Hybrid Deep Learning-Based Epidemic Prediction Framework of COVID-19: South Korea Case


School of Industrial Engineering, Kumoh National Institute of Technology, Gumi, Gyeongbuk 39177, Korea
*
Author to whom correspondence should be addressed.
Appl. Sci. 2020, 10(23), 8539; https://0-doi-org.brum.beds.ac.uk/10.3390/app10238539
Submission received: 3 November 2020
/
Revised: 26 November 2020
/
Accepted: 27 November 2020
/
Published: 29 November 2020
(This article belongs to the Special Issue Fighting COVID-19: Emerging Techniques and Aid Systems for Prevention, Forecasting and Diagnosis)
Abstract
:Featured Application
The proposed framework is the hybrid deep learning framework using the meta-population model and LSTM. It is expected to contribute to the effective control of COVID-19 infection.
Abstract
The emergence of COVID-19 and the pandemic have changed and devastated every aspect of our lives. Before effective vaccines are widely used, it is important to predict the epidemic patterns of COVID-19. As SARS-CoV-2 is transferred primarily by droplets of infected people, the incorporation of human mobility is crucial in epidemic dynamics models. This study expands the susceptible–exposed–infected–recovered compartment model by considering human mobility among a number of regions. Although the expanded meta-population epidemic model exhibits better performance than general compartment models, it requires a more accurate estimation of the extended modeling parameters. To estimate the parameters of these epidemic models, the meta-population model is incorporated with deep learning models. The combined deep learning model generates more accurate modeling parameters, which are used for epidemic meta-population modeling. In order to demonstrate the effectiveness of the proposed hybrid deep learning framework, COVID-19 data in South Korea were tested, and the forecast of the epidemic patterns was compared with other estimation methods.
1. Introduction
Human mobility plays a crucial role in the temporal and spatial spread of infectious diseases. During the past few decades, researchers have extensively investigated how human mobility affects the propagation of disease. The travel of individuals carrying the virus among communities is one of the main causes of infectious diseases. In the mathematical modeling of disease transmission, the compartment model [1] is popular among epidemiologists to divide the population into classes labeled as susceptible, infected, and recovered. Meta-population models [2] are a type of spatial models that investigate interactions and movements among different subpopulations of the same species across time and space. As a virus is transferred between heterogeneous hosts and the environment, the meta-population model could be extended to serve as a more appropriate modeling framework for capturing the dynamics of epidemic propagation. Although several research studies [3] consider human mobility in epidemic modeling, it is difficult to capture mobility parameters. Real-time estimation of these parameters affecting the transmission of infectious diseases is important for accurate prediction of the epidemiological pattern of an infectious disease.
This study proposes a new hybrid deep learning (DL) approach for estimating COVID-19 transmission patterns in South Korea. The proposed framework combines deep learning with the susceptible–exposed–infected–recovered (SEIR) meta-population model. To show its effectiveness, the hybrid deep learning framework is compared with the long short-term memory (LSTM) model and the general deep neural network (DNN) model to forecast epidemic patterns in South Korea based on the same dataset. The dataset used in this study was provided by the Korea Centers for Disease Control and Prevention [4], which is an organization under the South Korean Ministry of Welfare and Health. The detailed framework and procedures are provided in the following sections.
The following section provides a review of the existing research studies and literature related to COVID-19 transmission and prediction using deep learning. Section 3 proposes the hybrid deep learning framework based on meta-population model. The numerical analysis of the proposed framework and the performance analysis are provided, including the comparison with other methods, in Section 4. Finally, Section 5 presents the concluding remarks and the future work.
2. Background and Literature Review
Previous studies [5,6,7] applied a modified SEIR compartmental model to predict the COVID-19 epidemic dynamics. This study incorporates a basic SEIR model [8] to describe the dynamic process of epidemic propagation. Given a population that contains a group of individuals, a compartment SEIR model includes four states at time t: susceptible (, exposed , infected , and recovered , as shown in Figure 1. Individuals in the susceptible state do not have the disease at time t but may become infected if they come in contact with an infectious person. The infected state includes individuals with a positive COVID-19 test result at time t who may infect a susceptible individual if they come in contact with each other. Individuals in the recovered state have recovered from COVID-19 and are no longer contagious at time t. Recovered individuals return to the susceptible state.
The rates of change of the above-mentioned states are represented by a set of coupled ordinary differential equations (ODEs), as shown in Equations (1)–(4).
Table 1 summarizes the characteristics and applications of COVID-19-related existing research studies.
As shown in Table 1, most of the COVID 19-related research studies ignored human mobility and its considerations owing to limitations of the frameworks used. Ibrahim and Murat [24] and Iacus et al. [25] showed the relationship between the initial spread of COVID-19and human mobility. Iacus et al. [26] showed that human mobility can explain up to 92% of the initial spreads in France and Italy. Ying et al. [26] considered the potential effects of various intra-city mobility restrictions to prevent the transmission of the disease. The spread relationship with human mobility made a number of countries implement human mobility-based policies [27,28] such as social distancing, stay-at-home policy, and several travel bans. Bonaccorsi et al. [29] and Pepe et al. [30] indicated a significant relationship between human mobility and restrictions on public transport. However, detailed prediction models considering human mobility have provided comparatively less owing to data issues and modeling complexities.
To overcome this issue, this research incorporates a deep learning approach into a COVID-19 SEIR model considering human mobility. There are several relevant research studies using deep learning methods. Table 2 summarizes the characteristics of the relevant research studies using a deep learning approach.
A number of research studies have applied deep learning approaches to detect epidemic patterns or predict future infectious features; the characteristics of these studies are summarized in Table 2. However, the integration of an ODE-based compartment framework in a deep learning framework has been studied comparatively so far. This research study combines both approaches and shows their effectiveness in predicting the epidemic trend of COVID-19.
3. Methodology of Hybrid Deep Learning Framework based on Meta-population
This paper proposes a new and effective framework, integrating an ODE-based meta-population model and deep neural network modeling [39,40] to explain two hypotheses. The first hypothesis is that COVID-19 spread can be analyzed using an SEIR model. It is explained in the previous section. The second hypothesis is that a hybrid deep model can predict the COVID-19 spread considering human mobility. This section and the following section explain the second hypothesis and test it with relevant case studies.
The prediction of disease propagation is achieved using an extended SEIR model. Meta-population [41,42,43] refers to a group of separated sub-populations of the same species, which are connected by an interaction network. Large-scale epidemic outbreaks, such as global pandemics, can be modeled using the propagation of pathogens through a meta-population network. Intra-cities in a country are modeled as sub-populations, and their human mobility is modeled with the network connecting the sub-populations, as shown in Figure 2. Individual movements among intra-cities can be considered as disease carriers. This research focuses on two cities in South Korea: Daegu and Seoul. Daegu is the city where the outbreak started in South Korea, and Seoul is the capital city with the highest trend of ongoing transmission. A susceptible individual of sub-population may contact infectious individuals from two sources: infectious individuals from the same sub-population, , or infectious visitors from sub-population .
The system in the meta-population model is divided into several connected sub-populations, along which individuals travel via transportation. Inside each sub-population, homogeneous mixing is assumed. This indicates that the mathematical modeling can capture the travel flows among sub-populations. The epidemic process of an infectious disease can be decomposed into different timelines of each sub-population, which can be represented as spatial and temporal processes. Figure 3 shows the SEIR-based meta-population model considering human mobility.
Equations (5)–(12) represent sets of ODEs of disease transmission between two sub-populations in the meta-population model.
The parameters and terms of the model are provided in Table 3.
As human-to-human transmission has been confirmed in the spreading of COVID-19, gatherings of people, contacts, or travels among cities (e.g., intra-city contact and intercity travel) of infected and exposed individuals have been the main reason for the spread of the virus. Based on the collected data, this study constructs the migration matrix at time t, which is given by Equation (13).
where K is the number of cities or regions (herein, K = 17), and is the rate of people traveling from city to city at time . The migration matrix is non-symmetric () because the traffic between cities is different at any given time. The number of outflow migrants of city at time is denoted by Equation (14).
The number of inflow migrants of city at time is denoted by Equation (15).
In the SEIR model, , , , and are defined as , , , and , respectively, where is the daily count. As the incubation period for COVID-19 can reach 14 days, the number of exposed individuals (who show no symptoms but are infectious) is crucial for the spread of the disease. State , which is not available from official data, is an important state in this model. In a city , the four states are defined by , , , and at time . The total susceptible population, , is the number of infected individuals in city . If city i has a total population of and the percentage of infected population is , then .
The provided meta-population model incorporates human migration patterns in order to capture the epidemic dynamics. For city , the daily increase in the number of infected cases includes the inflow of infected individuals from other cities. In real situations, the inflow and outflow of exposed individuals to and from a city are important and must be estimated by the epidemic model. Thus, if is the rate of people moving from city to city on day , then the number of infected individuals moving from city to city is given by Equation (16).
As the total number of migrant rates leaving the city is , the number of infected cases that have migrated out of city is determined from Equation (17), where is the population of city on day .
Thus, the total number of infected cases on day in city is given by Equation (18), where , and is the infection rate in city on day .
Moreover, this paper introduces () to the degree of migration unlikeness. In this manner, Equation (18) is converted into Equation (19).
Incorporating the migration dynamics, the increase in exposed individuals on day in city is determined by Equation (20), where is the infection rate of exposed individuals in city , and is the infection rate of susceptible individuals in city .
Then, and are computed from Equations (21) and (22), respectively. In this study, the recovered individuals are assumed to stay in city , and the recovery rates in different cities are assumed to differ owing to the varied treatments and availability of medical facilities.
The population of city on day increases or decreases owing to intercity migration, as shown in Equation (23), where .
Then, the instant susceptible population in city j at time t is defined in Equation (24), where .
As shown in Equation (25), the parameters in the provided meta-population model are estimated using the historical COVID-19 tracking data.
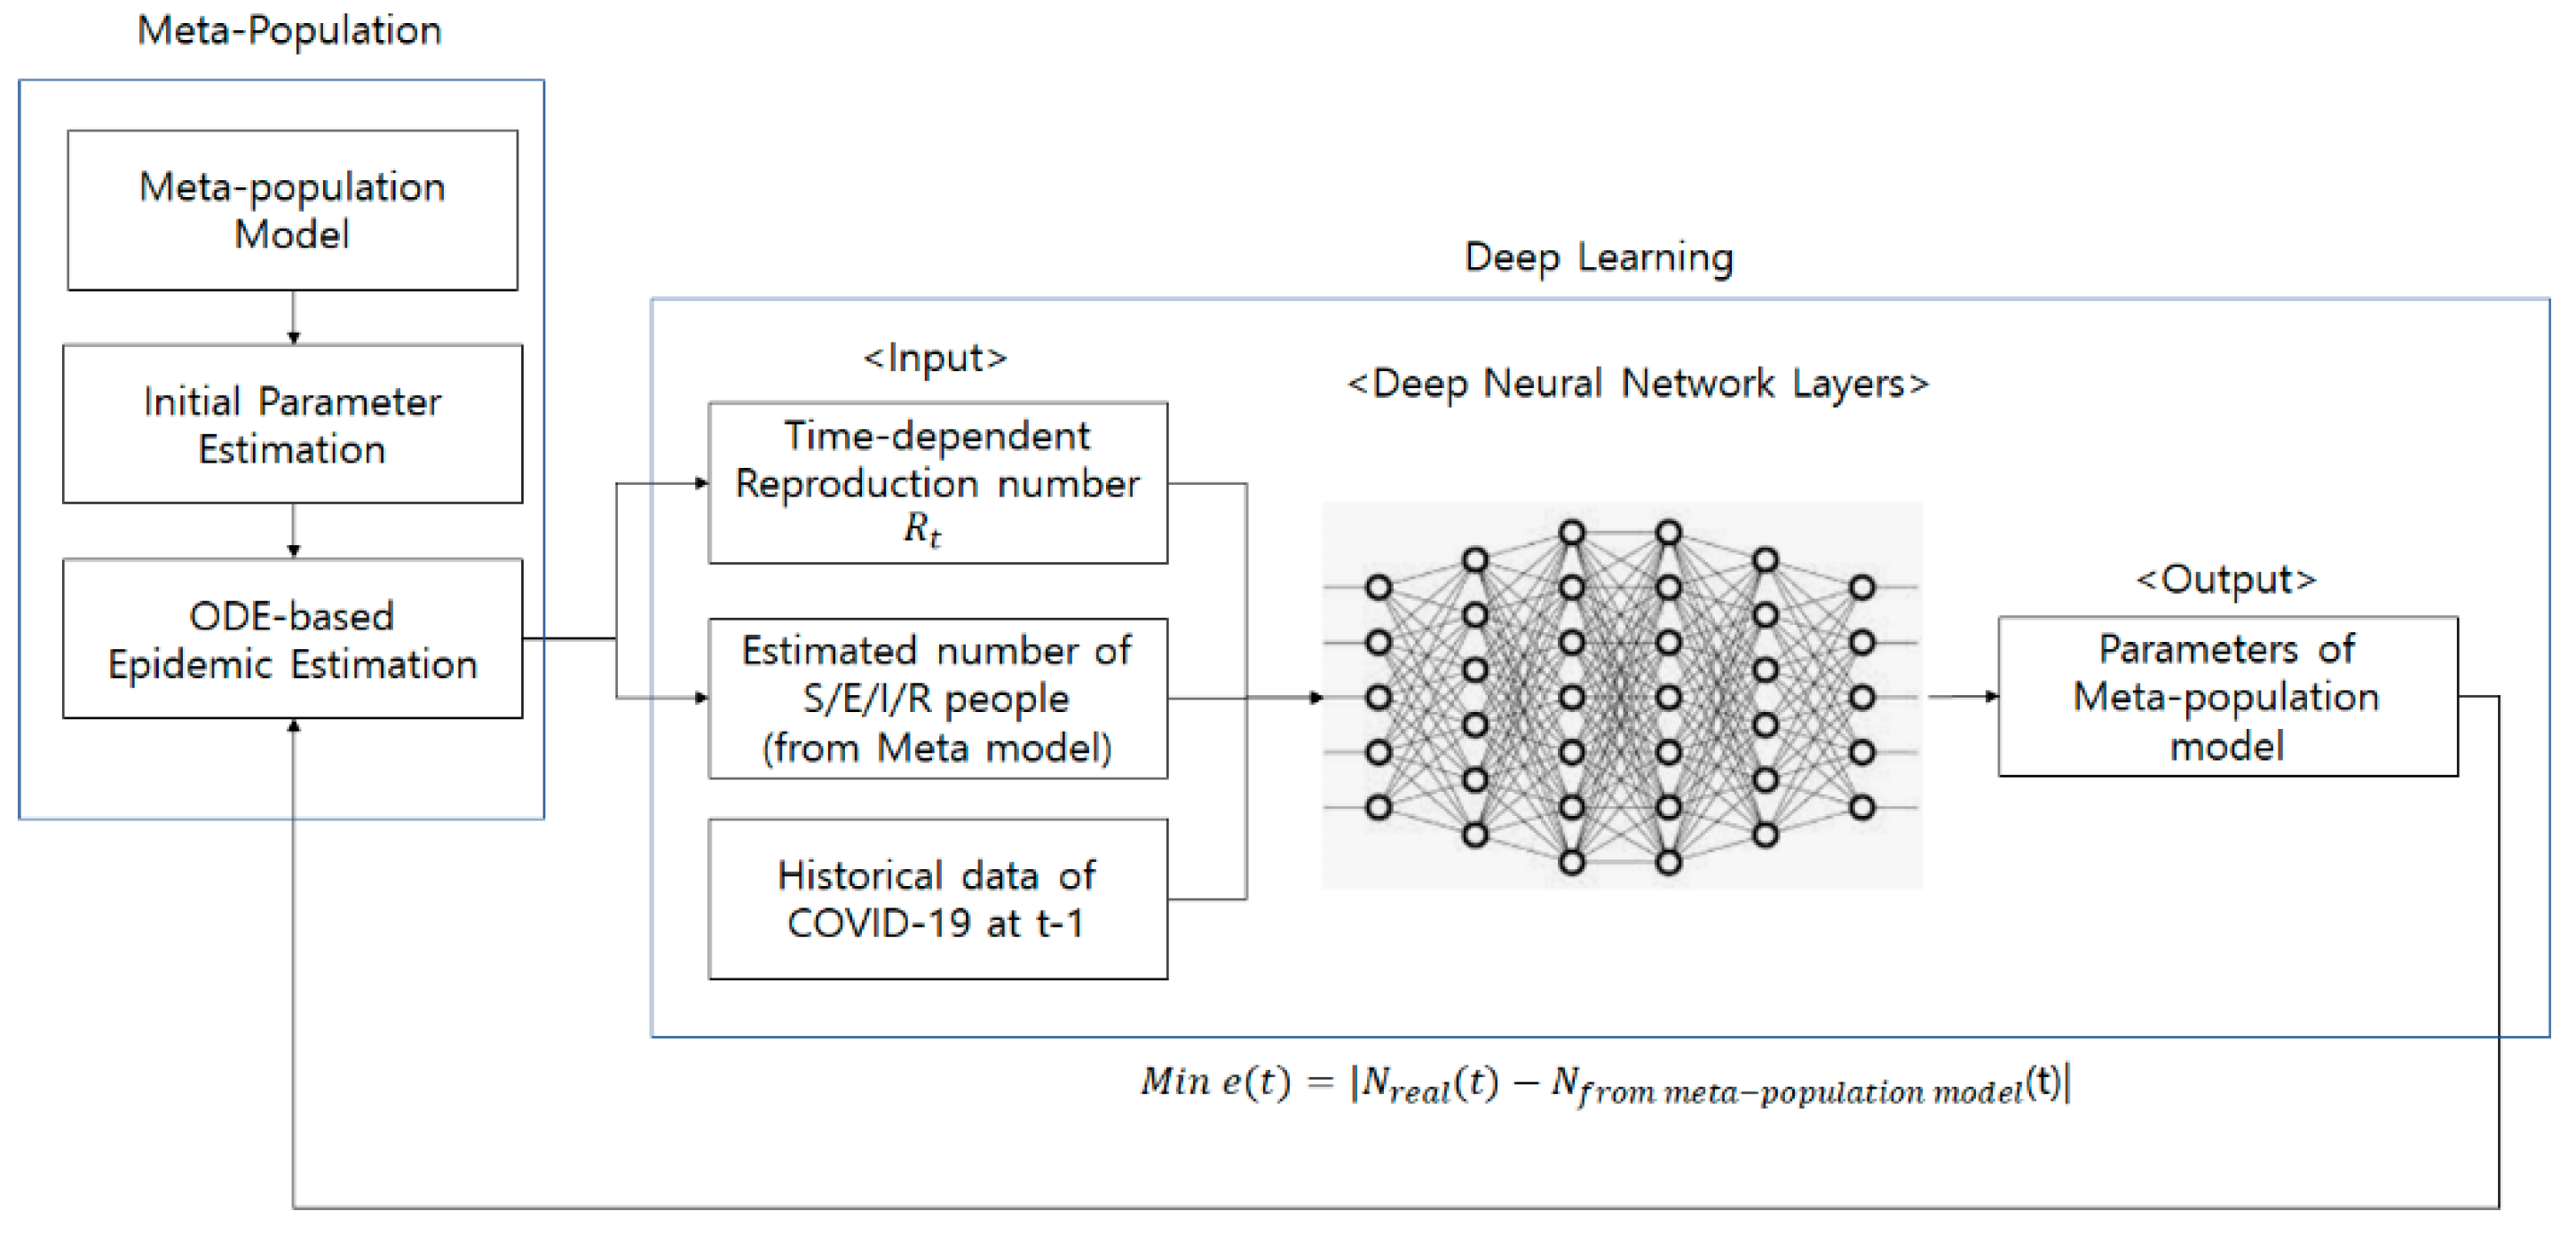
An estimated number of infected cases in each city is generated using the provided meta-population. However, it is difficult to capture accurate parameters using historical data. The wrong estimation may result in a biased erratic result. To overcome this issue, this study incorporates a meta-population model with a deep learning approach. Figure 4 shows the architecture of the hybrid approach using deep learning algorithms.
As shown in Figure 4, the meta-population model with the estimated parameter generates two types of parameters: the time-dependent reproduction number, , and the number of susceptible–exposed–infected–recovered people. However, it is difficult to obtain accurate results compared to the real COVID-19 data at time t. For this reason, the gap is minimized using a deep learning model; a general DNN or LSTM model is considered and tested.
Two output data from the previous meta-population model and the infected number of people from the real COVID-19 data (at time t-1) are used as input sets in the deep learning model. Then, the output of the DNN model is the parameters of the meta-population model. The weight in the hybrid deep learning model is updated with the minimization of error. The error is the gap between the real infected people at time t and the estimated infected people from the meta-population model at time t. The backpropagation method was used to minimize the error.
The novelty of this hybrid deep learning method enhances accuracy in the parameter estimation of the SEIR-based meta-population model. The following section shows the effectiveness of the proposed hybrid deep learning model through numerical analysis, and the results will be compared with the existing LSTM and DNN methods.
4. Numerical Analysis and Performance Evaluation Using the Meta-Population-Based Hybrid Deep Learning Framework
To demonstrate the effectiveness of the proposed framework, this study deploys data of COVID-19 cases in South Korea. As the transmission of the disease is still ongoing, the parameter affecting the simulation result has been changed dynamically with time. This study focuses on observing how the established meta-population model leads to a higher accuracy for outbreak prediction using parametric analysis. The parameters were learned using the DNN model. The approach allows us to determine the real-time dynamics of the reproduction number and analyze its relationship with other factors directly affecting the epidemic spread, such as the number of daily infected cases and people’s mobility levels. The two datasets [4] used for numerical testing are detailed in Table 4. The datasets are provided by Korea Centers for Disease Control and Prevention (KCDC). The datasets include incidence types and relevant human mobility information of COVID-19. This study analyzes its human mobility with the viewpoint of inner/intra-city mobility.
The basic reproduction number, , in both cities follows the patterns shown in Figure 5.
Then, the proposed framework is compared with a general LSTM model and a general deep neural network model. The LSTM and DNN models are trained using the same dataset. Moreover, this study uses two different modules in the deep learning core of the proposed method. Table 5 shows the characteristics of the compared methods.
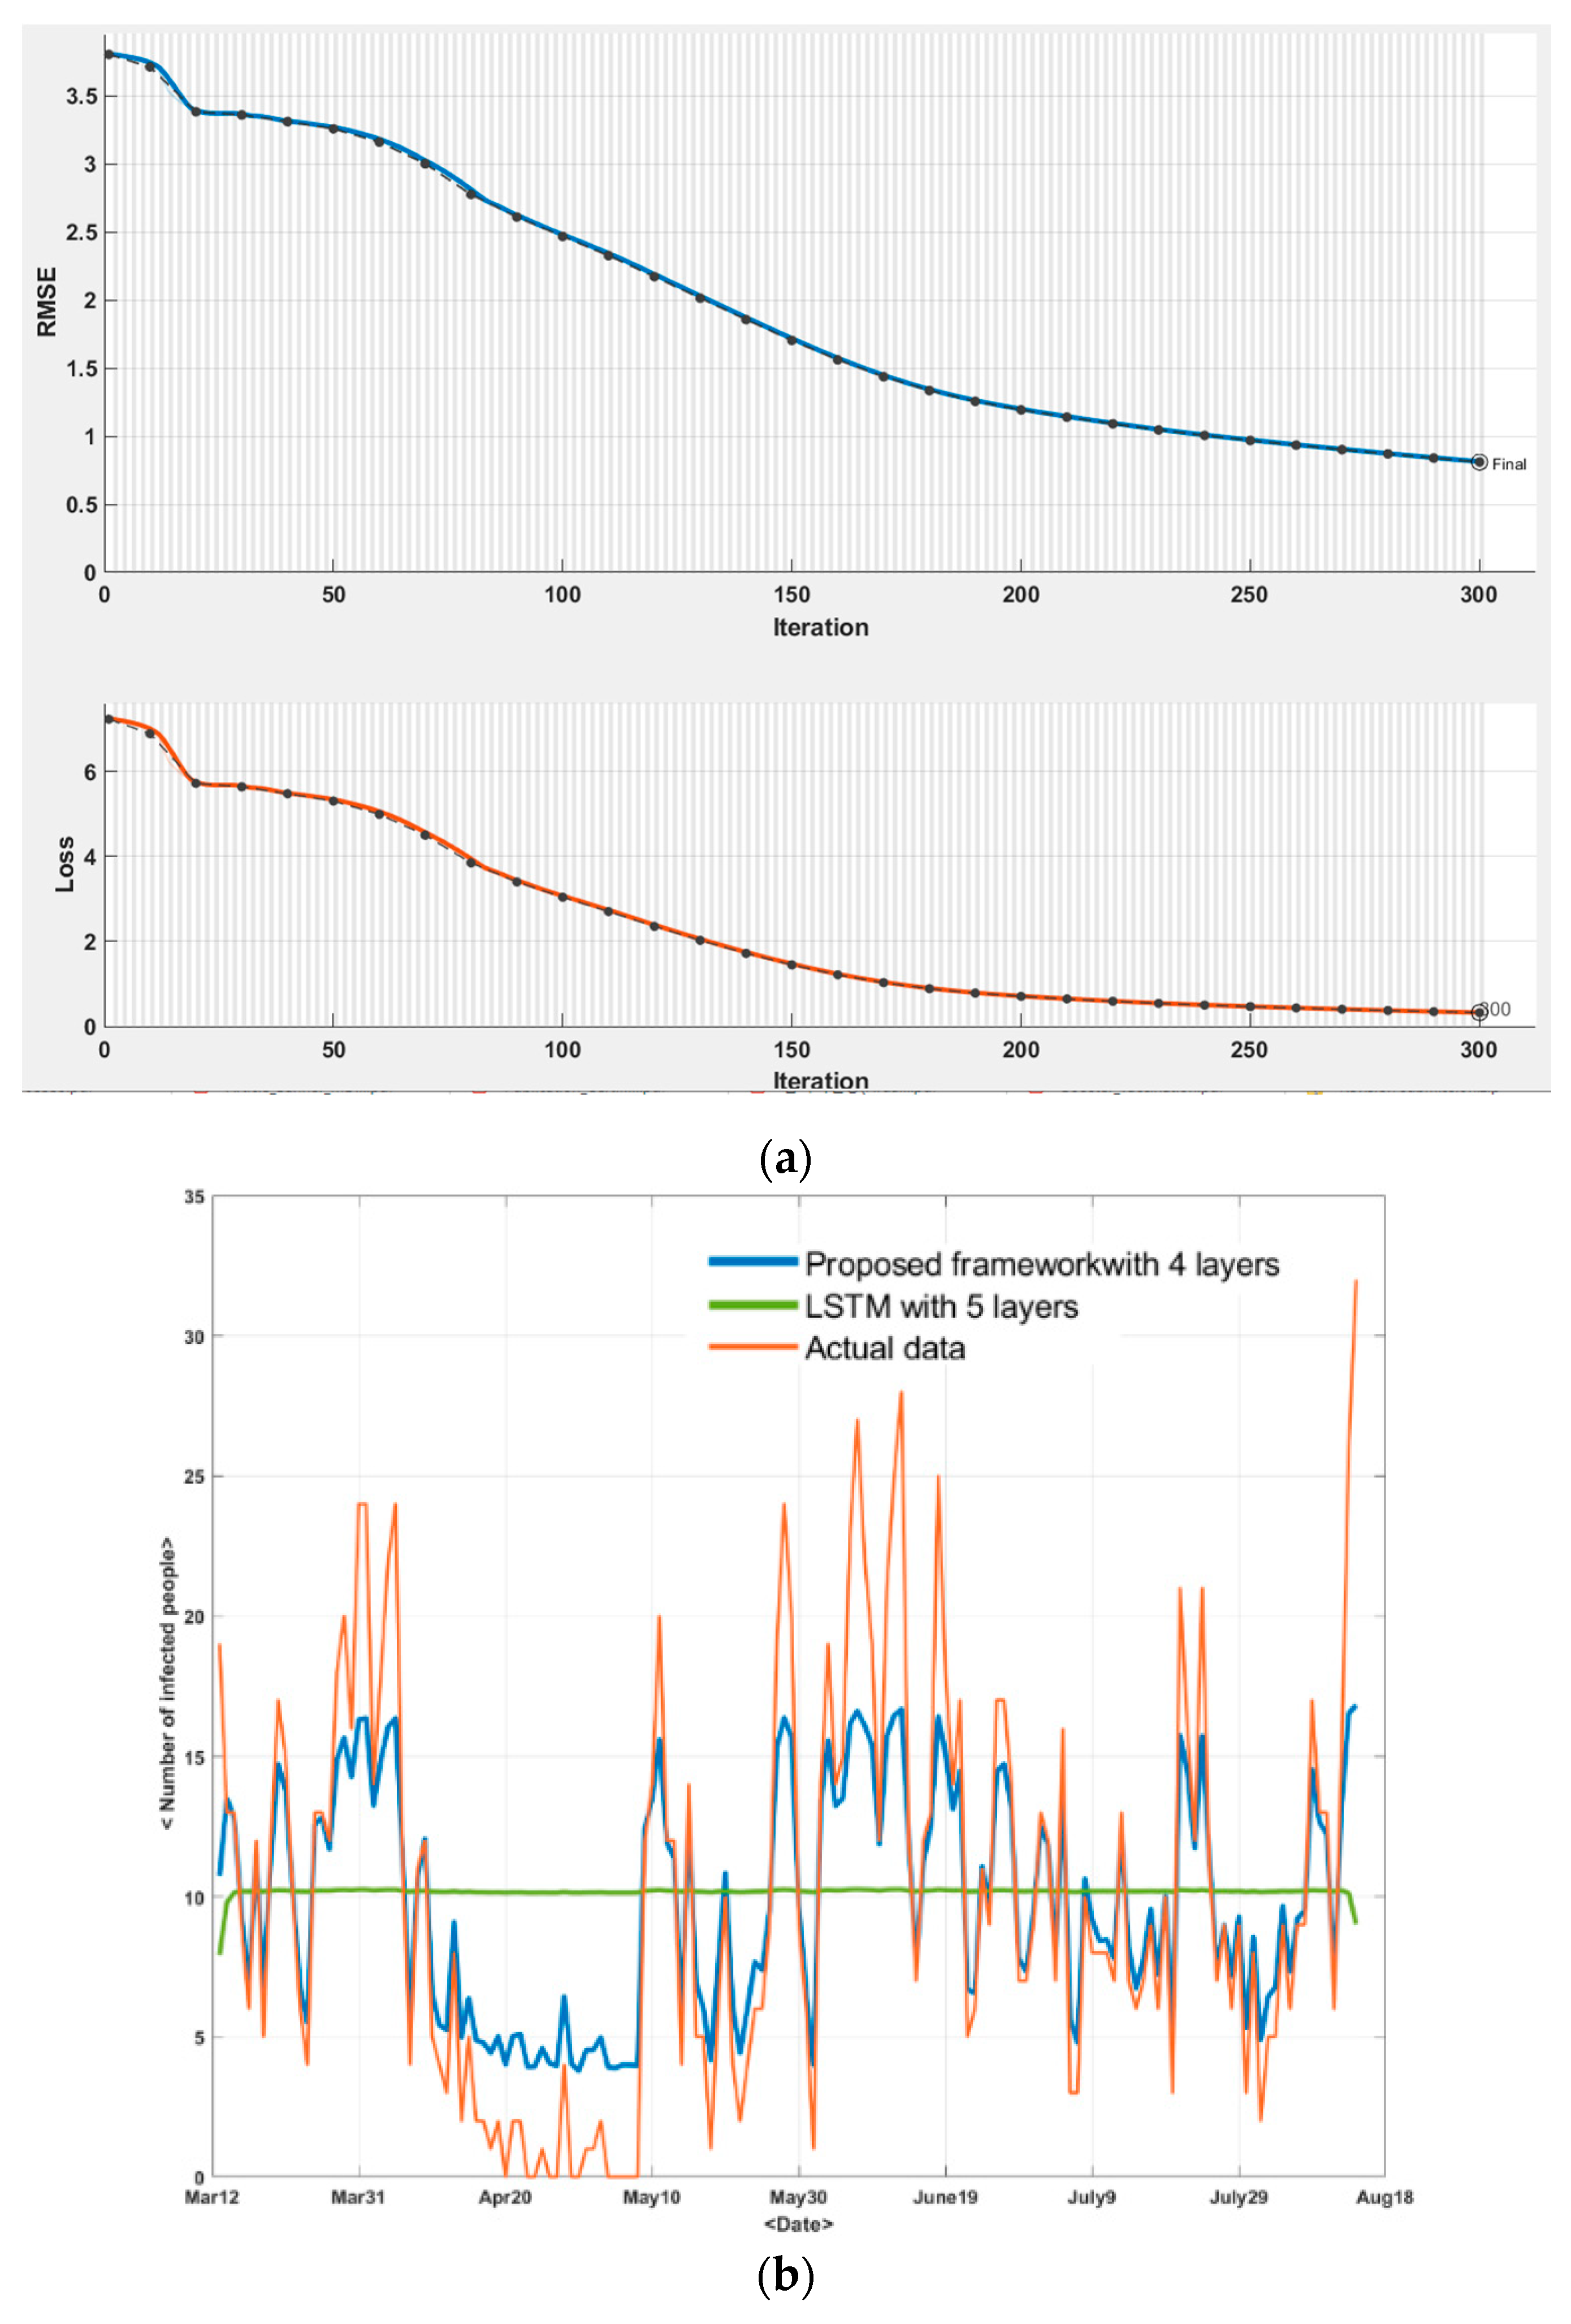
As shown in Table 5, the architecture and hyper-parameters of the methods are determined using the COVID-19 dataset in South Korea. Figure 6a shows the training errors (general loss and Root Mean Square Error (RMSE)) of the proposed hybrid deep learning framework incorporating the meta-population model and LSTM model. The loss is calculated as the gap between the actual reproduction rate of COVID-19 and the estimated reproduction rate using the proposed method. The architecture and relevant hyper-parameters such as the number of layers, the used optimizer, and learning are determined with experimental analyses. Figure 6b shows performance comparison with methods with different numbers of layers. Using the experimental tests, the number of layers and other hyper-parameters are determined.
The value of the basic reproduction number obtained using the four methods are also compared with the actual number of infected people, as shown in Figure 8.
A comparison between the frameworks presented in Table 7 is illustrated in Figure 9. Figure 9 proves experimentally that the proposed method, incorporating the meta-population model and LSTM, has the best performance compared to the other three methods.
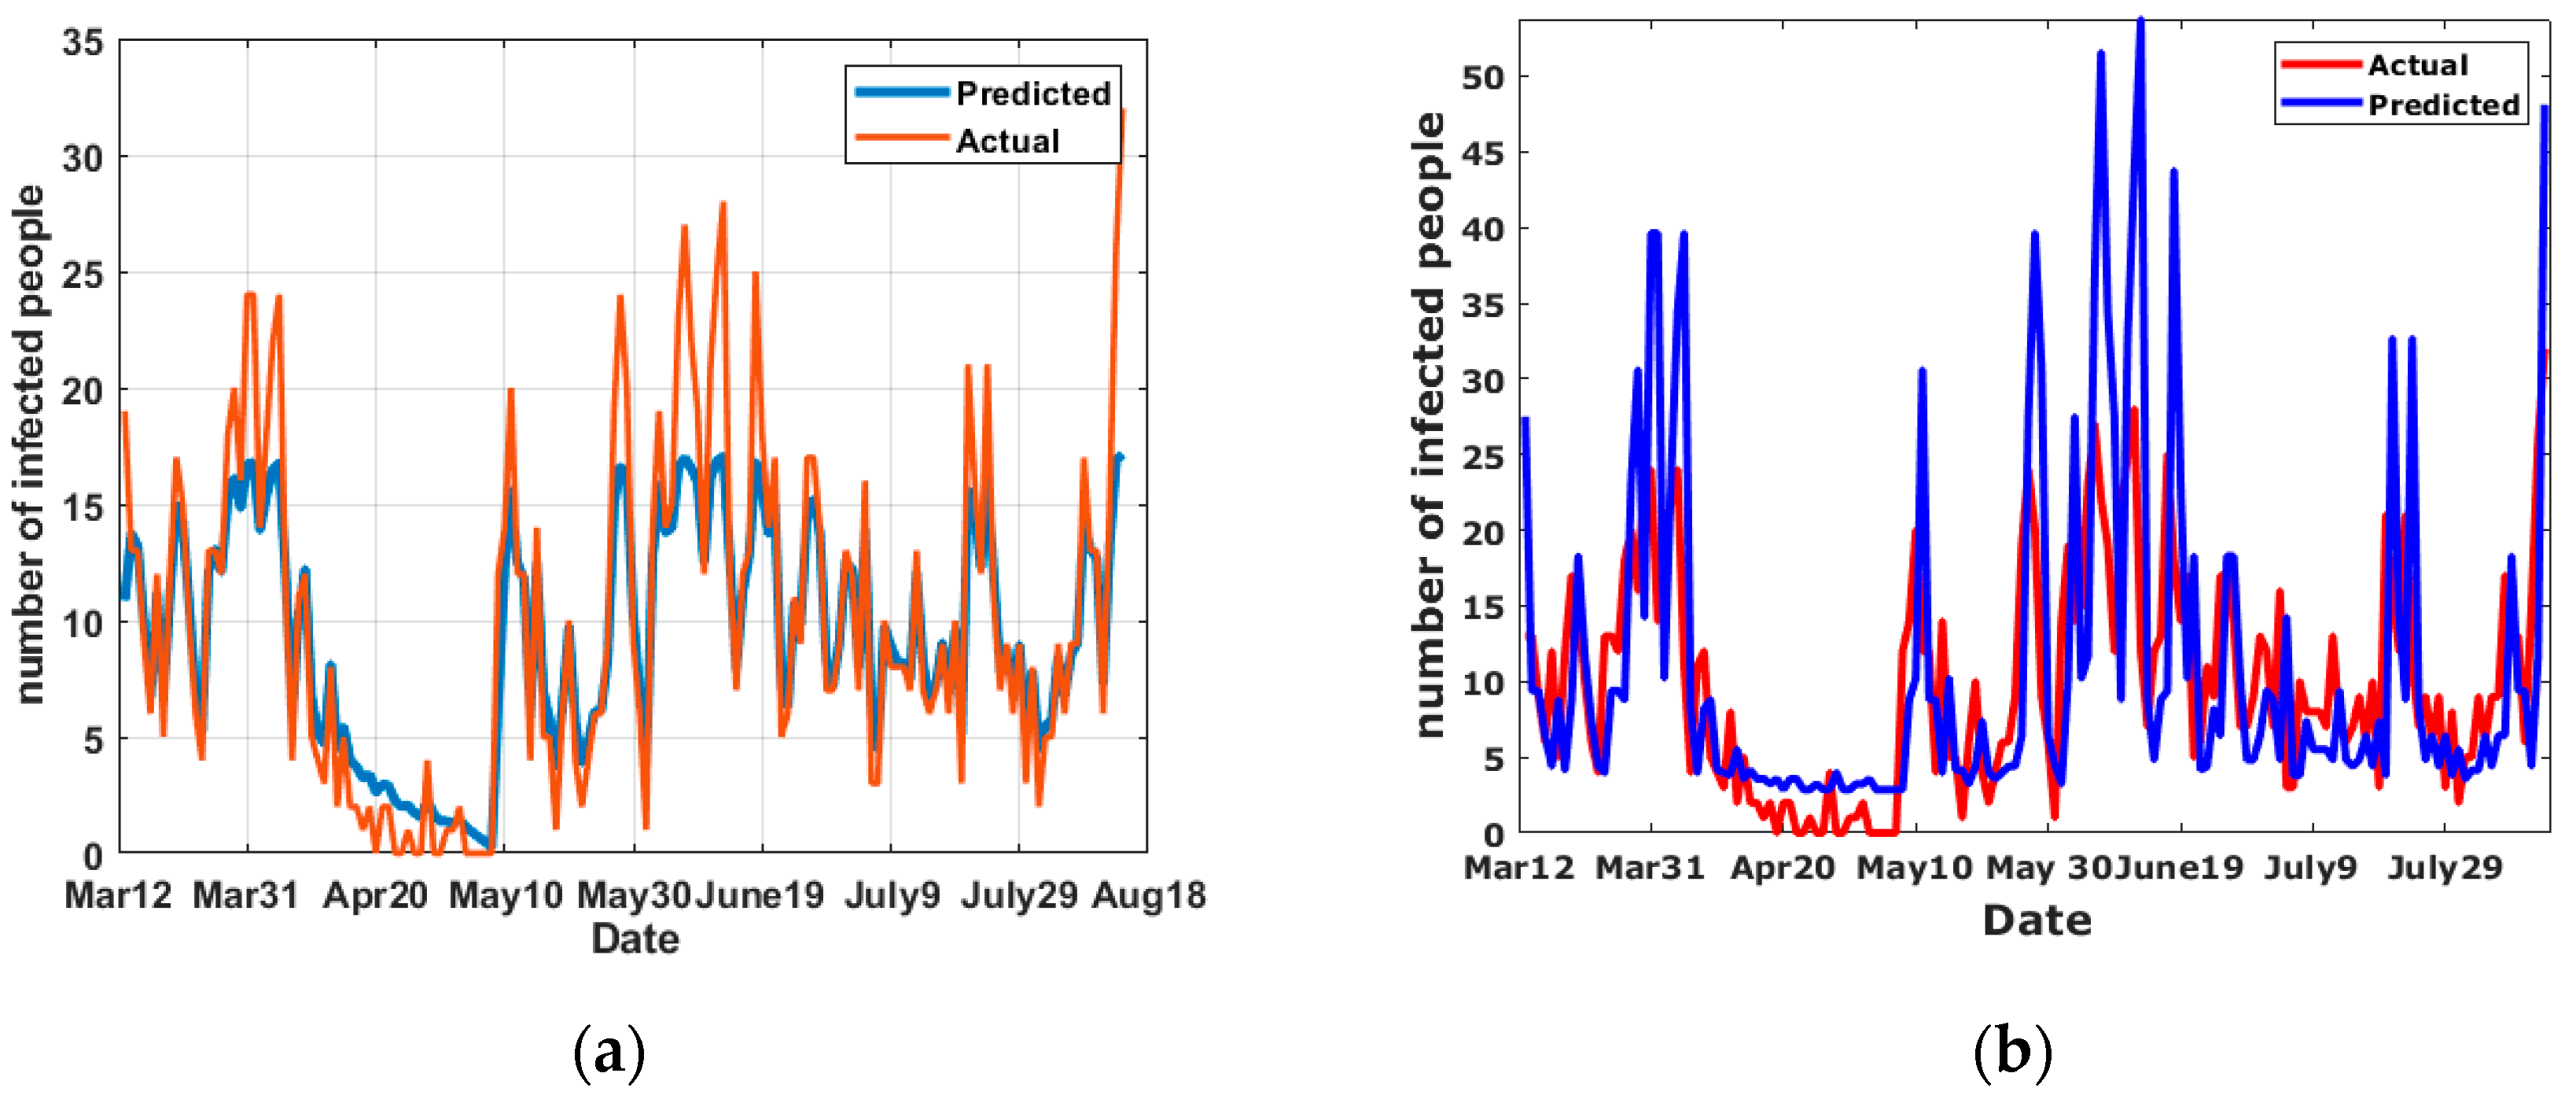
The number of infected people obtained using the four methods are also compared with the actual number of infected people, as shown in Figure 10.
The numerical tests indicate that the proposed method has better performance than other methods. In particular, the hybrid deep learning framework using the meta-population model and LSTM is more accurate than that using the meta-population model and DNN, as indicated by obtaining the least error value. Similar tests were performed for the cases in Daegu; the results are shown in Table 8, which is illustrated in Figure 11.
The actual and predicted value of the reproduction number for Daegu using the proposed method are illustrated in Figure 12.
The actual and predicted numbers of infected people using the four methods shown in Table 9 are illustrated in Figure 13.
The actual and predicted numbers of infected people in Daegu using the four methods are illustrated in Figure 14. The numerical tests indicate that the proposed method has better performance than other methods. In particular, the hybrid deep learning framework using the meta-population model and LSTM is more accurate than that using the meta-population model and DNN considering the lowest error achieved.
The overall performances are provided in Table 10. The comparison results are calculated as the averages of 50 repetitions. The averages are provided in Table 10, and their standard deviations are less than 2.28 in and 0.20 in , respectively. The effectiveness of hybrid deep learning for predicting the COVID-19 epidemic pattern is proven experimentally by achieving the least RMSE error compare with the other three methods.
5. Conclusions
The epidemic prediction of infectious diseases is one of the most widely studied research areas. A number of research studies using time-series analysis, regression studies, and other statistical methods have been conducted to explain epidemic dynamics. In addition, deep learning approaches have been introduced for forecasting. These methods have been applied for tracking COVID-19 patterns. The emergence of the COVID-19 virus has changed every aspect of our lives and has devastated all societies. Before the effective vaccines come into wide use, it is important to accurately predict the epidemic patterns of COVID-19. However, it is difficult to estimate the pattern owing to the characteristics of COVID-19. As infection is primarily mediated by the droplets of infected people, human mobility has to be considered and incorporated in epidemic analysis.
As COVID-19 follows an SEIR-based infection model, the proposed framework implements an SEIR compartment model. In order to incorporate human mobility among regions, the SEIR compartment model is expanded with relevant human mobility-based modeling parameters and terms. Although the expanded epidemic model has advantages over simple compartment models, its performance depends on the accurate estimation of the epidemic model parameters. To increase the accuracy of parameter estimation, deep learning approaches are deployed. The proposed hybrid deep learning framework consists of an epidemic meta-model and a deep learning model. The estimated epidemic status and real COVID-19 historical data are input to the deep learning model, and the parameters of the meta-population model are generated as output. The weight of the deep learning model is updated with the minimization of the gap between the real COVID-19 status and the estimated status computed from the meta-population model. To demonstrate the effectiveness of the proposed hybrid deep learning model, the estimation results are compared with other forecasting methods. The numerical analysis demonstrates that the hybrid deep learning framework using the meta-population model and LSTM model exhibits the best performance among the testing methods. Therefore, the proposed framework is expected to contribute to the effective control of COVID-19 infection.
In future studies, the epidemic patterns of various infectious diseases can be predicted using the proposed hybrid deep learning framework. As the spread of infectious disease follows a specific epidemic pattern, the meta-population model of the proposed hybrid deep learning framework can be modified and applied depending on the disease scenario. In addition, the deep learning model used can be replaced with more effective models. This research focuses on the prediction of COVID-19 spread considering human mobility. While a number of research studies propose effective restrictions on human mobility, the proposed framework can help the prevention and control of the COVID-19 spread.
Author Contributions
F.R. and H.L. conceptualized the framework and developed the methodologies. F.R. implemented and validated the framework. H.L. supervised the overall research processes. F.R. wrote the manuscript and H.L. reviewed and edited it. All authors have read and agreed to the published version of the manuscript.
Funding
This research is funded by Professor Research Year System, Kumoh National Institute of Technology, S. Korea.
Conflicts of Interest
The authors declare no conflict of interest.
References
- Rahmadani, F.; Lee, H. Dynamic model for the epidemiology of diarrhea and simulation considering multiple disease carriers. Int. J. Environ. Res. Public Health 2020, 17, 5692. [Google Scholar] [CrossRef] [PubMed]
- Arino, J. Diseases in meta-populations. Ser. Contemp. Appl. Math. 2009, 64–122. [Google Scholar] [CrossRef] [Green Version]
- Achrekar, H.; Gandhe, A.; Lazarus, R.; Yu, S.-H.; Liu, B. Predicting flu trends using twitter data. In Proceedings of the 2011 IEEE Conference on Computer Communications Workshops (INFOCOM WKSHPS), Shanghai, China, 10–15 April 2011; pp. 702–707. [Google Scholar]
- Coronavirus Disease-19, Republic of Korea. Available online: http://ncov.mohw.go.kr/ (accessed on 13 July 2020).
- Mwalili, S.; Kimathi, M.; Ojiambo, V.; Gathungu, D.; Mbogo, R. SEIR model for COVID-19 dynamics incorporating the environment and social distancing. BMC Res. Notes. 2020, 13, 352. [Google Scholar] [CrossRef] [PubMed]
- Shaobo, H.; Yuexi, P.; Kehui, S. SEIR modeling of the COVID-19 and its dynamics. Nonlinear Dyn. 2020, 101, 1667–1680. [Google Scholar]
- Carcione, J.M.; Santos, J.E.; Bagaini, C.; Ba, J. A simulation of a COVID-19 epidemic based on a deterministic SEIR model. Front. Public Health 2020, 8, 230. [Google Scholar] [CrossRef]
- Rahmadani, F.; Lee, H. ODE-based epidemic network simulation of viral Hepatitis A and kernel support vector machine based vaccination effect analysis. J. Korean Inst. Intell. Syst. 2020, 30, 106–112. [Google Scholar] [CrossRef]
- Petropoulos, F.; Makridakis, S. Forecasting the novel coronavirus COVID-19. PLoS ONE 2020, 15, e0231236. [Google Scholar] [CrossRef]
- Samuel, S.C.; Miguel, A.S.; Miguel, A.P.; Elena, P.-B. An efficient COVID-19 prediction model validated with the cases of China, Italy, and Spain: Total or partial lockdowns? J. Clin. Med. 2020, 9, 1547. [Google Scholar]
- Zhou, T.; Xianbin, L.; Houquiang, L. Prediction of new coronavirus infection based on a modified SEIR model. medRxiv 2020. [CrossRef]
- Tsallis, C.; Timakli, U. Predicting COVID-19 peaks around the world. Front. Phys. 2020, 8, 217. [Google Scholar] [CrossRef]
- Singh, R.K.; Rani, M.; Bhagavathula, A.S.; Sah, R.; Rodriguez-Morales, A.J.; Kalita, H.; Nanda, C.; Sharma, Y.D.; Sharma, Y.D.; Rabaan, A.A.; et al. Prediction of the COVID-19 pandemic for the top 15 affected countries: Advanced autoregressive integrated moving average (ARIMA) model. JMIR Public Health Surveill. 2020, 6, e19115. [Google Scholar] [CrossRef] [PubMed]
- Jia, W.; Han, K.; Song, Y.; Cao, W.; Wang, S.; Yang, S.; Wang, J.; Kou, F.; Tai, P.; Li, J.; et al. Extended SIR prediction of the epidemics trend of COVID-19 in Italy and compared with Hunan, China. Front. Med. 2020, 7, 169. [Google Scholar]
- Zhu, G.; Li, J.; Meng, Z.; Yu, Y.; Li, Y.; Tang, X.; Dong, Y.; Sun, G.; Zhou, R.; Wang, H.; et al. Learning from large-scale wearable device data for predicting epidemics trend of COVID-19. Discret. Dyn. Nat. Soc. 2020, 2020, 1–8. [Google Scholar] [CrossRef]
- Wynants, L.; Van Calster, B.; Collins, G.; Riley, R.D.; Heinze, G.; Schuit, E.; Bonten, M.J.; Dahly, D.L.; A A Damen, J.; Debray, T.P.A.; et al. Prediction models for diagnosis and prognosis of covid-19: Systematic review and critical appraisal. BMJ 2020, 369, m1328. [Google Scholar] [CrossRef] [PubMed] [Green Version]
- Chowdhury, R.; Heng, K.; Shawon, S.R.; Goh, G.; Okonofua, D.; Ochoa-Rosales, C.; Gonzalez-Jaramillo, V.; Bhuiya, A.; Reidpath, D.; Prathapan, S.; et al. Dynamic interventions to control COVID-19 pandemic: A multivariate prediction modelling study comparing 16 worldwide countries. Eur. J. Epidemiol. 2020, 35, 389–399. [Google Scholar] [CrossRef]
- Bertozzi, A.L.; Franco, E.; Mohler, G.; Short, M.B.; Sledge, D. The challenges of modeling and forecasting the spread of COVID-19. Proc. Natl. Acad. Sci. USA 2020, 117, 16732–16738. [Google Scholar] [CrossRef]
- Arora, P.; Kumar, H.; Panigrahi, B.K. Prediction and analysis of COVID-19 positive cases using deep learning models: A descriptive case study of India. Chaos Solitons Fractals 2020, 139, 110017. [Google Scholar] [CrossRef]
- Ayyoubzadeh, S.M.; Zahedi, H.; Ahmadi, M.; Kalhori, S.R.N. Predicting COVID-19 incidence through analysis of google trends data in Iran: Data mining and deep learning pilot study. JMIR Public Health Surveill. 2020, 6, e18828. [Google Scholar] [CrossRef]
- Gozes, O.; Frid-Adar, M.; Sagie, N.; Kabakovitch, A.; Amran, D.; Amer, R.; Greenspan, H. A weakly supervised deep learning framework for COVID-19 CT detection and analysis. In Thoracic Image Analysis TIA 2020. Lecture Notes in Computer Science; Springer: Cham, Switzerland, 2020; Volume 12502. [Google Scholar]
- Wang, S.; Zha, Y.; Li, W.; Wu, Q.; Li, X.; Niu, M.; Wang, M.; Qiu, X.; Li, H.; Yu, H.; et al. A fully automatic deep learning system for COVID-19 diagnostic and prognostic analysis. Eur. Respir. J. 2020, 56, 2000775. [Google Scholar] [CrossRef]
- Zeroual, A.; Harrou, F.; Dairi, A.; Sun, Y. Deep learning methods for forecasting COVID-19 time-series data: A comparative study. Chaos Soliton Fractals 2020, 140, 110121. [Google Scholar] [CrossRef]
- Ibrahim, S.; Murat, M.Y. Coronavirus and migration: Analysis of human mobility and the spread of COVID-19. Migr. Lett. 2020, 17, 379–398. [Google Scholar]
- Iacus, S.M.; Santamaria, C.; Sermi, F.; Spyratos, S.; Tarchi, D.; Vespe, M. Human mobility and COVID-19 initial dynamics. Nonlinear Dyn. 2020, 101, 1901–1919. [Google Scholar] [CrossRef] [PubMed]
- Zhou, Y.; Xu, R.; Hu, D.; Yue, Y.; Li, Q.; Xia, J. Effects of human mobility restrictions on the spread of COVID-19 in Shenzhen, China: A modeling study using mobile phone data. Lancet Digit. Health 2020, 2, e417–e424. [Google Scholar] [CrossRef]
- Jinjarak, Y.; Ahmed, R.; Nair-Desai, S.; Xin, W.; Aizenman, J. Accounting for Global COVID-19 Diffusion Patterns, January-April 2020. Natl. Bur. Econ. Res. 2020, 1–45. [Google Scholar] [CrossRef]
- Petherick, A.; Kira, B.; Hale, T.; Phillips, T.; Sam, W.; Cameron-Blake, E.; Hallas, L.; Majumdar, S.; Tatlow, H.; Body, T.; et al. Oxford COVID-19 Government Response Tracker. Blavatnik School of Government. 2020. Available online: www.bsg.ox.ac.uk/covidtracker (accessed on 15 October 2020).
- Bonaccorsi, G.; Pierri, F.; Cinelli, M.; Flori, A.; Galeazzi, A.; Porcelli, F.; Schmidt, A.L.; Valensise, C.M.; Scala, A.; Quattrociocchi, W.; et al. Economic and social consequences of human mobility restrictions under COVID-19. Proc. Natl. Acad. Sci. USA 2020, 117, 15530–15535. [Google Scholar] [CrossRef] [PubMed]
- Pepe, E.; Bajardi, P.; Gauvin, L.; Privitera, F.; Lake, B.; Cattuto, C.; Tizzoni, M. COVID-19 outbreak response, a dataset to assess mobility changes in Italy following national lockdown. Sci. Data 2020, 7, 1–7. [Google Scholar] [CrossRef] [PubMed]
- Shaun, M.K.; Joe, G.G.; David, T.J. Recent developments in deep learning applied to protein structure prediction. Proteins Struct. Funct. Bioinform. 2019, 87, 1179–1189. [Google Scholar]
- Chunlei, Z.; Rong, X. Predicting cancer origins with a DNA methylation-based deep neural network model. PLoS ONE 2020, 15, e0226461. [Google Scholar]
- Islam, M.; Wang, Y.; Hu, P. Deep learning models for predicting phenotypic traits and diseases from omics data. Intech Open 2018, 75311. [Google Scholar] [CrossRef] [Green Version]
- Wang, Y.; Xu, C.; Zhang, S.; Yang, L.; Wang, Z.; Zhu, Y.; Yuan, J. Development and evaluation of a deep learning approach for modeling seasonality and trends in hand-foot-mouth disease incidence in mainland China. Nat. Sci. Rep. 2019, 9, 8046. [Google Scholar] [CrossRef]
- Taeho, J.; Kwangshik, N.; Andrew, S. Deep learning in Alzheimer’s disease: Diagnostic classification and prognostic prediction using neuroimaging data. Front. Aging Neurosci. 2019, 1, 220. [Google Scholar]
- Wang, M.; Wang, H.; Wang, J.; Liu, H.; Lu, R.; Duan, T.; Gong, X.; Feng, S.; Liu, Y.; Cui, Z.; et al. A novel model for malaria prediction based on ensemble algorithms. PLoS ONE. 2019, 14, e226910. [Google Scholar] [CrossRef] [PubMed] [Green Version]
- Li, J.; Shao, X.; Sun, R. A DBN-based deep neural network model with multitask learning for online air quality prediction. J. Control Sci. Eng. 2019, 5304535. [Google Scholar] [CrossRef] [PubMed]
- Lin, S.; Li, Z.; Fu, B.; Chen, S.; Li, X.; Wang, Y.; Wang, X.; Lv, B.; Xu, B.; Song, X.; et al. Feasibility of using deep learning to detect coronary artery disease based on facial photo. Eur. Heart J. 2020, 640. [Google Scholar] [CrossRef] [PubMed]
- Lee, H. Framework and development of fault detection classification using IoT device and cloud environment. J. Manuf. 2017, 43, 257–270. [Google Scholar] [CrossRef]
- Choo, S.; Lee, H. Learning framework of multimodal Gaussian-Bernoulli RBM handling real-value input data. Neurocomputing 2018, 275, 1813–1822. [Google Scholar] [CrossRef]
- Gavrishchaka, V.; Yang, Z.; Miao, R.; Senyukova, O. Advantages of hybrid deep learning frameworks in applications with limited data. Int. J. Mach. Learn. Comput. 2018, 8, 6. [Google Scholar]
- Chen, S.; Lanzas, C.; Lee, C.; Zenarosa, G.L.; Arif, A.A.; Dulin, M. Meta-population model from pathogen’s perspective: A versatile framework to quantify pathogen transfer and circulation between environment and hosts. Sci. Rep. 2019, 9, 1694. [Google Scholar] [CrossRef]
- Castle, S.T.; Foley, P.; Clifford, D.L.; Foley, J. A stochastic structured meta-population model to assess recovery scenario of patchily distributed endangered species: Case study for a Mojave Desert rodent. PLoS ONE 2020, 15, e0237516. [Google Scholar] [CrossRef]
Figure 1.
Compartment model of susceptible–exposed–infected–recovered (SEIR) disease transmission.

Figure 2.
SEIR-based meta-population network in South Korea.

Figure 3.
SEIR compartment-based meta-population model considering human mobility.

Figure 4.
Framework of a meta-population network based on deep learning.

Figure 5.
Patterns of the basic reproduction number in (a) Seoul and (b) Daegu.

Figure 6.
Training progress and performance tests, (a) Training progress with respect to RMSE and general loss, and (b) Performance comparison with different number of the hidden layers using the Seoul dataset.
Figure 6.
Training progress and performance tests, (a) Training progress with respect to RMSE and general loss, and (b) Performance comparison with different number of the hidden layers using the Seoul dataset.

Figure 7.
Actual and estimated value of reproduction number using the proposed method and conventional machine learning methods.
Figure 7.
Actual and estimated value of reproduction number using the proposed method and conventional machine learning methods.

Figure 8.
Estimation of the Rt for Seoul, (a) the proposed meta-population + long short-term memory (LSTM) model, (b) the proposed meta-population + deep neural network (DNN) model, (c) LSTM only, and (d) DNN only.
Figure 8.
Estimation of the Rt for Seoul, (a) the proposed meta-population + long short-term memory (LSTM) model, (b) the proposed meta-population + deep neural network (DNN) model, (c) LSTM only, and (d) DNN only.

Figure 9.
Actual and estimated numbers of infected people using the proposed method and conventional machine learning methods.
Figure 9.
Actual and estimated numbers of infected people using the proposed method and conventional machine learning methods.

Figure 10.
Estimation of the It for Seoul using (a) the proposed meta-population + LSTM model, (b) the proposed meta-population + DNN model, (c) LSTM only, and (d) DNN only.
Figure 10.
Estimation of the It for Seoul using (a) the proposed meta-population + LSTM model, (b) the proposed meta-population + DNN model, (c) LSTM only, and (d) DNN only.


Figure 11.
Actual and estimated value of reproduction number.

Figure 12.
Estimation of the Rt for Daegu using (a) the proposed meta-population + LSTM model, (b) the proposed meta-population + DNN model, (c) LSTM only, and (d) DNN only.
Figure 12.
Estimation of the Rt for Daegu using (a) the proposed meta-population + LSTM model, (b) the proposed meta-population + DNN model, (c) LSTM only, and (d) DNN only.

Figure 13.
Actual and estimated number of infected people.

Figure 14.
Estimation of the It for Daegu, (a) the proposed meta-population + LSTM model, (b) the proposed meta-population + DNN model, (c) LSTM only, and (d) DNN only.
Figure 14.
Estimation of the It for Daegu, (a) the proposed meta-population + LSTM model, (b) the proposed meta-population + DNN model, (c) LSTM only, and (d) DNN only.


Table 1.
Research studies on COVID-19 transmission and prediction.
| Research Studies | COVID-19 Related Application | Characteristics | Issues |
|---|---|---|---|
| Petropoulos et al. [9] | - Forecasting and prediction of ten-days-ahead COVID-19 patterns | - Suitable for short series | - Limited assumption is used; past patterns continue to apply |
| - Capturing a variety of trends and seasonal forecasting patterns | |||
| - Used method: exponential smoothing | |||
| Samuel et al. [10] | - Predict the overall infections, peak, and one-week pattern before occurrence | - Accurate prediction of the total number of infected people, daily infection curve, and infection peak | - Ignorance of human mobility |
| - Used method: Verhulst equation | |||
| Zhou et al. [11] | - Estimation of COVID-19 epidemiology | - The incubation period of COVID-19 is considered | - Related parameters depend on the used dataset only |
| - Used method: SEIR compartment model | |||
| Tsallis et al. [12] | - Analysis of active cases and deaths per day | - Utilization of the main factors affecting the COVID-19 spread and effects of lockdowns | - Ignorance of human mobility |
| - Used method: Q-statistical functional form | |||
| Singh et al. [13] | - COVID-19 pattern prediction | - Effectiveness of the ARIMA model compared to that of basic regression and exponential methods | - ARIMA does not support volatility or in-between changes in the prediction periods |
| - Used method: ARIMA | |||
| Wangping et al. [14] | - Estimation of the COVID-19 epidemic trend in Italy | - Usage of a Markov chain Monte Carlo (MCMC) algorithm to obtain posterior estimates and parameters | - Ignorance of asymptomatic and unconfirmed cases |
| - Used method: extended susceptible–infected–removed model | |||
| Guokang et al. [15] | - Prediction of epidemic trend | - Prediction with physiological data to alert the infection outbreak in advance | - Limitation of the used detection method for calculating the physiological anomaly rate |
| - Used method: framework based on the heart rate and sleep data collected from wearable devices | |||
| Laure et al. [16] | - Prediction model for diagnosing COVID-19 | - Summary of several diagnostic and prognostic models for COVID-19 | - Rare analysis and research studies considering human mobility |
| - Review of existing relevant research studies | |||
| Rajiv et al. [17] | - Analysis of up-to-date transmission and clinical parameters to simulate outbreak trajectories | - Consideration of non-pharmacological interventions (NPI) | - Uncertain effectiveness of the long-term implementation of NPI |
| - Used method: multivariate prediction model | |||
| Andrea et al. [18] | -Policy-relevant analysis for COVID-19 spread control | - Measurement and forecasting of the impacts of social distancing. | - Usage of a number of assumptions to avoid overfitting |
| -Used methods: Parsimonious models for early-time data | |||
| Arora et al. [19] | - Prediction of the positive case of COVID-19 | - Geographical consideration and segmentation | - Comparative error for long-term prediction |
| - Used method: deep LSTM | |||
| Ayyoubzadeh et al. [20] | - Prediction of the COVID-19 incidence in Iran | - Usage of 10-fold cross-validation | - Occurrence of overfitting in LSTM model |
| - Used methods: linear regression and LSTM | |||
| Gozes et al. [21] | - Chest CT scan-based COVID-19 detection | - Understanding of the radiographic manifestations | - Difficult detection in the early phase of COVID-19 |
| - Used method: residual network | |||
| Wang et al. [22] | - Identification of potential high-risk COVID-19 patients | - Strategies with high and low risk patient groups | - Ignorance of human mobility |
| - Used method: deep neural network | |||
| Zeroual et al. [23] | - Prediction of the number of new and recovered cases | - Consideration of time-variant properties | - Ignorance of human mobility |
| - Used methods: LSTM, bidirectional LSTM and variational autoencoder (VAE) |
Table 2.
Deep learning-based infection modeling and the related framework.
| Research Studies | Application | Deep Learning Method |
|---|---|---|
| Shaun et al. [31] | - Observation of structural patterns of amino acids | CNN |
| - Interactions between local sequence motifs using a CNN | ||
| Chunlei et al. [32] | - DNN-based classifier for cancer prediction using DNA methylation data | DNN |
| Mohaiminul et al. [33] | - Predicting phenotypic traits and diseases from omics data | DNN |
| Yongbin et al. [34] | - Estimation of infectious pattern of hand–foot–mouth disease data | LSTM |
| Taeho et al. [35] | - Prediction of Alzheimer’s disease based on neuroimaging data | CNN and recurrent neural network (RNN) |
| Wang et al. [36] | - Malaria prediction using ensemble algorithms | LSTM |
| Jiangeng et al. [37] | - Forecasting air quality time series | Multitask learning pre-trained by a deep-belief network. |
| Shen et al. [38] | - Detection of coronary artery disease based on facial photo | CNN |
Table 3.
Notations of variables and parameters.
| Symbol | Description |
|---|---|
| Variables | |
| Number of susceptible humans in sub-population | |
| Number of exposed humans in sub-population | |
| Number of infected humans in sub-population | |
| Number of recovered humans in sub-population | |
| Number of susceptible humans in sub-population | |
| Number of exposed humans in sub-population | |
| Number of infected humans in sub-population | |
| Number of recovered humans in sub-population | |
| Parameters | |
| Influx rate of susceptible humans | |
| Rate from “susceptible” status to “exposed” status in sub-pop | |
| Rate from “exposed” status to “infected” status in sub-pop | |
| Rate from “infected” status to “recovered” status in sub-pop | |
| Rate from “susceptible” status to “exposed” status in sub-pop | |
| Rate from “exposed” status to “infected” status in sub-pop | |
| Rate from “infected” status to “recovered” status in sub-pop | |
| Rate from “recovered” status to “susceptible” status | |
| Natural death rate of susceptible human | |
| Natural death rate of exposed human | |
| Natural death rate of infected human | |
| Natural death rate of recovered human | |
| Disease-induced death rate of infected human | |
| Infection rate in the same sub-pop | |
| Infection rate from sub-pop to sub-pop | |
| Infection rate from sub-pop to sub-pop | |
| Migration rate in the same sub-pop | |
| Migration rate from sub-pop to sub-pop | |
| Migration rate from sub-pop to sub-pop |
Table 4.
Datasets of COVID-19 cases in Seoul and Daegu.
| Data Characteristics | Seoul | Daegu |
|---|---|---|
| Time period | 12 March 2020–14 August 2020 | 8 April 2020–4 September 2020 |
| Characteristics of the basic reproduction number | Highest value is 2.65 on 18 August 2020 | Highest value is 7.25 on 26 February 2020 |
Table 5.
Characteristics of the compared methods.
| Methods | Proposed Hybrid Deep Learning Framework | LSTM | DNN | |
|---|---|---|---|---|
| Core Deep Learning Module (LSTM) | Core Deep Learning Module (DNN) | |||
| Input | ODE-based epidemic estimation and historical data of COVID-19 at t-1 | ODE-based epidemic estimation and historical data of COVID-19 at t-1 | historical data of COVID-19 at t-1 | historical data of COVID-19 at t-1 |
| Output | Parameters of meta-population model | Parameters of meta-population model | Parameters of meta-population model | Parameters of meta-population model |
| Number of layers | 4 | 4 | 4 | 4 |
| Activation functions | tanh, sigmoid | ReLU | tanh, sigmoid | ReLU |
| Number of epochs | 300 | 300 | 300 | 300 |
| Optimizer | Adam | Adam | Adam | Adam |
| Learning rate | 0.001 | 0.001 | 0.001 | 0.001 |
Table 6.
Comparisons of the estimated Rt value for Seoul.
| Target Date | Actual Value | Proposed Framework with LSTM | Proposed Framework with DNN | LSTM | DNN |
|---|---|---|---|---|---|
| 17 March | 1.36 | 1.49 | 1.75 | 1.45 | 1.29 |
| 13 April | 0.89 | 0.98 | 0.87 | 1.02 | 0.73 |
| 15 May | 1.31 | 1.20 | 1.77 | 1.11 | 1.31 |
| 4 June | 1.26 | 1.20 | 1.64 | 1.16 | 1.31 |
| 4 July | 0.93 | 0.96 | 0.92 | 0.97 | 0.73 |
| 6 August | 0.94 | 0.95 | 0.93 | 0.96 | 0.75 |
Table 7.
Estimated number of infected people on target dates using the proposed method and conventional machine learning methods.
Table 7.
Estimated number of infected people on target dates using the proposed method and conventional machine learning methods.
| Target Date | Actual Value | Proposed Framework with LSTM | Proposed Framework with DNN | LSTM | DNN |
|---|---|---|---|---|---|
| 17 March | 12 | 12 | 9 | 8 | 1 |
| 13 April | 8 | 8 | 4 | 6 | 1 |
| 15 May | 14 | 14 | 11 | 8 | 1 |
| 4 June | 14 | 14 | 11 | 14 | 2 |
| 4 July | 7 | 7 | 5 | 11 | 1 |
| 6 August | 9 | 9 | 7 | 9 | 1 |
Table 8.
Comparisons of the estimated Rt value for Daegu.
| Target Date | Actual Value | Proposed Framework with LSTM | Proposed Framework with DNN | LSTM | DNN |
|---|---|---|---|---|---|
| 16t April | 0.69 | 0.77 | 0.74 | 0.65 | 0.78 |
| 15 May | 0.68 | 0.69 | 0.75 | 0.71 | 0.75 |
| 13 Jun | 0.75 | 0.75 | 0.86 | 0.76 | 0.71 |
| 20 July | 0.88 | 0.97 | 0.81 | 1.1 | 0.71 |
| 17 August | 0.93 | 0.93 | 0.98 | 0.98 | 1.66 |
Table 9.
Comparisons of the estimated It value for Daegu.
| Target Date | Actual Value | Proposed Framework with LSTM | Proposed Framework with DNN | LSTM | DNN |
|---|---|---|---|---|---|
| 16 April | 4 | 4 | 5 | 4 | 3 |
| 15 May | 3 | 3 | 3 | 3 | 4 |
| 13 June | 3 | 3 | 2 | 1 | 4 |
| 20 July | 2 | 2 | 2 | 2 | 4 |
| 17 August | 1 | 1 | 1 | 1 | 4 |
Table 10.
Comparison of RMSE values for each method.
| Comparison | Seoul Case | Daegu Case | |||
|---|---|---|---|---|---|
| The proposed hybrid deep learning framework | Meta-population model + LSTM | 3.04 | 0.14 | 0.84 | 0.12 |
| Meta-population model + DNN | 9.20 | 0.19 | 4.57 | 0.14 | |
| LSTM | 5.70 | 0.17 | 1.05 | 0.20 | |
| DNN | 11.24 | 0.21 | 4.45 | 0.21 | |
Publisher’s Note: MDPI stays neutral with regard to jurisdictional claims in published maps and institutional affiliations. |
© 2020 by the authors. Licensee MDPI, Basel, Switzerland. This article is an open access article distributed under the terms and conditions of the Creative Commons Attribution (CC BY) license (http://creativecommons.org/licenses/by/4.0/).
Share and Cite
MDPI and ACS Style
Rahmadani, F.; Lee, H. Hybrid Deep Learning-Based Epidemic Prediction Framework of COVID-19: South Korea Case. Appl. Sci. 2020, 10, 8539. https://0-doi-org.brum.beds.ac.uk/10.3390/app10238539
AMA Style
Rahmadani F, Lee H. Hybrid Deep Learning-Based Epidemic Prediction Framework of COVID-19: South Korea Case. Applied Sciences. 2020; 10(23):8539. https://0-doi-org.brum.beds.ac.uk/10.3390/app10238539
Chicago/Turabian StyleRahmadani, Firda, and Hyunsoo Lee. 2020. "Hybrid Deep Learning-Based Epidemic Prediction Framework of COVID-19: South Korea Case" Applied Sciences 10, no. 23: 8539. https://0-doi-org.brum.beds.ac.uk/10.3390/app10238539
Note that from the first issue of 2016, this journal uses article numbers instead of page numbers. See further details here.