1. Introduction
The presence of masonry infill walls (MIW) in reinforced concrete buildings is quite widespread. The MIW are widely used for partition purposes and to provide thermal and acoustic insulation to the structures. Recent and past earthquakes showed that the MIW out-of-plane (OOP) collapse called into question the life-safety and near collapse limit states of many building structures [
1,
2]. The MIW collapse has been responsible for human severe injuries, casualties and high economic losses [
3]. Therefore, the adequate knowledge of the MIW flexural capacity is fundamental to guide the designers to develop strengthening efficient strategies to reduce their vulnerability. The MIW retrofitting need to be a priority by the national and international authorities. Application of appropriate strengthening solutions, well designed, need to be mandatory in future standards for new constructions and rehabilitation of existing ones. Currently, there is not any design procedure for prevention of the infills OOP collapse available in the codes. Due to the high non-linearity and fragility of the MIW, the retrofitting and strengthening becomes quite complicated. The experimental testing needs to address the effect of the MIW in the global response of the building structure and to identify the variables that increase the OOP collapse vulnerability.
Different retrofitting and strengthening strategies can be found over the literature [
4], namely the use of fiber reinforced polymers (FRP) [
5,
6,
7], engineered cementitious composites (ECC) [
8,
9,
10], textile reinforced mortars (TRM) and bed joints’ reinforcement [
11]. Concerning the last technique, it is more usual in the case of new constructions. The definition of the appropriate solution depends on different issues, being the most relevant ones the costs (material and workmanship), complexity (design methodology, interpretation of the problem) and appropriate knowledge to apply the technique.
From the literature review, it is possible to observe that the most prevalent techniques are the use of FRP and TRM. Most of the studies carried out using FRP to strengthen MIW is related to their in-plane behaviour. The first application of FRP to improve the MIW OOP behaviour was carried out by Haroun and Ghoneam [
12]. Later, Carney and Myers [
13] tested MIW built with concrete blocks strengthened with FRP applied with two different approaches, namely: (i) application of externally bonded glass FRP laminates, and (ii) near surface mounted glass FRP rods. The walls were subjected to OOP flexural strength tests until its rupture. The most prevalent failure mode observed was de FRP delamination, and masonry units cracking near to the FRP strips. It was observed an improvement of the OOP strength and energy dissipation capacity up to 200%. Later, Lunn and Rizkalla [
6] tested a series of MIW made of solid clay bricks subjected to distributed OOP loadings. Glass FRP was applied assuming different strategies concerning the overlapping in the frame-panel interfaces. From the results, the authors found an improvement of the panel strength up to 200% and the most common failure mode was again the delamination of the FRP strips. The authors pointed out the significant contribution of the anchorage of the strengthening material to prevent the strengthening failure for lower OOP loading demands.
The TRM strengthening is a very attractive solution since it involves a composite made of reinforcing meshes such as textile meshes (made of different materials such as glass, carbon, or polypropylene) embedded in an inorganic mortar. The mortar can have standard properties or high strength and/or ductility characteristics. The TRM has the potential to integrate thermal energy insulation material, which proved to be a new trend in the strengthening of buildings’ envelopes [
14]. The MIW retrofitting is considered mandatory since the reduction of the out-of-plane vulnerability is a priority nowadays. Economical and efficient solutions with easy applications procedures must be developed and proposed to designers and construction companies. Before application on existing constructions, the realization of mechanical characterization tests allows to assess and discuss the efficiency of retrofitting solutions, check if there are any local or global problems related to the compatibility between the retrofitting material and the wall. These solutions aim to reduce the out-of-plane collapse vulnerability and reduce their impact on society.
Guidi, et al. [
15] studied the effectiveness of TRM strengthening applied in infilled RC frames subjected to combined IP-OOP loading tests. A total of 6 specimens were tested, namely: two non-strengthened specimens; two specimens built with horizontal and vertical bed joints reinforcement; two models strengthened using a glass fibre mesh that was cast in an extra fibre-reinforced plaster layer. No detailed properties were provided concerning the strengthening material. From the test results, it was observed that a higher OOP strength of the strengthened specimens was achieved for more considerable IP prior drift. Without strengthening it was observed a substantial reduction of 23%, while the strengthened specimens reached a drop of about 6%. The strengthened specimens reached an OOP strength 54% higher than that the as-built ones. Francesca da Porto, et al. [
16] tested the TRM effectiveness to improve the MIW OOP behaviour. Full-scale specimens were tested, in which the walls were built with hollow clay brick masonry units. From the results, it was noticed that the panels OOP behaviour improved significantly, reaching 2.7 times to 3.5 times higher OOP strength. It was also concluded that the retrofitting allowed the controlled collapse of the panel. Koutas and Bournas (2019) carried out a scaled testing campaign, comprising six half-scale and single-story masonry-infilled RC frames strengthened with TRM and subjected to OOP loading demands. The strengthening improvement varied from 3.79 to 5.45 times for single-wythe wall specimens and 2.45 for double-wythe walls. On the other hand, it was reached an increase of the energy dissipation capacity from 138% to 261%.
More recently, De Risi, et al. [
17] carried out a set of OOP tests in infilled RC frames strengthened with TRM. The primary goal was to prevent the OOP collapse and assess the importance of the anchorage of the strengthening materials. For this, the authors tested two different types of anchorages, namely a weak plastic connector and a more robust L-shape glass fibre connector. From the tests, the authors noticed that the maximum strength improved 77% to 122% and their energy dissipation capacity up to 93%. It was evident the prominent role of the anchorage since it guaranteed the proper position and fixation of the strengthening material during the tests. Later, Koutas and Bournas [
18] tested the application of TRM in scaled infilled RC specimens with and without mesh-frame anchorages. The authors found an improvement of the maximum strength from 145% to 445% and of the energy dissipation capacity from 139% to 261%.
Based on the results available in the literature it is possible to address some conclusions about the beneficial effect of using TRM to strengthen MIW; however, it has not been studied the impact of the mesh tensile strength. Additionally, a detailed characterization of MIW made of hollow clay horizontal brick units, strengthened with TRM under OOP loading demands is still missing in the literature.
The principal objective of this research work is to study the effectiveness of using TRM strengthening in MIW subjected to flexural strength tests parallel to the bed joints. A total of eighteen specimens were tested, in which eight were not strengthened (two without plaster and six with plaster) plus ten strengthened specimens (five with a soft textile mesh and five with a strong one). All the models have the same geometric dimensions, materials, and the flexural strength tests were carried out according to the standard NP EN 1052-2 [
19]. The details of the testing campaign will be provided, with particular emphasis on the MIW specimens description, the strengthening materials and their application. Material properties from the walls and strengthening material are provided. After that, details concerning the test setup, instrumentation and loading protocol are described. The core of this research work is the analysis of the experimental results, in which the discussion focuses on the force-displacement curves and failure modes. The efficiency of the strengthening techniques is assessed by comparing the results with those obtained in the as-built reference ones. Also, the comparative analysis of the performance of TRM with a weak and a strong mesh is carried out.
2. Testing Campaign Overview
The testing campaign overview will be the focus of this section. First, the characteristics and details of the specimens that comprise the testing campaign are presented in
Section 2.1. Afterwards, it is given a summary of the material properties of the MIW in
Section 2.2.
Section 2.3 aims to provide definition and strengthening process adopted in this work. Characteristics of the textile meshes and connectors are provided. Finally, the test setup, loading protocol and instrumentation are presented in the last sub-section.
2.1. Specimens’ Characteristics
The MIW geometric dimensions were defined according to the standard NP EN1052-2 (CEN 1999) recommendations. The geometric dimensions were defined as 600 × 620 mm, respectively, width and height. Hollow clay horizontal bricks 150 mm thick were used, representative of those used in the southern European countries. The mortar used for the bed joints construction and plastering is a ready-mix traditional mortar type M5 class. As previously stated, a group of eight non-strengthened MIW were tested, two of them without plaster (herein named “HCHB150” group) and six with 10 mm thick plaster (herein called “HCHB150P10”). These eight specimens are used as reference specimens in this testing campaign.
The remaining ten MIW were strengthened with TRM using two different types of textile meshes, namely: (i) polypropylene (PP) mesh with a lower tensile strength, and (ii) strong glass fibre mesh (GFRP) with higher tensile strength. Five MIW were strengthened with the weak PP mesh (herein called “SWM” group), and five MIW were strengthened with the strong glass fibre mesh (herein called “SSM”). The details of the strengthening will be provided in
Section 2.3.
2.2. Material Properties
The masonry units selected for this experiment were hollow clay horizontal bricks, with a thickness of 150 mm and a percentage of voids equal to 80.5%. Compressive strength tests were carried out according to the standard NP EN 771-1 (CEN 2016). From the tests, it was found an average compression strength equal to 1.04 MPa, a coefficient of variation (CoV) of 23.6% and standard deviation of 0.24 MPa. From the technical sheet provided by the supplier, it can be found that the content of active salts corresponds to an S0 category and that the units are an A1 Euroclass fire reaction category. Concerning the unit mass, it was found an average value equal to 5.2 kg per unit. The supplier also provided information concerning the thermal transmission coefficient, and acoustic insulation, which is 0.42 m2 K/W and 43 dB, respectively.
Mortar specimens, 40 × 40 × 160 mm, were collected during the construction and plastering of the MIW. Flexural and compression strength tests were carried out according to the standard EN 196-2006 (CEN 2006). Six specimens were tested for each group. The results are summarized in
Table 1.
Concerning the results of the mortar used in the construction of the walls, it can be observed that the flexural strength varies between 1.82 MPa (HCHB150 group) and 2.32 MPa (HCHB150P10 group). The lowest compressive strength was reached by SSM group with 5.12 MPa and the highest one achieved by SWM with a value equal to 6.49 MPa. The results obtained by the mortar used in the construction of the walls are globally similar and higher than the ones used in the walls plastering. The average flexural and compressive strength results of the mortar specimens collected from the walls plastering are 1.56 MPa and 4.09 MPa, respectively.
2.3. Description of the Strengthened Specimens
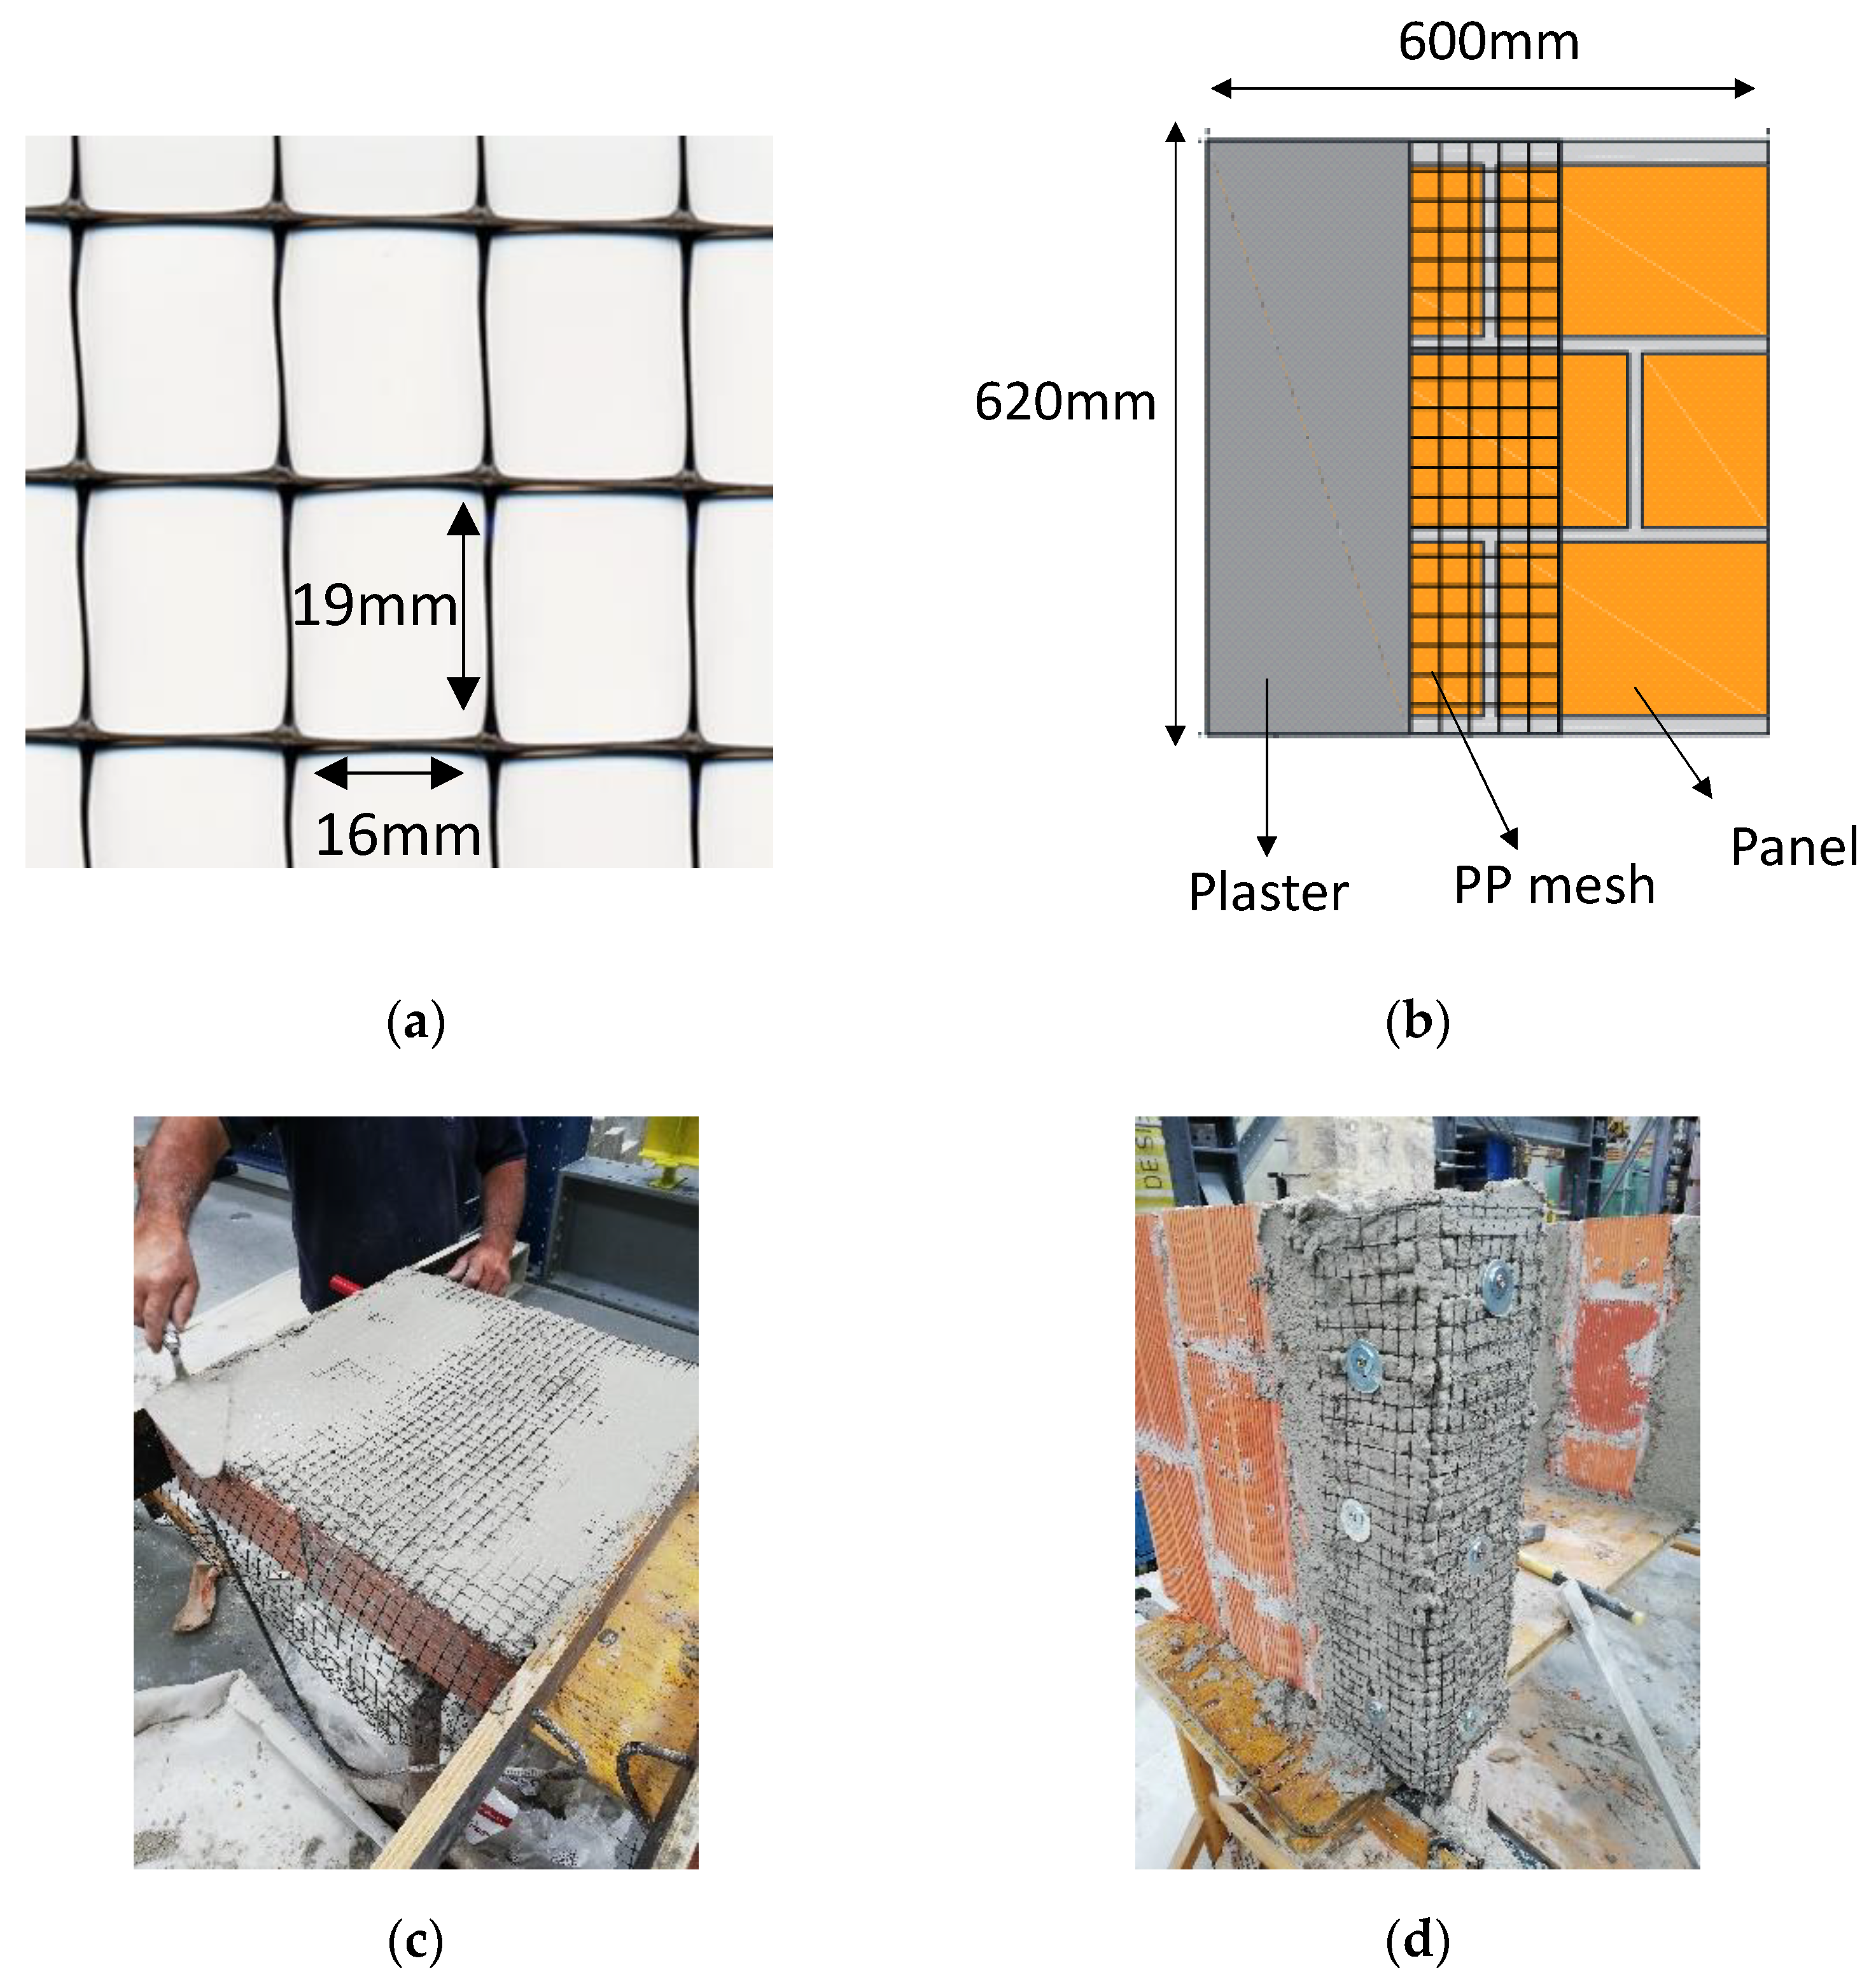
2.3.1. Strengthening with a Weak Mesh (SWM Group)
The first group of walls were strengthened using a PP textile mesh with a low tensile strength equal to 5.25 kN/m. This mesh is herein considered as a weak one and is typically recognized as a “Tenax aviary” mesh. The mesh size is equal to 16 × 19 mm and has a maximum yielding extension equal to 15%, a mesh density equal to 315 g/m
2 and is a bidirectional mesh, as shown in
Figure 1a. The schematic layout of the strengthening strategy adopted for the SWM specimens is shown in
Figure 1b. In
Figure 1c,d is shown the front and backside view of the MIW strengthening.
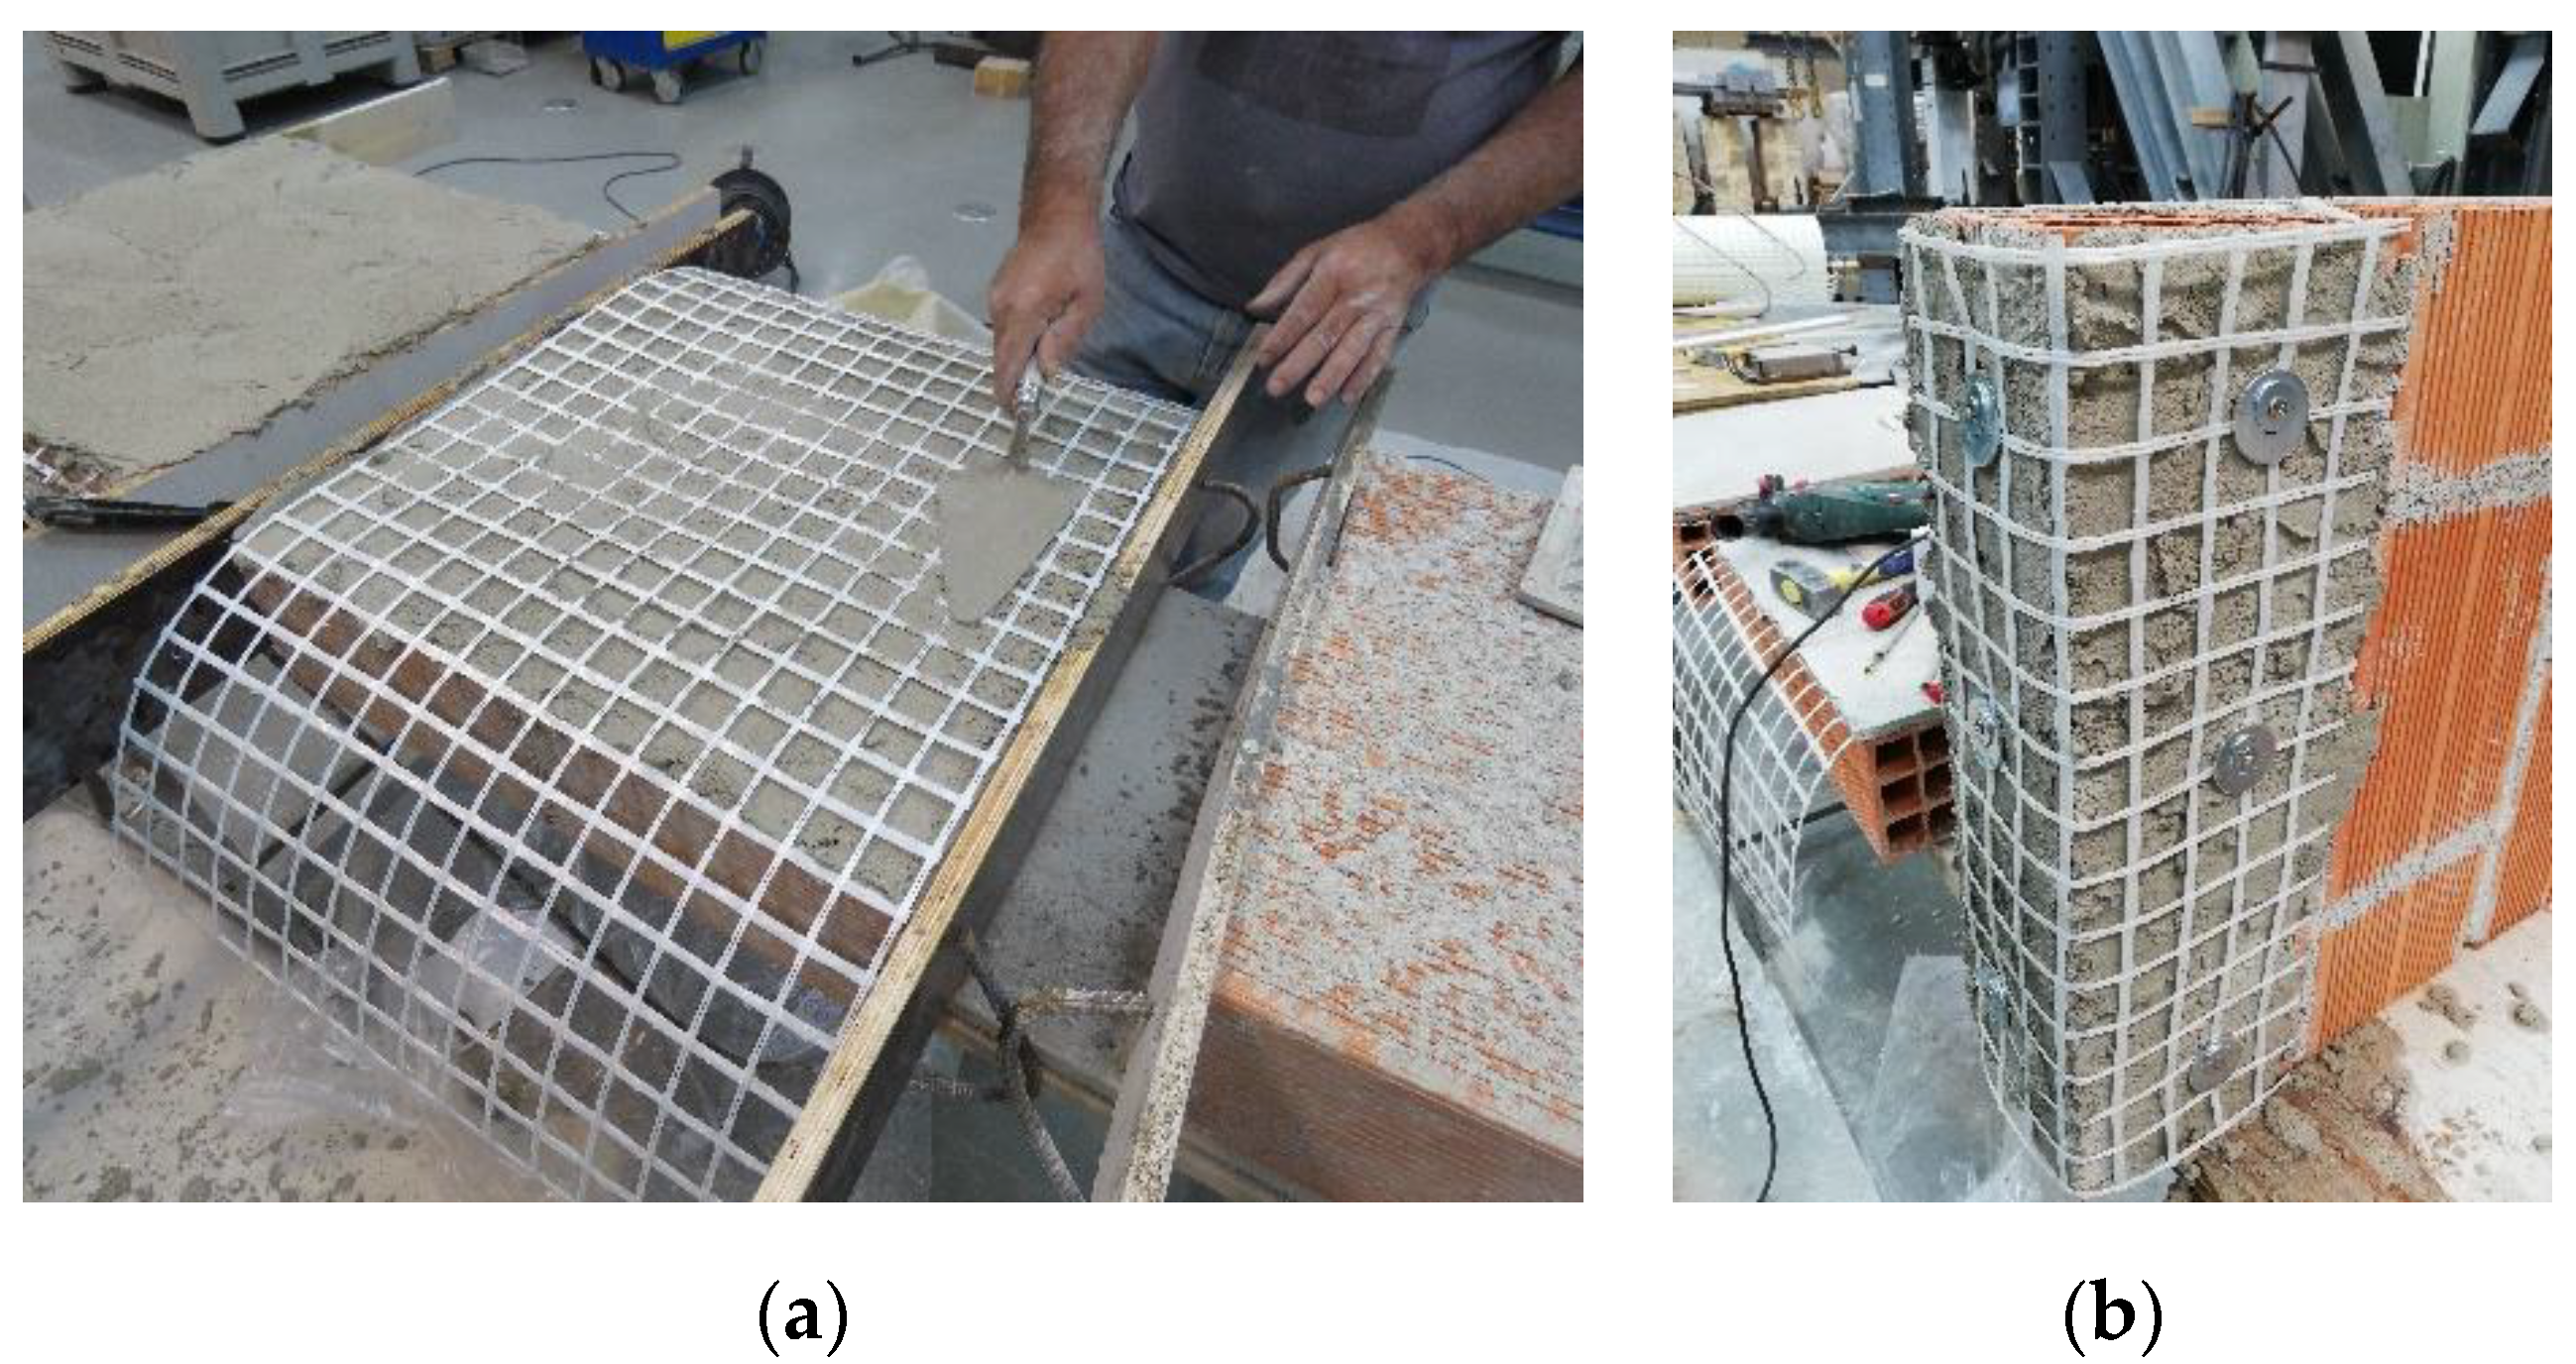
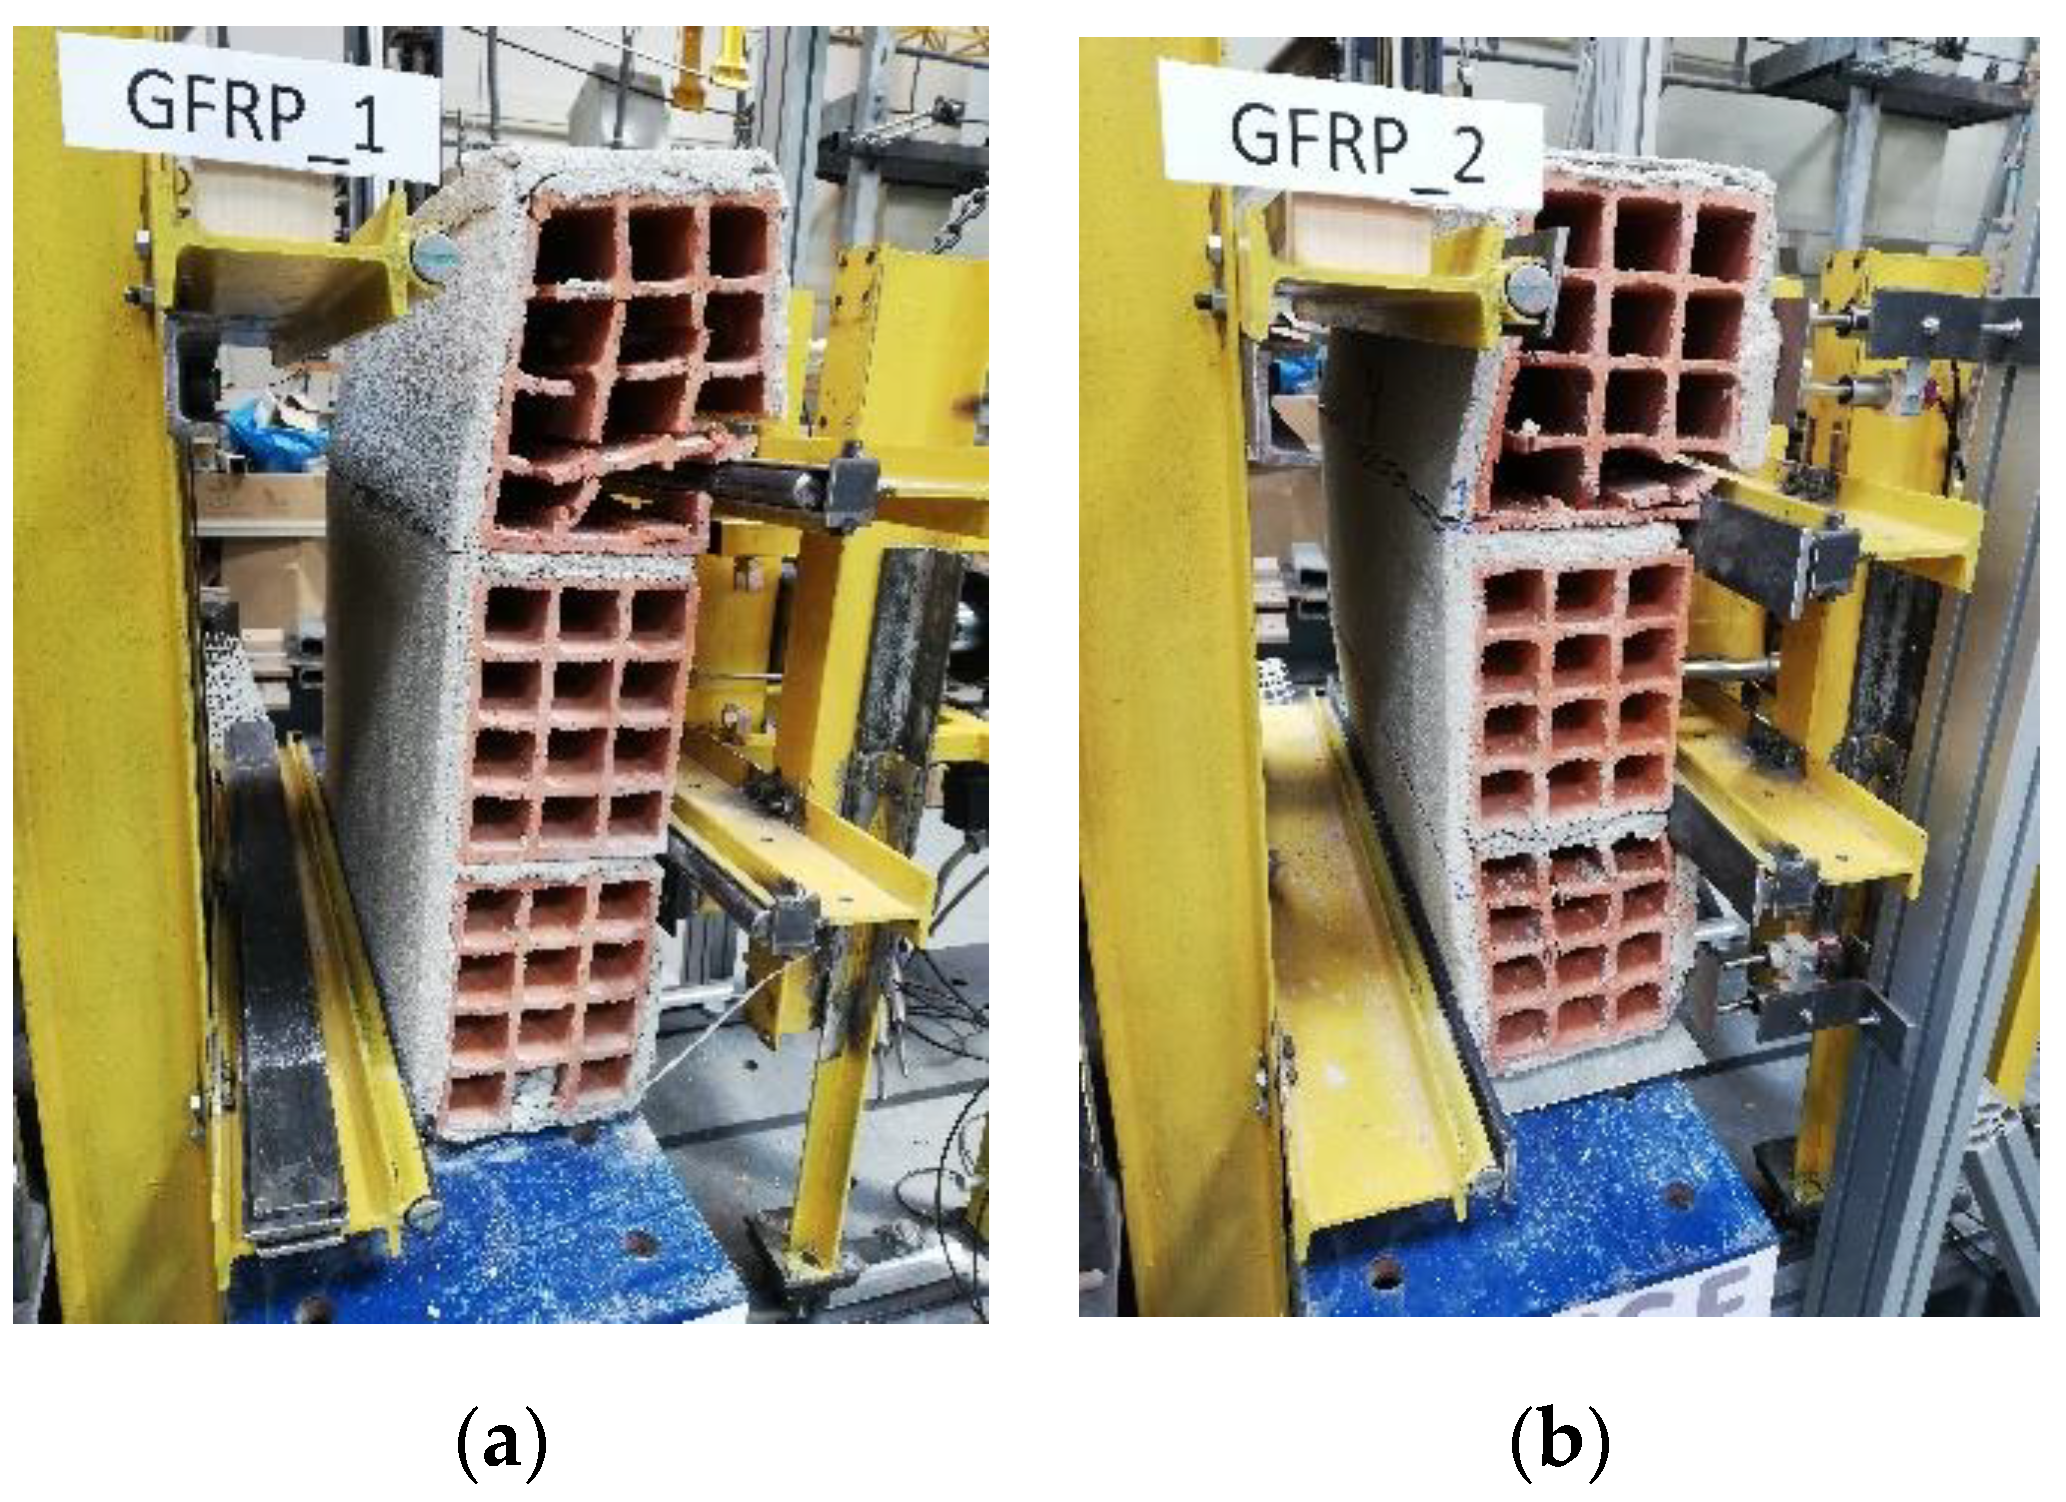
2.3.2. Strengthened Specimens with a Strong Mesh (SSM Group)
The walls that comprised the SSM group were strengthened using a glass fibre reinforced polymer (GFRP) textile mesh, designated FASSA NET ARG 40 and supplied by Fassa Bartolo. This mesh has a tensile strength equal to 70 kN/m, a mesh size equal to 40 × 40 mm, a maximum extension at rupture equal to 3% and a mesh density equal to 315 g/m
2. This textile mesh is bidirectional and is considered the strong mesh in this study. The schematic layout of the strengthening strategy of the SSM group specimens is shown in
Figure 1b.
Figure 2a,b shows the strengthening details of the models.
2.3.3. Strengthening Procedure
The strengthening procedure was the same for all the walls and followed the following steps, namely:
- ➣
Step 1: After the MIW construction, the walls were mortar splashed and 28 days later they were wet with water;
- ➣
Step 2: Application of the first layer of plaster with an average thickness of 5 mm;
- ➣
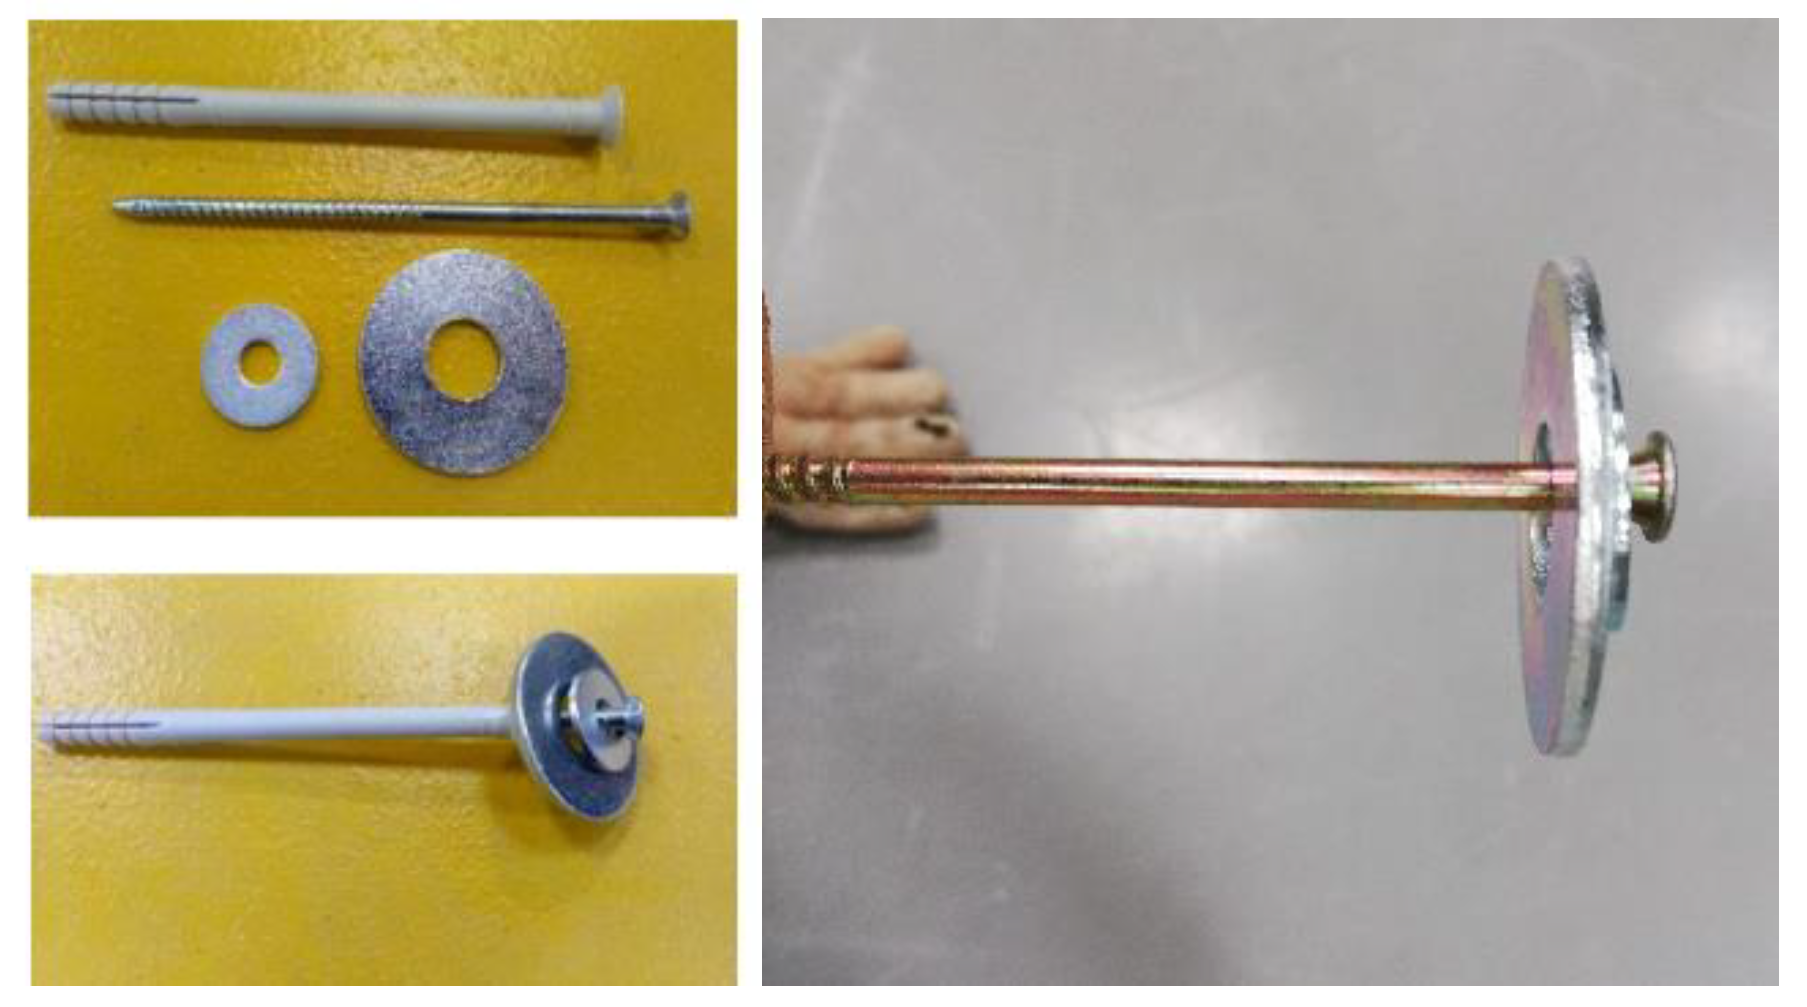
Step 3: Application of the textile mesh and after that, the second layer of plaster with an average thickness of 5 mm. The textile mesh, with a total length equal to 1050 mm, was placed in the wall surface. This 1050 mm were divided into the full extension of 600 mm for the panel height plus a remaining mesh extension of 450 mm divided for the top and bottom of the panel (150 mm for the top and 300 mm for the panel bottom). The textile mesh was folded to envelop the wall. After that, the mesh was fixed to top and backside of the wall through three steel connectors. The steel connectors (with a diameter and length equal to 6 mm and 8 cm, respectively, see
Figure 2) ensured the connection of the mesh to the panel and that the connectors crossed two of the brick internal septa. Two very thin steel plates were used to help to fix the textile mesh to the brick surface (see
Figure 3);
- ➣
Step 4: A 5 mm thick plaster was applied to cover the textile mesh in the top and backside of the wall.
2.4. Test Setup, Instrumentation and Loading Protocol
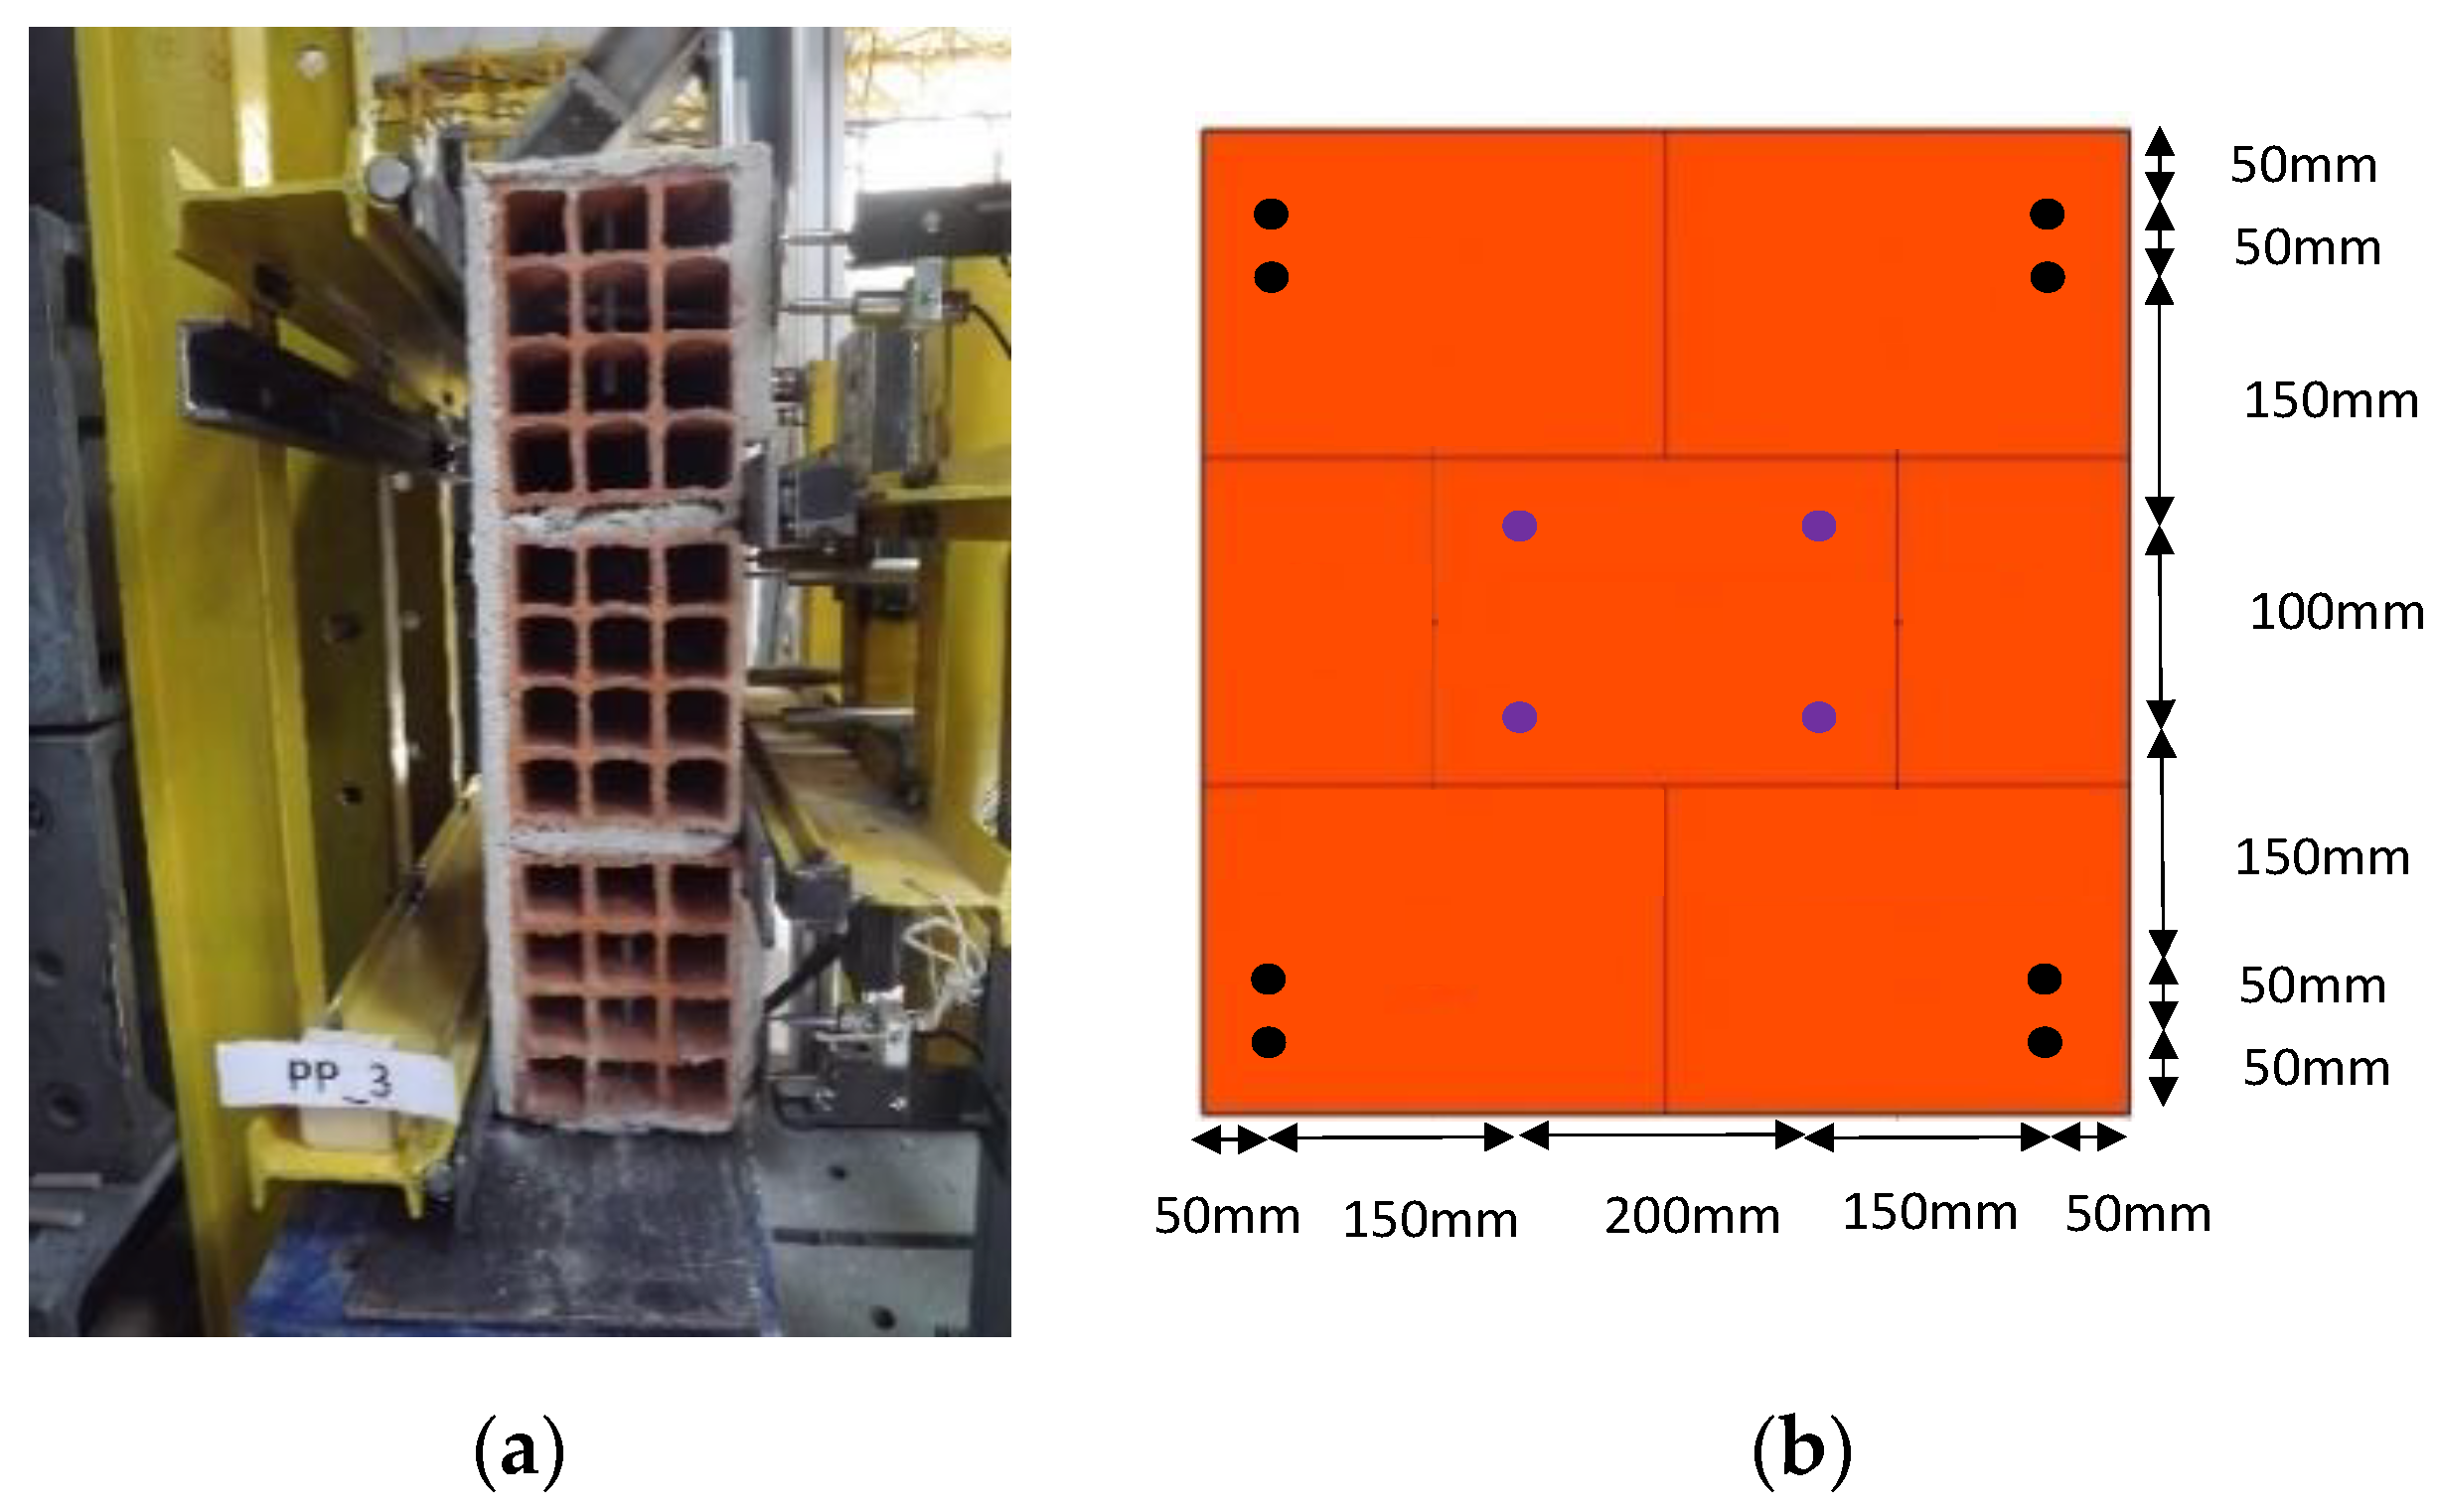
The test was performed according to the standard EN1052-2 (CEN 1999), in which it was used a servo-hydraulic actuator with a maximum capacity of 100 kN (±100 mm). The loading was distributed along two linear alignments distanced 300 mm apart (see
Figure 4a). The loading was applied through two rollers placed between the specimen and the steel shapes that were attached to the actuator. The rollers are free to rotate, thus allowing the rotation of the specimen. The model reacted against a steel structure, also composed by two horizontal rollers, inserted in other steel shapes. The OOP restraints were positioned according to the standard, namely 50 mm distanced from the top and bottom sections of all the specimens.
The standard demands only load monitoring during the tests. Nonetheless, instrumentation was used to measure the OOP deformation of the walls tested. Four LVDTs were used for the testing of groups HCHB150 and HCHB150P10. The LVDTS were placed at the wall geometric centre (100 mm vertical and 150 mm horizontal) and is shown in
Figure 4b by the blue circles.
Concerning the strengthened specimens, a total of 12 LVDTs were used to monitor the OOP displacements in the panel corners (2 LVDTs in each corner) and four central LVDTs. The LVDTs used in the panel corners allowed the determination of the rotation of the panel (
Figure 4b—red circles). The tests were performed until the panel total failure, in agreement with the standard EN1052-2 (CEN 1999).
3. Discussion of the Experimental Results
The test results are first presented and discussed by evaluating the force-displacement curves and the most representative failure modes and damages observed during the tests. After that, it will be assessed the maximum flexure strength obtained by each strengthened specimen to analyse the effect of the connectors. Finally, the efficiency of the strengthening strategies is analysed by comparing the results of the reinforced panels with the results of the non-strengthened ones.
3.1. Force-Displacement Curves
The flexural strength was computed according to the standard EN 1052-2 (CEN 1999) expression, given by Equation (1):
where,
fi,max is the maximum applied force,
l1 is the distance between OOP restrains,
l2 is the distance between the internal OOP loading application alignments, b is the specimen width and
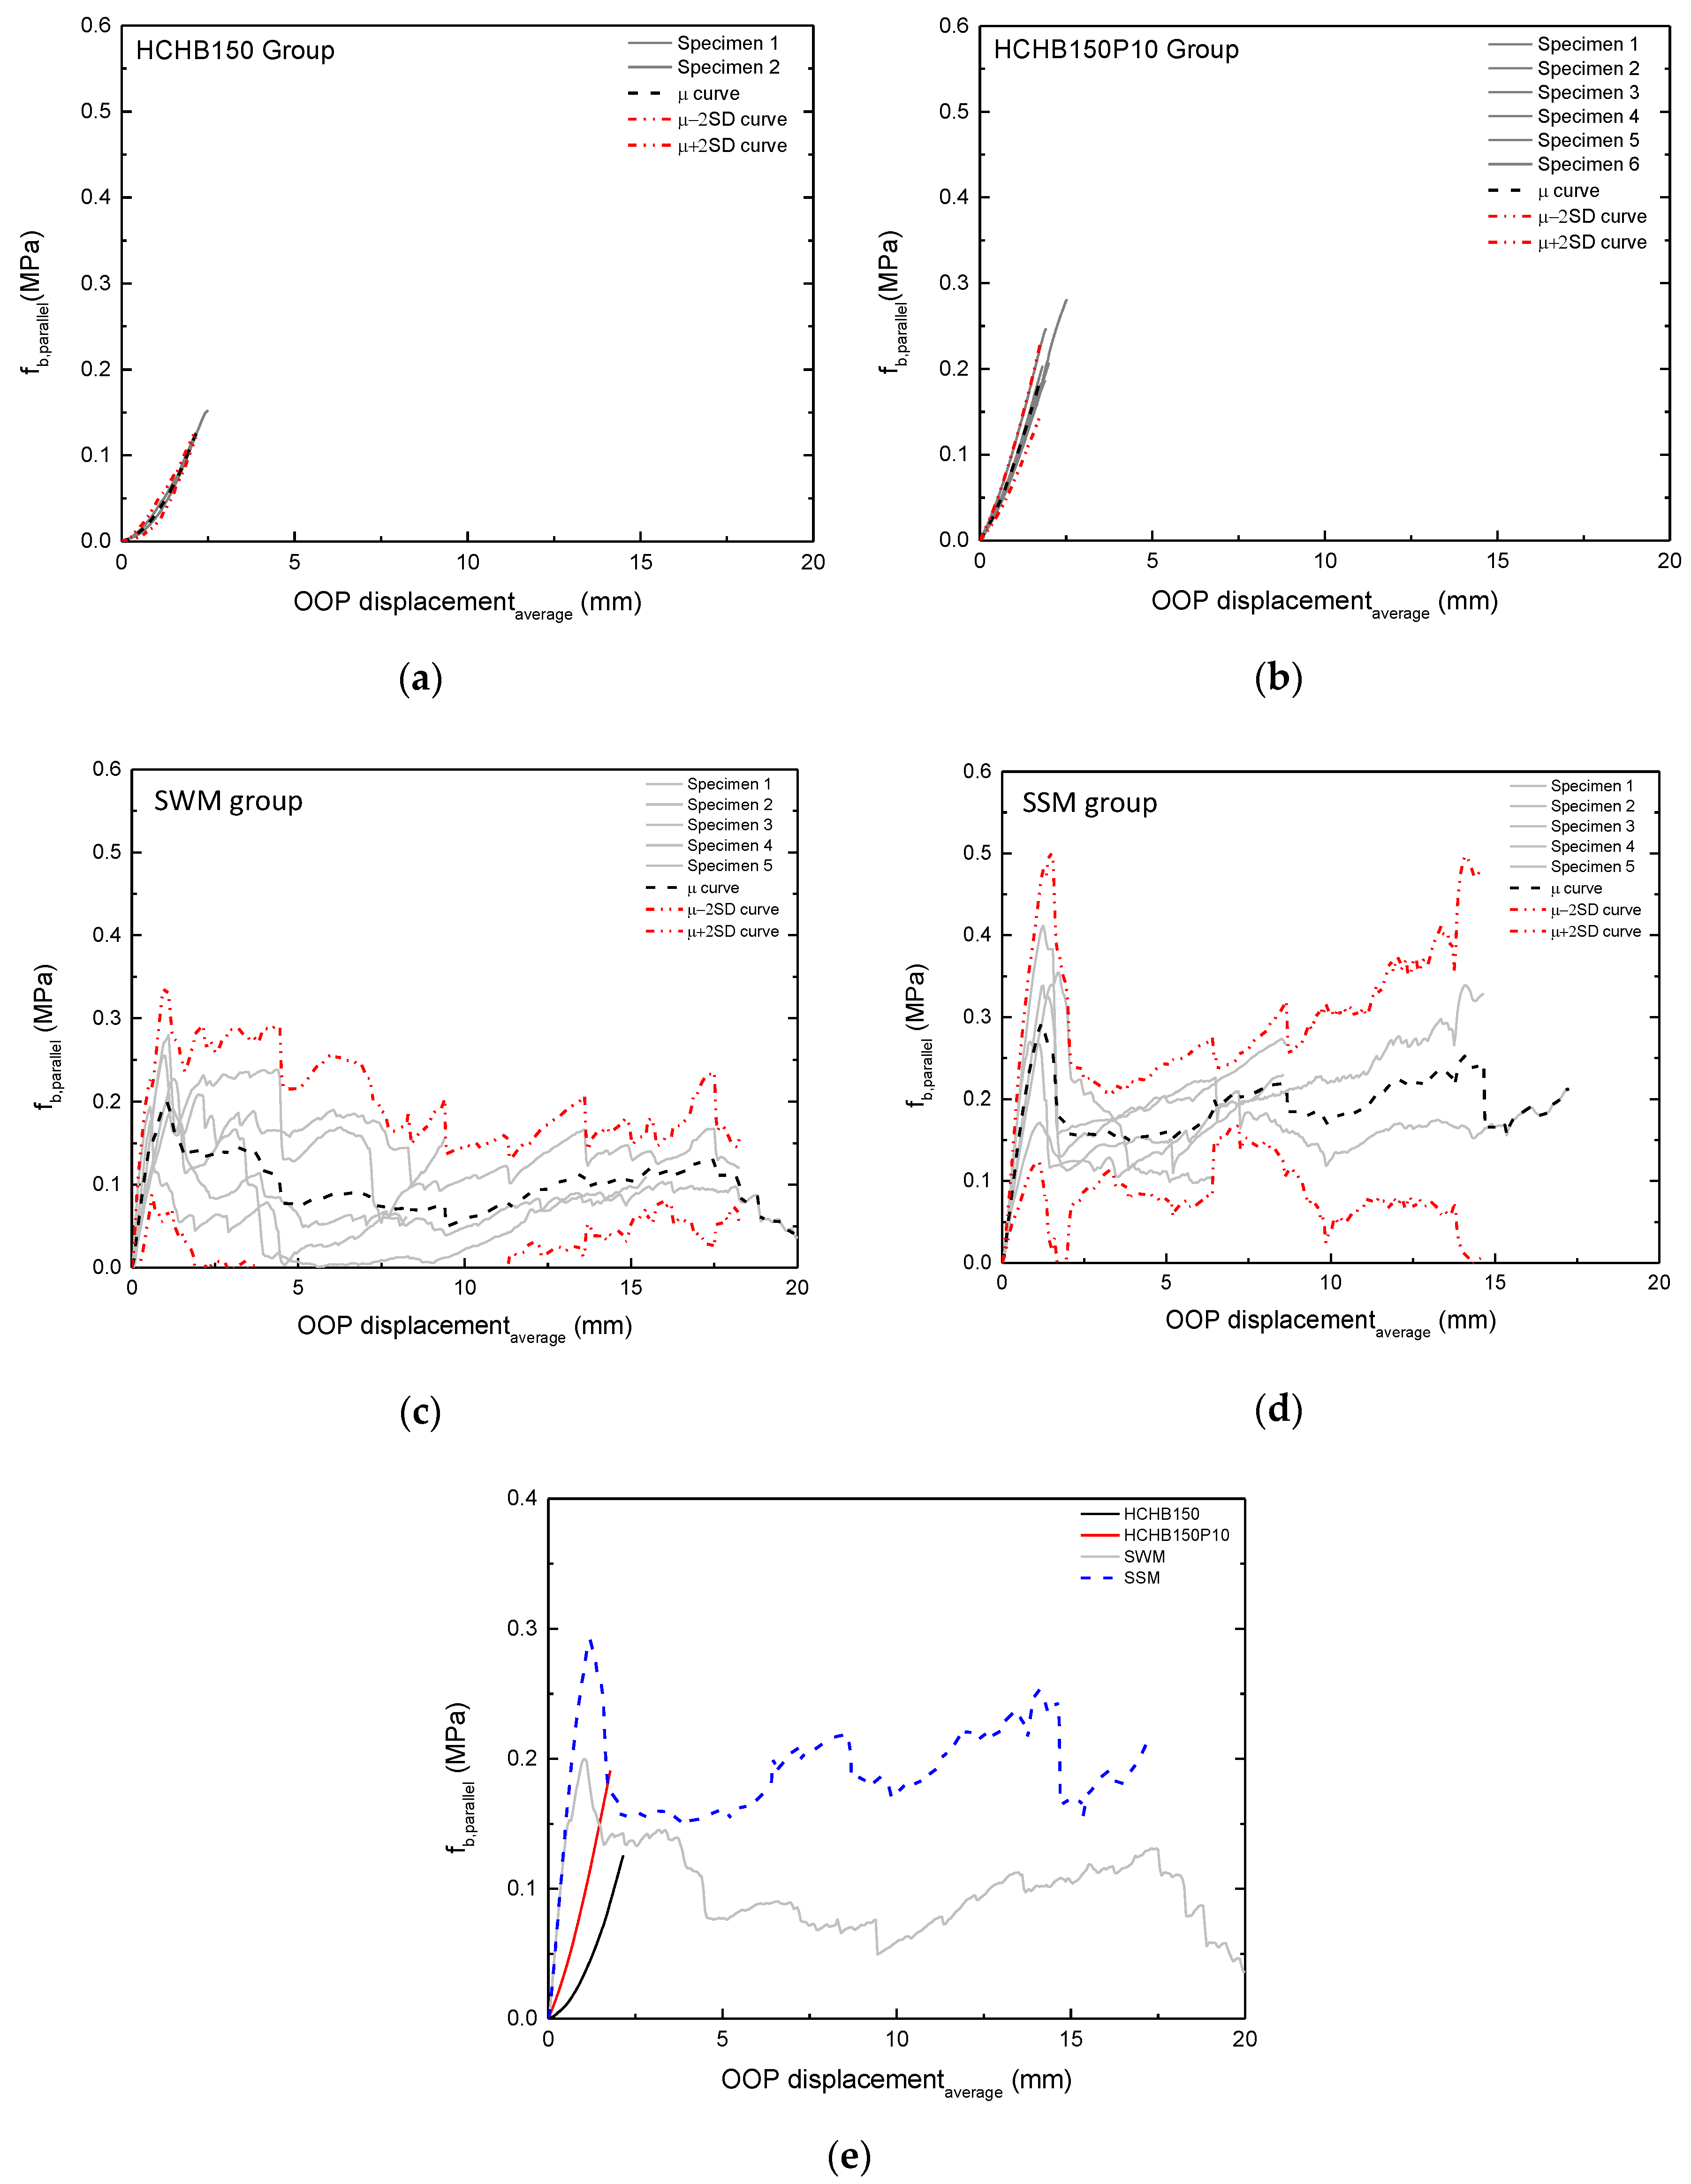
tu is the specimen thickness. The force-displacement curves of the groups HCHB150, HCHB150P10, SWM, SSM are plotted in
Figure 4. The OOP displacement considered was the average of the four central LVDT measurements. Additionally, the average curve, μ, of the stress-strain results obtained by all the specimens, the average curve plus two times the standard deviation (μ + 2 SD) and the average curve minus two times the standard deviation (μ − 2 SD) are included for each group result. The summary of the test results is presented in
Table 2. From the results, the following observations can be drawn, namely:
- ➣
The maximum strength achieved by HCHB150 group was 0.14 MPa (see
Figure 5a) with a CoV equal to 12.7%. It is possible to observe that the ultimate displacement corresponded in both tests to the displacement at the maximum force;
- ➣
The maximum strength of the HCHB150P10 group was 0.22MPa with a CoV equal to 17.6%, as shown in
Figure 5b. From the comparison between the HCHB150 and HCHB150P10 it is possible to observe that the plaster increased the flexure strength about 1.57 times;
- ➣
Regarding the SSM group,
Figure 5c, the maximum strength was achieved by specimen 2 with 0.41 MPa and the minimum one was equal to 0.21 MPa, thus about 50% lower. However, as summarized in
Table 2 it seems that the results obtained by specimen 1 were very different from the remaining ones, which affected the global average, CoV and standard deviation. For this, in
Table 2 is also included the average, CoV and standard deviation excluding the specimen 1 results which is more representative of the real behaviour of the GFRP group;
- ➣
The OOP displacement corresponding to the maximum strength of the SSM group ranged between 0.85 and 1.7 mm (
Figure 5d). On the other hand, the OOP ultimate displacement ranged between 6.4 mm and 14.65 mm. These results were affected by the mode of failure of the specimens;
- ➣
The SSM group average flexure strength was 0.34MPa with a CoV equal to 17%;
- ➣
The maximum force reached by the SWM group specimens was 8.69 kN (see
Figure 5c) and the lowest 5.93 kN. The average value equal to 7.12 kN (with a CoV of 16.81%) was achieved, as shown in
Figure 5b;
- ➣
The OOP displacement corresponding to the maximum strength of the SWM group ranged between 0.55 and 1.25 mm. The OOP ultimate displacement ranged between 8.25 mm and 20.15 mm;
- ➣
The SWM group achieved an average flexural strength equal to 0.23 MPa with a CoV equal to 16.53%. Regarding the comparison between the results obtained by each group, it can be observed that the flexural strength reached by the SSM group was 1.48 times higher, as plotted in when compared with SWM with similar CoV;
- ➣
Regarding the ultimate OOP displacement (last OOP displacement recorded in each test), it can be observed that the SWM reached an average value equal to 14.30 mm. This result is 50% higher than the SSM group, which can be due to the higher ductility of the PP textile mesh when compared with the GFRP mesh.
The comparison between the average curves of each group is plotted in
Figure 5e, from which it is possible to observe that the SSM group and the HCHB150 achieved the highest and lowest flexural strength, respectively. The SSM group reached a flexure strength about 2.43 times higher than that of HCHB150. From the comparison, between HCHB150P10 and the strengthened MIW it is evident that the TRM was efficient to improve the flexural strength (54% using SSM and 5% using SWM) and deformation capacity (4.78 times using SSM and 7.15 times using SWM).
From the comparison between the results herein obtained and those obtained in the literature, it is possible to conclude that the TRM reached lower improvement of the walls OOP strength. For example, the SWM and SSM groups got an average flexural strength of 0.23 MPa and 0.34 MPa, which means a gain of 5% and 55%, respectively. Regarding the use of a soft mesh, it can be concluded that this lower performance is due to the poor tensile strength of the net. Globally, these results cannot be directly related to OOP tests of infill walls surrounded by RC frames, which showed an improvement of up to 100%, since the arching mechanism development was limited in this testing campaign by the geometric dimensions of the specimens. This limitation could affect the flexural strength of the strengthened (and non-strengthened specimens).
3.2. Damages Observed and Failure Mode
Concerning the failure mode of the SSM specimens, shown in
Figure 6, they were characterized by the concentration of the deformation in the middle-height of the panel, observing the first cracking (sometimes in the ¾ or ¼ of the panel height) and consequently the development of another one. Flexural failure was observed until the crushing of the bricks in the backside of the panel (without strengthening), as shown in
Figure 6. It was observed in two specimens (specimen 1,
Figure 6a and specimen 2,
Figure 6b) shear failure, which justify the lower difference between the SSM group and SWM group results when compared with the differences of their meshes tensile strength. In the situations, in which the shear failure did not occur, and the specimen was in conditions of reaching higher OOP displacements.
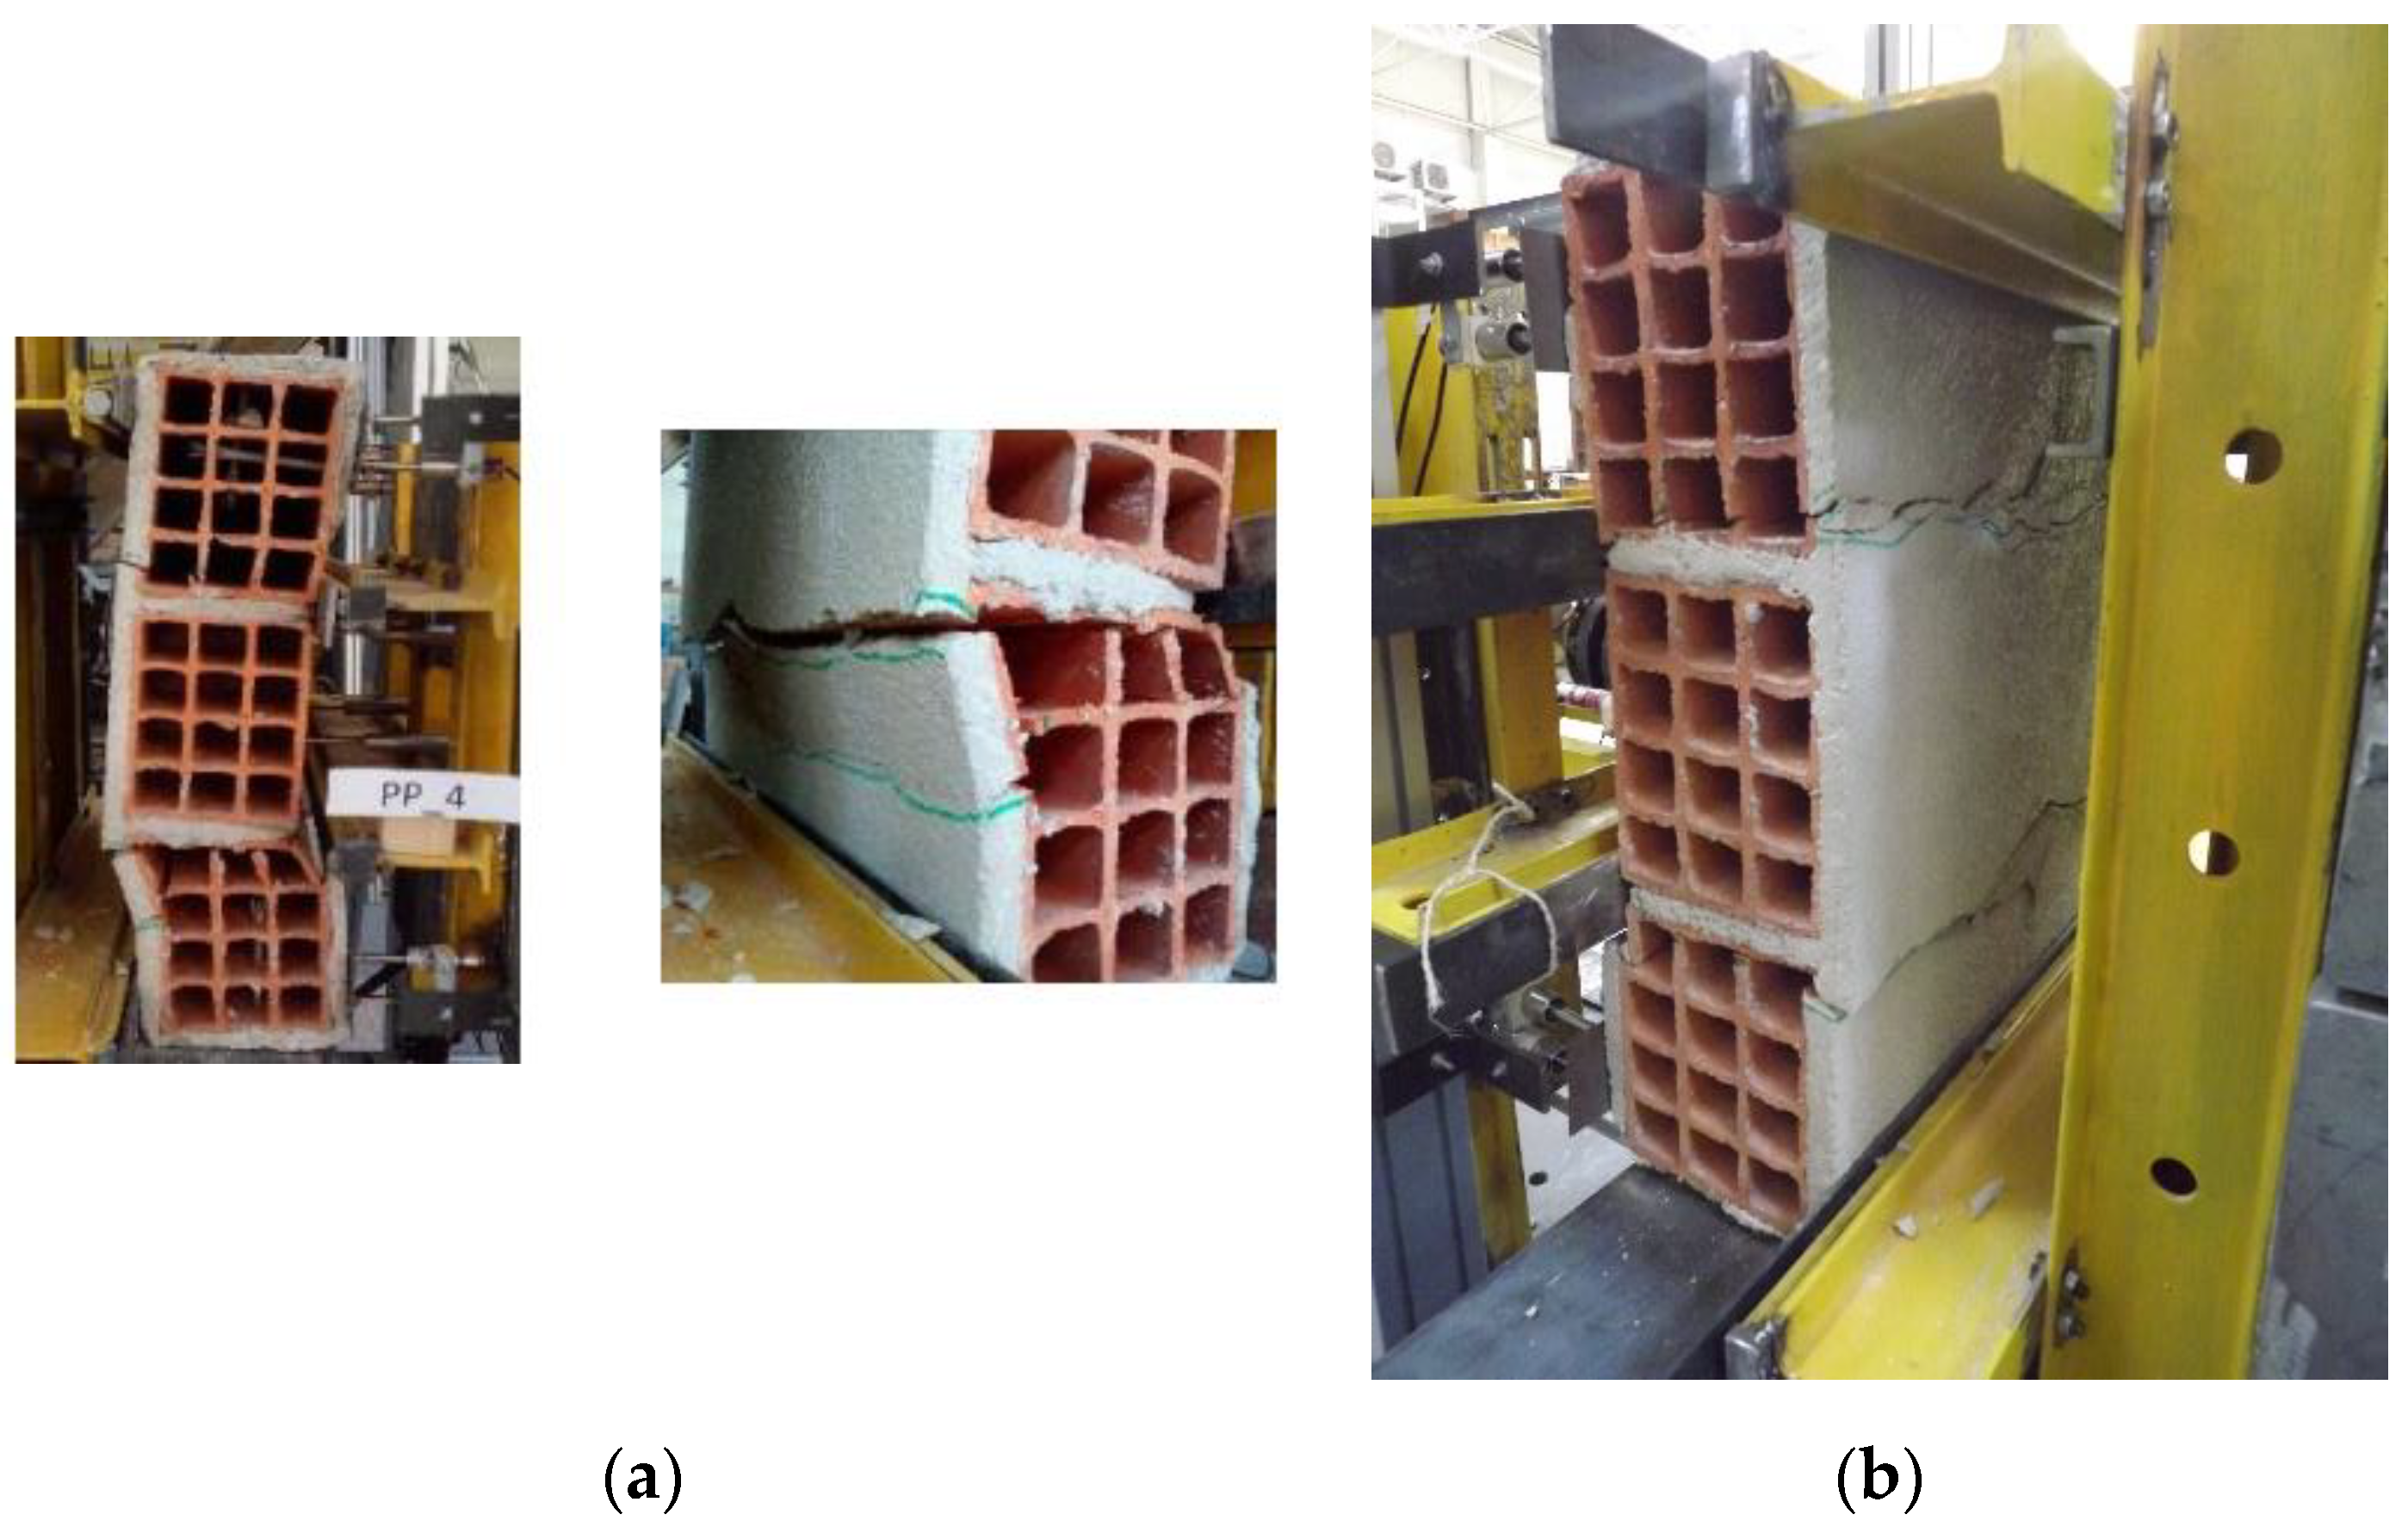
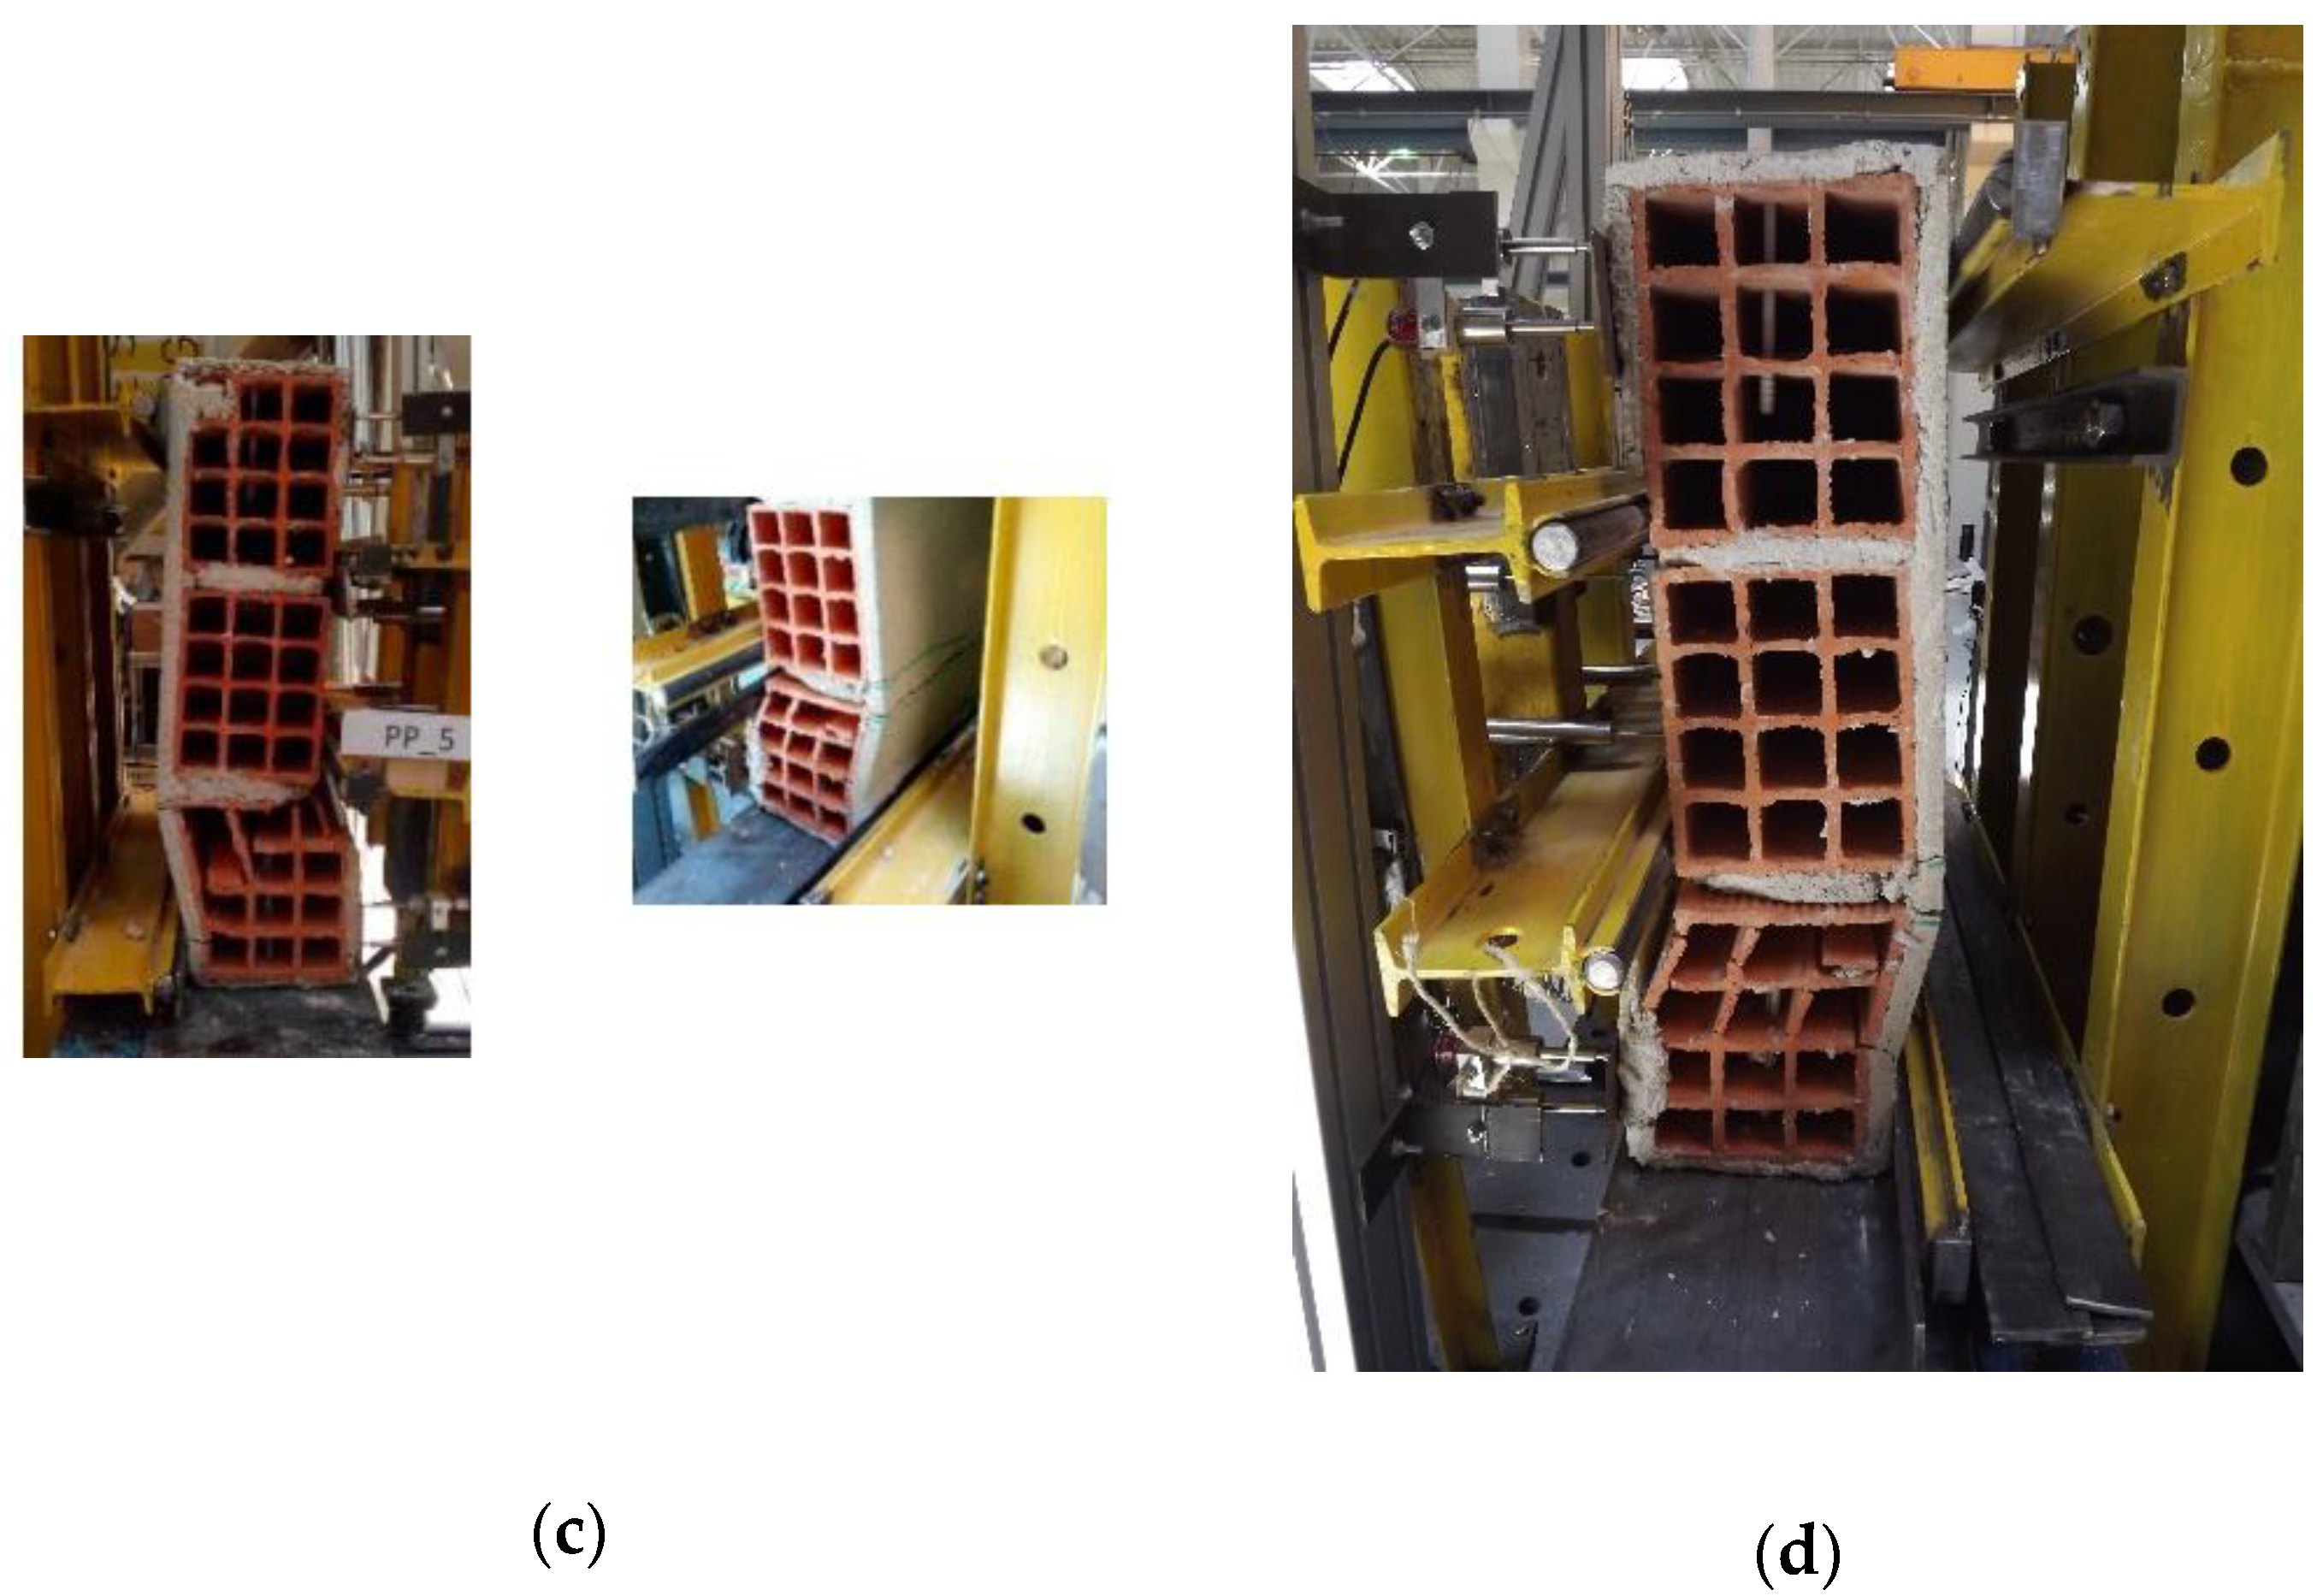
Concerning the SWM group, the failure mode was characterized by the development of many cracks along with the panel height and higher out-of-plane deformation along the bed joints alignment, shown in
Figure 7a. However, in specimens 3 and 5 it was observed shear failure, which limited the conclusions from those specimens (see
Figure 7b).
From the obtained results, it is clear that an additional testing campaign needs to be performed in panels with larger height/thickness ratio. It also requires the clarification of the OOP behaviour of infill walls in its as-built condition.
4. Final Remarks and Conclusions
The primary goal of this manuscript was the execution of a testing campaign to assess the efficiency of TRM strengthening solutions to improve the MIW out-of-plane behaviour, thus contributing to preventing their collapse in future earthquakes. An experimental campaign was carried out comprising by the realization of flexural strength tests parallel to the horizontal bed joints in eighteen MIW, 2 of them without plaster, 6 with plaster, 5 strengthened with low strength textile mesh and 5 with strong textile mesh. The effect of using plaster, TRM strengthening solution and the influence of using different types of mesh was assessed (such as weak or strong). From the testing campaign, the following conclusions can be drawn:
- ➣
The plaster increased the flexural capacity of the MIW about 57%; however, it was not observed significant contribution in the deformation capacity;
- ➣
Therefore, the TRM strengthening technique revealed to be adequate to improve the flexural capacity of the panels, both in terms of strength and deformation;
- ➣
The selection of the mesh should be performed taking into account the type of masonry unit used to build the panel, since if weak brick units such as HCHB are used, it will not explore all of the tensile strength characteristics of the mesh. The bricks will crush before the rupture of the mesh. It was observed that the rupture of the mesh occurred only when it was used the weak mesh (SWM specimens);
- ➣
The flexural strength increased 5% and 54% with a weak and strong mesh, respectively. On the other hand, the deformation capacity improved about 7.15 times and 4.18 times with a weak mesh and a strong mesh, respectively.
From this study, it can be concluded that a cheaper strengthening solution like TRM can be easily applied in the buildings envelopes to prevent the MIW out-of-plane collapse when subjected to earthquakes. This strategy could have a meaningful impact on the reduction of fatalities and economic losses in future events.
Finally, the dimensions of the specimen, which were designed according to the code standard demands, affected the conclusions of the testing campaign. It was observed shear failure in some of the models. The code demanding concerning the geometric dimensions should be revised to ensure the characterization of the flexure strength of non-strengthened and strengthened walls. As future work, it is suggested the repetition of this testing campaign using specimens with higher heigh/thickness (slenderness) ratio to clarify the findings herein obtained. Additionally, a future study is planned to be performed concerning the development of simplified analytical predictions of strengthened masonry infill walls with TRM.


