Article

Effects of Flexural Stiffness on Deformation Behaviour of Steel and FRP Stress-Ribbon Bridges

by
Algirdas Juozapaitis
1,
Giedrė Sandovič
1,
Ronaldas Jakubovskis
2 and
Viktor Gribniak
1,2,*
1
Department of Steel and Composite Structures, Vilnius Gediminas Technical University, Vilnius TECH, LT-10223 Vilnius, Lithuania
2
Laboratory of Innovative Building Structures, Vilnius TECH, LT-10223 Vilnius, Lithuania
*
Author to whom correspondence should be addressed.
Submission received: 12 February 2021 / Revised: 8 March 2021 / Accepted: 11 March 2021 / Published: 14 March 2021
(This article belongs to the Special Issue Advances on Structural Engineering, Volume II)

Abstract

:

Featured Application

A new structural system of the pedestrian bridge with ribbons made of flexural-stiff profiles is introduced and physically tested, proving its efficiency.

Abstract

Stress-ribbon systems develop the most flexible and slender bridges. A structural system of such elegant bridges consists of cables or ribbons and deck slabs placed to these strips to distribute the live load. Although this structural system is simple, the design of such structures is a challenging issue. Design limitations of the bridge deck slope induce considerable forces in the ribbons, which transfer the tension to massive foundations. The deformation increase under concentrated and asymmetrical loads causes another problem of stress-ribbon bridges—the kinematic component, the design object of such structures, exceeds the dead load-induced vertical displacement several times. This paper introduces a new concept of such a structural system, comprising ribbons made of flexural-stiff profiles. The proposed approach to reduce kinematic displacements is illustrated experimentally by testing two pedestrian bridge prototypes with different flexural stiffness of the steel ribbons. Numerical models calibrated using the test results are used for the parametric analysis of the flexural stiffness effect on the deformation behaviour of the bridge system with steel and fibre-reinforced polymer (FRP) ribbons. A practical approach to the choice of the efficient flexural stiffness of the ribbon-profiles is also proposed.

1. Introduction

The stress-ribbon layout is one of the oldest structural systems efficient for pedestrian bridges [1]. The assemblage slenderness makes such elegant structures an intrinsic part of the modern infrastructure [1,2,3,4,5]. A slightly sagged suspension band forms a catenary shape that looks natural and aesthetically attractive. The structural system of such bridges consists of cables and ribbons and the deck slabs placed on them. Typically, spiral strands and flexible bands made of steel are used for that purpose, though the number of fibre-reinforced polymers (FRP) application examples is continuously increasing [4,6]. The deck slabs, distributing the load to the supporting bands, often do not affect the load-bearing capacity of the bridge. Although this structural system is simple, its design is challenging. The serviceability demands limit the bridge deck slope to 8–12% [7,8], reducing the sag-to-span ratio (f/l) to the range of 0.020–0.033. Thus, large foundations are necessary to resist tremendous tension forces acting on the ribbons.
Another problem is related to the deformability of the stress-ribbon systems under concentrated and asymmetrical loads [1,5,9]—the kinematic displacement magnitude, the structural design object, can several times exceed the dead load-induced displacement component [10]. Enlarging the dead load, pre-stressing the concrete bridges, and increasing the flexural stiffness of the structural system can solve the above problem. The self-weight increase is the simplest way to stabilise the structure [1]; however, the dead load increases the thrust force acting on the ribbons. The pre-stress technologies require specialised anchorage systems and can cause a sudden bridge failure [11,12]. Juozapaitis et al. [13] revealed that the flexural-stiff suspension systems can efficiently reduce the kinematic displacements.
This paper introduces an innovative concept of the stress-ribbon structural system with flexural-stiff ribbons. The application of hot-rolled and welded steel profiles simplifies the construction process. Furthermore, this structural system ensures the formation of lightweight decks, reducing axial forces in the ribbons. The proposed concept can be extended to the pultruded FRP profiles. However, bending stresses in the ribbons increase with increasing the flexural stiffness. Combining different materials in a composite cross-section can solve this problem, but it requires developing the connection technologies and design procedures [14,15,16,17]. Thus, the optimisation of the bridge geometry and material properties becomes a crucial issue [18,19]. Besides, conventional techniques do not apply to the design of the anisotropic material components [20].
Numerical methods could be a powerful tool for solving a broad spectrum of engineering problems [21]. Romera et al. [4] and Xiao et al. [5] investigated dynamics problems of the suspension bridges. Radnić et al. [12] and Votsis et al. [22] carried out numerical simulations of stress-ribbon and suspension bridges to optimise the ribbons’ material parameters and geometry. However, a limited number of experimental works in the field do not determine the optimum flexural stiffness of the ribbons. The contributions by Bleicher et al. [23], Juozapaitis et al. [24], and Sandovic et al. [25] should be mentioned as rare examples of such experimental studies.
This study is a continuation of the researches [24,25]. It experimentally investigates the deformation behaviour of two pedestrian steel bridge prototypes: one has flexible bands typical of such structural systems and an alternative structure with the innovative flexural-stiff ribbons. Numerical models calibrated using the test results are used for the parametric analysis of the flexural stiffness effect on the deformation behaviour of the bridge system with steel and fibre-reinforced polymer (FRP) ribbons. A practical approach to the choice of the stiffness of the ribbon-profiles is also proposed.

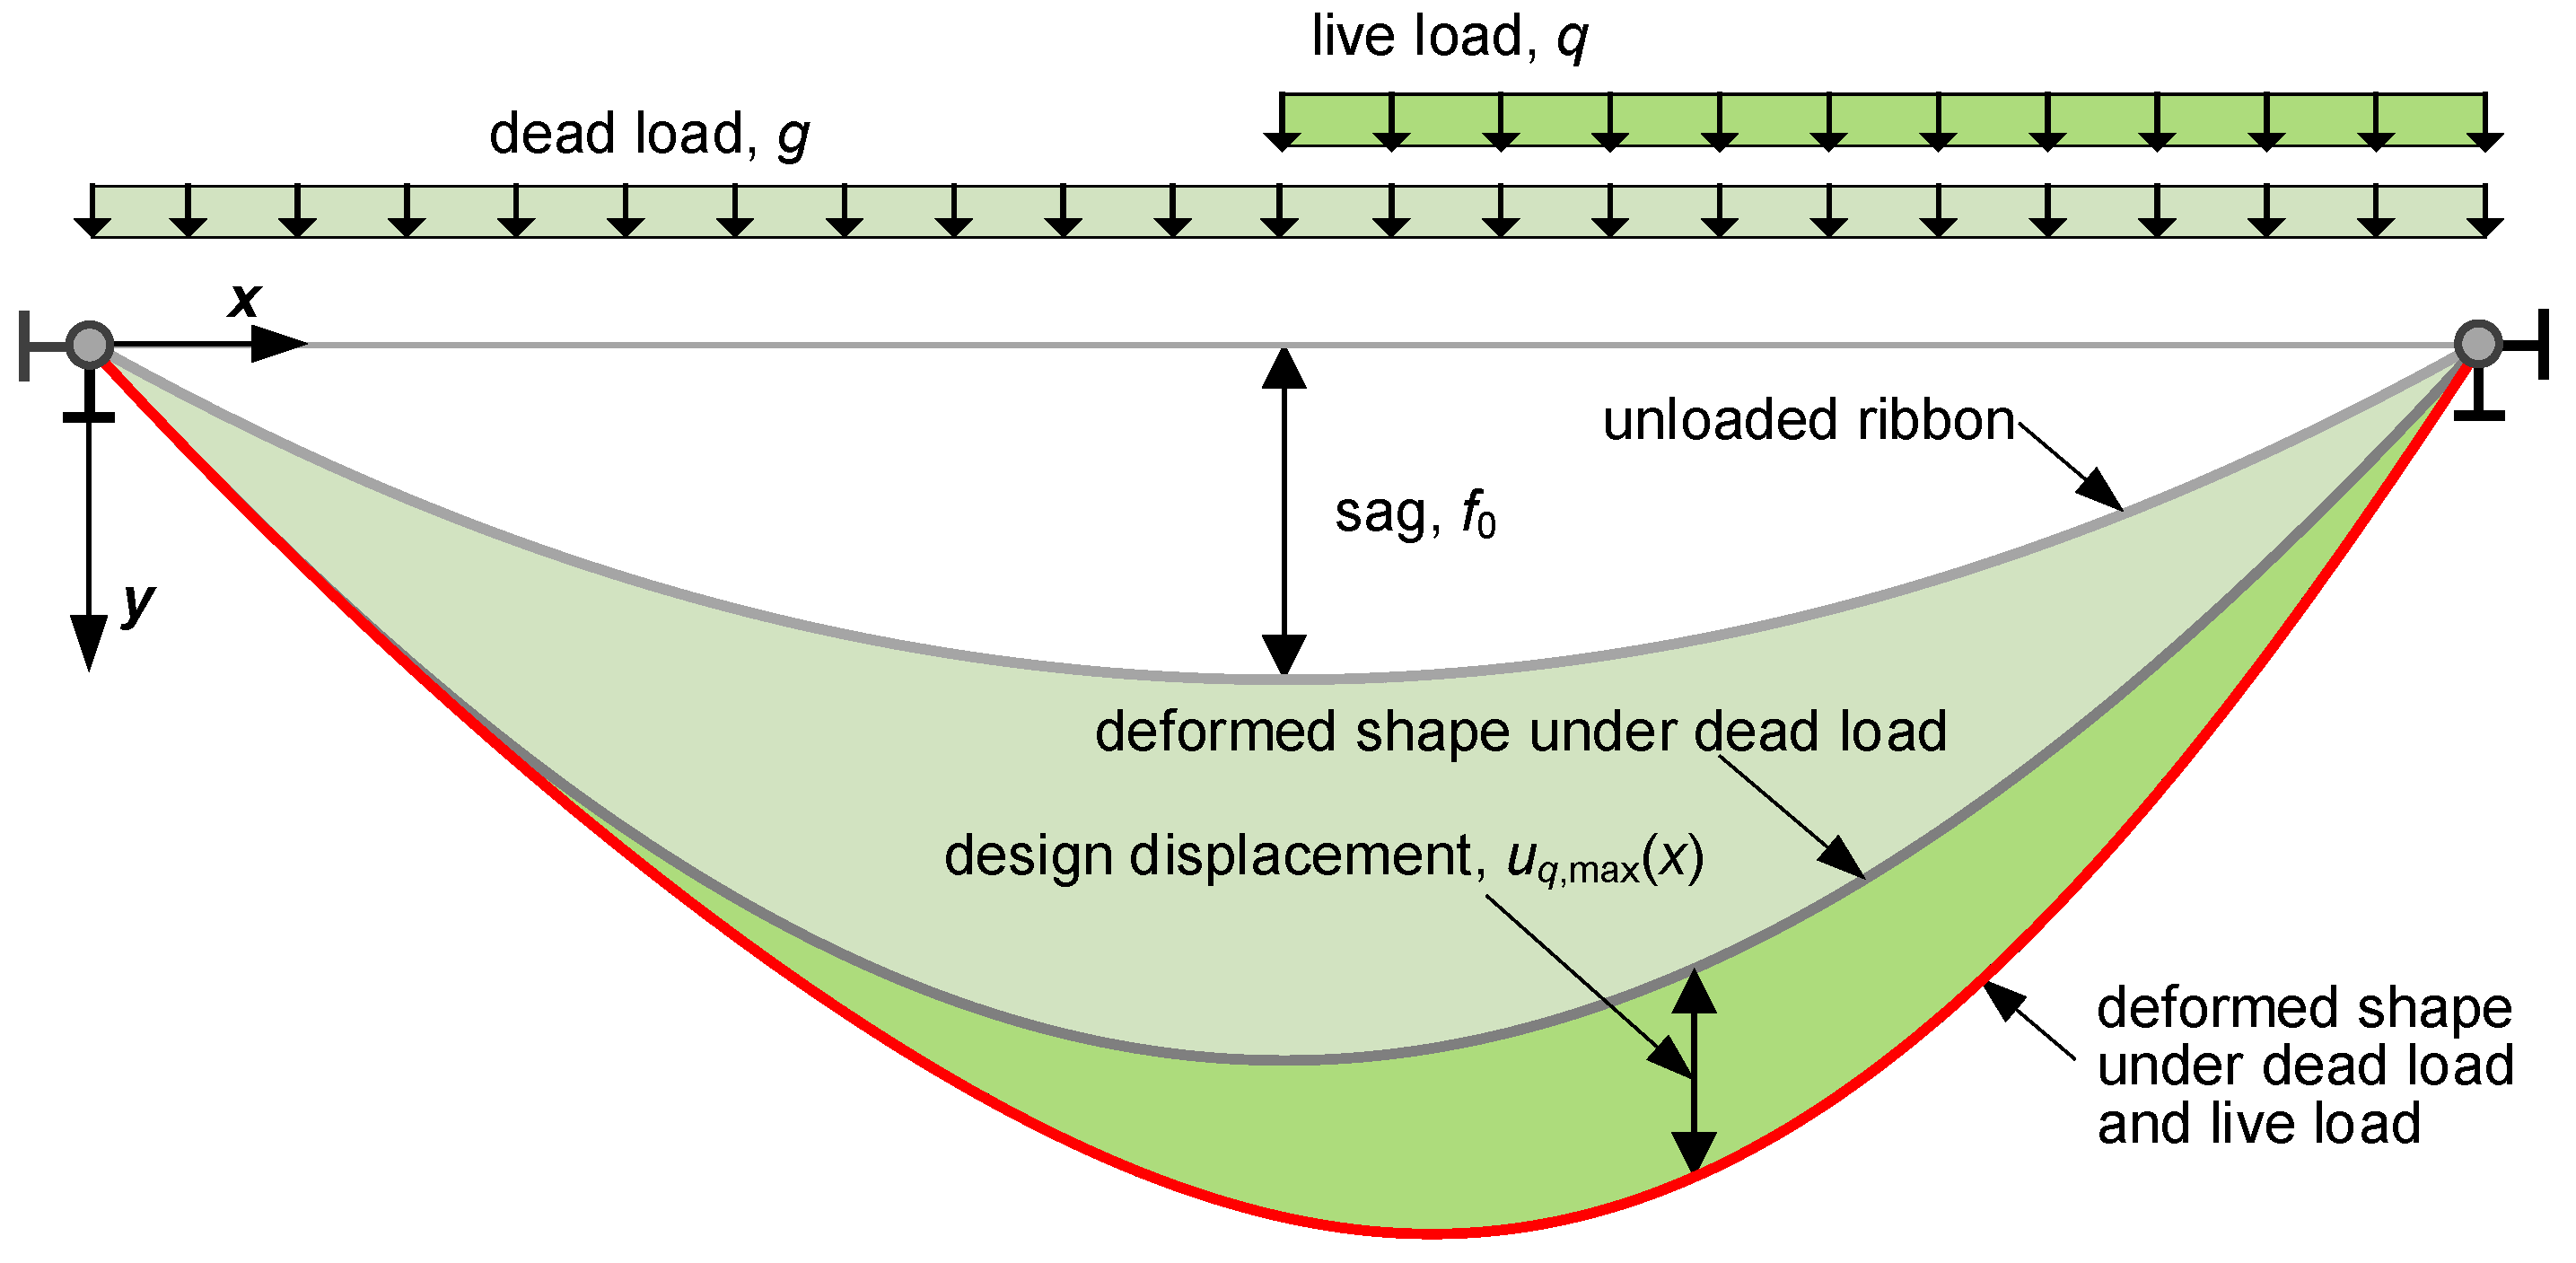
2. Design Procedure of the Bridge with Flexural-Stiff Ribbons

The ribbons are designed to resist substantial axial forces, transferring them to massive foundations. The stress-ribbon bridge shape also has no strict limitations; in some cases, the movement requirements of special vehicles can limit the maximal slope of the bridge deck. However, the stress-ribbon bridges can undergo significant displacements, particularly from concentrated and asymmetrically distributed loads. Thus, the limitations of vertical displacements become the governing design condition [1,7,19]. The displacement increment induced by the live load (q), regarding the dead-load deformed shape, is the design criterion.
Figure 1 shows the design scheme of the stress-ribbon bridge, having an initial sag of the ribbons f0. The dead load g increases the vertical displacement. A parabolic curve approximately describes this deformed shape that is the onset of design calculations. In other words, a live load (q) induces additional displacement uq(x) that is the limitation object—various load distribution layouts determine the maximum vertical displacement
u q , m a x ( x ) u q , l i m
where uq,lim is the displacement limit.
The stress-ribbon systems are sensitive to the load q distributed over the bridge half span that often induces the maximum kinematic displacement of the bridge. The loading ratio γ(= q/g) and the flexural stiffness of the ribbons control the kinematic displacement magnitude [1,13]. The following expression determines the functional relationship between the bridge parameters and the vertical displacement [13]:
u q ( x )   =   Φ ( γ ,   x / l , ( k l )     1 ,   Ω [ k l ,   k x ] ) u q , l i m
where l is the bridge span; the coefficient k   =   H / E I y defines slenderness of the ribbon (H is the thrust force, EIy is the flexural stiffness of the ribbon); the operand Ω [ k l ,   k x ] represents a combination of hyperbolic functions of the variables given in the brackets. A mathematical expression of Equation (2) depends on the structural parameters and boundary conditions of the ribbons. Juozapaitis and Norkus [26] formulated several examples of such equations for the steel ribbon, having three hinges.
The proposed approach to the choice of the efficient geometry of the ribbon cross-section, expressed in terms of the flexural stiffness, employs an iterative calculus accounting for ULS (ultimate limit state) and SLS (serviceability limit state) limitations. The following expression defines the required second moment of inertia of the ribbon subjected to an unsymmetrical load distributed over the bridge half span, using the beam analogy and satisfying condition (1):
I y 1 156 · q e q * · l q 4 u q , l i m · E
where uq,lim is the displacement limit; q e q * is the load uniformly distributed over the span length lq (in this case, lq = l/2), i.e., q e q *   =   q / 2 ; E is the elasticity modulus.
The ULS limits define the condition for determining the cross-section parameters:
H A · f d β
where H is the thrust force; A is the cross-section area; fd is the design strength of the material; the coefficient β is calculated, as follows:
β   =   1   +   e 2 · α c 2 · h c
where αc is the shape coefficient; hc is the cross-section height. The eccentricity e can be approximated, using the beam analogy, as follows:
e 48 · u q , l i m · E I y 5 · l q 2 · H
where EIy is the flexural stiffness of the ribbon.
The minimum required cross-section area can be obtained from condition (4), accounting for expressions (5) and (6), as follows:
A H f d ( 1   +   24 · u q , l i m · E 5 · α c 2 · h c · k 2 · l q )
where k is the slenderness coefficient from Equation (2). The following equation determines the required cross-section height:
h c   =   { ( 12 · u q , l i m 5 · l q 2 · k 2 · α c 2 ) 2   +   f d k 2 · E · α c 2 } 1 / 2     12 · u q , l i m 5 · l q 2 · k 2 · α c 2
Remarkably, the compressive stresses in ribbons increase with increasing the flexural stiffness (EIy) because of the bending effect. That can cause stability problems of the flexural-stiff ribbons. Besides, the magnitude of compressive stresses must be limited in structural elements made from FRP [15,20,27]. For simplicity, this study assumes the following stress limitation in the ribbons:
σ 0
The above condition limits the height of the cross-section, accounting for expressions (4) and (5), as follows:
h c M 2 · H · α c 2
where M is the bending moment in the ribbon.
Equations (5), (7), and (8) include the shape coefficient that is calculated, as follows:
α c   =   ( I y / A h c 2 ) 1 / 2
The recurrent relationship between Equations (7), (8), and (11) forms the iteration process. At the first iteration, an approximate value of the coefficient αc is assumed. For this purpose, Equation (11) was applied to the profiles listed in the European Norm for Structural Sections in Steel (EN 10365). Table 1 summarises the estimated values of the coefficient αc for the first iteration. The iterative process is repeated, beginning Equations (8) and (7) and using the coefficient αc calculated by the Equation (11) at the previous iteration, as long as the difference between the assumed (beginning the iteration) and newly obtained αc value remains significant.

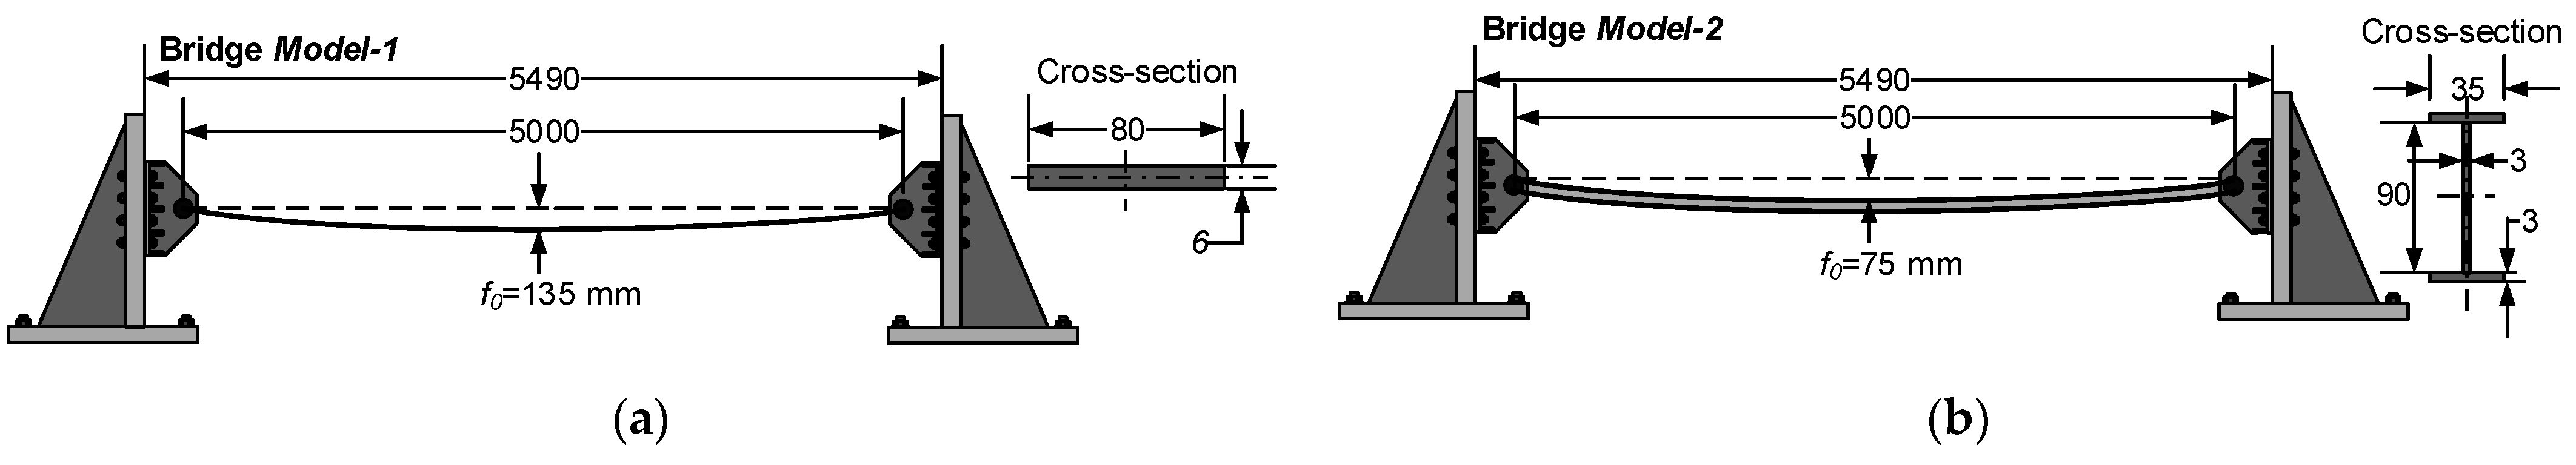
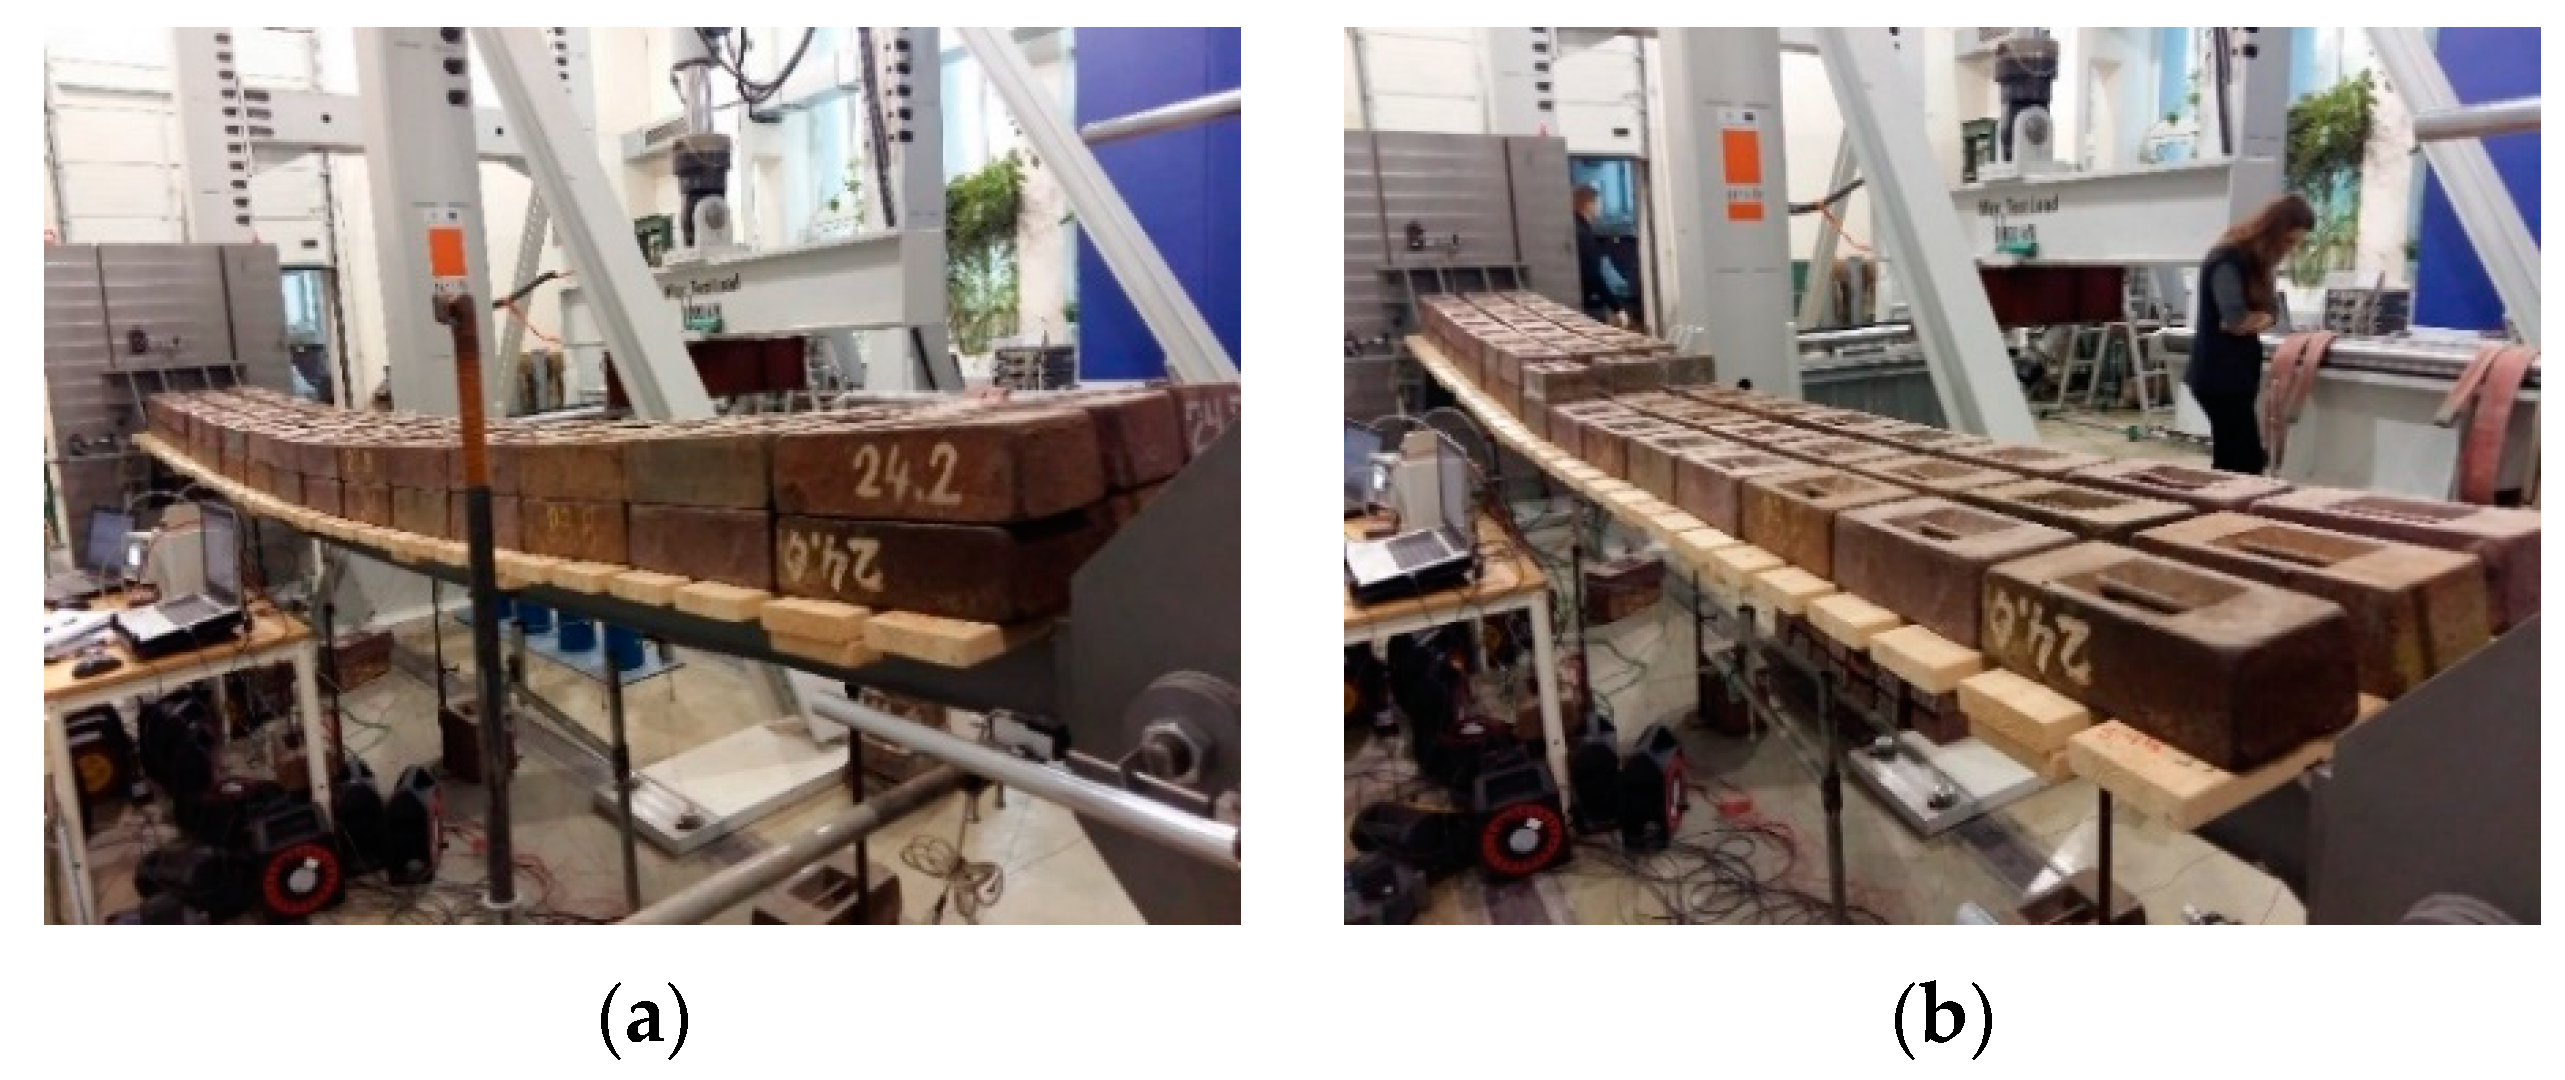
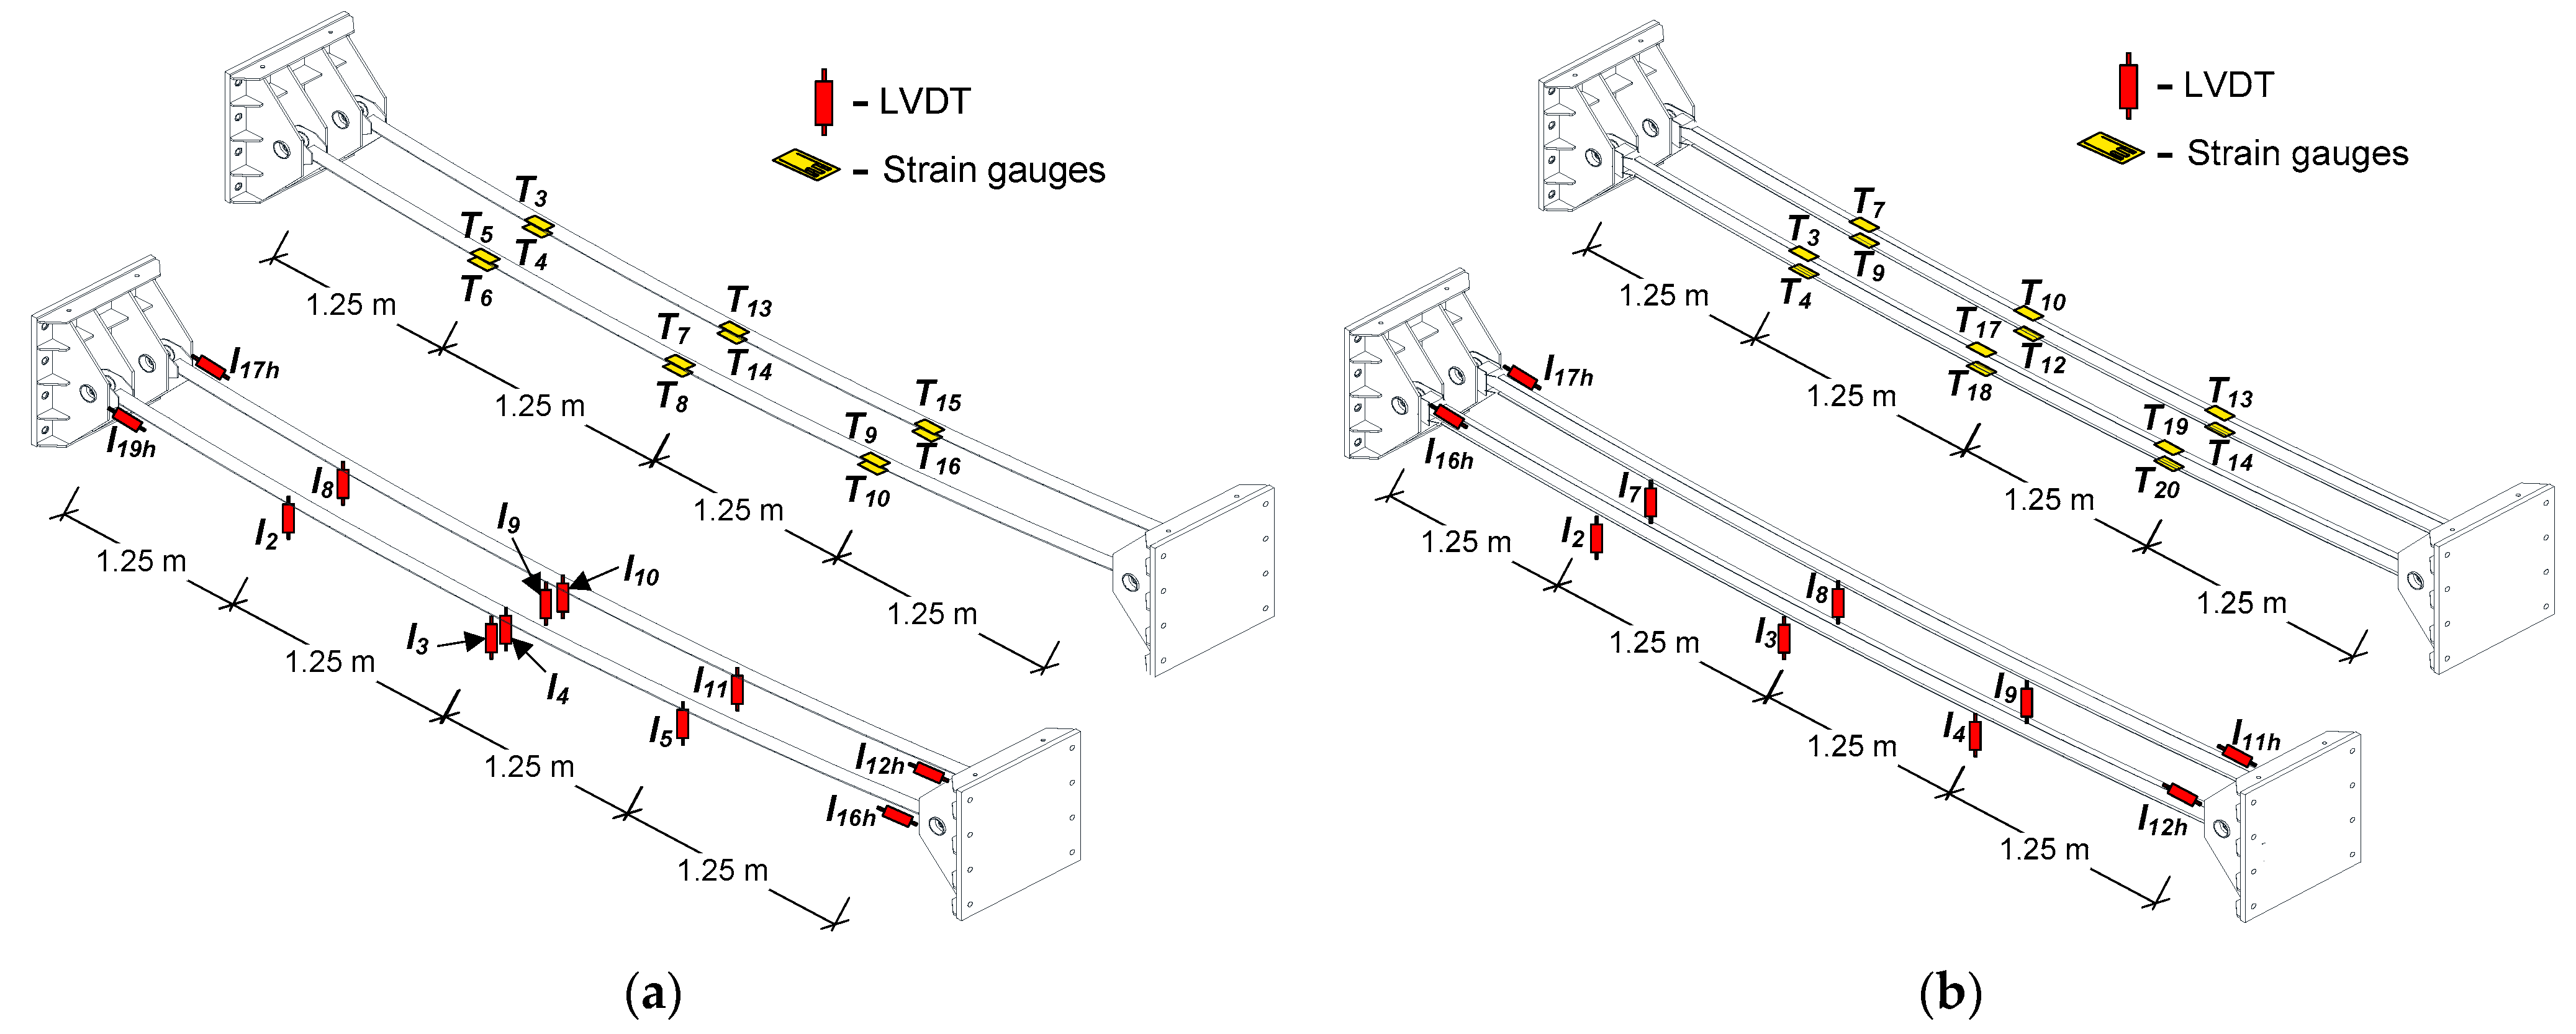
3. Experimental Program

Two pedestrian steel bridge prototypes of a 5 m span were built up and tested in the Laboratory of Building Structures and Geotechnics at Vilnius Gediminas Technical University (Vilnius Tech). The prototype ribbons had a pinned connection to rigid supports fixed to the strong floor. The axial stiffness of the steel ribbons was the same in both prototypes (EA = 96 MN, where A is the cross-section area; E ≈ 208 GPa is the elasticity modulus), but the flexural stiffness was significantly different. In the first model, the ribbons were designed as flexible bands with a small second moment of inertia (Iy = 0.14 cm4) and the initial sag f0 = 135 mm. The innovative ribbon-profiles of the second model were designed by using the methodology described in Section 2 without limitation of the stress in the ribbons, i.e., disregarding conditions (9) and (10), obtaining the inertia moment Iy = 63.7 cm4 and initial sag f0 = 75 mm. In this manuscript, the notations Model-1 and Model-2 define the prototypes with flexible bands and flexural-stiff ribbon-profiles. Figure 2 shows the corresponding bridge schemes.

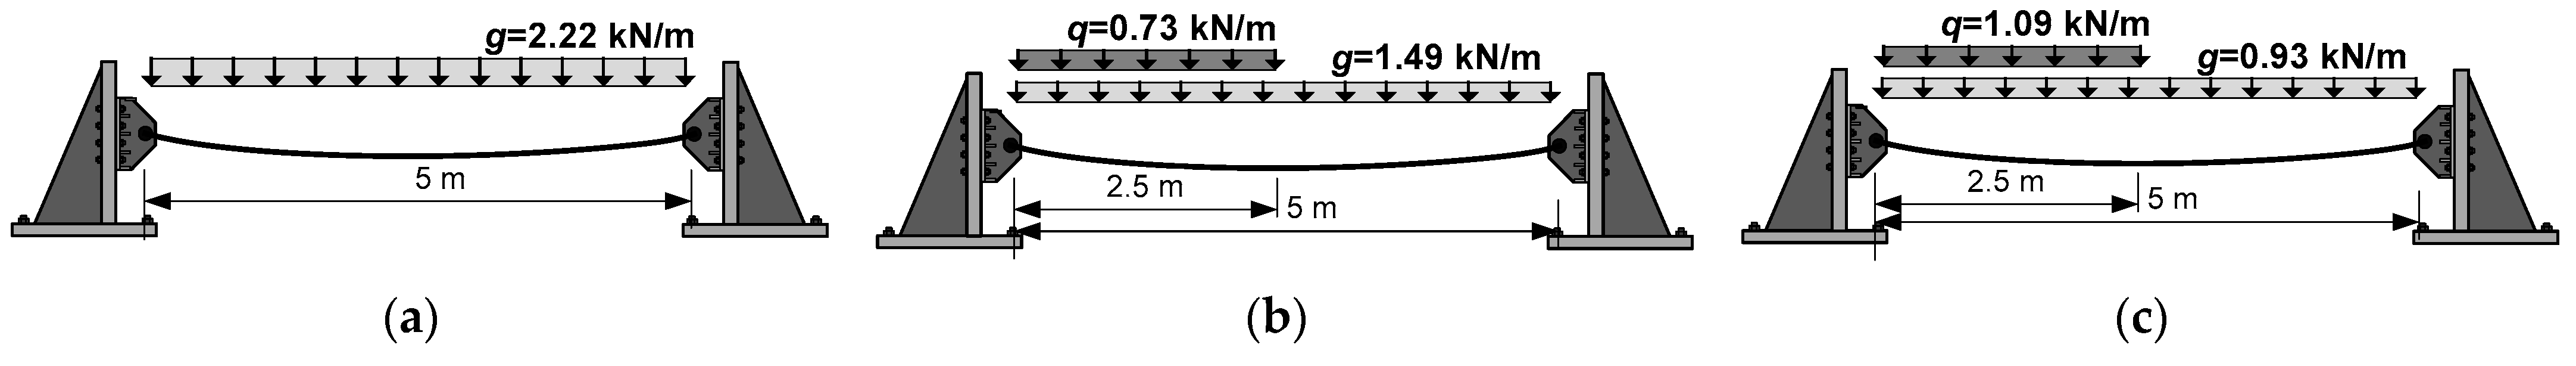
3.1. Loading Procedure
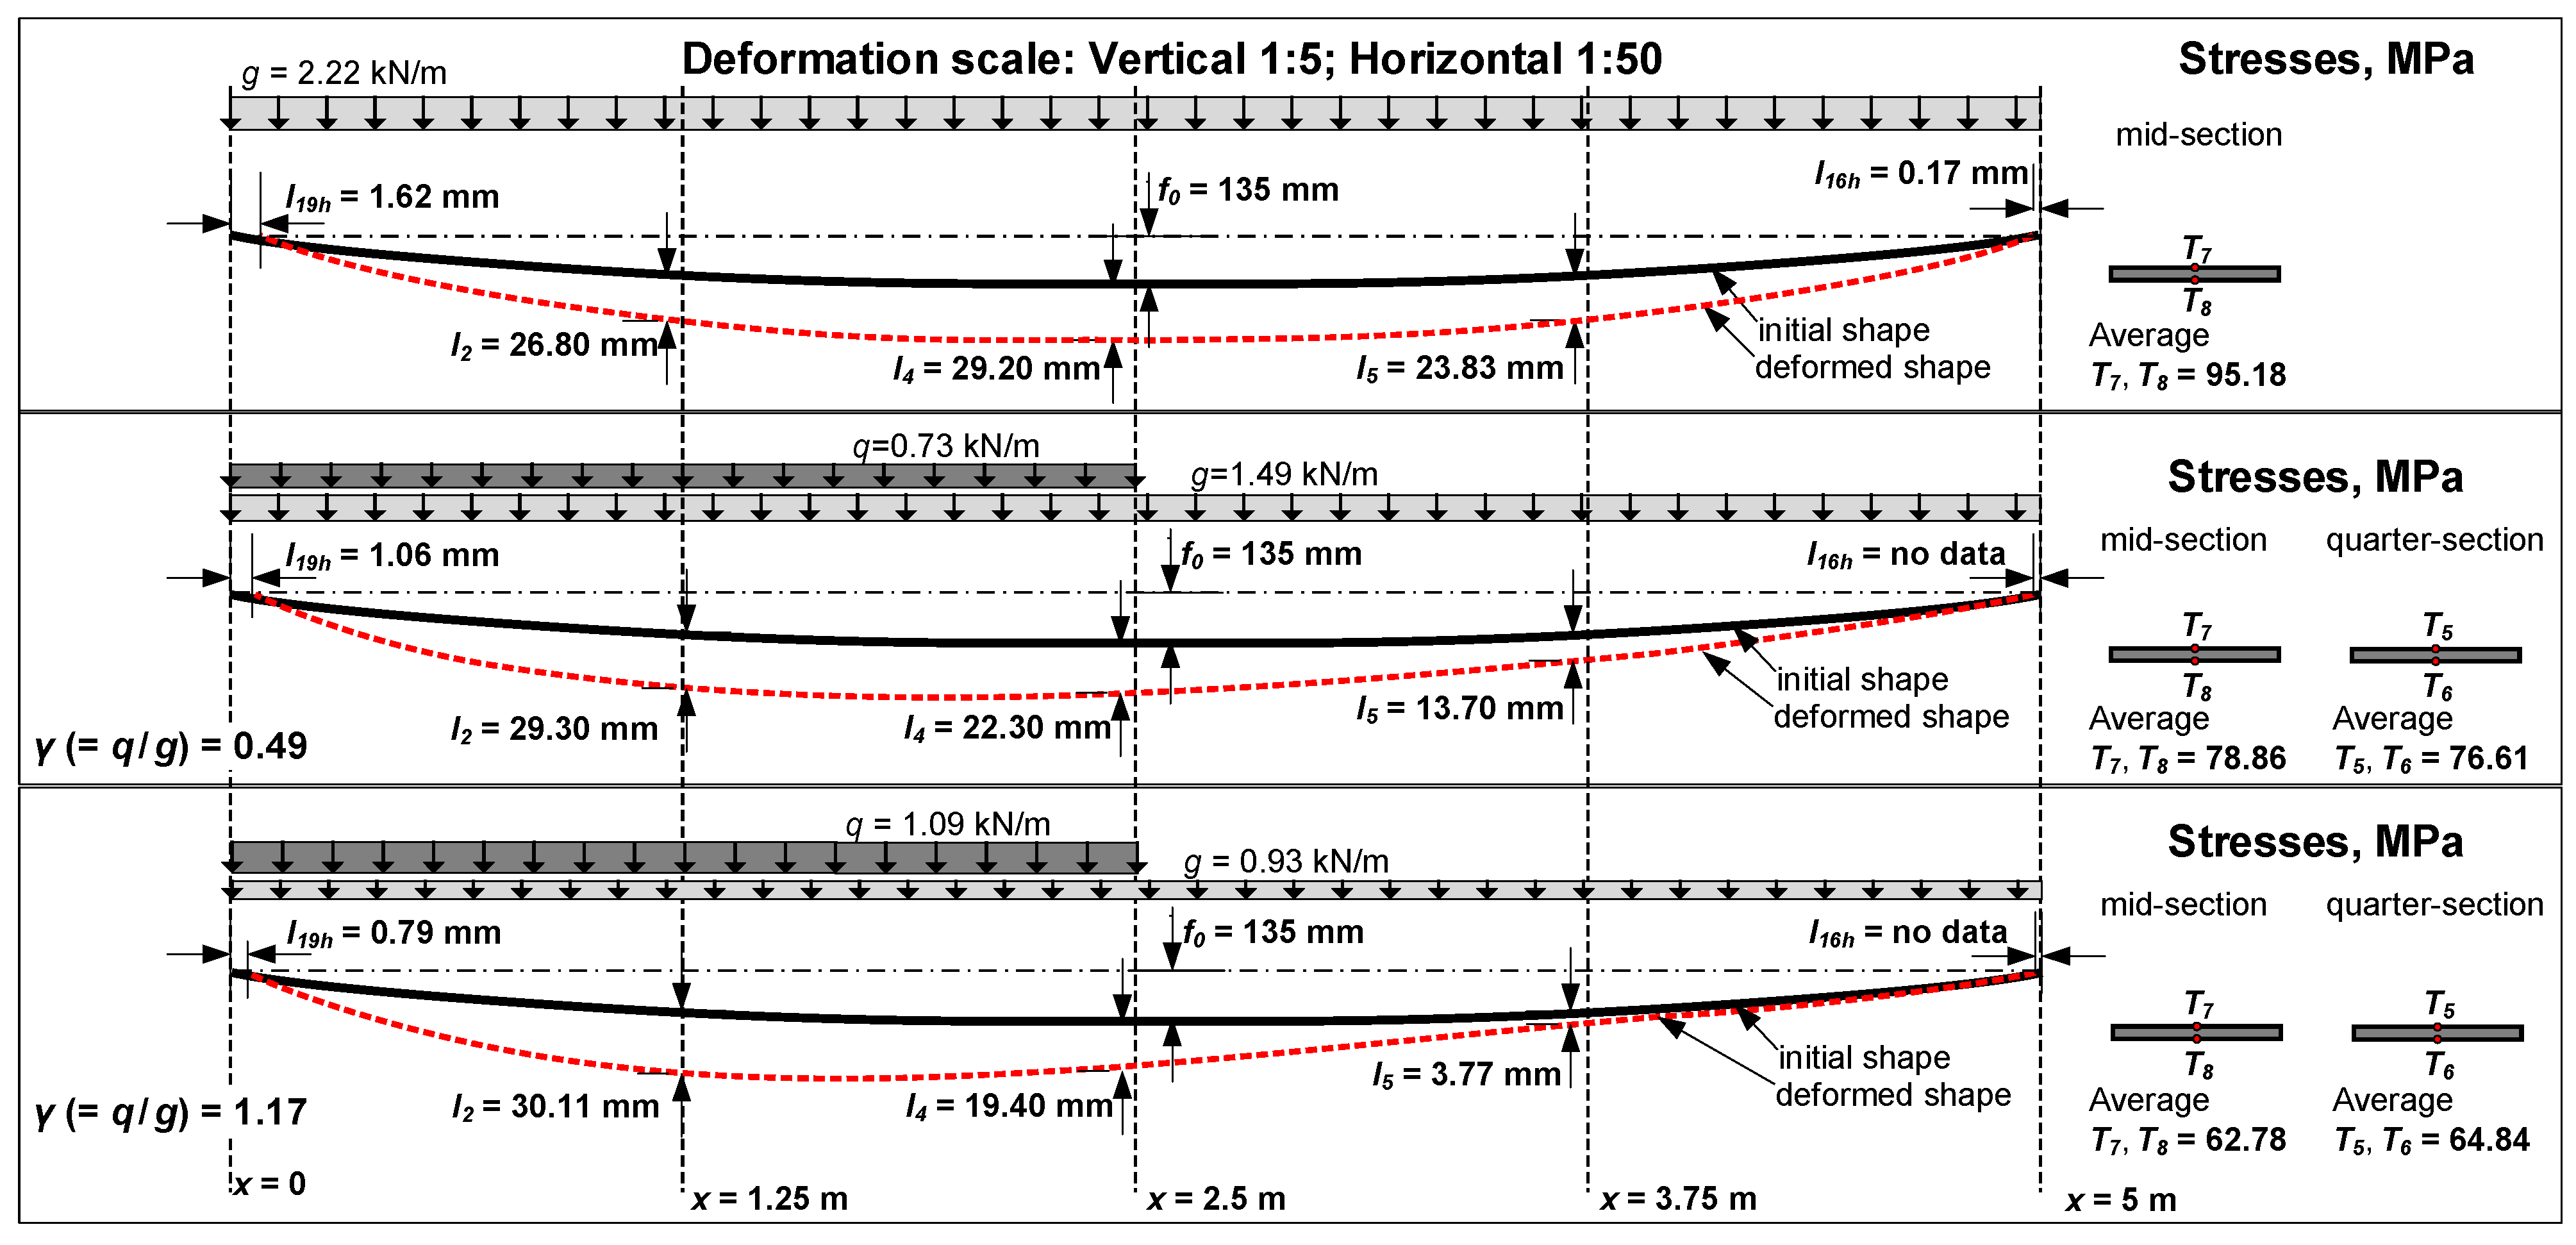
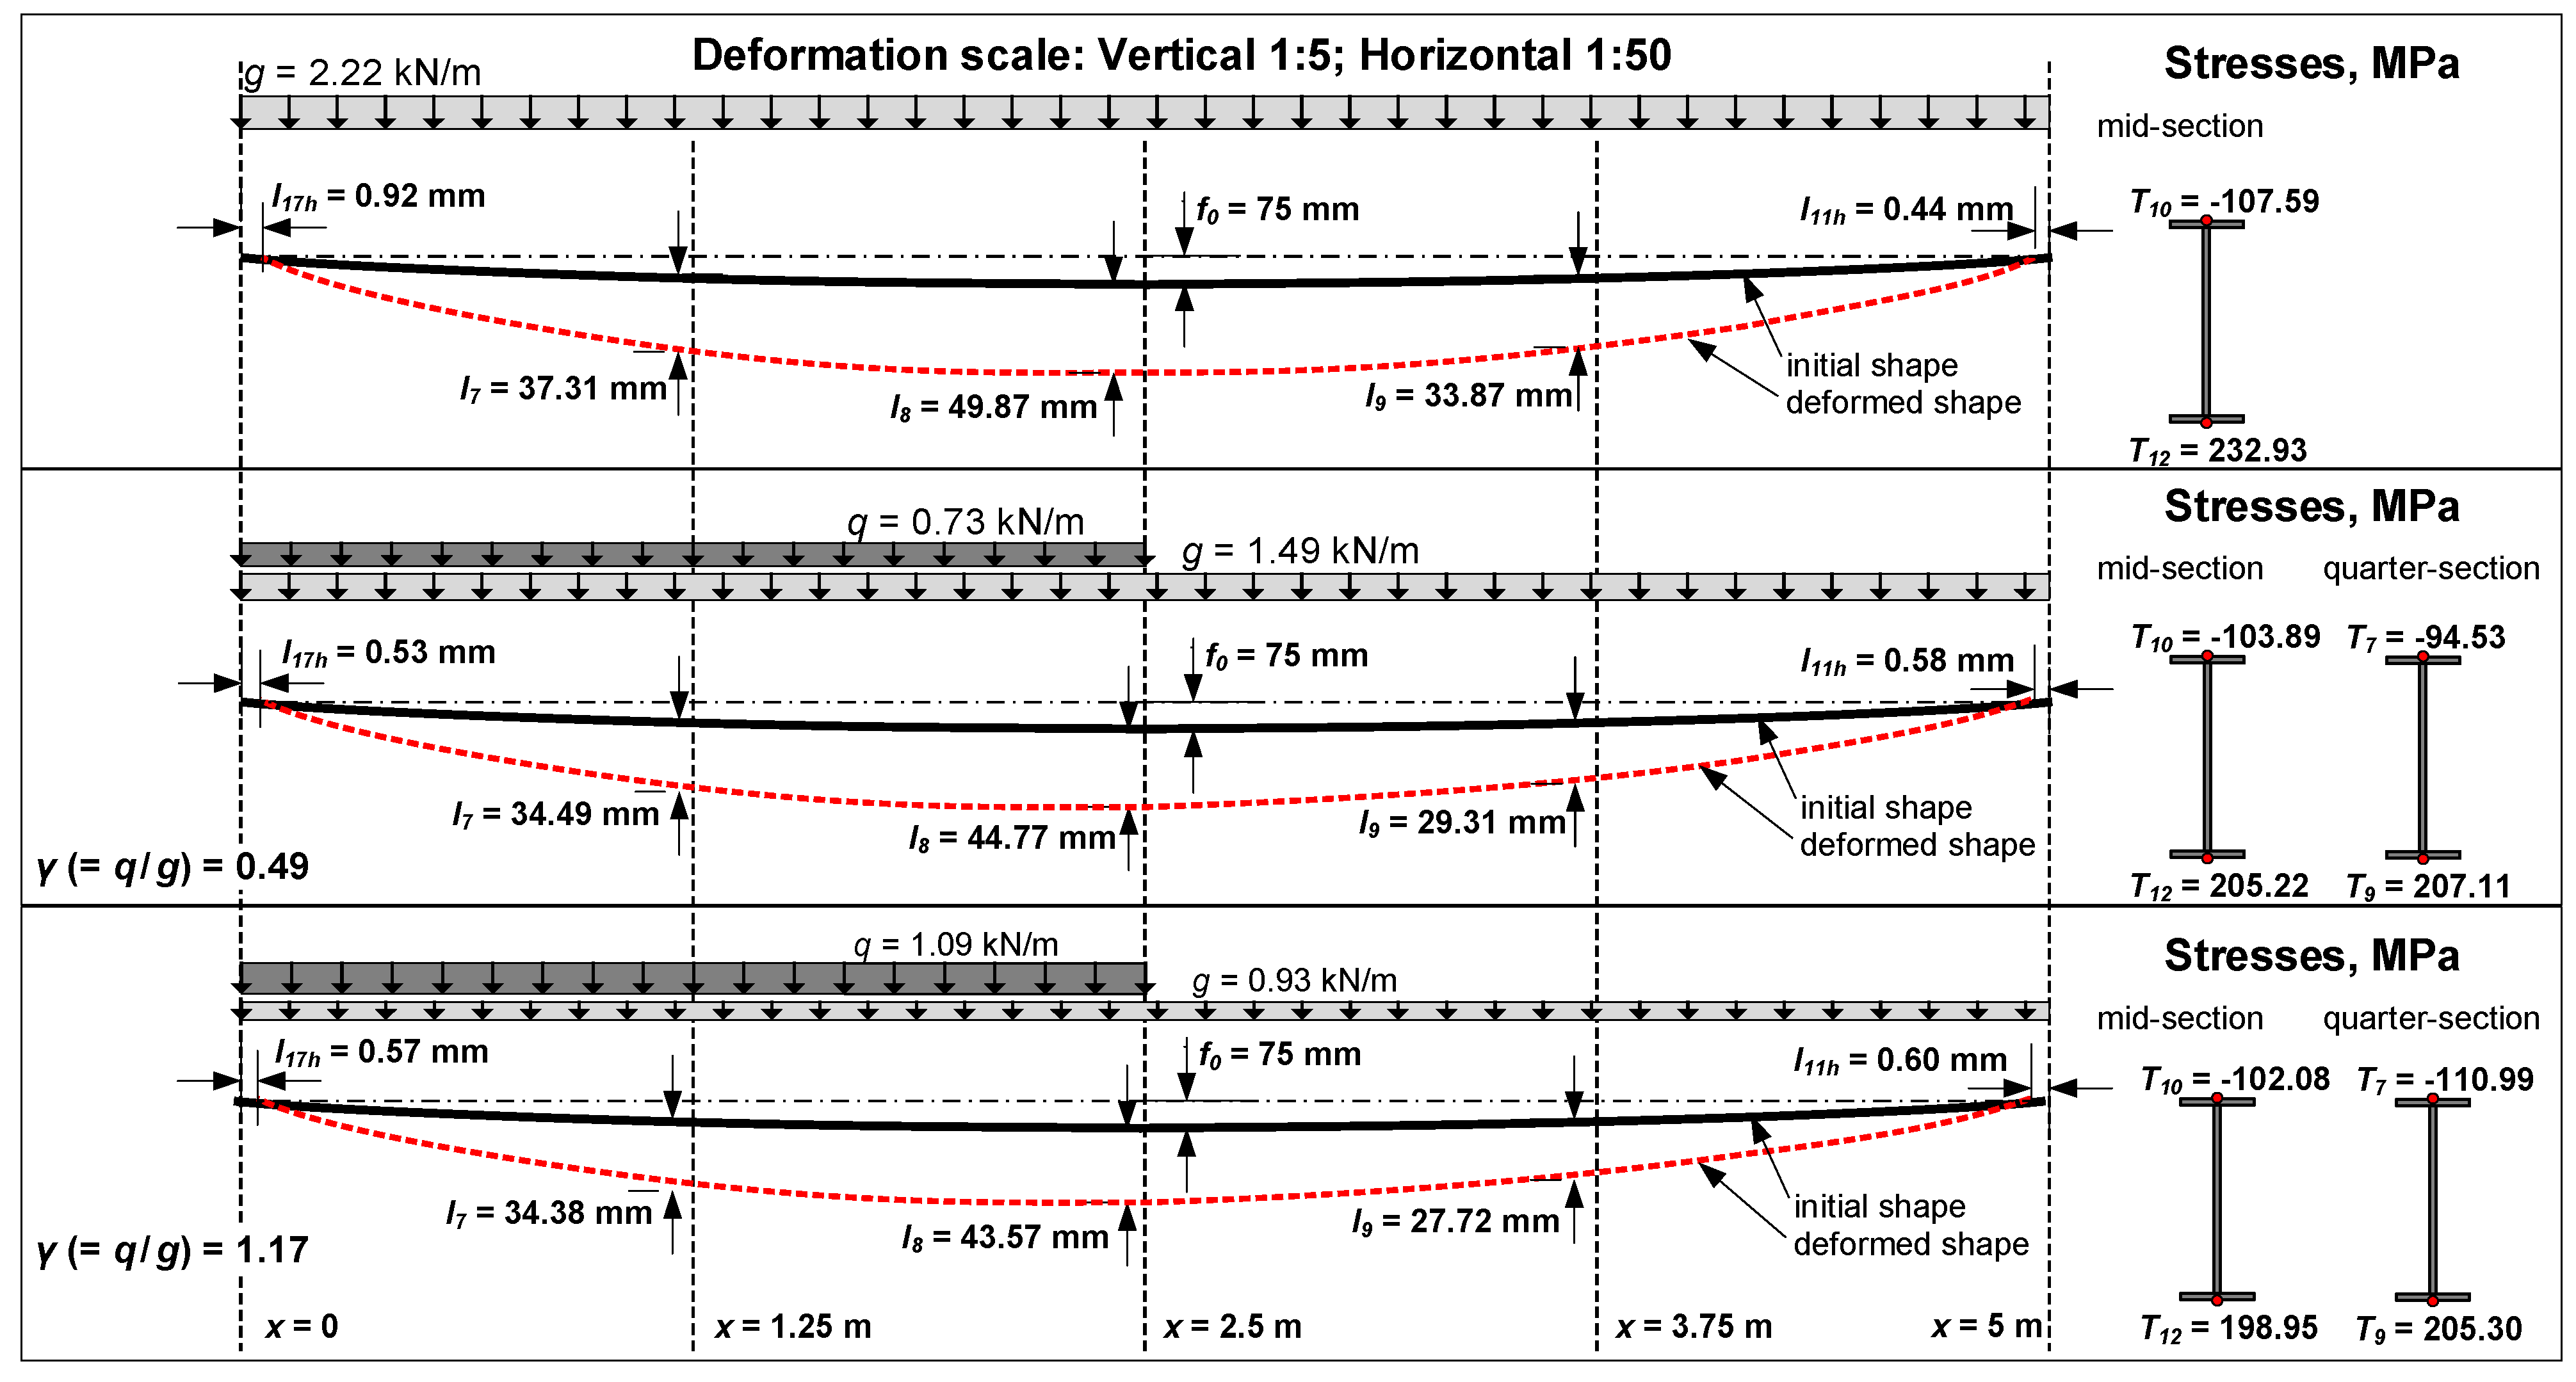
Three loading layouts are considered: one symmetrical and two asymmetrical (with different ratio between the live load, q, and the dead load, g)—Model-1 and Model-2 were subjected to the same loading schemes. The prototypes were loaded incrementally using iron weights. Figure 3 and Figure 4 show the loading schemes and typical arrangements of the weights corresponding to symmetrical and asymmetrical loading scenarios. The load held constant for two minutes after each loading step to stabilise the vertical displacement of the bridge systems. The increments of the symmetrical load are the following. A timber bridge deck was constructed over the steel ribbons inducing the 0.077 kN/m load at the first step. At the further increments, the iron weights (≈24 kg each) were distributed uniformly over the timber deck resulting in approximately 0.31 kN/m load. The final (seventh) increment induced a 2.22 kN/m load.
The asymmetrical loads were applied with the ratio q/g equal to 0.49 and 1.17. In all scenarios, the dead load, g, was distributed over the bridge span in the same manner as in the symmetrical loading case (Figure 3). For the ratio q/g = 0.49, the first five loading increments induced the dead load g = 1.49 kN/m. The additional live load (q) applied in two steps has induced 0.73 kN/m distributed over the bridge half span. Analogously, the ratio q/g = 1.17 generated in three loading steps to achieve the target load g and three successive increments to reach the necessary magnitude of the load q. The corresponding load components are the following: g = 0.93 kN/m and q = 1.09 kN/m.
Deformations of the stress-ribbons were measured using the 20 mm strain gauges. Vertical displacements of the ribbons and horizontal movements of the supports were monitored using linear variable displacement transducers (LVDT) with a 0.01 mm accuracy. Figure 5 shows the monitoring scheme. In Model-1 (Figure 5a), vertical displacements were recorded at the mid-span (LVDT I3, I4, I9, and I10) and quarters of the span (LVDT I2, I8, I5, and I11), whereas the LVDT I12h, I16h, I17h, and I19h monitored the horizontal movements of the supports. Deformations of the top and bottom surfaces of the steel bands were estimated at the location of the LVDT devices using the strain gauges T7, T8, T13, and T14 (located at the mid-span) and two sets of the indicators (T3, T4, T5, T6 and T9, T10, T15, T16) placed at quarters of the span. Model-2 had a similar monitoring devices’ distribution scheme (Figure 5b): the LVDT I3 and I8 were put at the mid-span; two sets of LVDT (I2, I7 and I4, I9) were located at the span quarters. Four LVDT (I11h, I12h; I16h, and I17h) monitored the supports’ horizontal movements. Deformations of the top and bottom surfaces of the ribbons were measured at the mid-span (using the gauges T17, T18, T10, and T12) and the span quarters (strain gauges T3, T4, T7, T9 and T19, T20, T13, T14).

3.2. Test Results

Figure 6 and Figure 7 show the loading results of Model-1 and Model-2, respectively. The schemes include vertical and horizontal displacements of the ribbons and the estimated stresses at the ribbons’ surface. These results are not suitable to compare the deformation behaviour of the prototypes because of the difference in the initial ribbon sag (f0) of these bridges. The physical tests aimed to gather experimental data for verifying numerical models described in the next section of this manuscript.
However, the deformation analysis of the bridge systems reveals a beneficial feature of the model with flexural-stiff ribbon-profiles. The deformation response of the prototype with flexible bands (Figure 6) is vulnerable for asymmetrical load distribution: the maximum vertical displacement (31.1 mm) situated in the loaded quarter; a camber tends to form in the unloaded part. Model-2 (Figure 7) does not demonstrate this unfavourable tendency. The octuple difference exists between the vertical displacements measured in Model-1 span quarters under asymmetrical loading with γ = 1.17. On the contrary, this loading case induces only a 1.2 times difference between the displacements of Model-2 span quarters.
The maximum stresses observed in the ribbons of Model-2 exceeded the values estimated in Model-1 (Figure 6 and Figure 7) due to the bending effect. The strain-gauge readings define the stresses under the assumption of the steel ribbons’ elastic deformation behaviour (the experimentally determined elasticity modulus of the steel Es = 208 GPa).

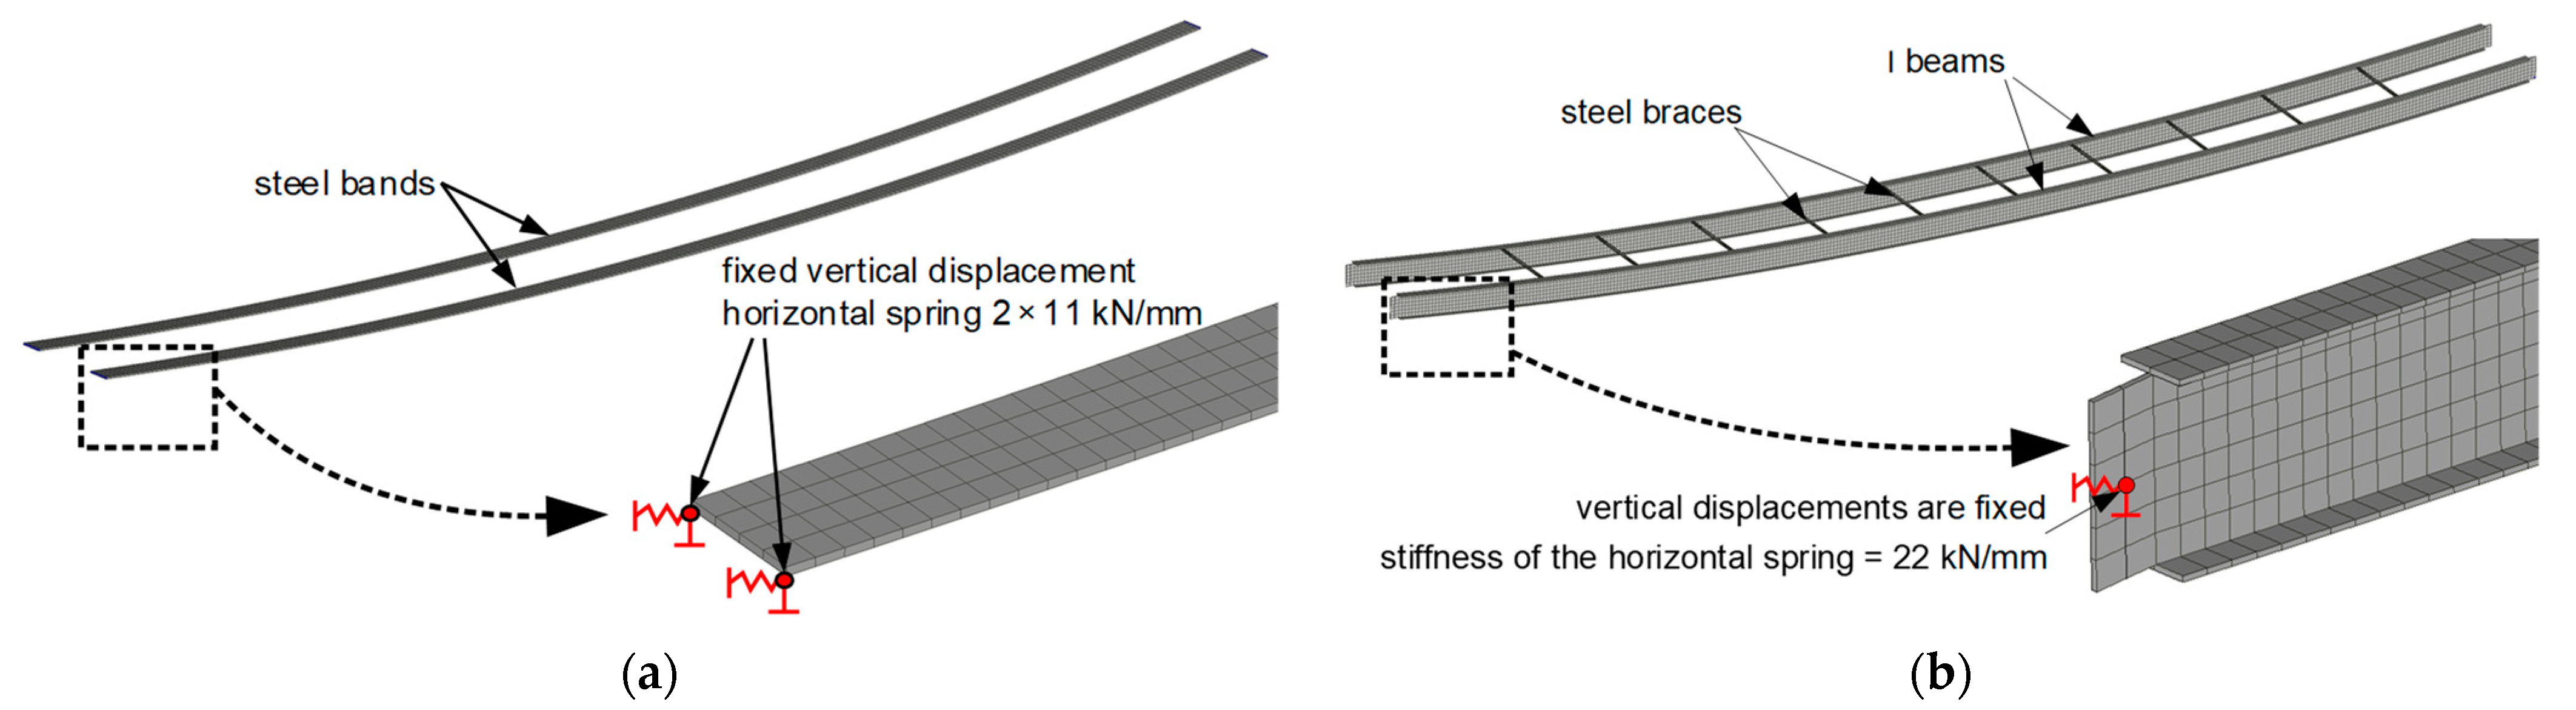
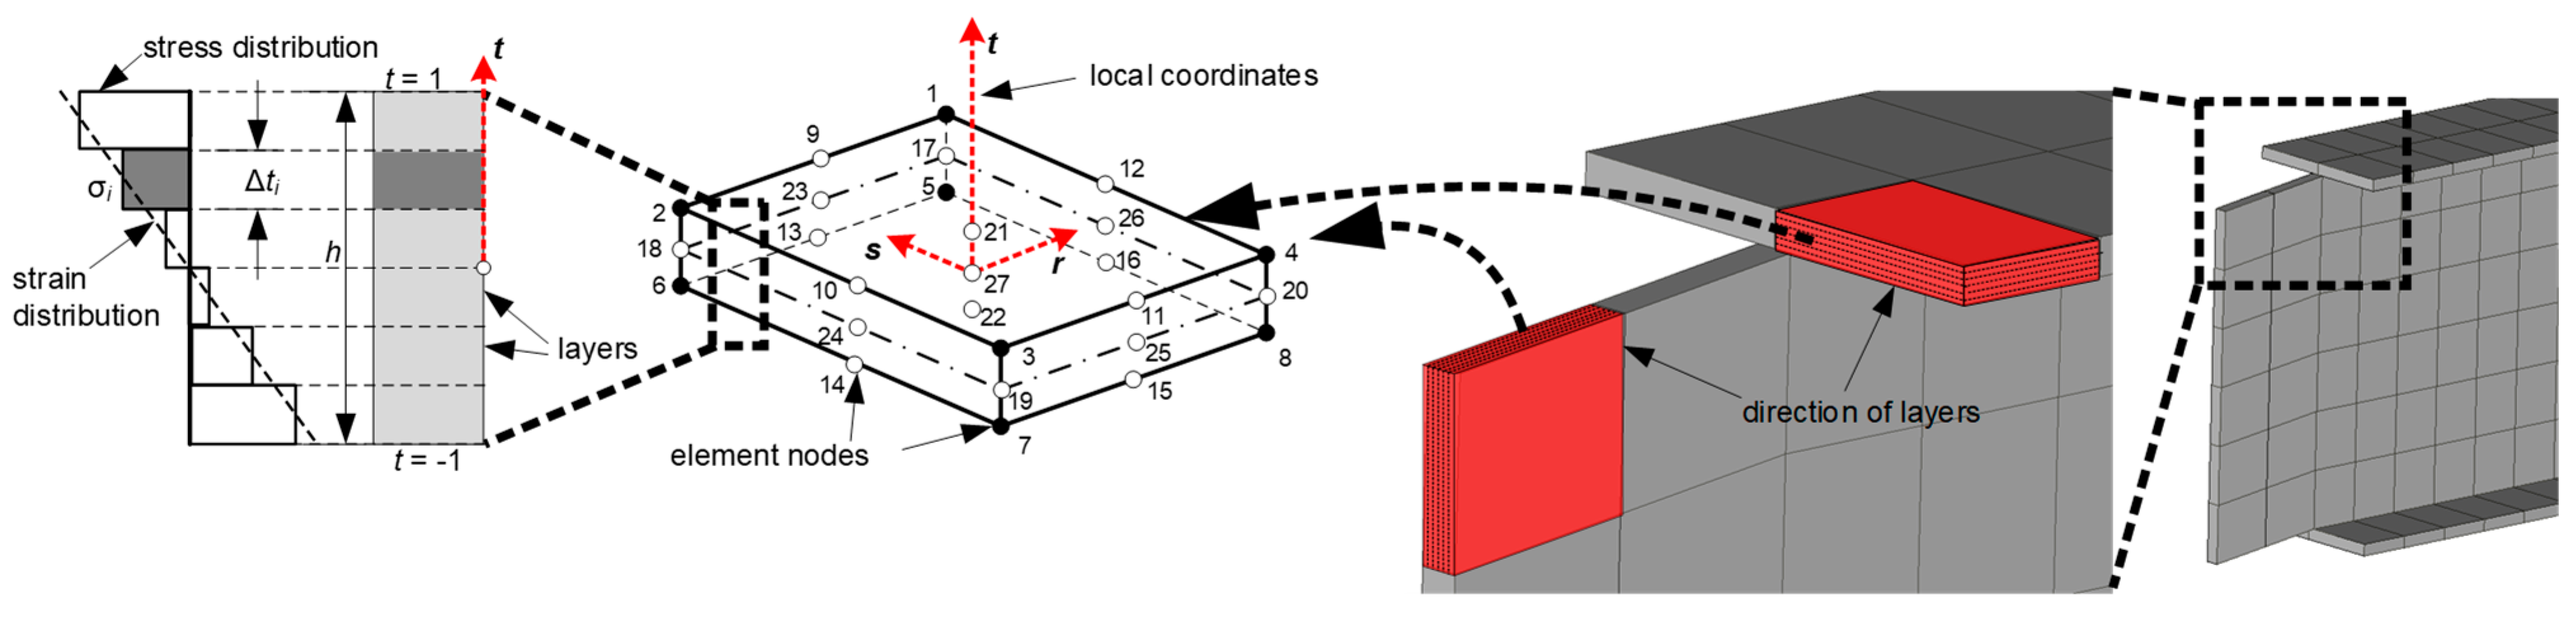
4. Numerical Modelling

Numerical models were developed to analyse the flexural stiffness effect of the ribbons on the deformation behaviour of the suspension bridges. The analysis employs a finite element (FE) software Atena. The deformation problem is solved in the 3D formulation using the Newton–Raphson iteration procedure [28].
The loading conditions include the dead load (g) distributed over the bridge span (l) and the live load (q) positioned either over the entire or half of the span. At the first stage, the permanent action is simulated. After that, the model is subjected to the live load. Both load components are applied incrementally (in five steps). Two analyses are carried out, investigating the deformation behaviour of the ribbons.
At the first analysis stage, the numerical models’ adequacy is verified using the test results presented in Section 3. Two FE models are considered. One model corresponds to the bridge with flexible bands (Model-1); another represents the bridge with flexural-stiff ribbon-profiles (Model-2). As shown in Figure 6 and Figure 7, a horizontal movement is characteristic of the supports. Springs are introduced in the numerical models to represent the support movements.
An inverse analysis was used to determine the spring stiffness corresponding to the measured horizontal displacements of the supports and the estimated thrust forces. The readings of the strain gauges Ti (Figure 5) determined the thrust forces under the assumption of elastic behaviour of the steel ribbons (Es = 208 GPa). The horizontal spring stiffness was selected to predict the support movement similar to the observed during the symmetrical loading test (g = 2.22 kN/m). The resultant stiffness is equal to 22 kN/mm. Both models assume the same stiffness of the springs.
At the second simulation stage, a parametric analysis is performed to identify the efficient combination of the ribbons’ cross-section parameters. A balance between stresses in flexural-stiff ribbon-profiles and vertical displacement gradient was the optimisation criterion—three numerical models with different flexural stiffness of the stress-ribbons are built up.

4.1. The Numerical Models’ Verification

Two FE models of the bridge prototypes described in Section 3 are built up; the FE models and the prototypes have the same notation. Figure 8 shows the FE models and boundary conditions. Non-linear isoparametric shell-brick elements with nine integration points in the shell plane are used. The 3D brick elements have 20 nodes and a layered structure [29]; six internal layers are distributed in the FE shell plane. Figure 9 shows the layered FE structure. The linear-elastic isotropic material model of the steel is used for the FE analysis, assuming the elasticity modulus E = 208 GPa (experimental value) and Poisson’s ratio ν = 0.30.
A uniaxial deformation state is characteristic of Model-1. Therefore, the 20 × 20 mm FE mesh size is applied. The total number of finite elements in the model is 2000. However, the reference [29] recommends at least four finite elements in the bending plane to simulate the bending effects. Thus, the 18 × 18 mm FE mesh size is used for Model-2. Six elements compose the vertical wall of the section (Figure 9). The same element size is used in the flanges. Steel braces connect the flexural-stiff ribbons, preventing out-of-plane displacements of the structure. The same system was used in the corresponding bridge prototype (Section 3). The total number of finite elements in Model-2 is 14,702.
Table 2 compares the numerical predictions and test results. The readings of the strain gauges Ti (Figure 5) determine the thrust forces under the assumption of elastic behaviour of the steel ribbons (Es = 208 GPa). A high confidence level of the deformation predictions is evident: the prediction error does not exceed 7%. The disagreement can result from a relatively coarse FE model discretisation and the geometry inaccuracies of the physical prototypes. The actual difference between the initial sag (f0) of two ribbons of Model-2 was equal to 8.7 mm, whereas the FE model assumes the average sag value. The acceptable adequacy of the numerical predictions enables applying the FE methodology to analyse the ribbon geometry effect on resisting the kinematic displacements.
Figure 10 shows the modelling example of the idealised bridge prototypes. The idealisation assumes the identical initial sag (f0 = 135 mm) and loading conditions (g = 2 kN/m + q = 2 kN/m) for both Model-1 and Model-2. The horizontal movements of the supports are neglected to eliminate the boundary condition influence. The experimental values (Section 3) determine the remaining parameters of the numerical models. The modelling results (Figure 10) reveal two aspects.
On the one hand, the total areas (S) under the live load-induced displacement curve, determining the system’s deformation energy, are almost identical for both prototype models. That is a consequence of the loading conditions similarity. On the other hand, Figure 10 demonstrates nearly double increases in the design displacement (uq,max) of the bridge with flexible ribbons (Model-1) regarding Model-2. The kinematic displacements also induced the substantial camber of the unloaded part of Model-1.
In real projects, the camber effect requires particular attention as it can cause cracking of the concrete deck and damage the joints between the deck segments. The literature review (Section 1) has suggested increasing the magnitude of the dead load (g) as a possible solution to this problem. The proposed alternative way offers the application of flexural-stiff ribbons for reducing the kinematic displacements. The next section analyses the efficiency of these two alternatives.

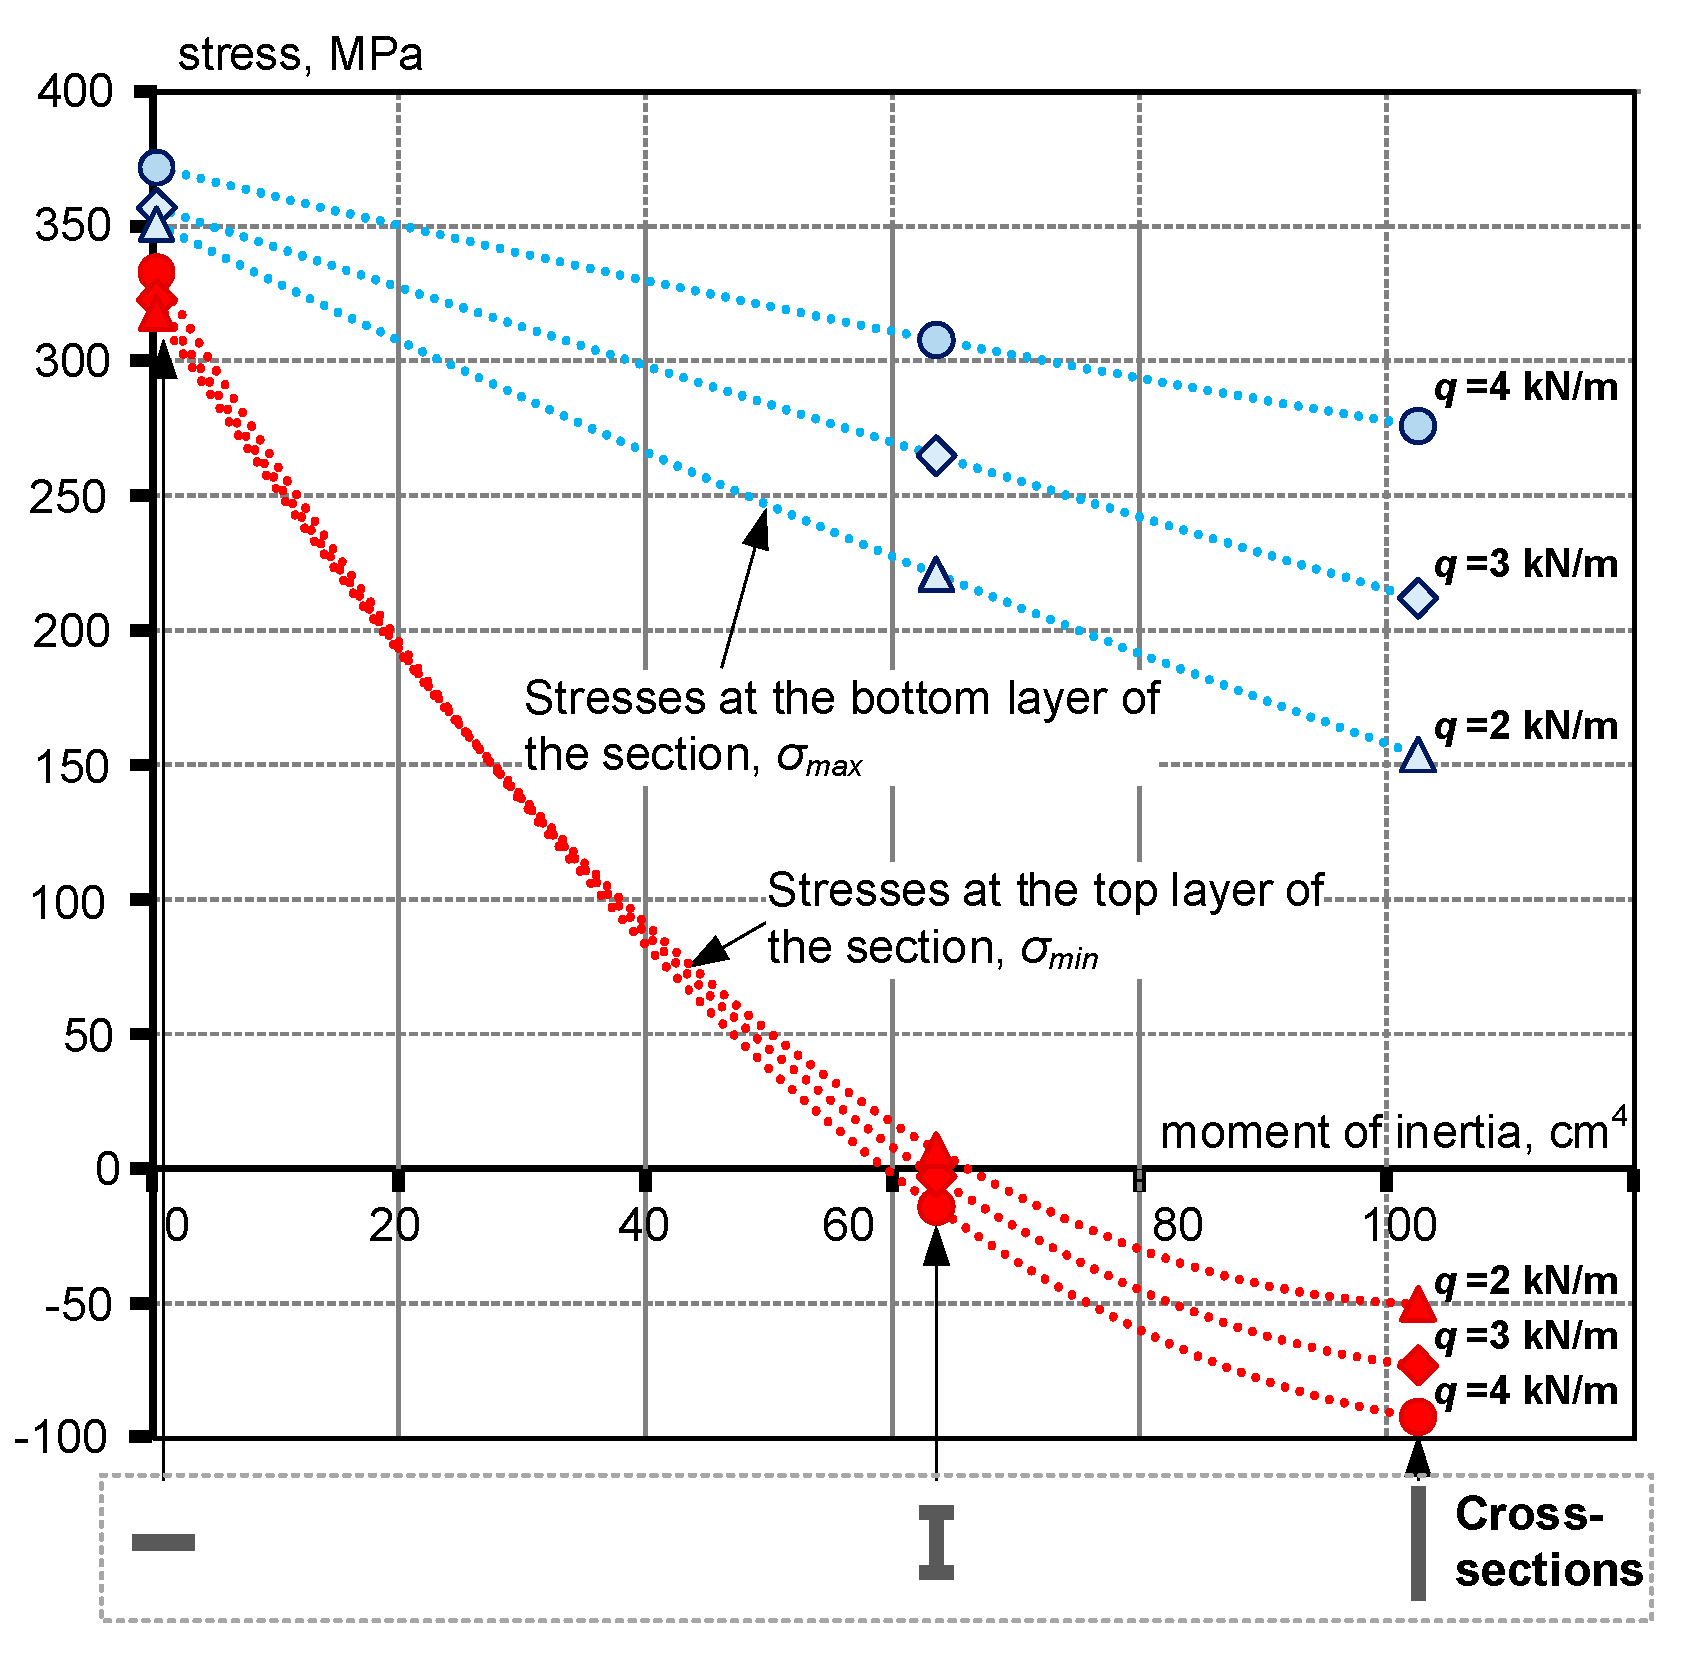
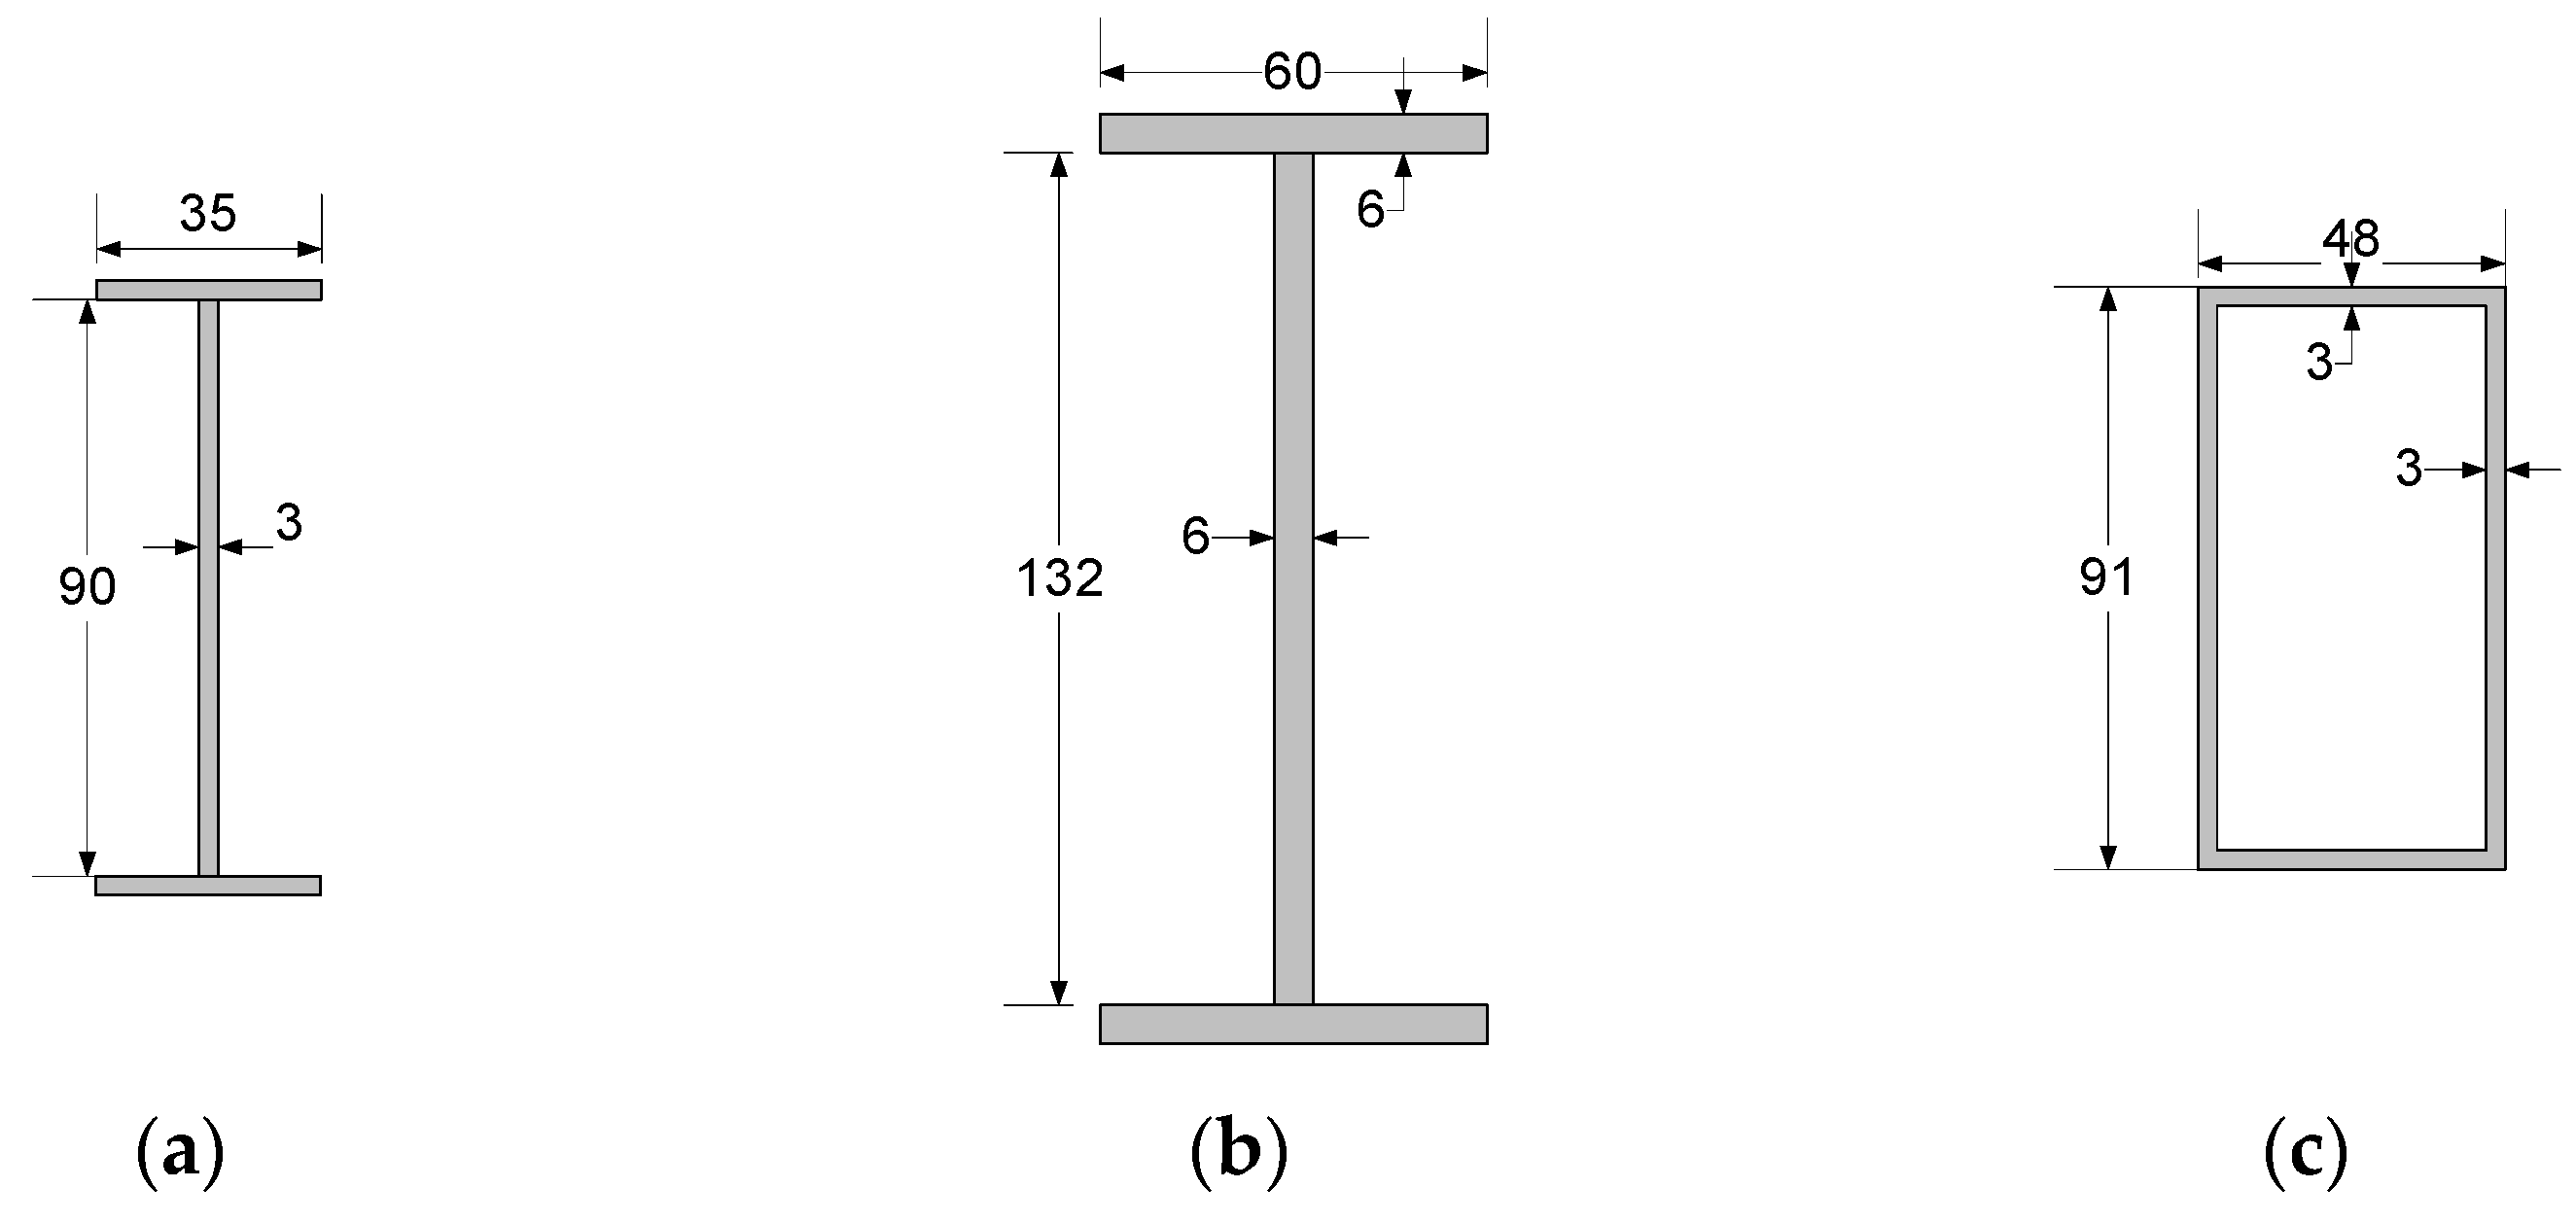
4.2. Parametric Analysis

The effects of flexural stiffness are investigated using three FE models with different flexural stiffness of the stress-ribbons. The horizontal movements of the supports are neglected to eliminate the influence of the boundary conditions. Figure 11 shows the considered cross-sections. The cross-section area, the material parameters, and FE type remain the same as in the previous section.
The bridge sag extent, altering the magnitude of the thrust force (H), affects the choice of the cross-section parameters by the iterative procedure described in Section 2. In this section, the initial sag of Model-2 was increased to 135 mm for illustrating the above statement by changing the compressive stresses in the ribbons. The same sag f0 is used in all FE models considered in this section for comparison purposes.
An additional Model-3 is investigated as a hypothetical case, representing a maximal flexural stiffness of the ribbon, though the cross-section area A does not change (Figure 11). In reality, this cross-section layout is impossible due to the low lateral-torsional buckling resistance of such a slender element. The modelling of the band half with symmetry condition along the longitudinal surface (Figure 12) ensures the buckling stability of Model-3.
Since the stress-ribbon bridges are susceptible to asymmetric loading conditions, the numerical analysis focuses on the deformation behaviour of the bridge models under the asymmetrical loading conditions. In the same manner as Section 4.1, the FE analyses employ the linear-elastic material model of steel, assuming the elasticity modulus E = 208 GPa and Poisson’s ratio ν = 0.30.
The design displacement (uq,max) induced by the live load is used for the analysis, as shown in Figure 10. The load situation of two alternative models (Model-1 and Model-3) are optimised regarding the deformation response of Model-2. The similarity of the displacements uq,max of the models is the optimisation condition. This process assumes the constant design load q and alters the dead load component to satisfy the optimisation criterion (i.e., uq,max = const).
The reference Model-2 is subjected to the dead load g = 2 kN/m combined with various live load components (q = 2 kN/m, 3 kN/m, and 4 kN/m) applied to the bridge half span, as shown in Figure 3 and Figure 10. The vertical displacement due to the live load (uq) is estimated by subtracting the dead load-induced displacement component (ug) from the total displacement predicted by the model (utot). The magnitude of the dead load applied to Model-1 and Model-3 is tailored iteratively to ensure the same displacement uq,max as the reference Model-2. Table 3 presents the calculation results in terms of the maximum vertical displacement (utot) and the corresponding design component uq. This table also includes the thrust force (H) in the ribbon and the extremum stresses in the cross-section (σmin/σmax) estimated in the section where the maximum vertical displacement appeared. In Model-1, that section was close to the quarter of the span. On the contrary, the maximum vertical displacement was localised near the mid-span of Model-2 and Model-3.
Bold numbers in Table 3 indicate the design values of the vertical displacement. Model-1 with flexible bands requires a considerable amount of the dead load to stabilise the displacement induced by the asymmetrically distributed load q. The triple dead load doubles the thrust force regarding Model-2. In both models (Model-1 and Model-2), the maximum stresses in the ribbons are similar; however, the minimum stresses are much lower in the reference case because of the bending effect in the flexural-stiff ribbon. The increase of the ribbons’ flexural stiffness of the ideal Model-3 further increases the compressive stresses in the ribbons. The dead load reduction from 20% to 60% of Model-3 is achieved (Table 3) and the thrust force decreases by 2.5 times regarding Model-2. The maximum stresses in the ribbon of all models are similar.
The simulation results (Table 3) demonstrate that the thrust forces decrease with increasing the ribbon flexural stiffness. That also increases the compressive stresses in the cross-section because of the bending effect. As mentioned in Section 2, the limitations of compressive stresses can be necessary in some cases (e.g., applying FRP profiles).
Figure 13 shows functional relationships between the flexural stiffness of the ribbon-bands and the extremum stresses in the cross-section having the maximum displacement utot. Second-order polynomials approximate the calculated points. This figure demonstrates the application example of condition (9) in the engineering design of the flexural-stiff steel ribbons. The figure shows that Model-2 fulfils the stress-limitation requirement—the compressive stresses in the ribbon do not exceed 20 MPa.
A bridge Model-4 is introduced to investigate the applicability of the proposed methodology for designing stress-ribbons made of glass fibre-reinforced polymer (GFRP). The loading conditions of Model-2 and Model-4 are the same. The choice of cross-section geometry is based on Equation (3). The GFRP profile elasticity modulus E = 28 GPa and strength fd = 190 MPa are assumed by following the producer recommendations [30]. Equations (3), (8) and (7), define the moment of inertia, the profile height, and the cross-section area. The inertia moment Iy is increased, compensating for the effect of a relatively low elasticity modulus of GFRP, for maintaining the same flexural stiffness of the ribbon, as Model-2 (Figure 14a). Figure 14b shows the resultant dimensions of the cross-section. Table 4 gives the physical characteristics of alternative cross-sections.
Table 3 presents the FE simulation results of Model-4 in the grey-filled row. As expected, the minimal compressive stresses among the analysed bridge systems were induced in the GFRP ribbons. Although the flexural stiffness (EIy) of both bridges (i.e., Model-2 and Model-4) is the same, more significant vertical displacements are characteristic of the bridge model with GFRP ribbons. It is a consequence of the high deformability of Model-4, calling for an excessive increase to the axial stiffness of GFRP ribbons because of the absence of standard profiles [30], satisfying both the axial stiffness and flexural stiffness limitations. A non-standard rectangular 127 × 27 mm (depth × width) cross-section can be an example satisfying both the axial stiffness and the flexural stiffness conditions. The unit weight, m, of this profile is equal to 6.18 kg/m. Further reduction of the weight is impossible since it reduces the stiffness EA. That makes the GFRP profiles inefficient for this structural application.
The application of carbon fibre-reinforced polymers (CFRP) presents an acceptable solution to the above problem [4,15]. The elasticity modulus of such profiles can vary from 88 GPa to 245 GPa depending on the carbon filament content; the tensile strength can reach 2.5 GPa [31]. Thus, an alternative Model-5 has ribbons made of CFRP profiles. In this example, the CFRP elasticity modulus and strength are equal to 148 GPa and 1.1 GPa. Figure 14c shows that the cross-section composed following the design procedure described in Section 2. The cross-section shape was changed because of the CFRP composite manufacturing peculiarities—the chosen closed-shape conforms to the manufacturer datasheets [31]. Table 3 presents the FE calculation results (in the grey-filled row).
The FE simulations assume the elastic behaviour of both GFRP and CFRP materials. The modelling also neglects the anisotropy of FRP composites. The predominance of tensile stresses, which are relatively low regarding the FRP strength [25], makes the assumed simplifications acceptable for the deformation analysis.
Table 4 shows that the reference steel ribbon and CFRP profile have almost identical stiffness (both axial and flexural); the predicted displacements of Model-2 and Model-5 are similar, as well (the bold numbers indicate the characteristic values in Table 3). However, Model-5 has the lowest unit weight (m) among the ribbons listed in Table 4.
The above results reveal the following issues:
  • The existing assortment of GFRP profiles, based on the similarity of cross-section dimensions of the polymer and steel profiles, does not ensure achieving adequate efficiency as steel counterparts in situations when equivalent axial and flexural stiffness are required in conjunction.
  • CFRP profiles are applicable as flexural-stiff stress-ribbons. The development of such structural systems is the object of further research.

5. Conclusions

This study develops a new concept of the stress-ribbon bridge system that comprises ribbons made of flexural-stiff profiles. The proposed approach efficiency in reducing kinematic displacements was illustrated by physical tests of two steel bridge prototypes. The finite element model, verified using the test results, was used for the parametric analysis. The following conclusions are formulated:
  • A more sustainable deformation behaviour is characteristic of the bridge prototype with the innovative flexural-stiff ribbons regarding the model with flexible bands of the same axial stiffness. Even under asymmetrical load distribution (unfavourable for the typical bridge systems), the proposed ribbon-profiles did not experience undesirable camber of the unloaded part of the span. At the same time, the proposed design procedure can limit unacceptable compressive stresses in the ribbons.
  • An engineering methodology and design equations are proposed to choose the cross-section geometry of the flexural-stiff ribbon-profiles. It allows composing the ribbons of any materials, increasing the versatility of the stress-ribbon structural systems.
  • The existing dimensioning system of GFRP profiles, based on the cross-section similarity to the steel profiles, is inefficient in situations that require the satisfaction of both the axial stiffness and the flexural stiffness limitations. The application of CFRP profiles is a promising alternative to steel in flexural-stiff stress-ribbon structural systems.

Author Contributions

Conceptualization, A.J.; methodology, A.J.; data curation, G.S.; investigation, G.S. and R.J.; software, R.J.; formal analysis, R.J. and V.G.; visualization, G.S. and R.J.; validation, A.J. and V.G.; writing—original draft preparation, G.S.; writing—reviewing and editing, V.G.; supervision, A.J.; resources, A.J.; project administration, R.J. All authors have read and agreed to the published version of the manuscript.

Funding

This project has received funding from the European Regional Development Fund (Project No. 01.2.2-LMT-K-718-03-0010) under grant agreement with the Research Council of Lithuania (LMTLT). The APC was funded by Vilnius Tech.

Institutional Review Board Statement

Not applicable.

Informed Consent Statement

Not applicable.

Data Availability Statement

Not applicable.

Conflicts of Interest

The authors declare no conflict of interest.

References

  1. Strasky, J. Stress Ribbon and Cable-Supported Pedestrian Bridges; Thomas Telford: London, UK, 2005. [Google Scholar]
  2. Goldack, A.; Schlaich, M.; Meiselbach, M. Stress ribbon bridges: Mechanics of the stress ribbon on the saddle. ASCE J. Bridge Eng. 2016, 21, 04015089. [Google Scholar] [CrossRef]
  3. Tubino, F.; Pagnini, L.; Piccardo, G. Uncertainty propagation in the serviceability assessment of footbridges. Struct. Infrastruct. Eng. 2020, 16, 123–137. [Google Scholar] [CrossRef]
  4. Romera, L.; Hernández, S.; Baldomir, A.; Nieto, F. Study of pedestrian comfort in a three span stress ribbon footbridge with carbon fibre cables. WIT Trans. Built Environ. 2020, 196, 139–152. [Google Scholar]
  5. Xiao, X.; Xue, H.; Chen, B. Nonlinear model for the dynamic analysis of a time-dependent vehicle-cableway bridge system. Appl. Math. Model. 2021, 90, 1049–1068. [Google Scholar] [CrossRef]
  6. Liu, Y.; Zwingmann, B.; Schlaich, M. Carbon fiber reinforced polymer for cable structures—A review. Polymers 2015, 7, 2078–2099. [Google Scholar] [CrossRef] [Green Version]
  7. fib (The International Federation for Structural Concrete). Guidelines for the Design of Footbridges; fib: Lausanne, Switzerland, 2005. [Google Scholar]
  8. Han, K.J.; Lim, N.H.; Ko, M.G.; Kim, K.D. Efficient assumption of design variables for stress ribbon footbridges. KSCE J. Civ. Eng. 2016, 20, 250–260. [Google Scholar] [CrossRef]
  9. del Arco, C.D.; Aparicio, A.C.; Mari, A.R. Preliminary design of pre-stressed concrete stress ribbon bridges. ASCE J. Bridge Eng. 2001, 6, 234–241. [Google Scholar] [CrossRef]
  10. Juozapaitis, A.; Norkus, A. Shape determining of loaded cable via total displacements. Technol. Econ. Dev. Econ. 2005, 11, 248–259. [Google Scholar] [CrossRef]
  11. Scheer, J. Failed Bridges: Case Studies, Causes and Consequences; Ernst&Sohn Verlag: Berlin, Germany, 2010. [Google Scholar]
  12. Radnić, J.; Matešan, D.; Buklijaš-Kobojević, D. Numerical model for analysis of stress-ribbon bridges. Građevinar 2015, 67, 959–973. [Google Scholar]
  13. Juozapaitis, A.; Vainiunas, P.; Kaklauskas, G. A new steel structural system of a suspension pedestrian bridge. J. Constr. Steel Res. 2006, 62, 1257–1263. [Google Scholar] [CrossRef]
  14. Gholami, M.; Sam, A.R.M.; Yatim, J.M.; Tahir, M.M. A review on steel/CFRP strengthening systems focusing environmental performance. Constr. Build. Mater. 2013, 47, 301–310. [Google Scholar] [CrossRef]
  15. Gholami, M.; Mohd Sam, A.R.; Marsono, A.K.; Tahir, M.M.; Faridmehr, I. Performance of steel beams strengthened with pultruded CFRP plate under various exposures. Steel Compos. Struct. 2016, 20, 999–1022. [Google Scholar] [CrossRef]
  16. Arnautov, A.K.; Kulakov, V.; Andersons, J.; Gribniak, V.; Juozapaitis, A. Experimental investigation on stiffness and strength of single-lap z-pinned joints in a laminated CFRP stress-ribbon strip. Balt. J. Road Bridge Eng. 2016, 11, 120–126. [Google Scholar] [CrossRef] [Green Version]
  17. Liu, Z.Q.; Luo, B.; Wang, Q.; Feng, B. Experimental and numerical investigation of the anti-debonding performance for novel CFRP-steel tube composite member under tension. J. Build. Eng. 2021, 35, 102004. [Google Scholar] [CrossRef]
  18. Segal, E.M.; Rhode-Barbarigos, L.; Adriaenssens, S.; Coelho, R.D.F. Multi-objective optimization of polyester-rope and steel-rope suspended footbridges. Eng. Struct. 2015, 99, 559–567. [Google Scholar] [CrossRef]
  19. Quaranta, G.; Demartino, C.; Xiao, Y. Experimental dynamic characterization of a new composite glubam-steel truss structure. J. Build. Eng. 2019, 25, 100773. [Google Scholar] [CrossRef]
  20. Alaedini, S.; Kabir, M.Z.; Al-Mahaidi, R. Stability performance of thin-walled pultruded beams with geometric web-flange junction imperfections. J. Build. Eng. 2021, 33, 101549. [Google Scholar] [CrossRef]
  21. Wadi, A.; Pettersson, L.; Karoumi, R. FEM simulation of a full-scale loading-to-failure test of a corrugated steel culvert. Steel Compos. Struct. 2018, 27, 217–227. [Google Scholar]
  22. Votsis, R.A.; Stratford, T.J.; Chryssanthopoulos, M.K.; Tantele, E.A. Dynamic assessment of a FRP suspension footbridge through field testing and finite element modelling. Steel Compos. Struct. 2017, 23, 205–215. [Google Scholar] [CrossRef] [Green Version]
  23. Bleicher, A.; Schlaich, M.; Fujino, Y.; Schauer, T. Model-based design and experimental validation of active vibration control for a stress ribbon bridge using pneumatic muscle actuators. Eng. Struct. 2011, 33, 2237–2247. [Google Scholar] [CrossRef]
  24. Juozapaitis, A.; Merkevičius, T.; Daniūnas, A.; Kliukas, R.; Sandovič, G.; Lukoševičienė, O. Analysis of innovative two-span suspension bridges. Balt. J. Road Bridge Eng. 2015, 10, 269–275. [Google Scholar] [CrossRef] [Green Version]
  25. Sandovic, G.; Juozapaitis, A.; Gribniak, V. Experimental and analytical investigation of deformations and stress distribution in steel bands of a two-span stress-ribbon pedestrian bridge. Math. Probl. Eng. 2017, 2017, 9324520. [Google Scholar] [CrossRef]
  26. Juozapaitis, A.; Norkus, A. Determination of rational parameters for the advanced structure of a pedestrian suspension steel bridge. Balt. J. Road Bridge Eng. 2007, 2, 173–181. [Google Scholar]
  27. Tong, Z.; Song, X.; Huang, Q. Deflection calculation method on GFRP-concrete-steel composite beam. Steel Compos. Struct. 2018, 26, 595–606. [Google Scholar]
  28. Jakubovskis, R.; Kupliauskas, R.; Rimkus, A.; Gribniak, V. Application of FE approach to deformation analysis of RC elements under direct tension. Struct. Eng. Mech. 2018, 68, 345–358. [Google Scholar]
  29. Cervenka, V.; Jendele, L.; Cervenka, J. ATENA Program. Documentation, Part. 1: Theory; Cervenka Consulting: Prague, Czechia, 2007. [Google Scholar]
  30. Fiberline. The Fiberline Design Manual, 2nd ed.; Fiberline Composites: Middelfart, Denmark, 2003. [Google Scholar]
  31. Röchling. Durostone® Composite Profiles: Fibre Reinforced Plastics; Röchling Industrial: Laupheim, Germany, 2017. [Google Scholar]
Figure 1. The design scheme of a stress-ribbon bridge.
Applsci 11 02585 g001
Figure 2. Geometry characteristics of the prototypes with different flexural stiffness of stress-ribbons: (a) the bridge with flexible bands; (b) the bridge with flexural-stiff ribbon-profiles.
Applsci 11 02585 g002
Figure 3. The bridge prototypes’ loading schemes: (a) symmetrical load; (b) asymmetrical load (q/g = 0.49); (c) asymmetrical load (q/g = 1.17).
Applsci 11 02585 g003
Figure 4. Typical loading layouts: (a) symmetrical load situation; (b) asymmetrical load situation.
Applsci 11 02585 g004
Figure 5. The monitoring devices’ layout: (a) prototype with flexible bands (Model-1); (b) prototype with flexural-stiff ribbon-profiles (Model-2).
Applsci 11 02585 g005
Figure 6. Monitoring results of the bridge Model-1.
Applsci 11 02585 g006
Figure 7. Monitoring results of the bridge Model-2.
Applsci 11 02585 g007
Figure 8. The bridge prototypes’ FE models: (a) model with flexible bands (Model-1); (b) model with flexural-stiff ribbon-profiles (Model-2).
Applsci 11 02585 g008
Figure 9. Shell-brick finite element and corresponding layered model.
Applsci 11 02585 g009
Figure 10. The bridge models’ vertical displacements.
Applsci 11 02585 g010
Figure 11. The ribbons’ cross-sections assumed for the parametric analysis.
Applsci 11 02585 g011
Figure 12. Symmetry conditions applied in the bridge Model-3.
Applsci 11 02585 g012
Figure 13. Extremum stresses in the cross-section having the maximum vertical displacement.
Applsci 11 02585 g013
Figure 14. Alternative cross-sections: (a) steel; (b) GFRP; (c) CFRP. GFRP: glass fibre-reinforced polymer; CFRP: carbon fibre-reinforced polymer.
Applsci 11 02585 g014
Table 1. Approximated values of the shape coefficient αc.
Cross-Section Type (EN 10365)Height, mmEstimated Coefficient
IPE-beam 160–6000.410–0.405
HE-beam200–9000.430–0.405
Square hollow section80–4000.381–0.393
Round hollow section88.9–12190.337–0.348
Table 2. Test and numerical results: maximum vertical displacements (umax) and thrust forces (H).
SourceModel-1Model-2
Symmetrical LoadAsymmetrical Load (q/g = 0.49)Symmetrical LoadAsymmetrical Load (q/g = 0.49)
umax, mmH, kNumax, mmH, kNumax, mmH, kNumax, mmH, kN
Test29.236.029.329.549.941.344.830.2
Finite element simulations30.537.929.531.748.843.242.030.6
Difference–4.5%–5.0%–0.7%–6.9%2.2%–4.4%6.2%–1.3%
Table 3. Design results of alternative bridge models: vertical displacement components, extremum stresses, and thrust force.
Bridge Modelq = 2 kN/mq = 3 kN/mq = 4 kN/m
g, kN/mutot, mmuq, mmσmin, MPaσmax, MPaH, kNg, kN/mutot, mmuq, mmσmin, MPaσmax, MPaH, kNg, kN/mutot, mmuq, mmσmin, MPaσmax, MPaH, kN
Model-18.962.08.4318351155.38.663.612.2323357157.98.666.415.6333372164.5
Model-22.022.68.4722154.22.026.312.2–326562.32.029.415.6–1430870.3
Model-30.411.38.4–5015412.60.415.112.2–7321216.80.619.515.6–9227622.2
Model-42.039.612.3–46444.22.045.018.2–77346.32.050.223.6–108452
Model-52.018.67.35137572.022.110.9–616565.32.024.813.8–919474.1
Table 4. Physical properties of alternative stress-ribbons.
ParameterSteel (Model-2)GFRP (Model-4)CFRP (Model-5)
Iy, cm463.745886.5
A, cm24.815.18.0
E, GPa20828148
ν0.300.230.28
EIy, kNm2127.3128.2128.0
EA, MN96.042.3118.1
m, kg/m3.772.721.52
Publisher’s Note: MDPI stays neutral with regard to jurisdictional claims in published maps and institutional affiliations.

