Article

System Reliability Evaluation of a Bridge Structure Based on Multivariate Copulas and the AHP–EW Method That Considers Multiple Failure Criteria

College of Transportation, Jilin University, Changchun 130025, China
*
Author to whom correspondence should be addressed.
Submission received: 16 January 2020 / Revised: 5 February 2020 / Accepted: 15 February 2020 / Published: 19 February 2020
(This article belongs to the Section Civil Engineering)

Abstract

:
The system reliability evaluation of a bridge structure is a complicated problem. Previous studies have commonly used approximate estimation methods, such as the wide bounds method and the narrow bounds method, but neither could obtain an accurate result. In recent years, the copula theory has been introduced into the system reliability evaluation, which can obtain more accurate results than the approximate methods. However, most studies simply construct binary copula functions to consider the joint failure of two failure modes. For a complex bridge structure composed of multiple components and failure modes, the joint failure of multiple failure modes needs to be considered. Before evaluating the system reliability, it is necessary to determine the failure criteria of the system. Different failure criteria for simply supported beam bridges have been proposed. However, there is no standard available to determine which failure criterion to choose, and the selection of failure criteria is ambiguous. In this paper, a novel method is proposed to evaluate the system reliability of a simply supported beam bridge by considering multiple failure criteria based on multivariate copulas and the analytic hierarchy process entropy weight (AHP–EW) method. The method first considers multiple failure criteria comprehensively and constructs multivariate copulas for the joint failure of multiple components in a bridge system reliability evaluation. The AHP–EW method is a comprehensive weighting method combining the analytic hierarchy process and entropy weight methods, which is used to establish the hierarchical analysis model between system reliability and multiple failure criteria. By considering the joint failure of multiple failure modes in the system reliability evaluation under a single failure criterion, multivariate copula functions were constructed. In order to verify the applicability of the proposed bridge system reliability method, a simply supported reinforced concrete (RC) hollow slab bridge composed of nine slab segments was selected as the numerical example. The results indicate that the method proposed in this paper could evaluate the bridge system reliability more comprehensively and reasonably.

1. Introduction

With the rapid development of China’s urbanization, transportation has become increasingly important [1]. As a link connecting cities, transportation directly affects the lives of urban residents, and its quality is a direct reflection of the degree of urban development. Bridge structures are an important part of the transportation system and play an important role. The reinforced concrete (RC) simply supported girder bridges, with the characteristics of higher quality and lower cost, have been widely used for small-to-medium-span highway bridges in China [2]. The bridge structure in service is subjected to the coupling effect of environmental erosion and traffic load, which will cause the aging of concrete components, further reduce the bearing capacity, and even cause the collapse of the bridge [3,4,5]. The collapse of a bridge often means not only economic losses and traffic jams, but also irreparable casualties [6]. In order to ensure the remaining service life of a bridge structure and the safety of people’s lives and property, damage detection and performance evaluation of structures have developed rapidly, providing a basis and guidance for bridge maintenance and management decisions [7,8,9]. In recent years, algorithmic and mathematical methods have been widely used in structural damage detection, such as the Kalman filter and eigen perturbation theories [10,11]. However, there are many random factors in the performance evaluation of a bridge structure, such as resistance and load effects [12,13]. Therefore, probabilistic methods are often used to evaluate the performance of a bridge structure, such as reliability and fragility models [14,15,16]. In this paper, reliability is selected as the probabilistic measure for structural safety assessments.
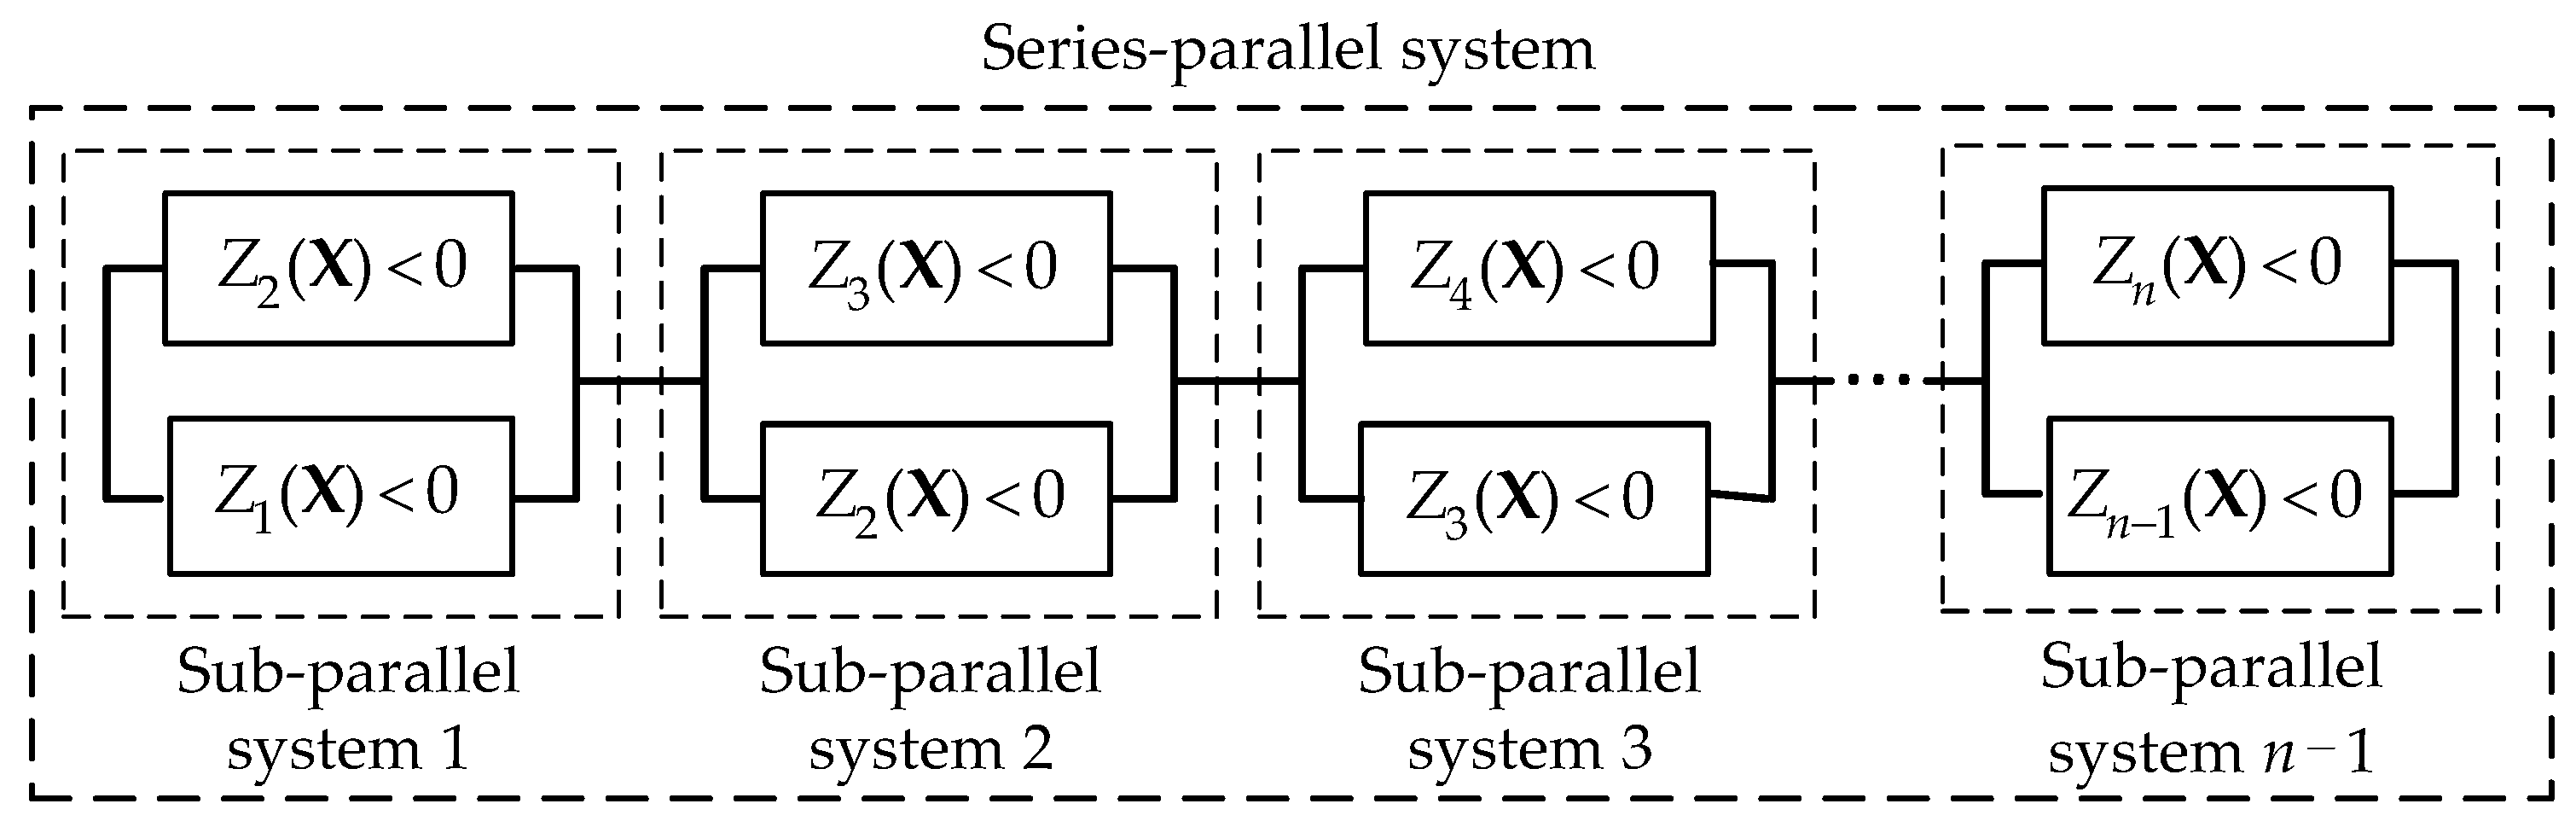
A bridge structure is a complex system with multiple components. There exist many failure modes, such as flexural failure and shearing failure [17]. The reliability of a single component cannot reflect the overall performance of the bridge structure. For structural designers, performance is often concerned with the reliability evaluation of bridge systems. In order to evaluate the system reliability, multiple integrals are often calculated. For a complex bridge structure, it is not only difficult to obtain the joint probability density function for each random variable, but it is also difficult to calculate multiple integrals. Therefore, some approximate calculation methods to find the system reliability are proposed, such the wide bounds [18] and narrow bounds methods [19]. However, these approximate calculation methods only consider the linear correlations between failure modes and ignore the nonlinear correlations. The evaluation results cannot accurately reflect the actual condition of the bridge system.
In order to obtain an accurate evaluation result, the copula theory has been introduced into system reliability evaluations recently. The copula function can not only describe the nonlinear correlation between failure modes, but can also solve the joint failure probability of multiple failure modes. Liu et al. [20] presented mixed copula models for the system reliability evaluation of a multiple-component system by considering the nonlinear correlations between failure modes, and utilized a simply supported cored slab bridge to illustrate the feasibility and application of mixed copula models. Sun et al. [21] proposed a reliability model of failure crack propagation based on a time-varying copula and calculated the time-varying joint failure reliability by considering two failure modes in a numerical example. Fan et al. [22] proposed a new model to evaluate a time-dependent bridge system reliability by considering nonlinear correlations between failure modes based on a Gaussian copula function and Bayesian dynamic linear models, and used an actual series system with two failure modes to illustrate the feasibility of the proposed model. Lu et al. [23] proposed a method for the system reliability analysis of engineering structures by considering multiple dependent failure modes based on a copula and introduced copula functions into the narrow bounds theory. Song et al. [24] applied a copula technique to describe the nonlinear dependence among typical component seismic demands of the commonly used concrete continuous girder bridge style and analyzed the influence of the real dependence among components on the seismic reliability. Fang et al. [25] used a copula function to model the dependency between two degradation processes in a bivariate degradation model of a coherent system. Wang et al. [26] proposed a system reliability evaluation method based on non-parametric copulas and utilized four examples to illustrate the feasibility and efficiency of the proposed method. Significant studies have been devoted to the reliability evaluation of complex systems based on copula functions. However, most studies only use the binary copula function to consider the case where two failure modes occur together. For a bridge structure composed of multiple components, the system reliability evaluation may consider the occurrence of multiple failure modes simultaneously. Therefore, a multivariate copula function needs to be constructed.
In order to evaluate the bridge system reliability, the relationship between individual components and the overall system should be identified first, such as a series system, parallel system, and series-parallel system. This relationship is also called the failure criterion of the bridge system. Liu et al. [20] proposed a failure criterion where the failure of any two adjacent components would cause the entire system to fail and calculated the system reliability using a simple supported hollow slab beam as an example. Tu et al. [27] assumed that the failure of any three adjacent beams would lead to the destruction of the entire structure and calculated the system reliability of a widened T-girder bridge using the proposed failure criterion. Wang et al. [28] proposed a semi-analytical method to assess the time-dependent reliability of an aging series system subjected to non-stationary loads and considered that the failure of any single component would cause the entire system to fail. However, the selection of the failure criterion is ambiguous in the system reliability evaluation of the bridge structure. There are no rules for determining which failure criterion should be chosen. Therefore, multiple failure criteria should be comprehensively considered to make the evaluation result more reasonable. The AHP–EW method is introduced to solve this problem, which can obtain the comprehensive weight of the subjective weight and the objective weight of each evaluation index. The analytic hierarchy process entropy weight (AHP–EW) method is gradually being accepted and recognized in various research fields [29,30,31].
This paper develops a novel method that can be used to evaluate the system reliability of the bridge structure by considering multiple failure criteria based on copulas and the AHP–EW method. In order to obtain accurate evaluation results, the system reliability evaluation under each failure criterion was used to adapt the copula theory. By considering the joint failure of multiple components, the multivariate copula functions were constructed. The AHP–EW method was used to comprehensively consider the subjective and objective weights of each failure criterion in the system reliability evaluation and construct the analytic hierarchy model. The specific process of the system reliability evaluation using the method proposed in this paper is shown in Figure 1. Then, a simply supported RC hollow slab bridge composed of nine slab segments was selected as the numerical example to illustrate the applicability of the proposed method.

2. System Reliability Evaluation Method of a Single Failure Criterion

In order to evaluate the system reliability, a model describing the relationship between the individual components and the overall system needs to be determined first, namely the failure criterion. For a bridge system, there are three commonly used failure criteria: failure of any one component, failure of any two adjacent components, and failure of any three adjacent components [20,27,28]. The bridge structure is composed of multiple components. Each component has its own failure mode, which is determined by the performance function. Because each component has the same material property and load source, the failure modes between the components have a nonlinear correlation. System reliability evaluation needs to consider the probability of the joint failure of multiple components. Therefore, it is necessary to construct a joint distribution function of multiple failure modes. However, it is very complicated to construct the joint distribution function. In order to consider the joint failure of multiple components, multivariate copulas were introduced to construct the joint distribution function of multiple failure modes and consider the nonlinear correlation between each failure mode. Then, the method of system reliability evaluation obtained by considering different failure criteria was proposed based on multivariate copulas.

2.1. Copula Theory

The copula function, first proposed by Sklar [32], describes the correlation between variables, and is actually a class of functions that connect joint distributions to their respective marginal distributions. X 1 , X 2 ,…, X d are the random variables with respective marginal distributions F 1 , F 2 , , F d and the multivariate distribution is F ( x 1 , x 2 , , x d ) . For all x R , R ( , + ) , there exists a d-dimensional copula function, which describes the relationship between the multivariate distribution and the corresponding marginal distribution function:
F ( x 1 , x 2 , , x d ) = P { X 1 x 1 , X 2 x 2 , , X d x d } =   C ( F 1 ( x 1 ) , F 2 ( x 2 ) , , F d ( x d ) | θ ) = C ( u 1 , u 2 , , u d | θ ) .
where C ( · ) is the copula function with domain [0,1]d. θ is the parameter for the copula. The functions F i ( x i ) = u i , i = 1 , 2 , , d follow the uniform distribution U(0,1).
The set of all copula functions contains many families, such as Archimedean copulas, meta-elliptical copulas, quadratic copulas [33], and cubic copulas [34]. Among them, Archimedean copulas and meta-elliptical copulas are commonly used because they are relatively simple in their function construction compared to the other copulas [35,36]. In this study, the Clayton, Gumbel, and Frank copulas in Archimedean copulas and the Gaussian copula in meta-elliptical copulas were selected as the candidate copulas based on previous studies [20,23].

2.1.1. Archimedean Copulas

Archimedean copulas are rather popular because of the mathematical tractability and the capability of capturing wide ranges of dependence. In addition, the statistical inference on Archimedean copulas has been well developed; therefore, the Archimedean copulas are widely used in various fields [37]. The d-dimensional Archimedean copula function is defined as given in Equation (2):
C ( u 1 , u 2 , , u d | θ ) = { φ 1 ( φ ( u 1 ) , φ ( u 2 ) , , φ ( u d ) ) , i = 1 d φ ( u i ) φ ( 0 ) 0 , o t h e r s
where C ( u 1 , u 2 , , u d | θ ) represents the Archimedean copula function. φ ( t ) is a generator function of C ( u 1 , u 2 , , u d | θ ) and satisfies φ ( t ) = 0 , φ ( t ) < 0 , and φ ( t ) > 0 . φ 1 ( · ) is the inverse function of φ ( · ) .
The Archimedean copula function C ( · ) is determined by its unique generator function φ ( t ) . In this study, the Clayton, Gumbel, and Frank copulas were adopted as the candidate Archimedean copulas. The three copulas have different generator functions and copula functions, which lead to some differences in their description of correlation, especially in describing the tail correlation. Table 1 shows their respective copula functions and generator functions.

2.1.2. Meta–Elliptical Copulas

Meta–elliptical copulas, first proposed by Fang [38], are derived from the elliptic distribution function. It is an extension of the multivariate normal distribution function. Meta-elliptic copulas can fit the abnormal distributions well, such as a multivariate extremal distribution. The meta–elliptic copula functions can be divided into the Gaussian copula, t-copula, Cauchy copula, etc. In this study, the Gaussian copula was adopted as the candidate meta-elliptic copula. The d-dimensional Gaussian copula function is defined as follows:
C ( u 1 , u 2 , , u d | Σ ) = Φ Σ ( Φ 1 ( u 1 ) , Φ 1 ( u 2 ) , , Φ 1 ( u d ) ) = Φ 1 ( u 1 ) Φ 1 ( u 2 ) 1 ( 2 π ) d / 2 | Σ | 1 / 2 exp ( 1 2 w T Σ 1 w ) d w .
where C ( u 1 , u 2 , , u d | Σ ) represents the Gaussian copula function. Φ 1 ( · ) is the inverse function of the standard normal distribution function. Φ Σ ( Φ 1 ( u 1 ) , Φ 1 ( u 2 ) , , Φ 1 ( u d ) ) is the multivariate standard normal distribution function. w represents the matrix of variables of the integrand. Σ represents the correlation coefficient matrix.

2.1.3. Selection of the Best-Fitting Copula

The copula parameter θ in the copula function describes the correlation between variables. Different types of copula functions have different characteristics in describing the correlation between variables. It is necessary to select the most suitable copula function when modeling the correlation between variables [39]. The best-fitting copula can be selected based on the minimum value of the Akaike information criterion (AIC) or the Bayesian information criterion (BIC) [40]. The AIC and BIC are defined as follows:
AIC = 2 ln ( L ( θ ) ) + 2 n ,
BIC = 2 ln ( L ( θ ) ) + n ln N .
where L ( θ ) represents the likelihood function value of the copula function value with N samples, n represents the number of parameters in the copula function, and N is the number of samples.

2.2. System Reliability Estimation Based on Multivariate Copulas

According to the three commonly used bridge failure criteria (failure of any one component, failure of any two adjacent components, and failure of any three adjacent components), methods for evaluating the system reliability based on copulas are respectively proposed.

2.2.1. Failure Criterion I: Failure of Any One Component

Failure criterion I represents a series system, which assumes that failure of any one component will cause the whole structure to fail, as shown in Figure 2.
The bridge system is composed of multiple components, and the performance function of each component is established using Equation (6):
Z i ( X ) = Z i ( X 1 , X 2 , , X n ) , i = 1 , 2 , , n ,
where Z i and X i represent the performance function and random variables of the ith component, respectively.
According to Equation (1), the joint failure probability of all components can be denoted using Equation (7):
P f = P { Z 1 ( X ) 0 , Z 2 ( X ) 0 , , Z n ( X ) 0 } = C ( F Z 1 ( 0 ) , F Z 2 ( 0 ) , , F Z n ( 0 ) ) = C ( P f Z 1 , P f Z 2 , , P f Z n ) .
where F Z i ( · ) and P f Z i represent the joint distribution function and the failure probability of the ith component, respectively; C ( · ) is the multivariate copula function.
We consider the failure probability of each component as a probability event. According to the series system shown in Figure 2, the system failure probability of failure criterion I is the sum event of multiple events. Then, based on Equations (1) and (7), the system reliability of failure criterion I (failure of any one component) can be obtained as follow:
P f i = P { Z 1 ( X ) 0 Z 2 ( X ) 0 Z n ( X ) 0 } = i = 1 n P { Z i ( X ) 0 } 1 i < j n n P { Z i ( X ) 0 , Z j ( X ) 0 } + 1 i < j < k n n P { Z i ( X ) 0 , Z j ( X ) 0 , Z k ( X ) 0 } + + ( 1 ) n 1 P { Z 1 ( X ) 0 , Z 2 ( X ) 0 , , Z n ( X ) 0 } i = 1 n P { Z i ( X ) 0 } 1 i < j n n P { Z i ( X ) 0 , Z j ( X ) 0 } = i = 1 n P f Z i 1 i < j n n C ( P f Z i , P f Z j ) .
where C ( · ) represents the binary copula function and P f I represents the system failure probability of failure criterion I.

2.2.2. Failure Criterion II: Failure of Any Two Adjacent Components

Failure criterion II refers to the series-parallel system shown in Figure 3. It assumes that failure of any two adjacent components will cause the whole structure to fail.
For a sub-parallel system composed of two components, the nonlinear correlation between the components in each subsystem is considered. In the series system consisting of each sub-parallel system, each sub-parallel system is considered to be independent of each other. The performance function of each component is defined as follows in Equation (9):
Z i j ( X ) = Z i j ( X 1 , X 2 , , X n ) , i = 1 , 2 , , n 1 ,   j = 1 , 2 , , n .
where Z i j represents the performance function of the jth component in the ith sub-parallel system.
According to the relationship between the components and the system shown in Figure 3, with Equations (1) and (7), the system reliability of failure criterion II (failure of any two components) can be obtained based on the bivariate copula function, as follows:
P f = P { Z 11 ( X ) 0 , Z 12 ( X ) 0 } P { Z 22 ( X ) 0 , Z 23 ( X ) 0 } P { Z n 1 , n 1 ( X ) 0 , Z n 1 , n ( X ) 0 } = 1 ( 1 P { Z 11 ( X ) 0 , Z 12 ( X ) 0 } ) ( 1 P { Z n 1 , n 1 ( X ) 0 , Z n 1 , n ( X ) 0 } ) = 1 i = 1 n 1 ( 1 P { Z i , j 1 ( X ) 0 , Z i j ( X ) 0 } ) = 1 i = 1 n 1 ( 1 C ( P f Z i , j 1 , P f Z i j ) ) ,   j = i + 1 .
where C ( · ) represents the binary copula function and P f represents the system failure probability of failure criterion II.

2.2.3. Failure Criterion Ш: Failure of Any Three Adjacent Components

Failure criterion Ш represents a series-parallel system, which assumes that failure of any three components will cause the whole structure to fail, as shown in Figure 4.
The system reliability evaluation method of failure criterion Ш is basically the same as the system reliability evaluation method of failure criterion II. The nonlinear correlation among three components in a subparallel system is considered. The relationship between each subparallel system is also considered to be independent of each other. With Equations (1) and (7), the system reliability of failure criterion Ш (failure of any three components) can be obtained based on the ternary copula function, as follows:
P f III = 1 i = 1 n 2 ( 1 P { Z i i ( X ) 0 , Z i j ( X ) 0 , Z i k ( X ) 0 } ) = 1 i = 1 n 2 ( 1 C ( P f Z i i , P f Z i j , P f Z i k ) ) ,   j = i + 1 , k = i + 2 .
where C ( · ) represents the ternary copula function and P f III represents the system failure probability of failure criterion Ш.

3. System Reliability Evaluation Method That Considers Multiple Failure Criteria

The system failure probability under different failure criteria can be calculated based on copulas. However, there is currently no standard in the system reliability evaluation of a bridge structure to decide which failure criterion to choose. In order to comprehensively consider multiple failure criteria, the AHP–EW method was applied to establish the model of bridge system reliability evaluation and calculate the comprehensive weight of each failure criterion. Peer experts were invited to score each failure criterion based on their knowledge and experience. The possible scores ranged from 1 to 5. The higher the score was, the more reasonable the failure criterion was.

3.1. AHP(Analytic Hierarchy Process) Method

AHP is a subjective decision-making method for solving the complex problems of multiple objectives [41]. Its core idea is to determine the weight of evaluation indexes according to the experience of experts. Here, we take three failure criteria as the evaluation indexes of the system reliability.
The specific steps are as follows.
(1) Establish the hierarchical mode for system reliability evaluation:
In order to evaluate the bridge system reliability by considering multiple failure criteria, a target layer and an index layer are established. The target layer represents the system reliability by considering multiple failure criteria. Each index in the index layer represents the system reliability of each failure criterion. Then, a hierarchical structure between the target layer and the index layer is established, as shown in Figure 5.
(2) Construct the judgment matrix A .
The judgment matrix is constructed based on the scores of peer experts for each index. Equation (13) shows the definition of the element a i j in the judgment matrix A , in which a i j indicates the relative importance of the ith index over the jth index.
A = [ a 11 a 12 a 1 n a 21 a 22 a 2 n a n 1 a n 2 a n n ]
a i j = s i s j , i , j = 1 , 2 , , n ,
where s i and s j indicate the scores of the ith index and the jth index, respectively. a i j is an element of the judgment matrix.
(3) Calculate the weight vector W = ( w 1 ; w 2 ; ; w n ) :
w i = j = 1 n a i j n i = 1 n j = 1 n a i j n , i , j = 1 , 2 , , n ,
(4) Calculate the maximum eigenvalue λ max :
λ max = 1 n i = 1 n ( A W ) i w i .
(5) Check the consistency of the judgment matrix A:
C I = λ max n n 1 ,
C R = C I R I .
where CI and CR represent the consistency index and the consistency ratio, respectively. RI is the random consistency index shown in Table 2. n is the number of indexes.

3.2. Entropy Weight Method

Entropy theory was first introduced to information theory as a measure of information disorder by Shannon [43]. The entropy weight method, an objective weighting method, utilizes entropy theory to determine the index weight according to the information provided by the observations of each index. The importance of the index is reflected by the degree of deviation between the observations of the same index. The greater the degree of deviation, the smaller the entropy value, and the corresponding index weight should be larger [44]. The objective weight calculation procedures of the indexes are as follows.
(1) Construct the evaluation matrix M:
Let the evaluation matrix M = ( x i j )m×n be an information system according to the knowledge and experience of peer experts.
Normalize the evaluation matrix M:
In order to eliminate the impact of different index dimensions on evaluation, the evaluation matrix needs to be normalized.
v i j = x i j min ( x j ) max ( x j ) min ( x j ) , i = 1 , 2 , , m ; j = 1 , 2 , , n .
where v i j is the standardized value of the jth index of the ith evaluation sample. m and n represent the number of experts and the number of indexes, respectively.
(2) Calculate the characteristic proportion ( p i j ) of the jth index of the ith evaluation sample:
p i j = v i j i = 1 m v i j , j = 1 , 2 , , n ,
which satisfies 0 p i j 1 .
(3) Calculate the entropy value ( e j ) of the jth index:
e j = 1 ln ( m ) i = 1 m p i j ln ( p i j ) , j = 1 , 2 , , n ,
where if p i j = 0 or p i j = 1 , p i j ln ( p i j ) = 0 .
(4) Calculate the difference coefficient ( d j ) of the jth index:
d j = 1 e j , j = 1 , 2 , , n .
(5) Calculate the entropy weight ( u j ) of the jth index:
u j = d j j = 1 1 d j , j = 1 , 2 , , n .

3.3. System Reliability Evaluation That Considers Multiple Criteria

After calculating the weight of each index using the AHP and EW methods, the subjective and objective weights of each index were multiplied and normalized to obtain the comprehensive weight C = ( c 1 ; c 2 ; ; c j ) , as shown in Equation (23):
c j = ( w j u j ) / k = 1 n w k u k , j = 1 , 2 , , n .
It can be seen from Equation (23) that it not only considers the knowledge and experience of peer experts to scale the indexes, but also distinguishes the quality of the index data, overcomes the shortcomings of the single-weighting method, and makes the evaluation result more reasonable.
The system reliability under each failure criterion can be obtained based on copulas. According to the analytic hierarchy model shown in Figure 5, the system reliability obtained by considering multiple failure criteria is a weighted summation of the system failure probability under each failure criterion, as shown in Equation (24):
p f = j = 1 n p f j c j , j = 1 , 2 , , n .
where p f is the system failure probability obtained by considering multiple failure criteria. p f j is the system failure probability under the jth failure criterion.

4. Numerical Example

A simply supported hollow slab bridge was used to demonstrate the implementation of the proposed system reliability evaluation method. The procedure of the proposed method can be summarized as follows.
(1)
Calculate the failure probability of each component and determine three failure criteria of bridge system shown in Figure 2, Figure 3 and Figure 4.
(2)
Based on multivariate copulas, evaluate the system reliability under different failure criteria using Equations (8), (10), and (11). The best-fitting copula function is determined using Equations (4) and (5).
(3)
Based on the AHP–EW method, determine the system reliability evaluation model that considers multiple failure criteria, as shown in Figure 5, and calculate the comprehensive weight using Equation (23).
(4)
Evaluate the system reliability by considering multiple failure criteria with Equation (24).

4.1. Bridge Description

A simply supported hollow slab beam in service was selected as the case study [20]. The bridge was 13.0 m long and 9.0 m wide. It was composed of nine concrete slab segments, as shown in Figure 6.
The performance function corresponding to the failure mode of each slab segment was established using Equation (25):
Z i = g ( R i , G i , Q i ) = R i G i Q i , i = 1 , 2 , , 9 , .
where Z i is the performance function of the ith slab segment; R i , G i , and Q i are random variables that represent the resistance, dead load effect, and live load effect of the ith slab segment, respectively.
The resistance R refers to the ability of the structure to withstand the load effects. The dead load effect G is the internal force generated by the dead load on the structure, where the dead load refers to the load whose value does not change with time. The live load effect Q is the internal force generated by the live load on the structure, where the live load refers to the load whose value changes with time. For the calculation method of the resistance, dead load effect, and live load effect, please refer to References [2,45,46]. The resistance, dead load effect, and live load effect of each slab segment follow a normal distribution [20]. The statistical parameters of these random variables are listed in Table 3.
According to the performance function of each component and the statistical parameters of the random variables, the reliability index β of each slab segment was calculated using the first-order second-moment (FOSM) method [47]. Then, the failure probability P f could be obtained using the equation P f = Φ 1 ( β ) , in which Φ 1 ( · ) represents the cumulative density function of a standard normal distribution. The results of the failure probability are shown in Table 4.

4.2. Bridge System Reliability Estimation of the Single Failure Criterion

According to the method proposed in this paper, the system reliability of the case bridge under different failure criteria could be evaluated. The system reliability evaluation under failure criteria I and II used the binary copula function. The ternary copula function was used for the system reliability evaluation under failure criterion Ш.

4.2.1. Failure Criterion I

Failure criterion I involves a simple series system. It is assumed that the failure of any one slab segment will cause the bridge system failure. Since the bridge structure is symmetrical, the repetitive pairs of failure mode pairs are ignored. According to the copula theorem, the copula parameters of the selected copula functions were evaluated, as shown in Table 5. The AIC and BIC values were calculated according to Equations (4) and (5), and the results are shown in Table 6. Then, the principle of minimum AIC and BIC values was used to select the best-fitting copula function. It illustrates that the Gaussian copula was the best-fitting copula for the two performance functions, as seen by comparing the AIC and BIC values.
Then, based on the Gaussian copula function, the joint failure probability of each pair of failure modes was obtained using Table 4 and Equation (7), as shown in Table 7. According to the binary Gaussian copula and Equation (8), the system failure probability P f i of the case bridge under failure criterion I was 1.099 × 10⁻⁴. For comparison, the system failure probability based on the other three copulas were also calculated, which were P f I Clayton = 1.097 × 10⁻⁴, P f I Gumbel = 1.139 × 10⁻⁴ and P f I Frank = 1.245 × 10⁻⁴.

4.2.2. Failure Criterion II

Failure criterion II involves a series-parallel system, which assumes that failure of any two adjacent slab segments will cause the bridge system to fail. According to the copula theorem, the copula parameters of the selected copula functions were evaluated, as shown in Table 8. The AIC and BIC values were calculated according to Equations (4) and (5), the results of which are shown in Table 9. The best-fitting copula function was selected based on the principle of minimum AIC and BIC values. By comparing AIC and BIC values, it can be seen that the Gaussian copula was the best-fitting copula for the two performance functions under failure criterion II.
Then, based on the Gaussian copula function, the joint failure probability of each pair of failure modes was obtained according to Table 4 and Equation (7), as shown in Table 10. According to the binary Gaussian copula and Equation (10), the system failure probability P f of the case bridge under failure criterion II was 1.049 × 10⁻⁵. For comparison, the system failure probability based on the other three copulas were also calculated, which are P f Clayton = 1.057 × 10⁻⁵, P f Gumbel = 7.862 × 10⁻⁶, and P f Frank = 2.736 × 10⁻⁸.

4.2.3. Failure Criterion Ш

Failure criterion Ш involves a series-parallel system, which assumes that failure of any three adjacent slab segments will cause the bridge system to fail. According to the copula theorem, the copula parameters of the selected copula functions were evaluated, as shown in Table 11. The AIC and BIC values were calculated according to Equations (4) and (5), the results of which are shown in Table 12. Similarly, according to the principle of minimum AIC and BIC values, the Gaussian copula was the best-fitting copula for the three performance functions, as seen by comparing the AIC and BIC values.
Then, based on the Gaussian copula function, the joint failure probability of each group of failure modes was obtained according to Table 4 and Equation (7), as shown in Table 13. According to the ternary Gaussian copula and Equation (11), the system failure probability P f III of the case bridge under failure criterion III was 4.356 × 10⁻⁶. For comparison, the system failure probability based on the other three copulas were also calculated, which were P f III Clayton = 5.702 × 10⁻⁶, P f III Gumbel = 1.575 × 10⁻⁶, and P f III Frank = 1.893 × 10⁻¹².

4.3. Bridge System Reliability Estimation Obtained by Considering Multiple Failure Criteria

After calculating the system failure probability corresponding to each failure criterion, the AHP–EW method was used to evaluate the bridge system reliability by considering multiple failure criteria. The hierarchical model shown in tabl5 was established. The target layer was the bridge system reliability obtained by considering multiple failure criteria, and the index layer contained each failure criterion of the bridge system. Thirteen experts in the field of civil engineering were selected to score each index based on their experience and knowledge. The possible scores ranged from 1 to 5. The higher the score was, the higher the probability that the bridge system would fail according to this failure criterion. The subjective weight and objective weight of each index were calculated using the AHP and EW method, respectively. Then, the comprehensive weight was obtained according to Equation (23). The selected indexes and their weights are shown in Table 14.
According to the comprehensive weight and system failure probability of each failure criterion of the case bridge, the system reliability obtained by considering multiple failure criteria was evaluated based on Equation (24), as follow:
P f = 0.4588 × 1.099 × 10 4 + 0.2287 × 1.049 × 10 5 + 0.3125 × 4.356 × 10 6 = 5.418 × 10 5 .

5. Conclusions

The system reliability evaluation results of the bridge structure by considering only a single failure criterion cannot objectively and accurately reflect the actual condition of the bridge system. The aim of the paper was to propose a novel method to evaluate bridge system reliability by considering multiple failure criteria based on multivariate copulas and the AHP–EW method. Bridge structures are complex structures composed of multiple components. Considering the joint failure of multiple components, the multivariate copula functions were constructed. Then, the system reliability under each failure criterion was obtained based on different copulas. According to the AHP–EW method and the system reliability evaluation results of each failure criterion, the system reliability obtained by considering multiple failure criteria was evaluated. The numerical example of the simply supported RC hollow slab bridge was used for the process of system reliability evaluation by considering multiple failure criteria. The method proposed in this paper is not only applicable to the numerical example, but it can also be a utility method for the technical community to evaluate the system reliability of structures with multiple components like the numerical example. The following conclusions were drawn:
  • Copulas provided an effective tool for constructing the joint distribution of multiple failure modes in the system reliability evaluation of a bridge structure. The binary copulas and ternary copulas were constructed to calculate the system failure probability of each failure criterion.
  • According to the three failure criteria proposed by the previous research, the copula functions were used to calculate the bridge system failure probability. The results showed that the greater the number of any adjacent failed slab segments, the smaller the system failure probability, namely P f I (1.099 × 10⁻⁴) > P f (1.049 × 10⁻⁵) > P f III (4.356 × 10⁻⁶). This law was consistent with the objective facts, and proved the applicability of the copula function in the bridge system reliability evaluation once again.
  • It is important to select the best-fitting copula from the candidate copulas. By comparison, different system reliability evaluation results will be obtained based on different copulas. Compared with the system reliability evaluation results of three failure criteria based on the most suitable Gaussian copula, the system reliability evaluation results obtained based on the Clayton copula were the closest, and the system reliability evaluation results obtained based on the Frank copula were the most different.
  • Among the subjective weights, the weight of failure criterion II (0.3849) was the largest and the weight of failure criterion Ш (0.2536) was the smallest. Among the objective weights, the weight of failure criterion I (0.4100) was the largest and the weight of failure criterion II (0.1919) was the smallest. The comprehensive weight of each failure criterion obtained using the AHP–EW method avoided the deviation caused by the subjective weighting method and the absolutization caused by the objective weighting method, and overcame the shortcomings of the single-weight method. The comprehensive weights of the three failure criteria were 0.4588, 0.2287, and 0.3125, respectively.
  • The evaluation result of the system failure probability obtained by considering multiple failure criteria was obtained via weighted summation of the system failure probability of each failure criterion, and the calculation result was 5.418 × 10⁻⁵ ( P f ), which is between 1.099 × 10⁻⁴ ( P f I ) and 1.049 × 10⁻⁵ ( P f ). It shows that the method proposed in this paper can provide a more comprehensive and reasonable system reliability evaluation result, and avoid the ambiguity caused by the selection of a single failure criterion.

Author Contributions

Conceptualization, H.L. and G.T.; formal analysis, H.L. and G.T.; funding acquisition, H.L. and G.T.; investigation, G.T., X.W., and X.H.; methodology, X.W. and G.T.; software, X.W. and X.H.; writing—original draft, H.L. and X.W.; writing—review and editing, G.T. All authors have read and agreed to the published version of the manuscript.

Funding

This research was funded by the National Natural Science Foundation of China (grant numbers 51478203 and 51978309), Science and Technology Project of Education Department of Jilin Province (grant number JJKH20190150KJ), Scientific and Technological Project of Science and Technology Department of Jilin Province (grant number 20190303052SF), and Budget Capital Construction Fund of Jilin Province (grant number 2019C041-5).

Acknowledgments

The authors would like to thank the anonymous reviewers for their constructive suggestions and comments toward improving the quality of the paper.

Conflicts of Interest

The authors declare no conflict of interest.

References

  1. Liu, H.B.; He, X.; Jiao, Y.B. Damage identification algorithm of hinged joints for simply supported slab bridges based on modified hinge plate method and artificial bee colony algorithms. Algorithms 2018, 11, 198. [Google Scholar] [CrossRef] [Green Version]
  2. Liu, H.B.; Wang, X.R.; Tan, G.J.; He, X.; Luo, G.B. System reliability evaluation of prefabricated RC hollow slab Bridges considering hinge joint damage based on modified AHP. Appl. Sci. 2019, 9, 4841. [Google Scholar] [CrossRef] [Green Version]
  3. Yanweerasak, T.; Pansuk, W.; Akiyama, M.; Frangopol, D.M. Life–cycle reliability assessment of reinforced concrete bridges under multiple hazards. Struct. Infrastruct. Eng. 2018, 14, 1011–1024. [Google Scholar] [CrossRef]
  4. Castaldo, P.; Palazzo, B.; Mariniello, A. Effects of the axial force eccentricity on the time–variant structural reliability of aging r.c. cross–sections subjected to chloride–induced corrosion. Eng. Struct. 2017, 130, 261–274. [Google Scholar] [CrossRef]
  5. Ghodoosi, F.; Bagchi, A.; Zayed, T. System–level deterioration model for reinforced concrete bridge decks. J. Bridg. Eng. 2015, 20, 04014081. [Google Scholar] [CrossRef]
  6. Miao, F.; Ghosn, M. Reliability–based progressive collapse analysis of highway bridges. Struct. Saf. 2016, 63, 33–46. [Google Scholar] [CrossRef]
  7. Liu, H.B.; Wang, X.Q.; Jiao, Y.B.; He, X.; Wang, B.Y. Condition evaluation for existing reinforced concrete bridge superstructure using fuzzy clustering improved by particle swarm optimisation. Struct. Infrastruct. Eng. 2017, 13, 955–965. [Google Scholar] [CrossRef]
  8. Ghosn, M.; Moses, F.; Frangopol, D.M. Redundancy and robustness of highway bridge superstructures and substructures. Struct. Infrastruct. Eng. 2010, 6, 257–278. [Google Scholar] [CrossRef]
  9. Lin, S.W.; Yi, T.H.; Li, H.N.; Ren, L. Damage detection in the cable structures of a bridge using the virtual distortion method. J. Bridg. Eng. 2017, 22, 04017039. [Google Scholar] [CrossRef]
  10. Soman, R.; Majewska, K.; Mieloszyk, M.; Malinowski, P.; Ostachowicz, W. Application of Kalman Filter based Neutral Axis tracking for damage detection in composites structures. Compos. Struct. 2018, 184, 66–77. [Google Scholar] [CrossRef]
  11. Bhowmik, B.; Tripura, T.; Hazra, B.; Pakrashi, V. First–order eigen–perturbation techniques for real–time damage detection of vibrating systems: Theory and applications. Appl. Mech. Rev. 2019, 71, 060801. [Google Scholar] [CrossRef]
  12. Saydam, D.; Frangopol, D.M. Applicability of simple expressions for bridge system reliability assessment. Comput. Struct. 2017, 114, 59–71. [Google Scholar] [CrossRef]
  13. Schneider, R.; Thons, S.; Straub, D. Reliability analysis and updating of deteriorating systems with subset simulation. Struct. Saf. 2017, 64, 20–36. [Google Scholar] [CrossRef] [Green Version]
  14. Brunesi, E.; Parisi, F. Progressive collapse fragility models of European reinforced concrete framed buildings based on pushdown analysis. Eng. Struct. 2017, 152, 579–596. [Google Scholar] [CrossRef]
  15. Ghasemi, S.H.; Nowak, A.S. Target reliability for bridges with consideration of ultimate limit state. Eng. Struct. 2017, 152, 226–237. [Google Scholar] [CrossRef]
  16. Vela, R.J.M.; Brunesi, E. Seismic assessment of an industrial frame–tank system: Development of fragility functions. Bull. Earthq. Eng. 2019, 17, 2569–2602. [Google Scholar] [CrossRef]
  17. Estes, A.C.; Frangopol, D.M. Repair optimization of highway bridges using system reliability approach. J. Struct. Eng. 1999, 125, 766–775. [Google Scholar] [CrossRef] [Green Version]
  18. Cornell, C.A. Bounds on the reliability of structural systems. J. Struct. Eng. 1967, 93, 171–200. [Google Scholar]
  19. Ditlevsen, O. Narrow reliability bounds for structural systems. J. Struct. Mech. 1979, 7, 453–472. [Google Scholar] [CrossRef]
  20. Liu, Y.F.; Fan, X.P. Time–independent reliability analysis of bridge system based on mixed copula models. Math. Probl. Eng. 2016, 2016, 2720614. [Google Scholar] [CrossRef] [Green Version]
  21. Sun, Y.T.; Zhang, Z.Z.; Zhang, Q.; Qin, X.R.; Luo, L.F. Multiple failure mode reliability modeling and analysis in failure crack propagation based on time–varying copula. J. Mech. Sci. Technol. 2018, 32, 4637–4648. [Google Scholar] [CrossRef]
  22. Fan, X.P.; Liu, Y.F. Time–variant reliability prediction of bridge system based on BDGCM and SHM data. Struct. Control. Health 2018, 25, E2185. [Google Scholar] [CrossRef]
  23. Lu, H.; Zhu, Z.C. A method for estimating the reliability of structural systems with moment–matching and copula concept. Mech. Based. Des. Struct. 2018, 46, 196–208. [Google Scholar] [CrossRef]
  24. Song, S.; Liu, J.; Qian, Y.J.; Zhang, F.; Wu, G. Dependence analysis on the seismic demands of typical components of a concrete continuous girder bridge with the copula technique. Adv. Struct. Eng. 2018, 21, 1826–1839. [Google Scholar] [CrossRef]
  25. Fang, G.Q.; Pan, R.; Hong, Y.L. Copula–based reliability analysis of degrading systems with dependent failures. Reliab. Eng. Syst. Safe. 2020, 193, 106618. [Google Scholar] [CrossRef]
  26. Wang, F.; Li, H. A practical non–parametric copula algorithm for system reliability with correlations. Appl. Math. Model. 2019, 74, 641–657. [Google Scholar] [CrossRef]
  27. Tu, B.; Fang, Z.; Dong, Y.; Frangopol, D.M. Time–variant reliability analysis of widened deteriorating prestressed concrete bridges considering shrinkage and creep. Eng. Struct. 2017, 153, 1–16. [Google Scholar] [CrossRef]
  28. Wang, C.; Zhang, H.; Li, Q.W. Time–dependent reliability assessment of aging series systems subjected to non–stationary loads. Struct. Infrastruct. Eng. 2017, 13, 1513–1522. [Google Scholar] [CrossRef]
  29. Li, L.; Liu, F.; Li, C.B. Customer satisfaction evaluation method for customized product development using entropy weight and analytic hierarchy process. Comput. Ind. Eng. 2014, 77, 80–87. [Google Scholar] [CrossRef]
  30. Chen, T.; Jin, Y.Y.; Qiu, X.P.; Chen, X. A hybrid fuzzy evaluation method for safety assessment of food–waste feed based on entropy and the analytic hierarchy process methods. Expert Syst. Appl. 2014, 41, 7328–7337. [Google Scholar] [CrossRef]
  31. Feng, G.Z.; Lei, S.Y.; Guo, Y.J.; Meng, B.; Jiang, Q.F. Optimization and evaluation of ventilation mode in marine data center based on AHP–entropy weight. Entropy 2019, 21, 796. [Google Scholar] [CrossRef] [Green Version]
  32. Schweizer, B. Introduction to copulas. J. Hydrol. Eng. 2007, 12, 346. [Google Scholar] [CrossRef] [Green Version]
  33. Kolesárová, A.; Mayor, G.; Mesiar, R. Quadratic constructions of copulas. Inf. Sci. 2015, 310, 69–76. [Google Scholar] [CrossRef]
  34. Evin, G.; Favre, A.-C. A new rainfall model based on the Neyman–Scott process using cubic copulas. Water Resour. Res. 2008, 44, W03433. [Google Scholar] [CrossRef] [Green Version]
  35. Corbella, S.; Stretch, D.D. Simulating a multivariate sea storm using Archimedean copulas. Coast. Eng. 2013, 76, 68–78. [Google Scholar] [CrossRef]
  36. Krajina, A. A method of moments estimator of tail dependence in meta–elliptical models. J. Stat. Plan. Infer. 2012, 142, 1811–1823. [Google Scholar] [CrossRef]
  37. Li, X.H.; Fang, R. Ordering properties of order statistics from random variables of Archimedean copulas with applications. J. Multivar. Anal. 2015, 133, 304–320. [Google Scholar] [CrossRef]
  38. Fang, H.B.; Fang, K.T.; Kotz, S. The Meta–elliptical distributions with given marginals. J. Multivar. Anal. 2002, 82, 1–16. [Google Scholar] [CrossRef] [Green Version]
  39. Tang, X.S.; Li, D.Q.; Rong, G.; Phoon, K.K.; Zhou, C.B. Impact of copula selection on geotechnical reliability under incomplete probability information. Comput. Geotech. 2013, 49, 264–278. [Google Scholar] [CrossRef]
  40. Li, D.Q.; Zhang, L.; Tang, X.S. Bivariate distribution of shear strength parameters using copulas and its impact on geotechnical system reliability. Comput. Geotech. 2015, 68, 184–195. [Google Scholar] [CrossRef]
  41. Chen, F.F.; Guo, S.X.; Gao, Y.J.; Yang, W.H.; Yang, Y.C.; Zhao, Z.; Ehsan, A. Evaluation model of demand–side energy resources in urban power grid based on geographic information. Appl. Sci. 2018, 8, 1491. [Google Scholar] [CrossRef] [Green Version]
  42. Saaty, R.W. The analytic hierarchy process—What it is and how it is used. Math. Model. 1987, 9, 161–176. [Google Scholar] [CrossRef] [Green Version]
  43. Shannon, C.E. A mathematical theory of communication. Bell. Syst. Tech. J. 1948, 27, 379–423. [Google Scholar] [CrossRef] [Green Version]
  44. Jiang, Y.H.; Fang, M.S.; Liu, Z.Q.; Wang, W.J. Comprehensive evaluation of power quality based on an improved TOPSIS method considering the correlation between indices. Appl. Sci. 2019, 9, 3603. [Google Scholar] [CrossRef] [Green Version]
  45. CCCC Highway Consultants CO., Ltd. General Specifications for Design of Highway Bridges and Culverts; Ministry of Communications of the People’s Republic of China: Beijing, China, 2015. (In Chinese) [Google Scholar]
  46. CCCC Highway Consultants CO., Ltd. Specifications for Design of Highway Reinforced Concrete and Prestressed Concrete Bridges and Culverts; Ministry of Communications of the People’s Republic of China: Beijing, China, 2018. (In Chinese) [Google Scholar]
  47. Lee, T.W.; Kwak, B.M. A reliability–based optimal design using advanced first order second moment method. Mech. Based. Des. Struct. 1987, 15, 523–542. [Google Scholar] [CrossRef]
Figure 1. The flowchart of a system reliability evaluation that considers multiple failure criteria. AHP: Analytic hierarchy process.
Applsci 10 01399 g001
Figure 2. Multiple-component series system.
Applsci 10 01399 g002
Figure 3. Series-parallel system composed of multiple sub-parallel systems (sub-parallel system with two components).
Applsci 10 01399 g003
Figure 4. Series-parallel system composed of multiple sub-parallel systems (sub-parallel system with three components).
Applsci 10 01399 g004
Figure 5. The hierarchical mode of system reliability evaluation.
Applsci 10 01399 g005
Figure 6. Cross-section for the case bridge (unit: m).
Applsci 10 01399 g006
Table 1. Summary of the adopted Archimedean copulas.
CopulaCopula Function C ( u 1 , u 2 , , u d | θ ) Generator Function φ ( t ) Range of θ
Clayton [ ( i = 1 d u i θ ) d + 1 ] 1 θ ( t θ 1 ) ( 0 , + )
Gumbel exp { [ i = 1 d ( ln u i ) θ ] 1 / θ } ( ln t ) θ [ 1 , + )
Frank 1 θ ln [ 1 + i = 1 d e θ u i 1 ( e θ 1 ) d 1 ] ln e θ t 1 e θ 1 ( , + ) \ { 0 }
Table 2. The random consistency index (RI) [42].
n12345678910
RI000.580.91.121.241.321.411.451.49
Table 3. Statistical parameters of the random variables [20].
Slab Segment NumberResistance R Dead Load Effect G Live Load Effect Q
Mean
(kN·m)
Standard Deviation
(kN·m)
Mean
(kN·m)
Standard Deviation
(kN·m)
Mean
(kN·m)
Standard Deviation
(kN·m)
1796.0491.783212.869.6885.4212.71
2796.0491.783221.799.6896.4214.35
3796.0491.783223.919.68116.817.38
4796.0491.783230.749.68144.421.49
5796.0491.783260.699.68180.926.92
6796.0491.783230.749.68144.421.49
7796.0491.783223.919.68116.817.38
8796.0491.783221.799.6896.4214.35
9796.0491.783212.869.6885.4212.71
Table 4. The failure probability of each slab segment.
Slab Segment NumberFailure ProbabilitySlab Segment NumberFailure Probability
14.57 × 10−864.46 × 10⁻⁶
21.56 × 10−776.22 × 10⁻⁷
36.22 × 10−781.56 × 10⁻⁷
44.46 × 10−694.57 × 10⁻⁸
51.14 × 10⁻⁴
Table 5. The copula parameters for the candidate copulas.
Z i Z j Copula Parameters θ
GaussianClaytonGumbelFrank
Z1Z20.97918.1946.75927.58
Z1Z30.97868.0176.80127.85
Z1Z40.97907.8706.81228.00
Z1Z50.97877.7066.77227.19
Z2Z30.97867.6746.82127.46
Z2Z40.97777.5666.59626.34
Z2Z50.97847.7176.84227.24
Z3Z40.97857.7326.75927.28
Z3Z50.97747.5726.51426.10
Z4Z50.97767.8616.54626.26
Table 6. The Akaike information criterion (AIC) and Bayesian information criterion (BIC) values for the candidate copulas.
Z i Z j GaussianClaytonGumbelFrank
AICBICAICBICAICBICAICBIC
Z1Z2−3172.172−3167.264−2638.153−2633.245−2987.18−2982.272−2894.185−2889.277
Z1Z3−3149.584−3144.676−2601.126−2596.218−2987.19−2982.282−2902.385−2897.477
Z1Z4−3169.802−3164.894−2580.177−2575.269−2998.766−2993.858−2917.606−2912.698
Z1Z5−3153.864−3148.956−2543.111−2538.203−2996.096−2991.189−2867.761−2862.853
Z2Z3−3148.243−3143.335−2532.662−2527.755−3005.002−3000.094−2884.315−2879.408
Z2Z4−3109.616−3104.708−2522.278−2517.37−2949.566−2944.658−2819.904−2814.996
Z2Z5−3142.166−3137.258−2540.273−2535.365−3010.377−3005.469−2867.096−2862.188
Z3Z4−3146.562−3141.654−2543.441−2538.533−2992.757−2987.849−2873.682−2868.774
Z3Z5−3093.642−3088.734−2522.063−2517.155−2923.267−2918.359−2803.811−2798.903
Z4Z5−3103.555−3098.648−2574.042−2569.134−2932.939−2928.031−2815.509−2810.602
Table 7. The joint failure probability of each pair of failure modes based on a Gaussian copula.
Z i Z j Joint Failure Probability P f Z i Z j Joint Failure Probability P f
Z1Z23.993 × 10−8Z2Z41.558 × 10−7
Z1Z34.522 × 10−8Z2Z51.560 × 10−7
Z1Z44.570 × 10−8Z3Z46.073 × 10−7
Z1Z54.570 × 10−8Z3Z56.220 × 10−7
Z2Z31.418 × 10−7Z4Z54.459 × 10−6
Table 8. The copula parameters for the candidate copulas.
Z i Z j Copula Parameters θ
GaussianClaytonGumbelFrank
Z1Z20.97908.1946.75927.58
Z2Z30.97867.6746.82127.46
Z3Z40.97857.7326.75927.28
Z4Z50.97767.8616.54626.26
Z5Z60.97857.9206.77827.33
Z6Z70.97797.4326.78027.00
Z7Z80.97787.6906.74627.19
Z8Z90.97897.7506.77827.61
Table 9. The akaike information criterion (AIC) and bayesian information criterion (BIC) values for the candidate copulas.
Z i Z j GaussianClaytonGumbelFrank
AICBICAICBICAICBICAICBIC
Z1Z2−3172.17−3167.264−2638.153−2633.245−2987.18−2982.272−2894.185−2889.277
Z2Z3−3148.243−3143.335−2532.662−2527.755−3005.002−3000.094−2884.315−2879.408
Z3Z4−3146.562−3141.654−2543.441−2538.533−2992.757−2987.849−2873.682−2868.774
Z4Z5−3103.555−3098.648−2574.042−2569.134−2932.939−2928.031−2815.509−2810.602
Z5Z6−3145.400−3140.492−2584.306−2579.398−2985.515−2980.608−2872.403−2867.496
Z6Z7−3116.444−3111.536−2482.662−2477.754−2993.222−2988.314−2854.561−2849.653
Z7Z8−3112.185−3107.277−2526.177−2521.269−2985.223−2980.315−2858.875−2853.967
Z8Z9−3161.455−3156.548−2549.842−2544.934−3001.664−2996.757−2898.705−2893.797
Table 10. The joint failure probability of each pair of failure modes based on a Gaussian copula.
Z i Z j Joint Failure Probability P f Z i Z j Joint Failure Probability P f
Z1Z23.989 × 10−8Z5Z64.459 × 10−6
Z2Z31.418 × 10−7Z6Z76.060 × 10−7
Z3Z46.075 × 10−7Z7Z81.408 × 10−7
Z4Z54.459 × 10−6Z8Z93.985 × 10−8
Table 11. The copula parameters for the candidate copulas.
Z i Z j Z k Copula Parameters θ
GaussianClaytonGumbelFrank
Z1Z2Z30.97877.3566.46226.21
Z2Z3Z40.97837.1216.43425.74
Z3Z4Z50.97787.2336.36725.33
Z4Z5Z60.97807.2666.43725.63
Z5Z6Z70.97807.1316.43125.32
Z6Z7Z80.97757.0036.40825.38
Z7Z8Z90.97837.2076.48825.88
Table 12. The AIC and BIC values for the candidate copulas.
Z i Z j Z k GaussianClaytonGumbelFrank
AICBICAICBICAICBICAICBIC
Z1Z2Z3−6595.721−6590.813−5367.287−5362.379−6181.589−6176.681−6011.271−6006.363
Z2Z3Z4−6551.639−6546.731−5266.967−5262.06−6184.301−6179.393−5952.425−5947.517
Z3Z4Z5−6510.834−6505.926−5310.706−5305.798−6142.439−6137.531−5903.524−5898.616
Z4Z5Z6−6528.413−6523.505−5328.672−5323.764−6172.587−6167.679−5936.418−5931.51
Z5Z6Z7−6527.538−6522.631−5265.767−5260.859−6179.003−6174.095−5903.251−5898.343
Z6Z7Z8−6481.984−6477.076−5216.417−5211.509−6153.824−6148.916−5892.996−5888.088
Z7Z8Z9−6551.996−6547.088−5298.768−5293.860−6218.126−6213.218−5955.734−5950.826
Table 13. The joint failure probability of each group of failure modes based on a Gaussian copula.
Z i Z j Z k Joint Failure Probability P f Z i Z j Z k Joint Failure Probability P f
Z1Z2Z33.961 × 10−8Z5Z6Z76.062 × 10−7
Z2Z3Z41.414 × 10−7Z6Z7Z81.404 × 10−7
Z3Z4Z56.058 × 10−7Z7Z8Z93.943 × 10−8
Z4Z5Z62.783 × 10−6
Table 14. The evaluation indexes of bridge system reliability and the weights of indexes.
Index LayerSubjective WeightObjective WeightComprehensive Weight
Failure Criterion I0.36150.41000.4588
Failure Criterion II0.38490.19190.2287
Failure Criterion Ш0.25360.39810.3125

