Article

Characterization and Defect Analysis of Machined Regions in Al-SiC Metal Matrix Composites Using an Abrasive Water Jet Machining Process

by
Pedro F. Mayuet Ares
*,
Lucía Rodríguez-Parada
,
Álvaro Gómez-Parra
and
Moises Batista Ponce
Department of Mechanical Engineering & Industrial Design, Faculty of Engineering, University of Cádiz, Av. Universidad de Cádiz 10, E-11519 Puerto Real-Cádiz, Spain
*
Author to whom correspondence should be addressed.
Submission received: 31 December 2019 / Revised: 11 February 2020 / Accepted: 17 February 2020 / Published: 23 February 2020

Abstract

:
Metal matrix composite (MMC) materials are increasingly used in industrial sectors such as energy, structural, aerospace, and automotive. This is due to the improvement of properties by the addition of reinforcements. Thus, it is possible to obtain properties of higher strength, better rigidity, controlled thermal expansion, and elevated wear resistance. However, due to the extreme hardness achieved during their manufacture, these composites pose a challenge to the conventional machining industry due to the rapid deterioration experienced by cutting tools. This article therefore proposes the use of an unconventional machining method that is becoming increasingly widely used: abrasive water jet cutting. This process is characterized by high production rates, absence of wear, and environmental friendliness, among other advantages. Experimental tests were carried out in order to analyze results that minimize the formation of defects in the machining of metal matrix composite consisting of aluminium matrix with silicon carbide (Al-SiC MMC). To this end, results were analyzed using Scanning Optical and Electron Microscope (SOM/SEM) techniques, the taper angle was calculated, and areas with different surface quality were detected by measuring the roughness.

1. Introduction

The transport sector is one of the main contributors to environmental pollution, second only to the energy sector. Growing concern for the environment and strict pollution control regulations have forced transport manufacturers to develop materials and manufacturing technologies to reduce pollution [1]. In this context, composite materials with excellent properties/weight ratio have made it possible for vehicles to reduce their weight and, thus, their consumption and emissions.
Composite materials have long been generally used in the transport sector as substitutes for more traditional metal materials such as steel. Therefore, 21% of the general consumption of these materials is precisely for transport, mainly by air and land. Furthermore, the general trend is for the consumption of these materials to grow by more than 8% by 2025 [1].
The most commonly used compounds are polymeric matrix materials, such as Carbon-Fiber-Reinforced Polymer (CFRP) or Glass-Fiber-Reinforced Polymer (GFRP). However, in the transportation industry, a significant growth in the consumption of metal matrix composite (MMC) is expected because they offer important characteristics that cannot be obtained by other compounds. This growth is estimated to be around 30% [2]. For example, in a sector such as the automotive industry, polymer matrix composite materials are the most used and will continue to be so in the coming years. However, the growth in percentage of MMCs is expected to double by 2025 [3]. This is mainly due to the search for lighter alternatives to conventional metallic materials used in critical structural areas and in the powertrain to reduce consumption. Therefore, it is expected that while the outer areas will be produced with CFRP, the structural areas of the chassis will be produced with MCC [4].
The other sectors linked to the transport industry are following the same trend, since by adding reinforcements to a metal matrix it is possible to obtain a material 30%–40% more rigid than the matrix material. Thus, in addition to the improvement of mechanical properties, other properties such as high temperature resistance, fire resistance, control of thermal and electrical conductivity, or improved radiation resistance are achieved [1]. Therefore, it is an ideal material for industries that require lightweight materials with excellent properties.
On the other hand, there are many types of MMC depending on the matrix and the reinforcement. The most interesting industrial MMCs contain an aluminium matrix [4]. Their demand with respect to the other MMCs is more than 30%, being also the most consumed by the transport industry [5]. The reinforcements are usually ceramic and discontinuous, in the form of particles or short fibers. The high configuration capacity of polymeric composite materials is also transferable to the MMCs, where it is possible to control the quantity and type of reinforcements in order to design their mechanical and thermal properties [6].
These excellent characteristics are responsible for the difficulties that arise during the shaping of these materials in processes such as machining that attempt to adjust the part to the final geometry [6]. The conventional machining of these materials is tremendously complex due to the abrasive conditions of the material that lead in relatively short times to the deterioration of the tool. This was the case in the study by Chaudhary et al. [7] where, in spite of using tools with Poly-Crystalline Diamond (PCD), the result of the drilling process was not adequate due to the rapid deterioration of the tool. Despite this, the roughness (Ra) obtained was about 0.8 µm. Something similar happened to Ramasubramanian et al. [8], where in the turning process of an Al-SiC MMC, tools with advanced coatings such as microcrystalline diamond (MCD) or nanocrystalline diamond (NCD) had a life of about two minutes, and others with simpler coatings, like TiAlN, suffered catastrophic breakage.
Therefore, the most recent research is based on the use of nonconventional machining technologies where the mechanical and thermal properties of these materials do not adversely affect the forming process. This is the case in laser cutting. There have been several investigations concerning the use of this technology with MMCs. However, the thermal properties of MMCs influence the process negatively. Thus, Sharma and Kumar [9] determined that in an Al-SiC MMC, in spite of being viable and obtaining a roughness (Ra) of around 1.3 µm with reduced shape defects, behavior appeared during the fusion of the material which could generate defects and even cause microfractures.
Likewise, there have been studies on the use of the electro-erosion process, which is presented as a viable alternative for the forming of these materials [10]. However, as this process is generally slow, and its main attraction is to obtain good qualities, it should be combined with another process to improve performance, such as abrasive water jet machining (AWJM) [10,11]. This unconventional process meets the necessary conditions for cutting in terms of time ratios, wear reduction, and absence of thermal defects. Thus, although waterjet cutting is an increasingly widely used technology, there are no optimal machining parameters for MMCs that reduce the occurrence of defects and improve the dimensional and geometric quality of the machined component [12].
Defects in AWJM are mainly due to distortions in taper and surface quality and are directly related to parameters such as Transverse Feed Rate (TFR), Stand-Off Distance (SOD), Water Pressure (WP), and Abrasive Mass Flow Rate (AMFR), as well as material conditions and material thickness. These defects produce a negative impact on the surface integrity of the parts obtained due to the progressive growth of roughness as the material thickness increases and the appearance of striation marks due to jet delay when it lacks kinetic energy [13]. As a result, up to three possible cutting regions can be obtained [12,14], as shown in Figure 1:
-
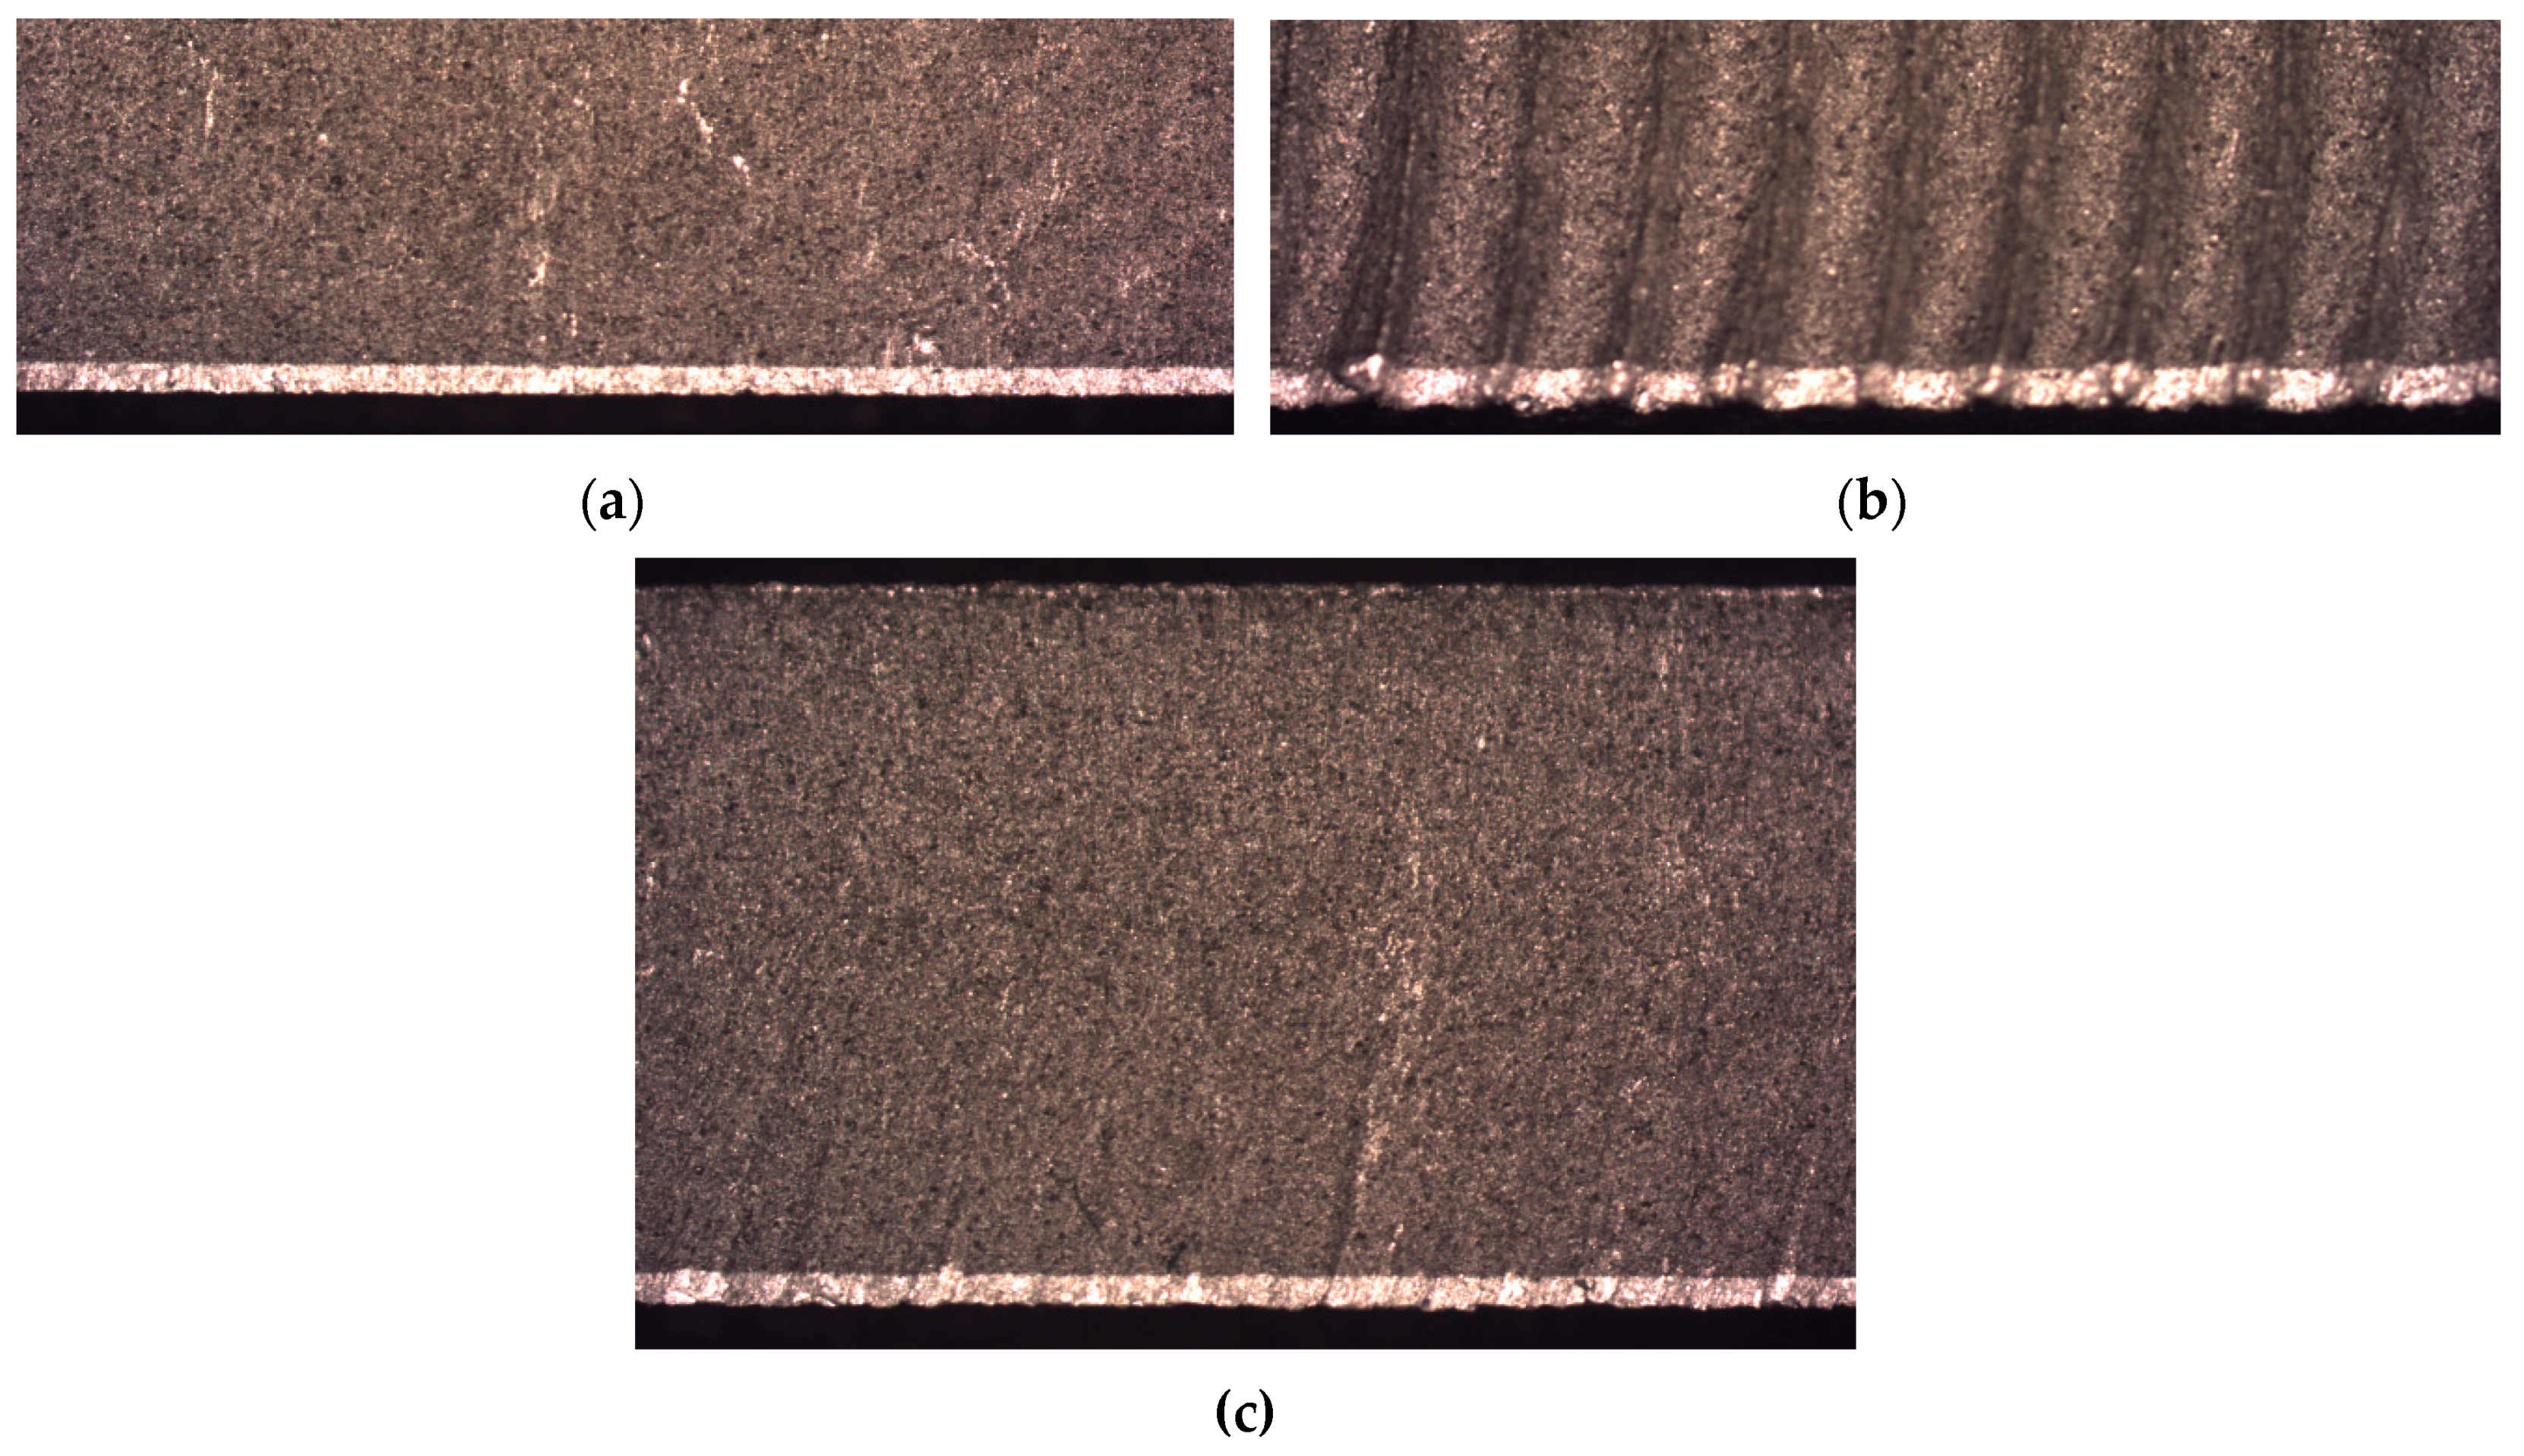
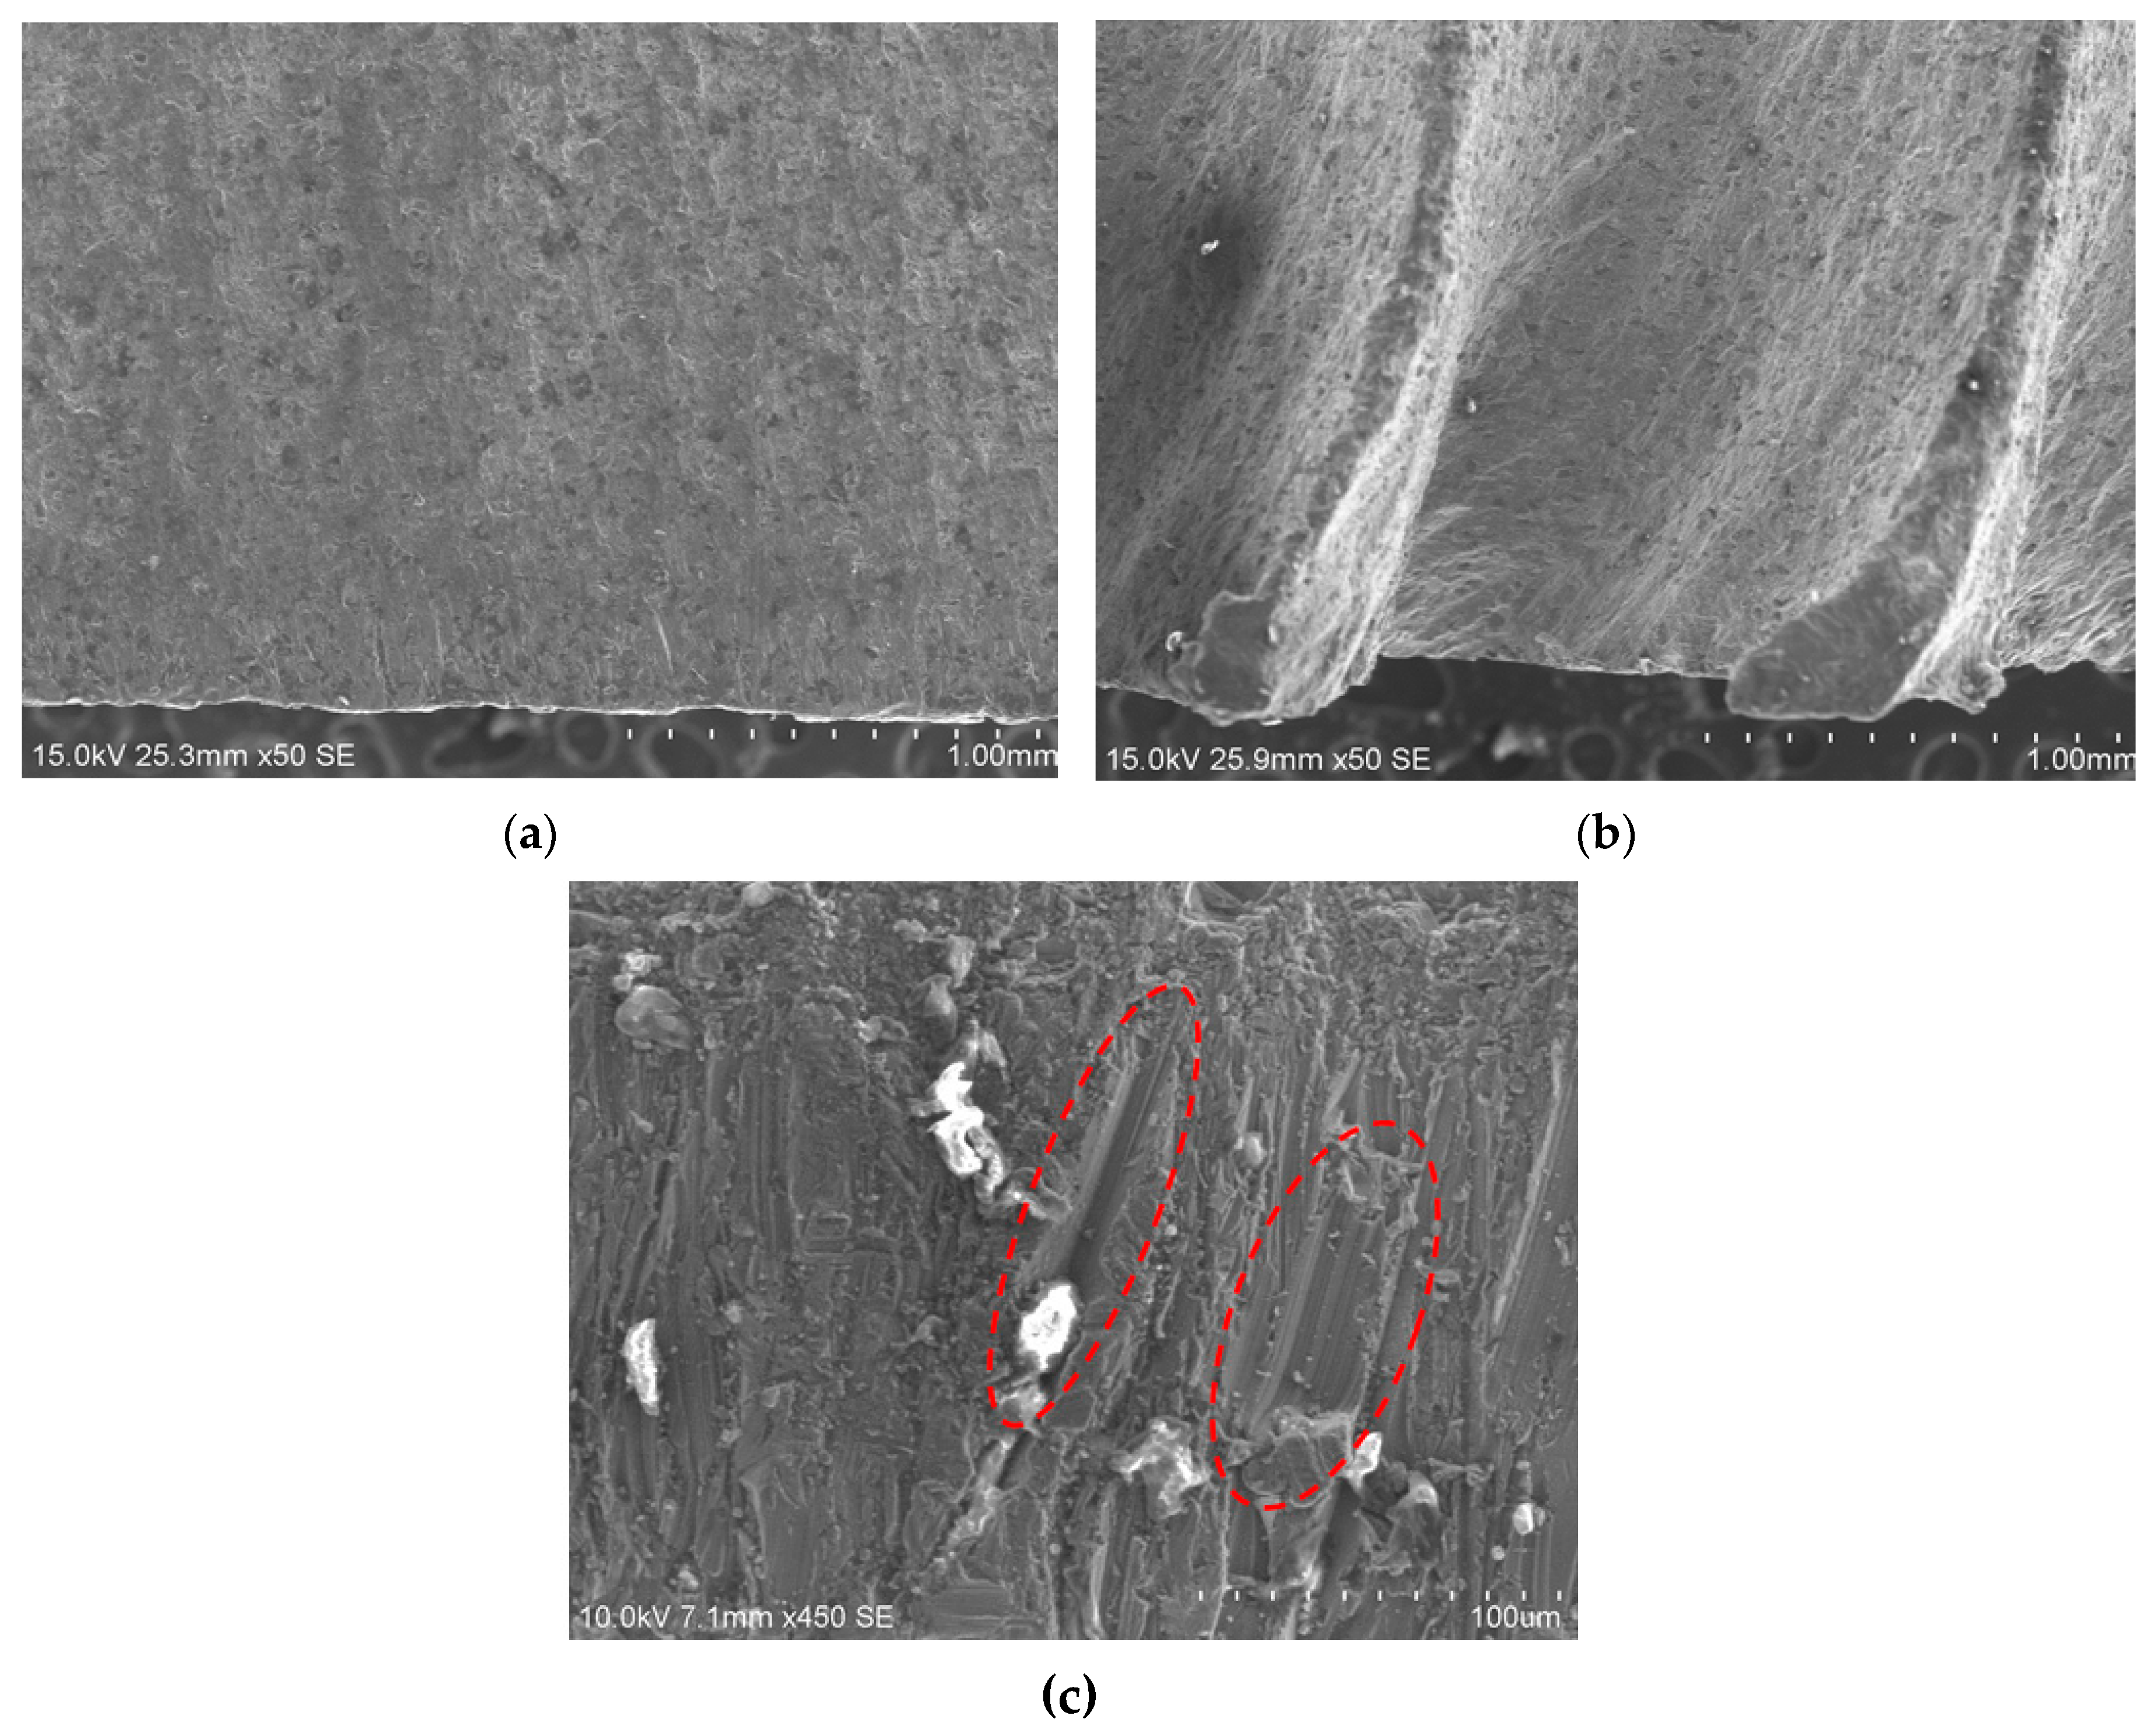
Initial Damage Region (IDR). The impact of the jet deforms the surface of the material by the successive impact of particles.
-
Smooth Cutting Region (SCR). The jet still has sufficient kinetic energy and the roughness obtained is reduced.
-
Rough Cutting Region (RCR). Characterized by the detection of marks caused by jet delay at the output of the material. This is the area where the worst roughness results are obtained.
In this article, the main objective is to minimize the formation of defects in MMC cutting through AWJM by controlling TFR, WP, and AMFR. To this end, up to 27 straight cuts were made while varying levels of parameters in order to identify their influence on the formation of the taper angle and the different cutting regions (IDR, SCR, and RCR). Macrographs were taken using stereoscopic optical microscopy (SOM) to measure the taper angle. Additionally, roughness measurements were carried out in different areas to analyze surface quality (Zone 1, Zone 2, and Zone 3). Finally, the results were analyzed through ANOVA and SEM in order to evaluate the influence of each test.

2. Materials and Methods

2.1. Material and Machining Process

The metal matrix composite material was A356.2 SiC 63 Cp (CPS Technologies Corp, MA, USA), with composition shown in Table 1. To determine the composition of the alloy, the website "MatWeb" (MatWeb, Blacksburg, VA, USA) was used [15].
To carry out this experiment, two plates of A356.2 SiC 63 Cp alloy were used. The size of each one was 180 × 115 × 5.5 mm. The machining process was performed via AWJM, that this consisted of the production of 27 cuts spaced 6 mm apart, each with a total length of 60 mm. For this purpose, a TCI Cutting (TCI cutting, Valencia, Spain) waterjet machine was employed. In Table 2, the cutting parameters used in the experimental methodology are shown.
Moreover, during the machining process, the parameters shown in Table 3 were kept constant.
Finally, in order to study the penetration of the jet into the material and the deviations generated at the outlet of the material, the machining process was recorded using a Redlake Motion Pro X4 high-speed camera with a capture frequency of up to 8000 frames per second (fps) (Del Imaging Systems LLC, Swiftwater Circle Woodsville, NH, USA).

2.2. Test Evaluation

Surface integrity was evaluated in terms of geometrical properties. From the point of view of micro-geometrical properties, the roughness average (Ra) was measured. For its part, the kerf taper angle (T) was the variable chosen for the evaluation of macro-geometrical properties. For measuring roughness profiles, the following methodology was taken into account. The cutting area was divided into three zones, where Figure 2 shows the distance at which each measurement was taken.
In this way, all micro-geometrical changes that take place during the cutting process were considered (Figure 2).
To carry out the measurements, a Mahr Pertometer Concept PGK 120 roughness tester (Mahr, Göttingen, Germany) was employed. In addition, in the evaluation of the micro-geometrical properties, an optical inspection was also carried out via the use of a scanning electronic microscope (SEM). In this case, a Hitachi SU 1510 (Hitachi, Tokio, Japan) microscope was employed. Moreover, analysis by SOM techniques was performed using a SMZ-800 Nikon microscope (Nikon, Tokyo, Japan) which had a 5-megapixel Optikam B5 optical camera (Optika, Ponteranica, Italy).
Parameter T, which identifies the kerf taper angle, was calculated using the following equation, Equation (1) [12]:
T = t a n 1 ( w t   w b 2 t ) .
In this equation, and as can be seen in Figure 2, Wt is the width of the slot produced by the very first impact of the water jet, while Wb is the width generated by the outlet of the jet. To measure these variables (Wt, Wb) in the machined pieces, the free software Image J was used. Figure 3 shows an example of measurement. The procedure followed before carrying out the measurement consisted of a previous image calibration process to determine the pixel/mm ratio. In this way, all the measurements made directly on the images returned a correct result. In addition, by processing the image, the area damaged by erosion caused by loss of coherence of the jet was identified (see Figure 3).

2.3. Analysis of Results

Analysis of the results was carried out by following three main steps. The first one consisted of identifying the trends between the cutting parameters and the variables studied. The second step was based on quantifying the weight of each of the cutting parameters. To do this, an analysis of variance (ANOVA) was carried out with a 95% confidence interval. Finally, contour graphs were produced taking into account the results obtained in the ANOVA study. The statistical analysis performed was carried out using Minitab statistical software.

3. Results and Discussion

3.1. Global Analysis of Results

Table 4 shows the measurement results obtained for T and the different roughness zones.

3.1.1. Taper Analysis

The data for Tests 21, 24, and 27 were not measured due to the high deviations obtained at the cutting output, as shown in the example of Test 21 in Figure 4a. This phenomenon occurred as a result of the combination of low pressure levels together with high feed rates. To characterize the formation of the geometry at the exit of the piece, different frames were captured from the high-speed video. Specifically, Figure 4b shows the capture of the piercing when it passes through the material. Subsequently, Figure 4c,d shows two frames of when the jet is machining the groove. The images show the change in direction in the jet deflection and are attributed to the difficulty experienced when cutting the material. Thus, the combination of parameters and the hardness of the reinforced compound caused a zig-zag effect in the jet that also produced the characteristic striation marks at the exit of the cut [14].
As for the results obtained, Figure 5 shows a graph of the interaction between parameter levels for the variable T. The data reflect that there is not a high variation in the taper angle since all the results are between values of 1° and 2°. However, trends can be observed according to the levels of parameters used. Thus, low T results are mainly obtained when WP is high (500 MPa) and TFR is low (100 mm/min). This is due to the fact that under high pressure conditions together with low feed rates, the jet has higher kinetic energy and, therefore, a higher power of penetration into the material. As these two parameters vary, most of the dispersion of results occurs, as shown in the slope of the graphs relating these parameters. It should be noted that the influence of WP and TFR on T formation is in good agreement with what has been previously determined by different authors in various materials [16,17,18]. The AMFR parameter has a minor influence compared to the other parameters. This phenomenon can also be seen in the slope of the graph relating AMFR to WP and TFR. In this case, average values of abrasive (340 g/min) imply a slight decrease in T. Both excess and defective abrasive imply a loss of efficiency during cutting. High rates of AMFR cause abrasive particles to collide with each other before entering the material, with consequent loss of energy and deviation of speed and trajectory. On the other hand, reduced rates cause the jet to be unable to erode the surface of the material or penetrate the material adequately, favoring the formation of defects or even cuts that do not penetrate the material completely.

3.1.2. Roughness Analysis

Figure 6 shows the roughness results measured in Zone 1. The highest results obtained in the measuring process reach values of around 35 µm when low pressures and high feed rates are used. This is again the case for Tests 21, 24, and 27. For all other tests, combinations of parameters result in values between 3 µm and 9 µm. Specifically, the lowest values of roughness are obtained when TFR takes low levels, this parameter being the most influential in the cutting process in this region, followed by WP. AMFR does not show an influence on the process, although it is true that low and medium abrasive rates seem to provide slightly lower roughness.
The data measured in Zone 2 are similar, although slightly lower, to those obtained in Zone 1 (Figure 7). This reflects that the damage produced in the initial region is reduced compared to that in other materials due to the high hardness of the composite. In order to analyze differences between the two zones, the cuts were analyzed by microscopy.
Figure 8 shows pictures taken via SOM/SEM techniques from Tests 7 and 21 in order to compare measurement areas for tests with parameters of opposite levels. Figure 8a,b shows how there are macro-geometrical differences caused by jet deflection, but no apparent deformation defects caused by jet impact at the material inlet. SEM analysis in Figure 8c,d reveals that localized areas appear at the material inlet where localized material detachments are distinguished, as well as IDR identified with Zone 1. In order to obtain more information about this phenomenon, Figure 9 shows SEM images with ×10 magnification.
In Figure 9, two types of defects can be distinguished at the entry of the material. Figure 9a shows embedded particles that have deformed the surface of the material. On the other hand, Figure 9b shows that in some locations there are material detachments as a result of the loss of reinforcement particles and the successive impact of abrasive particles. Indeed, the continuous impact of particles causes hardening by plastic deformation. This implies that the material becomes brittle as the impact of the jet continues, producing an increase in dislocations [6,19,20]. This phenomenon, together with the high quantity of SiC particles, produces detachment of the material in certain locations. In addition, it is important to point out that the detached material drags pieces of particles, as shown in Figure 9b.
Figure 10 shows the data measured in Zone 3, where it can be seen that the feed rate is the most influential parameter. In this region, the highest values of roughness are found due to the appearance of the jet delay phenomenon at the exit of the cut as TFR increases. This is related to the appearance of RCR. As a result, it is possible to find different cutting regions as a function of feed speed with roughness values up to 50 µm. The jet pressure also influences the formation of the jet lag phenomenon. This is especially the case when the WP level is low, as this is where the highest values of roughness are found due to the loss of jet penetration energy. However, this trend changes as WP levels of 380 MPa and 500 MPa are reached, where some stability of roughness is achieved due to the increased kinetic energy of the jet. On the other hand, AMFR seems to be more influential than in the previous areas, showing a slight increase in surface quality as the abrasive rate increases.
Figure 11a–c shows SOM images of Tests 7, 21, and 12, respectively. In Test 7, it can be seen that there is no jet delay due to the high pressure and low feed rate. Therefore, the roughness results for this speed range are similar to those obtained for the rest of the zones. On the contrary, for Test 21, it can be seen that in the whole profile of the cut, striation marks appear; therefore, SCR is not generated. This is due to the use of low pressure and a high feed rate. Finally, for Test 12, it can be seen that there are both areas—SCR and RCR—due to the combination of parameters. This shows the influence of the different parameter levels and the need to limit their influence on the formation of different cutting regions.
As for SEM analysis, Figure 12a,b shows the images of Test 7 and 21 analyzed above in order to observe the formation of the striation phenomenon. Specifically, in Test 21, the formation of jet delay marks is observed, accompanied by material drag at the jet exit. In addition, it is shown how, as the jet penetrates the material, the striation becomes deeper. This is due to the combined effects of loss of kinetic energy and jet opening at the exit of the cut.
On the other hand, Figure 12c shows how, independently of the cutting parameters used and their influence, separate wear tracks or grooves plowed by individual abrasive grains are observed. The width of these tracks is related to the size of the abrasive particles, although they are not uniform [20]. This lack of uniformity is attributed to the size distribution of abrasive particles as they exit the nozzle and impact on the surface of the material. In addition, it may also be due to the fact that SiC particles are harder than Indian garnet, so they can fracture the abrasive by breaking down the wear grooves [21].

3.2. ANOVA

Table 5 shows the degrees of significance in percentages of the variables as a function of the F-value and the p-value.
Figure 13 shows the main effects graph for each variable. For T (Figure 13a), the parameters that have significance in the process are TFR and WP with F-values of 18.31 and 9.87, respectively. This is shown in the graph where the slope of TFR indicates the degree of influence on the process. In addition, TFR ranges from the lowest to the highest values in the process. WP shows a greater degree of influence on defect formation when the selected pressure is in the range 380–500 MPa, which causes a decrease in the measured taper angle from approximately 1.65° to 1.40°. Finally, AMFR does not seem to show significance in T formation. However, it is observed that the defects are lower for 340 g/min, as determined in the previous section.
As for the analysis of different roughness zones, Figure 13b–d shows the main effects graphs for Zone 1, Zone 2, and Zone 3, respectively. The degree of influence of each parameter is described below.
Zone 1. There are no significant parameters in this area. However, the degree of influence of the factor F on the process was analyzed. Thus, the parameter with the most influence on the formation of roughness in this zone is TFR, followed by WP and AMFR. Indeed, TFR shows an upward trend in the graph, over the range 300–500 mm/min. In this range, there is an average increase of about 8 µm to 20 µm. WP shows variable behavior depending on the selected level. An intermediate level provides a slightly lower roughness than a high level, which means that in roughness formation this parameter loses significance as it reaches a certain limit with sufficient kinetic energy. AMFR seems to have no influence on the process, although an increase in the level of abrasive produces a slight decrease, as predicted in the overall analysis of results.
Zone 2. In this zone, both the influence of parameters and the degree of significance are similar to those in Zone 1, although it should be noted that the roughness experiences a slight average decrease over the process. This phenomenon can be seen in the intermediate line that appears in the graph where the average value obtained is shown, being, in this case, less than 10 µm. The analysis in Section 3.1.2 revealed that IDR exists. However, its size is small due to the high hardness of the material. It is characterized by the localized detachment of small amounts of material, as detected by SEM analysis. Thus, the differences between Zone 1 and Zone 2 are mainly attributed to differences in measurement caused by this defect.
Zone 3. The significant parameter is TFR with an F-value of 14.20. This is shown in the main effects graph with a high slope for the entire range of levels from 100 mm/min to 500 mm/min. WP shows a similar behavior to the above, although it experiences a high rise in roughness due to the loss of kinetic energy of the jet in this area, especially when the pressure used is 250 MPa. The AMFR analysis reflects that the importance of this parameter is higher in this area than in the previous ones, reaching an F-value of 0.81 compared to 0.24 and 0.21 previously. This change of trend is in good agreement with what was found in [16,17] and is mainly due to the loss of penetration capacity of the jet as the material thickness increases, favoring the formation of RCR.

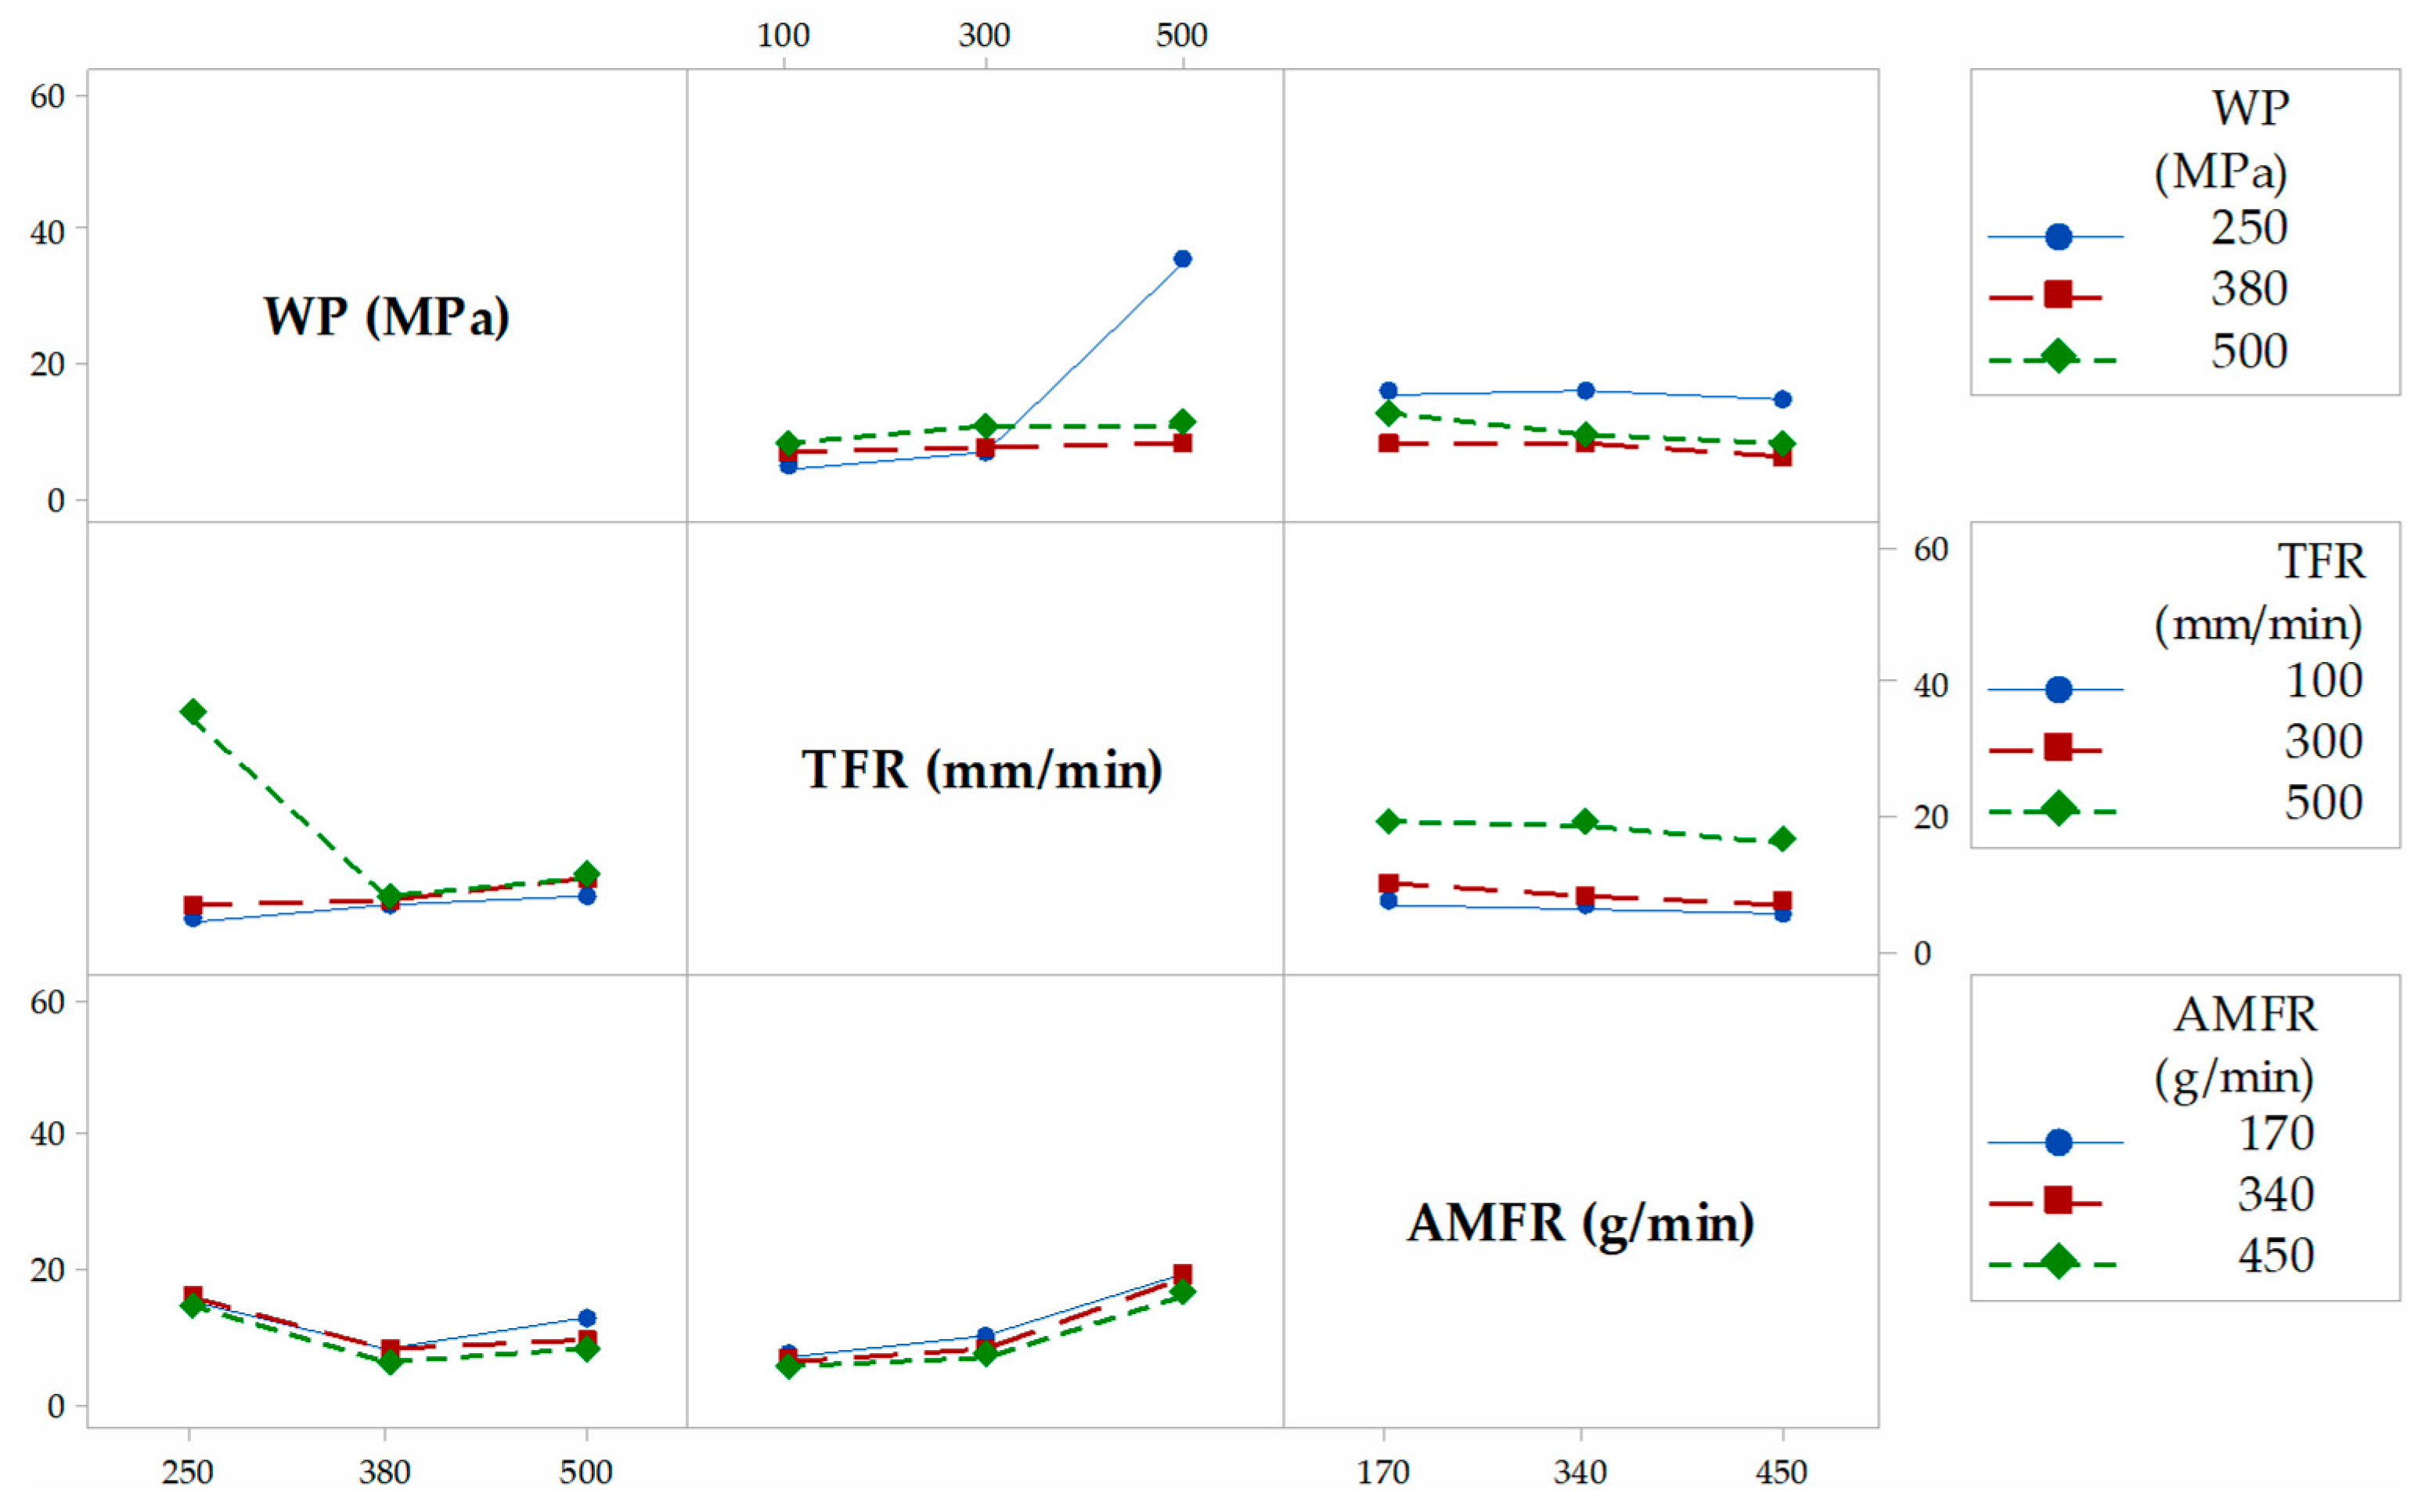
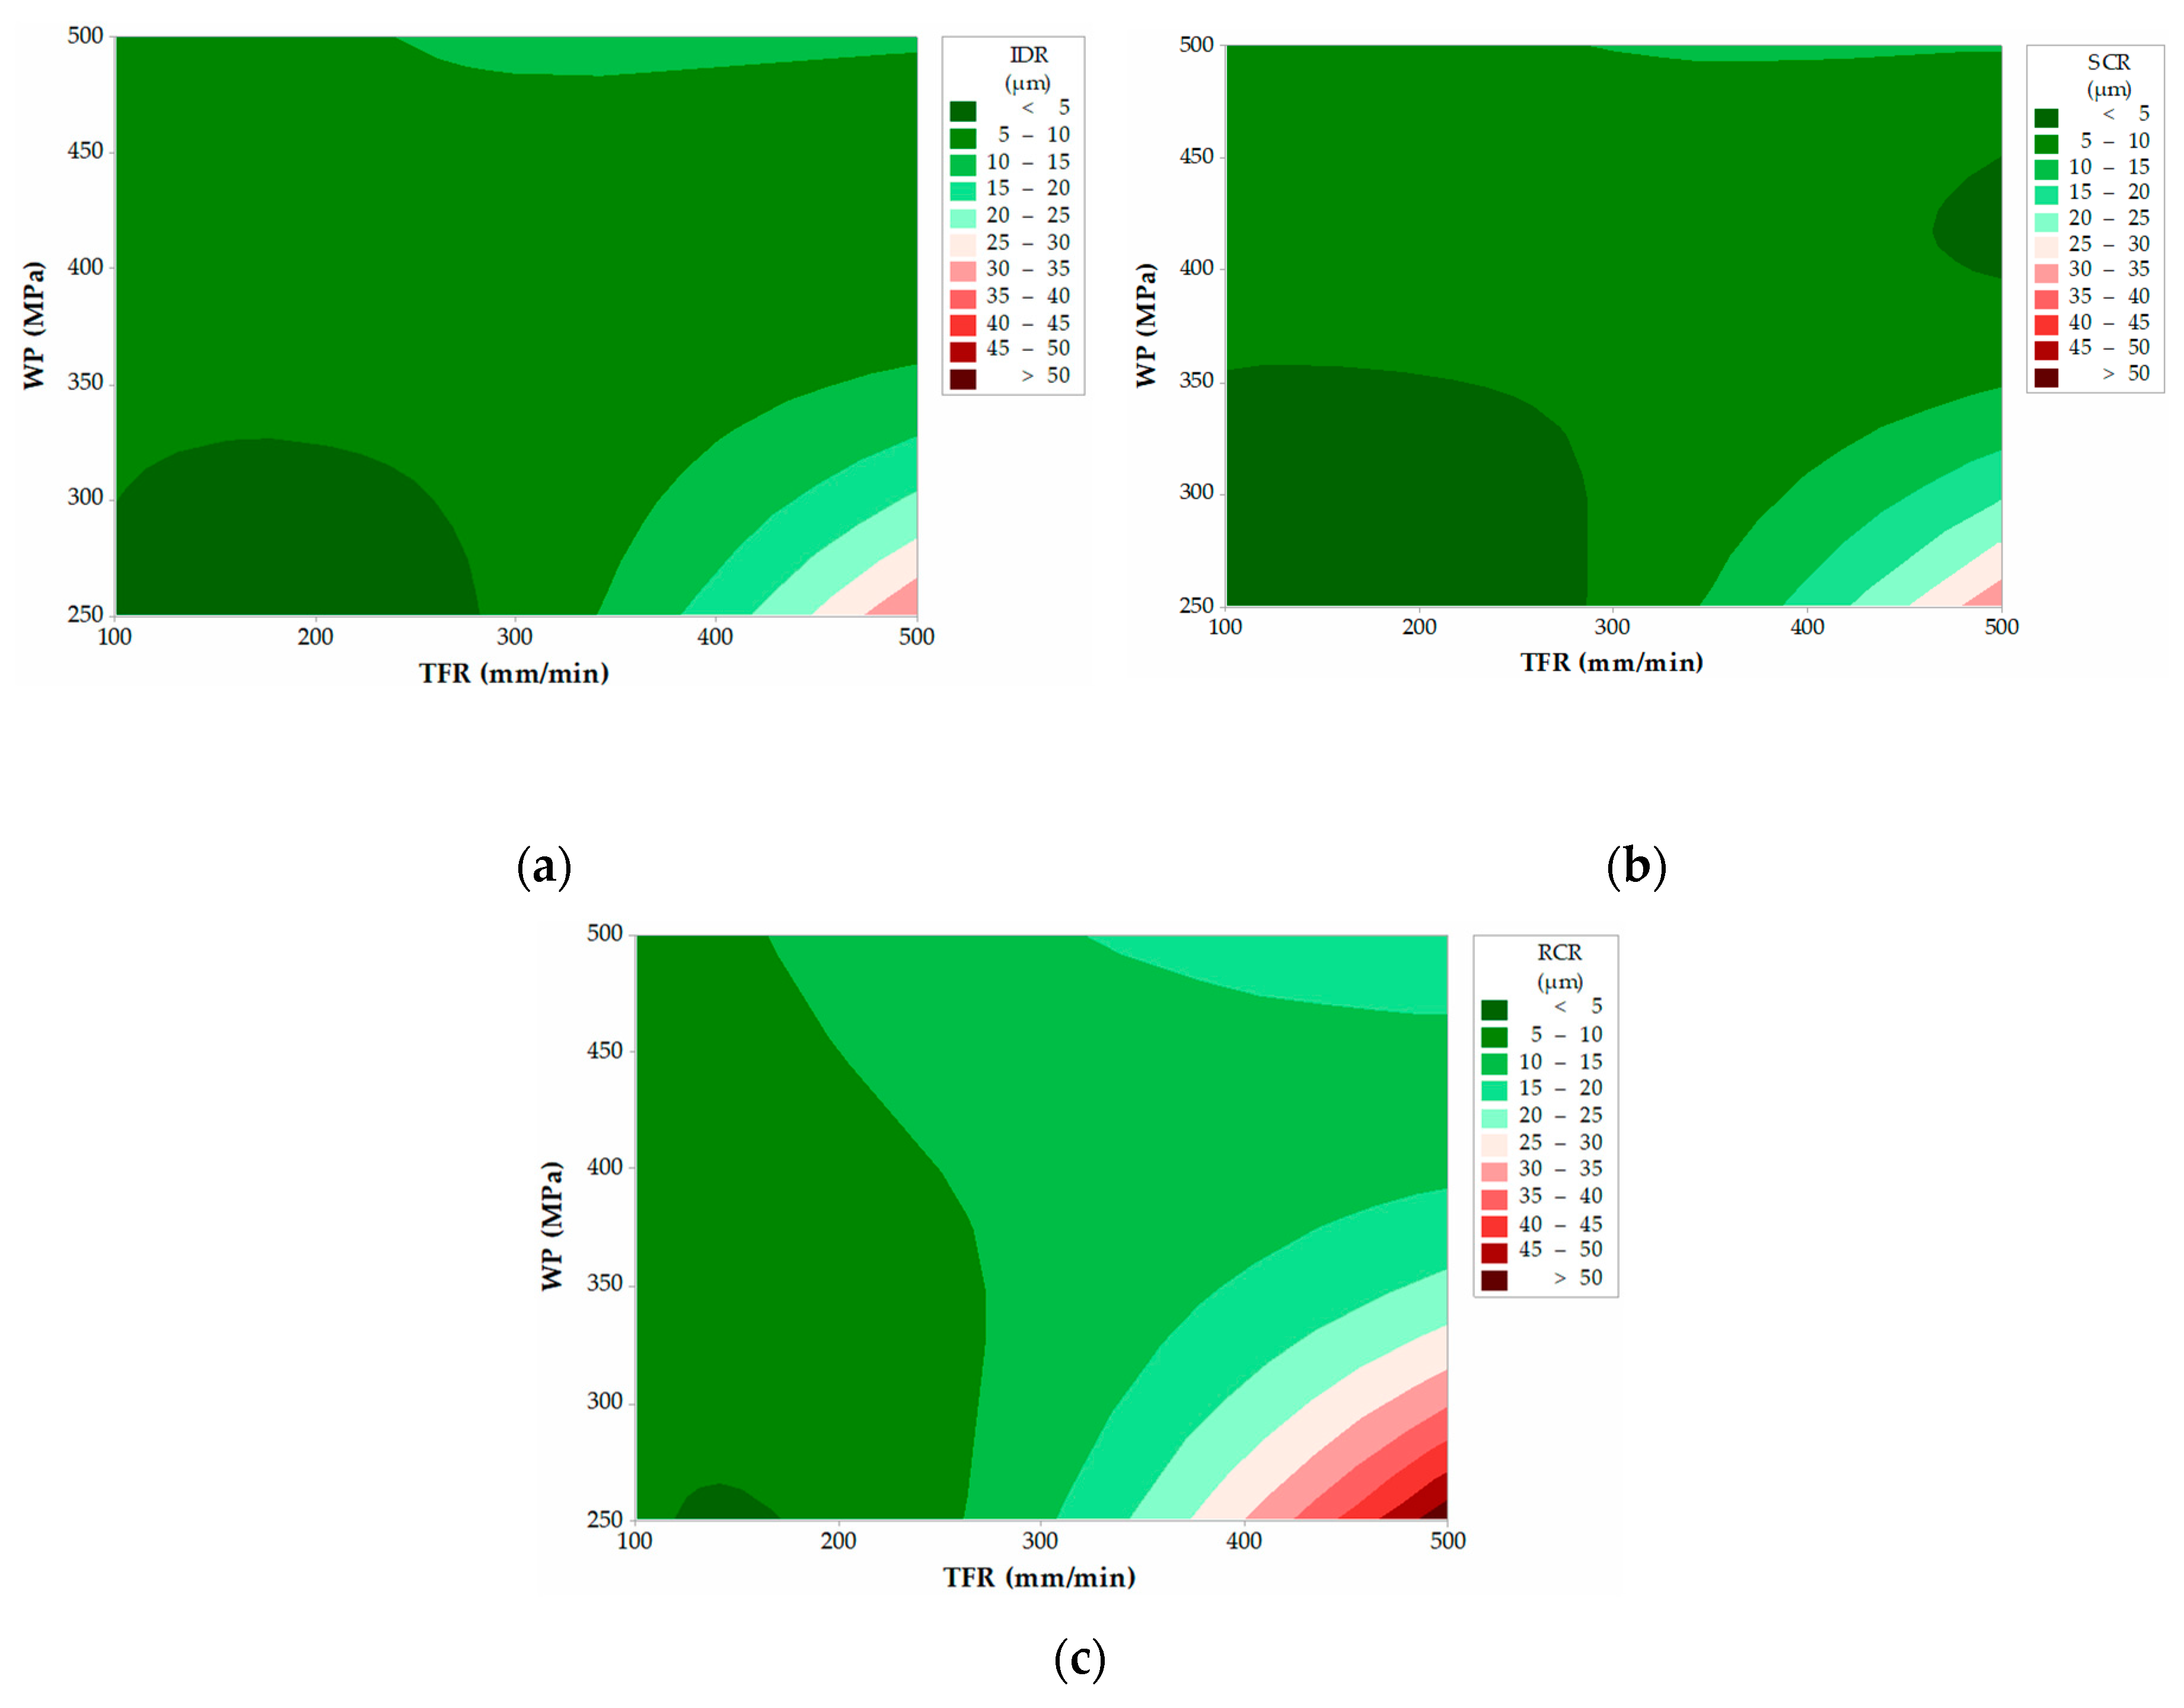
3.3. Analysis of Contour Graphs

Figure 14 shows the contour graph for the variable T as a function of the variables that show significance. Values that minimize defect formation are obtained by selecting high pressure levels and low spindle feed rates. In this way, angles of less than 1.2° are obtained. Also, based on the information obtained in previous sections, it would be more convenient to add intermediate abrasive flows to reduce the angle.
For surface quality analysis, Figure 15a–c shows the contour graphs for Zone 1, Zone 2, and Zone 3, respectively. In this case, as there are no significant parameters, the graphs are presented as a function of the most influential parameters as a function of the F-value. Thus, in all three zones, results were graphed as a function of TFR and WP with the same scaling factor.
The results for the three contour graphs show that there is an area where roughness results below 5 µm are obtained. Specifically, this area comprises the range 100–200 mm/min for TFR and 250–300 MPa for WP. Thus, by selecting low TFR and low and medium WP levels, it is possible to achieve a high surface quality. It should be noted that these parameters must be accompanied by high abrasive flow rates. On the contrary, if high TFR and low WP levels are selected, roughness values above 50 µm are reported. This shows that TFR is the most influential parameter by zones, as shown in Table 5.

4. Conclusions

A study on the influence of the main technological parameters on the formation of defects and roughness zones during abrasive water jet machining of MMC material was carried out. The following conclusions were drawn from the study carried out in relation to T formation:
-
In the evaluation of the taper angle, values between 1° and 2° were obtained. The lowest values of T were obtained using high cutting pressures and low feed rates because these are the significant parameters in defect formation.
-
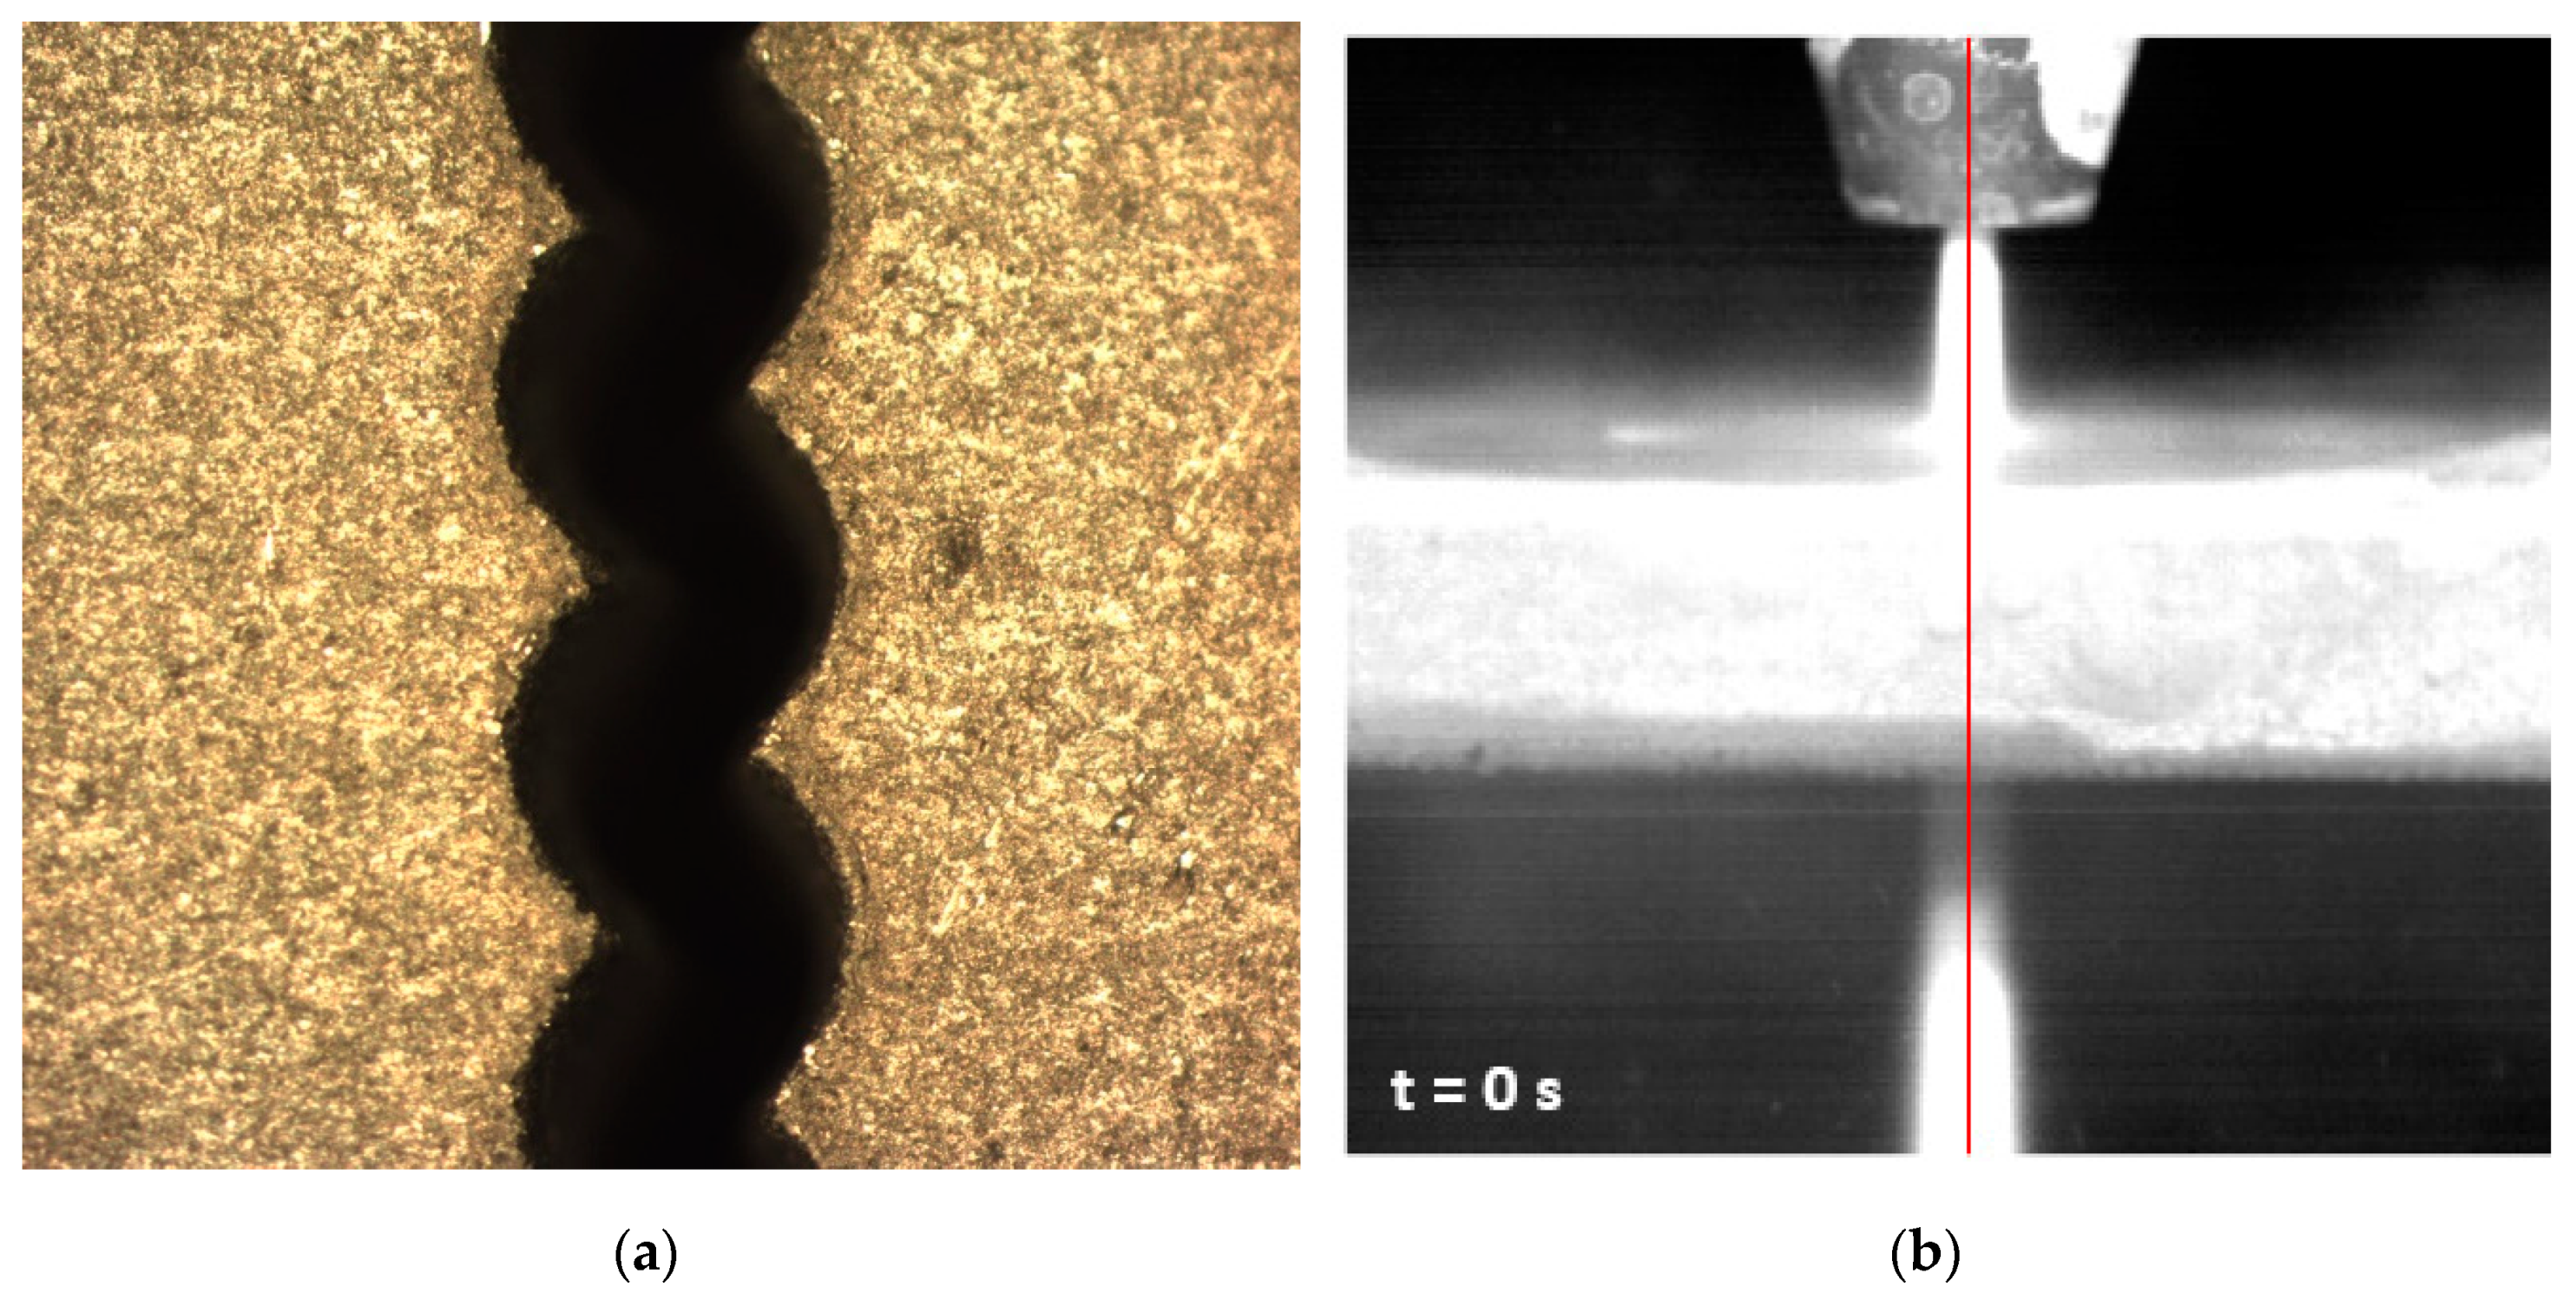
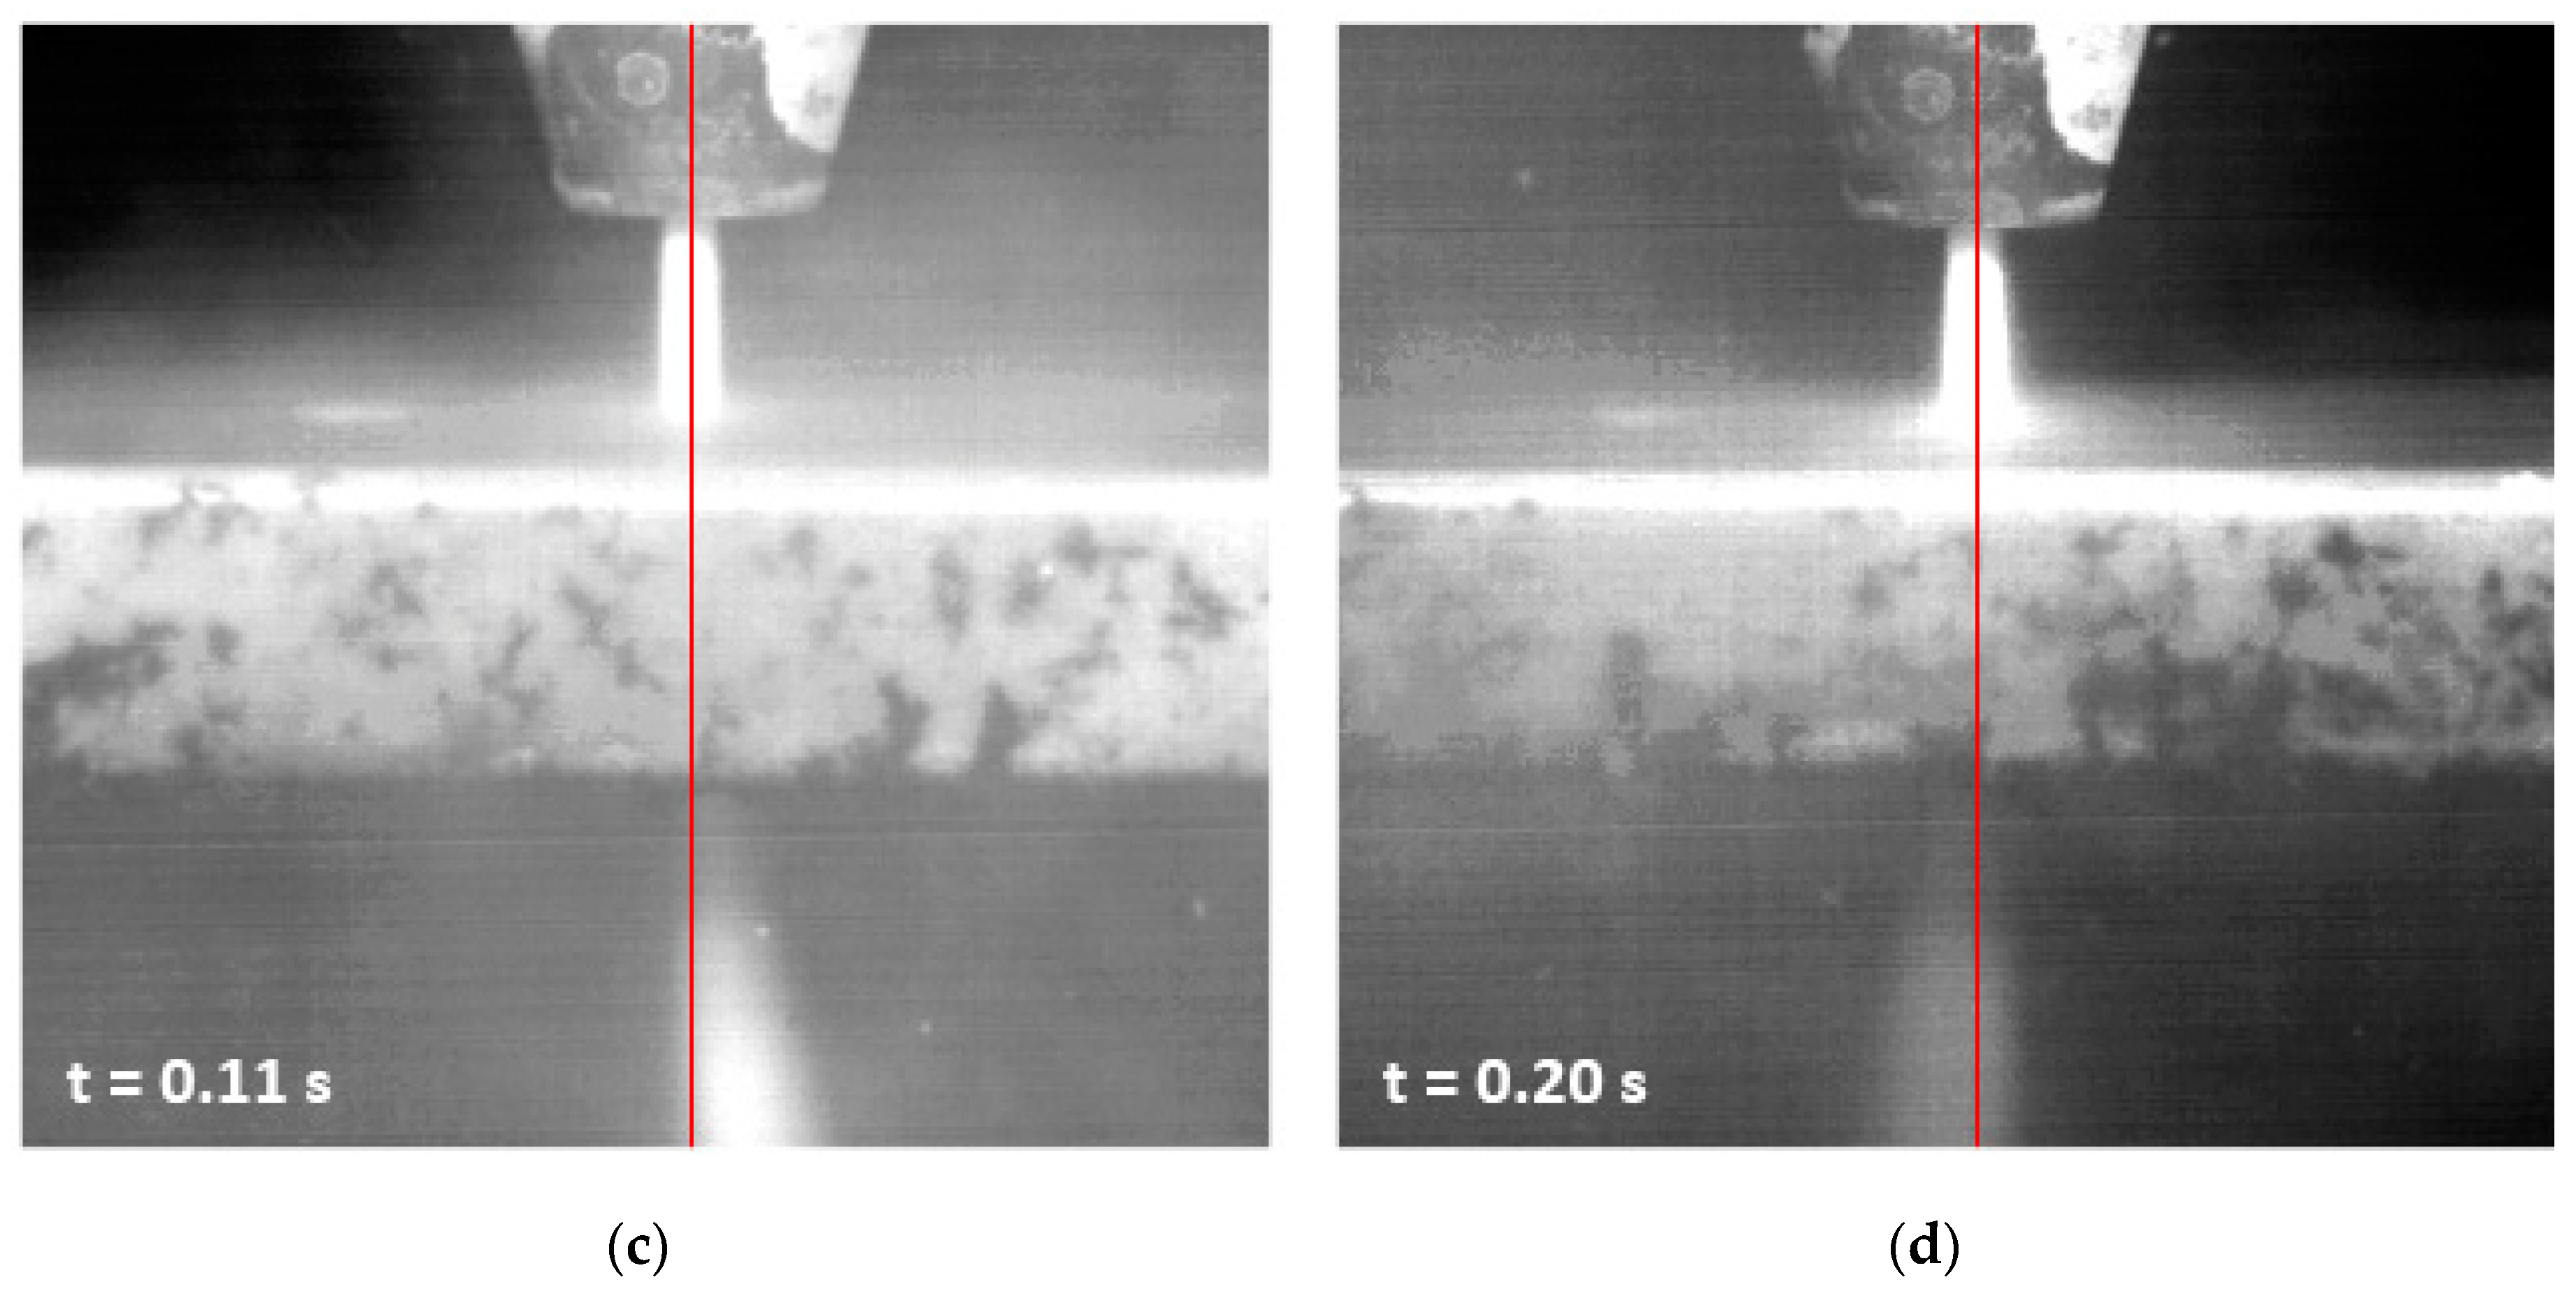
In those tests where the jet lacked sufficient kinetic energy to penetrate the material, it was possible to detect the formation of the striated zone and jet deflection at the exit of the cut through the use of a high-speed camera.
The following conclusions were drawn from the study carried out in Zone 1, Zone 2, and Zone 3:
-
The most favorable surface quality values, with roughness of around 5 µm, were obtained using low feed speeds, pressures in the low to medium range, and high abrasive rates.
-
No major differences were observed between the roughness values measured in Zone 1 and Zone 2. This highlighted the difficulty in establishing differences between IDR and SCR. However, through SEM analysis, it was possible to detect material-specific wear mechanisms that made it possible to distinguish between the two areas.
-
The increase in the measuring distance to the thickness of the specimen made it possible to detect striation marks due to jet delay in Zone 3 or RCR. In certain cases, values exceeding 50 µm were reached under unfavorable cutting conditions.
-
Depending on the parameter combination used, specimens with two or three regions were characterized: IDR + SCR, IDR + RCR, and IDR + SCR + RCR.
Finally, in order to reach a compromise and minimize taper angle and roughness defects during composite machining, the authors recommend the use of low feed rates, medium–high pressure levels, and intermediate abrasive rates.

Author Contributions

Conceptualization, P.F.M.A.; Methodology, P.F.M.A., L.R.-P. and Á.G.-P.; Software, L.R.-P. and Á.G.-P.; Validation, M.B.P.; Formal Analysis, P.F.M.A.; Investigation, P.F.M.A. and M.B.P.; Resources, L.R.-P. and M.B.P.; Data Curation, P.F.M.A. and M.B.P.; Writing—Original Draft Preparation, P.F.M.A. and Á.G.-P.; Writing—Review and Editing, P.F.M.A. and Á.G.-P.; Supervision, M.B.P.; Project Administration, P.F.M.A. All authors have read and agreed to the published version of the manuscript.

Funding

This research was funded by the programme for the Promotion and Impulse of Research and Transfer of the University of Cadiz. Project: PR PR2017-086, Machining of composite materials of strategic use in the aeronautical industry using AWJM.

Conflicts of Interest

The authors declare no conflict of interest.

References

  1. Composites Market Size, Share & Trends Analysis Report By Product (Carbon, Glass), By Resin, By Manufacturing Process, By Application, By End Use And Segment Forecasts, 2018 - 2025. Available online: https://www.grandviewresearch.com/industry-analysis/composites-market (accessed on 12 May 2019).
  2. Metal matrix composites market to 2024. Available online: https://www.ameriresearch.com/product/metal-matrix-composites-market/ (accessed on 12 May 2019).
  3. Automotive Composite Market Analysis By Product (Polymer, Metal, Ceramic), By Application (Interior, Exterior, Structural & Powertrain Components), By Region, And Segment Forecasts, 2018-2025. Available online: https://www.grandviewresearch.com/industry-analysis/automotive-composites-market (accessed on 12 May 2019).
  4. Brandes, E.A.; Brook, G.B. Simithells Light Metals Handbook, 7th ed.; Elsevier & Butterwort-Heinemann: Oxford, UK, 1998. [Google Scholar]
  5. Vanarotti, M.; Shrishail, P.; Sridhar, B.R.; Venkateswarlu, K.; Kori, S.A. Study of Mechanical Properties & Residual Stresses on Post Wear Samples of A356-SiC Metal Matrix Composites. Procedia Mater. Sci. 2014, 5, 873–882. [Google Scholar]
  6. Cahn, R.W.; Haasen, P. Physical Metallurgy, 4th ed.; North-Holland: Amsterdam, The Netherlands, 1996. [Google Scholar]
  7. Chaudhary, G.; Kumar, M.; Verma, S.; Srivastav, A. Optimization of drilling parameters of hybrid metal matrix composites using response surface methodology. Procedia Mater. Sci. 2014, 6, 229–237. [Google Scholar] [CrossRef] [Green Version]
  8. Ramasubramanian, K.; Arunachalam, N.; Ramachandra Rao, M.S. Wear performance of nano-engineered boron doped graded layer CVD diamond coated cutting tool for machining of Al-SiC MMC. Wear 2019, 426–427, 1536–1547. [Google Scholar] [CrossRef]
  9. Sharma, V.; Kumar, V. Multi-objective optimization of laser curve cutting of aluminium metal matrix composites using desirability function approach. J. Braz. Soc. Mech. Sci. Eng. 2016, 38, 1221–1238. [Google Scholar] [CrossRef]
  10. Kandpala, B.C.; Kumar, J.; Singh, A. Machining of aluminium metal matrix composites with electrical discharge machining - A Review. Mater. Today Proc. 2015, 2, 1665–1671. [Google Scholar] [CrossRef]
  11. Lalmuan, S.K.; Das, S.; Chandrasekaran, M.; Tamang, S. Machining investigation on hybrid metal matrix composites - A review. Mater. Today Proc. 2017, 4, 8167–8175. [Google Scholar] [CrossRef]
  12. Alberdi, A.; López de Lacalle, L.N.; Rivero, A.; Suarez, A. Effect of process parameter on the kerf geometry in abrasive water jet milling. Int. J. Adv. Manuf. 2010, 51, 467–480. [Google Scholar] [CrossRef]
  13. Ruiz-Garcia, R.; Mayuet Ares, P.F.; Vazquez-Martinez, J.M.; Salguero Gómez, J. Influence of abrasive waterjet parameters on the cutting and drilling of CFRP/UNS A97075 and UNS A97075/CFRP stacks. Materials 2019, 12, 107. [Google Scholar] [CrossRef] [PubMed] [Green Version]
  14. Natarajan, Y.; Kumar Murugesan, P.; Mohan, M.; Ali Khan, S.A.L. Abrasive water jet machining process: A state of art of review. J. Manuf. Process. 2020, 49, 271–322. [Google Scholar] [CrossRef]
  15. MatWeb. Material Property Data. Available online: http://www.matweb.com/ (accessed on 28 January 2020).
  16. Ravi Kumar, K.; Sreebalaji, V.S.; Pridhar, T. Characterization and optimization of abrasive water jet machining parameters of aluminium/tungsten carbide composites. Measurement 2018, 117, 57–66. [Google Scholar] [CrossRef]
  17. Ming Ming, I.W.; Azmi, A.I.; Chuan, L.C.; Mansor, A.F. Experimental study and empirical analyses of abrasive waterjet machining for hybrid carbon/glass fiber-reinforced composites for improved surface quality. Int. J. Adv. Manuf. Technol 2018, 95, 3809–3822. [Google Scholar] [CrossRef]
  18. Shanmugam, D.K.; Wang, J.; Liu, H. Minimisation of kerf tapers in abrasive waterjet machining of alumina ceramics using a compensation technique. Int. J. Mach. Tools Manuf. 2008, 48, 1527–1534. [Google Scholar] [CrossRef]
  19. Zahavi, J.; Schmitt, G.F., Jr. Solid particle erosion of reinforced composite materials. Wear 1981, 71, 179–190. [Google Scholar] [CrossRef]
  20. Srivastava, A.K.; Nag, A.; Dixit, A.R.; Tiwari, S.; Scucka, J.; Zelenak, M.; Hloch, S.; Hlavacek, P. Surface integrity in tangential turning of hybrid MMC A359/B4C/Al2O3 by abrasive waterjet. J. Manuf. Process. 2017, 28, 11–20. [Google Scholar] [CrossRef]
  21. Gnanavelbabu, A.; Saravanan, P.; Rajkumar, K.; Karthikeyan, S.; Baskaran, R. Effect of abrasive waterjet machining parameters on hybrid AA6061-B4C-CNT composites. Mater. Today Proc. 2018, 5, 13438–13450. [Google Scholar] [CrossRef]
Figure 1. Scheme of cutting regions in abrasive water jet machining (AWJM).
Applsci 10 01512 g001
Figure 2. Schemes of the cutting area, zones in the section of the cut, and distances at which measurements were performed.
Applsci 10 01512 g002
Figure 3. The cutting process performed: (a) Top of the cut material. Erosion-affected zone and measurement of the Wt parameter; (b) Bottom of the cut material. Measurement of parameter Wb.
Applsci 10 01512 g003
Figure 4. (a) SOM image. Jet output. Test 21. WP = 250 MPa; AMFR = 170 g/min; TFR = 500 mm/min; (b) Piercing frame; (c) Right jet deflection frame; (d) Left jet deflection frame.
Applsci 10 01512 g004aApplsci 10 01512 g004b
Figure 5. Interaction graphs for T.
Applsci 10 01512 g005
Figure 6. Interaction graphs for IDR.
Applsci 10 01512 g006
Figure 7. Interaction graphs for SCR.
Applsci 10 01512 g007
Figure 8. Difference between cutting profiles for (a) SOM image. Jet inlet. Test 7. WP = 500 = MPa; AMFR = 450 g/min; TFR = 100 mm/min; (b) SOM image. Jet inlet. Test 21. WP = 250 MPa; AMFR = 170 g/min; TFR = 500 mm/min; (c) SEM image. Test 7. IDR identification; (d) SEM image. Test 21. IDR identification.
Applsci 10 01512 g008
Figure 9. Distinguished defects in IDR: (a); detail of material deformation by particle impact; (b) detail of fragments of detached material.
Applsci 10 01512 g009
Figure 10. Interaction graphs for RCR.
Applsci 10 01512 g010
Figure 11. Difference between cutting profiles for (a) SOM image. Jet outlet. Test 7. WP = 500 = MPa; AMFR = 450 g/min; TFR = 100 mm/min; (b) SOM image. Jet outlet. Test 21. WP = 250 MPa; AMFR = 170 g/min; TFR = 500 mm/min; (c) SOM image. Jet outlet. Test 12. WP = 380 MPa; AMFR = 170 g/min; TFR = 500 mm/min.
Applsci 10 01512 g011
Figure 12. (a) SEM image. Jet outlet. Test 7. WP = 500 = MPa; AMFR = 450 g/min; TFR = 100 mm/min; (b) SEM image. Jet outlet. Test 21. WP = 250 MPa; AMFR = 170 g/min; TFR = 500 mm/min; (c) Detail of grooves plowed by abrasive grains.
Applsci 10 01512 g012
Figure 13. Parameter interaction graphs for the response variables for (a) T; (b) Zone 1; (c) Zone 2; and (d) Zone 3.
Applsci 10 01512 g013
Figure 14. Taper contour graph as a function of significant parameters: TFR and WP.
Applsci 10 01512 g014
Figure 15. Roughness contour graphs as a function of significant parameters: (a) Zone 1: TFR and WP; (b) Zone 2: TFR and WP; and (c) Zone 3: TFR and WP.
Applsci 10 01512 g015
Table 1. Composition of the A356.2 SiC 63 Cp alloy.
AlloyAlCuFeMgMnSiTiZnOthers
A356.291.10–93.30≤0.20≤0.200.25–0.45≤0.106.5–7.5≤0.20≤0.100.15
Table 2. Cutting parameters: working pressure (WP), abrasive mass flow rate (AMFR), traverse feed rating (TFR).
ParameterLevels
WP (MPa)250380500
AMFR (g/min)170340450
TFR (mm/min)100300500
Table 3. Constant parameters.
Orifice Diameter
(mm)
Nozzle Diameter
(mm)
Nozzle Length
(mm)
Abrasive Size
(µm)
Abrasive TypeStand-Off Distance
(mm)
0.30250380500Garnet2.5
Table 4. Results obtained during the evaluation for each combination of parameters: working pressure (WP), abrasive mass flow rate (AMFR), traverse feed rating (TFR).
TestWP (MPa)AMFR
(g/min)
TFR (mm/min)T (°)Zone 1 (µm)Zone 2 (µm)Zone 3 (µm)
15001701001.348.918.419.79
25001703001.5114.7113.3022.03
35001705001.5413.5413.5030.30
45003401001.137.765.957.56
55003403001.538.608.4912.07
65003405001.6010.529.1214.21
75004501001.426.966.205.70
85004503001.558.368.589.01
95004505001.658.428.2114.81
103801701001.417.736.347.35
113801703001.497.645.2511.52
123801705001.817.596.2419.31
133803401001.396.444.985.48
143803403001.447.527.0111.12
153803405001.749.337.3116.45
163804501001.555.044.565.28
173804503001.916.615.9210.18
183804505001.895.904.9413.43
192501701001.593.894.137.27
202501703001.676.416.8517.05
21250170500-35.7935.0153.05
222503401001.514.433.784.68
232503403001.867.276.0613.29
24250340500-35.6934.7156.03
252504501001.523.653.574.62
262504503001.695.175.0011.82
27250450500-33.9932.0752.21
Table 5. Analysis of variance (ANOVA) results of the evaluated variables: traverse feed rating (TFR), working pressure (WP), abrasive mass flow rate (AMFR).
TFR WP AMFR
VariableFp%VariableFp%VariableFp%
T18.310.00050.40T9.870.00127.17T3.200.0668.82
Zone 16.290.00832.77Zone 12.660.09513.85Zone 10.240.7871.26
Zone 26.290.00831.79Zone 23.280.05914.89Zone 20.210.8131.06
Zone 314.200.00047.71Zone 34.750.02115.96Zone 30.810.4572.74

