Ground Reaction Forces Generated by Runners—Harmonic Analyses and Modelling


Faculty of Civil Engineering, Division of Bridge, Metal and Timber Structures, Cracow University of Technology, 31-155 Kraków, Poland
Appl. Sci. 2020, 10(5), 1575; https://0-doi-org.brum.beds.ac.uk/10.3390/app10051575
Submission received: 8 January 2020
/
Revised: 17 February 2020
/
Accepted: 20 February 2020
/
Published: 25 February 2020
(This article belongs to the Special Issue Bridge Dynamics)
Abstract
:Featured Application
The presented topic is applicable during the dynamic analysis of pedestrian-carrying structures exposed to the dynamic action of runners. The presented information enables the prediction of the dynamic response of the structure and verification of the serviceability limit state of vibration in terms of the comfort of use of the structure.
Abstract
Building structures carrying pedestrian traffic, e.g., footbridges, long-span floors and long cantilevered platforms projecting outwards from the walls (long balconies), can be susceptible to the dynamic influence of its users. One type of dynamic action that can occur on these structures is the dynamic action of people running. The main aim of this paper is to present the results of the harmonic analyses and mathematical models of two types of ground reaction forces (GRFs) generated by people applying different running techniques, i.e., forefoot- and heel-strike (rearfoot) running technique. The analyses of the GRFs were performed on the basis of the results of laboratory tests of running people and concern the vertical component of the ground reaction forces (VGRFs) generated by runners. The harmonic analyses were performed using Fourier transform. The results of the study show the main features and differences between forces generated by forefoot- and heel-strike runners. Data obtained for various running styles allowed the development of a load model proposal for the VGRFs generated by heel-strike runners. The results of the VGRF parameterization and the proposed new VGRF model allow the VGRFs generated by forefoot and heel-strike runners to be accurately estimated in the case of normal running pace (recreational running). The application of the presented results allows improvements to the accuracy of determining the dynamic response of structures induced by runners.
1. Introduction
The specificity of designing building structures requires verification of the serviceability limit states, including vibration caused by foot traffic. In order to verify the requirements of vibration serviceability limit states, appropriate design scenarios should be selected depending on the types of foot traffic that can occur on the structure during its service life. The type of foot traffic strongly depends on the main aim of the foot traffic and location of the structure. In buildings and city areas where the probability of people hurrying or exercising is high, the structures can be exposed to the action of people running. Examples of these structures are footbridges located within recreational areas (city parks, walking boulevards, etc.) or located in the vicinity of public transport stops or public transport hubs. Runners can induce excessive vibration of these structures, which can significantly disturb the comfort of its use. Excessive vibration of footbridges can also be induced by runners during sporting events (half marathons, marathons, running trainings, etc.). Cases of excessive vibration of footbridges induced by running people have been reported in [1,2,3,4,5,6,7,8]. In the case of steel footbridges, one running person can induce high amplitude vibration acceleration reaching 2.0–3.0 m/s2 or more [3]. At the design stage of these structures, dynamic loads generated by people running should be taken into account where relevant.
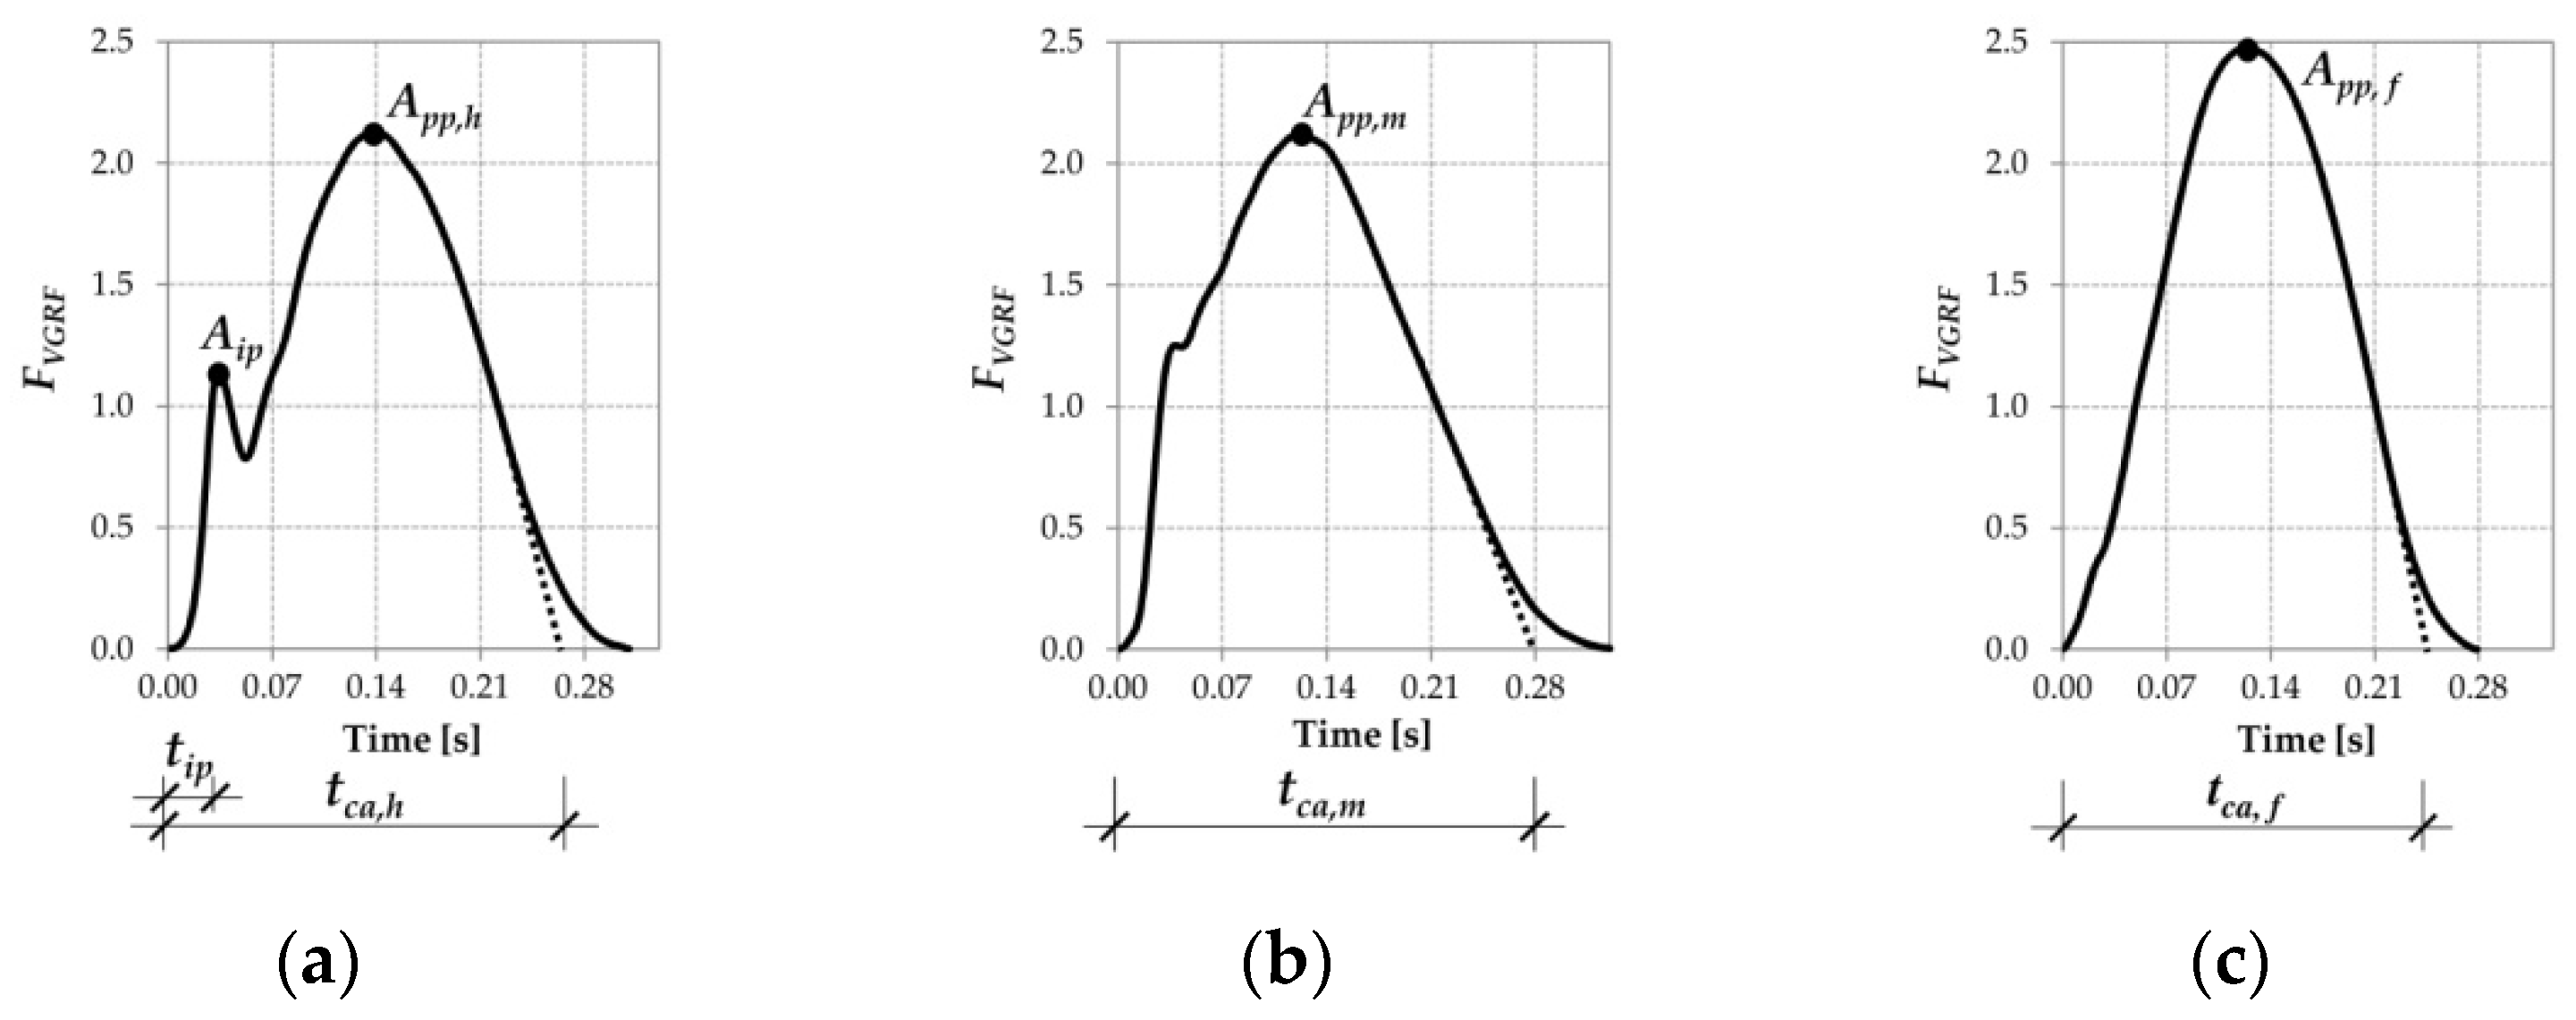
Ground reaction forces generated during running depends on the running technique, which manifests itself in different foot-ground contact patterns (foot-strike patterns). Detailed analysis of the run allows the identification of three types of foot contact with the ground: heel-strike pattern (also known as a rearfoot-strike pattern), in which the heel contacts with the ground first; midfoot-strike pattern, in which the heel and the forefoot (the ball of the foot) make contact with the ground simultaneously; and forefoot-strike pattern in which the forefoot contacts the ground first (the heel does not touch the ground). Different types of foot-strike patterns produce a different time course of the ground reaction force (GRF). In Figure 1, the time courses of the vertical component of normalised ground reaction forces (FVGRF = VGRF/G, where: G—weight of running person) for different foot-striking patterns are presented.
The VGRF generated by a heel-strike runner is characterised by two peaks: an impact peak (Aip) and a propulsive peak (App). During forefoot-strike running, only propulsive peak App occurs in the course of the VGRF. Midfoot-strike running is an intermediate case in which only a small impact peak may occur in the course of the VGRF. The most important differences between the course of the VGRFs for different foot-strike patterns concern the value of amplitudes of propulsive peak and the value of contact time (see Section 3 and Section 4 for details).
There are several proposals for mathematical models of the VGRF generated by a running person in the literature [8,9,10,11,12,13,14]. All of these models allow the VGRF generated to be determined during the forefoot-strike running technique, i.e., the VGRF not containing the impact peak Aip. In [9,10,11,12] the Fourier series was used to describe the VGRF time course. It is worth noting that parameters of the Fourier series presented in [9,10,11] enable correct estimation of the VGRF for an ordinary running activity with step frequency fr = 2.0–4.0 Hz, while the application of the Fourier coefficients proposed in [12] leads to an overestimation of the VGRF amplitude (detailed analyses of this topic are presented in [15]). In addition, models presented in [9,10,11,12] recommend the use of 3 or 4 harmonics to determine the VGRF curve. For frequency of running fr = 2.80 Hz (the typical pace of running), the frequency range corresponding to 4 harmonics is 2.8–11.0 Hz. These proposals can be considered correct for modelling the VGRF generated during forefoot running for the needs of dynamic analysis performed in civil engineering tasks. To determine the VGRF generated by heel-strike runners, consideration of approximately 10–15 harmonics is required [16,17]. For a frequency of running of fr = 2.80 Hz the frequency range corresponding to 15 harmonics is 2.8–45.0 Hz (see Section 4 for details).
Another type of the VGRF model, called the half-sine model, has been proposed in [7,13]. The half-sine model allows determination of the VGRF generated during the forefoot-strike running technique. It should be also mentioned that the half-sine model is very sensitive to the value of contact time of the foot with the ground tc. The amplitude of the VGRF in the half-sine model is inversely proportional to tc. The assumption of the underestimated tc, e.g., tc = 0.5 Tr recommended in [7] for ordinary running activity (where: Tr—running period, Tr = 1/fr), results in a large overestimation of the VGRF amplitude [1,15] (see Section 4 for details).
The load model proposed in [14] is another example of a model of the VGRF generated by a runner, enabling determination of the VGRF in the form of a half-sine curve. The model allows the reliable value of the dynamic response of the structure subjected to the dynamic action of running people to be estimated, but it cannot be directly compared with the measured VGRFs. The model is characterized by a constant amplitude of 1250 N, as well as the duration of the foot contact time with the ground being significantly shorter than contact time values measured during running tests. The model proposed in [14] describes the force which generates an impulse causing a dynamic response of the structure comparable to the response induced by real VGRFs, but the parameters of the modelled VGRFs are not directly comparable to the parameters of the measured VGRFs.
A different methodology for the VGRF modelling, presented in [18], uses the sum of the Gaussian functions to reconstruct the VGRF time course. The proposed procedure does not distinguish between running techniques but can easily be adapted to model different running styles. The correct selection of the number and parameters of the Gaussian functions enables determination of the template curve of the VGRF separately for forefoot-strike and heel-strike running.
Another method of the VGRF modelling has been presented in [19,20]. In the model, the runner’s body was divided into two masses: m1—the mass of the lower limb which contacts with the ground during running (m1 = 0.08 G, where: G—total body mass of the runner)—and m2—the mass of the rest of the runner’s body (m2 = 0.92 G). In order to create the VGRF curve, the sum of the cosine functions describing the forces created during the motion of the two parts of the runner’s body was used. With properly selected parameters, the proposed model allows the VGRF curves generated during heel-strike and forefoot-strike running to be determined.
Most recreational runners, around 90–95%, are heel-strike runners [21,22,23]. In [24], it was reported that in a group of professional marathon runners, nearly 75% of runners, were also heel-strike runners. The heel-strike running style can be considered to be the most common running style. Despite this, as mentioned earlier, the existing models of the VGRF generated by running people are mainly related to forces generated by forefoot-strike runners without taking into account the differences in parameters between the VGRFs generated by heel-strike and forefoot-strike runners.
For a better understanding of loads generated during running, a series of laboratory tests of people running and measurements of vertical ground reaction forces (VGRFs) were performed. Acquired forces were analysed using fast Fourier transform (FFT) to illustrate the differences in the parameters of the VGRFs generated by forefoot-strike and heel-strike runners. In addition, the VGRFs were parametrised in order to find the relation between the frequency of running and the foot contact time with the ground as well as the relation between frequency of running and VGRF amplitude for different running technique. The paper also presents the author’s proposal of the mathematical model for the VGRF generated by heel-strike runners.
The research results presented in the paper enable a more accurate simulation of vertical forces induced by runners and can increase the accuracy of estimation of the dynamic response of civil engineering structures.
2. Materials and Methods
The VGRFs generated during running were measured during laboratory tests of a group of 13 healthy volunteers with full mobility and with no injuries and disabilities (5 males and 8 females, weight 51.6 ÷ 108.4 kg (mean ± SD: 70.2 ± 16.2 kg), height 158–187 cm (mean ± SD: 172.3 ± 9.8 m) age 22–45 years (mean ± SD: 25 ± 6.8 years)). Volunteers were chosen from the 22–45 age group using a convenience sampling method among students and employees of the University of Physical Education in Krakow and Cracow University of Technology.
All running tests were carried out in the laboratory of the Biomechanics Section of the University of Physical Education in Krakow. The force measurements were realized using two AMTI 6-degrees of freedom force plates (40 × 60 cm) located in line, one after the other, in the centre of a wooden walkway (Figure 2).
The data were collected at a sample rate of 1.0 kHz. A high sampling rate was necessary to accurately measure the impact peak of the VGRF generated by heel-strike runners.
During the tests, the volunteers ran in sports shoes. All test participants were asked to run at the pace indicated by the electronic metronome. The tests were performed in the frequency range 2.40–3.40 Hz to simulate slow, moderate and fast running pace. The running frequency increment was 0.2 Hz. The running frequencies were recalculated from [Hz] to [BPM] (beats per minute). The tested frequency range corresponds to the frequencies of the steps occurring during recreational and marathon running. Cases of very fast running or sprinting were not studied.
All volunteers were asked to land with their feet in the area of the force plates during the tests. Prior to conducting the force measurement, each volunteer practiced running with the frequency indicated by an electronic metronome to better match the running pace during the final measurement. All test participants performed two series of runs for each running frequency. The duration of each series was 60 s. After two series, the examined person rested during the series performed by other participants of the studies. The frequency was subsequently increased by 0.20 Hz, and the measurement was repeated for the new running frequency.
The recorded VGRF signals were filtered using a fourth-order low-pass Butterworth digital filter with a cut-off frequency of 60 Hz. The cut-off frequency of 60 Hz was established during signal processing tests as the frequency that allowed removal of unwanted noise and did not change the course of the VGRF waveform.
In analyses, the normalised (dimensionless) ground reaction forces FVGRF, defined as FVGRF = VGRF/G, were used (where: VGRF—recorded and filtered vertical component of the ground reaction force, G—weight of running person). To calculate the amplitudes of real VGRF, the amplitudes of normalised FVGRF should be multiplied by the weight of running person G. The normalised FVGRF forces were parameterised by the following indicators: the normalised amplitude of the impact peak (Aip), the normalised amplitude of the propulsive peak (App,h or App,f for heel-strike and forefoot-strike runner respectively), the time of occurrence of Aip (tip), the time of occurrence of App,h or App,f (tpp,h or tpp,f) and the approximated contact time of the foot with the ground (tca,h or tca,f for heel-strike and forefoot-strike runner respectively, see Figure 1).
The times tip, tpp,h and tpp,f associated with the force curve peaks were extracted by finding the force curve peaks in the selected region of the curve along with the time values corresponding to identified peaks.
The approximated contact time of the foot with the ground, tca,h or tca,f (the time indicated by a dashed line in Figure 1), was obtained from the analysis of the collected data using the method developed by the author. The approximated contact time was determined as the point of intersection of the time axis with a straight line passing through two points lying on the right half of the FVGRF curve at the height corresponding to the value of the force amplitudes FVGRF = 1.0 and FVGRF = 1.10 (the origin of the coordinate system was taken at the beginning of the FVGRF curve; FVGRF = 1.0 corresponds to the body weight of the runner). This method allowed a straight line approximating the slope of the right half of the FVGRF curve and the value of the approximated contact time of the foot with the ground to be determined. The approximated contact time was assumed as a curve indicator due to the method of force modelling (sinusoidal model), which precludes reconstruction of the actual curvature of the FVGRF curve in its final part. The omitted low values of the FVGRF were assumed negligible from the point of view of the dynamic analyses of building structures.
In order to determine the amplitude and phase spectra of the FVGRF generated by heel-strike and forefoot-strike runners, the FVGRF were decomposed using the fast Fourier transform (FFT). Each FVGRF curve was analysed separately. Recorded steps were not organised into a set of successive steps. The duration of each of the analysed FVGRF curves was assumed to be equal to the running period Tr = 1/fr (during the flight phase of running FVGRF = 0 was assumed). The presented FFT results relate to the FVGRF generated during running with a step frequency of fr = 2.80 Hz, which can be assumed as the frequency of running at a normal pace [25,26,27].
Data recorded for heel-strike runners were used to develop the author’s proposal of a load model describing the VGRF generated during heel-strike running. The function describing the impact peak occurring during heel-strike running was elaborated by analysing the variability of the parameter of the impact-peaks (amplitude and time of its occurrence). Due to a relatively large intra- and inter-subject variability of the analysed parameters, recommended values of the impact peak function parameters were presented in the form of ranges of values independent of the running frequency.
3. Results
In Table 1, Table 2 and Table 3 and in Figure 3 and Figure 4, the results of the parameterisation of the FVGRF generated by heel-strike and forefoot-strike runners are presented. In Figure 3 and Figure 4, the regression lines and their equations are additionally presented (the bars in the charts represent the standard deviation).
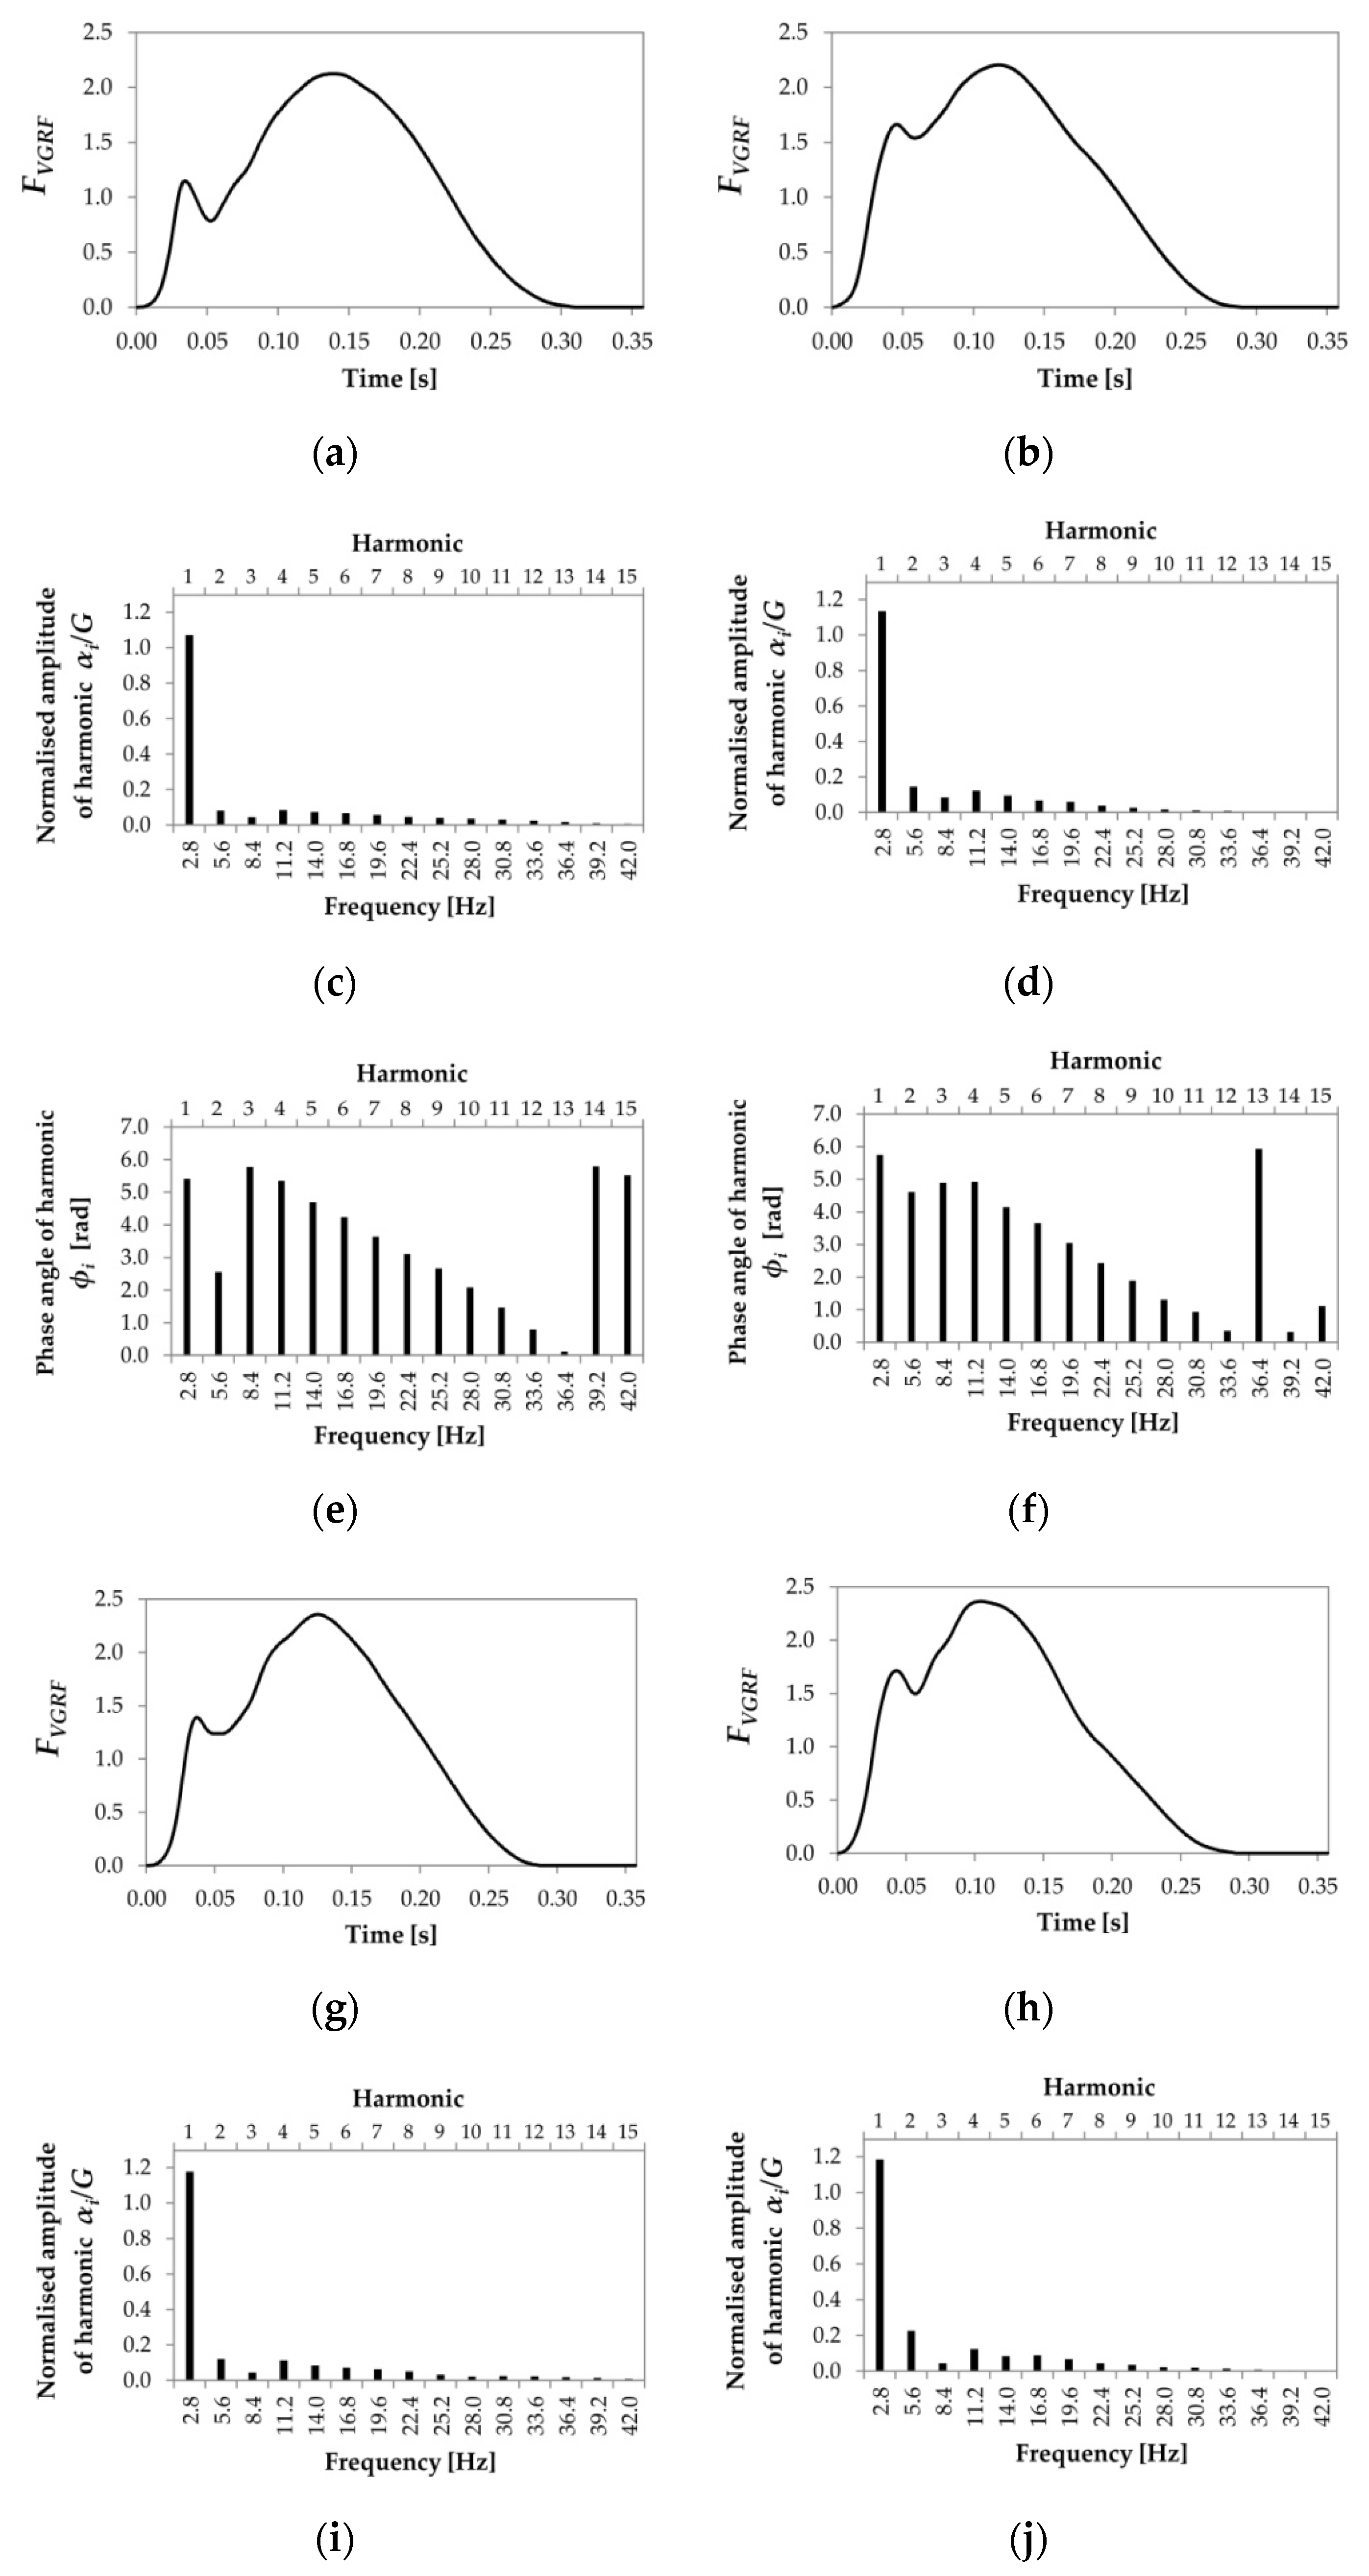
In Figure 5 and Figure 6 the sample charts of the FVGRF curves generated by heel-strike and forefoot-strike runners, respectively, along with the corresponding amplitudes and phase angles of fifteen harmonics are presented.
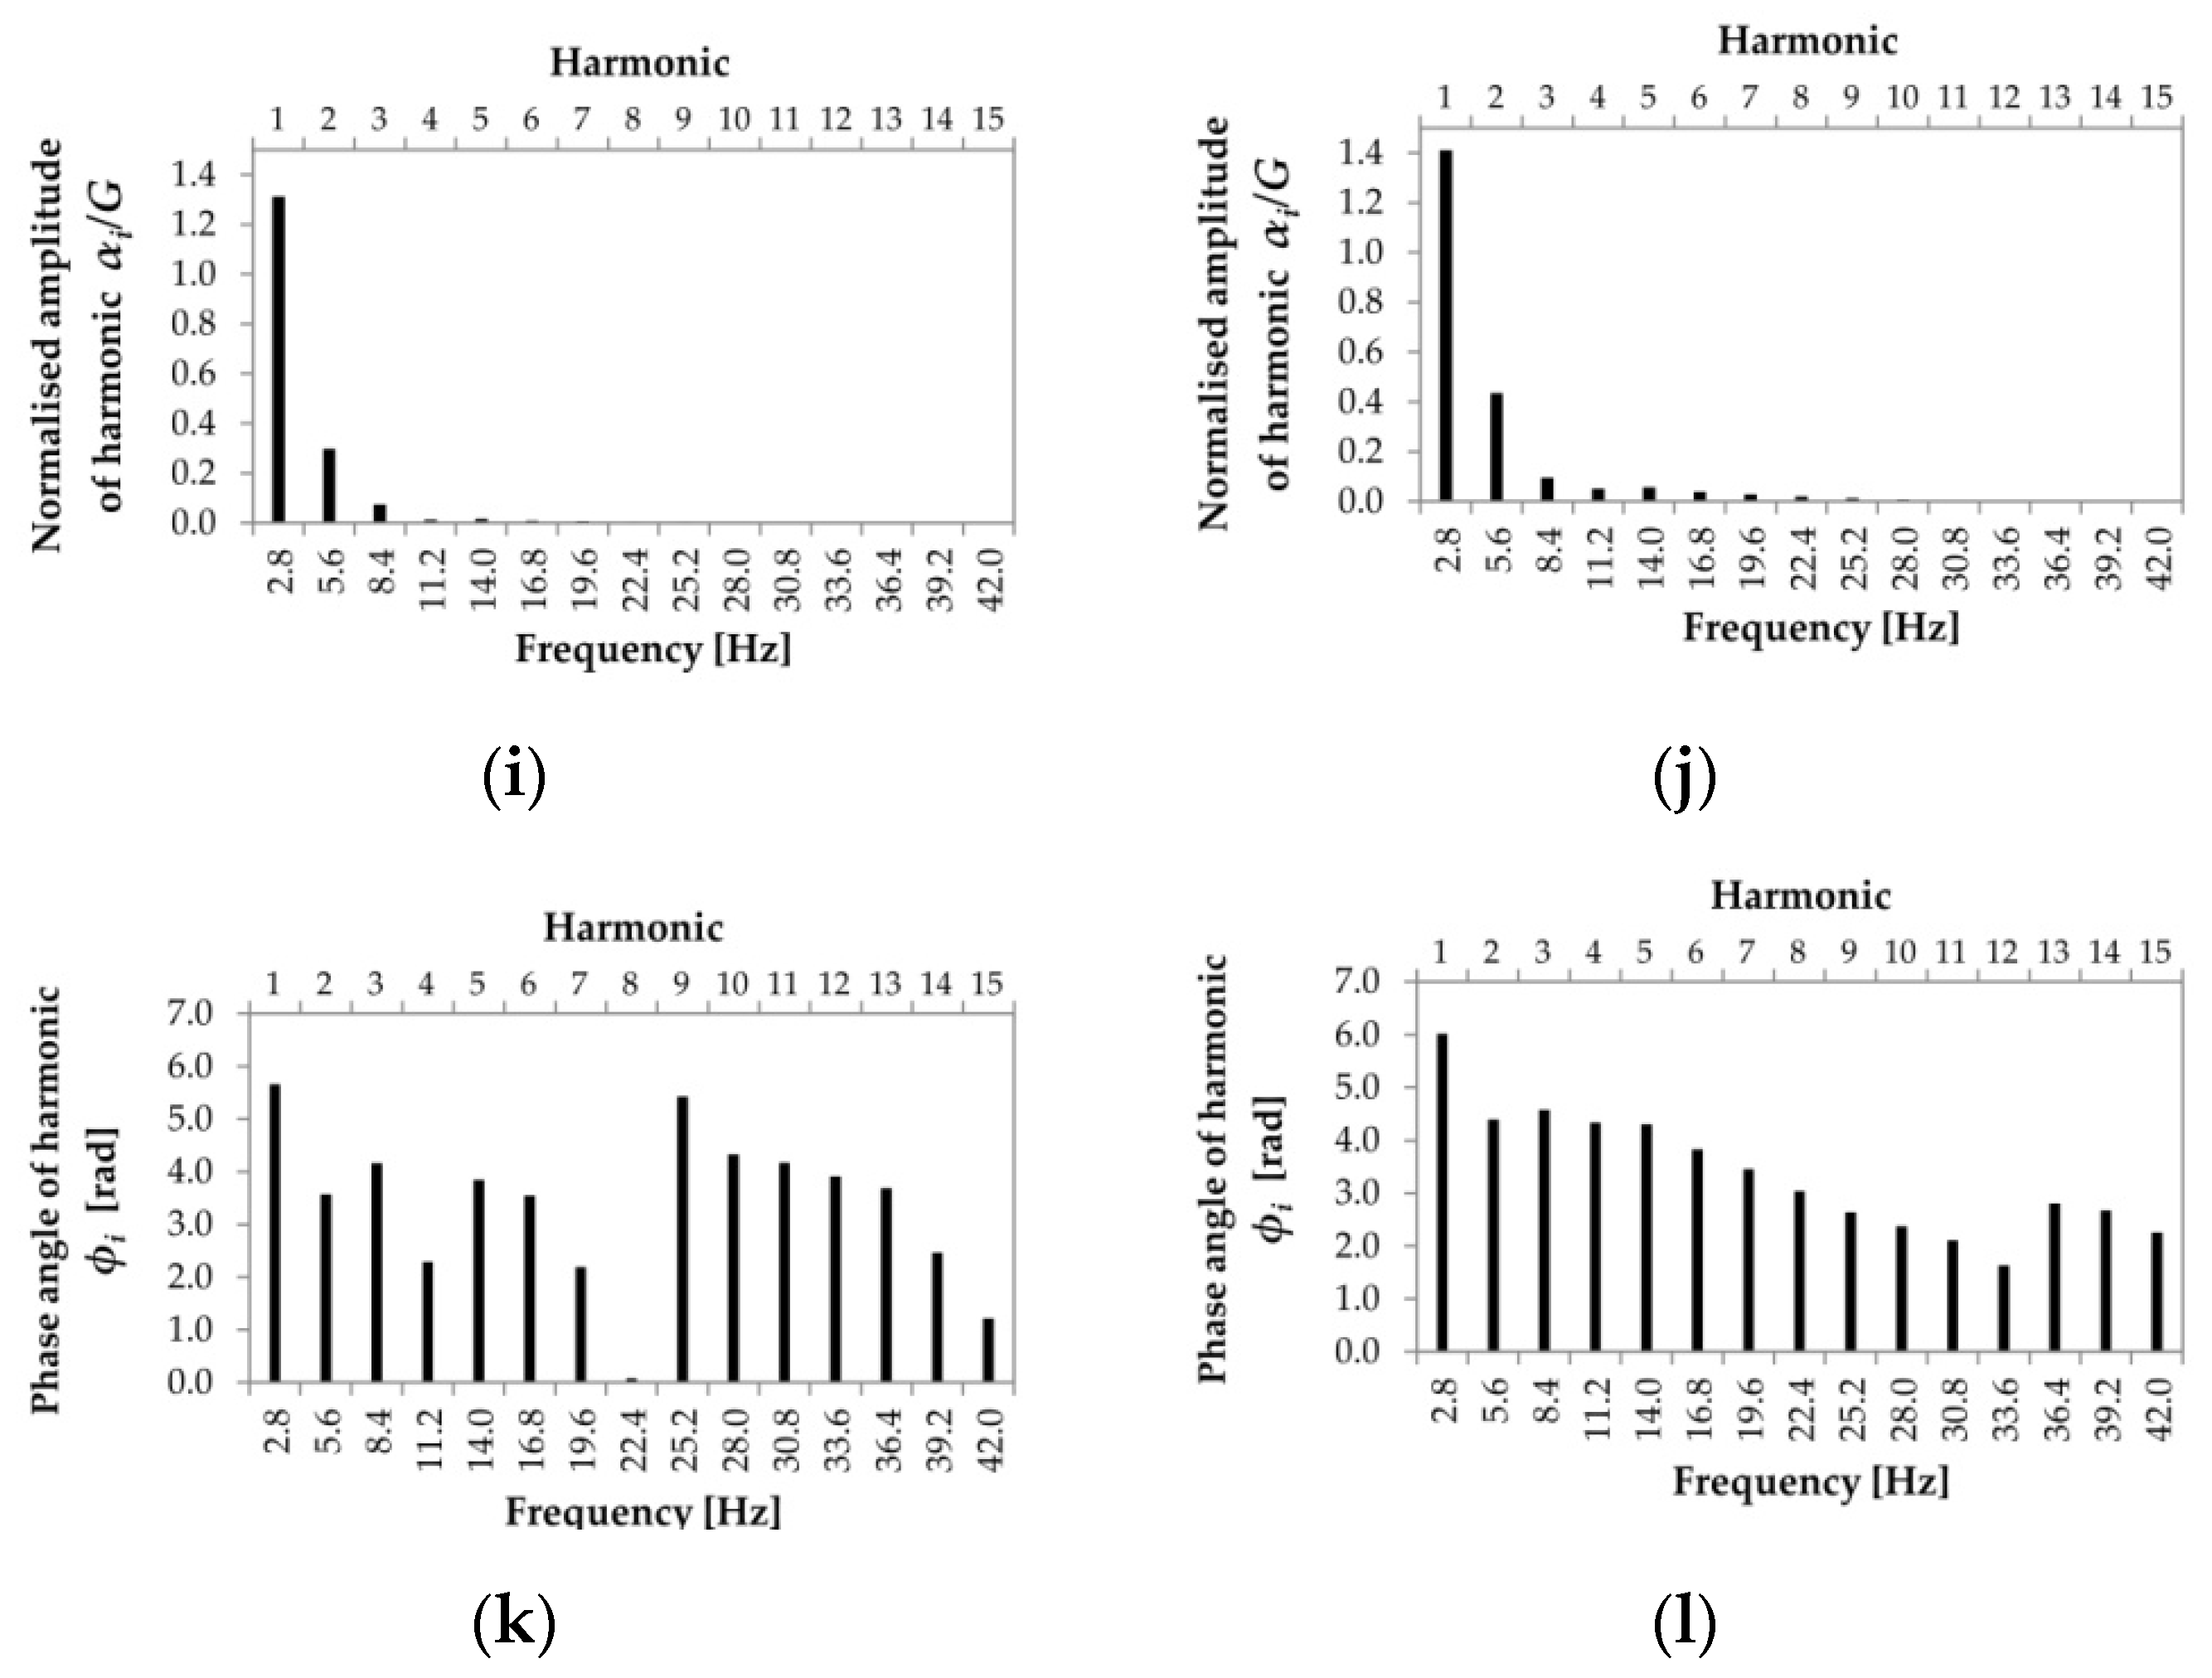
Figure 7 and Figure 8 present examples of normalised amplitudes and their corresponding phase angles of the fifteen FVGRF harmonics determined for forty FVGRF samples generated by four heel-strike and four forefoot-strike runners respectively. To improve the readability of the FVGRF amplitudes of higher harmonics, the logarithmic scale of the FVGRF amplitude charts is used (in Figure 5 and Figure 6 the exemplary amplitudes of the FVGRF curves in linear scale are presented).
4. Discussion
Section 3 presents the results of research on the vertical component of the ground reaction forces generated by running people (VGRF). The research took account of two different running styles: heel-strike running and forefoot-strike running. To the best of the author’s knowledge, previous work presenting the results of a similar study do not take into account the division of VGRF into different running styles. The presented analyses enabled the identification of the main features and differences between the VGRF generated as a result of two different running styles.
Comparing the amplitudes of the propulsive peaks App,h and App,f (Table 1, Figure 3a and Figure 4a) and the values of the contact time of the foot with the ground tca,h, tca,f (Table 2, Figure 3c and Figure 4c), two main differences between heel-strike and forefoot-strike FVGRF can be observed. Firstly, the mean FVGRF amplitudes generated during forefoot-strike running (App,f) reach values around 10–15% greater than the mean FVGRF amplitudes generated during heel-strike running (App,h). Secondly, the approximated contact time of the foot with the ground for forefoot-strike running (tca,f) is around 10–15% less than the approximated contact time for heel-strike running (tca,h). As confirmed by the results of analyses performed by the author, the use of accurate values of the contact time of the foot with the ground is crucial for proper modelling of the FVGRF using the half-sine model presented in [7,13].
A similar relationship between the FVGRF amplitudes generated during the normal pace of running (with a velocity of around 3.0 m/s) by forefoot-strike and heel-strike runners can be found in [28,29]. It was considered that results obtained by the author, which are consistent with the results presented in [28,29], indicate the relatively high importance of running technique for the FVGRF amplitude. Further analyses of this topic are required.
The values of tca,h and tca,f can be estimated by empirical Formula (1) and (2):
Equations (1) and (2) were determined by the author using an exponential regression line best fitted to the data set presented in Table 2 using the weighted nonlinear least-squares method. Fitted regression lines are shown in Figure 3c and Figure 4c.
The use of Formula (1) and (2) allows the approximated contact times of the foot with the ground (tca,he, tca,fe) to be correctly estimated, and thus, the FVGRF amplitudes for heel-strike and forefoot-strike running, respectively, can be correctly estimated. To compare the estimated FVGRF amplitudes with the experimental values, in Table 4 the estimated values of amplitudes App,he, App,fe determined for the estimated contact times tca,he, tca,fe are presented. It can be seen that the estimated amplitudes are consistent with the experimental values of App,h, App,f presented in Table 1. It is worth noting that the estimated amplitudes App,he, App,fe are also consistent with the dynamic load factor kp defined in [13]. However, it should be noted that according to the results obtained for the step frequency during running fr in a range of 2.4–3.4 Hz, the mean value of the dynamic impact factor kp defined in [13] as a function of tc/Tr should be determined for the tc/Tr ratio in a range of 0.63–0.77 (see the last two columns in Table 4, note: in the formula tc/Tr use tca,he or tca,fe instead of tc for heel-strike and forefoot-strike runners respectively). In addition, it is worth noting that the values of the contact duration of the foot with the ground presented in Table 2 are consistent with the recommendations presented in [13], after [30], only in the step frequency range fr = 2.4–3.0 Hz. For fr > 3.0 Hz, the values of the contact durations of the foot with the ground recommended in [13,28] are less than the experimental values presented in Table 2. Normalised force amplitudes determined for the shorter contact times of the foot with the ground, e.g., using the half-sine model, reach values of up to FVGRF ≈ 3.0 that do not occur during the normal pace of the run (recreational running) [28,29]. These values can be considered the upper limit of the force amplitudes which can only occur during fast running at a speed of 5–6 m/s [28]. It is also worth noting that assuming the contact time tce = 0.5 Tr, recommended in [7], leads to a constant and overestimated value of the FVGRF amplitude for all step frequencies during running (see values of Appe in Table 4).
Analysing the results presented in Table 1 and Table 2 and in Figure 3 and Figure 4, it can be observed that the FVGRF amplitudes reach the highest values in the step frequency range of fr = 2.70–3.10 Hz, which corresponds to a typical running pace.
Analysing the results presented in Figure 3d, the lack of an explicit trend of the impact peak indicator Aip can be identified (large scatter of Aip values). A linear regression was used to approximate the Aip values. The mean value of the normalised amplitude of the impact peak is Aip = 1.30. The impact peak Aip occurs on average about 42.0 ms after the contact of the heel with the ground.
Analysing Figure 5, Figure 6, Figure 7 and Figure 8, which show the normalised amplitudes of the FVGRF harmonics (αi/G, where: αi—amplitude of the harmonic, G—weight of running person) generated during heel-strike and forefoot-strike running, it can be observed that the amplitude spectra for both running techniques are dominated by the amplitudes of the 1st harmonics with mean values and standard deviations of 1.08 ± 0.09 and 1.36 ± 0.07 for heel-strike and forefoot-strike running respectively. It can be also seen that the scatter of amplitudes of individual harmonics in the case of forefoot-strike running is greater than in the case of heel-strike running especially for higher harmonics (for i ≥ 4, where: i—number of harmonic).
In the case of forefoot-strike running the 2nd harmonic reaches the mean value of around 24% of the amplitude of the 1st harmonic. The 3rd harmonic reaches a mean value of about 8% of the amplitude of the 1st harmonic. The mean amplitudes of the 4th and 5th harmonics reach around 2.5–2.7% of the amplitude of the 1st harmonic. The mean amplitudes of the 6th and 7th harmonics reach around 1.4–1.8% of the amplitude of the 1st harmonic. Higher harmonics (for i ≥ 8) reach amplitudes of less than 1.0% of the amplitude of the 1st harmonic. A relatively fast decrease in the mean amplitude value of individual harmonics can be seen.
In the case of heel-strike running the distribution of normalised amplitudes of the analysed harmonics nos. 2–15 is more even than in the case of forefoot-strike running. A large number of harmonics reach amplitudes in the range of 4.0–9.0% of the amplitude of the 1st harmonic. The 2nd harmonic reaches a mean value of around 9% of the amplitude of the 1st harmonic. The 3rd harmonic reaches a mean value of around 7% of the amplitude of the 1st harmonic. The mean amplitudes of the 4th and 5th harmonics reach around 6.5–7.5% of the amplitude of the 1st harmonic. The mean amplitudes of the 6th and 7th harmonics reach about 4.6–5.6% of the amplitude of the 1st harmonic. The mean amplitudes of harmonics nos. 8–14 reach values in the range of 1.0–4.0% of the amplitude of the 1st harmonic.
Analysing the charts showing the phase angles of the FVGRF harmonics (φi) presented in Figure 5, Figure 6, Figure 7 and Figure 8, a relatively large scatter of the φi of individual harmonics can be noticed. This feature of the FVGRF harmonics causes major problems in FVGRF modelling using the Fourier series, especially in the case of the FVGRF generated by heel-strike runners. The shape of the FVGRF generated by forefoot-strike runners is dominated by the 1st harmonic and is slightly dependent on the values of the phase angles of the higher harmonics. Proper assumption of the phase angles for the first three harmonics is sufficient to correct modelling of the FVGRF generated by forefoot-strike runners.
In the case of analysed running pace with a step frequency of fr = 2.80 Hz the mean phase angles for the 1st harmonics of the FVGRF are φ1,h = 5.48 ± 0.13 rad (~1.75π) and φ1,f = 5.83 ± 0.19 rad (~1.86π) for heel-strike and forefoot-strike running respectively. In the case of forefoot-strike running, the constant value of the phase angles φi ≈ 4.0 rad (~1.30π) for i ≥ 2 can be assumed without significant loss of accuracy in determining the FVGRF (compare Figure 8b).
In the case of the FVGRF generated during heel-strike running, the characteristic is a large scatter of the phase angel values for the 2nd harmonic and almost linear decrease of the phase angles for harmonics 3–15 (Figure 7b). It should be noted that the reader should remember about the periodicity of the phase angles of ±2π (6.28 rad), which allows a large value of phase angles determined for higher harmonics (shown in Figure 7b for harmonics 10–15) to be converted to a small or negative value. The mean value and the standard deviation of the phase angle for the 2nd harmonic is φ2 = 4.0 ± 1.15 rad. The value of the phase angle for the 3rd harmonic (φ3) can be assumed to be in the range of 5.5–6.3 rad. The values of the phase angle for the higher harmonics (harmonics 4–15) should be linearly reduced every 0.5 rad (compare Figure 7c).
The constant term of the Fourier series (α0) is another important parameter for modelling any curves by means of the Fourier series. This constant term α0 represents the average value of the function over its domain. In the case of the FVGRF generated by forefoot-strike runners the value of the normalised constant term can be assumed α0,f = 1.0 ± 0.034. For the FVGRF generated by heel-strike runners, the value of the normalised constant term is α0,h = 0.978 ± 0.035.
Figure 9 presents the impact of the number of harmonics included in the FVGRF modeling on the accuracy of the FVGRF curve fitting. The residual plots, presented below the FVGRF charts, show the accuracy of fitting of the FVGRF to the example laboratory test result. To achieve high accuracy of the mapping of the FVGRF curve generated by forefoot-strike runners, it is sufficient to use 3–5 harmonics (Figure 9e,f). In the case of the FVGRF generated by heel-strike runners, sufficient accuracy can only be achieved if 10–15 harmonics are used (Figure 9c,d).
Due to the large variability of the Fourier series parameters, especially the phase angles values, modelling of the FVGRF generated by heel-strike runners using the Fourier series can be burdensome and can lead to large inaccuracies. An alternative way of modelling of the FVGRF generated by heel-strike runners should be proposed. This alternative method may be the method presented in [18,19,20]. This could also be the model proposed by the author and based on the half-sine model.
The FVGRF generated by heel-strike runners can be simulated using the half-sine model (Equation (3) [7,13]) assuming the correct contact time value tca,he according to Equation (2) and adding an impact peak function ϕip(t) (Equation (6), author’s proposal) responsible for producing the impact peak occurring in the FVGRF generated by heel-strike runners.
where FVGRF(t)—normalised vertical component of the ground reaction force FVGRF(t) = VGRF/G, G—weight of running person (note: VGRF(t) = FVGRF(t)·G), Ar—the FVGRF amplitude acc. to Equation (5), k—coefficient of contact time of the foot with the ground acc. to Equation (4), fr—step frequency during running, Tr—step period during running Tr = 1/fr, ϕip—the impact peak function, Aϕ—the impact peak amplitude, αϕ—coefficient of the impact peak location, βϕ—coefficient of the impact peak slenderness, λ—coefficient of the impact peak duration λ ≈ (0.17–0.20)Tr (only the first cycle of the impact peak function should be used).
During the analyses a large intra- and inter-subject variability of the impact peak parameters was observed, and for this reason, the recommended values of the impact peak parameters are presented in a form of ranges of values independent of the running frequency.
A typical Aϕ value can be assumed to be in the range of 0.5–1.3. The value of the impact peak location coefficient αϕ can be assumed in the range αϕ = 4–8 (αϕ can be a decimal number). The coefficient αϕ should be adequately adjusted to the running frequency to achieve the location of the impact peak 30–45 ms after contact of the foot with the ground; αϕ = 5–8 or αϕ = 4–6 can be assumed for running frequency fr = 2.4–2.8 Hz and fr = 2.8–3.4 Hz respectively. βϕ = 2, 3, 4, 5,... can be assumed. The recommended value is βϕ = 4 (βϕ can be a decimal number). For more information see [15].
In Figure 10 the FVGRF generated using Equations (3)–(6) along with corresponding amplitude and phase angles spectra are presented.
5. Summary
The paper presents the issue of the modelling of the vertical component of the ground reaction forces (VGRF) generated by running people. Two types of VGRF were analyzed related to two styles of running, i.e., heel-strike running and forefoot-strike running. This approach develops the current way of analysing the issue. The results of laboratory tests of runners allowed the formulation of new proposals for the description of the VGRF parameters. This helps to avoid overestimating the VGRF amplitude, increasing the accuracy of the VGRF determination and, as a consequence, increasing the accuracy of estimation of the dynamic response of the structure subjected to the dynamic action of runners. The presented results of analyses of two different types of forces generated during running can help engineers (structural designers) to better understand the principles and complexity of the VGRF modeling.
Supplementary Materials
Data presented in Figure 5a,b,g,h; Figure 6a,b,g,h; Figure 7a,b and Figure 8a,b are available online as supplementary material in a form of text files (.txt) at https://0-www-mdpi-com.brum.beds.ac.uk/2076-3417/10/5/1575/s1 (this web address must be edited).
Funding
This research was funded by Politechnika Krakowska, Grant no.: L-1/82/2018/DS. The APC was funded by Politechnika Krakowska, Faculty of Civil Engineering.
Conflicts of Interest
The author declare no conflicts of interest.
References
- Zäll, E.; Purroy, J.G.; Andersson, A.; Ülker-Kaustell, M. The effect of runners on footbridges—A case study. In Proceedings of the 6th International Conference Footbridge 2017, Berlin, Germany, 6–9 September 2017; Schlaich, M., Goldack, A., Eds.; Technische Universität Berlin: Berlin, Germany, 2017. [Google Scholar] [CrossRef] [Green Version]
- Wang, C.; Shi, W. Optimal design and application of a multiple tuned mass damper system for an in-service footbridge. Sustainability 2019, 1111. [Google Scholar] [CrossRef] [Green Version]
- Pańtak, M. Dynamic characteristics of medium span truss, cable-stayed and suspension steel footbridges under human-induced excitation. In Proceedings of the 4th International Conference Footbridge 2011, Wrocław, Poland, 6–8 July 2011; Biliszczuk, J., Bien, J., Hawryszkow, P., Kaminski, T., Eds.; Dolnośląskie Wydawnictwo Edukacyjne: Wroclaw, Poland, 2011. [Google Scholar]
- Caetano, E.; Cunha, A.; Câncio Martins, L. Assessment of running pedestrian induced vibrations on a stress-ribbon footbridge. In Proceedings of the 4th International Conference Footbridge 2011, Wrocław, Poland, 6–8 July 2011; Biliszczuk, J., Bien, J., Hawryszkow, P., Kaminski, T., Eds.; Dolnośląskie Wydawnictwo Edukacyjne: Wroclaw, Poland, 2011. [Google Scholar]
- Drygała, I.J.; Polak, M.A.; Dulińska, J.M. Vibration serviceability assessment of GFRP pedestrian bridges. Eng. Struct. 2019, 184, 176–185. [Google Scholar] [CrossRef]
- Hawryszków, P. Dynamical investigation of a footbridge in Wronki near Poznań. In Proceedings of the 8th International Conference on Arch Bridges ARCH 2016, Wrocław, Poland, 5–7 October 2016; Biliszczuk, J., Bien, J., Hawryszkow, P., Kaminski, T., Eds.; Dolnośląskie Wydawnictwo Edukacyjne: Wroclaw, Poland, 2016; pp. 691–700. [Google Scholar]
- Occhiuzzi, A.; Spizzuoco, M.; Ricciardelli, F. Loading models and response control of footbridges excited by running pedestrians. Struct. Contr. Health Monit. 2008, 1515, 349–368. [Google Scholar] [CrossRef]
- Živanović, S. Vibration serviceability of a footbridge under vertical pedestrian load. In Proceedings of the 11th Symposium on Structural Dynamics and Vibration Measurement, Dubendorf, Switzerland, 30 May 2008. [Google Scholar]
- Rainer, J.H.; Pernica, G. Vertical dynamic forces from footsteps. Can. Acoust. 1986, 14, 12–21. [Google Scholar]
- Rainer, J.H.; Pernica, G.; Allen, D.E. Dynamic loading and response of footbridges. Can. J. Civ. Eng. 1988, 1515, 66–71. [Google Scholar] [CrossRef] [Green Version]
- International Organization for Standardization. Bases for Design of Structures—Serviceability of Buildings and Walkways Against Vibrations; ISO 10137:2007; International Organization for Standardization: Geneva, Switzerland, 2007. [Google Scholar]
- Bachmann, H.; Ammann, W.; Deischl, F.; Eisenmann, J.; Floegl, I.; Hirsch, G.H.; Klein, G.K.; Lande, G.J.; Mahrenholtz, O.; Natke, H.G.; et al. Vibration Problems in Structures: Practical Guideline; Birkhäuser Verlag: Basel, Switzerland, 1995. [Google Scholar]
- Bachmann, H.; Ammann, W. Vibrations in Structures Induced by Man and Machines; IABSE: Zurich, Switzerland, 1987. [Google Scholar]
- Feldmann, M.; Heinemeyer, C.; Lukić, M.; Caetano, E. Human Induced Vibration of Steel Structure (HIVOSS): Background Document; European Union: Luxembourg, 2008. [Google Scholar]
- Pańtak, M. Runners on footbridges—A new VGRF model for heel strike running technique. MATEC Web Conf. 2019, 262, 64. [Google Scholar] [CrossRef]
- Gruber, A.H.; Edwards, W.B.; Hamill, J.; Derrick, T.R.; Boyer, K.A. A comparison of the ground reaction force frequency content during rearfoot and non-rearfoot running patterns. Gait Posture 2017, 56, 54–59. [Google Scholar] [CrossRef] [PubMed]
- Hamill, J.; Gruber, A.H. Is changing footstrike pattern beneficial to runners? J. Sport Health Sci. 2017, 66, 146–153. [Google Scholar] [CrossRef] [PubMed]
- Racic, V.; Morin, J.B. Data-driven modelling of vertical dynamic excitation of bridges induced by people running. Mech. Sys. Sig. Proc. 2014, 43, 153–170. [Google Scholar] [CrossRef]
- Clark, K.P.; Ryan, L.J.; Weyand, P.G. Foot speed, foot-strike and footwear: Linking gait mechanics and running ground reaction forces. J. Exp. Biol. 2014, 217, 2037–2040. [Google Scholar] [CrossRef] [PubMed] [Green Version]
- Clark, K.P.; Ryan, L.J.; Weyand, P.G. A general relationship links gait mechanics and running ground reaction forces. J. Exp. Biol. 2017, 220, 247–258. [Google Scholar] [CrossRef] [PubMed] [Green Version]
- Almeida, M.O.; Saragiotto, B.T.; Yamato, T.P.; Lopes, A.D. Is the rearfoot pattern the most frequently foot strike pattern among recreational shod distance runners? Phys. Thera. Sport 2015, 16, 29–33. [Google Scholar] [CrossRef] [PubMed]
- Bakkie, D.; Mache, M.A.; Johnson, C.; Garcia-Krauss, P.; Kendall, K.; Hsieh, C. Foot strike pattern trends in sub-elite half marathon runners. In Proceedings of the 31 International Conference on Biomechanics in Sports, Taipei, Taiwan, 07–11 July 2013; University of Konstanz Open Journal Systems (OJS): Konstanz, Germany, 2013. [Google Scholar]
- Larson, P.; Higgins, E.; Kaminski, J.; Decker, T.; Preble, J.; Lyons, D.; McIntyre, K.; Normile, A. Foot strike patterns of recreational and sub-elite runners in a long-distance road race. J. Sports Sci. 2011, 2929, 1665–1673. [Google Scholar] [CrossRef] [PubMed]
- Hasegawa, H.; Yamauchi, T.; Kraemer, W.J. Foot strike patterns of runners at the 15-km point during an elite-level half marathon. J. Str. Cond. Res. 2007, 2121, 888–893. [Google Scholar] [CrossRef]
- Hawryszków, P. Analysis of dynamical sensitivity and comfort of footbridges. In Proceedings of the 4th International Conference Footbridge 2011, Wrocław, Poland, 6–8 July 2011; Biliszczuk, J., Bien, J., Hawryszkow, P., Kaminski, T., Eds.; Dolnośląskie Wydawnictwo Edukacyjne: Wroclaw, Poland, 2011. [Google Scholar]
- Hawryszków, P. Experimental vibration analysis of footbridges. In Proceedings of the Conference EVACES 2013: Experimental Vibration Analysis for Civil Engineering Structures, 2013, Ouro Preto, Brazil, 28–30 October 2013; Cury, A., Barbosa, F., Eds.; Even3: San Paulo, Brazil, 2017. [Google Scholar]
- Živanović, S.; Pavic, A.; Reynolds, P. Vibration serviceability of footbridges under human-induced excitation: A literature review. J. Sound. Vib. 2005, 279, 1–74. [Google Scholar] [CrossRef] [Green Version]
- Nilsson, J.; Thorstensson, A. Ground reaction forces at different speeds of human walking and running. Acta Physiol. Scand. 1989, 136136, 217–227. [Google Scholar] [CrossRef]
- Keller, T.S.; Weisberger, A.M.; Ray, J.L.; Hasan, S.S.; Shiavi, R.G.; Spengler, D.M. Relationship between vertical ground reaction force and speed during walking, slow jogging, and running. Clin. Biomech. 1996, 1111, 253–259. [Google Scholar] [CrossRef]
- Wheeler, J.E. Prediction and control of pedestrian-induced vibration in footbridges. J. Str. Div. 1982, 108108, 2045–2065. [Google Scholar]
Figure 1.
Examples of time courses of normalised ground reaction forces FVGRF for different foot-strike patterns for running frequency fr = 2.80 Hz: (a) heel-strike pattern, (b) midfoot-strike pattern, (c) forefoot-strike pattern (based on the author’s research results).
Figure 1.
Examples of time courses of normalised ground reaction forces FVGRF for different foot-strike patterns for running frequency fr = 2.80 Hz: (a) heel-strike pattern, (b) midfoot-strike pattern, (c) forefoot-strike pattern (based on the author’s research results).

Figure 2.
Running volunteers during the experiment (grey rectangle—the region of force measurement).
Figure 2.
Running volunteers during the experiment (grey rectangle—the region of force measurement).

Figure 3.
The FVGRF curve indicators for heel-strike running style:(a) indicator App,h, (b) indicator tpp,h, (c) indicator tca,h, (d) indicator Aip, (e) indicator tip.
Figure 3.
The FVGRF curve indicators for heel-strike running style:(a) indicator App,h, (b) indicator tpp,h, (c) indicator tca,h, (d) indicator Aip, (e) indicator tip.

Figure 4.
The FVGRF curve indicators for forefoot-strike running style: (a) indicator App,f, (b) indicator tpp,f, (c) indicator tca,f.
Figure 4.
The FVGRF curve indicators for forefoot-strike running style: (a) indicator App,f, (b) indicator tpp,f, (c) indicator tca,f.

Figure 5.
Sample charts of the FVGRF curves generated by heel-strike runners (fr = 2.80 Hz) and their corresponding amplitudes and phase angles for 15 harmonics: (a,b,g,h) examples of the FVGRF curves; (c,d,i,j) normalised amplitudes of the FVGRF harmonics; (e,f,k,l) phase angles of the FVGRF harmonics (The data presented can be found in Supplementary Materials in the form of text files containing numerical data. See section Supplementary Materials).


Figure 6.
Sample charts of the FVGRF curves generated by forefoot-strike runners (fr = 2.80 Hz) and their corresponding amplitudes and phase angles for 15 harmonics: (a,b,g,h) examples of the FVGRF curves; (c,d,i,j) normalised amplitudes of the FVGRF harmonics; (e,f,k,l) phase angles of the FVGRF harmonics (The data presented can be found in Supplementary Materials in the form of text files containing numerical data. See section Supplementary Materials).


Figure 7.
The charts of (a) normalised amplitudes (log scale for the φi-axis) and (b) phase angles (linear scale for both axis) of the fifteen harmonics determined for forty FVGRF samples generated by four heel-strike runners (fr = 2.80 Hz) (The data presented can be found in Supplementary Materials in the form of text files containing numerical data. See section Supplementary Materials).


Figure 8.
The charts of (a) normalised amplitudes (log scale for the φi-axis) and (b) phase angles (linear scale for both axis) of the fifteen harmonics determined for forty FVGRF samples generated by four forefoot-strike runners (fr = 2.80 Hz) (The data presented can be found in Supplementary Materials in the form of text files containing numerical data. See section Supplementary Materials).

Figure 9.
Impact of the number of harmonics on the accuracy of the FVGRF curve modeling: (a–d) heel-strike running; (e–h) forefoot-strike running: (a,e) model containing 3 harmonics; (b,f) model containing 5 harmonics; (c,g) model containing 10 harmonics; (d,h) model containing 15 harmonics (upper chart—the FVGRF curves, lower chart—residual plots; dot line—result of laboratory test, solid line—result of the FVGRF fitting).

Figure 10.
An example of an artificially generated vertical component of the ground reaction force for heel-strike running: (a) normalised ground reaction force FVGRF generated using the half-sine model and normalised impact peak generated using the impact peak function, (b) the sum of normalised VGRF and normalised impact peak (solid bold line) in relation to the results of laboratory tests (thin dashed lines), (c) the amplitudes spectrum of the generated FVGRF, (d) phase angles spectrum of the generated FVGRF.


Table 1.
App,h, App,f, tpp,h, tpp,f indicators of the FVGRF curve (mean ± standard deviation).
| Step Frequency [Hz] | Heel-Strike Runners | Forefoot-Strike Runners | ||
|---|---|---|---|---|
| App,h ± SD | tpp,h ± SD [s] | App,f ± SD | tpp,f ± SD [s] | |
| 2.4 | 2.047 ± 0.178 | 0.153 ± 0.012 | 2.300 ± 0.127 | 0.125 ± 0.013 |
| 2.6 | 2.155 ± 0.171 | 0.134 ± 0.011 | 2.385 ± 0.124 | 0.114 ± 0.011 |
| 2.8 | 2.203 ± 0.192 | 0.122 ± 0.014 | 2.488 ± 0.155 | 0.104 ± 0.012 |
| 3.0 | 2.180 ± 0.176 | 0.113 ± 0.013 | 2.453 ± 0.059 | 0.102 ± 0.010 |
| 3.2 | 2.098 ± 0.181 | 0.107 ± 0.009 | 2.450 ± 0.078 | 0.095 ± 0.011 |
| 3.4 | 2.085 ± 0.191 | 0.103 ± 0.012 | 2.428 ± 0.153 | 0.096 ± 0.011 |
Table 2.
tca,h, tca,f indicators of the FVGRF curve (mean ± standard deviation).
| Step Frequency [Hz] | Heel-Strike Runners | Forefoot-Strike Runners |
|---|---|---|
| tca,h ± SD [s] | tca,f ± SD [s] | |
| 2.4 | 0.320 ± 0.019 | 0.283 ± 0.009 |
| 2.6 | 0.281 ± 0.015 | 0.253 ± 0.006 |
| 2.8 | 0.254 ± 0.017 | 0.226 ± 0.005 |
| 3.0 | 0.240 ± 0.017 | 0.213 ± 0.006 |
| 3.2 | 0.235 ± 0.008 | 0.200 ± 0.005 |
| 3.4 | 0.222 ± 0.015 | 0.190 ± 0.006 |
Table 3.
Aip, tip indicators of the FVGRF curve (mean ± standard deviation).
| Step Frequency [Hz] | Heel-Strike Runners | |
|---|---|---|
| Aip ± SD | tip ± SD [s] | |
| 2.4 | 1.245 ± 0.130 | 0.048 ± 0.008 |
| 2.6 | 1.311 ± 0.225 | 0.044 ± 0.008 |
| 2.8 | 1.280 ± 0.215 | 0.041 ± 0.006 |
| 3.0 | 1.255 ± 0.212 | 0.041 ± 0.008 |
| 3.2 | 1.345 ± 0.210 | 0.038 ± 0.007 |
| 3.4 | 1.346 ± 0.147 | 0.038 ± 0.005 |
Table 4.
Estimated parameters of the FVGRF indicators.
| Frequency fr [Hz] | tca,he [s] Equation (1) | tca,fe [s] Equation (2) | tce = 0.5 Tr [s] | App,he (for tca,h) | App,fe (for tca,f) | Appe (for tc) | ||
|---|---|---|---|---|---|---|---|---|
| 2.4 | 0.322 | 0.283 | 0.208 | 2.035 | 2.315 | 3.142 | 0.768 | 0.679 |
| 2.6 | 0.282 | 0.251 | 0.192 | 2.145 | 2.407 | 3.142 | 0.731 | 0.658 |
| 2.8 | 0.257 | 0.228 | 0.179 | 2.186 | 2.462 | 3.142 | 0.711 | 0.633 |
| 3.0 | 0.241 | 0.211 | 0.167 | 2.172 | 2.481 | 3.142 | 0.720 | 0.639 |
| 3.2 | 0.231 | 0.199 | 0.156 | 2.123 | 2.469 | 3.142 | 0.752 | 0.640 |
| 3.4 | 0.225 | 0.190 | 0.147 | 2.052 | 2.433 | 3.142 | 0.755 | 0.646 |
where: Tr = 1/fr; App,he, App,fe, Appe—estimated amplitudes of normalised ground reaction forces FVGRF: App,he = π/(2·tca,he·fr); App,fe = π/(2·tca,fe·fr); Appe = π/(2·tce·fr) according to [7]. The amplitudes of the real VGRFs should be calculated as follows, e.g., App,hR = App,he·G, App,fR = App,fe·G, AppR = Appe·G, where G—weight of running person.
© 2020 by the author. Licensee MDPI, Basel, Switzerland. This article is an open access article distributed under the terms and conditions of the Creative Commons Attribution (CC BY) license (http://creativecommons.org/licenses/by/4.0/).
Share and Cite
MDPI and ACS Style
Pańtak, M. Ground Reaction Forces Generated by Runners—Harmonic Analyses and Modelling. Appl. Sci. 2020, 10, 1575. https://0-doi-org.brum.beds.ac.uk/10.3390/app10051575
AMA Style
Pańtak M. Ground Reaction Forces Generated by Runners—Harmonic Analyses and Modelling. Applied Sciences. 2020; 10(5):1575. https://0-doi-org.brum.beds.ac.uk/10.3390/app10051575
Chicago/Turabian StylePańtak, Marek. 2020. "Ground Reaction Forces Generated by Runners—Harmonic Analyses and Modelling" Applied Sciences 10, no. 5: 1575. https://0-doi-org.brum.beds.ac.uk/10.3390/app10051575
Note that from the first issue of 2016, this journal uses article numbers instead of page numbers. See further details here.