Article

A Biomechanical Investigation of Athletic Footwear Traction Performance: Integration of Gait Analysis with Computational Simulation

1
Department of Orthopedic Surgery, Shin Kong Wu Ho-Su Memorial Hospital, Taipei 111, Taiwan
2
School of Medicine, College of Medicine, Fu Jen Catholic University, New Taipei City 242, Taiwan
3
Graduate Institute of Applied Science and Technology, National Taiwan University of Science and Technology, Taipei 106, Taiwan
4
Graduate Institute of Biomedical Engineering, National Taiwan University of Science and Technology, Taipei 106, Taiwan
5
Footwear & Recreation Technology Research Institute, Taichung 407, Taiwan
*
Author to whom correspondence should be addressed.
Both authors contributed equally to this work.
Submission received: 13 February 2020 / Accepted: 26 February 2020 / Published: 2 March 2020
(This article belongs to the Special Issue Applied Biomechanics in Sport, Rehabilitation and Ergonomy)

Abstract

:
Evaluations are vital to quantify the functionalities of athletic footwear, such as the performance of slip resistance, shock absorption, and rebound. Computational technology has progressed to become a promising solution for accelerating product development time and providing customized products in order to keep up with the competitive contemporary footwear market. In this research, the effects of various tread pattern designs on traction performance in a normal gait were analyzed by employing an approach that integrated computational simulation and gait analysis. A state-of-the-art finite element (FE) model of a shoe was developed by digital sculpting technology. A dynamic plantar pressure distribution was automatically applied to interpret individualized subject conditions. The traction performance and real contact area between the shoe and the ground during the gait could be characterized and predicted. The results suggest that the real contact area and the structure of the outsole tread design influence the traction performance of the shoe in dry conditions. This computational process is more efficient than mechanical tests in terms of both cost and time, and it could bring a noticeable benefit to the footwear industry in the early design phases of product development.

Graphical Abstract

1. Introduction

With the significant rise in exercising, the demand for athletic footwear products has grown rapidly. To keep up, the footwear industry has been required to expand product range, accelerate the product development time, and provide customized products. Performing an evaluation is vital in product design, prototyping, biomechanics, and other areas in order to quantify the functions of athletic footwear. These functions include traction, motion control, and the attenuation of impact forces during a motion [1]. Focusing on footwear traction, a proper traction can effectively maximize performance or minimize the risk of injury [2]. The traction is typically measured in terms of the shoe–floor coefficient of friction by various slip testers [3,4,5,6]. However, the results of slip testing in predicting the coefficient of friction are inconsistent [7]. On the other hand, experimental tests are time-consuming and expensive, and they cannot keep pace with the growing demand within the footwear market. Developing a numerical simulation could reduce the number of design iterations and improve design quality, and it promises a more efficient and less costly product development process. Previous studies have developed a finite element (FE) model to predict the coefficient of friction between the shoe and floor [8,9]. However, the shoe models had been simplified to a rear part of the outsole. In a previous case study, the outsoles of military boots with five different tread patterns were used to investigate how the tread patterns affect traction-force, which resists slip in a gaiting direction [10]. However, the uniform vertical force of 200 N was applied as the only loading condition. The dynamic simulation was conducted to predict the slip resistant performance by calculating the reaction force [11]. However, the models were simplified to an outsole without complex curves. Oversimplified or unaesthetic models and a lack of subject-specific loading conditions are the primary disadvantages of previous numerical studies of footwear.
In the present study, digital sculpting technology was employed to create the complex curved shapes of a shoe model. Plantar pressure measurement was performed to obtain the personal pressure data. The non-linear FE method was used to simulate the traction performance under subject-specific loading, which was defined by plantar pressure measurement. The mechanical tests were performed to validate the results of the FE analysis. This study aimed to demonstrate an approach that integrated digital sculpting technology and an FE method with gait analysis, and to evaluate the effect of a variety of tread pattern designs on the traction performance during the gait.

2. Materials and Methods

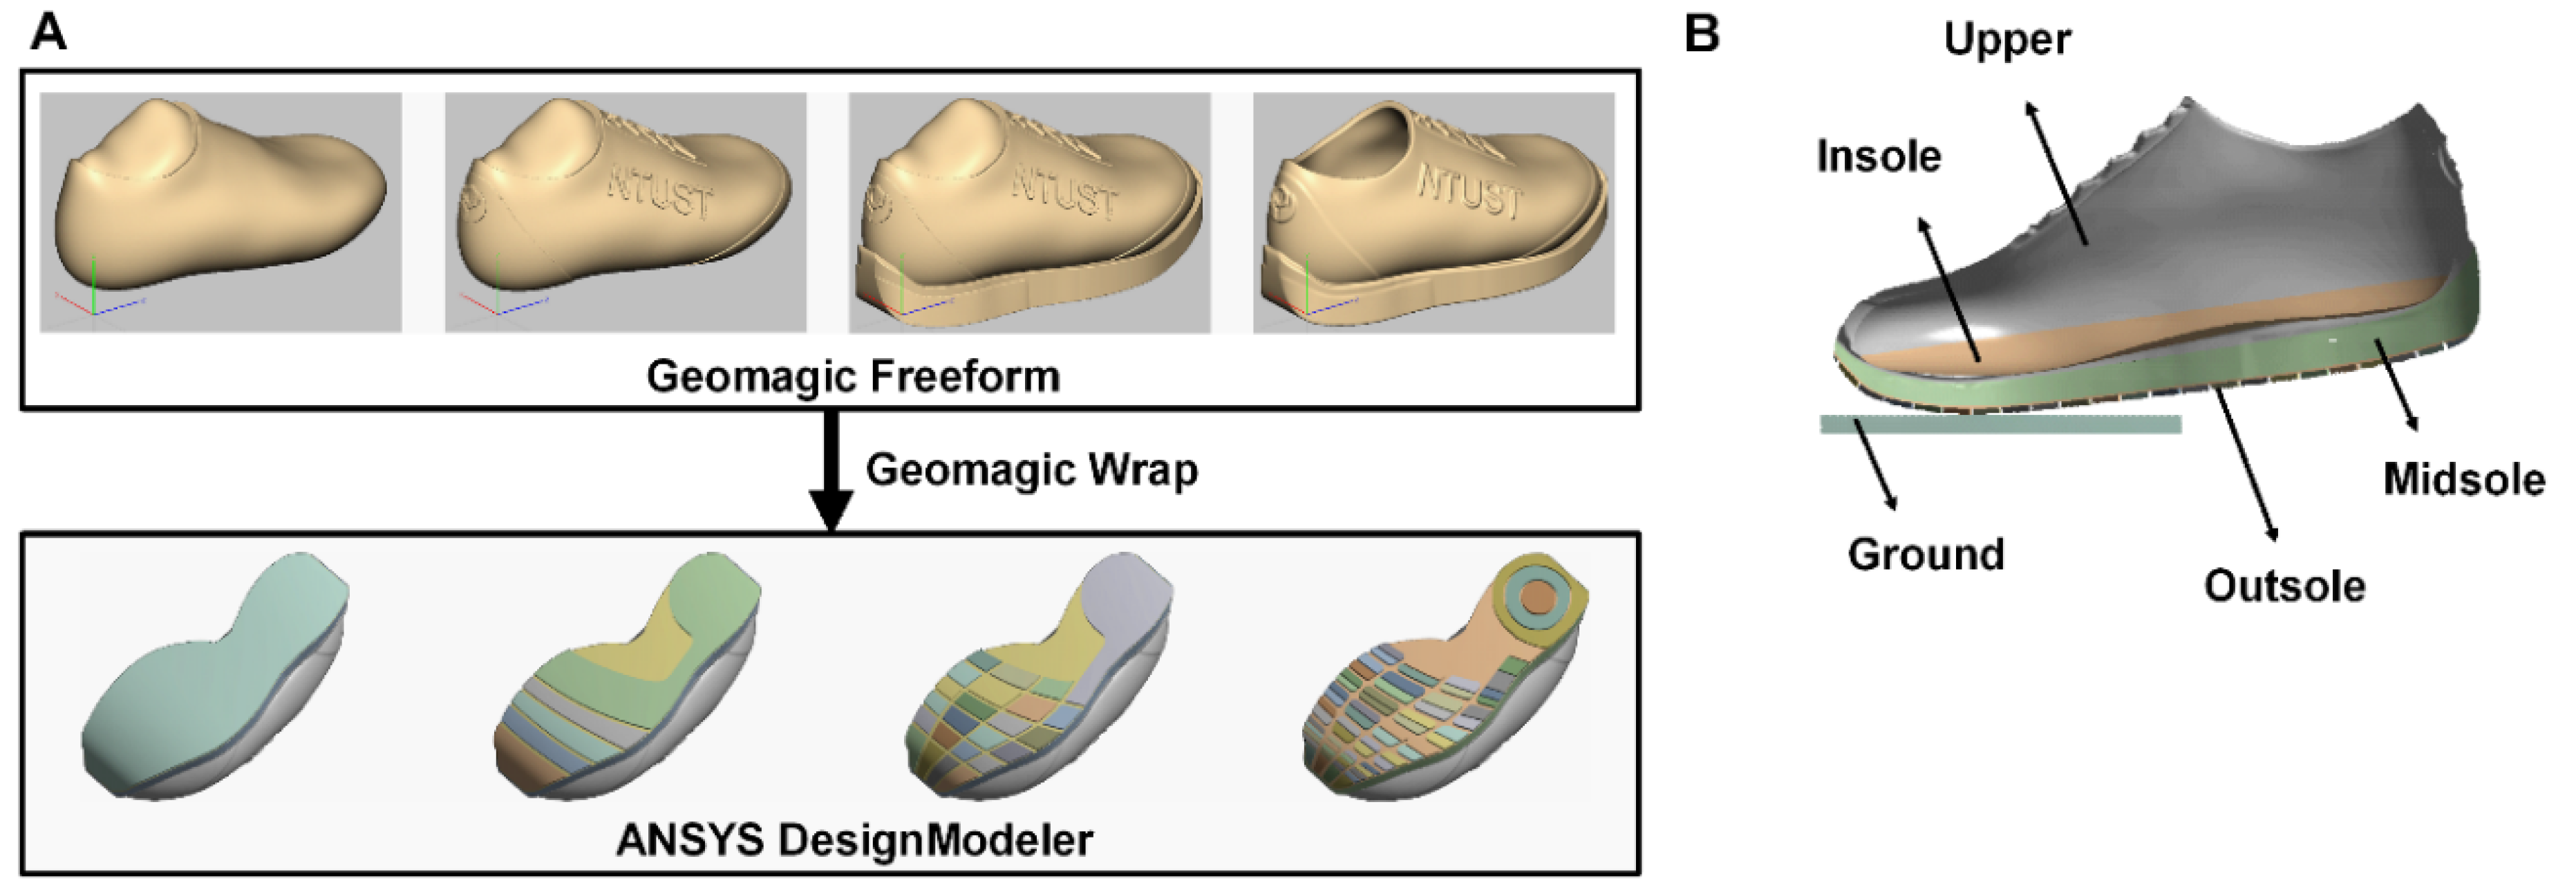
2.1. Development of Shoe Geometry

In this research, we used Geomagic Freeform (3D Systems, Rock Hill, SC, USA), a digital sculpting technology, to create the three-dimensional (3D) shoe model. Geomagic Freeform enables users to easily create a model with complex curves, especially when compared to traditional computer-aided design programs, which struggle to do so [12,13]. The file format conversion was needed before transmitting the file of shoe model to the ANSYS Workbench 18.2 (ANSYS, Inc., Canonsburg, PA, USA). The digital sculpting shoe model was converted by Geomagic Wrap (3D Systems, Rock Hill, SC, USA) then imported in the ANSYS DesignModeler, one of the built-in geometric modelers in Workbench, to accurately create and parametrically control the tread patterns (Figure 1A). The 3D shoe–ground model consisted of elements including ground, outsole, midsole, insole, and upper (Figure 1B). Ten types of outsole tread pattern design were divided into two groups, as shown in Figure 2. Two common outsole tread designs, straight stripe and herringbone, were developed in “group one”. The height of the two types of straight stripe design were 3 and 6 mm, respectively; the grooves between each tread were both 3 mm (G1_S_Height-3 and G1_S_Height-6). The tread width of the two types of herringbone design were 10 and 30 mm; the grooves between each tread, the tread height, and the tread angle were 3 mm, 3 mm, and 90° (G1_H_width-10 and G1_H_width-30), respectively. Two commercially available tread pattern designs (G2_A and G2_B) and four original designs (G2_C, G2_D, G2_E, and G2_F) were developed in “group two”. The difference between G2_E and G2_F was the height of the straight stripe and the groove in the front part of the outsole.

2.2. Plantar Pressure Measurements during Gait

To evaluate the traction performance in a physiological loading condition, plantar pressure was measured during a gait. Data of dynamic plantar pressure were recorded using an in-shoe pressure measurement system called the F-Scan Wireless System (Tekscan, Inc., South Boston, MA, USA), and synchronized with force plates (Kistler, Inc., Winterthur, Switzerland). The F-Scan Wireless System consists of an in-shoe sensor and software for data analysis. In this study, the sensing region of a 3000 Esport in-shoe sensor was 2.5 mm × 2.5 mm × 0.406 mm, and the pressure-sensitive area of the sensor was 305 mm × 107 mm. The total number of sensels was 954 (resolution: 3.9 sensel/cm2), with a 75–125 psi pressure range. The F-Scan Wireless System was attached to one subject (male, aged 24, 58 kg weight and 166 cm height), who performed level walking at a naturally self-selected pace across the force plates (Figure 3). Three major phases of a right foot gait cycle were identified and selected: loading response, mid-stance, and push-off. These phases were selected based on the ground reaction force (GRF) profiles from the force plates and the foot contact area from the F-Scan Wireless System. The maximum GRF in the anteroposterior and mediolateral direction before the first peak was defined as the loading response phase; the maximum foot contact area was defined as the mid-stance phase; and the second peak of the GRF was defined as the push-off phase. After the definition of the major phases, the dynamic plantar pressure charts of each were exported from the F-Scan System program. According to the literature, the plantar pressure distribution charts could be divided into three regions: forefoot, mid-foot, and rearfoot [14] (Figure 3). The loading conditions of the FE analysis were based on the pressure distribution charts.

2.3. Finite Element Model

After model preparation in the ANSYS DesignModeler, the ANSYS Workbench 18.2 static structural module (ANSYS, Inc., Canonsburg, PA, USA) was employed to simulate the footwear traction performance. Footwear is normally manufactured using very compressible rubber-like materials that can be modelled by a hyperelastic material model, and a strain-energy function is needed to describe their mechanical behavior [15,16,17,18,19,20]. In the current study, an Ogden foam second-order material model was used for the footwear, and the values of the elastomeric Ogden foam parameters are shown in Table 1 [21]. The Young’s modulus of the ground was 17,000 MPa, while the Poisson’s ratio was 0.1 [21]. In terms of element types, the ground and the outsole were modelled with hex dominant elements, whereas the upper, insole, and midsole sections were modelled with tetrahedron elements. The convergence analysis was conducted by manually refining the mesh size of the outsole and the ground until the difference between the results of the reaction force and real contact area were less than the convergence criterion, with an allowance of error of 0.5%. Through this convergence process, the optimal mesh density was determined. The element size of upper, insole, and midsole were 4 mm, while the outsole and ground were 1.7 mm. Each FE model contained approximately 858,074 to 1,014,773 nodes, and 377,489 to 465,000 elements. The frictional contact between the relevant surfaces of the outsole and the ground was applied by using CONTA 174 and TARGE 170 elements. The contact elements with the default settings were used. The coefficient of friction was 0.6, as a static coefficient of friction of 0.5 was recommended by James Miller as the minimum slip-resistant standard [22], and others have proposed an optimal coefficient of friction for various sports between 0.5 and 0.7 [23]. The foot angles in three different positions were defined to mimic level walking (Figure 4). The foot angle was set to 6°, as the average foot angle is between 5° and 7° [24]. The contact angle between the bottom of the heel and the ground was 7° during the loading response phase. The contact angle between the bottom of the shoe and the ground was 7° during the push-off phase. The footwear was parallel with the ground during the mid-stance phase (Figure 4).

2.4. Simulation Condition and Data Output

In this research, a total of thirty FE analyses were conducted using ten types of tread pattern design with three positions: loading response, mid-stance, and push-off. The traction analysis was performed by fully constraining both ends of the shoe throughout the simulation. The horizontal displacement was applied to the bottom surface of the ground to mimic the sliding behavior. The moving directions of the ground were defined based on the international standard ISO 13287 [25]. All of the data from the dynamic plantar pressure were applied as the loading conditions. We used the time-effective ANSYS Application Customization Toolkit (ANSYS ACT), an add-on module to the Workbench Environment based on Python and XML, to create the automatic pressure generator on the insole (Figure 4). In this FE analysis process, two steps were considered: loading application and ground movement. The dynamic plantar pressure was applied at the first step, and the displacement of the ground was applied at the second step. In post-processing, the horizontal reaction force of the bottom surface of the ground was calculated and considered as the friction force to evaluate the traction performance [26]. A higher value reaction force indicated better traction performance. Additionally, the real contact area of the outsole was calculated to understand the contact area of the shoe after the loading application and ground movement.

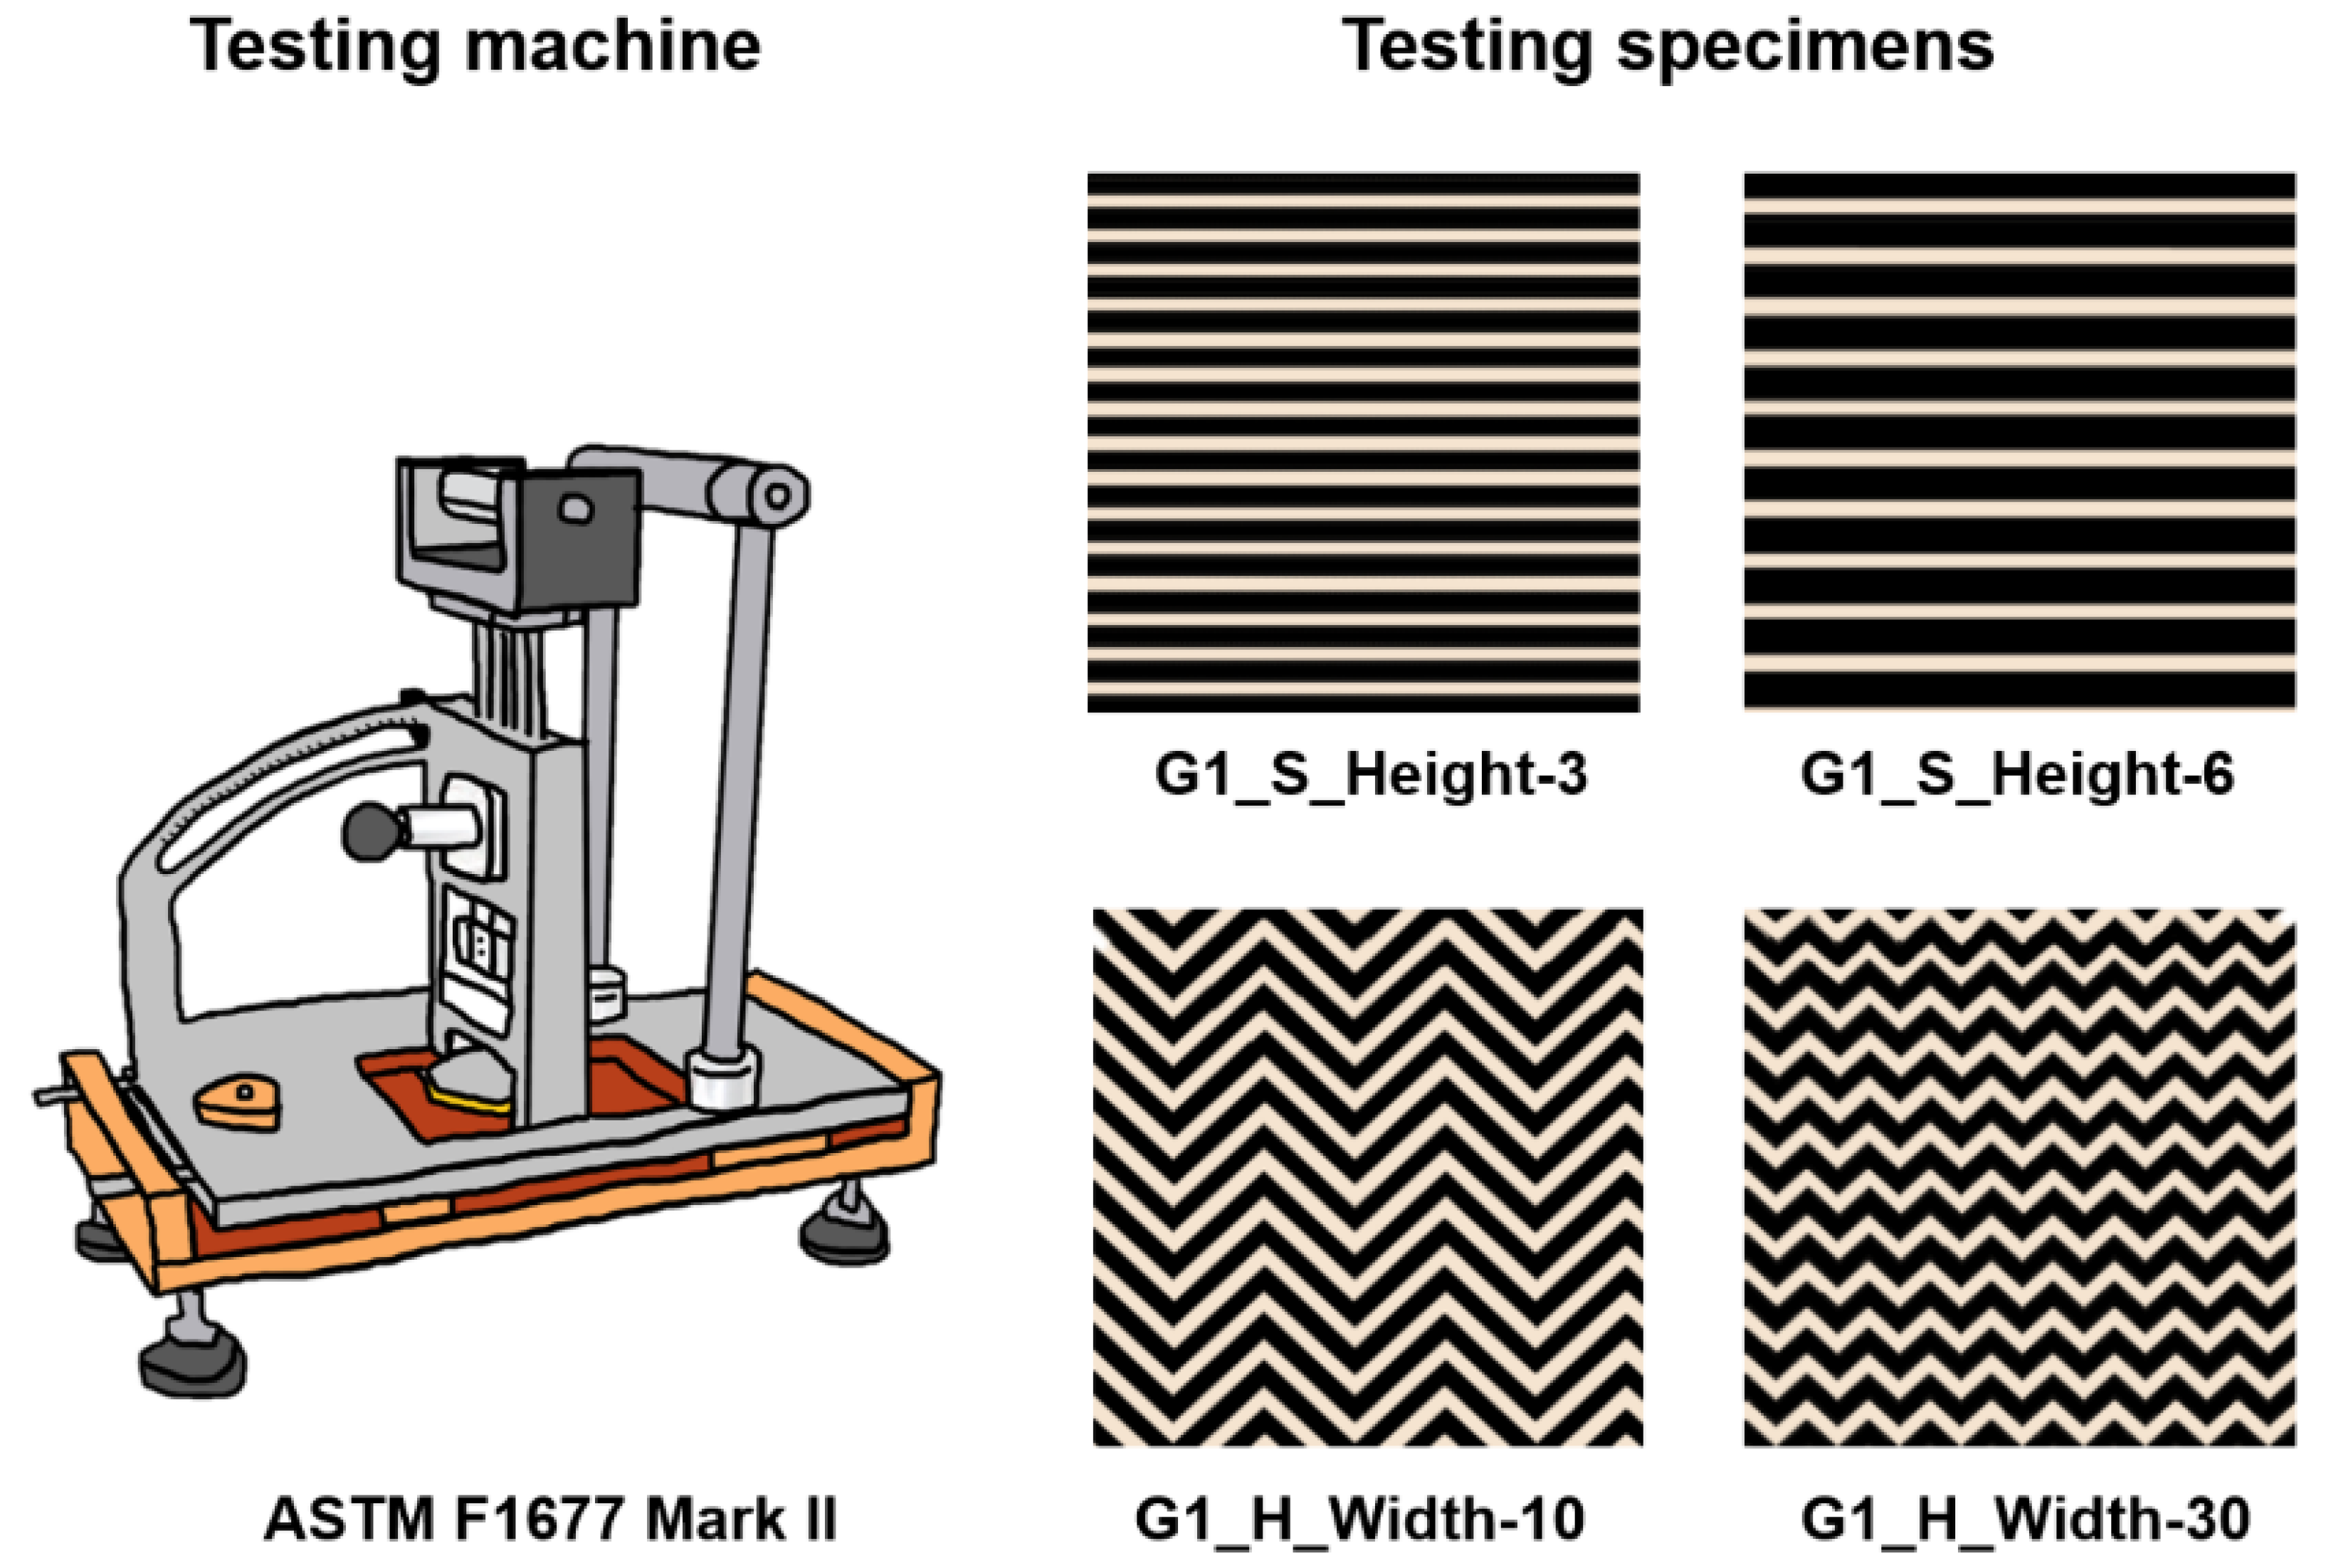
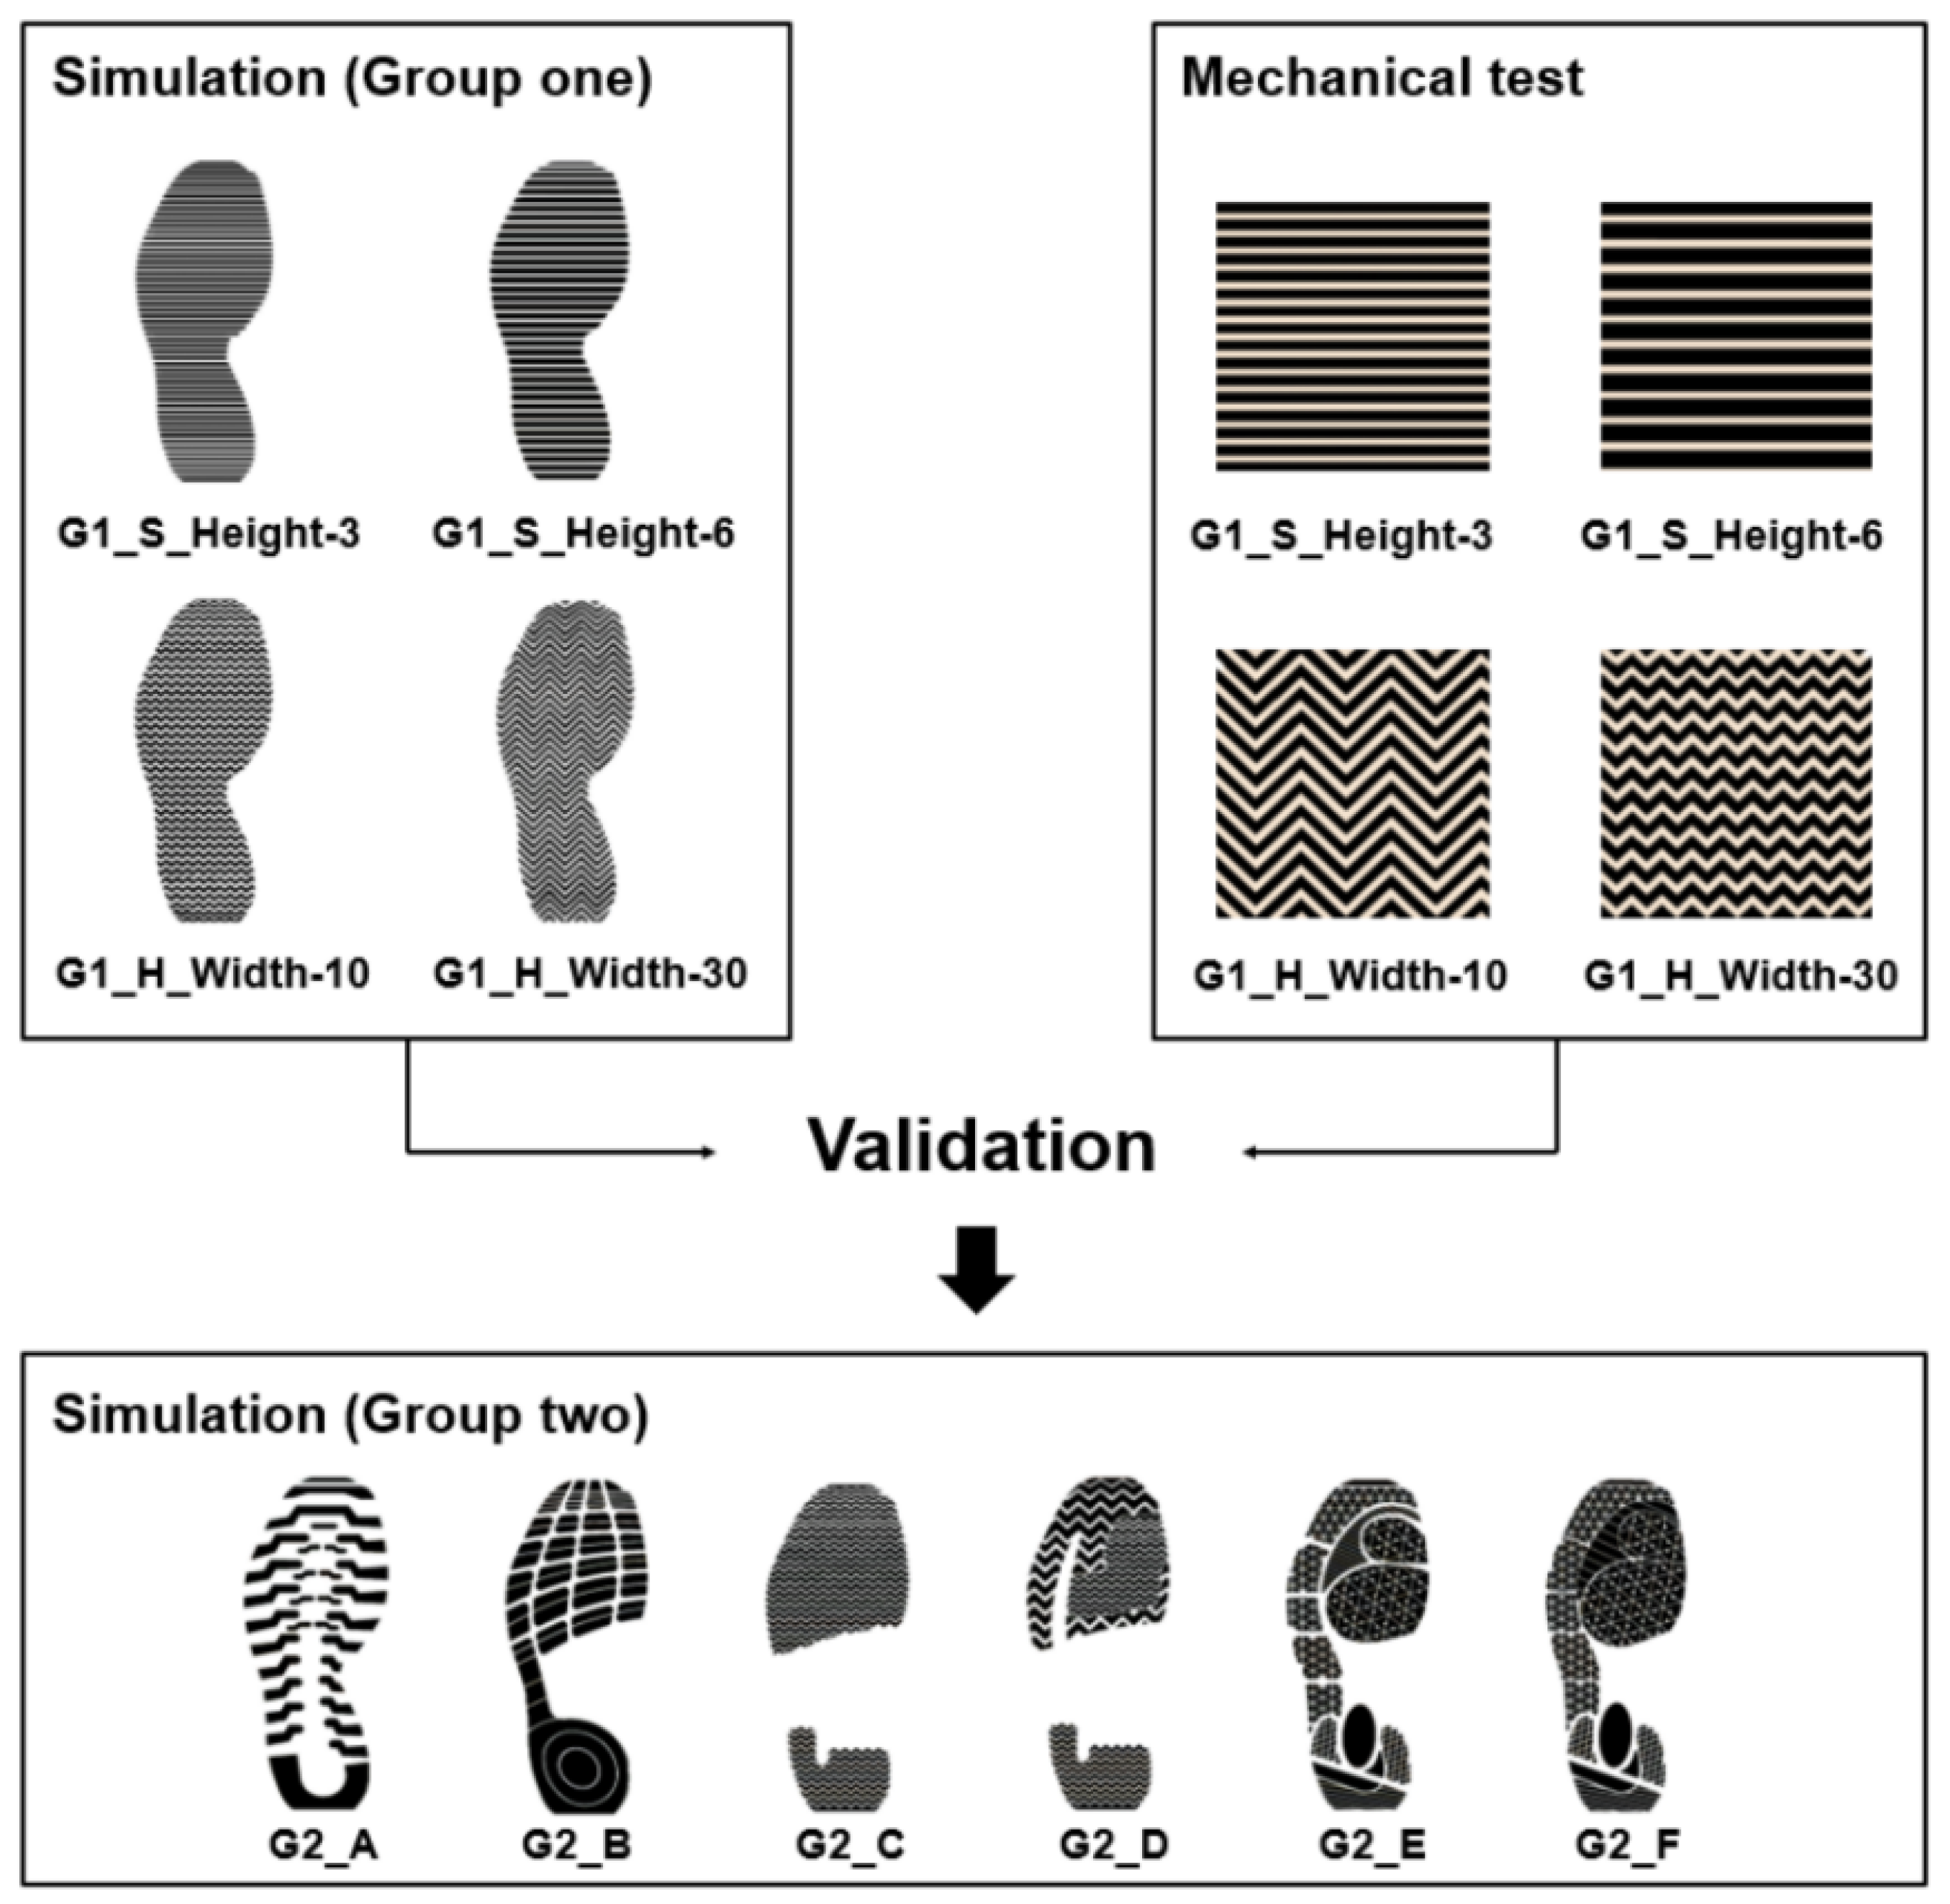
2.5. Experiment for FE Model Validation

An experimental test was conducted to validate the feasibility and applicability of the numerical simulation. Four types of tread design (straight stripe with 3 mm height, straight stripe with 6 mm height, herringbone with 3 mm height, and herringbone with 6 mm height) predicted by the FE method in group one were selected for the slip-resistance test. Before performing any tests, a horizontal surface was needed on which to place the testing machine. The specimen was placed parallel to both the floor with the dry condition and the test holder. Initially, the test was performed by leaving the rotating support in the vertical position and the weight was released using the trigger. It was noted visually whether the specimen slipped when it contacted the floor surface. Without moving the tester, the steps described above were repeated, increasing the angle of rotating support until the slip just occurred. The corresponding value of the coefficient of friction was obtained and recorded. The operational procedure was followed using a previous slip-resistance standard test (ASTM F 1677 for Mark II) [27] (Figure 5). Each test was repeated three times, and the average coefficient of friction was reported. The experimental measurements of the coefficient of friction were compared to their FE results.

2.6. Experimental–Computational Correlation

The flowchart of the experimental–computational process is illustrated in Figure 6. The four types of tread design (straight stripe with 3 mm height, straight stripe with 6 mm height, herringbone with 3 mm height, and herringbone with 6 mm height) were first selected to compare their FE predicted results to the experimental data. As strong positive correlations between the FE prediction and the mechanical testing measurement were found, the traction simulations of new designs, group two, were then conducted.

3. Results

3.1. FE Model Validation

The FE analyses in this research were conducted for the loading response, mid-stance, and push-off phases, which represent the entire stance phase of a gait cycle. The experimental measurements of the coefficient of friction for the four testing specimens were compared to their FE predicted reaction force, group one. The predicted FE reaction forces in group one were found to reasonably comply with the experimental measurement of the coefficient of friction. Strong positive correlations existed between the reaction force during the entire stance phase of the gait cycle in the FE analysis and the coefficient of friction in mechanical testing: R2 = 0.936 at loading response, R2 = 0.920 at mid-stance, and R2 = 0.935 at push-off (Figure 7).

3.2. Traction Performance Evaluation of Group One

The reaction force of the four types of straight stripe and herringbone tread pattern design in group one is shown in Figure 7. It is observed that G1_S_Height-3 had the lowest value reaction force during the entire stance phase of the gait cycle. The results of the reaction force in the moving direction revealed slightly different trends between the loading response, mid-stance, and push-off phases. The straight stripe tread pattern (G1_S_Height-3 and G1_S_Height-6) had a lower value reaction force than that of the herringbone tread pattern (G1_S_Width-10 and G1_S_Width-30) during the entire stance phase of the gait cycle, except for G1_S_Height-6 at the push-off phase. The higher height of straight stripe (G1_S_Height-6) had a higher reaction force during the entire stance phase of the gait cycle. In terms of the tread width of herringbone, the results show that a higher value of tread width had a higher reaction force at the loading response and push-off phases.

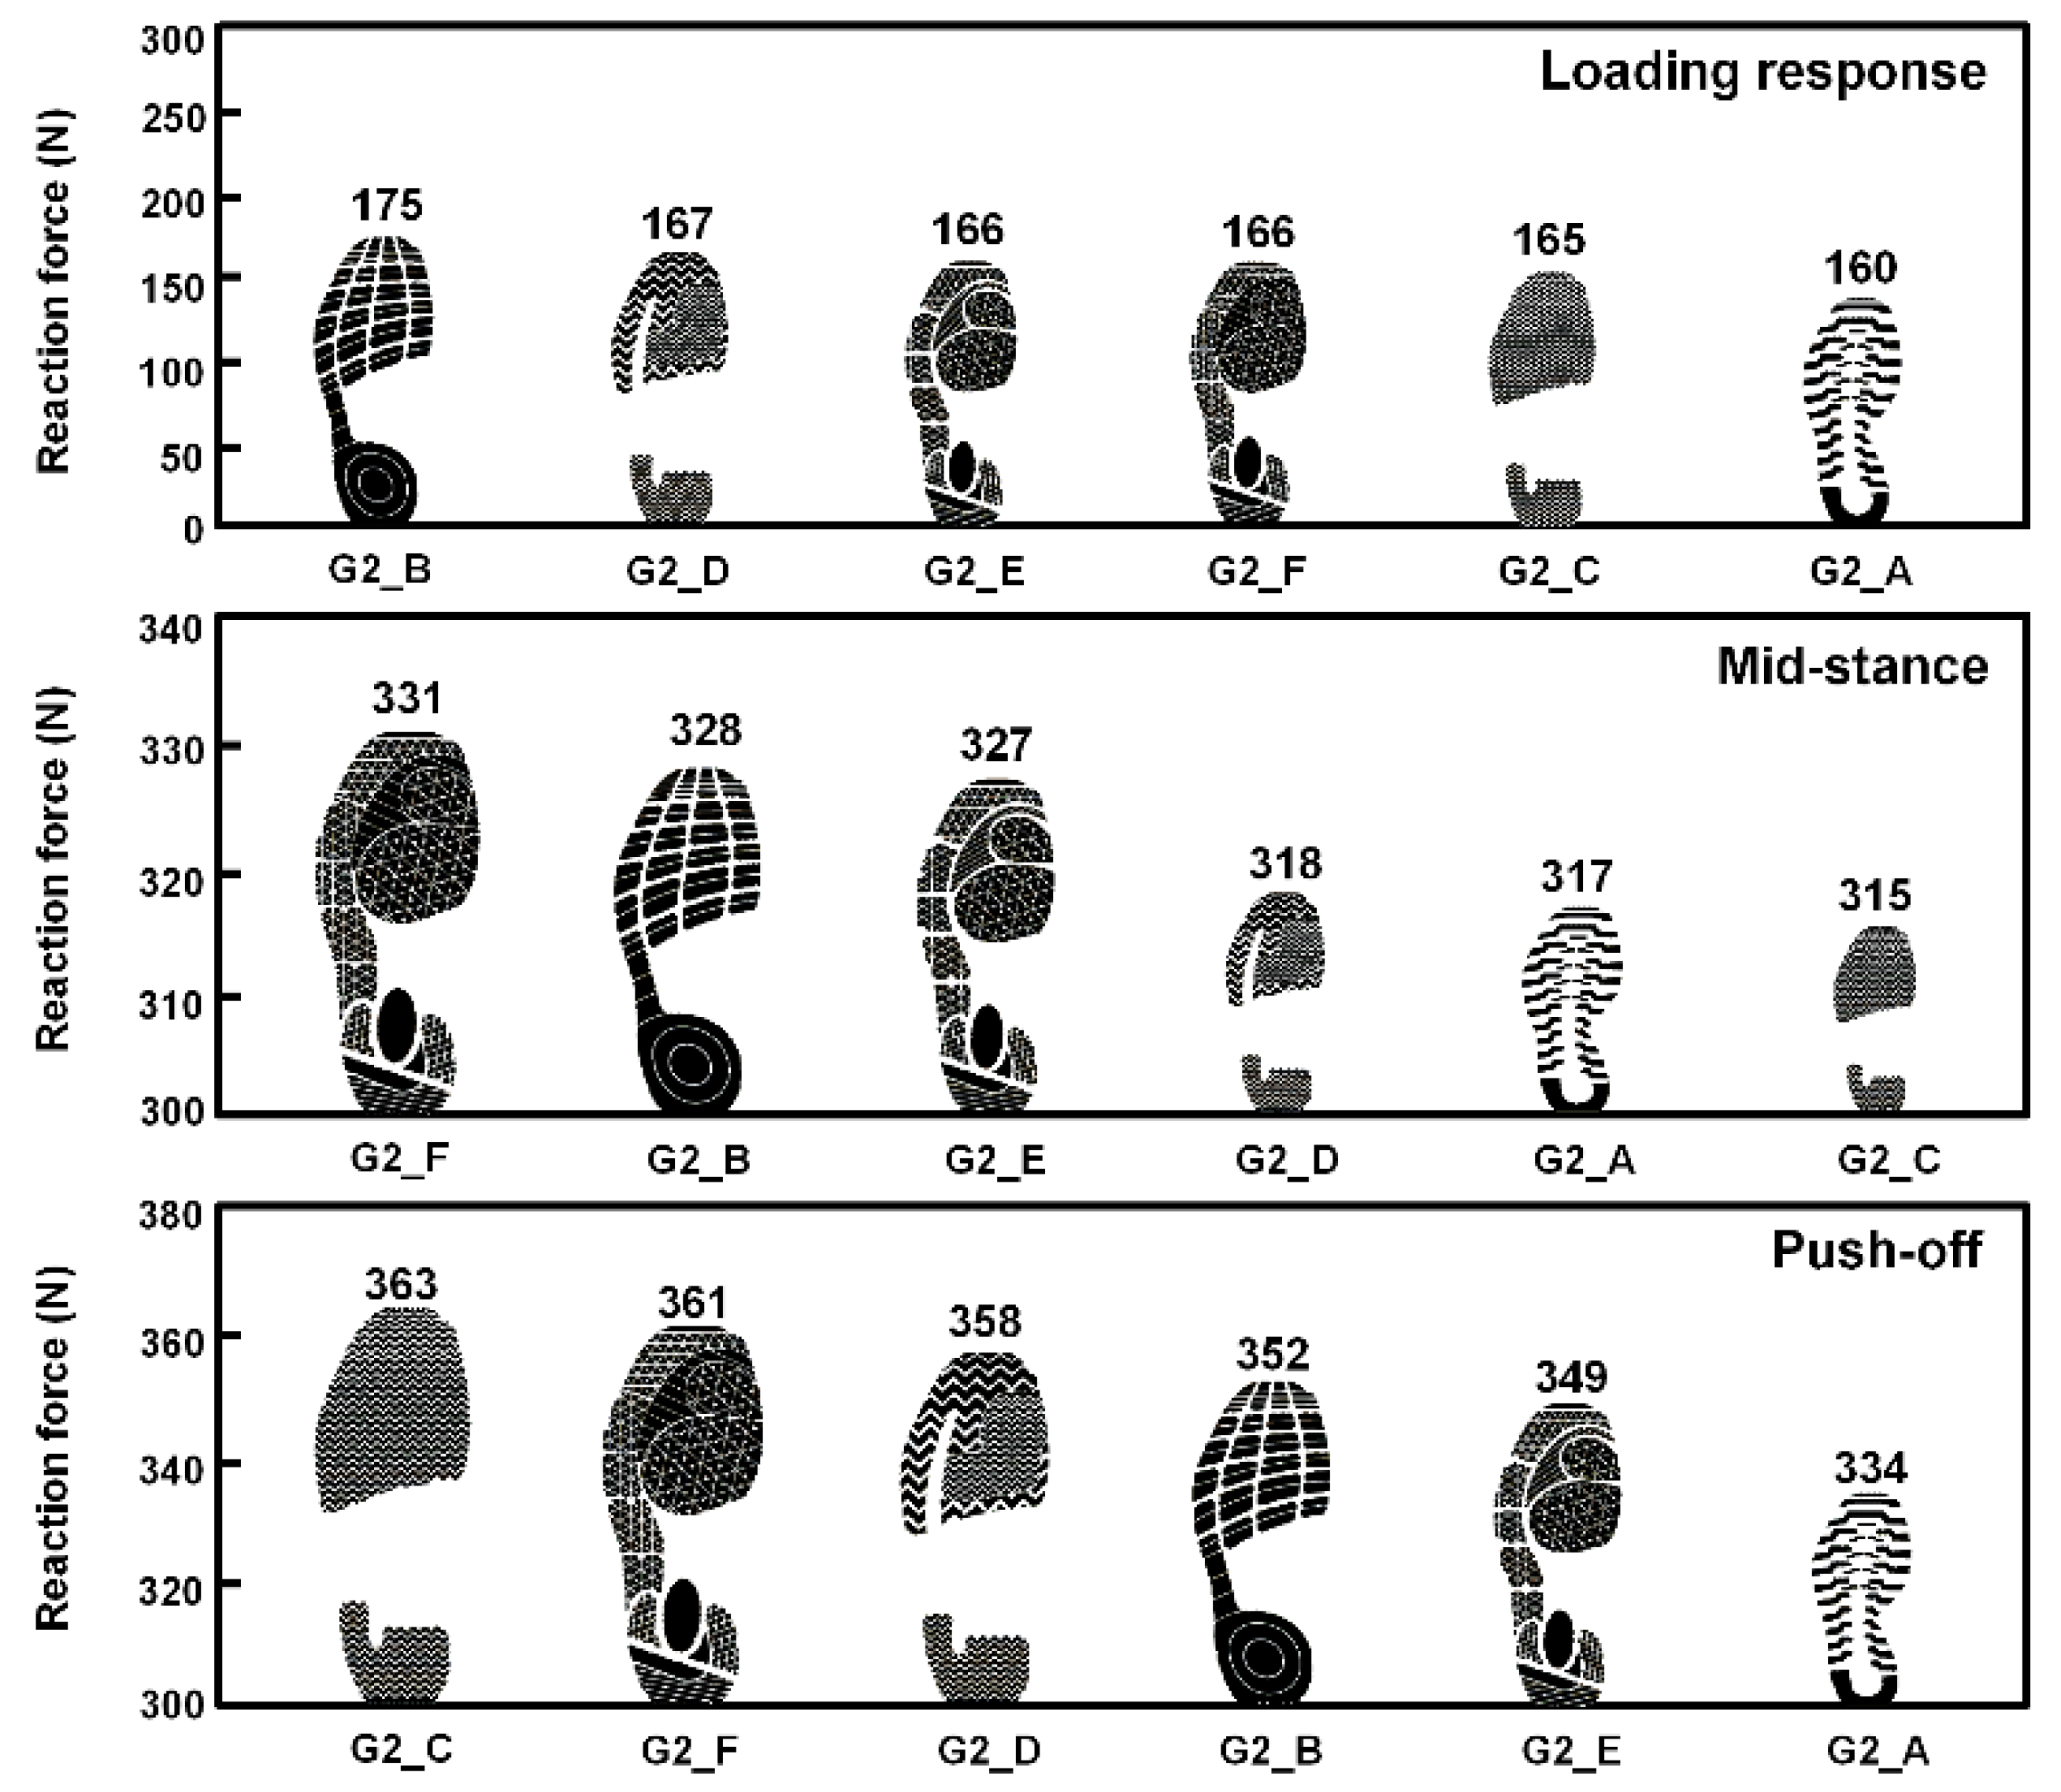
3.3. Traction Performance Evaluation of Group Two

Figure 8 represents the reaction force of the two commercially available designs and the four original designs in group two. The results of the reaction force in the moving direction revealed the different trends between the loading response, mid-stance, and push-off phases. The reaction force of the commercially available design G2_A was smaller than that of the others in the loading response and push-off phases, and only slightly higher than G2_C in the mid-stance phase. As compared with the two commercially available designs, the reaction force of G2_B was greater than that of the G2_A during the entire stance phase of the gait cycle. The four original designs showed similar results for the reaction force at the loading response phase. Distinct from the results at the loading response phase, the wide straight stripe and thin groove tread design in the front (G2_F) had a higher value reaction force than that of the thin straight stripe and wide groove tread design in the front (G2_E) at the push-off and mid-stance phases. As the tread width was increased, the reaction force could be increased, and this trend can be found both in the mechanical test and the FE analysis.

3.4. The Correlation between Contact Area and Traction Performance

The predictions for the real contact area where the outsole made contact with the ground surface at push-off are presented in Figure 9. The results show the significant effect of tread pattern design on the real contact area. Linear regression was used to establish the relationship between two variables, real contact area and reaction force. As shown in the linear regressions graphs (Figure 10), strong positive correlations were observed between the reaction force of the ground and the shoe–ground real contact area during the entire stance phase of the gait cycle in the FE analysis: R = 0.84 at loading response, R = 0.76 at mid-stance, and R = 0.80 at push-off. Overall, a higher value of shoe–ground real contact area could have a greater reaction force.

4. Discussion

The influence of oversimplified models and the lack of actual circumstances have been underestimated in recent experimental research and simulation analysis of footwear traction [10,28,29,30,31,32]. For example, a simplified outsole pad model could lead to an overly constrained boundary condition. The lack of actual loading conditions and shoe position lead to the inability to mimic human weight, pressure distribution, and foot angle in normal gait. To the best of our knowledge, the model development and FE analysis setting process in this research could improve the feasibility and applicability of traction performance simulation.
One of the most prominent features of this research was the automatic pressure application, which could provide new insights for computational simulation. Instead of the built-in manual pressure generator, the ANSYS ACT extension was used to create an automatic plantar pressure generator. The manual pressure time settings were 4 h at the mid-stance phase, 2.5 h at the push-off phase, and 1 h at the loading response phase. The automatic pressure application time was significantly reduced to 8 min at the mid-stance phase, 3 min at the push-off phase, and 50 s at the loading response phase. The ANSYS ACT extension for the automatic plantar pressure generator is an efficient tool for mimicking physiological loading conditions during the gait motion, and it is particularly advantageous to the footwear industry, especially for customized products.
Trend differences have been found between the reaction force calculation during the entire stance phase of the gait in the FE analysis and the coefficients of friction measurements in the experimental test. The trend differences could be caused by the shoe position, sliding direction, or loading condition. The experimental test only considered the condition that the specimen was parallel with the ground and slid in one direction under a load of 4.5 kg. To mimic the human gait motion, the contact angle between the bottom of the shoe and the ground was 7° at the loading response phase and 7° at the push-off phase. The footwear was parallel with the ground at the mid-stance phase. The foot angle was 6° at all three phases. In terms of the ground sliding direction, the horizontal displacement of the ground was from toe to heel at the loading response phase, and was from heel to toe at the push-off and mid-stance phases. Instead of a uniform loading of 4.5 kg, the data of the dynamic plantar pressure were used in the FE analysis. Therefore, the FE results of reaction force had different trends from the experimental test.
According to the classical Amontons–Coulomb friction law, the friction force is independent of the apparent contact area [33]. However, this theory could only be correct at the macroscopic scale. Previous research has proven that the real contact area between sliding surfaces plays a role in friction at a microscopic scale, especially for an elastic material during sliding [34,35,36]. Some important aspects may be gained from the graph of linear regressions shown in Figure 10. The higher value of the shoe–ground real contact area could achieve a higher traction performance. Some of the results that did not follow this observation perfectly could be caused by the geometry of the tread. When the surfaces of ground and outsole tread push against one another, a shear force is needed to break the adhesive bond of the contacting surfaces [37,38,39]. The geometry of the tread may have contributed to the formation and strength of bonds, which could affect the results of the reaction force.
The potential limitations of this research should be noted. Firstly, for the surface condition, neither contamination conditions nor the roughness of the surface of the ground were tested. A dry and flat concrete ground was applied in the FE model. Secondly, the loading condition in the FE model was based on a single-subject dynamic plantar pressure measurement, and was applied to the insole. Thirdly, the coefficient of friction between the outsole and the ground was fixed at 0.6, and the traction performance was evaluated by comparing the horizontal reaction forces of the ground. Fourthly, the ground reaction forces in the medial–lateral and superior–inferior directions were ignored, as we considered the magnitudes of the friction force and ground reaction force in the anterior–posterior direction to be equal. The friction types of the current analysis only focus on static friction. Finally, the simplified testing specimens based on ASTM F 1677 were manufactured and used in the present study. Further tests using the whole shoe specimens are needed to validate the numerical outcomes in a future study.

5. Conclusions

Evaluation is essential to quantifying the function of traction performance. The findings of this research suggest that the real contact area and the structure of the outsole tread design influence the traction performance of the shoe in dry conditions. This computational process provides a lower cost and more time-efficient method evaluating traction performance in an actual-person situation during a gait motion. This research can be applied to product development in the early design phases in the footwear industry to improve product performance or achieve the goals of customized products.

Author Contributions

Conceptualization, K.-S.S., W.-C.H. and C.-C.H.; Formal analysis, S.-Y.J., J.-W.C., J.-C.Y. and Y.-C.H.; Funding acquisition, K.-S.S. and C.-C.H.; Investigation, K.-S.S., S.-Y.J., C.-C.H., J.-W.C., J.-C.Y. and Y.-C.H.; Methodology, W.-C.H. and C.-C.H.; Validation, K.-S.S., W.-C.H. and C.-C.H.; Writing–original draft, S.-Y.J. and C.-C.H.; Writing–review & editing, K.-S.S., W.-C.H. and C.-C.H. All authors have read and agreed to the published version of the manuscript.

Funding

This study was financially supported by the Shin Kong Wu Ho-Su Memorial Hospital Research Program under Grant No. SKH-8302-106-DR-12.

Acknowledgments

The authors would like to express their appreciation for the supports from the Footwear & Recreation Technology Research Institute (FRT, Taiwan, R.O.C.).

Conflicts of Interest

The authors declare no conflict of interest.

References

  1. McPoil, T.G. Athletic Footwear: Design, Performance and Selection Issues. J. Sci. Med. Sport 2000, 3, 260–267. [Google Scholar] [CrossRef]
  2. Gronqvist, R.; Chang, W.-R.; Courtney, T.K.; Leamon, T.B.; Redfern, M.S.; Strandberg, L. Measurement of Slipperiness: Fundamental Concepts and Definitions. Ergonomics 2001, 44, 1102–1117. [Google Scholar] [CrossRef] [PubMed]
  3. ASTM. Standard Test Method for Measuring the Coefficient of Friction for Evaluation of Slip Performance of Footwear and Test Surfaces/Flooring Using a Whole Shoe Tester; ASTM International: West Conshohocken, PA, USA, 2011. [Google Scholar]
  4. Hanson, J.P.; Redfern, M.S.; Mazumdar, M. Predicting Slips and Falls Considering Required and Available Friction. Ergonomics 1999, 42, 1619–1633. [Google Scholar] [CrossRef] [PubMed]
  5. Chang, W.-R.; Grönqvist, R.; Leclercq, S.; Brungraber, R.J.; Mattke, U.; Strandberg, L.; Thorpe, S.C.; Myung, R.; Makkonen, L.; Courtney, T.K. The Role of Friction in the Measurement of Slipperiness, Part 2: Survey of Friction Measurement Devices. Ergonomics 2001, 44, 1233–1261. [Google Scholar] [CrossRef] [PubMed]
  6. Burnfield, J.M.; Powers, C.M. Prediction of Slips: An Evaluation of Utilized Coefficient of Friction and Available Slip Resistance. Ergonomics 2006, 49, 982–995. [Google Scholar] [CrossRef]
  7. Powers, C.M.; Brault, J.R.; Stefanou, M.A.; Tsai, Y.-J.; Flynn, J.; Siegmund, G.P. Assessment of Walkway Tribometer Readings in Evaluating Slip Resistance: A Gait-Based Approach. J. Forensic Sci. 2007, 52, 400–405. [Google Scholar] [CrossRef]
  8. Moghaddam, S.R.M.; Acharya, A.; Redfern, M.S.; Beschorner, K.E. Predictive Multiscale Computational Model of Shoe-Floor Coefficient of Friction. J. Biomech. 2018, 66, 145–152. [Google Scholar] [CrossRef]
  9. Beschorner, K.E. Development of a Computational Model for Shoe-Floor Contaminant Friction. Mechanical Engineering. Ph.D. Thesis, University of Illinois Urbana-Champaign, Champaign, IL, USA, 2004. [Google Scholar]
  10. Sun, Z.; Howard, D.; Moatamedi, M. Finite Element Analysis of Footwear and Ground Interaction. Strain 2005, 113–117. [Google Scholar] [CrossRef]
  11. Huang, Q.; Hu, M.; Xu, B.; Wu, J.; Zhou, J. Feasibility of Application of Finite Element Method in Shoe Slip Resistance Test. Leather Footwear J. 2018, 18, 139–148. [Google Scholar] [CrossRef]
  12. Kim, S.H.; Cho, J.R.; Choi, J.H.; Ryu, S.H.; Jeong, W.B. Coupled Foot-Shoe-Ground Interaction Model to Assess Landing Impact Transfer Characteristics to Ground Condition. Interact. Multiscale Mech. 2012, 5, 75–90. [Google Scholar] [CrossRef]
  13. Qiu, T.-X.; Teo, E.-C.; Yan, Y.-B.; Lei, W. Finite Element Modeling of a 3d Coupled Foot-Boot Model. Med. Eng. Phys. 2011, 33, 1228–1233. [Google Scholar] [CrossRef] [PubMed]
  14. Cavanagh, P.R.; Rodgers, M.M.; Liboshi, A. Pressure Distribution under Symptom-Free Feet During Barefoot Standing. Foot Ankle 2016, 7, 262–278. [Google Scholar] [CrossRef] [PubMed]
  15. Miehe, C.; Goktepe, S.; Lulei, F. A Micro-Macro Approach to Rubber-Like Materials? Part I: The Non-Affine Micro-Sphere Model of Rubber Elasticity. J. Mech. Phys. Solids 2004, 52, 2617–2660. [Google Scholar] [CrossRef]
  16. Verdejo, R.; Mills, N.J. Heel–Shoe Interactions and the Durability of Eva Foam Running-Shoe Midsoles. J. Biomech. 2004, 37, 1379–1386. [Google Scholar] [CrossRef] [PubMed]
  17. Goske, S.; Erdemir, A.; Petre, M.; Budhabhatti, S.; Cavanagh, P.R. Reduction of Plantar Heel Pressures: Insole Design Using Finite Element Analysis. J. Biomech. 2006, 39, 2363–2370. [Google Scholar] [CrossRef] [PubMed]
  18. Sissler, L.; Jacques, A.; Rao, G.; Berton, E.; Gueguen, N. A 3-D Finite Element Model of the Foot-Shoe Structure During a Walking Cycle for Shoe Sole Design. Footwear Sci. 2013, 5, S36–S37. [Google Scholar] [CrossRef]
  19. Benkahla, J.; Baranger, T.N.; Issartel, J. Experimental and Numerical Simulation of Elastomeric Outsole Bending. Exp. Mech. 2012, 52, 1461–1473. [Google Scholar] [CrossRef]
  20. Chen, W.M.; Lee, S.J.; Lee, V.S. Plantar Pressure Relief under the Metatarsal Heads—Therapeutic Insole Design Using Three-Dimensional Finite Element Model of the Foot. J. Biomech. 2015, 48, 659–665. [Google Scholar] [CrossRef]
  21. Cheung, T.M.; Zhang, M. Finite Element Modeling of the Human Foot and Footwear. In Proceedings of the ABAQUS Users’ Conference, Boston, MA, USA, 23–25 May 2006. [Google Scholar]
  22. Miller, J.M. “Slippery” Work Surface: Towards a Performance Definition and Quantitative Coefficient of Friction Criteria. J. Saf. Res. 1983, 14, 145–158. [Google Scholar] [CrossRef] [Green Version]
  23. Nigg, B.M.; Segesser, B. The Influence of Playing Surfaces on the Load on the Locomotor System and on Football and Tennis Injuries. Sports Med. 1988, 5, 375–385. [Google Scholar] [CrossRef]
  24. Menz, H.B.; Latt, M.D.; Tiedemann, A.; Mun San Kwan, M.; Lord, S.R. Reliability of the Gaitrite® Walkway System for the Quantification of Temporo-Spatial Parameters of Gait in Young and Older People. Gait Posture 2004, 20, 20–25. [Google Scholar] [CrossRef]
  25. ISO. Personal Protective Equipment-Footwear-Test Method for Slip Resistance; International Organization for Standardization: Geneva, Switzerland, 2012. [Google Scholar]
  26. Ali, A.S.; Badran, A.H.; Ali, W.Y. Friction Behavior of Epoxy Floor Tiles Filled by Carbon Nanoparticles. J. Egypt. Soc. Tribol. 2018, 15, 1–10. [Google Scholar]
  27. ASTM. Standard Test Method for Using a Portable Inclineable Articulated Strut Slip Tester (Plast); ASTM International: West Conshohocken, PA, USA, 2005. [Google Scholar]
  28. Li, K.W. Friction between Footwear and Floor Covered with Solid Particles under Dry and Wet Conditions. Int. J. Occup. Saf. Ergon. 2014, 20, 43–53. [Google Scholar] [CrossRef] [PubMed] [Green Version]
  29. Mohamed, M.K.; Samy, A.M.; Ali, W.Y. Friction Coefficient of Rubber Shoes Sliding against Ceramic Flooring. KGK-Rubberpoint 2012, 65, 52–57. [Google Scholar]
  30. Moghaddam, M.; Reza, S. Finite Element Analysis of Contribution of Adhesion and Hysteresis to Shoe-Floor. Science in Engineering. Master Thesis, University of Wisconsin-Milwaukee, Milwaukee, WI, USA, 2013. [Google Scholar]
  31. Shibataa, K.; Abe, S.; Yamaguchi, T.; Hokkirigwa, K. Evaluation for Slip Resistance of Floor Sheets and Shoe Sole with Newly Developed Mobile Friction Measurement System. In Proceedings of the 19th Triennial Congress of the IEA, Melbourne, Australia, 9–14 August 2015. [Google Scholar]
  32. Li, K.W.; Chen, C.J. The Effect of Shoe Soling Tread Groove Width on the Coefficient of Friction with Different Sole Materials, Floors, and Contaminants. Appl. Ergon. 2004, 35, 499–507. [Google Scholar] [CrossRef]
  33. Popova, E.; Popov, V.L. The Research Works of Coulomb and Amontons and Generalized Laws of Friction. Friction 2015, 3, 183–190. [Google Scholar] [CrossRef] [Green Version]
  34. Etsion, I.; Kogut, L. A Static Friction Model for Elastic-Plastic Contacting Rough Surfaces. J. Tribol. 2004, 126, 34–40. [Google Scholar]
  35. Krim, J. Resource Letter_Fmmls-1_Friction at Macroscopic and Microscopic Length Scales. Am. Assoc. Phys. Teach. 2002, 70, 890–897. [Google Scholar]
  36. Kanaga Karuppiah, K.S.; Bruck, A.L.; Sundararajan, S. Evaluation of Friction Behavior and Tts Contact-Area Dependence at the Micro- and Nano-Scales. Tribol. Lett. 2009, 36, 259–267. [Google Scholar] [CrossRef]
  37. Johnson, K.L.; Kendall, K.; Roberts, A.D. Surface Energy and the Contact of Elastic Solids. Proc. R. Soc. A. Math. Phys. Eng. Sci. 1971, 324, 301–313. [Google Scholar]
  38. Strandberg, L. The Effect of Conditions Underfoot on Falling and Overexertion Accidents. Ergonomics 1985, 28, 131–147. [Google Scholar] [CrossRef] [PubMed]
  39. Chowdhury, S.K.; Ghosh, P. Adhesion and Adhesional Friction at the Contact between Solids. Wear 1994, 174, 9–19. [Google Scholar] [CrossRef]
Figure 1. (A) The development process of the running shoe model; and (B), the anatomy of the 3D shoe and ground model.
Applsci 10 01672 g001
Figure 2. A 3D shoe model, and ten types of tread pattern design.
Applsci 10 01672 g002
Figure 3. Experimental setup for plantar pressure measurements during gait, and the exporting plantar pressure distribution chart.
Applsci 10 01672 g003
Figure 4. The position, boundary, and loading conditions of the finite element (FE) analysis three major phases of a gait cycle.
Applsci 10 01672 g004
Figure 5. The configuration of the experiment and the specimens.
Applsci 10 01672 g005
Figure 6. Flowchart of the experimental–computational process.
Applsci 10 01672 g006
Figure 7. The relationship between the FE predicted ground reaction force of group one and the experimentally measured coefficient of friction.
Applsci 10 01672 g007
Figure 8. The reaction force chart for group two.
Applsci 10 01672 g008
Figure 9. The predicted real contact area at push-off.
Applsci 10 01672 g009
Figure 10. The relationship between ground reaction force and real contact area.
Applsci 10 01672 g010
Table 1. The parameters of the Ogden foam material model used for footwear materials.
Materialµ1µ2α1α2β1β2
Upper0.213−0.0620910.3−3.3490.320.32
Insole0.213−0.0620910.3−3.3490.320.32
Midsole1.037−0.30447.181−2.3480.320.32
Outsole8.874−7.8272.0281.3450.320.32

