Article

Reducing Acidity of Tropical Acid Soil to Improve Phosphorus Availability and Zea mays L. Productivity through Efficient Use of Chicken Litter Biochar and Triple Superphosphate

by
Ali Maru
1,
Ahmed Osumanu Haruna
1,2,3,*,
Audrey Asap
1,
Nik Muhamad Abd. Majid
3,
Nathaniel Maikol
1 and
Alicia Vanessa Jeffary
1
1
Department of Crop Science, Faculty of Agriculture and Food Sciences, Universiti Putra Malaysia Bintulu Campus, Sarawak 97008, Malaysia
2
Agriculture and Environment, Borneo Eco-Science Research Center, Faculty of Agriculture and Food Sciences, Universiti Putra Malaysia Bintulu Sarawak Campus, Sarawak 97008, Malaysia
3
Institute of Tropical Forestry and Forest Products (INTROP), Universiti Putra Malaysia, Selangor 43400, Malaysia
*
Author to whom correspondence should be addressed.
Submission received: 9 January 2020 / Revised: 10 February 2020 / Accepted: 10 February 2020 / Published: 20 March 2020
(This article belongs to the Special Issue Biochar: Productions, Properties and Applications)

Abstract

:

Featured Application

Authors are encouraged to provide a concise description of the specific application or a potential application of the work. This section is not mandatory.

Abstract

Phosphorus is a macronutrient which plays an important role in plant metabolism, growth, and development. However, in tropical acid soils, P fixation is high because of significant amounts of Al and Fe ions. Al and Fe ions can reduce diffusion of P into plant roots. Low absorption of P at initial growth of most plants causes stunting and slow growth of plant leaves. This process reduces photosynthesis. Chicken litter biochar (CLB) had been used on tropical acid soils to improve total P, available P, organic P, and inorganic fractions of P. Moreover, CLB is able to reduce exchangeable acidity, Fe, and Al ions in mineral acid soils because of the reactive surfaces of this organic amendment. However, there is dearth of information on the effects of the right combination of CLB and triple superphosphate (TSP) on the aforementioned soil chemical properties and crop productivity. To this end, the objectives of this study were to improve P: (i) Availability in a mineral acid soil and (ii) uptake, agronomic efficiency, and dry matter yield of Zea mays L. using the right amounts of TSP and CLB. Combinations of 75%, 50%, and 25% CLB (based on recommended 5 t ha−1) and TSP (based on recommended P fertilization for maize) were evaluated in a pot study. Selected soil chemical properties, maize plants nutrient uptake, growth variables, and dry matter yield were determined using standard measures. Results showed that 25% and 50% biochar of 5 t ha−1 with 75% TSP can increase soil P availability, recovery, agronomic use efficiency, and dry matter yield of maize plants. These optimum rates can also reduce P fixation by Al and Fe ions. Therefore, soil and maize productivity can be improved by using CLB (25% and 50% of 5 t ha−1) and TSP (75% of conventional rate) to increase nutrients availability especially P.

1. Introduction

Phosphorus is a macronutrient and plays a vital role in metabolism of plants, roots growth, and plants development. It promotes plant flowering, seed and root development, crop quality, and maturation because of accumulation, transfer, and release of energy in different cellular metabolic processes during degradation and biosynthesis. Phosphorus is absorbed by plants in the form of monovalent (H2PO4) and divalent (HPO42−) orthophosphate anions, primarily during vegetative growth and re-translocation during reproductive stage into fruits and seeds [1]. Low absorption of P at initial growth of most plants causes stunting and slow growth of plant leaves. This process reduces photosynthesis [2]. Phosphorus deficiency in maize causes distinct reddish or purple colors on leaves and vegetative tissues of maize plants because of formation of anthocyanin and concentration of chlorophyll. Additionally, P deficiency begins with older leaves because of movement of P compounds to newer leaves. Severe P deficiency impedes plant root growth and P uptake such that crop yield and quality are statistically reduced [3].
Phosphate availability and use efficiency are very poor in acidic soils especially in Malaysia where most soils are high in Al and Fe [4,5]. Conventionally, significant amounts of lime and P fertilizers (TSP and rock phosphates) are applied to acid soils to saturate Al and Fe ions in addition to ensuring maintenance of enough plant P available [5,6]. However, this approach is not economically viable because of increase in plant production cost and leaching of P partly because of unbalanced use of P fertilizers. Excessive use of P fertilizers in agriculture had been implicated in eutrophication of water bodies. Hence, there is a need to amend tropical acid soils with organic materials.
Organic amendments have been used in the tropics to increase nutrient uptake [7,8]. Zeng et al. reported that organic matter and soil pH influenced availability of plant P uptake [9]. The CLB used this present study was produced by combusting chicken waste under no oxygen or limited oxygen conditions. Biochars are recalcitrant partly because of their high C and degree of aromatic graphene sheets. The surface chemistry, pore size, and particle size distribution of biochars depend on feedstock type and type of pyrolysis (mainly temperature) used [10,11]. The CLB used in this present study is reputed of reducing soil acidity because of its relatively high pH and liming effect. Furthermore, because of their high affinity for Al and Fe ions, they fix these ions to stop them from being hydrolyzed to produce more hydrogen ions. This chemical reaction unlocked fixed P to make them available but some of the available P are temporarily trapped in the pores structure of CLB and are adsorbed by the functional groups on the outer surface of the graphene sheets and pores.
When a tropical acid soil was amended with CLB, soil total P, available P, organic P, and inorganic fractions of P (soluble-P, Al-P, Fe-P, redundant soluble-P, and Ca-P) increased but soil exchangeable acidity, Fe, and Al ion reduced [12] because of the high reactive surface area of this organic amendment which is known to electrostatically bind exchange cations and anions. The anion exchange capacity of biochars prevents anionic nutrients such as phosphates from being excessively leached into water bodies and this minimizes eutrophication. The high affinity of CLB for Al and Fe ion also minimizes P fixation [12,13]. Moreover, the high pH of CLB increases soil pH to reverse P fixation by Al and Fe ions besides improving soil CEC and nutrient availability [14].
Although Ch’ng et al. used biochar to improve P availability of TSP, their study did not optimize the use of both biochar and TSP because these materials were not varied [12]. Their study focused only on fixed amounts of TSP and biochar. Hence, there is a need to determine economic rates of biochar and TSP. Thus, it was hypothesized that the economic rates of CLB and TSP will statistically increase soil available P, P use efficiency, and dry mater yield of crops such as Zea mays L. in a sustainable manner. Therefore, the objectives of this study were to improve:
  • Phosphorus availability in a mineral acid soil using the right amounts of CLB and TSP,
  • Phosphorus uptake, agronomic efficiency, and dry matter yield of Zea mays L. using the right amounts of CLB and TSP.

2. Materials and Methods

2.1. Experiment Setup

A pot experiment was carried in a net house at Universiti Putra Malaysia Bintulu Sarawak Campus, Malaysia. The test crop used in this study was Thai Super Sweet hybrid F1 maize (Zea mays L.). Pots (22 cm in height, 30 cm in width, and 30 cm in diameter) were filled with 7 kg of a mineral acid soil (from 5 mm bulked soil sample). Nitrogen, P, and K fertilizers were used based on the requirement of Thai Super Sweet hybrid F1 maize. Urea, triple superphosphate (TSP), and muriate of potash (MOP) were applied at 60 kg N ha−1 (130 kg ha−1 Urea), 60 kg P2O5 ha−1 (130 kg ha−1 TSP), and 60 kg K2O ha−1 (105 kg ha−1 MOP), respectively. These rates were based on the recommendation of MARDI (Malaysian Agricultural Research and Development Institute) [13]. Based on these recommendations, the rates were scaled to per pot basis (Table 1). The amount of P fertilizer was further varied and reduced to 75%, 50%, and 25% (Table 1) whereas, the amounts of N and K fertilizers were the same except for the treatment without N, P, and K fertilizers. The fertilizers were applied in two equal splits (at 10 and 28 days after sowing). The CLB was applied at a rate of 5-ton ha−1. Based on this rate, the CLB was scaled to 180 g of biochar per 7 kg of soil per pot (Table 2).

Chemical Properties of Chicken Litter Biochar

The CLB used in this study was from the Black Earth Company, Australia. It was produced by the combusting chicken litter in oxygen-limited conditions and relatively high temperature (controlled) through pyrolysis. Chemical properties of the chicken litter biochar (Table 3) are consistent with Australia Certified Organic Standard, 2010.
Soil and CLB were thoroughly mixed and moistened with a tap water at 60% water holding capacity before sowing. Maize seeds were soaked with water and fungicide (Thiram) for 24 h before sowing. This was done to ensure good germination, avoidance of seed infection, and plant establishment. Sowing depth was 3–4 cm and the maize seeds were sown in planting holes (two seeds per hole) after which the holes were partially covered with loose soil. At seven days after sowing, maize plants were thinned to two. The pot experiment was conducted in a completely randomized design with three replications. During the pot experiment, soil water holding capacity was calculated based on the amount of water retained at field capacity. The moisture was then maintained at 60% water holding capacity. The maize plants were monitored and harvested at tasseling stage (52 days after sowing) because this growth stage is a major determinant of maize yield [16,17]. Nutrient and dry weight accumulation can also increase greatly around tasseling stage.

2.2. Harvesting of Maize Plants

The harvested maize plants were partitioned into leaves, stems, and roots after which they were oven dried at 60 °C until constant weight was obtained. Thereafter, their dry weights were determined using a digital balance. Soil samples were collected, air-dried, ground, and sieved to pass a 2 mm sieve.

2.3. Soil Chemical Analysis before and after Pot Study

The pot study was carried out using Typic Paleudults (Bekenu Series). The soil was taken from a secondary forest (latitude 3°12′15.45′′ N and longitude 113°04′15.82′′ E) at Bintulu, Sarawak, Malaysia. The soil samples were collected at a depth of 0 to 25 cm after which they were transported to a research complex at Universiti Putra Malaysia Bintulu Sarawak Campus, Malaysia where they were air dried at room temperature. Afterwards, the soil samples were crushed to pass a 5 mm sieve to remove twigs, plant roots, and ironstone concretions. Prior to collection of the soil samples, soil bulk density was determined using the core sampling method. The soil surface area was cleared, and three core samplers were gently hammered into the soil (within depth of 1 to 25 cm). Thereafter, the soil samples were dried in an oven at 105 °C until constant weight was attained, cooled in a desiccator, and weighed. The weight of the empty core sampler was subtracted from the final weight to obtain weight of the dry soil. Equation (1) was used to calculate bulk of the soil.
B u l k   D e n s i t y =   [ D r y   W t .   o f   s o i l   o n l y   C o r e   v o l u m e ]
where
C o r e   v o l u m e = π r 2 h = 100.14   c m 3
The physico-chemical properties of the soil used in this present study (Table 4) were within the range reported of the Bekenu series (Typic Paleudult) [18].
Soil samples were characterized for physical and chemical properties before and after the pot study. Soil pH in water and KCl were determined in a 1:2.5 (soil:distilled water/KCl) using a digital pH meter [19]. Soil total organic carbon was calculated as 58% of the organic matter using the loss of weight on ignition method [20]. Cation exchange capacity (CEC) of the soil was determined using the leaching method [21] followed by steam distillation [22]. Exchangeable cations were extracted with 1 M NH4OAc, pH 7 using the leaching method [21]. Afterwards, the cations were determined using atomic absorption spectrometry (Analyst 800, Perkin Elmer instruments, Norwalk, CT, USA). Total N was determined using Kjeldhal method [23]. Soil total P was extracted using aqua regia method whereas soil available P was extracted using Mehlich No.1 double acid method [24]. Water soluble P was extracted using deionized water following the Mehlich No.1 double acid extraction method [24]. The extracted total P, available P, and water-soluble P were then determined using spectrophotometer after the blue color was developed [25]. Soil exchangeable acidity, H+, and Al3+ were determined using acid-base titration method [26].

2.4. Roots and Above Ground Biomass Analysis

The single dry ashing method [21] was used to extract P, K, Ca, Mg, Na, and Fe in the plant tissues (leaf and stem). Filtrates were analyzed for K, Ca, Mg, Na, and Fe using atomic absorption spectrophotometry. Phosphorus was determined using molybdenum blue method [23]. Total N was determined using Kjeldhal method [23]. The concentrations of N, P, K, Ca, Mg, Na, and Fe in leaf and stem were multiplied by the respective dry weight of the plant parts to obtain the amounts of N, P, K, Ca, Mg, Na, and Fe taken up by the maize plants. The nutrient concentrations were multiplied by their dry matter yield to represent nutrient uptake. The agronomic and crop recovery efficiency of applied N was determined using the formula below:
AEN = (Yp − Y0)/Fp
REN = (Up − U0)/Fp
where:
  • AEN = Agronomic efficiency of applied P,
  • REN = Crop recovery efficiency of applied P,
  • Fp—amount of (fertilizer) P applied (kg ha−1),
  • Yp—crop yield with applied P (kg ha−1),
  • Y0—crop yield (kg ha−1) in a control treatment with no P,
  • Up—total plant P uptake in aboveground biomass at maturity (kg ha−1) in a plot that received P,
  • U0—the total P uptake in aboveground biomass at maturity (kg ha−1) in a plot that received no P.

2.5. Statistical Analysis

Analysis of variance (ANOVA) was used to test treatment effects whereas treatment means were compared using Tukey’s Test. Statistical Analysis Software version 9.4 was used for the statistical analysis [27].

3. Results and Discussion

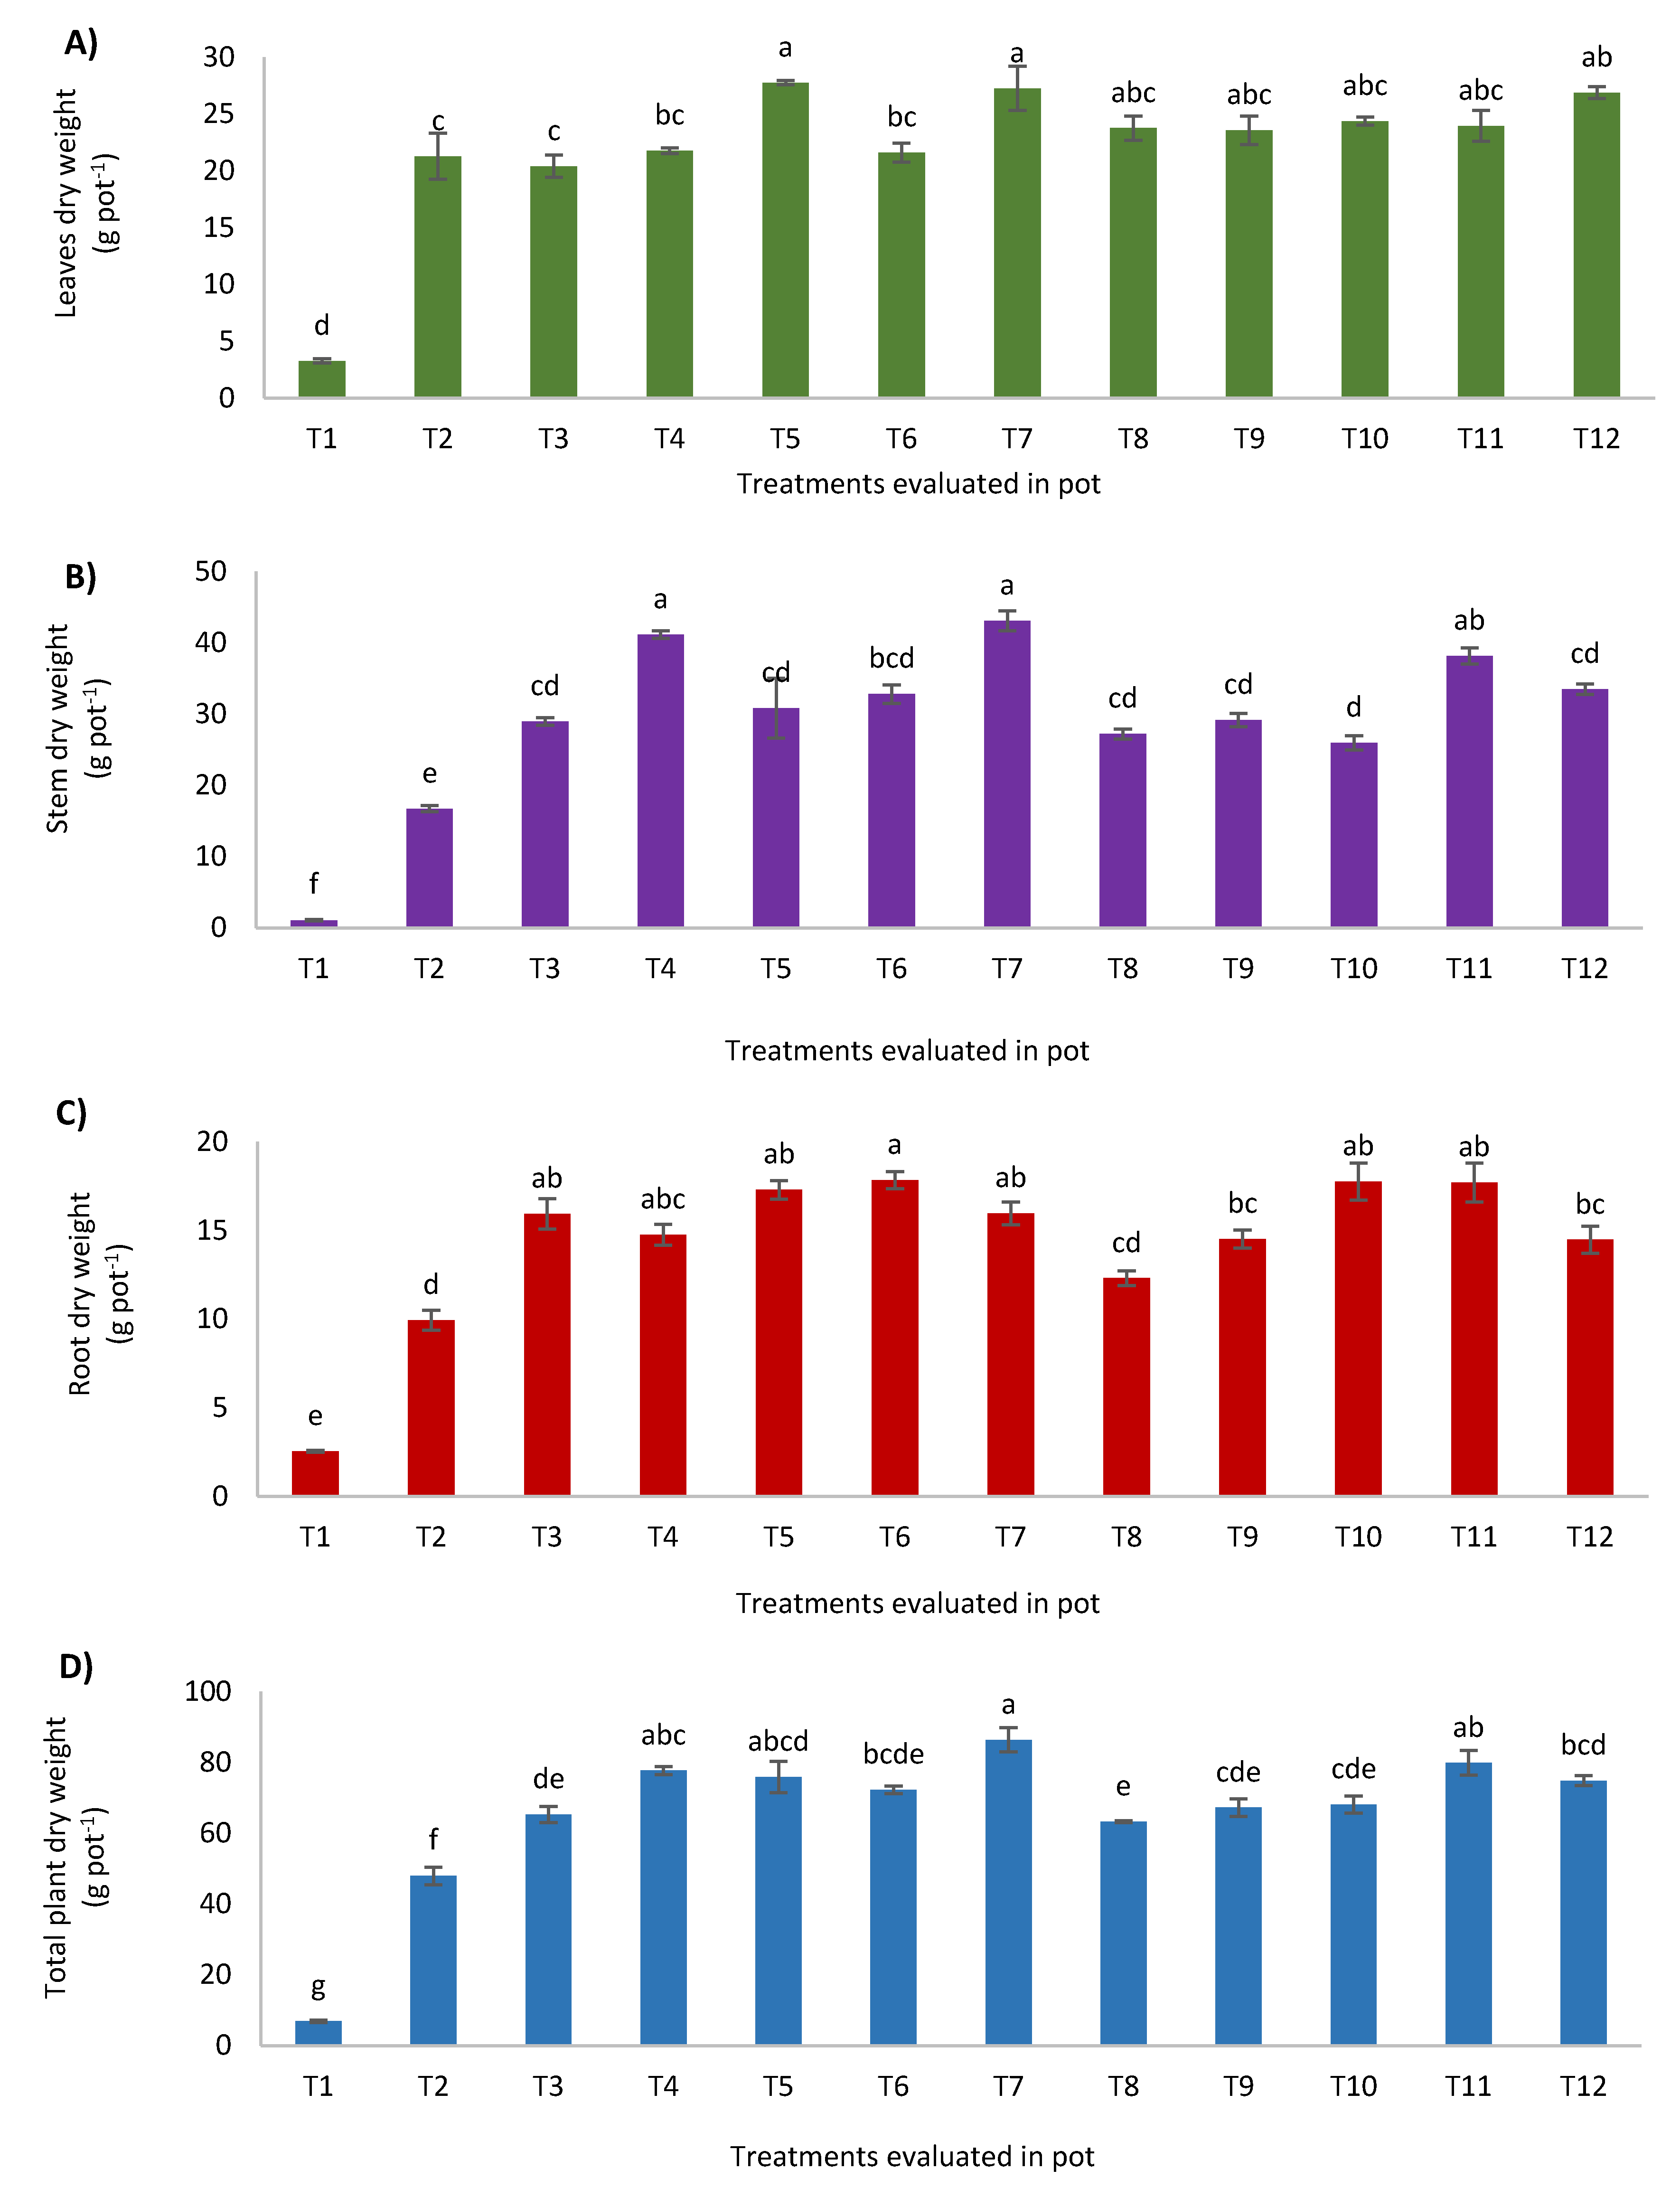
3.1. Effects of Different Rates of Chicken Litter Biochar and Phosphorus on Plant Growth Variables

Leaves, stems, and roots dry weight of T1 were statistically lower than those of T2, T3, T4, T5, T6, T7, T8, T9, T10, T11, and T12 (Figure 1A–C) because nutrients in T1 soil were not enough to support good growth and development of maize plants. Fageria and Baligar, stated that Ca, Mg, and P deficiencies coupled with Al toxicity can limit plant growth and development on acid soils [28]. Leaf dry weight of T2 was statistically lower compared with those of T5, T7, and T12 (Figure 1A) whereas stem dry weight of T2 was statistically lower than those of T4, T7, and T11. The root dry weight of T2 was statistically lower than those of T3, T4, T5, T6, T7, T8, T9, T10, T11, and T12 (Figure 1C). Generally, total plant dry weight of T2 was statistically lower than those of the treatments with chicken litter biochar because of nutrient fixation, particularly P. Akinrinde, associated poor crop growth on acid soils to locking of P by Al and Fe hydrous oxides [29]. The treatments with CLB increased maize plant dry matter yield because this organic amendment was able to increase significantly improve bio-availability of nutrients and their uptake by the maize plants followed by conversion of the nutrients to plant biomass production. This observation is consistent with the results obtained by [30] who also studied the effects of biochar on maize plants’ growth, nutrient uptake, and dry matter yield [31].
Treatments T4, T5, T7, and T11 showed similar effects but the effect of T7 was statistically higher than those of T1, T2, T3, T6, T8, T9, T10, and T12 (Figure 1D). Co-application of CLB with chemical fertilizers especially P improves crop yield (Figure 2). For example, Yamato et al. reported that, co-application of biochar and chemical fertilizers significantly increased maize yield compared with application of chemical fertilizers only [22]. Mau and Utami, also reported an increase in maize yield because of increase in availability and uptake P in acid soils following combined application of biochar and arbuscular mycorrhiza (AM) fungal spores [32]. In this present study, the use of CLB alone did not significantly improve maize growth and P uptake because nutrients in this organic amendment alone was not enough to support the growth and development of maize plants. However, the significant maize plant growth in T7 was due to an increase in P fertilizer use efficiency (Figure 2 and Figure 3).

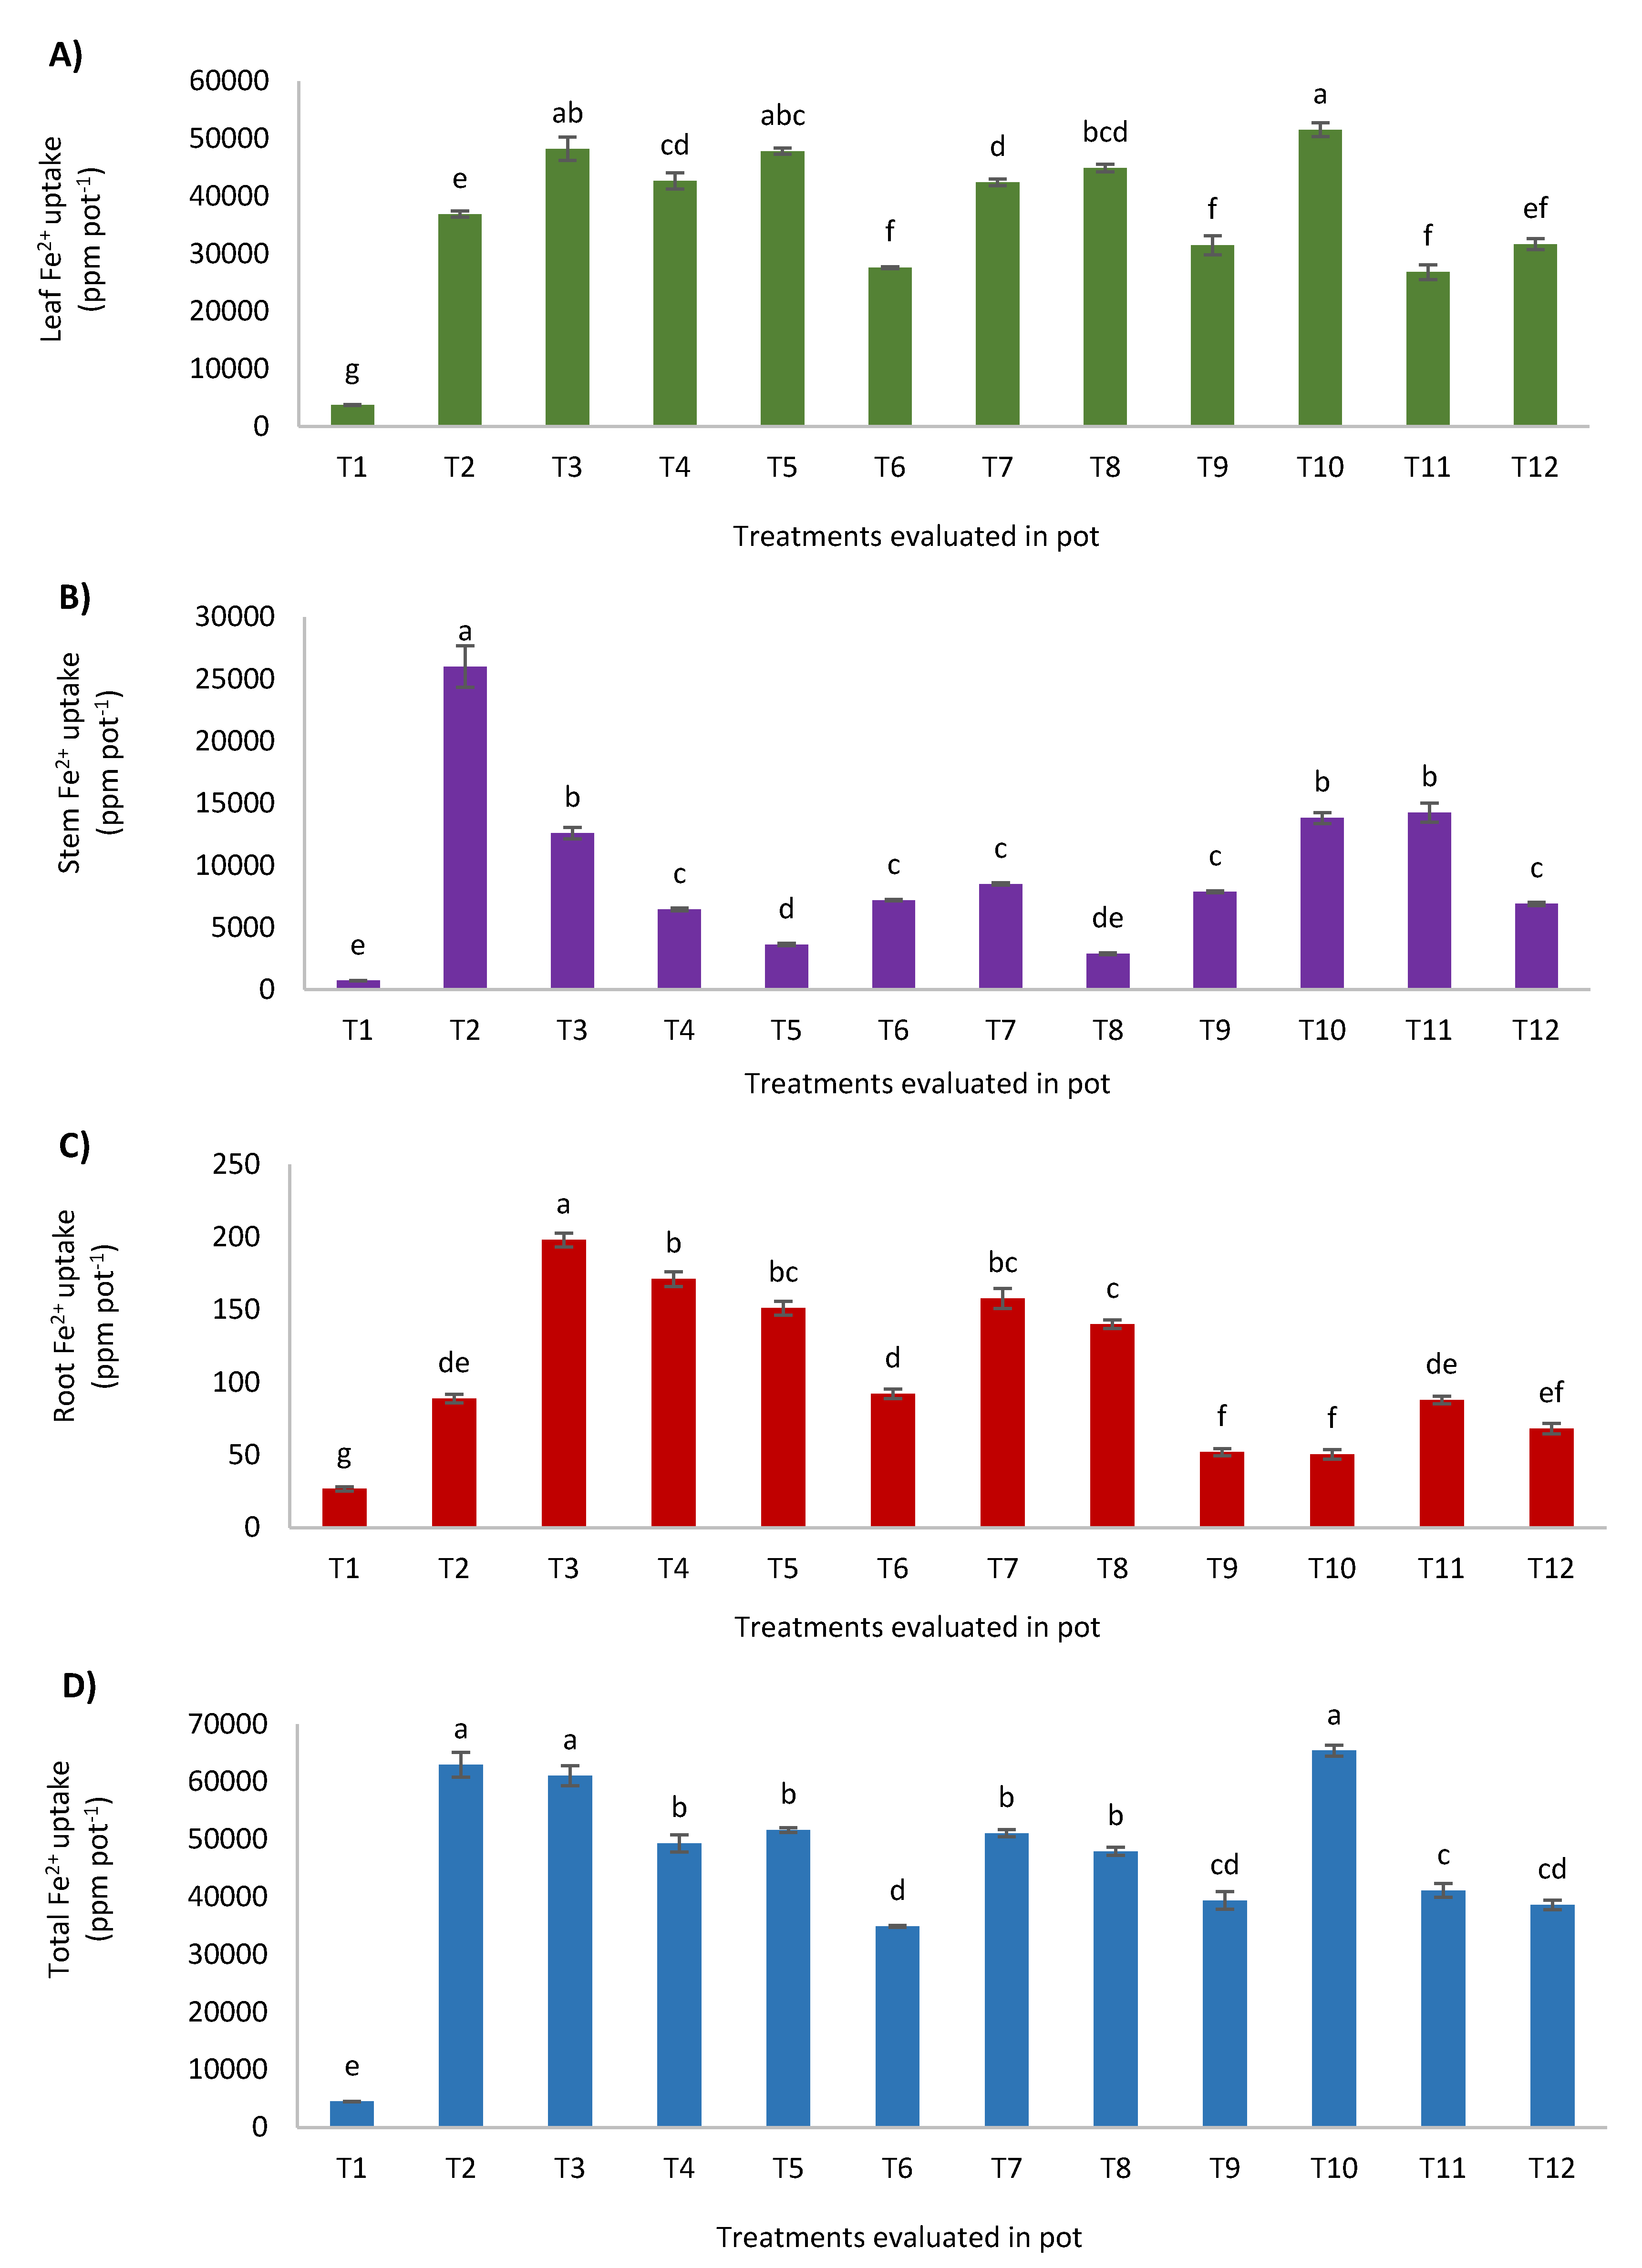
3.2. Effects of Different Amounts of Chicken Litter Biochar and Phosphorus on Plant Nutrient Uptake

Maize plant leaves, stems, and roots P uptake in T1 (soil only) were statistically lower than other treatments (Figure 4A–C) because one of the most common problems associated with highly weathered mineral acid soils is Al3+ toxicity [33] because Al3+ toxicity reduces plant growth and development increases. Additionally, highly weathered mineral acid soils are low in P because of P fixation by Fe, Al, and Mn. These factors contribute to severe reduction of soil P availability and P uptake [33]. Leaf P uptake with only chemical fertilization (T2) was statistically higher than with CLB (Figure 4A). Phosphorus uptake in stems was higher in T4, T7, T10, and T11 than those of T1, T2, T5, T6, T9, and T12 (Figure 4B) whereas P uptake in the maize plant roots of T3, T8, and T9 were not statistically different but higher than those of T1, T2, T4, T5, T6, T7, T10, T11, and T12 (Figure 4C). This was because most of the P taken up in T2 were not translated into dry matter production compared with the treatments with CLB where most of the nutrients taken up were converted into dry matter yield [34]. Generally, total P uptake in T2 was similar to those of T4, T7, and T11 but significantly lower than that of T10 (Figure 4D). Treatment 10 showed the highest total P uptake because this treatment had the highest amounts of CLB and TSP. This suggests that T10 (combination of CLB and TSP) is the most suitable treatment that can improve maize plants growth and development on tropical acid soils.
Iron uptake in leaves, stems, and roots of T1 were statistically lower than in other treatments due to the poor growth and development of maize plants (Figure 5A–C). Iron uptake in leaf and root of T2 was lower than those of T3, T4, T5, T7, T8, and T10 (Figure 5A,C). However, in stem, Fe uptake in T2 was statistically higher than the rest of the treatments (Figure 5B) and this was due to the higher concentration of Fe in the maize plant biomass of T2 compared with the treatments with CLB. Generally, the total Fe uptake in T2 was not statistically different from those of T3 and T10 but higher than those of T1, T4, T5, T6, T7, T8, T9, T11, and T12 (Figure 5D). These results further confirm the liming effect of CLB and its ability to reduce concentrations of Fe and Al in the soil solution of tropical acid soils [35].
With T1, the N, K, Ca, Na, and Mg taken up by the maize plants’ leaves, stems, and roots were statistically lower than those of T2, T3, T4, T5, T6, T7, T8, T9, T10, T11, and T12 (Table 5, Table 6, Table 7, Table 8 and Table 9) because of the inherent low fertility of Bekenu series [36,37]. Amending tropical acid soils with biochar increases soil P and K availability [38,39,40]. In addition, biochar is not only able to reduce P fixation, but it also increases mineralization of nutrients such as N, release of K, and availability of Ca, Na, and Mg by complexing with organic radicals [41]. Moreover, the use of CLB as an organic amendment in tropical acid soils has been reported to improve plant productivity through efficient plant nutrient absorption and translocation for dry matter production [42]. Treatment seven significantly increased N uptake in leaves, stems, and roots than those of T1, T2, T3, T4, T5, T6, T8, T9, T10, T11, and T12 (Table 5). Van Zwieten et al. also reported a similar effect of biochar on N uptake [43]. The differences observed in leaves, stems, and roots nutrients uptake could be related to the physiology of maize plants. Higher accumulation of plant biomass occurs in the stems and followed by leaves [44].

3.3. Crop Recovery and Agronomic Efficiency of Triple Superphosphate Applied in Pot Trial

Crop recovery (REP) and aAgronomic efficiency (AEP) results (Table 10) suggest P was higher in the soils with CLB than in the soil with the standard practice (T2) (Table 10). This confirms the findings of Cui et al. that biochars could enhance P availability and uptake [45]. Nèble et al. raised the concerns for a sustainable P fertilizer used because of the continued depletion of P fertilizer reserves in the world [46]. In this regard, biochar produced from animal wastes could be an alternative P source. Results of this present study further confirm that the use of CLB does not only serve as a source of P, but it can also increase efficient utilization of P fertilizers. Crop recovery of applied TSP increased with increasing rate of TSP and CLB (Table 10). This finding also suggests that biochar from manures contains highly soluble P which directly increases soil available P [47]. Furthermore, CLB improves soil micro-environment for phosphatase activities such as transforming organic P into inorganic P thereby making it available for plant uptake [48]. Results on agronomic efficiency is consistent with the increase in the maize plant dry matter yield of the treatments with CLB (Table 10). The agronomic efficiency of T10, T11, and T12 were highest and this supports the increase in plant dry matter yield of T10 as discussed earlier.

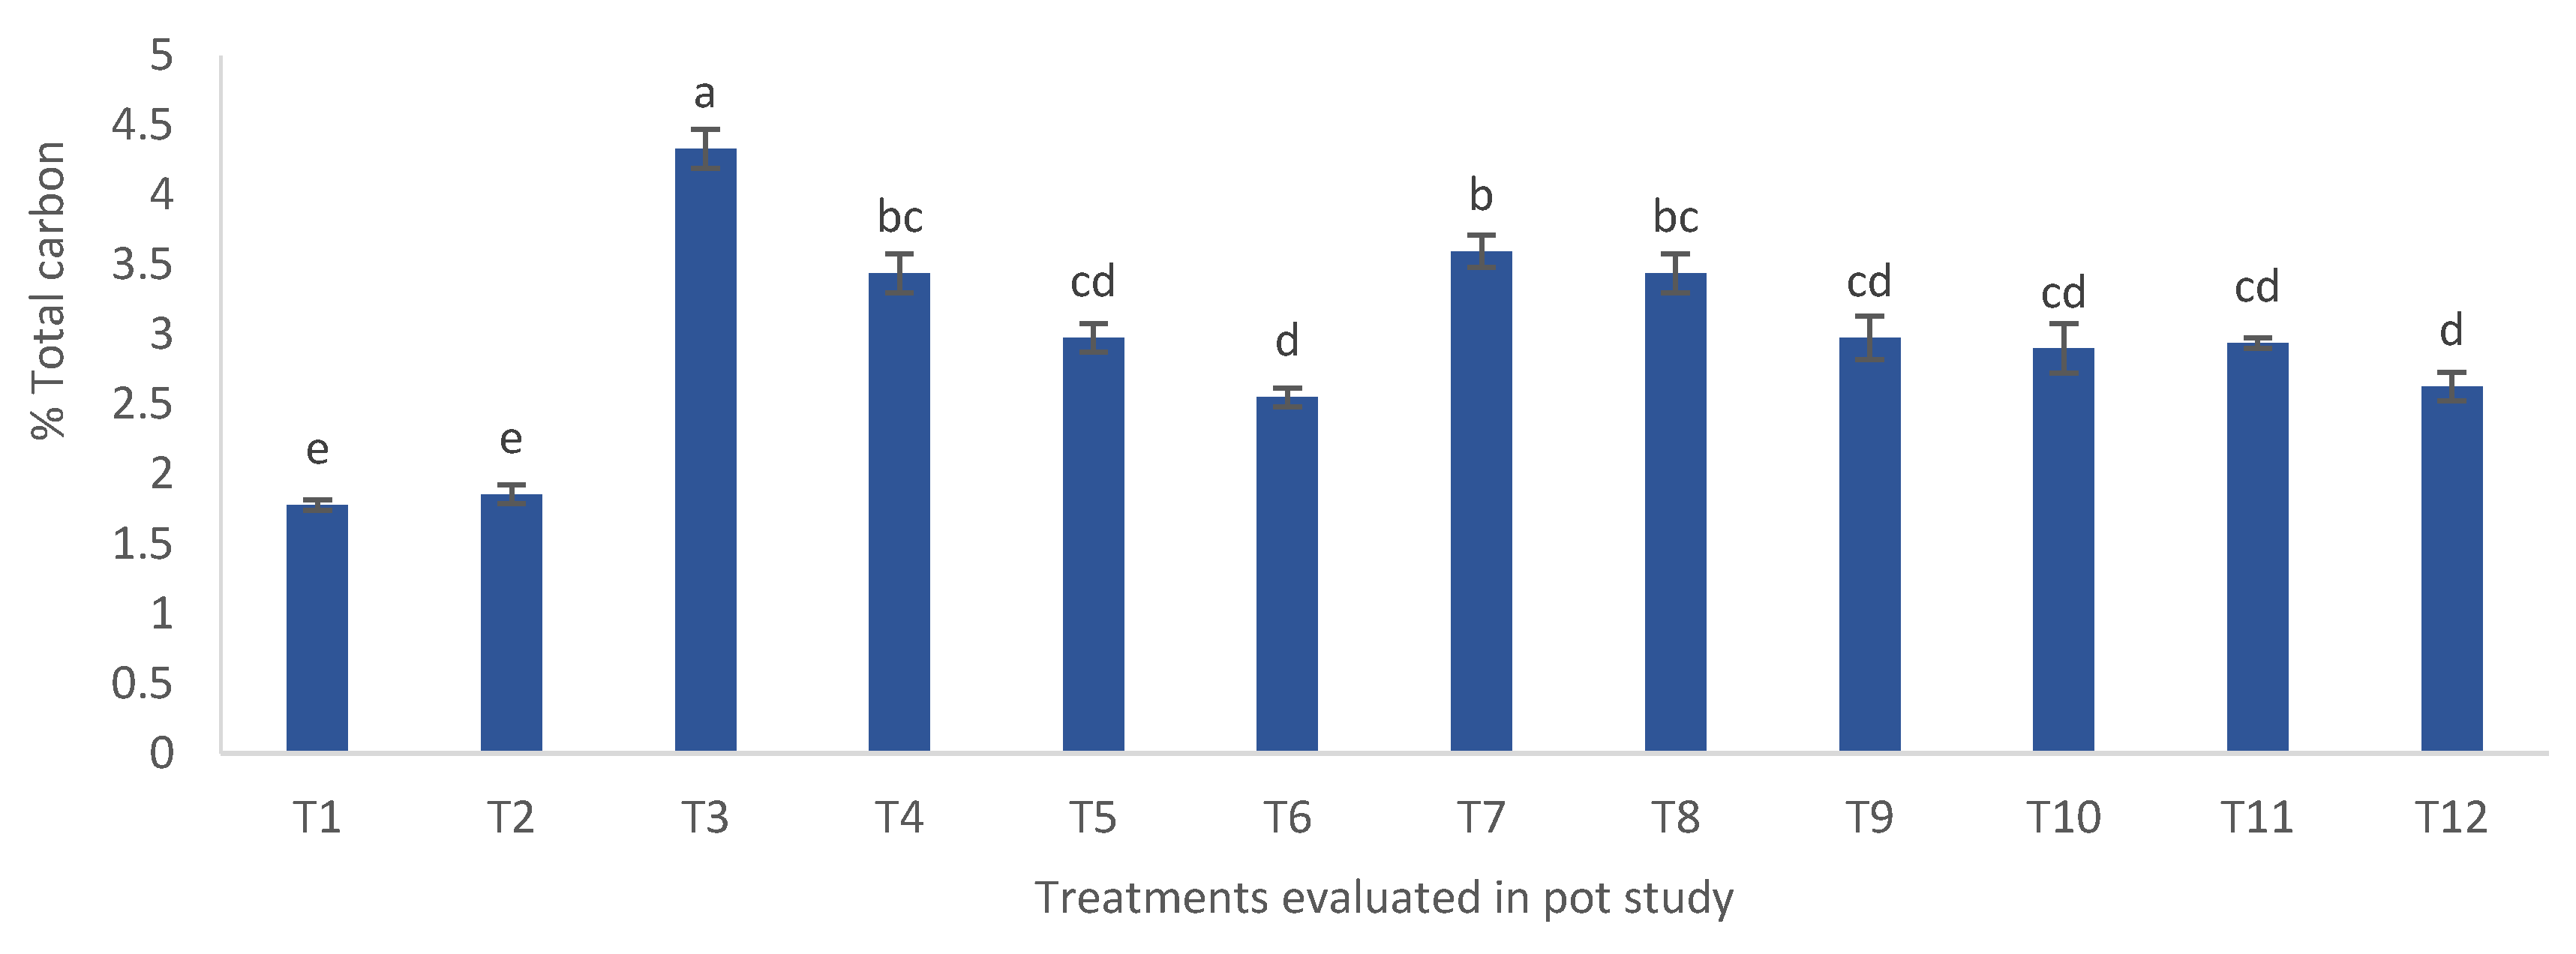
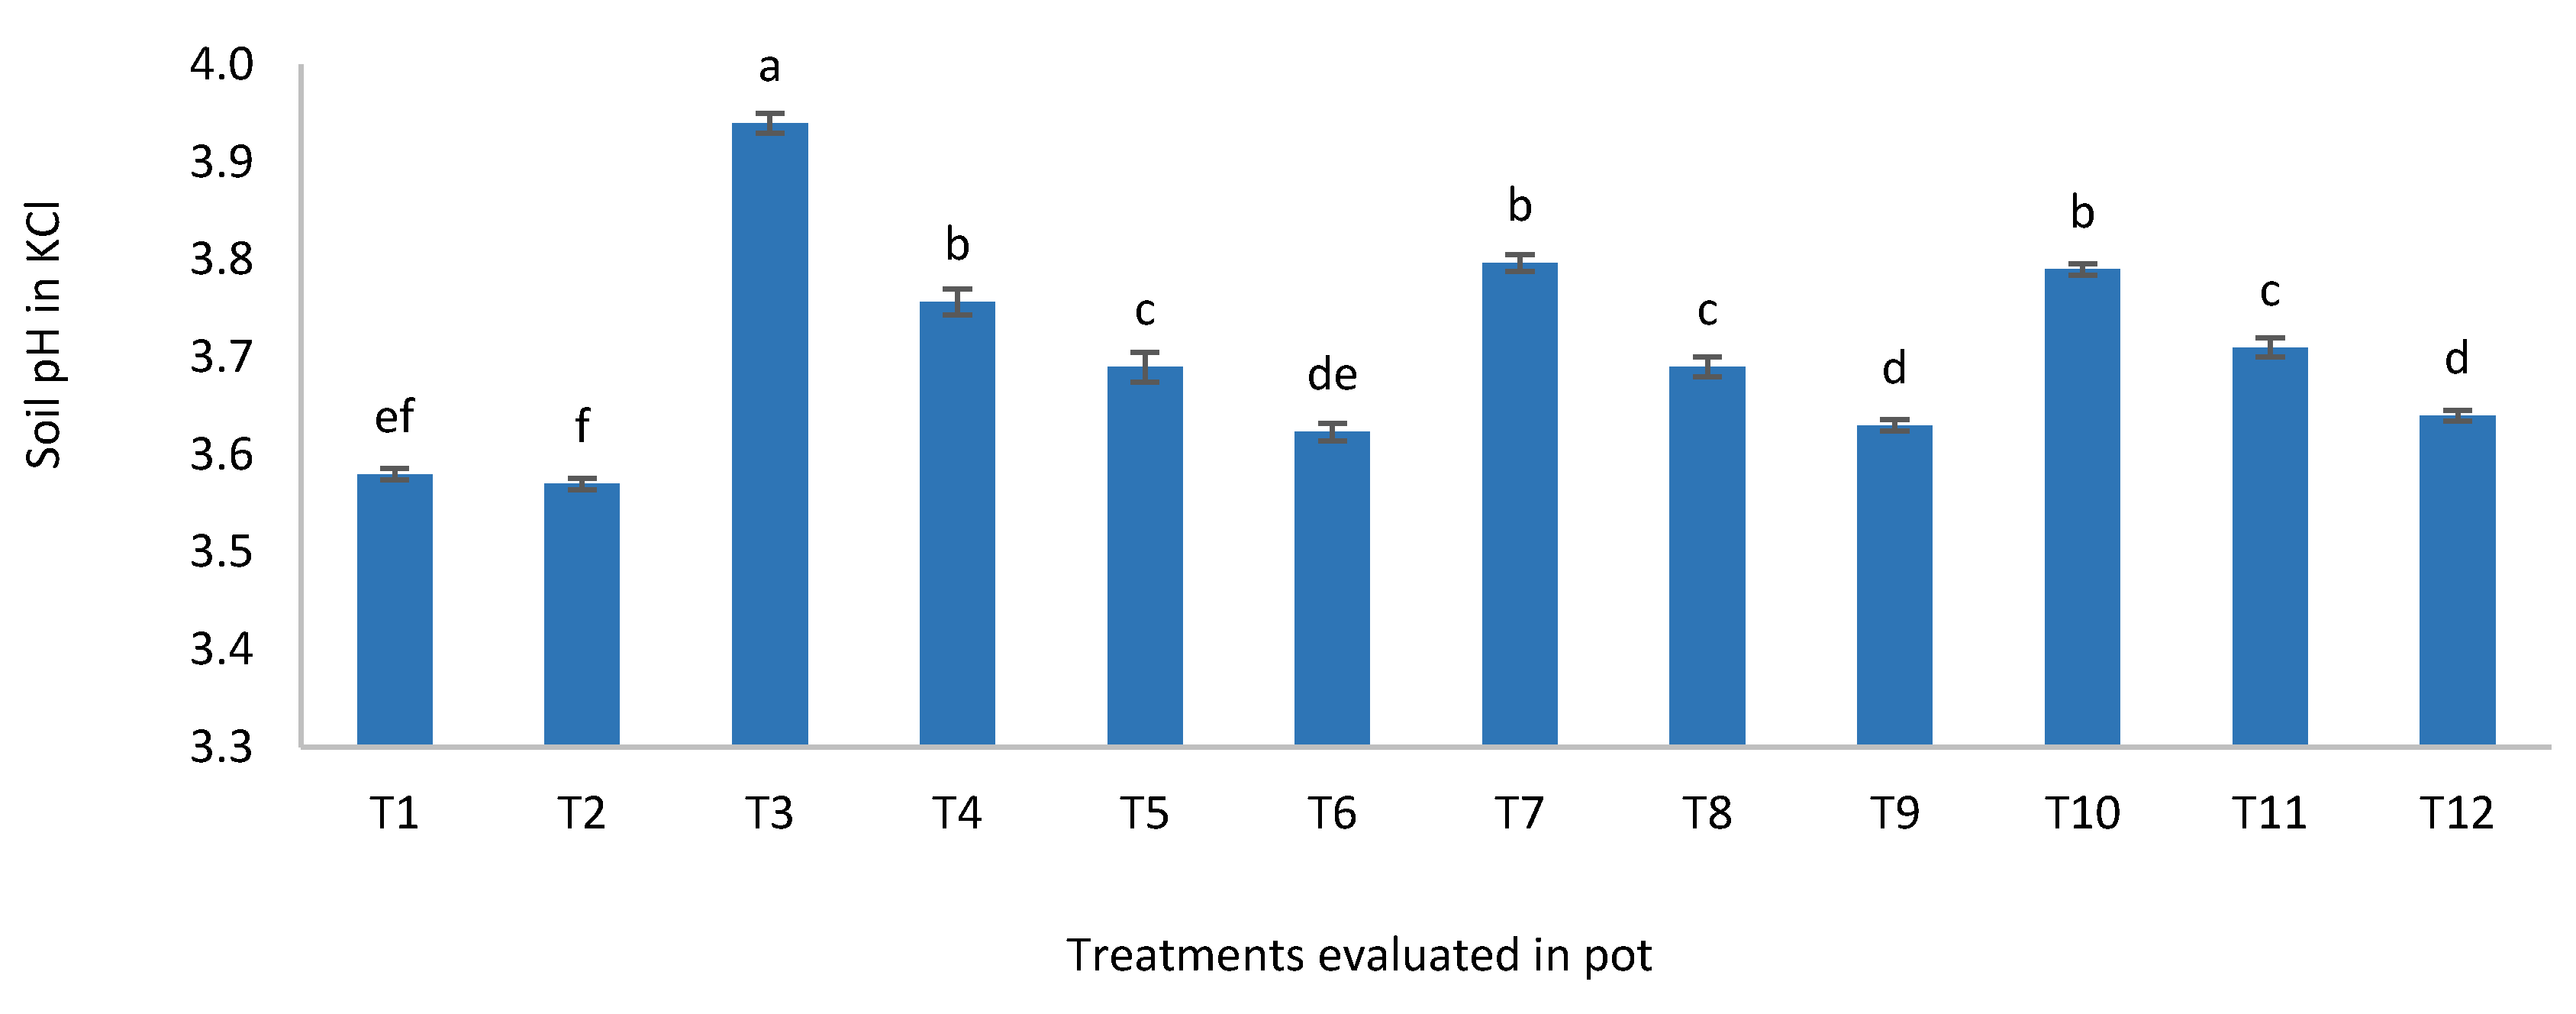
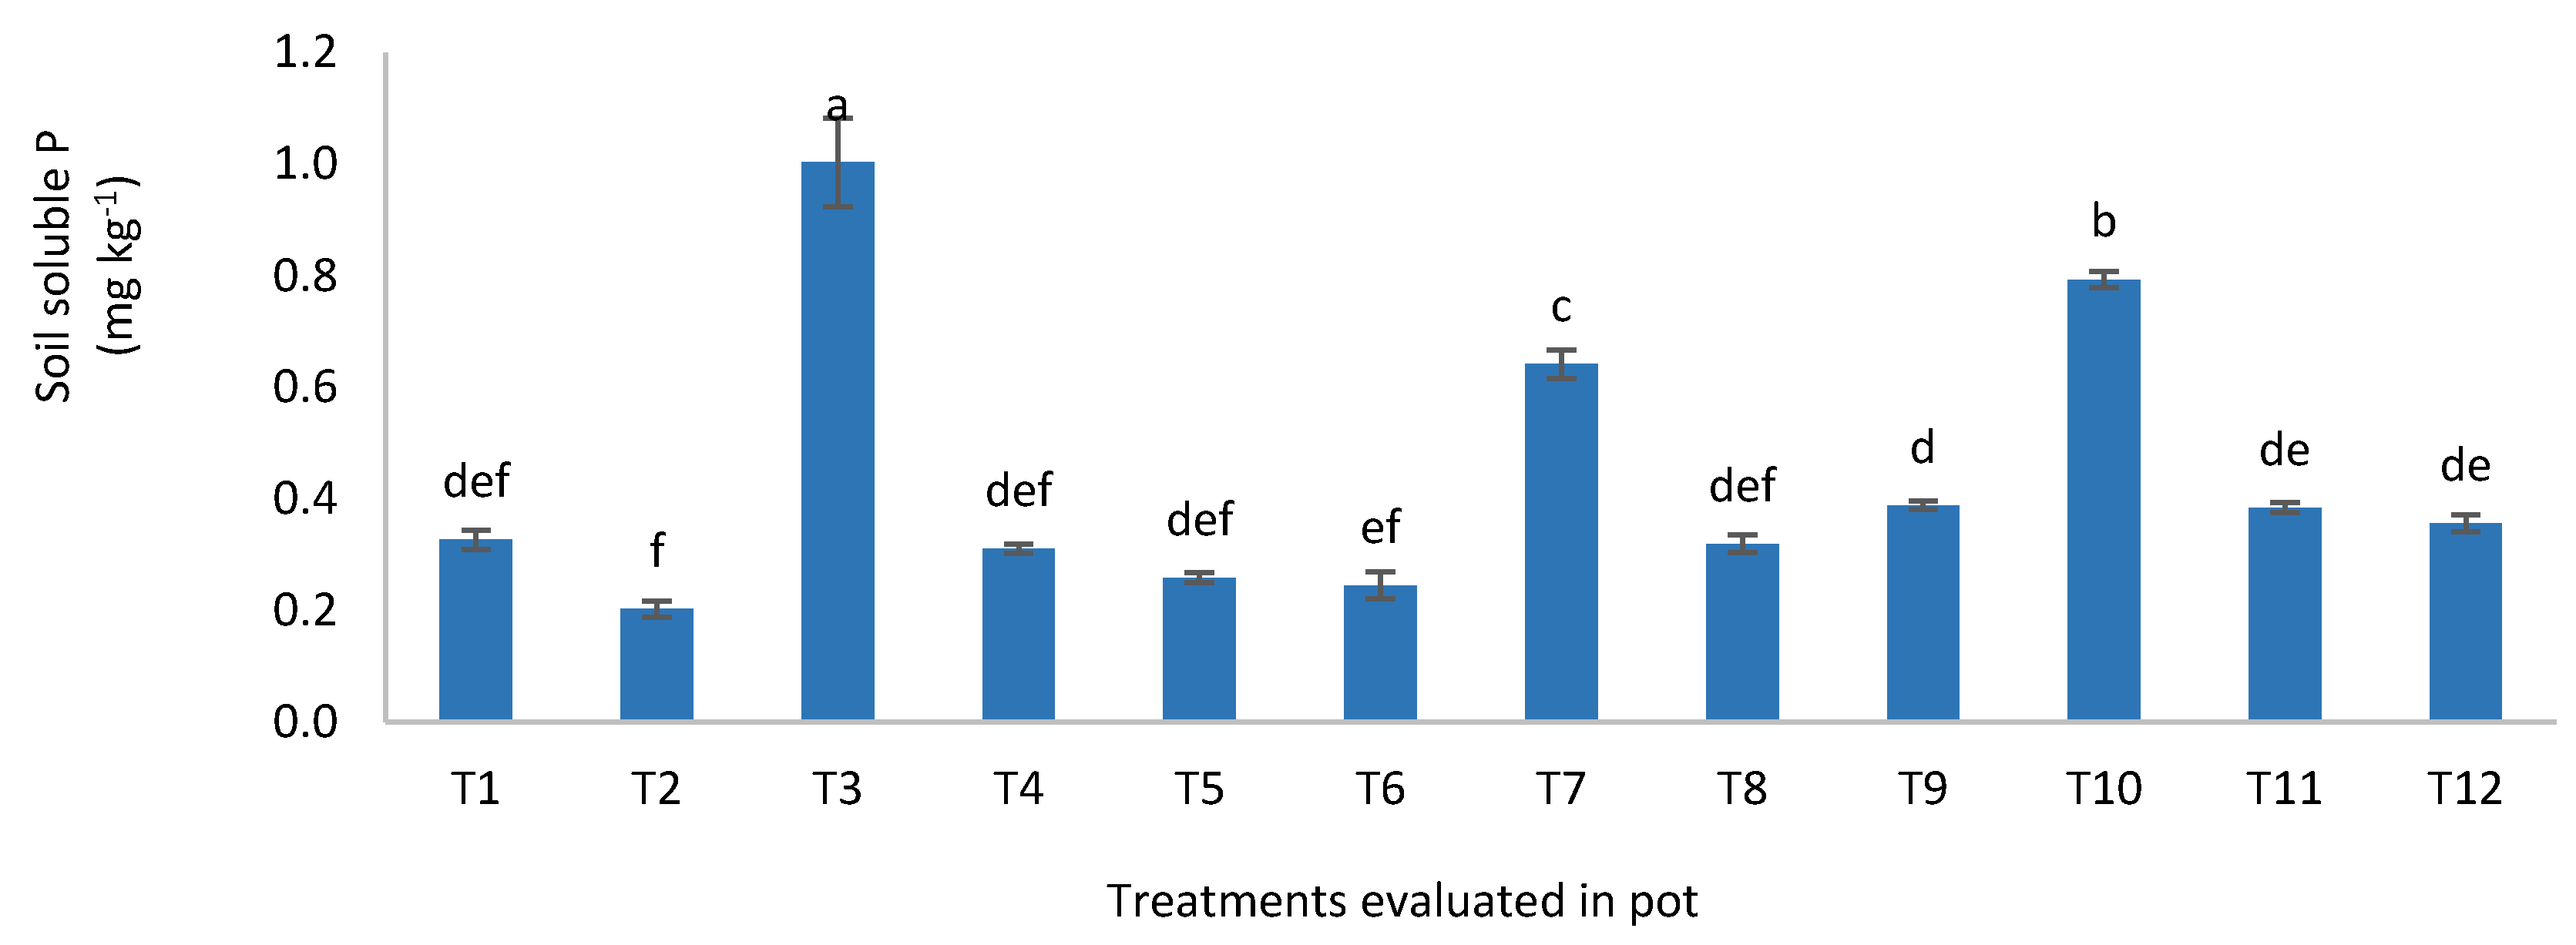
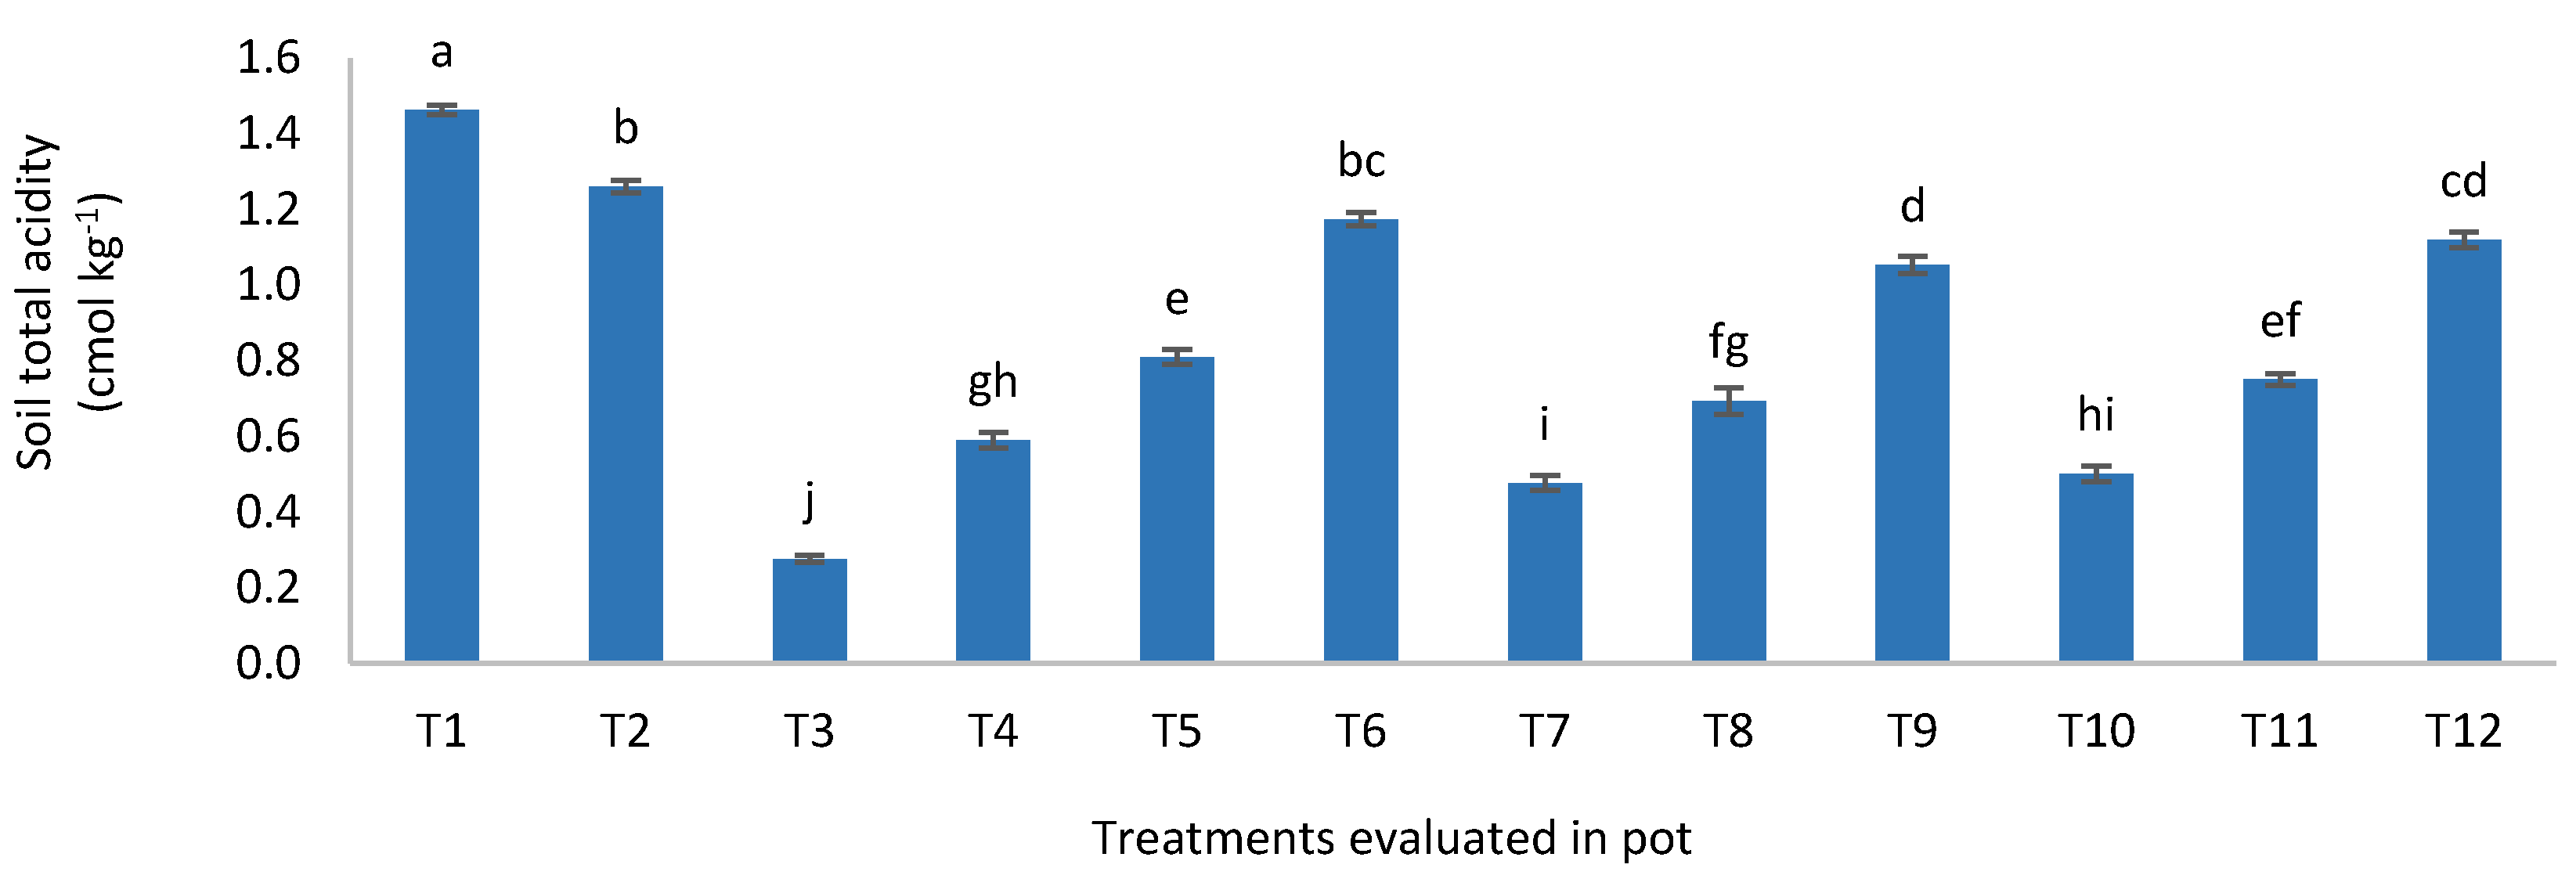
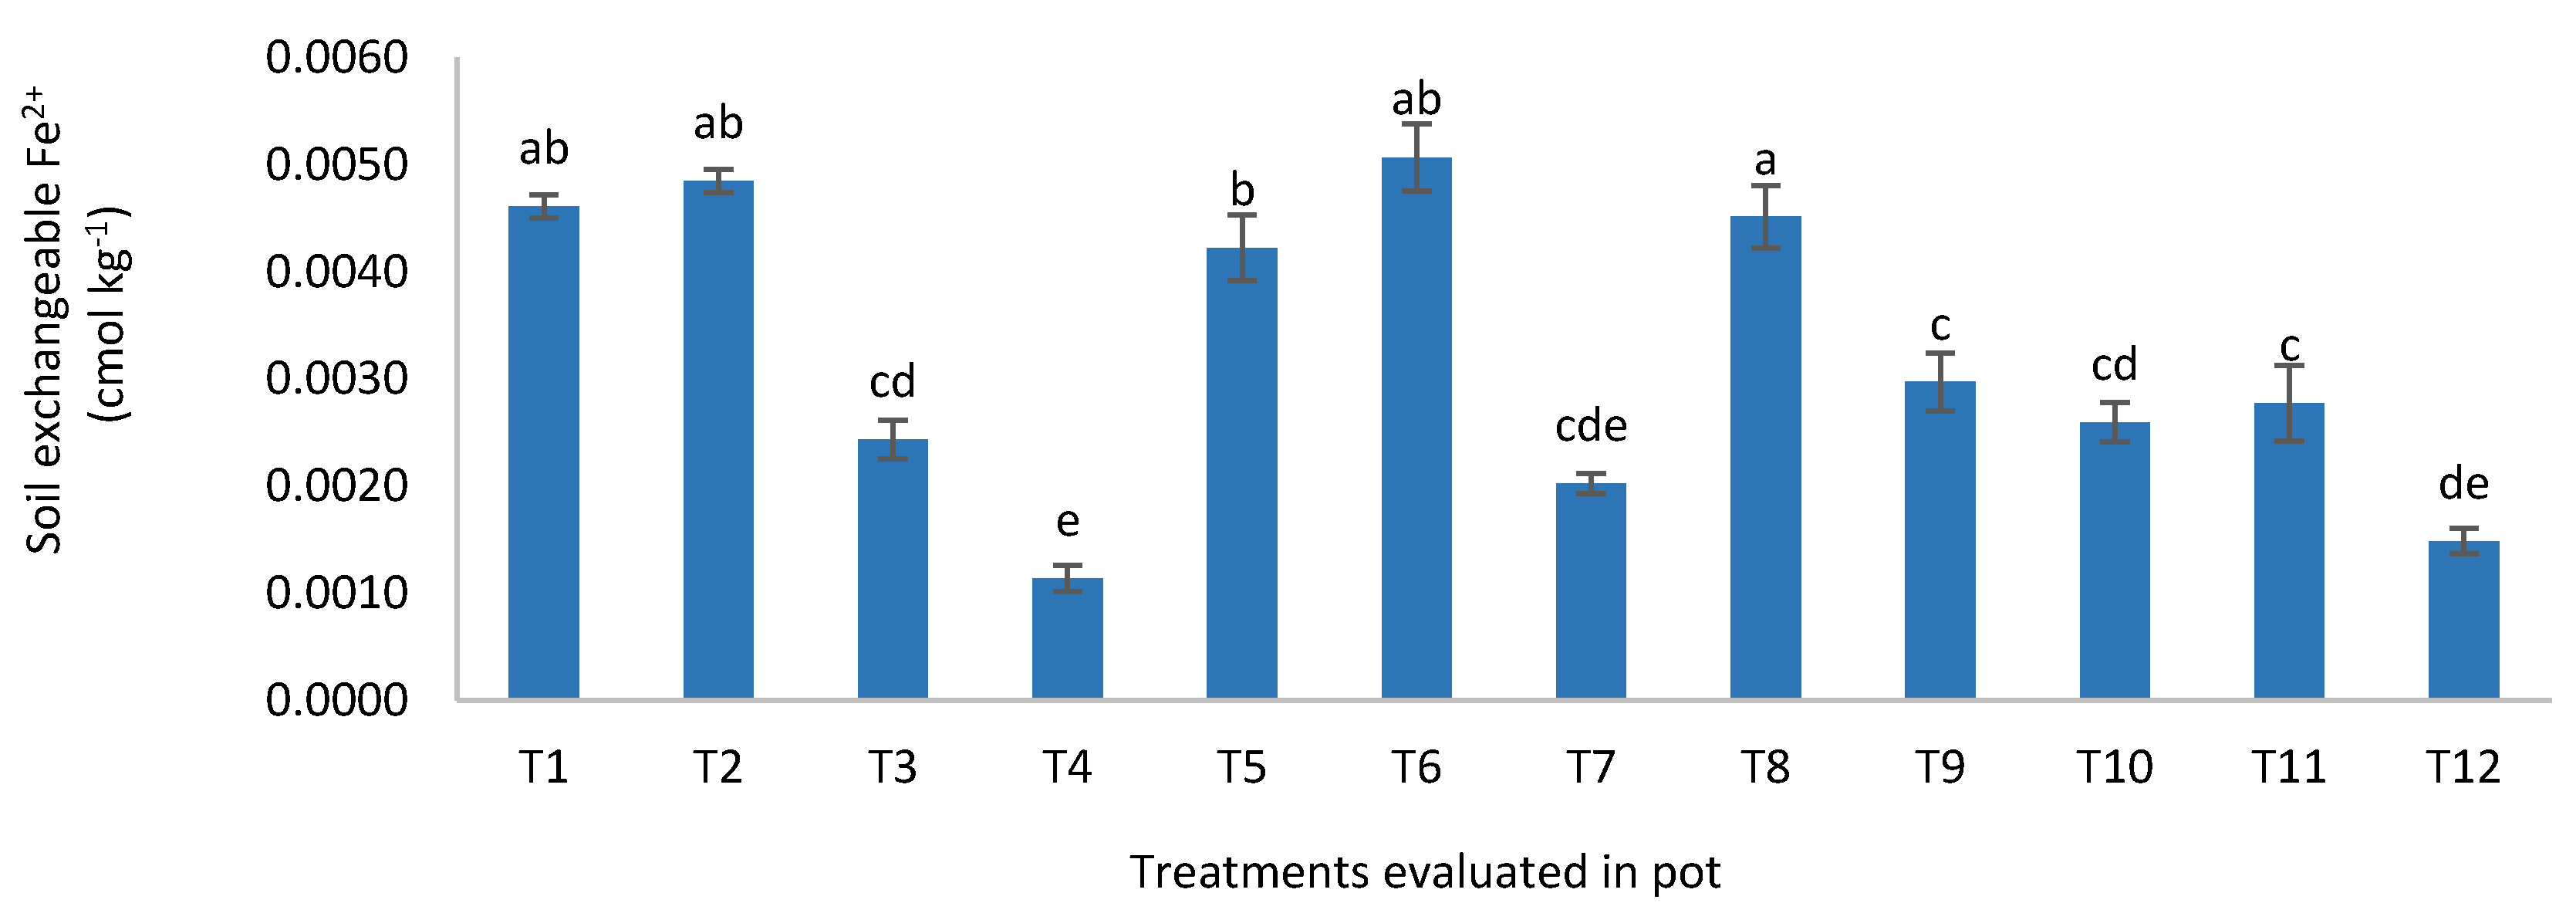
3.4. Effects of Different Amounts of Chicken Litter Biochar and Phosphorus on Soil Physico-Chemical Properties at Fifty Days after Sowing

Soil total organic carbon of T2 was not statistically different from that of T1 but lower than the soils with CLB. Among the soils with CLB, T3 showed statistically higher effect on total organic carbon than those of T4, T5, T6, T7, T8, T9, T10, T11, and T12 (Figure 6). Increase in the total organic carbon of the soils with the CLB suggests the contribution of this organic amendment to soil organic matter. Among the treatments, T3 showed the highest effect because it had 100% CLB. This also suggests that soil total organic carbon increases with increasing amount of CLB. Zhang et al. attributed the increase in maize yield to increase soil organic carbon following application of biochar [48]. Biochar use on acid soils also improved soil total organic carbon [49,50]. Biochar’s are stable in soils such that they are able to store soil carbon for many years [51,52]. Moreover, they provide soil nutrients in addition to improving soil water holding capacity.
Soil pH in water and KCl of T1 and T2 were statistically lower than those of T3, T4, T5, T7, T8, T9, T10, T11, and T12. Among the soils with CLB, pH of T3 was statistically higher than those of T4, T5, T7, T8, T9, T10, T11, and T12 (Figure 7 and Figure 8) because biochars have some alkaline materials [52,53] and because of this, they are able reduce soil acidity [54,55]. This also explains the liming effect of biochars [56]. Their liming effect had been associated with alkaline metals (Ca, Mg, and K) oxides [57,58,59]. Generally, biochar application to nutrient-impoverished tropical soils considerably improves soil fertility by not only increasing soil pH but it also reduces Al and Fe hydrolysis or Al and Fe toxicity. These positive effects of biochars improve soil quality/health and crop yields [60].
Soil total and available P of T2 were not statistically different from those of T5, T6, T8, T9, and T12 but lower than those of T3, T4, T7, and T10 (Figure 9 and Figure 10). Soil total P of the treatment with CLB only (T3) was higher because of higher charred material in the soil [61]. However, the availability of P was lower because the maize plants might have used most of the available nutrients especially P to substitute N and other limiting nutrients. For T4, T7, and T10, the soil total P and available P were higher because 75% CLB was combined with 25%, 50%, and 75% of TSP (Figure 9 and Figure 10). This suggests that CLB can increase total P in the soils with significant release of P for plant uptake. This is possible because P increases during biochar production [62]. The TSP in this present study also contributed P because it is highly water-soluble [63]. The increase in soil available P following application of CLB further explains why the maize plants dry matter yield and P uptake were higher in the treatments with 75% CLB and 25%, 50%, and 75% of TSP. This observation further suggests that to optimize the use of scarce P resources, it is prudent to use only 25% TSP with 75% of 5 t ha−1 of CLB.
Water-soluble P of the treatments were lower than those of total and available P however, the water-soluble P of T3 was statistically higher than those of T1, T2, T4, T5, T6, T7, T8, T9, T10, T11, and T12 whereas the water-soluble of T2 was lower than those of T7, T9, T10, T11, and T12 (Figure 11) because water-soluble in this study increased with increasing P, indicating the direct P concentration in soil solution [63]. Moreover, the higher water-soluble P of T3 is partly associated with Ca, Mg, and K ions in biochars as they tend to flocculate colloidal soil [64,65].
Soil total acidity, exchangeable Al3+, and H+ of T1 were statistically higher than those of T2, T3, T4, T5, T6, T7, T8, T9, T10, T11, and T12 (Figure 12, Figure 13 and Figure 14). In T2, soil total acidity and exchangeable Al3+ were similar to those of T6 but higher than those of T3, T4, T5, T7, T8, T9, T10, T11, and T12 (Figure 12 and Figure 13). Most tropical soils are acidic such that they are prone to Al toxicity. This results in low soil organic matter, high P fixation, and low microorganism activity [66]. Lower soil total acidity, exchangeable Al3+, and H+ were observed in T3, T7, and T10 because these treatments had enough CLB to decrease soil total acidity and exchangeable Al3+ (Figure 12, Figure 13 and Figure 14). Furthermore, soil acidity reduces CEC and nutrient availability. Studies on tropical acid soils and plant productivity had suggested that soil and plant productivity relate to Al toxicity because this reduction leads to a significant increase in soil pH [67].
Soil exchangeable Fe of T1, T2, T6, and T8 were not statistically different but higher than those of T3, T4, T7, T9, T10, T11, and T12 (Figure 15). Exchangeable Fe decreased in the soils with CLB because of precipitation and formation of organo-metallic complexes. Reduction of Fe in soils with CLB increased availability of soil total P, available P, and P uptake in plants than with the standard practice [68]. Havlin et al. stated that one of the important characteristics of biochars is their ability to increase soil CEC because this enables plant nutrients availability or retention nutrients in soils [69]. However, in this pot study, soil CEC of T1, T2, T3, T4, T5, T6, T7, T8, and T10 were not statistically different (Figure 16) because of the confinement of the maize plants in this pot experiment.
Soil exchangeable K, Ca, Mg, and Na of T2 and T1 were similar but lower than those with CLB (Table 11). The treatments with CLB showed higher soil exchangeable K, Ca, Mg, and Na because of their liming effect and ability to supply essential macro and micro nutrients [70]. Growth of the maize plants with CLB were better than those without this organic amendment. Soil total N at harvest were not statistically different among treatments. At tasseling stage, N in the soil was absorbed for cobs production. Additionally, the CLB used in this study was low in N such that it could not have a significant effect on soil total N. This confirms the findings of [71] that biochars are not rich in N as most of N in their parent materials are lost during pyrolysis. Additionally, higher plant N uptake might have depleted the soil’s N contents.

4. Conclusions

Amending a tropical acid soil with CLB can reduce total acidity, exchangeable Al3+, and exchangeable H+ and it also increases soil pH. The reduction of soil acidic cations (Al3+, Fe3+, and H+) does not only increase soil pH but it also mitigates P fixation by Al3+ and Fe3+. Soil total P, available P, and water-soluble P were increased with increasing rate of CLB because of the P content in this organic amendment. Additionally, the effect of different rates of the CLB on efficiency of TSP indicated that, using 25% and 50% CLB of 5 t ha−1 with 75% TSP significantly increased soil P availability, recovery, agronomic use efficiency, and dry matter yield of maize plant compared with the chemical fertilization alone. The CLB can also increase not only soil total organic carbon but it can also increase availability of base cations exchangeable K, Ca, Mg, and Na. to enhance growth and development of maize plants. Although 75% chicken litter biochar of 5 t ha−1 with 75% TSP significantly increased soil P availability, recovery, agronomic use efficiency, and dry matter yield of maize plant, economically, using 25% and 50% chicken litter biochar of 5 t ha−1 with 75% TSP will be more profitable. The findings of this study suggest that application of CLB alone does not improve maize growth and development because of insufficient P in CLB to support the growth of maize plant. However, combining 25% and 50% CLB of 5 t ha−1 with 75% TSP can increase soil P availability, P recovery, agronomic efficiency, and maize productivity.

Author Contributions

Conceptualization, A.O.H. and N.M.A.M.; formal analysis, A.A., N.M., and A.V.J.; project administration, A.M.; supervision, A.O.H. and N.M.A.M.; writing—original draft, A.M.; writing—review and editing, A.O.H. All authors have read and agreed to the published version of the manuscript.

Funding

This research was funded by Ministry of Higher Education Malaysia for Putra Grant Scheme (Grant No. 9622000) and Universiti Puta Malaysia.

Acknowledgments

Authors would like to acknowledge Ministry of Higher Education Malaysia for Putra Grant Scheme (Grant No. 9622000) and Universiti Putra Malaysia for funding this study.

Conflicts of Interest

The authors declare that there is no conflict of interest.

References

  1. Sharif, M.; Arif, M.; Burni, T.; Khan, F.; Jan, B.; Khan, I. Growth and phosphorus uptake of sorghum plants in salt affected soil as affected by organic materials Composted with rock phosphate. Pak. J. Bot. 2014, 46, 173–180. [Google Scholar]
  2. Sato, S. Phosphorus Sorption and Desorption in a Brazilian Ultisol: Effects of pH and Organic Anions on Phosphorus Bioavailability. Ph.D. Thesis, University of Florida, Gainesville, FL, USA, 2003; p. 124. [Google Scholar]
  3. Bomans, E.; Fransen, K.; Gobin, A.; Mertens, J.; Michiels, P.; Vandendriessche, H.; Vogels, N. Addressing Phosphorus Related Problems in Farm Practice; European Commission DG ENV: Brussels, Belgium, 2005. [Google Scholar]
  4. Adnan, A.; Mavinic, D.S.; Koch, F.A. Pilot-scale study of phosphorus recovery through struvite crystallization examining the process feasibility. J. Environ. Eng. Sci. 2003, 2, 315–324. [Google Scholar] [CrossRef]
  5. Rahman, Z.A.; Gikonyo, E.; Silek, B.; Goh, K.J.; Soltangheis, A. Evaluation of phosphate rock sources and rate of application on oil palm yield grown on peat soils of Sarawak, Malaysia. J. Agron. 2014, 13, 12–22. [Google Scholar] [CrossRef] [Green Version]
  6. Ch’ng, H.Y.; Ahmed, O.H.; Majid, N.M.A. Biochar and compost influence the phosphorus availability, nutrients uptake, and growth of maize (Zea mays L.) in tropical acid soil. Pak. J. Agric. Sci. 2014, 51, 797–806. [Google Scholar]
  7. Ch’ng, H.Y.; Ahmed, O.H.; Majid, N.M.A. Improving phosphorus availability, nutrient uptake and dry matter production of Zea mays L. on a tropical acid soil using poultry manure biochar and pineapple leaves compost. Exp. Agric. 2016, 52, 447–465. [Google Scholar] [CrossRef]
  8. Lehmann, J.; Gaunt, J.; Rondon, M. Bio-char sequestration in terrestrial ecosystems–A review. Mitig. Adapt. Strateg. Glob. Chang. 2006, 11, 395–419. [Google Scholar] [CrossRef]
  9. Zeng, F.; Ali, S.; Zhang, H.; Ouyang, Y.; Qiu, B.; Wu, F.; Zhang, G. The influence of pH and organic matter content in paddy soil on heavy metal availability and their uptake by rice plants. Environ. Pollut. 2011, 159, 84–91. [Google Scholar] [CrossRef] [PubMed]
  10. Antal, M.J.; Grønli, M. The art, science, and technology of charcoal production. Ind. Eng. Chem. Res. 2003, 42, 1619–1640. [Google Scholar] [CrossRef]
  11. Demirbas, A. Effects of temperature and particle size on bio-char yield from pyrolysis of agricultural residues. J. Anal. Appl. Pyrolysis 2004, 72, 243–248. [Google Scholar] [CrossRef]
  12. Ch’ng, H.Y.; Ahmed, O.H.; Majid, N.M.A. Improving phosphorus availability in an acid soil using organic amendments produced from agroindustrial wastes. Sci. World J. 2014. [Google Scholar] [CrossRef]
  13. Malaysian Agricultural Research and Development Institute (MARDI). Jagung Manis Baru (New Sweet Corn): Masmadu; MARDI: Kuala Lumpur, Malaysia, 1993.
  14. Deal, C.; Brewer, C.E.; Brown, R.C.; Okure, M.A.; Amoding, A. Comparison of kiln-derived and gasifier-derived biochars as soil amendments in the humid tropics. Biomass Bioenergy 2012, 37, 161–168. [Google Scholar] [CrossRef]
  15. Maru, A.; Haruna, O.A.; Charles Primus, W. Coapplication of chicken litter biochar and urea only to improve nutrients use efficiency and yield of Oryza sativa L. cultivation on a tropical acid soil. Sci. World J. 2015, 2015, 943853. [Google Scholar] [CrossRef] [PubMed] [Green Version]
  16. Latifah, O.; Ahmed, O.H.; Majid, N.M.A. Short Term Enhancement of Nutrients Availability in Zea mays L. Cultivation on an Acid Soil Using Compost and Clinoptilolite Zeolite. Compost Sci. Util. 2017, 25, 22–35. [Google Scholar] [CrossRef]
  17. Susilawati, K.; Osumanu, H.A.; Nik, M.; Mohd, K.Y.; Mohamadu, B.J. Effect of organic based N fertilizer on dry matter (Zea mays L.), ammonium and nitrate recovery in an acid soil of Sarawak, Malaysia. Am. J. Appl. Sci. 2009, 6, 1289–1294. [Google Scholar] [CrossRef]
  18. Palanivell, P.; Ahmed, O.H.; Ab Majid, N.M.; Jalloh, M.B.; Susilawati, K. Improving lowland rice (O. sativa L. cv. MR219) plant growth variables, nutrients uptake, and nutrients recovery using crude humic substances. Sci. World J. 2015, 2015, 906094. [Google Scholar] [CrossRef] [PubMed] [Green Version]
  19. Peech, H.M. Hydrogen-ion Activity. In Method of Soil Analysis, Part 2; Black, C.A., Evan, D.D., Ensminger, L.E., White, J.L., Clark, F.E., Dinauer, R.C., Eds.; American society of Agronomy: Madison, WI, USA, 1965; pp. 914–926. [Google Scholar]
  20. Chefetz, B.; Hatcher, P.G.; Hadar, Y.; Chen, Y. Chemical and biological characterization of organic matter during composting of municipal solid waste. J. Environ. Qual. 1996, 25, 776–785. [Google Scholar] [CrossRef]
  21. Cottenie, A. Soil testing and plant testing as a basis of fertilizer recommendation. FAO Soils Bull. 1980, 38, 70–73. [Google Scholar]
  22. Yamato, M.; Okimori, Y.; Wibowo, I.F.; Anshori, S.; Ogawa, M. Effects of the application of charred bark of Acacia mangium on the yield of maize, cowpea and peanut, and soil chemical properties in South Sumatra, Indonesia. Soil Sci. Plant Nutr. 2006, 52, 489–495. [Google Scholar] [CrossRef]
  23. Tan, K.H. Soil Sampling, Preparation and Analysis, 2nd ed.; Taylor and Francis Group: Boca Raton, FL, USA, 2005; pp. 154–174. [Google Scholar]
  24. Mehlich, A. Determination of P, Ca, Mg, K, Na and NH4; North Carolina State University Soil Test Division: Raleigh, NC, USA, 1953. [Google Scholar]
  25. Murphy, J.; Riley, J.P. A modified single solution method for the determination of phosphate in natural waters. Anal. Chim. Acta 1962, 27, 31–36. [Google Scholar] [CrossRef]
  26. Rowell, D.L. Soil Science: Methods and Applications; University of Reading: Reading, UK, 1994. [Google Scholar]
  27. SAS. SAS/STAT Software. In SAS Institute, 2nd ed.; SAS Institute Inc.: Cary, NC, USA, 2013. [Google Scholar]
  28. Fageria, N.K.; Baligar, V.C. Ameliorating soil acidity of tropical Oxisols by liming for sustainable crop production. Adv. Agron. 2008, 99, 345–399. [Google Scholar]
  29. Akinrinde, E.A. Strategies for improving crops’ use-efficiencies of fertilizer nutrients in sustainable agricultural systems. Pak. J. Nutr. 2006, 5, 185–193. [Google Scholar] [CrossRef] [Green Version]
  30. Patel, P.C.; Yadav, N.K. Effect of Biochar on Growth, Dry Matter Yield and Nutrition of Corn (Zea mays L.) Grown on Sandy Loam of Middle Gujarat. Ph.D. Thesis, Anand Agricultural University, Anand, India, 2015. [Google Scholar]
  31. Ndor, E.; Jayeoba, J.O.; Asadu, C.L.A.; Iheshiulo, E.M.-A. Growth, nutrient uptake and dry matter yield of maize (Zea mays L.) grown in soil amended with rice husk and sawdust biochar. Int. J. Sci. Res. Agric. Sci. 2016, 3, 99–103. [Google Scholar] [CrossRef]
  32. Mau, A.E.; Utami, S.R. Effects of biochar amendment and arbuscular mycorrhizal fungi inoculation on availability of soil phosphorus and growth of maize. J. Degrad. Min. Lands Manag. 2014, 1, 69–74. [Google Scholar] [CrossRef]
  33. Nekesa, A.O.; Okaebo, J.R.; Otheno, C.O.; Thuita, M.N.; Kipsat, M.; Batiano, A.; Sanginga, N.; Kimettu, J.; Vanlauwe, B. The potential of Minjingu phosphate rock from Tanzania as a liming material: Effect on maize and bean intercrop on acid soils of western Kenya. Afr. Crop Sci. Conf. Proc. 2005, 7, 1121–1128. [Google Scholar]
  34. Manickam, T.; Cornelissen, G.; Bachmann, R.; Ibrahim, I.; Mulder, J.; Hale, S. Biochar application in Malaysian sandy and acid sulfate soils: Soil amelioration effects and improved crop production over two cropping seasons. Sustainability 2015, 7, 16756–16770. [Google Scholar] [CrossRef] [Green Version]
  35. Cui, L.; Li, L.; Zhang, A.; Pan, G.; Bao, D.; Chang, A. Biochar amendment greatly reduces rice Cd uptake in a contaminated paddy soil: A two-year field experiment. BioResources 2011, 6, 2605–2618. [Google Scholar] [CrossRef]
  36. Sanchez, P.A.; Swaminathan, M.S. Cutting world hunger in half. Science 2005, 307, 357–359. [Google Scholar] [CrossRef] [Green Version]
  37. Sanchez, P.A.; Swaminathan, M.S. Hunger in Africa: The link between unhealthy people and unhealthy soils. Lancet 2005, 365, 442–444. [Google Scholar] [CrossRef]
  38. Dempster, D.N.; Gleeson, D.B.; Solaiman, Z.I.; Jones, D.L.; Murphy, D.V. Decreased soil microbial biomass and nitrogen mineralisation with Eucalyptus biochar addition to a coarse textured soil. Plant Soil 2012, 354, 311–324. [Google Scholar] [CrossRef]
  39. Dempster, D.N.; Jones, D.L.; Murphy, D.V. Clay and biochar amendments decreased inorganic but not dissolved organic nitrogen leaching in soil. Soil Res. 2012, 50, 216–221. [Google Scholar] [CrossRef]
  40. Taghizadeh-Toosi, A.; Clough, T.J.; Sherlock, R.R.; Condron, L.M. Biochar adsorbed ammonia is bioavailable. Plant Soil 2012, 350, 57–69. [Google Scholar] [CrossRef]
  41. Wang, X.D.; Chen, X.N.; Ali, A.; Liu, S.; Lu, L.L. Dynamics of humic substance-complexed copper and copper leaching during composting of chicken manure. Pedosphere 2010, 20, 245–251. [Google Scholar] [CrossRef]
  42. Mahadi, M.A. Growth, nutrient uptake and yield of maize (Zea mays L.) as influenced by weed control and poultry manure. Int. J. Sci. Nat. 2014, 5, 94–102. [Google Scholar]
  43. Major, J.; Lehmann, J.; Rondon, M.; Goodale, C. Fate of soil-applied black carbon: Downward migration, leaching and soil respiration. Glob. Chang. Biol. 2010, 16, 1366–1379. [Google Scholar] [CrossRef]
  44. Van Zwieten, L.; Kimber, S.; Morris, S.; Downie, A.; Berger, E.; Rust, J.; Scheer, C. Influence of biochars on flux of N2O and CO2 from Ferrosol. Soil Res. 2010, 48, 555–568. [Google Scholar] [CrossRef]
  45. Pordesimo, L.O.; Edens, W.C.; Sokhansanj, S. Distribution of above ground biomass in corn stover. In 2002 ASAE Annual Meeting (p. 1); American Society of Agricultural and Biological Engineers: St Joseph, MI, USA, 2002. [Google Scholar]
  46. Cui, H.J.; Wang, M.K.; Fu, M.L.; Ci, E. Enhancing phosphorus availability in phosphorus-fertilized zones by reducing phosphate adsorbed on ferrihydrite using rice straw-derived biochar. J. Soils Sediments 2011, 11, 1135. [Google Scholar] [CrossRef]
  47. Nèble, S.; Calvert, V.; Le Petit, J.; Criquet, S. Dynamics of phosphatase activities in a cork oak litter (Quercus suber L.) following sewage sludge application. Soil Biol. Biochem. 2007, 39, 2735–2742. [Google Scholar] [CrossRef]
  48. Jin, Y.; Liang, X.; He, M.; Liu, Y.; Tian, G.; Shi, J. Manure biochar influence upon soil properties, phosphorus distribution and phosphatase activities: A microcosm incubation study. Chemosphere 2016, 142, 128–135. [Google Scholar] [CrossRef]
  49. Zhang, A.; Liu, Y.; Pan, G.; Hussain, Q.; Li, L.; Zheng, J.; Zhang, X. Effect of biochar amendment on maize yield and greenhouse gas emissions from a soil organic carbon poor calcareous loamy soil from Central China Plain. Plant. Soil 2012, 351, 263–275. [Google Scholar] [CrossRef]
  50. Khan, S.; Chao, C.; Waqas, M.; Arp, H.P.H.; Zhu, Y.G. Sewage sludge biochar influence upon rice (Oryza sativa L.) yield, metal bioaccumulation and greenhouse gas emissions from acidic paddy soil. Environ. Sci. Technol. 2013, 47, 8624–8632. [Google Scholar] [CrossRef]
  51. Khan, S.; Reid, B.J.; Li, G.; Zhu, Y.G. Application of biochar to soil reduces cancer risk via rice consumption: A case study in Miaoqian village, Longyan, China. Environ. Int. 2014, 68, 154–161. [Google Scholar] [CrossRef] [PubMed] [Green Version]
  52. Lal, R. Black and buried carbons’ impacts on soil quality and ecosystem services. Soil Tillage Res. 2008, 99, 1–3. [Google Scholar] [CrossRef]
  53. Sohi, S.P.; Krull, E.; Lopez-Capel, E.; Bol, R. A review of biochar and its use and function in soil. Adv. Agron. 2010, 105, 47–82. [Google Scholar] [CrossRef]
  54. Gaskin, J.W.; Steiner, C.; Harris, K.; Das, K.C.; Bibens, B. Effect of low-temperature pyrolysis conditions on biochar for agricultural use. Trans. ASABE 2008, 51, 2061–2069. [Google Scholar] [CrossRef]
  55. Chan, K.Y.; Van Zwieten, L.; Meszaros, I.; Downie, A.; Joseph, S. Using poultry litter biochars as soil amendments. Soil Res. 2008, 46, 437–444. [Google Scholar] [CrossRef]
  56. Novak, J.M.; Busscher, W.J.; Laird, D.L.; Ahmedna, M.; Watts, D.W.; Niandou, M.A. Impact of biochar amendment on fertility of a south-eastern coastal plain soil. Soil Sci. 2009, 174, 105–112. [Google Scholar] [CrossRef] [Green Version]
  57. Atkinson, C.J.; Fitzgerald, J.D.; Hipps, N.A. Potential mechanisms for achieving agricultural benefits from biochar application to temperate soils: A review. Plant Soil 2010, 337, 1–18. [Google Scholar] [CrossRef]
  58. Steiner, C.; Teixeira, W.G.; Lehmann, J.; Nehls, T.; de Macêdo, J.L.V.; Blum, W.E.; Zech, W. Long term effects of manure, charcoal and mineral fertilization on crop production and fertility on a highly weathered Central Amazonian upland soil. Plant Soil 2007, 291, 275–290. [Google Scholar] [CrossRef] [Green Version]
  59. Yuan, J.H.; Xu, R.K. The amelioration effects of low temperature biochar generated from nine crop residues on an acidic Ultisol. Soil Use Manag. 2011, 27, 110–115. [Google Scholar] [CrossRef]
  60. Yuan, J.H.; Xu, R.K.; Wang, N.; Li, J.Y. Amendment of acid soils with crop residues and biochars. Pedosphere 2011, 21, 302–308. [Google Scholar] [CrossRef]
  61. Van Zwieten, L.; Kimber, S.; Downie, A.; Chan, K.Y.; Cowie, A.; Wainberg, R.; Morris, S. Papermill char: Benefits to soil health and plant production. In Proceedings of the Conference of the International Agrichar Initiative, Terrigal, Australia, 27 April–2 May 2007; Volume 30. [Google Scholar]
  62. Hammond, D.S.; Steege, H.T.; Van Der Borg, K. Upland soil charcoal in the wet tropical forests of central Guyana. Biotropica 2007, 39, 153–160. [Google Scholar] [CrossRef]
  63. Brown, R. Biochar production technology. In Biochar for Environmental Management: Science and Technology; Lehmann, J., Joseph, S., Eds.; Earthscan: London, UK, 2009; pp. 127–146. [Google Scholar]
  64. McLaughlin, M.J.; McBeath, T.M.; Smernik, R.; Stacey, S.P.; Ajiboye, B.; Guppy, C. The chemical nature of P accumulation in agricultural soils—Implications for fertiliser management and design: An Australian perspective. Plant Soil 2011, 349, 69–87. [Google Scholar] [CrossRef]
  65. Koopmans, G.F.; Chardon, W.J.; Van der Salm, C. Disturbance of water-extractable phosphorus determination by colloidal particles in a heavy clay soil from the Netherlands. J. Environ. Qual. 2005, 34, 1446–1450. [Google Scholar] [CrossRef] [PubMed]
  66. Parvage, M.M.; Ulén, B.; Eriksson, J.; Strock, J.; Kirchmann, H. Phosphorus availability in soils amended with wheat residue char. Biol. Fertil. Soils 2013, 49, 245–250. [Google Scholar] [CrossRef] [Green Version]
  67. Cusack, D.F.; Silver, W.L.; Torn, M.S.; Burton, S.D.; Firestone, M.K. Changes in microbial community characteristics and soil organic matter with nitrogen additions in two tropical forests. Ecology 2011, 92, 621–632. [Google Scholar] [CrossRef] [Green Version]
  68. Verheijen, F.; Jeffery, S.; Bastos, A.C.; Van der Velde, M.; Diafas, L. Biochar application to soils. Crit. Sci. Rev. Eff. Soil Prop. Process. Funct. EUR. 2010, 24099, 162. [Google Scholar]
  69. DeLuca, T.H.; MacKenzie, M.D.; Gundale, M.J. Biochar effects on soil nutrient transformation. In Biochar for Environmental Management Science and Technology; Lehmann, J., Joseph, S., Eds.; Earthscan: London, UK, 2009; Chapter 14; pp. 251–270. [Google Scholar]
  70. Havlin, J.L.; Beaton, J.D.; Tisdale, S.L.; Nelson, W.L. Soil Fertility and Fertilizers: An Introduction to Nutrient Management; Pearson Prentice Hall: Upper Saddle River, NJ, USA, 2005; Volume 515, pp. 97–141. [Google Scholar]
  71. Taghizadeh-Toosi, A.; Clough, T.J.; Condron, L.M.; Sherlock, R.R.; Anderson, C.R.; Craigie, R.A. Biochar incorporation into pasture soil suppresses in situ nitrous oxide emissions from ruminant urine patches. J. Environ. Qual. 2011, 40, 468–476. [Google Scholar] [CrossRef] [Green Version]
Figure 1. Effects of treatments on dry weight of (A) leaves; (B) stems; (C) roots; and (D) total dry matter yield of maize at tasseling stage. Different letters indicate significant difference between means using Tukey’s HSD (Honestly Significant Difference) test at p ≤ 0.05. The error bars are the ± standard error of triplicates.
Applsci 10 02127 g001
Figure 2. Effects of treatments on maize plants at tasseling stage.
Applsci 10 02127 g002
Figure 3. Effects of treatments on maize plants’ root at tasseling stage. (Note: T represents treatment and R represents replication).
Applsci 10 02127 g003
Figure 4. Effects of treatments on P uptake of (A) leaves; (B) stems; (C) roots; and (D) total P uptake of maize at tasseling stage. Different letters indicate significant difference between means using Tukey’s HSD (Honestly Significant Difference) test at p ≤ 0.05. The error bars are the ± standard error of triplicates.
Applsci 10 02127 g004
Figure 5. Effects of treatments on iron uptake of (A) leaves; (B) stems; (C) roots; and (D) total iron uptake of maize at tasseling stage. Different letters indicate significant difference between means using Tukey’s HSD (Honestly Significant Difference) test at p ≤ 0.05. The error bars are the ± standard error of triplicates.
Applsci 10 02127 g005
Figure 6. Effects of treatments on soil total organic carbon. Different letters indicate significant difference between means using Tukey’s HSD (Honestly Significant Difference) test at p ≤ 0.05. The error bars are the ± standard error of triplicates.
Applsci 10 02127 g006
Figure 7. Effects of treatments on soil pH in water. Different letters indicate significant difference between means using Tukey’s HSD (Honestly Significant Difference) test at p ≤ 0.05. The error bars are the ± standard error of triplicates.
Applsci 10 02127 g007
Figure 8. Effects of treatments on soil pH in KCl. Different letters indicate significant difference between means using Tukey’s HSD (Honestly Significant Difference) test at p ≤ 0.05. The error bars are the ± standard error of triplicates.
Applsci 10 02127 g008
Figure 9. Effects of treatments on soil total phosphorus. Different letters indicate significant difference between means using Tukey’s HSD (Honestly Significant Difference) test at p ≤ 0.05. The error bars are the ± standard error of triplicates.
Applsci 10 02127 g009
Figure 10. Effects of treatments on soil available phosphorus. Different letters indicate significant difference between means using Tukey’s HSD (Honestly Significant Difference) test at p ≤ 0.05. The error bars are the ± standard error of triplicates.
Applsci 10 02127 g010
Figure 11. Effects of treatments on soil soluble phosphorus. Different letters indicate significant difference between means using Tukey’s HSD (Honestly Significant Difference) test at p ≤ 0.05. The error bars are the ± standard error of triplicates.
Applsci 10 02127 g011
Figure 12. Effects of treatments on soil total acidity. Different letters indicate significant difference between means using Tukey’s HSD (Honestly Significant Difference) test at p ≤ 0.05. The error bars are the ± standard error of triplicates.
Applsci 10 02127 g012
Figure 13. Effects of treatments on soil exchangeable Al3+. Different letters indicate significant difference between means using Tukey’s HSD (Honestly Significant Difference) test at p ≤ 0.05. The error bars are the ± standard error of triplicates.
Applsci 10 02127 g013
Figure 14. Effects of treatments on soil exchangeable H+. Different letters indicate significant difference between means using Tukey’s HSD (Honestly Significant Difference) test at p ≤ 0.05. The error bars are the ± standard error of triplicates.
Applsci 10 02127 g014
Figure 15. Effects of treatments on soil exchangeable Fe2+. Different letters indicate significant difference between means using Tukey’s HSD (Honestly Significant Difference) test at p ≤ 0.05. The error bars are the ± standard error of triplicates.
Applsci 10 02127 g015
Figure 16. Effects of treatments on soil cation exchange capacity. Different letters indicate significant difference between means using Tukey’s HSD (Honestly Significant Difference) test at p ≤ 0.05. The error bars are the ± standard error of triplicates.
Applsci 10 02127 g016
Table 1. Percentages of chicken litter biochar, nitrogen, phosphorus, and potassium fertilizers.
Treatment CodeTreatments
Biochar (5 t h−1)P (60 kg h−1)
T10%0%
T20%100%
T3100%0%
T475%25%
T550%25%
T625%25%
T775%50%
T850%50%
T925%50%
T1075%75%
T1150%75%
T1225%75%
Table 2. Scale down of chicken litter biochar, nitrogen, phosphorus, and potassium fertilizers rate in a pot study.
Treatment CodeBiochar RateFertilizers Rate
g plant−1
TSP
T100
T204.8
T31800
T41353.6
T5903.6
T6453.6
T71352.4
T8902.4
T9452.4
T101351.2
T11901.2
T12451.2
Table 3. Selected chemical properties of Black Earth chicken litter biochar.
Macro NutrientsMicro Nutrients
pH8.5Av. Particle Size0.5–2 mm
%mg kg−1
Total organic carbon63.7Silicon2.3Magnesium oxide6.7
Fixed Carbon61.2Aluminium1.5Arsenic2.1
Nitrogen2.8Potassium oxide16.3Cadmium0.7
Phosphate2.6Boron62Chromium9.6
Potassium3.9Copper167Mercury0.06
Calcium5.9Manganese1130Nickel14
Sulphur0.59Zinc856Lead12
Ash content23.7
Source: Maru et al. [15].
Table 4. Selected chemical and physical properties of Bekenu series (Typic Paleudult).
Soil PropertiesData Obtained (0–25 cm Depth)Standard Data Range (0–36 cm Depth)
pH in water4.444.6–4.9
pH in KCL3.833.8–4.0
Total C (%)1.20.57–2.51
Total N (%)0.080.08–0.17
Total P (g kg−1)0.18Nd
Available P (g kg−1)0.005Nd
Bulk density (g cm−3)1.18Nd
cmol kg−1
Available K0.140.05–0.19
CEC5.223.86–8.46
Total acidity0.51Nd
Exchangeable AL0.35Nd
Exchangeable H0.19Nd
Exchangeable Ca0.250.01
Exchangeable Mg0.340.07–0.21
Exchangeable Na0.220.01
Exchangeable Fe0.19Nd
Note: CEC: Cation exchange capacity; Nd: Not determined.
Table 5. Effects of co-applied biochar on nitrogen uptake of leaves, stems, and roots uptake of maize at tasseling stage.
LeavesStemsRootsTotal N Uptake
% pot−1
T16.44h ± 0.191.44 d ± 0.174.75e ± 0.0812.62f ± 0.11
T236.7cde ± 0.417.05c ± 0.3816.45ab ± 0.8770.2d ± 1.1
T317.53g ± 0.4714.6c ± 0.5912.05d ± 1.244.18e ± 1.21
T434.62def ± 0.3424.86b ± 1.4113.91bcd ± 0.5373.39d ± 1.77
T543.4abc ± 0.4524.78b ± 2.8214.16bcd ± 0.8882.34bc ± 1.49
T629.1f ± 1.6325.73b ± 0.7119.4a ± 0.5274.24cd ± 0.82
T746.66a ± 2.3636.26a ± 1.4816.07abc ± 0.4398.99a ± 3.07
T833.03def ± 1.7524.57b ± 0.7811.87d ± 0.9669.47d ± 1.43
T938.98bcd ± 2.0517.61c ± 0.3112.64cd ± 0.569.23d ± 2.32
T1036.86cde ± 1.7124.62b ± 1.3412.7cd ± 0.574.19cd ± 1.58
T1145.53ab ± 1.4334.18a ± 0.4910.6d ± 0.7690.31d ± 0.54
T1230.91ef ± 0.5932.05a ± 0.9611.49d ± 0.4174.45cd ± 1.19
Note: Different letters within a column indicate significant difference between means of three replicates ± standard error using Tukey’s test at p ≤ 0.05.
Table 6. Effects of treatments on potassium uptake of leaves, stems, and roots, and total potassium uptake of maize at tasseling stage.
LeavesStemsRootsTotal K Uptake
mg pot−1
T143.65g ± 0.7024.43g ± 0.6653.86g ± 1.18121.95f ± 1.78
T2371.37cd ± 12.30730.99cd ± 4.70196.85cde ± 10.591299.22c ± 5.01
T3569.47a ± 8.81824.61bc ± 4.86212.48cd ± 5.651606.56b ± 18.47
T4446.77b ± 11.791323.34a ± 36.95229.98c ± 7.822000.10a ± 40.67
T5538.21a ± 20.91994.76b ± 25.96171.03e ± 0.991703.99b ± 34.34
T6421.73bc ± 3.23693.26cde ± 7.05184.90de ± 5.58129.99c ± 15.17
T7426.42bc ± 12.94948.88b ± 26.62194.95cde ± 14.501570.26b ± 31.10
T8306.03ef ± 11.56586.16def ± 12.51174.76e ± 5.951066.949de ± 2.51
T9338.01de ± 12.56476.28f ± 14.15106.32f ± 2.65920.62e ± 8.78
T10361.55de ± 10.37505.92ef ± 6.29206.56cde ± 6.151074.05de ± 21.39
T11303.67ef ± 50.90557.40def ± 10.06406.97a ± 3.141268.03cd ± 7.32
T12269.66f ± 18.02562.00def ± 12.26343.22b ± 4.311174.89cd ± 129.07
Note: Different letters within a column indicate significant difference between means of three replicates ± standard error using Tukey’s test at p ≤ 0.05.
Table 7. Effects of treatments on calcium uptake of leaves, stems, and roots, and total calcium uptake of maize at tasseling stage.
LeavesStemsRootsTotal Ca Uptake
mg pot−1
T14.15f ± 0.054.11h ± 0.038.79d ± 0.1117.06f ± 0.12
T227.98e ± 1.1664.85g ± 1.6326.06c ± 3.76118.90e ± 2.18
T324.51e ± 0.2898.50def ± 0.0239.46b ± 0.78162.48d ± 1.60
T432.84d ± 0.72133.72ab ± 3.6143.25ab ± 0.97209.83ab ± 4.68
T535.51d ± 1.17108.08cde ± 1.5941.21b ± 0.27184.81c ± 0.28
T624.35e ± 1.17116.36bcd ± 2.2944.38ab ± 1.49185.09c ± 3.48
T752.12b ± 1.35124.63abc ± 4.1940.03b ± 4.41216.79a ± 1.46
T844.83c ± 0.79136.09a ± 4.6139.12b ± 0.92220.05a ± 4.70
T945.56c ± 0.9185.63f ± 0.7019.38c ± 0.99150.58d ± 5.63
T1048.18bc ± 1.76133.55ab ± 6.1337.54b ± 5.64219.29a ± 5.34
T1145.61c ± 1.04112.15cde ± 2.7140.58b ± 2.92198.35bc ± 2.92
T1256.58a ± 1.7796.31ef ± 6.9951.27a ± 1.16204.17ab ± 5.96
Note: Different letters within a column indicate significant difference between means of three replicates ± standard error using Tukey’s test at p ≤ 0.05.
Table 8. Effects of treatments on sodium uptake of leaves, stems, and roots, and total sodium uptake of maize at tasseling stage.
LeavesStemsRootsTotal Na Uptake
mg pot−1
T112.76e ± 0.280.38e ± 0.060.72h ± 0.00713.87g ± 0.28
T297.44d ± 2.057.34d ± 0.153.53f ± 0.27108.31ef ± 2.09
T3108.65cd ± 9.3622.49a ± 0.655.96a ± 0.05137.10de ± 9.07
T4142.23b ± 4.5913.57c ± 0.354.41cd ± 0.06160.22bcd ± 4.67
T5140.50b ± 8.846.61d ± 0.112.57g ± 0.05149.69cd ± 8.72
T690.24d ± 0.727.35d ± 1..654.68cd ± 0.11102.28f ± 1.89
T7166.89ab ± 5.9416.61b ± 866.55.50ab ± 0.15189.01ab ± 6.62
T8136.86bc ± 5.706.69d ± 0.0054.29de ± 0.09147.85d ± 5.76
T9182.48a ± 5.377.08d ± 0.103.36f ± 0.08192.94a ± 5.31
T10175.98a ± 3.636.40d ± 0.084.95bc ± 0.04187.34ab ± 3.71
T11174.25a ± 7.068.97d ± 0.053.72ef ± 0.03186.95ab ± 7.07
T12166.19ab ± 8.308.80d ± 0.664.64cd ±0.11179.64abc ± 7.71
Note: Different letters within a column indicate significant difference between means of three replicates ± standard error using Tukey’s test at p ≤ 0.05.
Table 9. Effects of treatments on magnesium uptake of leaves, stems, and roots, and total magnesium uptake of maize at tasseling stage.
LeavesStemsRootsTotal Mg Uptake
mg pot−1
T13.16f ± 0.012.21f ± 0.134.58g ± 0.119.95f ± 0.16
T227.01ab ± 0.3124.91e ± 0.6511.85f ± 1.4963.77e ± 1.32
T316.43e ± 0.4734.07d ± 1.4418.48de ± 0.4668.98e ± 2.06
T417.40e ± 0.7460.20ab ± 0.4725.98ab ± 0.46103.58b ± 0.85
T522.25cd ± 0.6945.75c ± 1.6018.63de ± 0.8386.63cd ± 2.72
T618.46de ± 0.3658.66b ± 0.2528.23a ± 0.11105.35b± 0.52
T723.49bc ± 1.2258.21b ± 1.3224.82b ± 0.59106.53ab ± 2.14
T818.49de ± 0.6344.43c ± 0.6720.47cd ± 0.468.34d ± 0.52
T929.78a ± 0.7344.97c ± 1.1416.84e ± 0.2391.60c ± 1.87
T1023.02bc ± 1.3344.48c ± 1.2323.32bc ± 0.7490.82cd ± 0.84
T1123.12bc ± 0.8564.84a ± 0.4226.00ab ± 0.22113.96a ± 1.08
T1224.98bc ± 1.2236.28d ± 0.4625.38ab ± 0.6186.63cd ± 1.73
Note: Different letters within a column indicate significant difference between means of three replicates ± standard error using Tukey’s test at p ≤ 0.05.
Table 10. Effects of treatments on crop recovery and agronomic efficiency of applied phosphorus at tasseling stage of maize plants.
TSPTotal P UptakeDry Matter YieldCrop Recovery Efficiency of Applied PAgronomic Efficiency of Applied P% Increase in Yield
g pot−1%
T10.000.016.8900.000.00
T24.800.1547.910.038.5585.62
T30.000.1465.2800.0089.45
T41.800.1577.670.0839.3291.13
T51.800.1375.860.0738.3190.92
T61.800.1272.240.0736.3190.46
T71.200.1686.330.1266.2092.02
T81.200.1363.270.1046.9989.11
T91.200.1367.220.1050.2889.75
T100.600.1968.090.30101.9989.88
T110.600.1679.820.25121.5591.37
T120.600.1274.830.18113.2390.79
Table 11. Chicken litter biochar and triple superphosphate on soil exchangeable cations after pot study.
Total NExchangeable KExchangeable CaExchangeable MgExchangeable Na
%cmol kg−1
T14.72a ± 0.020.81e ± 0.050.5f ± 0.010.1g ± 0.0040.0046g ± 0.0001
T24.61a ± 0.031.33 e± 0.040.51e ± 0.010.11g ± 0.0070.0049g ± 0.0001
T35.51a ± 0.092.90ab ± 0.081.46a ± 0.070.39a ± 0.010.0024a ± 0.0002
T45.245a ± 0.032.43d ± 0.061.23ab ± 0.020.356bc ± 0.0030.0011ab ± 0.0001
T55.01a ± 0.021.87de ± 0.030.95cd ± 0.030.29e ± 0.0080.0042cd ± 0.0003
T64.86a ± 0.021.28c ± 0.050.7ef ± 0.020.1f ± 0.0060.0051f ± 0.0003
T75.20a ± 0.022.38ab ± 0.21.14abc ± 0.060.32bcd ± 0.0070.002bc ± 0.0001
T85.17a ± 0.022.24ab ± 0.121.04bc ± 0.050.25de ± 0.0130.0055de ± 0.0003
T94.99a ± 0.081.65bc ± 0.160.74de ± 0.040.2f ± 0.0080.003ef ± 0.0003
T105.22a ± 0.022.51a ± 0.061.28ab ± 0.030.37b ± 0.0140.0026ab ± 0.0002
T115.06a ± 0.022.36abc ± 0.11.06bc ± 0.020.32cde ± 0.0090.0028bc ± 0.0004
T124.95a ± 0.061.69bc ± 0.090.77de ± 0.030.22f ± 0.0150.0015e ± 0.0001
Note: Different letters within a column indicate significant difference between means of three replicates ± standard error using Tukey’s test at p ≤ 0.

