Article

Fibrinogen and Fibrin Differentially Regulate the Local Hydrodynamic Environment in Neutrophil–Tumor Cell–Endothelial Cell Adhesion System

1
Shanghai Key Laboratory of Molecular Imaging, Collaborative Innovation Center for Biomedicines & School of Medical Instruments, Shanghai University of Medicine & Health Sciences, Shanghai 201318, China
2
MOE Key Laboratory of Hydrodynamics, School of Naval Architecture, Ocean and Civil Engineering, Shanghai Jiao Tong University, Shanghai 200240, China
3
Department of Biomedical Engineering, The Pennsylvania State University, University Park, PA 16802, USA
4
Institute of Biomechanics, School of Bioscience and Bioengineering, South China University of Technology, Guangzhou 510006, China
*
Authors to whom correspondence should be addressed.
Submission received: 18 November 2020 / Revised: 18 December 2020 / Accepted: 22 December 2020 / Published: 24 December 2020
(This article belongs to the Special Issue Microfluidics in Biomedical Engineering)

Abstract

:
As cancer is one of the major fatal diseases for human beings worldwide, the metastasis of tumor cells (TCs) from a blood vessel to an adjacent organ has become a focus of research. A tumor metastasis theory named the “two-step theory” pointed out that polymorphnuclear neutrophils (PMNs) could facilitate TC adhesion on an endothelial monolayer under flow, which was regulated by shear flow and promoted by fibrinogen and fibrin. In order to further understand the role of hydrodynamics played in the “two-step theory”, we improved our side-view micro-particle imaging velocimetry (PIV) system and successfully measured the flow velocity profiles around adherent PMNs and TCs on an endothelial monolayer in the presence of soluble fibrinogen or fibrin under shear flow. Combined with a computational fluid dynamics simulation, we found that: (1) soluble fibrinogen and fibrin influenced the variations of relative shear rates above an adhered PMN and an adherent TC at different PMN-to-TC position states; (2) compared with soluble fibrinogen, soluble fibrin made the curves of relative shear rates above an adherent cell flatter. Soluble fibrin might increase the collision frequency and affect the contact time and contact area between PMNs, TCs, and endothelium cells, resulting in the enhancement of TC adhesion and retention on an endothelial monolayer.

1. Introduction

As cancer remains one of the main risk factors to human health, researchers are continually seeking effective therapy methods to avoid death [1,2,3]. Tumor metastasis is a multi-step process involving not only the tumor cells themselves, but also other blood cells (e.g., white blood cells and platelets) and soluble proteins [4,5,6,7]. There are several theories to explain tumor metastasis, one of which was developed by Dong et al. and named the “two-step theory”. It proposed that polymorphonuclear neutrophils (PMNs) acted as bridges between tumor cells (TCs) and endothelial cells (ECs), which facilitated TC adhesion on the blood vessel wall [8]. A series of studies showed that the involvement of PMNs significantly increased tumor cell adhesion and extravasation under flow, which was regulated by shear force and shear rate, as well as tumor microenvironment [8,9,10,11,12]. These studies revealed the importance of targeting the adhesion of circulating tumor cells in tumor metastasis [6,13].
Studies showed that soluble fibrinogen (Fg) and fibrin (Fn) affected the initial adhesion of circulating melanoma cells. The potential procoagulant effect of melanoma cells is closely connected with a transmembrane protein tissue factor (TF) they secrete. It is reported that TF expression level on the surface of high metastatic tumor cells was 1000 times higher than that on the surface of nonmetastatic tumor cells [14], and TF could trigger coagulation by promoting thrombin formation [15,16]. Thrombin is one kind of serine protease with multiple functions, which could transfer Fg to Fn and activate several intracellular signal pathways [17,18]. It could also cause a cellular immune response, such as a change of intercellular adhesion molecule-1 (ICAM-1) expression level on an endothelial monolayer and the activation of white blood cells [19,20,21].
Parallel plate flow chamber experiments by Ozdemir et al. elucidated that the adhesion between melanoma cells and an endothelial monolayer was mediated by soluble Fn (sFn) via ICAM-1 (on TC)-Fn-ICAM-1 (on EC) and αvβ3 (on TC)-Fn-ICAM-1 (on EC). Thus, sFn acted as a bridge not only to promote the adhesion between melanoma cells and PMNs, but also to help melanoma cells directly adhere to the endothelial monolayer [22]. Soluble Fg (sFg) exists in the blood of healthy human beings, while the change of sFn expression is usually related to diseases [23,24,25]. Studies showed that sFg and sFn, especially sFn, could highly enhance the number of adhered melanoma cells, particularly the firmly adhered ones, on an endothelial monolayer. Moreover, sFg promoted a short adhesion time (1 s < t < 3 s) between melanoma cells and endothelial cells mediated by PMNs, while sFn promoted both short adhesion and long firm adhesion (t > 5 s) between melanoma cells and endothelial cells mediated by PMNs under high shear conditions [22,26].
Although the adhesion efficiency, adhesion time period, and adhesion kinetics were well studied, the change of local hydrodynamic environment during the process of PMNs facilitating TC adhesion on ECs in the presence of sFg and sFg was rarely understood. A better understanding of local hydrodynamic environment changes in a neutrophil–tumor cell–endothelial cell adhesion system with the presence of sFg or sFn would enrich the “two-step theory”. Our previous studies indicated that both cell deformation and cell relative positions would affect the local hydrodynamic environment to promote the firm adhesion of TCs on the substrate [27]. Therefore, in the current study, we proceed to improve the side-view micro-particle imaging velocimetry (micro-PIV) technique to investigate the local hydrodynamic environment of adhesion between TCs and ECs mediated by PMNs with sFg and sFn in blood flow. The purpose is to explore the hydrodynamic mechanism and to reveal the effect of sFg and sFn by combining the adhesion efficiency, adhesion time, and adhesion kinetics.

2. Methods

2.1. Preparation of Cells and Molecules

Transfected fibroblast L-cell (EI cells) with a stable human E-selectin and ICAM-1 expression (kindly provided by Dr. Scott Simon, University of California Davis, Davis, CA, USA) was chosen as an alternative model for the endothelial monolayer substrate. In previous studies, flow cytometry was used to periodically check the E-selectin and ICAM-1 levels on EI cells to verify the expression levels were comparable with IL-1β stimulated human umbilical vein endothelial cells (HUVECs) [28]. The EI culture medium was prepared by mixing 500 mL RPMI 1640 (GIBCO; Carlsbad, CA, USA) with 5 mg HT (Sigma; St Louis, MO, USA), 5 mL xanthine (Sigma; St Louis, MO, USA), 5 mL mycophenolic acid (Sigma; St Louis, MO, USA), and 5 mL glutamine (Invitrogen; Carlsbad, CA, USA), which was then filtered and stored at 4 °C. EI cells were put in EI medium with 10% FBS (BioSource; Carlsbad, CA, USA) supplement in a 37 °C tissue culture incubator with 5% CO2 until confluent.
Metastatic Lu1205 melanoma cells (generously provided by Dr. Gavin Robertson, Penn State Hershey Medical Center, Hershey, PA, USA) were cultured in DMEM/F12 medium (Dulbecco’s Modified Eagle Medium Nutrient Mixture F12, GIBCO; Carlsbad, CA, USA) with 10% FBS supplement. Prior to flow experiment, Lu1205 cells were cultured in a 37 °C tissue culture incubator with 5% CO2 until confluent. Next, 0.05% trypsin/EDTA (Invitrogen; Carlsbad, CA, USA) was applied to the confluent monolayer for detaching the cells, which were then washed twice with fresh culture medium. The cells were suspended in fresh medium at 37 °C for 1 h and then remixed with DMEM/F12 containing 1% BSA (Sigma; St. Louis, MO, USA). The concentration was adjusted to 1 × 10⁶ cells ml−1 for the experiment.
The separation and the preparation of PMNs from fresh human blood by Ficoll-Hypaque density gradient Histopaque-1077 and Histopaque-1119 (Sigma; St. Louis, MO, USA) followed the protocols described in previous studies [22]. After separation, the PMNs were remixed in Dulbecco’s phosphate-buffered saline (DPBS) containing 0.1% HSA (Calbiochem; La Jolla, CA, USA) at a concentration of 1 × 10⁶ cells ml−1, which was put in a 4 °C freezer for up to 4 h to conduct the experiment. The study was specifically approved by The Pennsylvania State University Institutional Review Board (IRB, NO. 19311), and written informed consent was obtained from all subjects. The methods were carried out in accordance with the approved guidelines.
Prior to the flow experiment, 1 mL soluble Fn was generated by mixing 120 μL 25 mg/mL soluble Fg (Sigma; St Louis, MO, USA) with 84 μL 24 mM Gly-Pro-Arg-Pro amide (GPRP, Sigma; St Louis, MO, USA) and 200 μL 10 U/mL thrombin (Sigma; St Louis, MO, USA) at 37 °C for 5 min. The role of GPRP was to prevent soluble Fn molecules from becoming polymerized after thrombin cleavage [23].

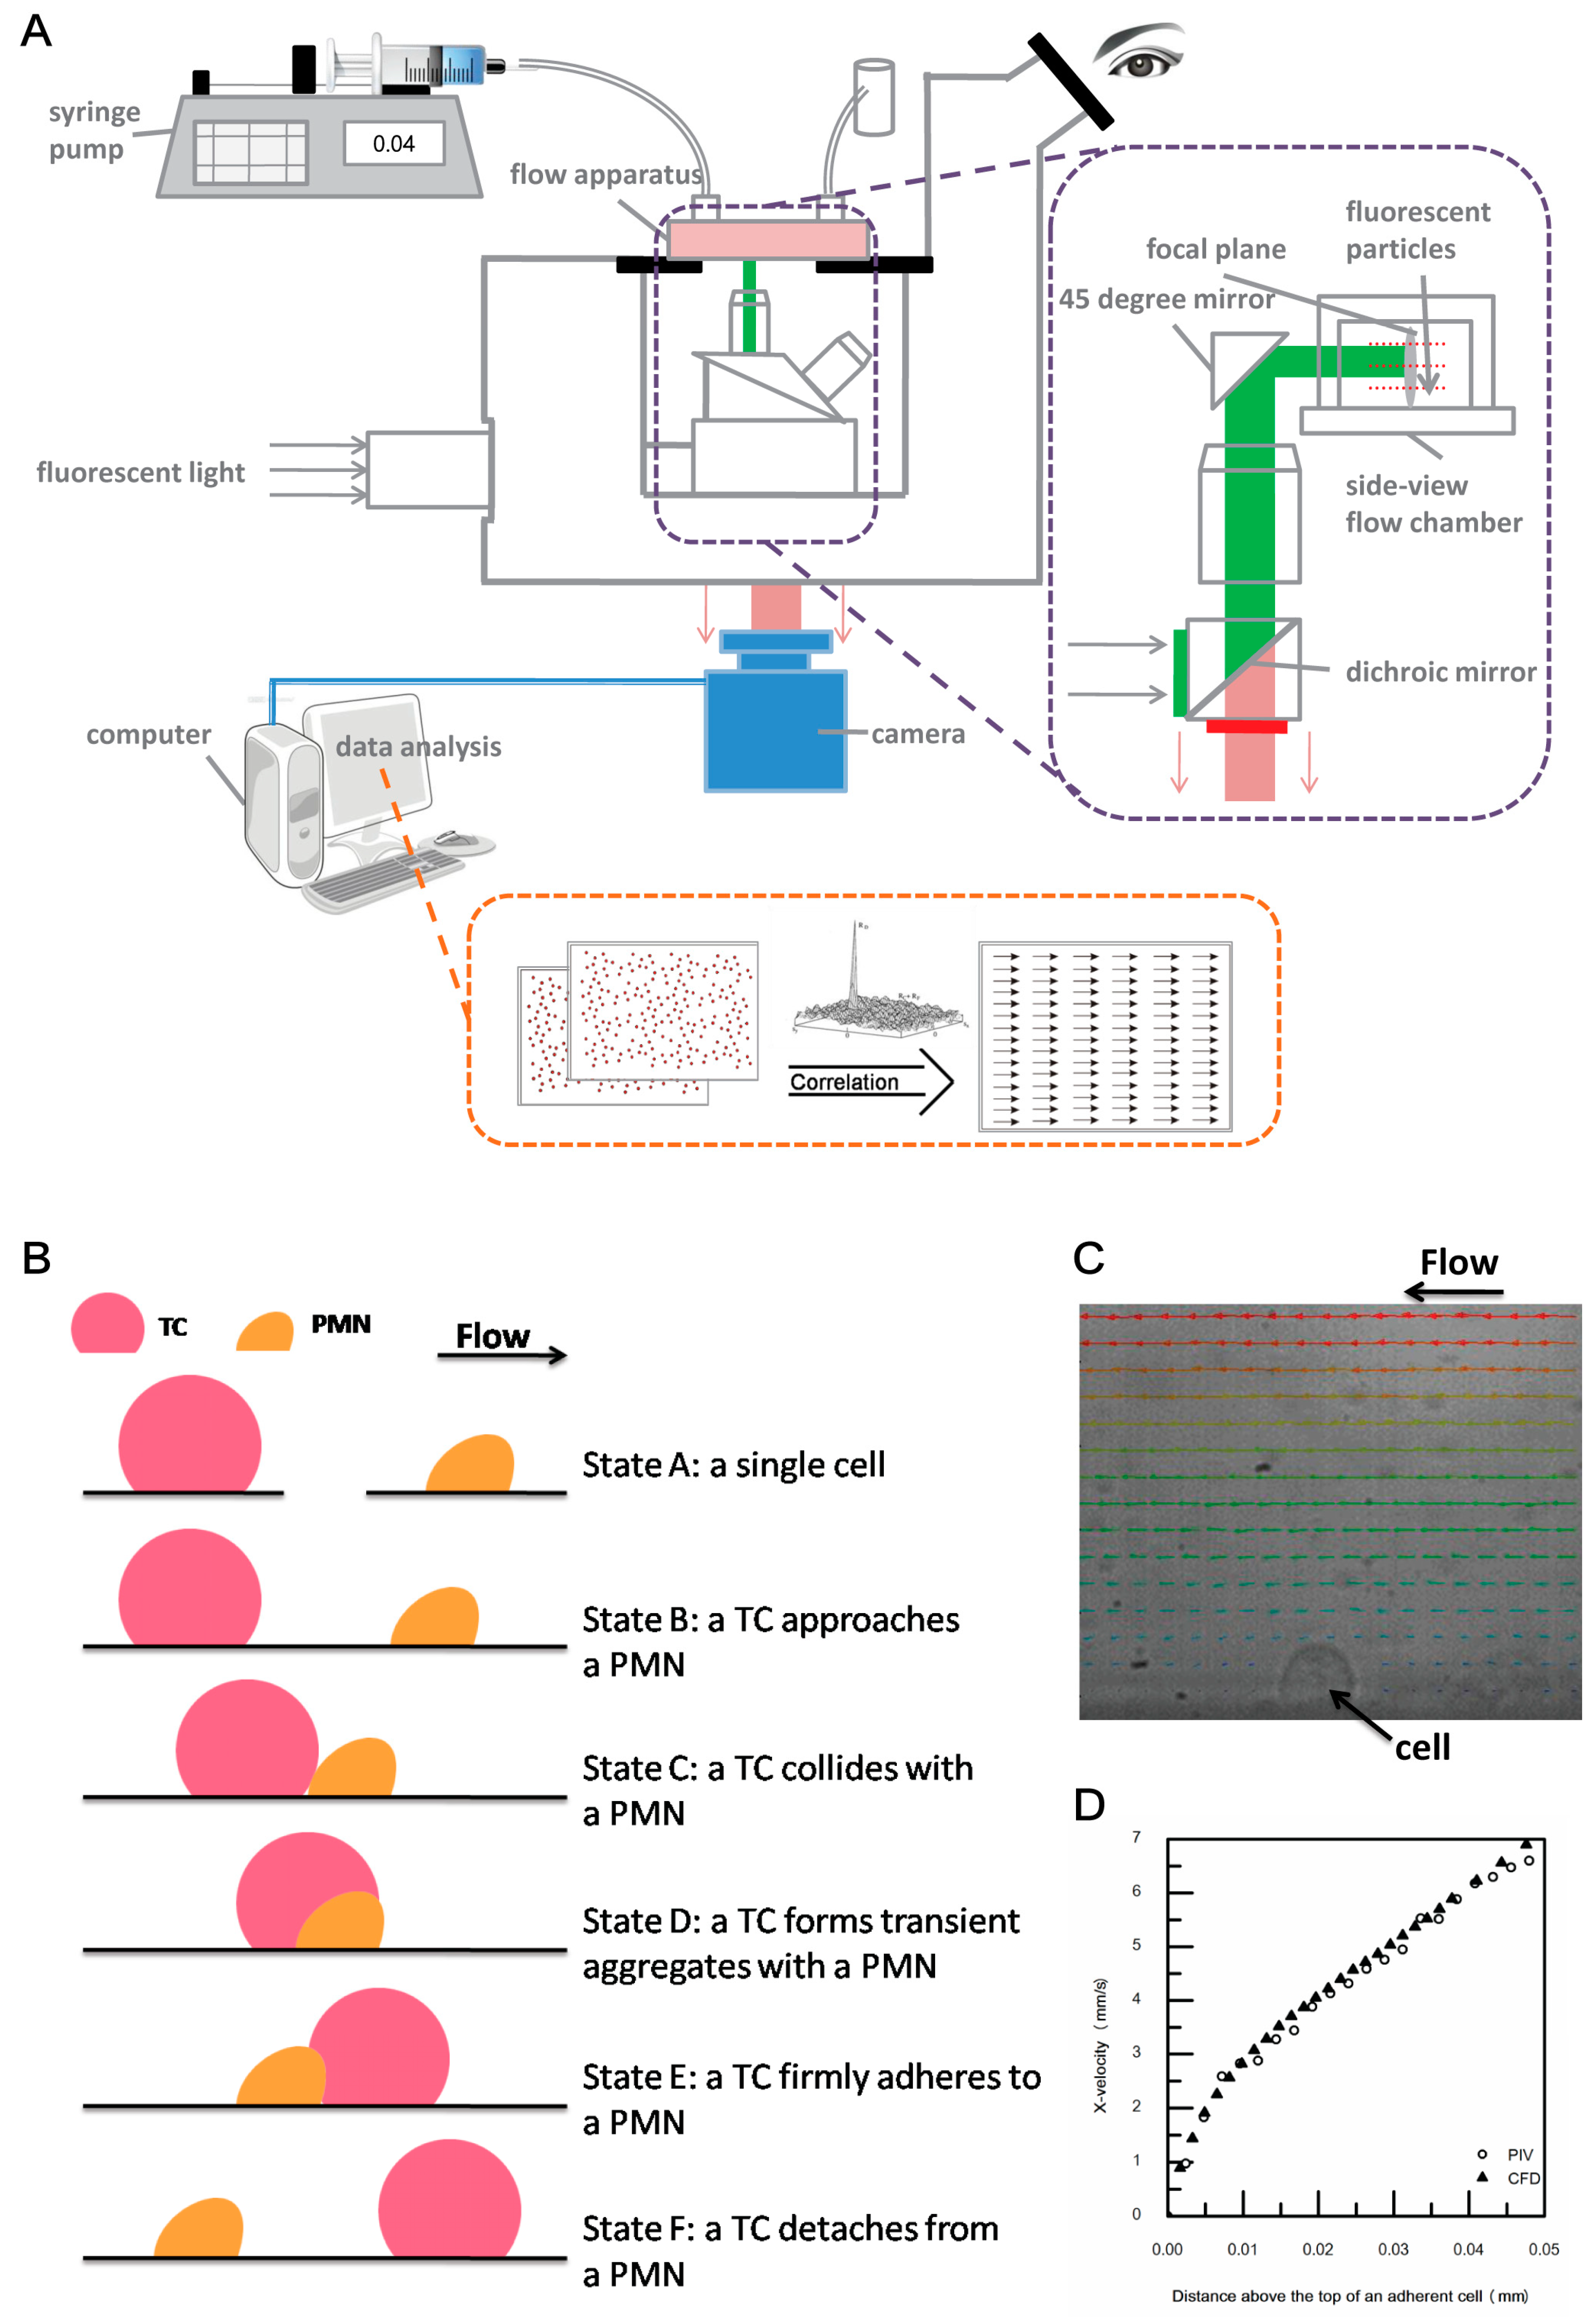
2.2. Coupled Side-View µPIV System Modification and Experimental Procedure

We have a methodology for studying the local fluid dynamics around a PMN and a melanoma cell with five PMN-to-TC position states under different flow conditions [22]. A side-view flow chamber with an inner dimension of 700 µm (width) × 550 µm (height) was assembled by inserting a Vitrotubes #5005 microslide into a Vitrocells #8270 microslide (Vitrocom; Mountain Lakes, NJ, USA), which were sterilized. Two needles were then used to connect the tubing and the chamber. Finally, superglue was used to seal the chamber. As the aspect ratio was 1.27, we followed the method described by Cao et al. to estimate wall shear stress distributions by applying a correction factor to analytical 2D channel velocity profiles [29]. The side-view µPIV system set-up was mainly as previously described [22], and consisted of a fluorescent microscope, a stage with a side-view flow chamber, two 45° mirrors with highly reflective surface coatings (Red Optronics; Mountain View, CA, USA), a high-speed camera, and a computer (Figure 1A). There were two important modifications: (1) continuous high-intensity fluorescent light was used as the illumination source; (2) a Basler A504kc high-speed camera was used to record the images.
Orange tracer particles (1 × 10¹⁰ particles mL−1) with a diameter of 1 µm (Invitrogen; Carlsbad, CA, USA) were diluted to 0.02% by volume with DMEM/F12 containing 1% BSA. The particle solution was then put in a 37 °C incubator for at least 24 h to prevent potential nonspecific aggregations. A syringe pump (Harvard Apparatus; Holliston, MA, USA) was used to drive the flow. We set two volumetric flow rates, 91.25 µL min−1 and 292 µL min−1, which equals wall shear rates of 62.5 s−1 and 200 s−1 respectively. The calculation followed Equation (1),
τ w = 6 μ Q W H 2 F
where µ is fluid molecular viscosity; Q is volume flow rate; W is the width of the chamber; H is the height of the chamber; and F is the correction factor for a rectangular channel with a finite aspect ratio. F is equal to 1.45 when an aspect ratio is 1.27 here [29], and the viscosity was measured to be approximately 1.5 cP at room temperature, by a RotoVisco 1 cone-plate viscometer (ThermoMC; Madison, WI, USA).
The inner microslide was coated with EI cells before being inserted into a bigger one. Cell suspension was mixed with fMLP-stimulated PMNs and Lu1205 melanoma cells at a 1:1 ratio, and soluble Fg or soluble Fn was added at the desired concentration. The mixed solution was then perfused into the side-view chamber at given experimental shear rates of 62.5 s−1 and 200 s−1. As described previously, six PMN-to-TC position states—(A) a single cell; (B) a TC approaches a PMN; (C) a TC collides with a PMN; (D) a TC forms a transient aggregate with a PMN; (E) a TC firmly adheres to a PMN; and (F) a TC detaches from a PMN—were chosen to be analyzed in a very low Reynolds number Stokes flow (Figure 1B). Besides bright images of adherent cells under both top view and side view, 2000 side-view PIV images were taken by a Basler A504kc camera at a speed of 1000 fps (Δt is 1 ms, digital gain is 2, offset is ~50–90, and ROI is 1280 × 512). Images were then analyzed offline.

2.3. Data Analysis

Image processing was conducted by ImageJ (NIH), NI-IMAQ (National Instruments; Austin, TX, USA), and JPIV (http://www.jpiv.vennemann-online.de). The 2000 raw images were divided into two groups (group A and group B) with a time interval of 1 ms. Average background images were generated by the ImageJ plug-in “average image filter” for group A and group B respectively, and then subtracted from raw images accordingly. In order to increase the particle density in one single image, each group was further divided into 20 smaller groups with 50 images. After applying the median filter and the math min filter, the overlap function of ImageJ was introduced to generate one single image from 50 images, and 20 images were output in both group A and group B separately. While signal-to-noise ratios were significantly increased by these operations, the dynamic boundary was missing, which could be compensated for by NI-IMAQ. After setting up the parameters in JPIV (multi pass, interrogation window size, region of interest, between passes), average ensemble correlation was selected to calculate the velocity profile. A typical image of velocity profile around an adherent cell calculated from micro-PIV images is shown in Figure 1C.
Local shear rates and upstream shear rates defined previously were calculated at each PMN-to-TC position state separately. Equations (2) and (3) were used to calculate bulk-flow Reynolds numbers and cell Reynolds numbers,
Re c h a m b e r = 2 ρ υ W H μ ( W + H )
Re c e l l = ρ γ ˙ R 2 μ
where ρ is the density of flow; µ is the viscosity of flow; υ is the average velocity in the chamber; W is the width of the chamber; H is the height of the chamber; γ ˙ is the local shear rate of the cell; and R is the cell radius.

2.4. CFD Simulations

For a homogeneous incompressible Newtonian fluid with a low Reynolds number, viscosity is considered unchanged at a stable temperature, and continuum flow is governed by the Navier–Stokes equation,
ν = 0
v t + ( ν ) v = f 1 ρ p + υ 2 ν
where ν t is unsteady acceleration, ( ν ) v is convective acceleration, and f, 1 ρ p , and υ 2 ν represent the effect of body force, pressure gradient, and viscosity. When the Reynolds number is very small, inertial effects are negligible compared to viscous effects, so Equation (5) could be rewritten as the following,
p = f + μ 2 ν
which is called the Stokes equation. Cell movement studies in biomechanics could be considered as Stokes flow because of their small dimension and slow velocity.
Corresponding to the experimental observations, a blood vessel was simplified as a 3D channel with a dimension of 1000 μm (length) × 700 μm (width) × 550 μm (height). Flow was fully developed to Poiseuille flow under a low Reynolds number condition. The melanoma cell was modeled as an ellipsoid, while the PMN was modeled as a teardrop by the following equation,
y 2 b 2 + z 2 a 2 = ( 1 x 2 a 2 ) ( 1 + β x a ) 2
where constant a is one half of cell length, and unknown constants (b, c, β) are determined as Cao et al. previously described [30]. The pre-deformed shape of the cells is determined by the measurements in Table 1 and Table 2. In order to save time, a region of 300 μm (length) × 150 μm (width) × 150 μm (height) in the central bottom flow was actually calculated. A PMN was fixed in the center of the bottom wall, and the upper stream profile was simplified to linear distribution. The boundary conditions were set to be velocity inlet and pressure outlet. The side walls and the top wall were treated as velocity boundaries, while the bottom wall was considered a fixed wall. Commercial software ANSYS-FLUENT was used to solve the problem with the single-precision solver and SIMPLE algorithm.
Since quasi-steady state is an important characteristic of Stokes flow, the instant flow field is determined only by the boundary conditions at these time periods and is not affected by the movement history of particles and other boundaries. During the process of PMN-facilitated TC adhesion on ECs, the relative PMN-to-TC position states in this study could be treated as six quasi-steady states (shown in Figure 1B) in low Reynolds number Stokes flow. Thus, the velocity profiles were assumed not changed when images were taken at each state. The validation of the CFD model is displayed in Figure 1D.

3. Results

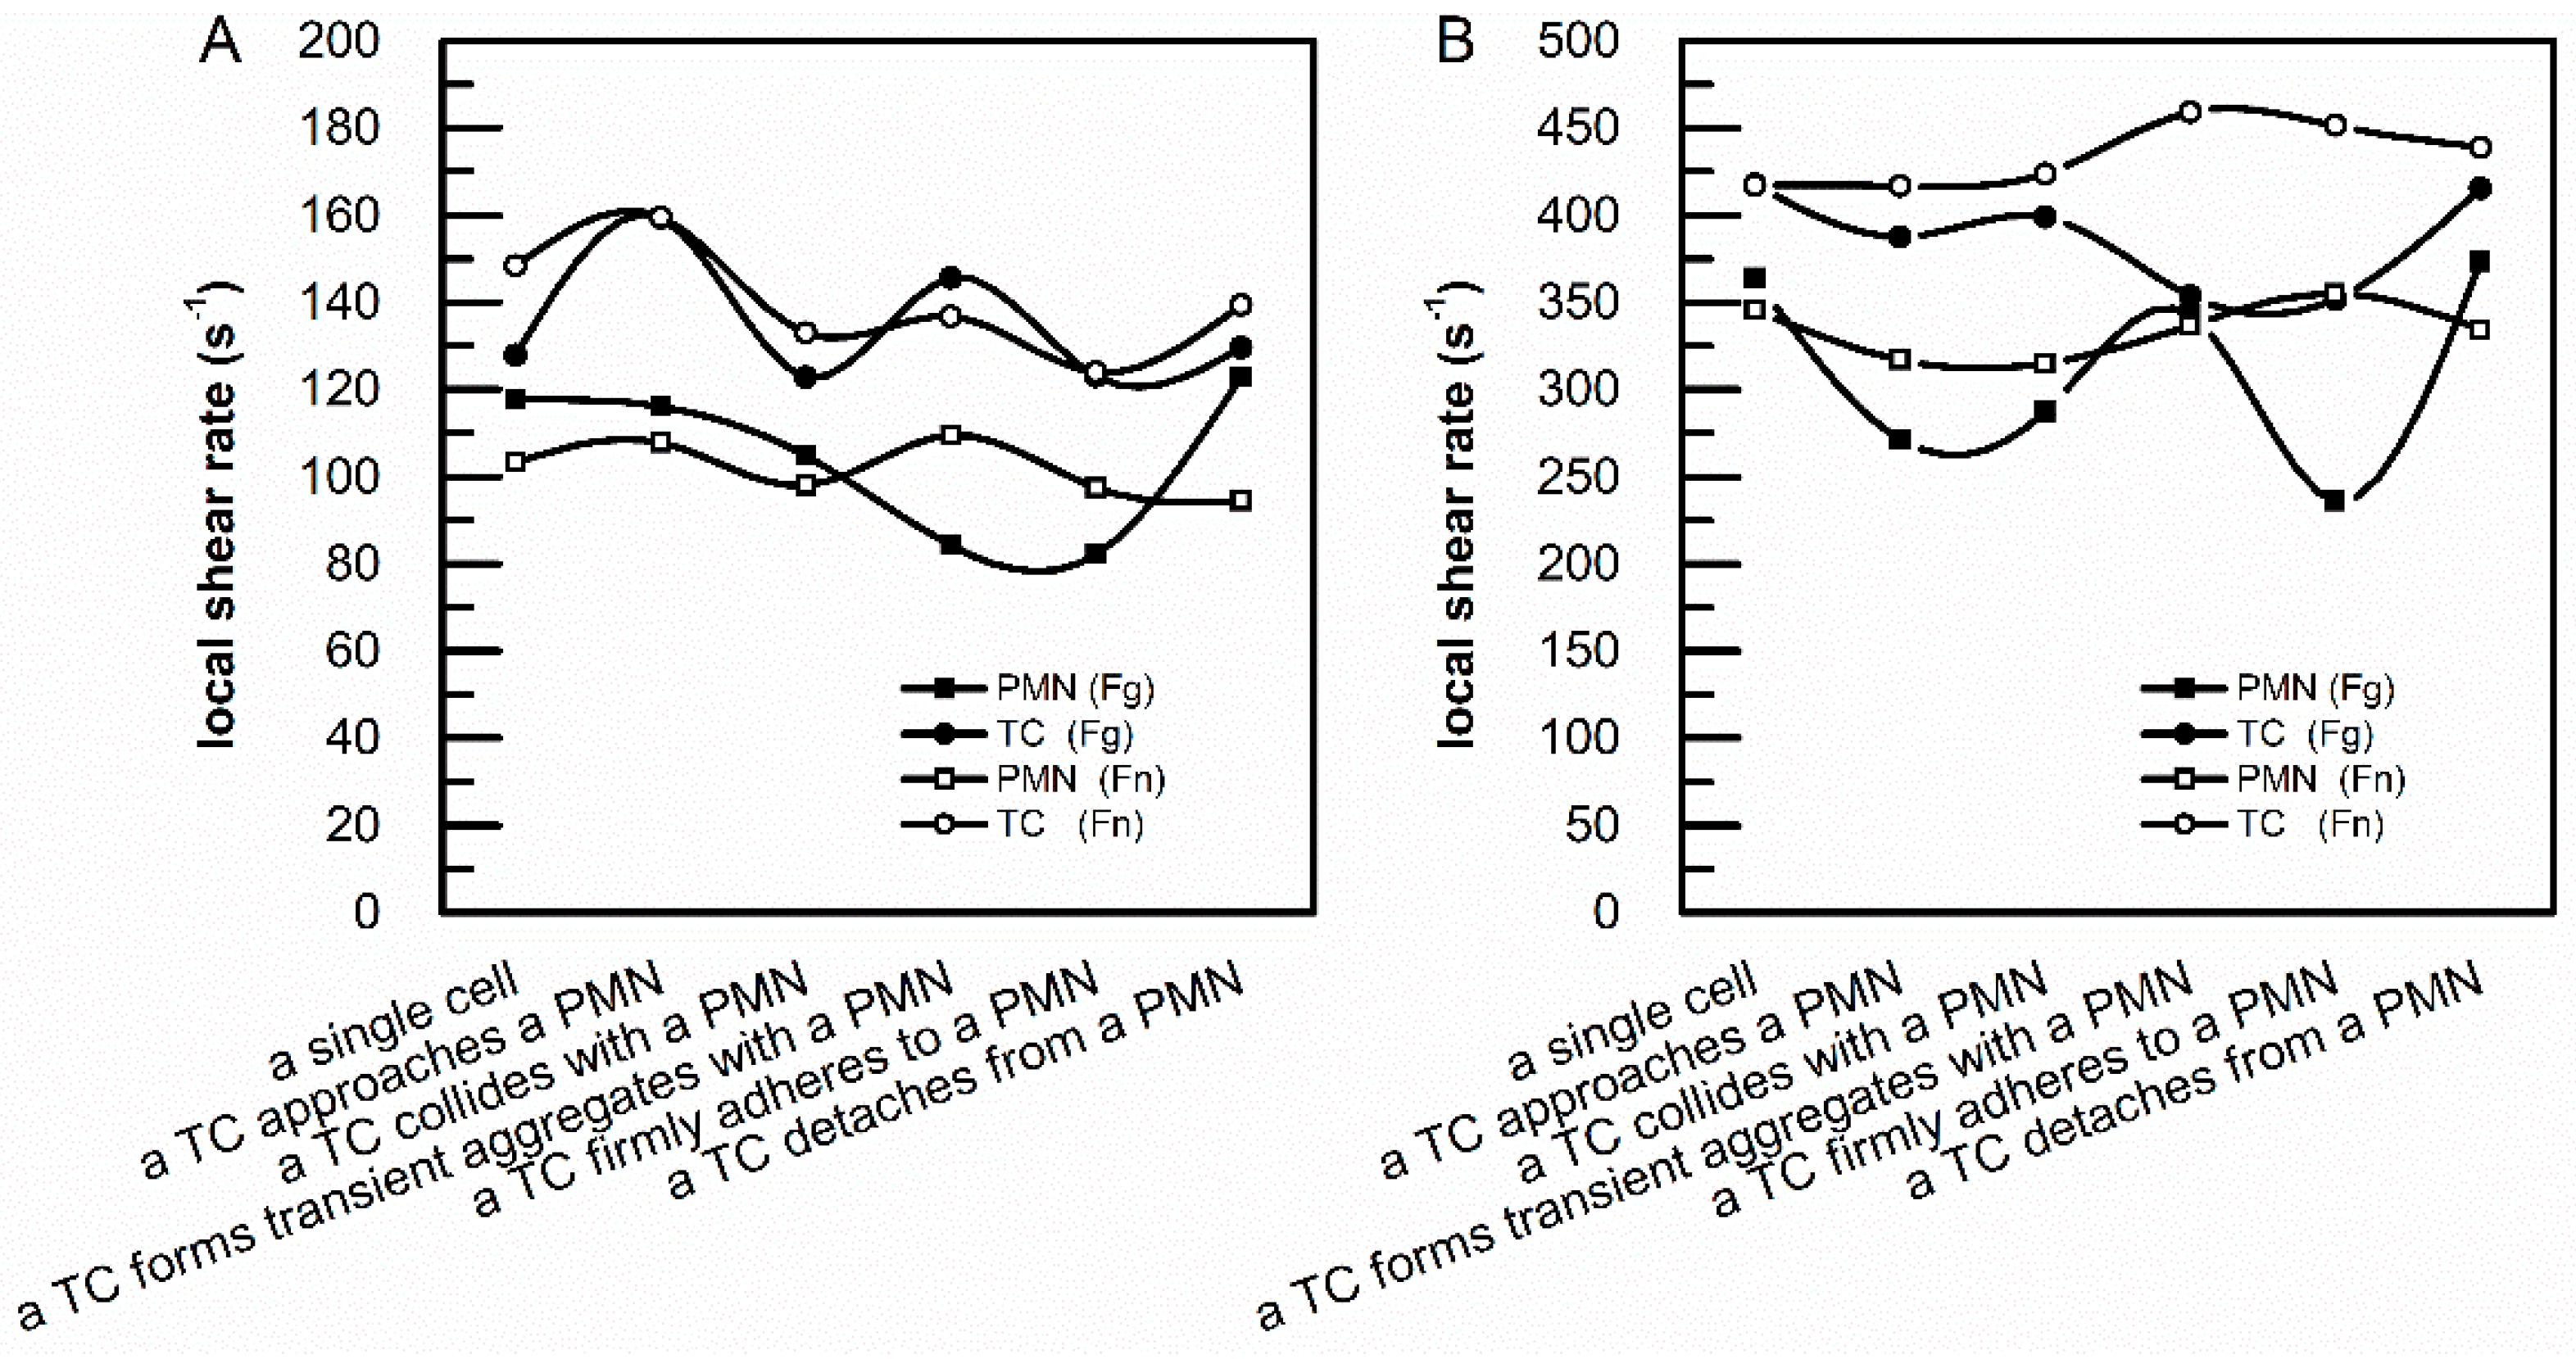
3.1. sFg and sFn Regulated the Local Shear Rates above an Adherent PMN and an Adherent TC on an Endothelial Monolayer

In order to simulate the process of PMN-mediated TC adhesion on an endothelial monolayer under physiological conditions, 1.5 mg ml−1 sFg was added to the solution. Local shear rates above an adherent PMN and an adherent TC at six different PMN-to-TC position states were calculated. Comparing the local shear rates above an adherent PMN with those above an adherent TC at the same PMN-to-TC position state, the data show that the local shear rates above an adherent PMN are all lower than those above an adherent TC under both low (91.25 μL min−1) and high (292 μL min−1) shear conditions, respectively (Figure 2). The results were consistent with previous studies [22]. It was also found that the differences between the local shear rates above an adherent TC and those above an adherent PMN are very small at two PMN-to-TC position states in the presence of sFg: (1) a TC detaches from an adherent PMN under low shear flow condition; (2) a TC forms transient aggregates with an adherent PMN under high shear condition. The corresponding heights of a PMN are 4.65 μm and 6.7 μm, while those of a TC are 11.85 μm and 13.5 μm (as shown in Table 1). Although the height of a PMN is much smaller than that of a TC, the local shear rates above adherent cells are very close, which might due to the “peak” and “valley” of endothelial monolayer. If a PMN adheres to the “peak” and a TC adheres to the “valley”, the effect of endothelial monolayer morphology on flow field might compensate for the effect of cell height on flow field. Therefore, besides the height of an adherent cell, the position on the endothelial monolayer where it stays also becomes an import factor that can affect the local hydrodynamic environment.
Since the increase of sFn in blood flow may reflect the occurrence of disease, we intended to investigate the local hydrodynamic environment around adherent PMNs and TCs on an endothelial monolayer with sFn in the solution. Thrombin (2 U mL−1) was mixed with sFg (1.5 mg mL−1) solution to convert sFg to sFn, while Gly-Pro-Arg-Pro amide (GPRP) was also added to prevent self-aggregation of sFn. As shown in Figure 2, local shear rates above an adherent TC are much higher than those above an adherent PMN under both low and high shear conditions, which also agreed with previous results [22]. Regarding the cell dimensions in Table 2, when a TC collides with an adherent PMN, the PMN shows the largest deformation (the heights decrease to 4.2 µm and 5.001 µm under low shear and high shear conditions, respectively). Besides the deformation of PMNs, the relative positions of TCs with respect to PMNs (TCs stand upstream of PMNs) contributed to the lowest local shear rates above an adherent PMN as well. However, the highest local shear rates above an adherent PMN and the extreme local shear rates (both the lowest and the highest) above an adherent TC appear at different PMN-to-TC position states, which might be explained by the effect of both an endothelial monolayer and sFn.

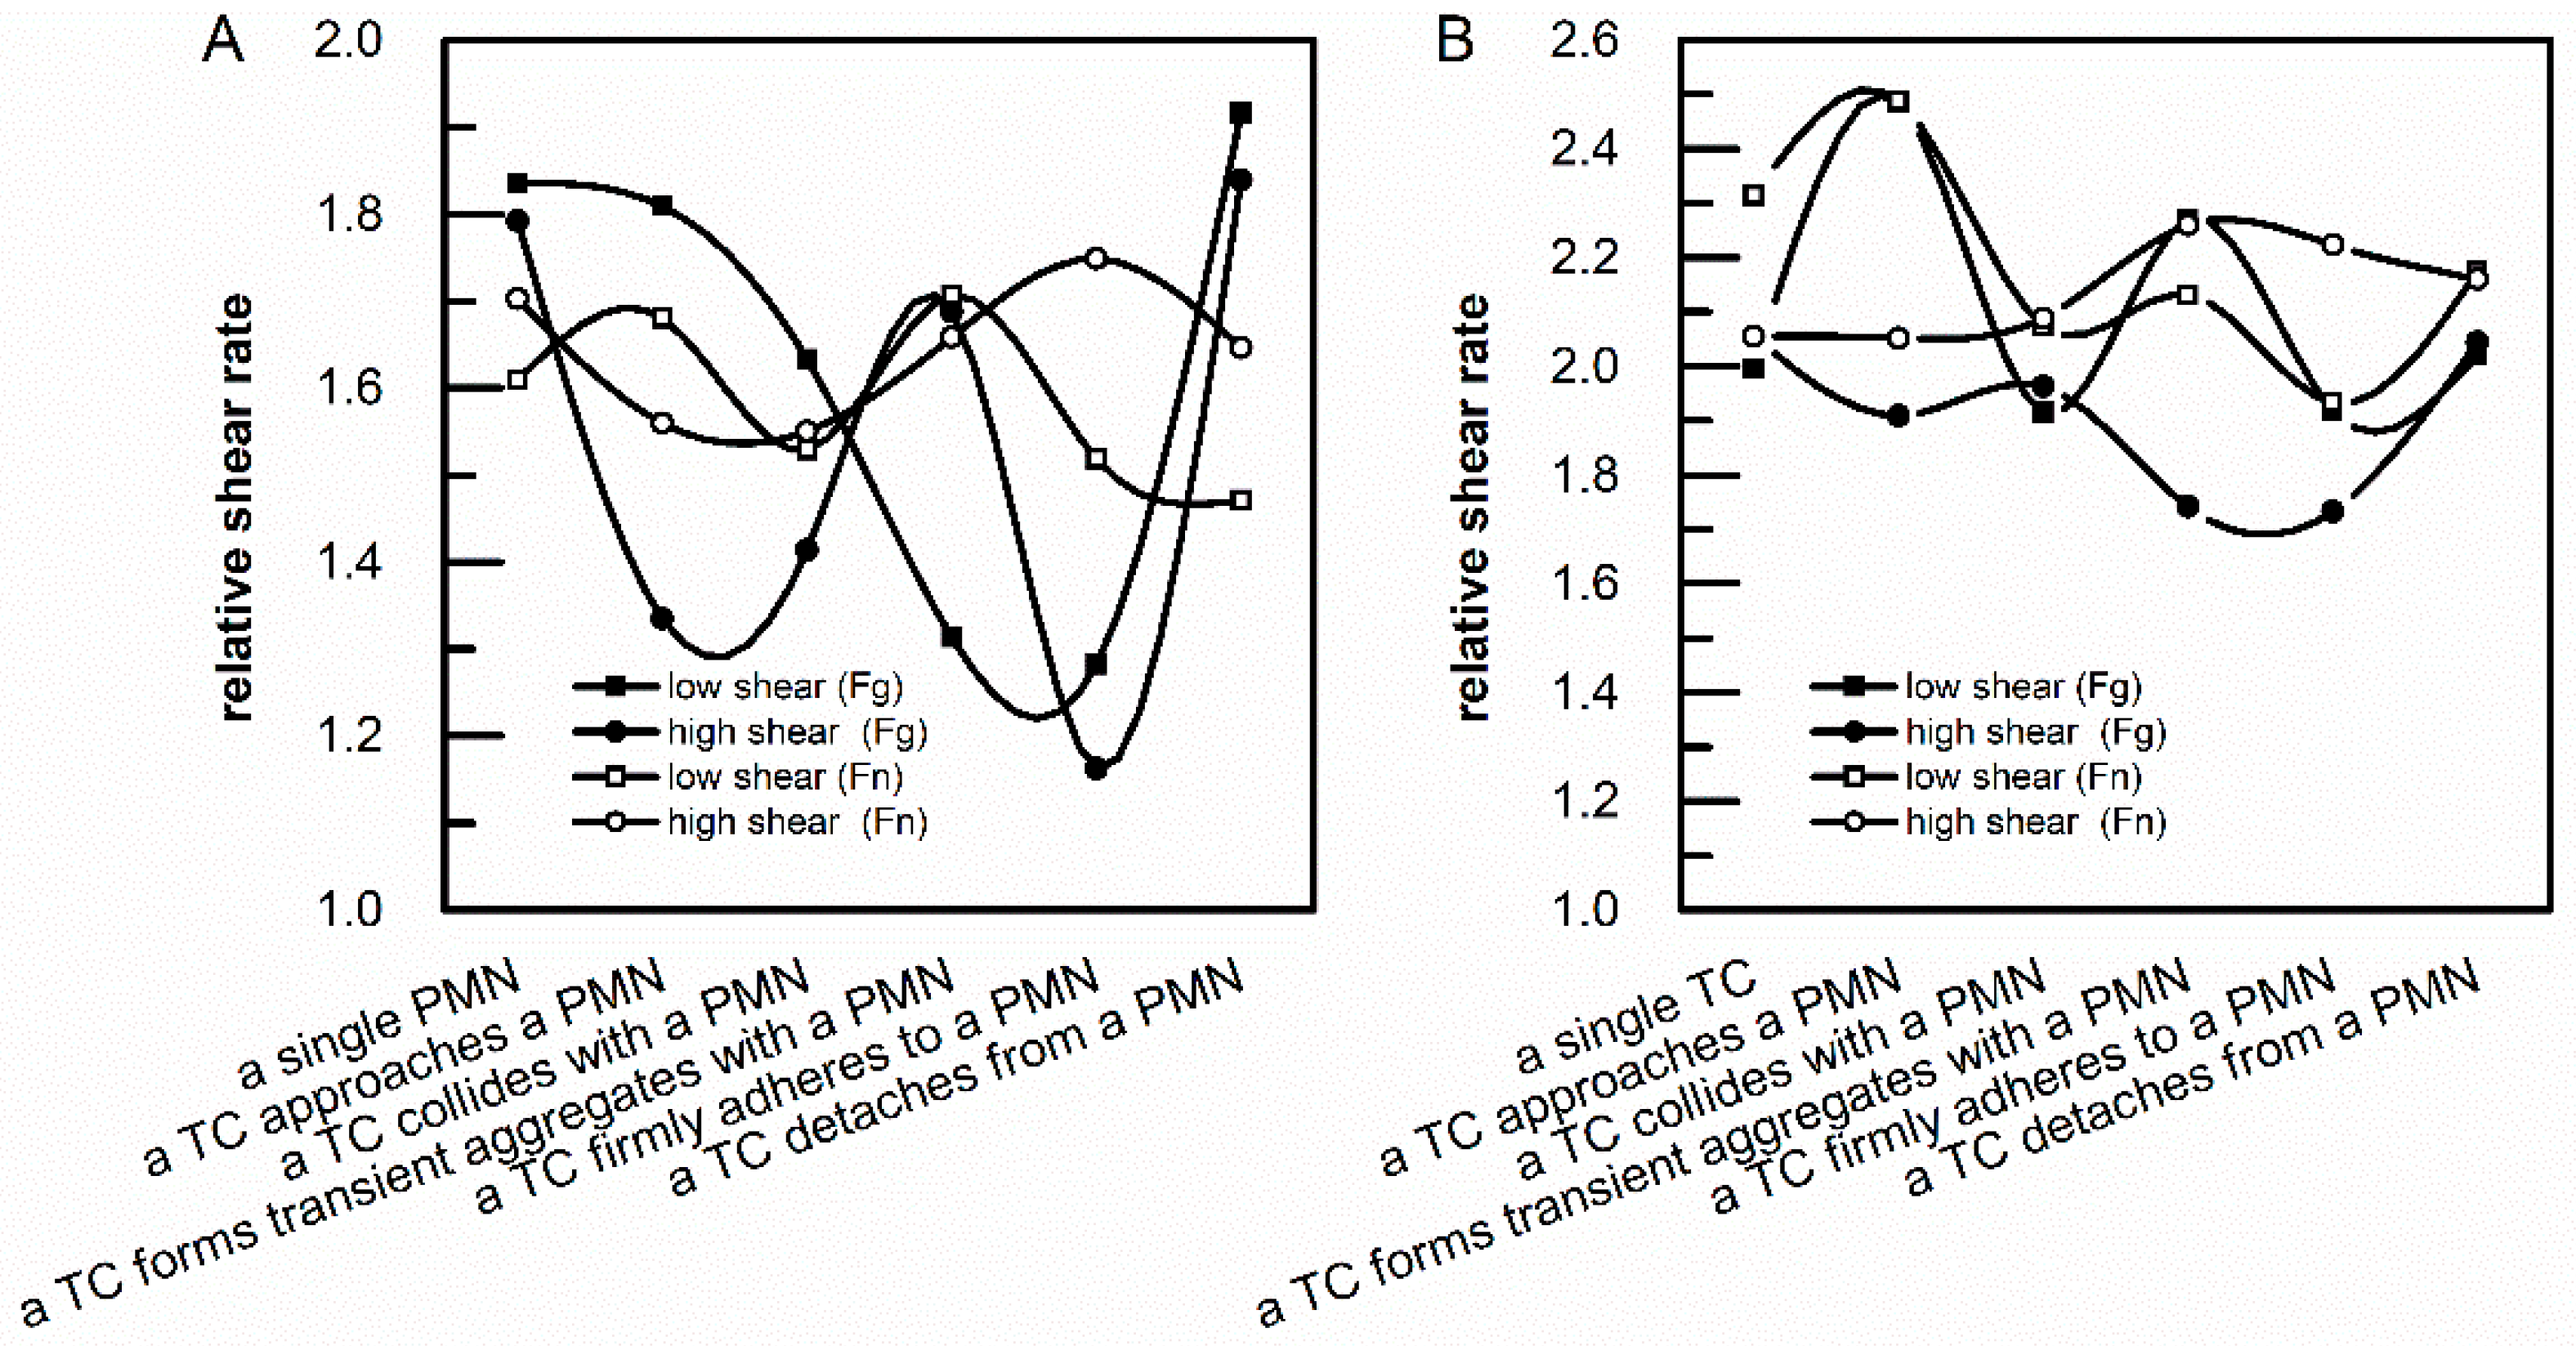
3.2. Analysis of Relative Shear Rates above an Adherent PMN and an Adherent TC

For the purpose of comparing the impact of adherent cells on the local hydrodynamic environment between low and high shear conditions in the presence of sFg and sFn, relative shear rates were calculated as described [22], which is defined as local shear rate above an adherent cell divided by upstream wall shear rate. It was indicated that in the presence of sFg, most of the relative shear rates (with the state of “transient aggregate” an exception) above an adherent PMN under high shear condition are lower than those under low shear condition (Figure 3A). Meanwhile, it was also found that the highest Relative Shear Rate above an adherent PMN appears when a TC detaches from an adherent PMN, while the lowest Relative Shear Rate above an adherent PMN appears when a TC forms firm adhesion with an adherent PMN under both low and high flow conditions. The curve of relative shear rates above an adherent TC under high shear condition overlaps with that under low shear flow condition, and the lowest Relative Shear Rate also appears at the state of “firm adhesion” (Figure 3B). An interesting phenomenon is that the Relative Shear Rate above an adherent TC unexpectedly increases when a TC approaches an adherent PMN and forms transient aggregates with it.
What would happen when sFg was converted to sFn in pathological blood flow? The curves of relative shear rates above an adherent PMN and an adherent TC do not show the same trend (the curves are overlapping) under both low and high shear conditions. As seen in Figure 3, the numeric range of relative shear rates above an adherent cell in the presence of sFn becomes smaller when compared with the numeric range that exists in the presence of sFg. The relative shear rates above an adherent PMN in the presence of sFn vary from 1.4 to 1.8 (from 1.2 to 2.0 compared with those in the presence of sFg) and the relative shear rates above an adherent TC vary from 1.9 to 2.5 (from 1.7 to 2.5 compared with those in the presence of sFg). More interestingly, the curves of relative shear rates above an adherent PMN and those above an adherent TC display similar trends when the shear condition is the same. Under a low shear flow condition, the Relative Shear Rate above an adherent cell reaches “peak value” at the states of “approach” and “transient aggregates”, and “valley value” at the states of “collision” and “firm adhesion”. Under high shear condition, the relative shear rates above an adherent cell at the latter three states are higher than those at the former three states.

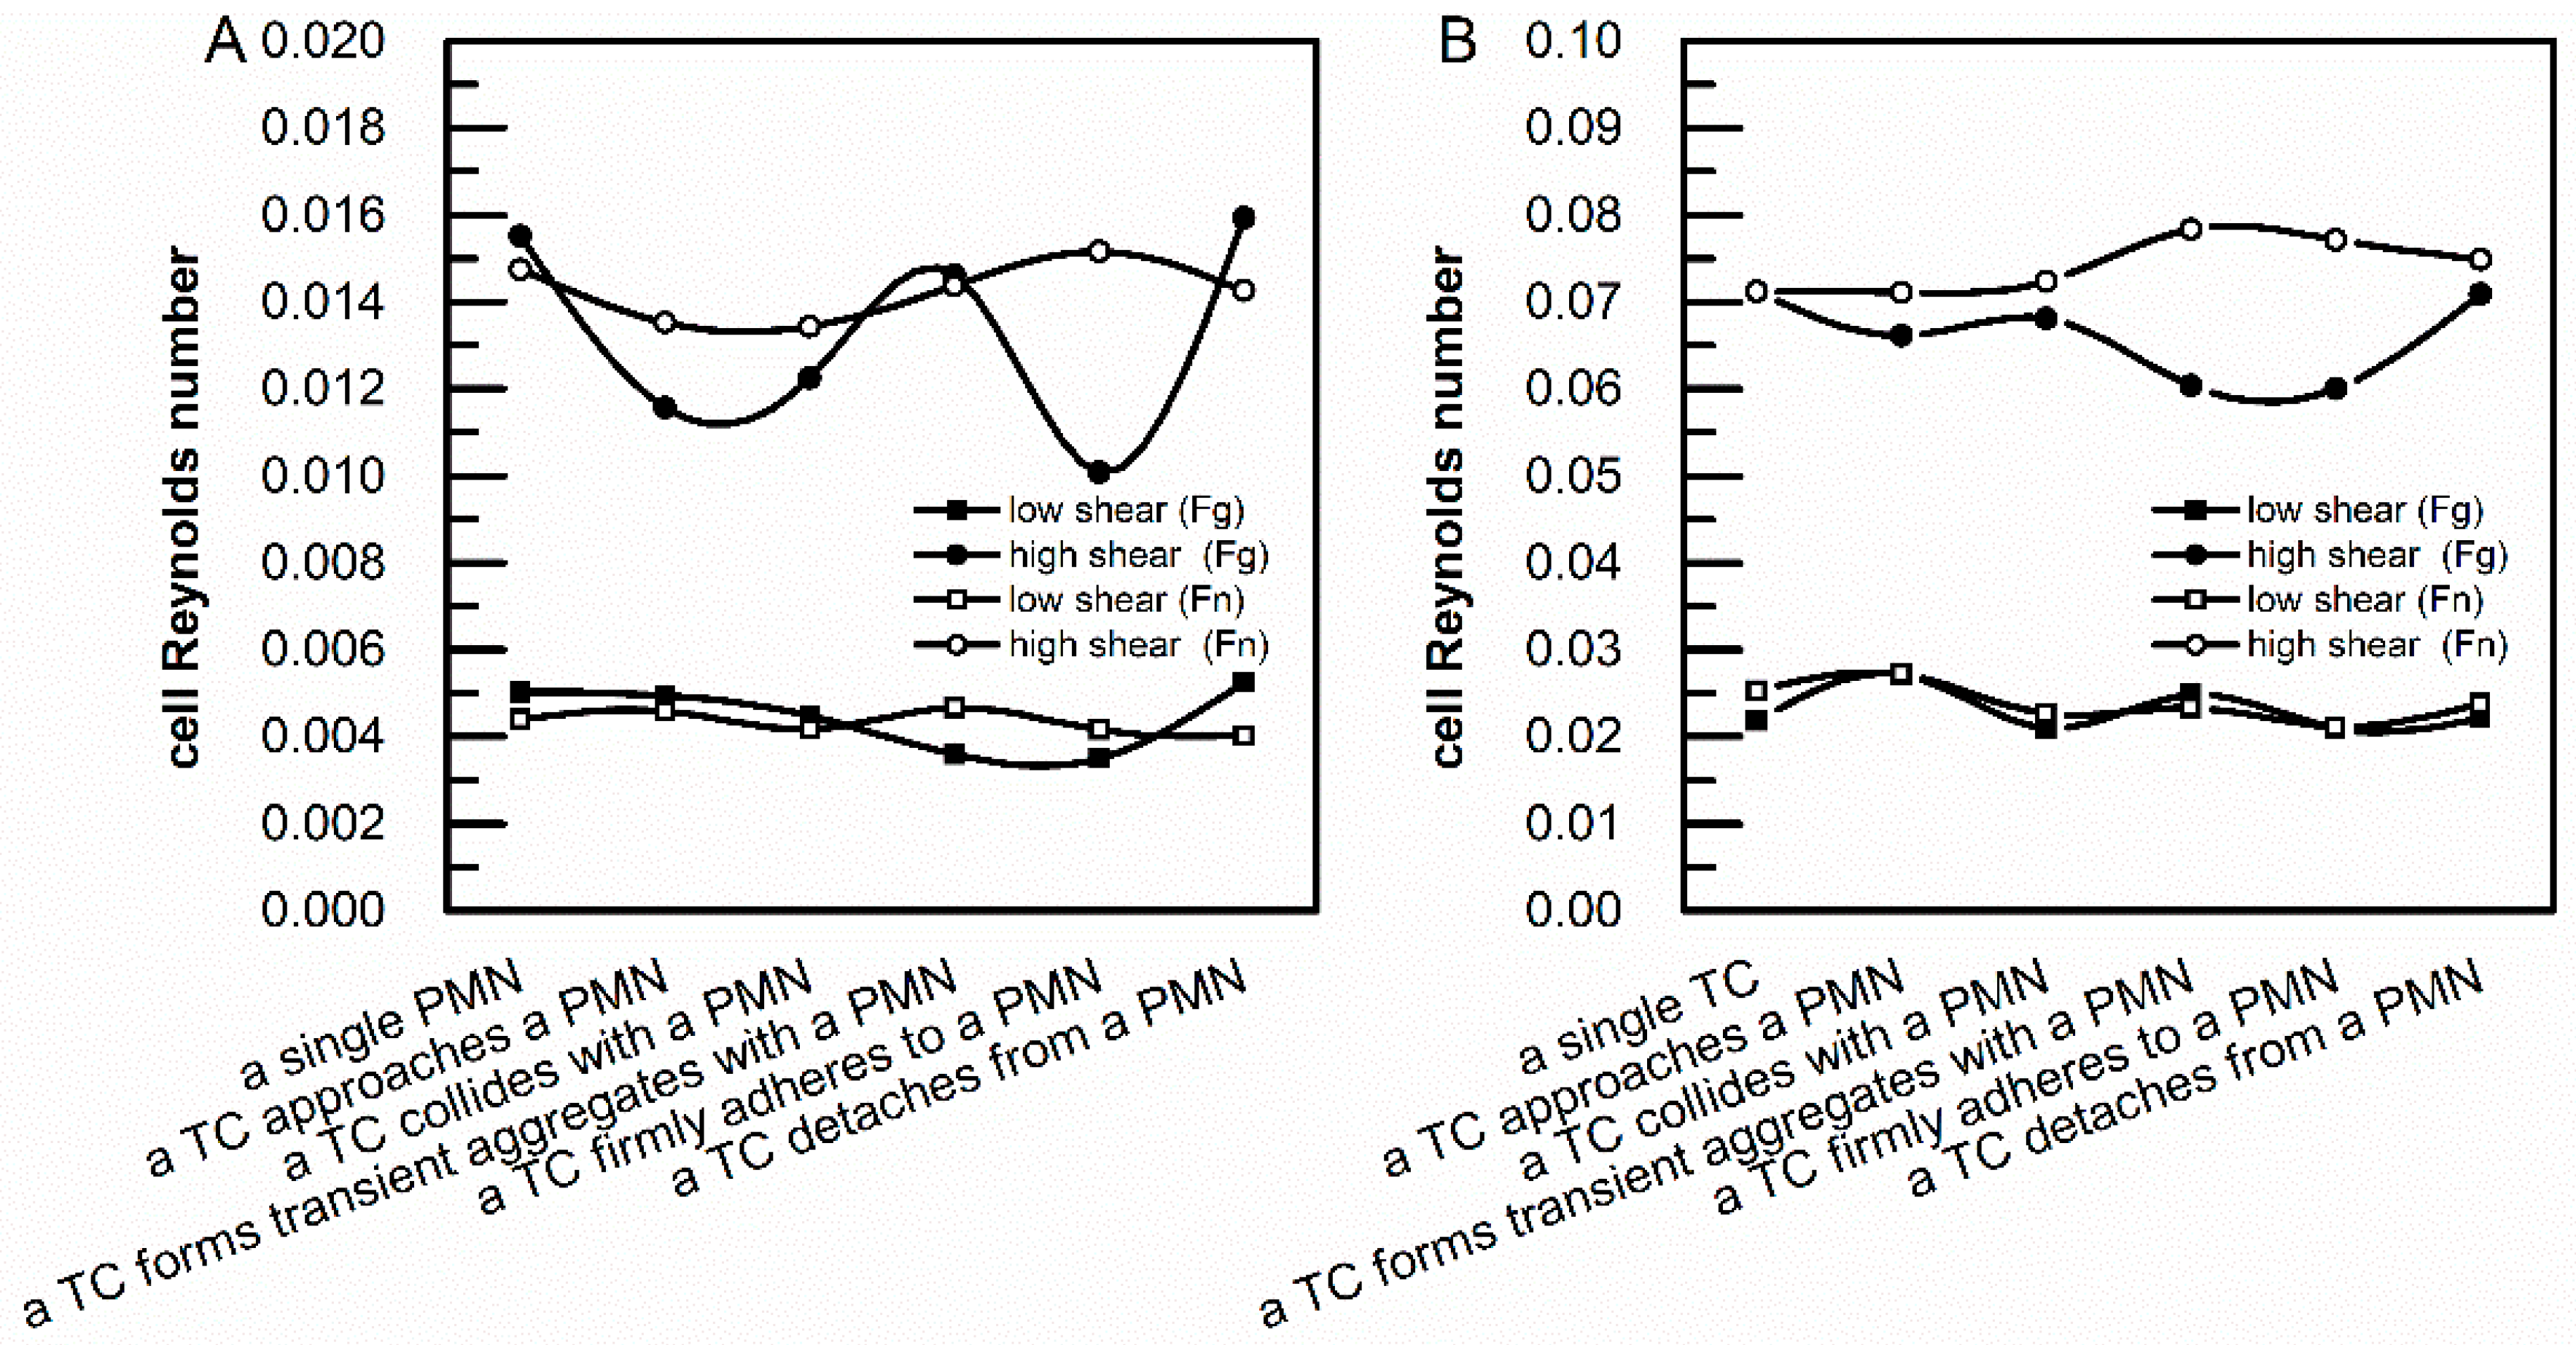
3.3. Calculation of Cell Reynolds Numbers

The bulk Reynolds number of the side-view flow chamber is 1.11 and 3.56 for low shear condition (91.25 μL min−1) and high shear condition (292 μL min−1), respectively. Cell Reynolds numbers were calculated by Equation (3) and cell Reynolds numbers of TCs were about 4–5 times those of PMNs.
Figure 4 shows the change of cell Reynolds numbers of adherent PMNs and TCs in the presence of sFg. Large variations appear for both cell Reynolds numbers of PMNs and those of TCs under high shear condition with a range of 0.01–0.017 and 0.06–0.075, respectively. The curves of cell Reynolds numbers of PMNs and those of TCs under low shear condition become much flatter, with a range of 0.003–0.006 and 0.02–0.03, respectively. The lowest cell Reynolds numbers of PMNs and TCs appear at the state of “firm adhesion” under both low and high shear conditions.
When sFg was converted to sFn, the curves of cell Reynolds numbers of PMNs and those of TCs show a flatter pattern under both low and high shear conditions. Cell Reynolds numbers of adherent PMNs vary from 0.004 to 0.005 and from 0.013 to 0.015 under low and high shear conditions, respectively. Cell Reynolds numbers of adherent TCs vary from 0.02 to 0.03 and from 0.07 to 0.08 under low and high shear conditions, respectively. The curves of cell Reynolds numbers of different cells under the same shear flow condition shear the similar pattern, with the lowest cell Reynolds numbers appearing when a TC collides with an adherent PMN.

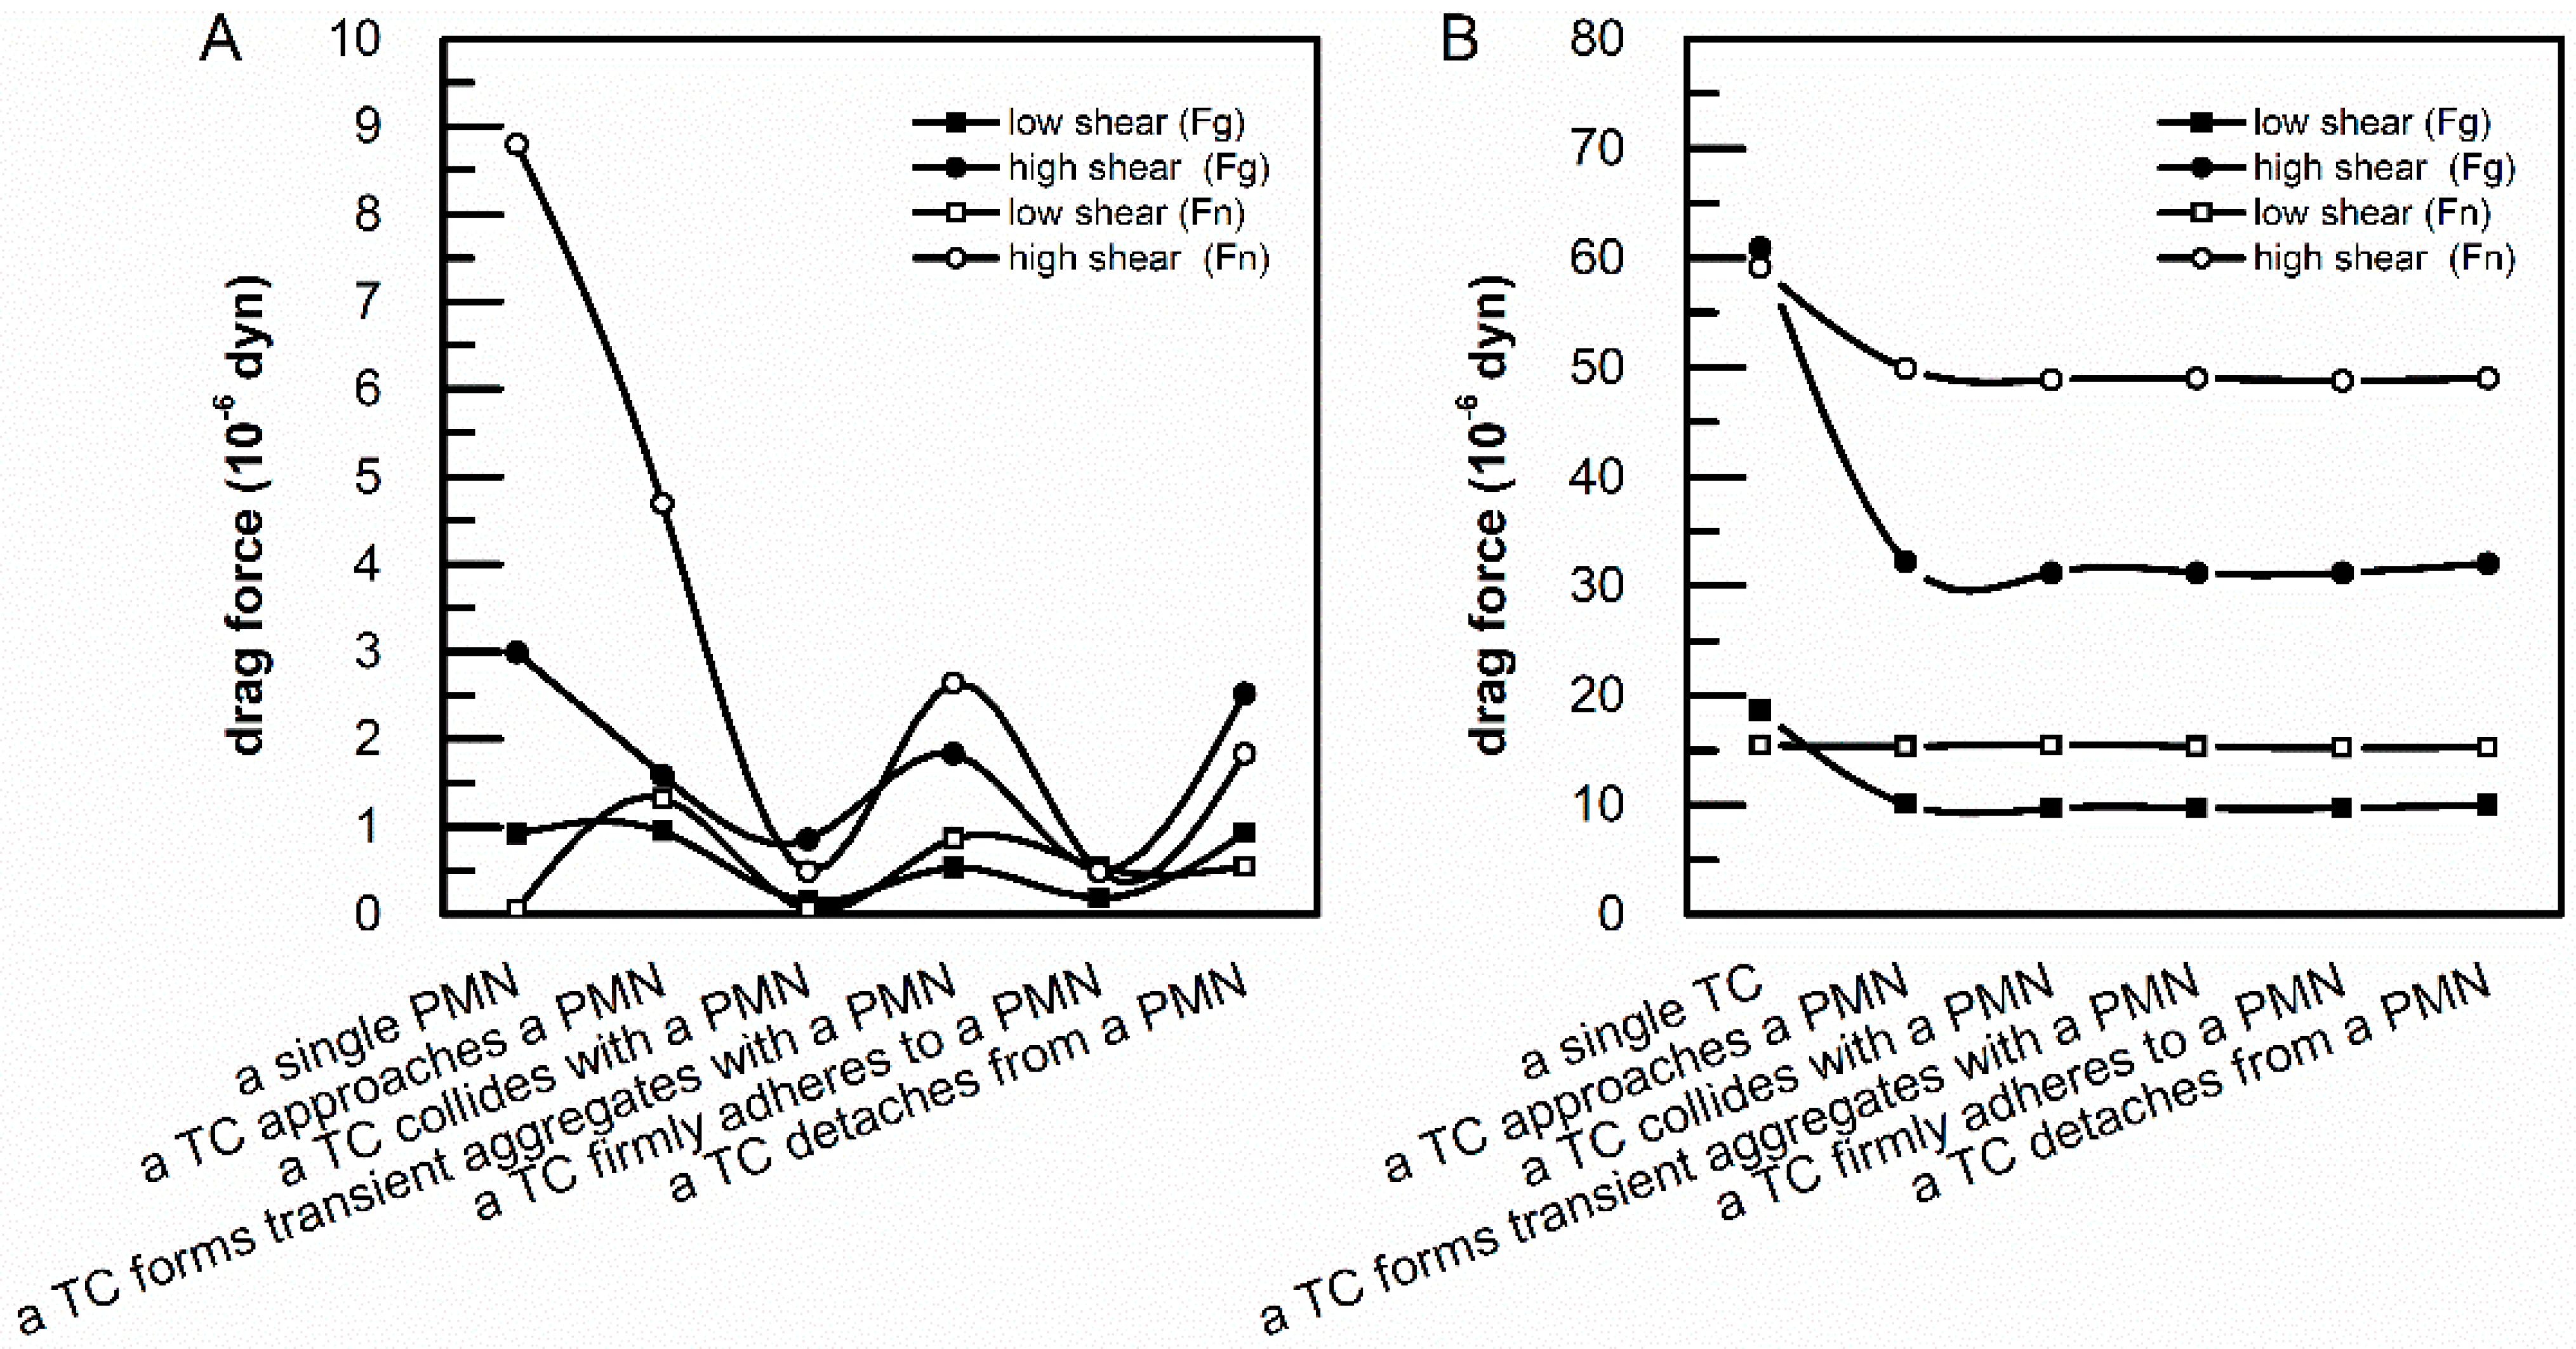
3.4. Drag Forces Acted on Adherent PMNs and TCs

Drag forces were calculated on deformed PMNs and TCs with respect to all PMN-to-TC position states. In the presence of sFg, drag forces acting on a TC drop down when a TC is moving towards an adherent PMN. The curves of drag forces acting on a PMN show complicated trends at different PMN-to-TC position states, with lowest drag forces appearing at the state of “firm adhesion” (Figure 5). When sFg was converted to sFn, the curves of drag forces acted on an adherent cell shear similarly to trends under low shear condition compared with those of the same type of cell in the presence of sFg. However, the curves of drag forces acting on an adherent cell under high shear flow condition display different modes. Drag force acting on an adherent PMN drops when a TC collides with an adherent PMN, while drag force acting on an adherent TC shows no apparent change at different PMN-to-TC position states. Moreover, drag forces acting on an adherent TC are much bigger than those acting on an adherent PMN.

4. Discussion

In this paper, we measured the velocity profiles around adherent cells in the presence of sFg and sFn at different PMN-to-TC position states to calculate local shear rates and relative shear rates above adherent cells and the corresponding cell Reynolds number. The results showed that both sFg and sFn affected the curves of relative shear rates above an adherent cell under different shear conditions: (1) the curves of relative shear rates above the same type of adherent cell under different shear conditions were overlapping; (2) the curves of relative shear rates above an adherent cell became flatter in the presence of sFn. Furthermore, the curves of the cell Reynolds numbers of an adherent cell showed fluctuation under high shear condition, and the value ranges of cell Reynolds numbers became smaller in the presence of sFn. Soluble fibrin(ogen), endothelial monolayer, PMN-to-TC position states, and different shear conditions all contributed to PMN-facilitated TC adhesion on ECs. Besides the effect of an endothelial monolayer on the local hydrodynamic environment, soluble fibrin(ogen) acted as a bridge to form extra molecule bonds between three pairs of cells: PMNs and ECs, TCs and ECs, and PMNs and TCs. The increase of collision frequency among these three types of cells affected the contact area and contact time, and further enhanced tumor cells’ firm adhesion on an endothelial monolayer. Both in vivo and in vitro studies showed that there was a strong connection between hemostasis and tumor metastasis. For example, cancer patients usually have a coagulation abnormality with a higher concentration of Fg and fibrinopeptide [31,32]. Tissue factors secreted by melanoma cells could promote the formation of Fn, which could increase the adhesion time of melanoma cells to endothelial cells [14]. Fg could facilitate the adhesion between PMNs and endothelial cells by forming molecular bonds to ICAM-1 [33,34]. Animal experiments indicated that a lack of Fg reduced the firm adhesion of tumor cells, while adding Fn increased the number of adhered tumor cells in pulmonary microcirculation [31,35,36]. In the presence of Fg and Fn, the adhesion between PMNs and melanoma cells would happen in a similar way, which is ICAM-1 (on TC)-fibrin(ogen)-β2 integrin (on PMN). αvβ3 Integrin expressed on the surface of melanoma cells could also bind to Fg and Fn in blood flow [37,38]. Zhang et al. studied the adhesion between melanoma cells and PMNs, and the results indicated that sFg and sFn enhanced the adhesion between tumor cells and PMNs with different kinetic mechanisms. It was also found that ICAM-1 was responsible for initial adhesion and αvβ3 integrin played a role in firm adhesion [39].
PMNs enhanced melanoma cells’ adhesion to endothelial cells in the blood flow, and the concentration of sFn in cancer patients increased due to thrombin [32,35]. In the process of PMN-facilitated tumor cell adhesion to endothelial cells, there were several factors that affected the final adhesion efficiency of tumor cells, such as collision efficiency, contact area, and contact time. In the “two-step theory”, collisions first occurred between PMNs and an endothelial monolayer, then between melanoma cells and adherent PMNs, and finally between tethering melanoma cells and the endothelial monolayer. The collisions between melanoma cells and the endothelial monolayer could not form firm adhesion without the help of PMNs under shear flow [8]. In the presence of sFg and sFn, there would be three different ways for melanoma cells to firmly adhere to an endothelial monolayer: (1) PMNs first adhere to endothelial cells and melanoma cells are then captured by adherent PMNs; (2) melanoma cells directly collide with the endothelial monolayer to form firm adhesion; (3) melanoma cells first form transient adhesion to endothelial cells and then collide with PMNs to be firmly arrested on the endothelial monolayer [22]. Therefore, the indirect and direct collision frequency between melanoma cells and an endothelial monolayer greatly increased. Parallel plate flow chamber experiments conducted by Ozdemir et al. indicated that sFg and sFn enhanced PMN adhesion to an endothelial monolayer, which increased the collision frequency between melanoma cells and PMNs per unit area and per unit time as well [22]. Meanwhile, the effect of an endothelial monolayer on the local hydrodynamic environment due to its morphology also promoted the collision frequency among PMNs, TCs, and the endothelial monolayer. For example, if a TC moved from “valley” to “peak” on an endothelial monolayer, it might be trapped more easily due to the decreasing shear rate. Ghost red blood cells were also approved to facilitate the collision frequency among PMNs, TCs, and the endothelial monolayer, which led to the increase of firmly adhered TCs (data not shown).
Besides collision frequency, contact area and contact time are two key parameters that affect the firm adhesion of cells. When the substrate was coated with protein molecules, since the width of the cell remained the same under different shear conditions, the contact length of the cell acted as an important factor for evaluating the contact area between an adherent cell and the endothelial monolayer [30]. Although it was difficult to directly observe the contact length of adherent cells from the side view due to the endothelial monolayer, the change in cell height reflected the degree of cell deformation to some extent. As the volume of a cell did not change, the decrease of cell height might have led to the increase in cell length, which resulted in the increase of contact area to enhance firm adhesion. As shown in Figure 3, in the presence of sFg, local shear rates above an adherent PMN and an adherent TC reach the lowest value when a TC forms firm adhesion with an adherent PMN. The decrease of local shear rates raised cell-cell contact time to allow more molecule bonds formed on adherent cells. Although a similar phenomenon was not observed for local shear rates above an adherent cell in the presence of sFn, the effect of different PMN-to-TC position states on local shear rates above an adherent cell was not as much as that in the presence of sFn. Under both low and high shear conditions (91.25 μL min−1 and 252 μL min−1, respectively), the curves of local shear rates above an adherent PMN and those above an adherent TC became much flatter. The strong effect of sFn on direct adhesion between TCs and an endothelial monolayer might be an explanation.
Relative shear rates above an adherent PMN vary at different PMN-to-TC position states in the presence of sFg and sFn under both low and high shear conditions (Figure 3A). The curve of relative shear rates above an adherent PMN in the presence of sFn under high shear condition displays a similar trend when compared with those curves in previous study [22]. However, in Figure 3B, except in the case of TC adhesion in the presence of sFn under high shear condition, the curves of relative shear rates above an adherent TC in the presence of sFg and sFn under both low and high shear conditions did not change too much compared with those curves in previous study (where the states of “a single TC” and “transient aggregates” were neglected) [22]. It was indicated that both an endothelial monolayer and soluble fibrin(ogen) affected the local hydrodynamic environment around adherent PMNs more than that around adherent TCs. Since a PMN has a smaller diameter (about 8 μm) than a melanoma cell (16–20 μm), it might be more easily influenced by the external factors.
Although we examined an endothelial monolayer and soluble fibrin(ogen) to simulate physiological tumor microenvironment in blood flow in vitro as much as possible, limitations still exist. For example, only one concentration of soluble fibrin(ogen) was considered. The diffusion of soluble fibrin(ogen) might be influenced by different shear conditions, thus the gradient of soluble fibrin(ogen) might affect cell adhesion. Moreover, dynamic wall shear stress distribution might be influenced by viscoelasticity of the extracellular matrix. Another limitation is the use of EI cells to mimic endothelial cells. Although the stable E-selectin and ICAM-1 expression of EI cells were comparable with those of activated ECs [28], other changes were neglected in this study. Shear flow would activate endothelial cells to promote the release of von Willebrand factor (vWF) from flow-stimulated EC [40], and it is reported that vWF could directly bind and immobilize extracellular DNA released from leukocytes [41]. Fibrin also induces release of vWF from endothelial cells [42]. Therefore, vWF released from activated endothelial cells might also act as a bridge for neutrophil adhesion to endothelial cells in the neutrophil–tumor cell–endothelial cell adhesion system with the presence of sFg or sFn. Moreover, highly metastatic melanoma cells could activate endothelial cells and tissue-factor-mediated thrombin formation, promoting the aggregation of platelets on tumor-activated endothelium, and leading to enhanced metastasis of tumor cells [43,44,45,46]. Side-view micro-PIV was a 2D observation and also had its limitations. In order to further reveal the mechanisms behind the “two-step theory” of tumor metastasis, there are several improvements that could be made in future studies: (1) 3D micro-PIV technique could be applied to capture the dynamic process of PMN-facilitated tumor cell adhesion on an endothelial monolayer; (2) fluid-structure interaction could be imported to simulate the process of calculating contact area and contact time during the collisions of cells; (3) the impact of protein concentration gradient and chemokine could be involved; (4) endothelial cells could be used rather than EI cells to investigate the impact of vWF released from activated endothelial cells on the neutrophil–tumor cell–endothelial cell adhesion system.

Author Contributions

Y.F., J.W. (Jianhua Wu), and C.D. developed the initial concept. Y.F., R.F.K., J.W. (Jianhua Wu), and C.D. designed the experiment. Y.F. performed the experiment and analyzed data. A.L. performed simulation work. Y.F. wrote the manuscript. J.W. (Jie Wu) and Z.D. gave critical thoughts and revised the manuscript. C.D., J.W. (Jianhua Wu), and R.S. supervised the study. All authors discussed the results and commented on the manuscript. All authors have read and agreed to the published version of the manuscript.

Funding

This work is supported by grants from the National Natural Science Foundation of China (11302129, to Y.F.), the Hundred Teacher Talent Program of Shanghai University of Medicine & Health Sciences (B3-0200-20-311008-23, to Y.F.), Construction project of Shanghai Key Laboratory of Molecular Imaging(18DZ2260400), Shanghai Municipal Education Commission (Class II Plateau Disciplinary Construction Program for Medical Technology of SUMHS, 2018–2020), the Key Program of National Natural Science Foundation of China(81830052), the National Institute of Health Grants (CA-125707, to C.D.), a National Science Foundation Grant (CBET-0729091, to C.D.), the National Natural Science Foundation of China (11432006 and 31170887, to J.W. (Jianhua Wu)), the Specialized Research Fund for the Doctoral Program of Higher Education of China (20130073110059, to R.S.), the National Natural Science Foundation of China (11102113, to J.W. (Jianhua Wu)), and a fellowship from the Chinese Scholarship Council.

Institutional Review Board Statement

The study was conducted according to the guidelines of the Declaration of Helsinki, and approved by the Institutional Review Board of The Pennsylvania State University (protocol code 19311).

Informed Consent Statement

Informed consent was obtained from all subjects involved in the study.

Data Availability Statement

No new data were created or analyzed in this study. Data sharing is not applicable to this article.

Acknowledgments

We thank Gavin Robertson (Penn State University Hershey Medical Center, Hershey, PA, USA) for providing Lu1205 melanoma cells, and Scott Simon (University of California Davis, Davis, CA, USA) for providing EI cells.

Conflicts of Interest

The authors declare no competing financial interests.

References

  1. Torchilin, V.P. Recent advances with liposomes as pharmaceutical carriers. Nat. Rev. Drug Discov. 2005, 4, 145–160. [Google Scholar] [CrossRef] [PubMed]
  2. Sun, H.; Dong, Y.; Feijen, J.; Zhong, Z. Peptide-decorated polymeric nanomedicines for precision cancer therapy. J. Control. Release 2018, 290, 11–27. [Google Scholar] [CrossRef] [PubMed]
  3. Shaked, Y. The pro-tumorigenic host response to cancer therapies. Nat. Rev. Cancer 2019, 19, 667–685. [Google Scholar] [CrossRef] [PubMed]
  4. Steeg, P. Tumor metastasis: Mechanistic insights and clinical challenges. Nat. Med. 2006, 12, 895–904. [Google Scholar] [CrossRef] [PubMed]
  5. Gupta, G.; Massagué, J. Cancer metastasis: Building a framework. Cell 2006, 127, 679–695. [Google Scholar] [CrossRef] [Green Version]
  6. Micalizzi, D.S.; Maheswaran, S.; Haber, D.A. A conduit to metastasis: Circulating tumor cell biology. Genes Dev. 2017, 31, 1827–1840. [Google Scholar] [CrossRef]
  7. Lambert, A.W.; Pattabiraman, D.R.; Weinberg, R.A. Emerging Biological Principles of Metastasis. Cell 2017, 168, 670–691. [Google Scholar] [CrossRef] [Green Version]
  8. Liang, S.; Slattery, M.; Wagner, D.; Simon, S.; Dong, C. Hydrodynamic shear rate regulates melanoma-leukocyte aggregation, melanoma adhesion to the endothelium, and subsequent extravasation. Ann. Biomed. Eng. 2008, 36, 661–671. [Google Scholar] [CrossRef] [Green Version]
  9. Liang, S.; Slattery, M.J.; Dong, C. Shear stress and shear rate differentially affect the multi-step process of leukocyte-facilitated melanoma adhesion. Exp. Cell Res. 2005, 310, 282–292. [Google Scholar] [CrossRef] [Green Version]
  10. Dong, C.; Slattery, M.J.; Liang, S.; Peng, H.H. Melanoma cell extravasation under flow conditions is modulated by leukocytes and endogenously produced interleukin 8. Mol. Cell. Biomech. 2005, 2, 145–159. [Google Scholar]
  11. Hoskins, M.H.; Kunz, R.F.; Bistline, J.E.; Dong, C. Coupled flow-structure-biochemistry simulations of dynamic systems of blood cells using an adaptive surface tracking method. J. Fluids Struct. 2009, 25, 936–953. [Google Scholar] [CrossRef] [PubMed] [Green Version]
  12. Huh, S.J.; Liang, S.; Sharma, A.; Dong, C.; Robertson, G.P. Transiently entrapped circulating tumor cells interact with neutrophils to facilitate lung metastasis development. Cancer Res. 2010, 70, 6071–6082. [Google Scholar] [CrossRef] [PubMed] [Green Version]
  13. Dong, C. Adhesion and signaling of tumor cells to leukocytes and endothelium in cancer metastasis. In Cellular and Biomolecular Mechanics and Mechanobiology; Springer: Berlin/Heidelberg, Germany, 2011; pp. 477–521. [Google Scholar]
  14. Mueller, B.M.; Reisfeld, R.A.; Edgington, T.S.; Ruf, W. Expression of tissue factor by melanoma cells promotes efficient hematogenous metastasis. Proc. Natl. Acad. Sci. USA 1992, 89, 11832–11836. [Google Scholar] [CrossRef] [PubMed] [Green Version]
  15. Rickles, F.R.; Patierno, S.; Fernandez, P.M. Tissue factor, thrombin, and cancer. Chest 2003, 124, 58S–68S. [Google Scholar] [CrossRef] [PubMed]
  16. Gobel, K.; Eichler, S.; Wiendl, H.; Chavakis, T.; Kleinschnitz, C.; Meuth, S.G. The Coagulation Factors Fibrinogen, Thrombin, and Factor XII in Inflammatory Disorders-A Systematic Review. Front. Immunol. 2018, 9, 1731. [Google Scholar] [CrossRef] [Green Version]
  17. Coughlin, S.R. Thrombin signalling and protease-activated receptors. Nature 2000, 407, 258–264. [Google Scholar] [CrossRef]
  18. Kattula, S.; Byrnes, J.R.; Wolberg, A.S. Fibrinogen and Fibrin in Hemostasis and Thrombosis. Arter. Thromb. Vasc. Biol. 2017, 37, e13–e21. [Google Scholar] [CrossRef] [Green Version]
  19. Sugama, Y.; Tiruppathi, C.; Andersen, T.; Fenton, J.; Malik, A. Thrombin-induced expression of endothelial P-selectin and intercellular adhesion molecule-1: A mechanism for stabilizing neutrophil adhesion. J. Cell Biol. 1992, 119, 935–944. [Google Scholar] [CrossRef]
  20. Zimmerman, G.A.; Mcintyre, T.M.; Prescott, S.M. Thrombin stimulates the adherence of neutrophils to human endothelial cells in vitro. J. Clin. Investig. 1985, 76, 2235–2246. [Google Scholar] [CrossRef]
  21. Wang, Y.; Gao, H.; Shi, C.; Erhardt, P.W.; Pavlovsky, A.; Soloviev, D.A.; Bledzka, K.; Ustinov, V.; Zhu, L.; Qin, J.; et al. Leukocyte integrin Mac-1 regulates thrombosis via interaction with platelet GPIbalpha. Nat. Commun. 2017, 8, 15559. [Google Scholar] [CrossRef] [Green Version]
  22. Ozdemir, T.; Zhang, P.; Fu, C.; Dong, C. Fibrin serves as a divalent ligand that regulates neutrophil-mediated melanoma cells adhesion to endothelium under shear conditions. Am. J. Physiol. Cell Physiol. 2012, 302, C1189–C1201. [Google Scholar] [CrossRef] [PubMed] [Green Version]
  23. Biggerstaff, J.P.; Weidow, B.; Vidosh, J.; Dexheimer, J.; Patel, S.; Patel, P. Soluble fibrin inhibits monocyte adherence and cytotoxicity against tumor cells: Implications for cancer metastasis. Thromb. J. 2006, 4, 12. [Google Scholar] [CrossRef] [PubMed] [Green Version]
  24. Refaai, M.A.; Riley, P.; Mardovina, T.; Bell, P.D. The Clinical Significance of Fibrin Monomers. Thromb. Haemost. 2018, 118, 1856–1866. [Google Scholar] [CrossRef] [Green Version]
  25. Campello, E.; Henderson, M.W.; Noubouossie, D.F.; Simioni, P.; Key, N.S. Contact System Activation and Cancer: New Insights in the Pathophysiology of Cancer-Associated Thrombosis. Thromb. Haemost. 2018, 118, 251–265. [Google Scholar] [CrossRef] [PubMed] [Green Version]
  26. Ozdemir, T.; Gaddes, E.; Wang, Y.; Dong, C. Perspectives: Interplay Between Melanoma Regulated Fibrin and Receptor Mediated Adhesion Under Shear Flow. Cell. Mol. Bioeng. 2014, 1–10. [Google Scholar] [CrossRef]
  27. Fu, Y.; Kunz, R.; Wu, J.; Dong, C. Study of local hydrodynamic environment in cell-substrate adhesion using side-view μPIV technology. PLoS ONE 2012, 7, e30721. [Google Scholar] [CrossRef]
  28. Gopalan, P.K.; Smith, C.W.; Lu, H.; Berg, E.L.; McIntire, L.V.; Simon, S.I. Neutrophil CD18-dependent arrest on intercellular adhesion molecule 1 (ICAM-1) in shear flow can be activated through L-selectin. J. Immunol. 1997, 158, 367–375. [Google Scholar]
  29. Cao, J.; Usami, S.; Dong, C. Development of a side-view chamber for studying cell-surface adhesion under flow conditions. Ann. Biomed. Eng. 1997, 25, 573–580. [Google Scholar] [CrossRef]
  30. Cao, J.; Donell, B.; Deaver, D.R.; Lawrence, M.B.; Dong, C. In vitro side-view imaging technique and analysis of human T-leukemic cell adhesion to ICAM-1 in shear flow. Microvasc. Res. 1998, 55, 124–137. [Google Scholar] [CrossRef]
  31. Biggerstaff, J.; Seth, N.; Amirkhosravi, A.; Amaya, M.; Fogarty, S.; Meyer, T.; Siddiqui, F.; Francis, J. Soluble fibrin augments platelet/tumor cell adherence in vitro and in vivo, and enhances experimental metastasis. Clin. Exp. Metastasis 1999, 17, 723–730. [Google Scholar] [CrossRef]
  32. Wojtukiewicz, M.Z.; Hempel, D.; Sierko, E.; Tucker, S.C.; Honn, K.V. Thrombin-unique coagulation system protein with multifaceted impacts on cancer and metastasis. Cancer Metastasis Rev. 2016, 35, 213–233. [Google Scholar] [CrossRef] [PubMed]
  33. Languino, L.; Plescia, J.; Duperray, A.; Brian, A.; Plow, E.; Geltosky, J.; Altieri, D. Fibrinogen mediates leukocyte adhesion to vascular endothelium through an ICAM-1-dependent pathway. Cell 1993, 73, 1423–1434. [Google Scholar] [CrossRef]
  34. Luyendyk, J.P.; Schoenecker, J.G.; Flick, M.J. The multifaceted role of fibrinogen in tissue injury and inflammation. Blood 2019, 133, 511–520. [Google Scholar] [CrossRef] [PubMed]
  35. Palumbo, J.S.; Kombrinck, K.W.; Drew, A.F.; Grimes, T.S.; Kiser, J.H.; Degen, J.L.; Bugge, T.H. Fibrinogen is an important determinant of the metastatic potential of circulating tumor cells. Blood 2000, 96, 3302–3309. [Google Scholar] [CrossRef] [PubMed]
  36. Tesfamariam, B. Involvement of platelets in tumor cell metastasis. Pharmacol. Ther. 2016, 157, 112–119. [Google Scholar] [CrossRef]
  37. Felding-Habermann, B.; Ruggeri, Z.; Cheresh, D. Distinct biological consequences of integrin alpha v beta 3-mediated melanoma cell adhesion to fibrinogen and its plasmic fragments. J. Biol. Chem. 1992, 267, 5070–5077. [Google Scholar]
  38. Huang, R.; Rofstad, E.K. Integrins as therapeutic targets in the organ-specific metastasis of human malignant melanoma. J. Exp. Clin. Cancer Res. 2018, 37, 92. [Google Scholar] [CrossRef]
  39. Zhang, P.; Ozdemir, T.; Chung, C.Y.; Robertson, G.P.; Dong, C. Sequential Binding of αvβ3 and ICAM-1 Determines Fibrin-Mediated Melanoma Capture and Stable Adhesion to CD11b/CD18 on Neutrophils. J. Immunol. 2011, 186, 242–254. [Google Scholar] [CrossRef] [Green Version]
  40. Dong, J.F.; Moake, J.L.; Nolasco, L.; Bernardo, A.; Arceneaux, W.; Shrimpton, C.N.; Schade, A.J.; McIntire, L.V.; Fujikawa, K.; Lopez, J.A. ADAMTS-13 rapidly cleaves newly secreted ultralarge von Willebrand factor multimers on the endothelial surface under flowing conditions. Blood 2002, 100, 4033–4039. [Google Scholar] [CrossRef] [Green Version]
  41. Grassle, S.; Huck, V.; Pappelbaum, K.I.; Gorzelanny, C.; Aponte-Santamaria, C.; Baldauf, C.; Grater, F.; Schneppenheim, R.; Obser, T.; Schneider, S.W. von Willebrand factor directly interacts with DNA from neutrophil extracellular traps. Arter. Thromb. Vasc. Biol. 2014, 34, 1382–1389. [Google Scholar] [CrossRef] [Green Version]
  42. Ribes, J.A.; Francis, C.W.; Wagner, D.D. Fibrin induces release of von Willebrand factor from endothelial cells. J. Clin. Investig. 1987, 79, 117–123. [Google Scholar] [CrossRef] [PubMed]
  43. Goerge, T.; Kleineruschkamp, F.; Barg, A.; Schnaeker, E.M.; Huck, V.; Schneider, M.F.; Steinhoff, M.; Schneider, S.W. Microfluidic reveals generation of platelet-strings on tumor-activated endothelium. Thromb. Haemost. 2007, 98, 283–286. [Google Scholar] [PubMed]
  44. Bauer, A.T.; Suckau, J.; Frank, K.; Desch, A.; Goertz, L.; Wagner, A.H.; Hecker, M.; Goerge, T.; Umansky, L.; Beckhove, P.; et al. von Willebrand factor fibers promote cancer-associated platelet aggregation in malignant melanoma of mice and humans. Blood 2015, 125, 3153–3163. [Google Scholar] [CrossRef] [PubMed] [Green Version]
  45. Kerk, N.; Strozyk, E.A.; Poppelmann, B.; Schneider, S.W. The mechanism of melanoma-associated thrombin activity and von Willebrand factor release from endothelial cells. J. Investig. Dermatol. 2010, 130, 2259–2268. [Google Scholar] [CrossRef] [Green Version]
  46. Yang, A.J.; Wang, M.; Wang, Y.; Cai, W.; Li, Q.; Zhao, T.T.; Zhang, L.H.; Houck, K.; Chen, X.; Jin, Y.L.; et al. Cancer cell-derived von Willebrand factor enhanced metastasis of gastric adenocarcinoma. Oncogenesis 2018, 7, 12. [Google Scholar] [CrossRef] [Green Version]
Figure 1. Illustration of side-view micro-PIV experiment and CFD simulation. (A) Setup of side-view micro-PIV system (drawn by the authors); (B) Six relative PMN-to-TC position states (PMN: polymorphonuclear neutrophil; TC: tumor cell); (C) Velocity profiles around an adherent cell; (D) Plot of a column of velocity profile above an adherent cell calculated from micro-PIV and CFD.
Applsci 11 00079 g001
Figure 2. Comparison of local shear rates above adherent PMNs and those above adherent melanoma cells in the presence of soluble fibrin(ogen). (A) Under low shear flow condition (91.25 µL min−1); (B) Under high shear flow condition (292 µL min−1). Solid squares (■) represent local shear rates above an adherent PMN in soluble fibrinogen (sFg) solution, solid circles (●) represent local shear rates above an adherent TC in soluble fibrin (sFn) solution, open squares (□) represent local shear rates above an adherent PMN in sFg solution, and open circles (○) represent local shear rates above an adherent TC in sFn solution.
Applsci 11 00079 g002
Figure 3. Relative shear rates above adherent cells in the presence of soluble fibrin (ogen). (A) Above an adherent PMN; (B) Above an adherent TC. Solid squares (■) represent a low shear condition (91.25 µL min−1) with sFg, solid circles (●) represent a high shear condition (292 µL min−1) with sFg, open squares (□) represent a low shear condition (91.25 µL min−1) with sFn, and open circles (○) represent a high shear condition (292 µL min−1) with sFn.
Applsci 11 00079 g003
Figure 4. Cell Reynolds numbers of adherent cells in the presence of soluble fibrin (ogen). (A) Above an adherent PMN; (B) Above an adherent TC. Solid squares (■) represent a low shear condition (91.25 µL min−1) with sFg, solid circles (●) represent a high shear condition (292 µL min−1) with sFg, open squares (□) represent a low shear condition (91.25 µL min−1) with sFn, and open circles (○) represent a high shear condition (292 µL min−1) with sFn.
Applsci 11 00079 g004
Figure 5. Drag force acting on adherent cells in the presence of soluble fibrin (ogen). (A) Above an adherent PMN; (B) Above an adherent TC. Solid squares (■) represent a low shear condition (91.25 µL min−1) with sFg, solid circles (●) represent a high shear condition (292 µL min−1) with sFg, open squares (□) represent a low shear condition (91.25 µL min−1) with sFn, and open circles (○) represent a high shear condition (292 µL min−1) with sFn.
Applsci 11 00079 g005
Table 1. Cell dimensions measured in sFg solution.
ConditionsPMNTC
Low ShearHigh ShearLow ShearHigh Shear
L (μm)H (μm)L (μm)H (μm)L (μm)H (μm)L (μm)H (μm)
isolated8.85.211.64.915.314.4815.1511.4
approach9.35.5510.34.912.39.312.29.9
collision8.254.86.66.614.2513.6514.712.15
transient aggregate8.78.17.86.713.3513.0514.613.5
adhesion7.656.37.055.8515.312.012.310.05
detach9.34.6510.955.714.2511.8515.4511.7
Table 2. Cell dimensions measured in sFn solution.
ConditionsPMNTC
Low ShearHigh ShearLow ShearHigh Shear
L (μm)H (μm)L (μm)H (μm)L (μm)H (μm)L (μm)H (μm)
isolated10.88.0311.08.314.711.713.710.4
approach11.78.5517.75.8514.5512.615.014.1
collision6.754.28.75.014.0312.8313.712.2
transient aggregate11.79.97.8755.5512.010.513.0510.7
adhesion11.257.059.26.515.311.8513.413.0
detach9.95.410.15.813.712.014.710.0
Publisher’s Note: MDPI stays neutral with regard to jurisdictional claims in published maps and institutional affiliations.

