Article

Kinematic Prediction and Experimental Demonstration of Conditioning Process for Controlling the Profile Shape of a Chemical Mechanical Polishing Pad

Precision Mechanical Process and Control R&D Group, Korea Institute of Industrial Technology (KITECH), Busan 46938, Korea
*
Author to whom correspondence should be addressed.
Submission received: 14 April 2021 / Revised: 3 May 2021 / Accepted: 5 May 2021 / Published: 11 May 2021
(This article belongs to the Special Issue Chemical Mechanical Polishing and Grinding)

Abstract

:
The uniformity of the wafer in a chemical mechanical polishing (CMP) process is vital to the ultra-fine and high integration of semiconductor structures. In particular, the uniformity of the polishing pad corresponding to the tool directly affects the polishing uniformity and wafer shape. In this study, the profile shape of a CMP pad was predicted through a kinematic simulation based on the trajectory density of the diamond abrasives of the diamond conditioner disc. The kinematic prediction was found to be in good agreement with the experimentally measured pad profile shape. Based on this, the shape error of the pad could be maintained within 10 μm even after performing the pad conditioning process for more than 2 h, through the overhang of the conditioner.

Graphical Abstract

1. Introduction

Chemical mechanical polishing (CMP) is one of the representative semiconductor processes, and is the only process closely related to mechanical motion in semiconductor manufacturing processes [1]. The CMP process involves planarizing the surface of a wafer through the relative motion between the pad corresponding to the tool and the wafer corresponding to the workpiece. The roughness of the pad surface determines the polishing rate of the wafer and the quality of the wafer surface [2,3]. Therefore, a conditioning process using a diamond conditioner is applied to maintain a constant roughness of the pad surface [4,5]. The diamond conditioner wears the pad by moving at a constant pressure and by rotating on the pad surface. The conditioning process helps keep the roughness of the pad constant; however, the shape of the pad varies as it wears out. The change in the pad shape during the conditioning process significantly influences the shape of the final polished wafer [6,7,8,9,10]. Therefore, to ensure the final quality of the wafer surface, reproducibility of the polishing rate, and reproducibility of the wafer shape, it is necessary to maintain the roughness of the pad and the pad shape constant throughout the conditioning process [8]. The roughness of the pad is closely related to its physical properties and the shape of the abrasive of the diamond disc, whereas it is unrelated to kinematic movements such as disc rotation or pad rotation [11]. However, the pad shape is dominantly influenced by disk rotation, pad rotation, and conditioning arm movement. The trajectory of the diamond abrasives that wear the pad is determined by the relative motion comprising the rotational motion of the pad and the conditioner and the sweep motion of the conditioning arm. The trajectory density of the abrasives directly affects the pad shape, and the amount of wear at locations with a high trajectory density is significant. In addition, the conditioning process is divided into several zones in the radial direction of the pad, and the conditioning in each zone is carried out with a difference in the occupancy time of the concierge. The difference in occupancy times causes a difference in the wear amount of the pad. If the conditioning process is performed for a long time under unevenly occupied conditions, the pad shape varies rapidly. In other words, depending on how the occupancy time is set, the pad shape can be maintained as good as that at the beginning or it may end up varying rapidly.
Although many researchers have investigated the pad cut rate, the pad temperature, conditioning lifetime, and pad deformation during the CMP process due to conditioning and polishing, they did not compare the kinematic predictions with the actual phenomenon [12,13,14,15,16,17,18]. Freeman et al. predicted the shape of a pad using simple mathematical modeling [19]. Chang et al. attempted to predict a 1D pad shape based on mathematical calculations. However, these previous studies did not compare the predicted and actual pad wear phenomena and were limited to simple predictions [20]. Zhou et al. also predicted the shape of the pad with respect to the diamond disc; however, the condition wherein the pad shape remains constant was not considered [21].
In this study, we predicted the trajectory of diamond abrasives based on the relative motion of three factors: pad rotation, conditioner rotation, and sweep speed. With this, the relative wear amount of the pad was derived by calculating the trajectory density on the pad, and the pad shape was predicted. In addition, we not only predicted the wear shape of the pad, but also measured it using an in situ pad profiler. The predicted results and actual measured results were found to be in good agreement. Finally, a condition in which the pad could continuously maintain its initial shape was derived, and the maximum height deviation was 10 μm or less despite performing the conditioning process for more than 2 h.

2. Materials and Methods

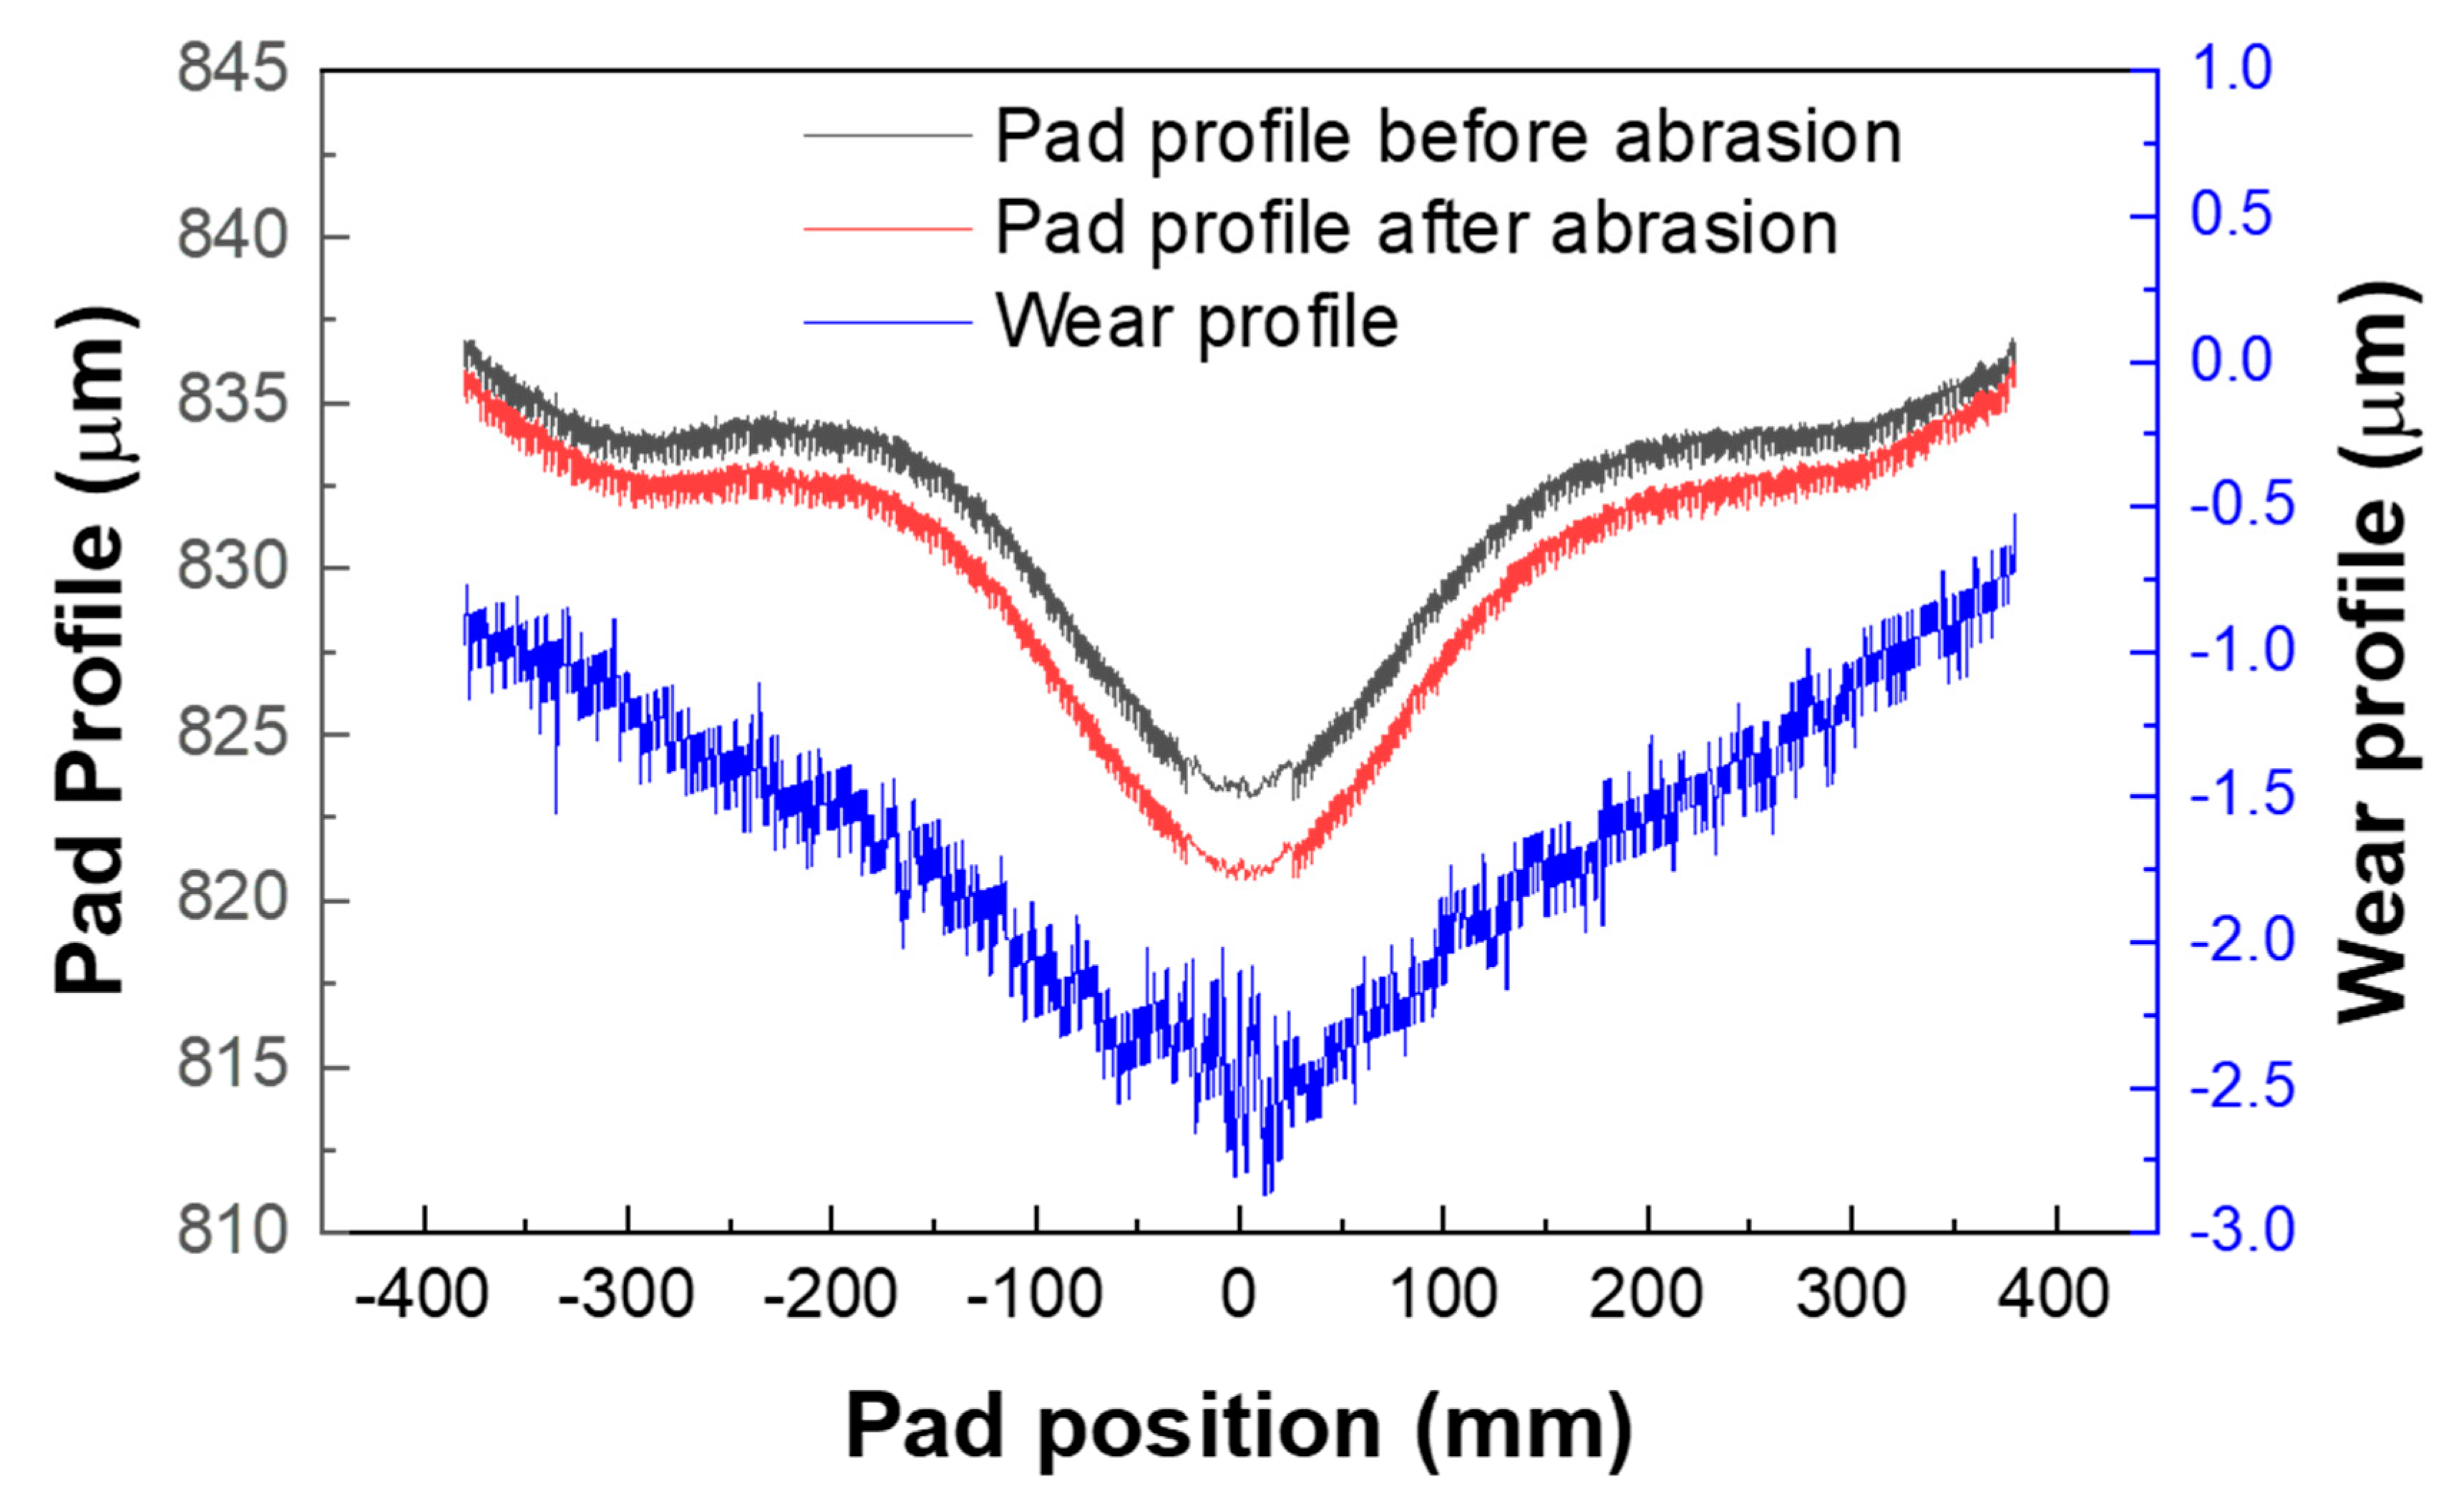
2.1. Conditioning Process and Pad Profile Measurement

Pad conditioning and profiling equipment (G&P Technology, Poli-762, Busan, Korea) was used to measure the pad wear with a contact dial gauge (1 μm resolution, Keyence, GT2, Osaka, Japan). Figure 1a,b shows the CMP equipment with the conditioner and the profiling system respectively. The moving speed of the dial gauge of the profiler in the radial direction of the pad was 5 mm/s, and the sampling frequency was 25 Hz. An IC1000 series pad of k groove with a diameter of 760 mm was used in the wear experiment. A diamond conditioner disc (Saesol Diamond Co., Ansan, Korea) was used in the experiment. The profiler measuring the pad shape is shown in Videos S1 and S2 (Supplementary files). The wear shape was profiled by measuring the pad shape before and after abrasion and then calculating the difference. Figure 2 is a typical pad profile (center fast change before and after abrasion, and the wear profile. Figure 3a shows a schematic of dividing the sweep zone into equal parts in the radial direction. Figure 3b shows a schematic of the relative occupancy time (ROT) between eight types of occupancy times. The developed simulation and equipment used in the experiments include the function of dividing the zone.
In the simulation, the distance between the center of the disc and the center of the pad was 480 mm, the length of the conditioning arm was set to 480 mm, the radius of the pad was 381 mm, and the radius of the conditioner was 50 mm. The rotation speed of the conditioner disc was 103 rotations per minute (rpm), the pad rotation speed was 97 rpm, and the sweep speed was 7 cycles/min. The sweep zone was divided into 11 zones in even, linear center fast, linear edge fast, and controlled ROT as listed in Table 1. In the parabolic, inverse parabolic, step edge fast, and step center fast, the sweep zone was divided into 15 zones, and the ROT is listed in Table 2. The number of grit of the diamond disc was 72. The conditioning process was also carried out with the same device configuration and conditions as above, and the pad was conditioned for 10 min with a conditioning load of 40 N, and the pad shape before and after was measured. The starting point of conditioning was 25 mm from the center of the pad, and the return point of the conditioner was 350 mm from the center.

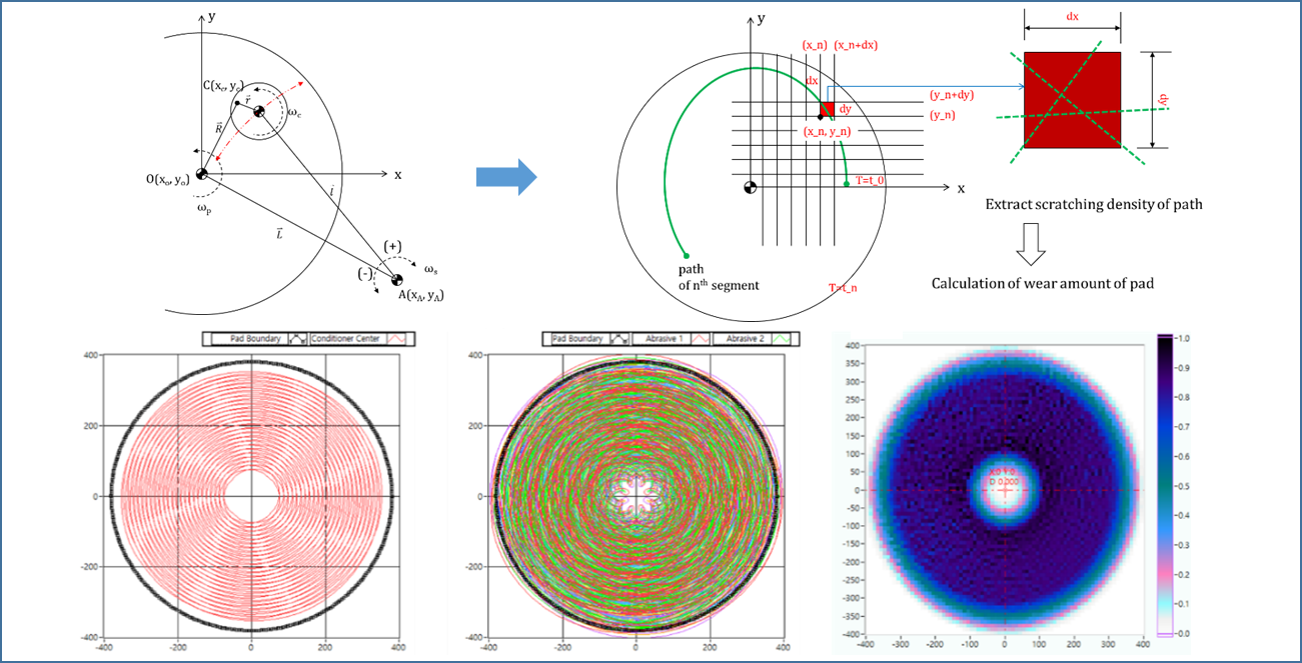
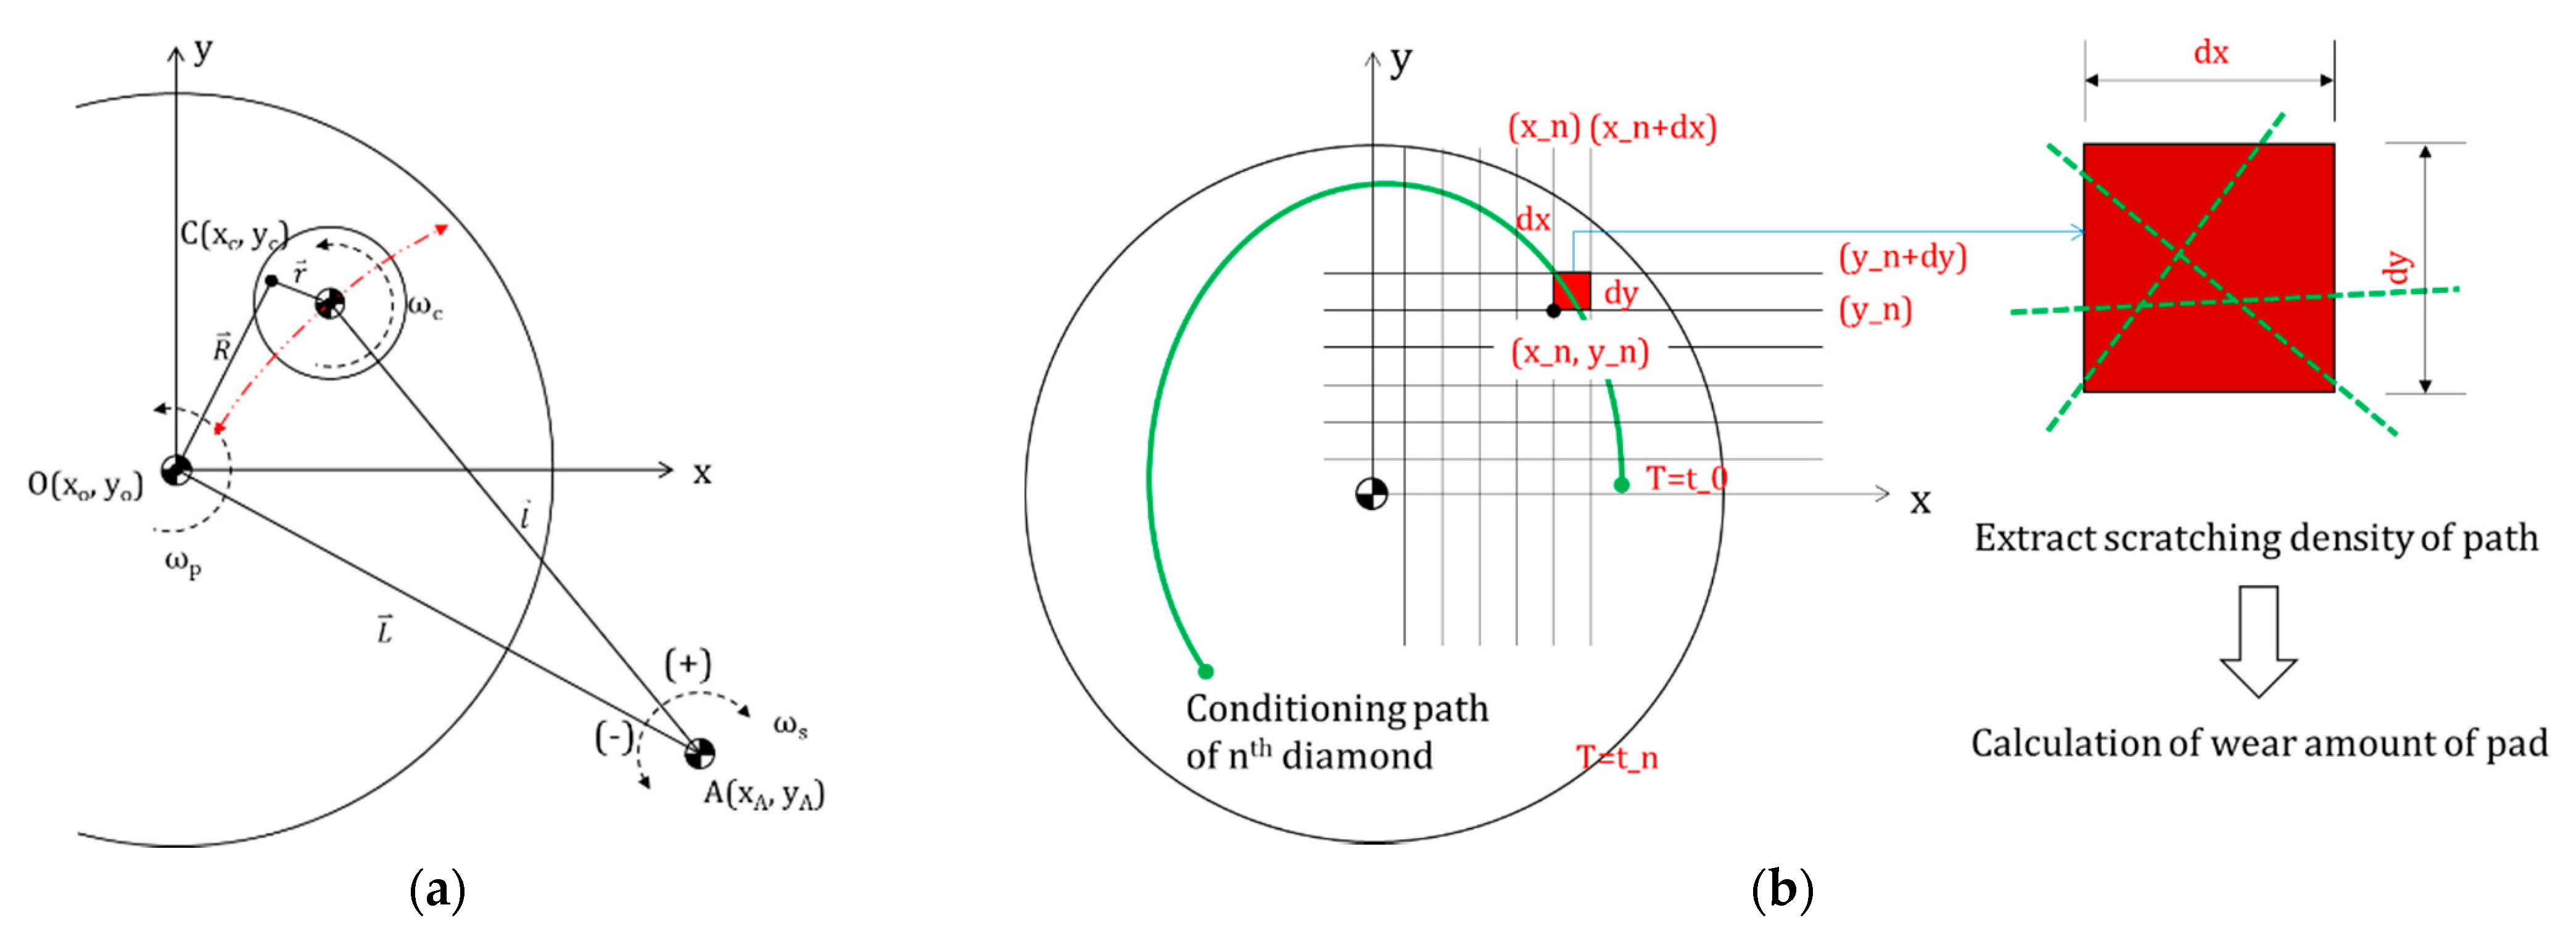
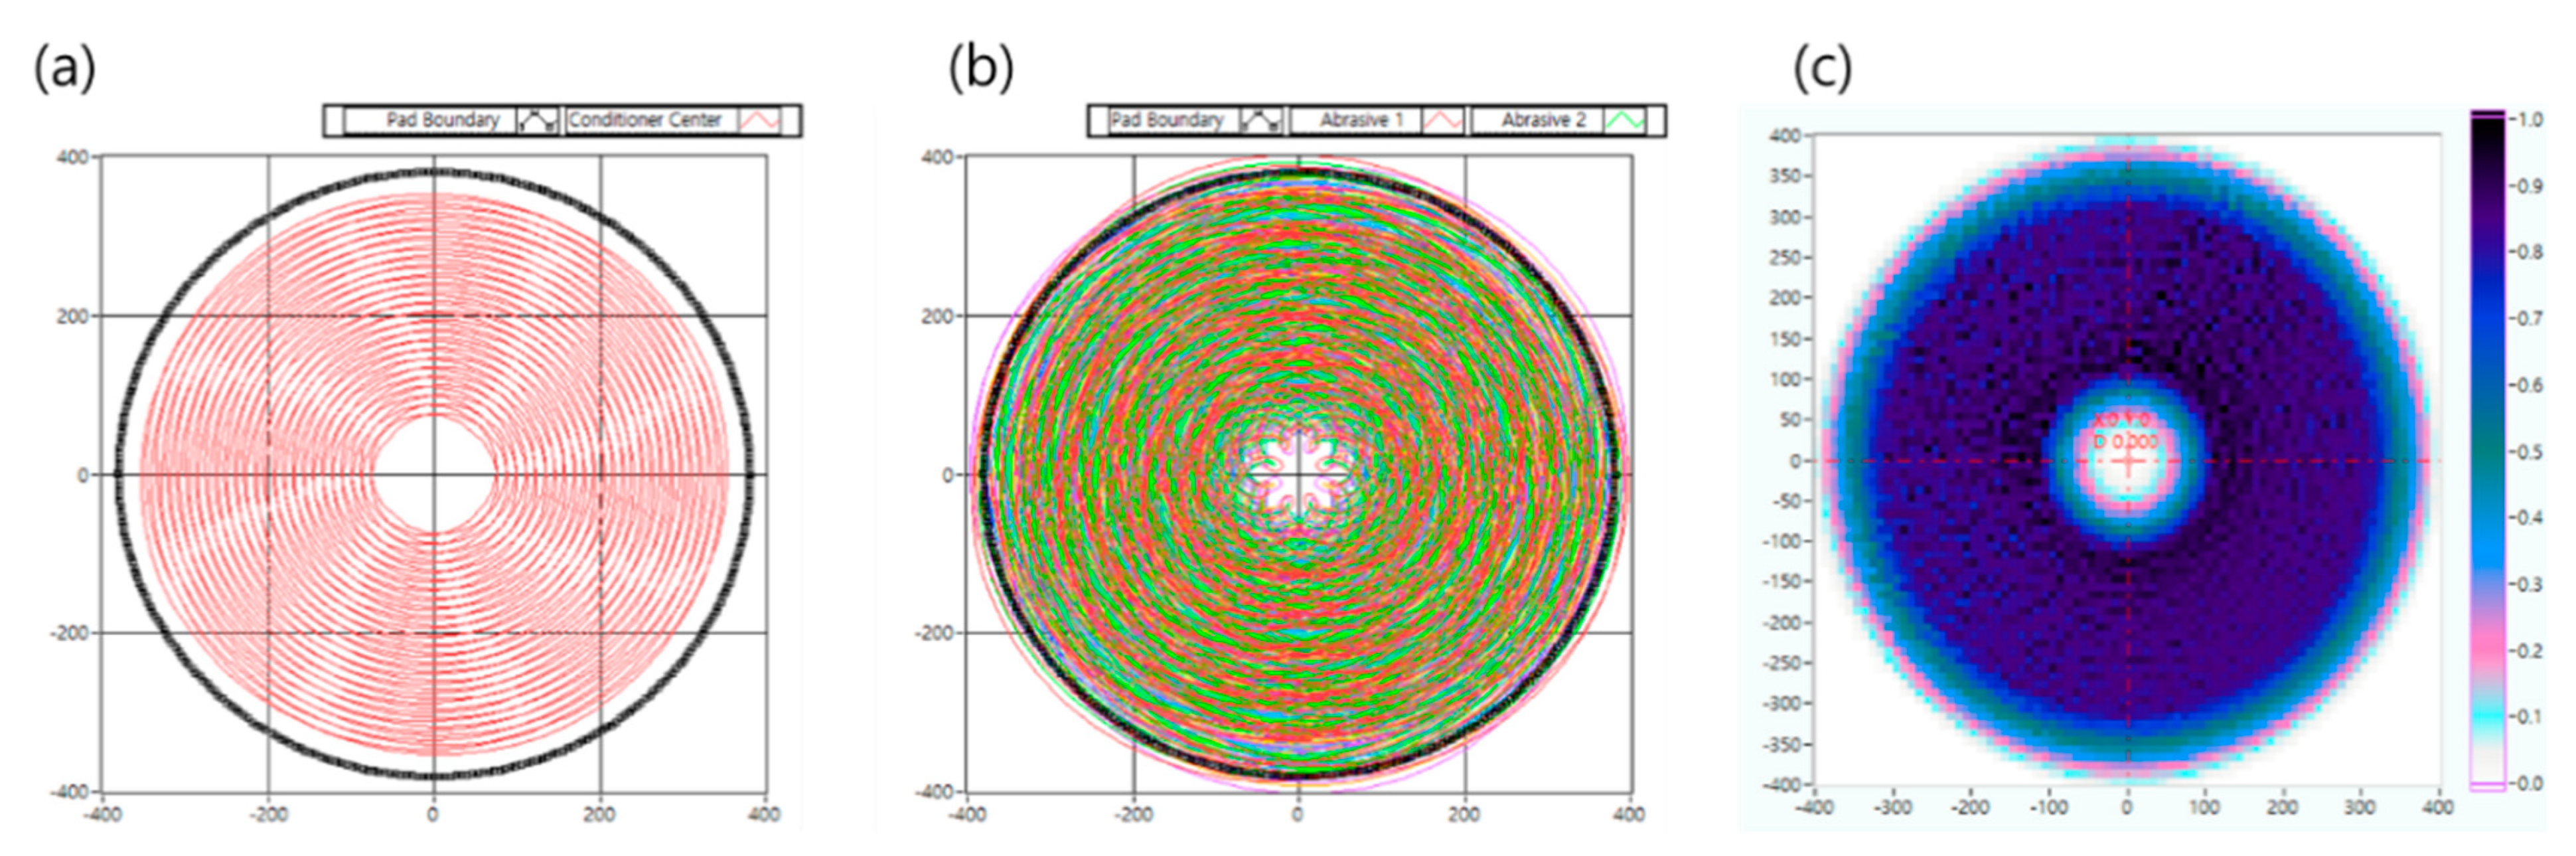
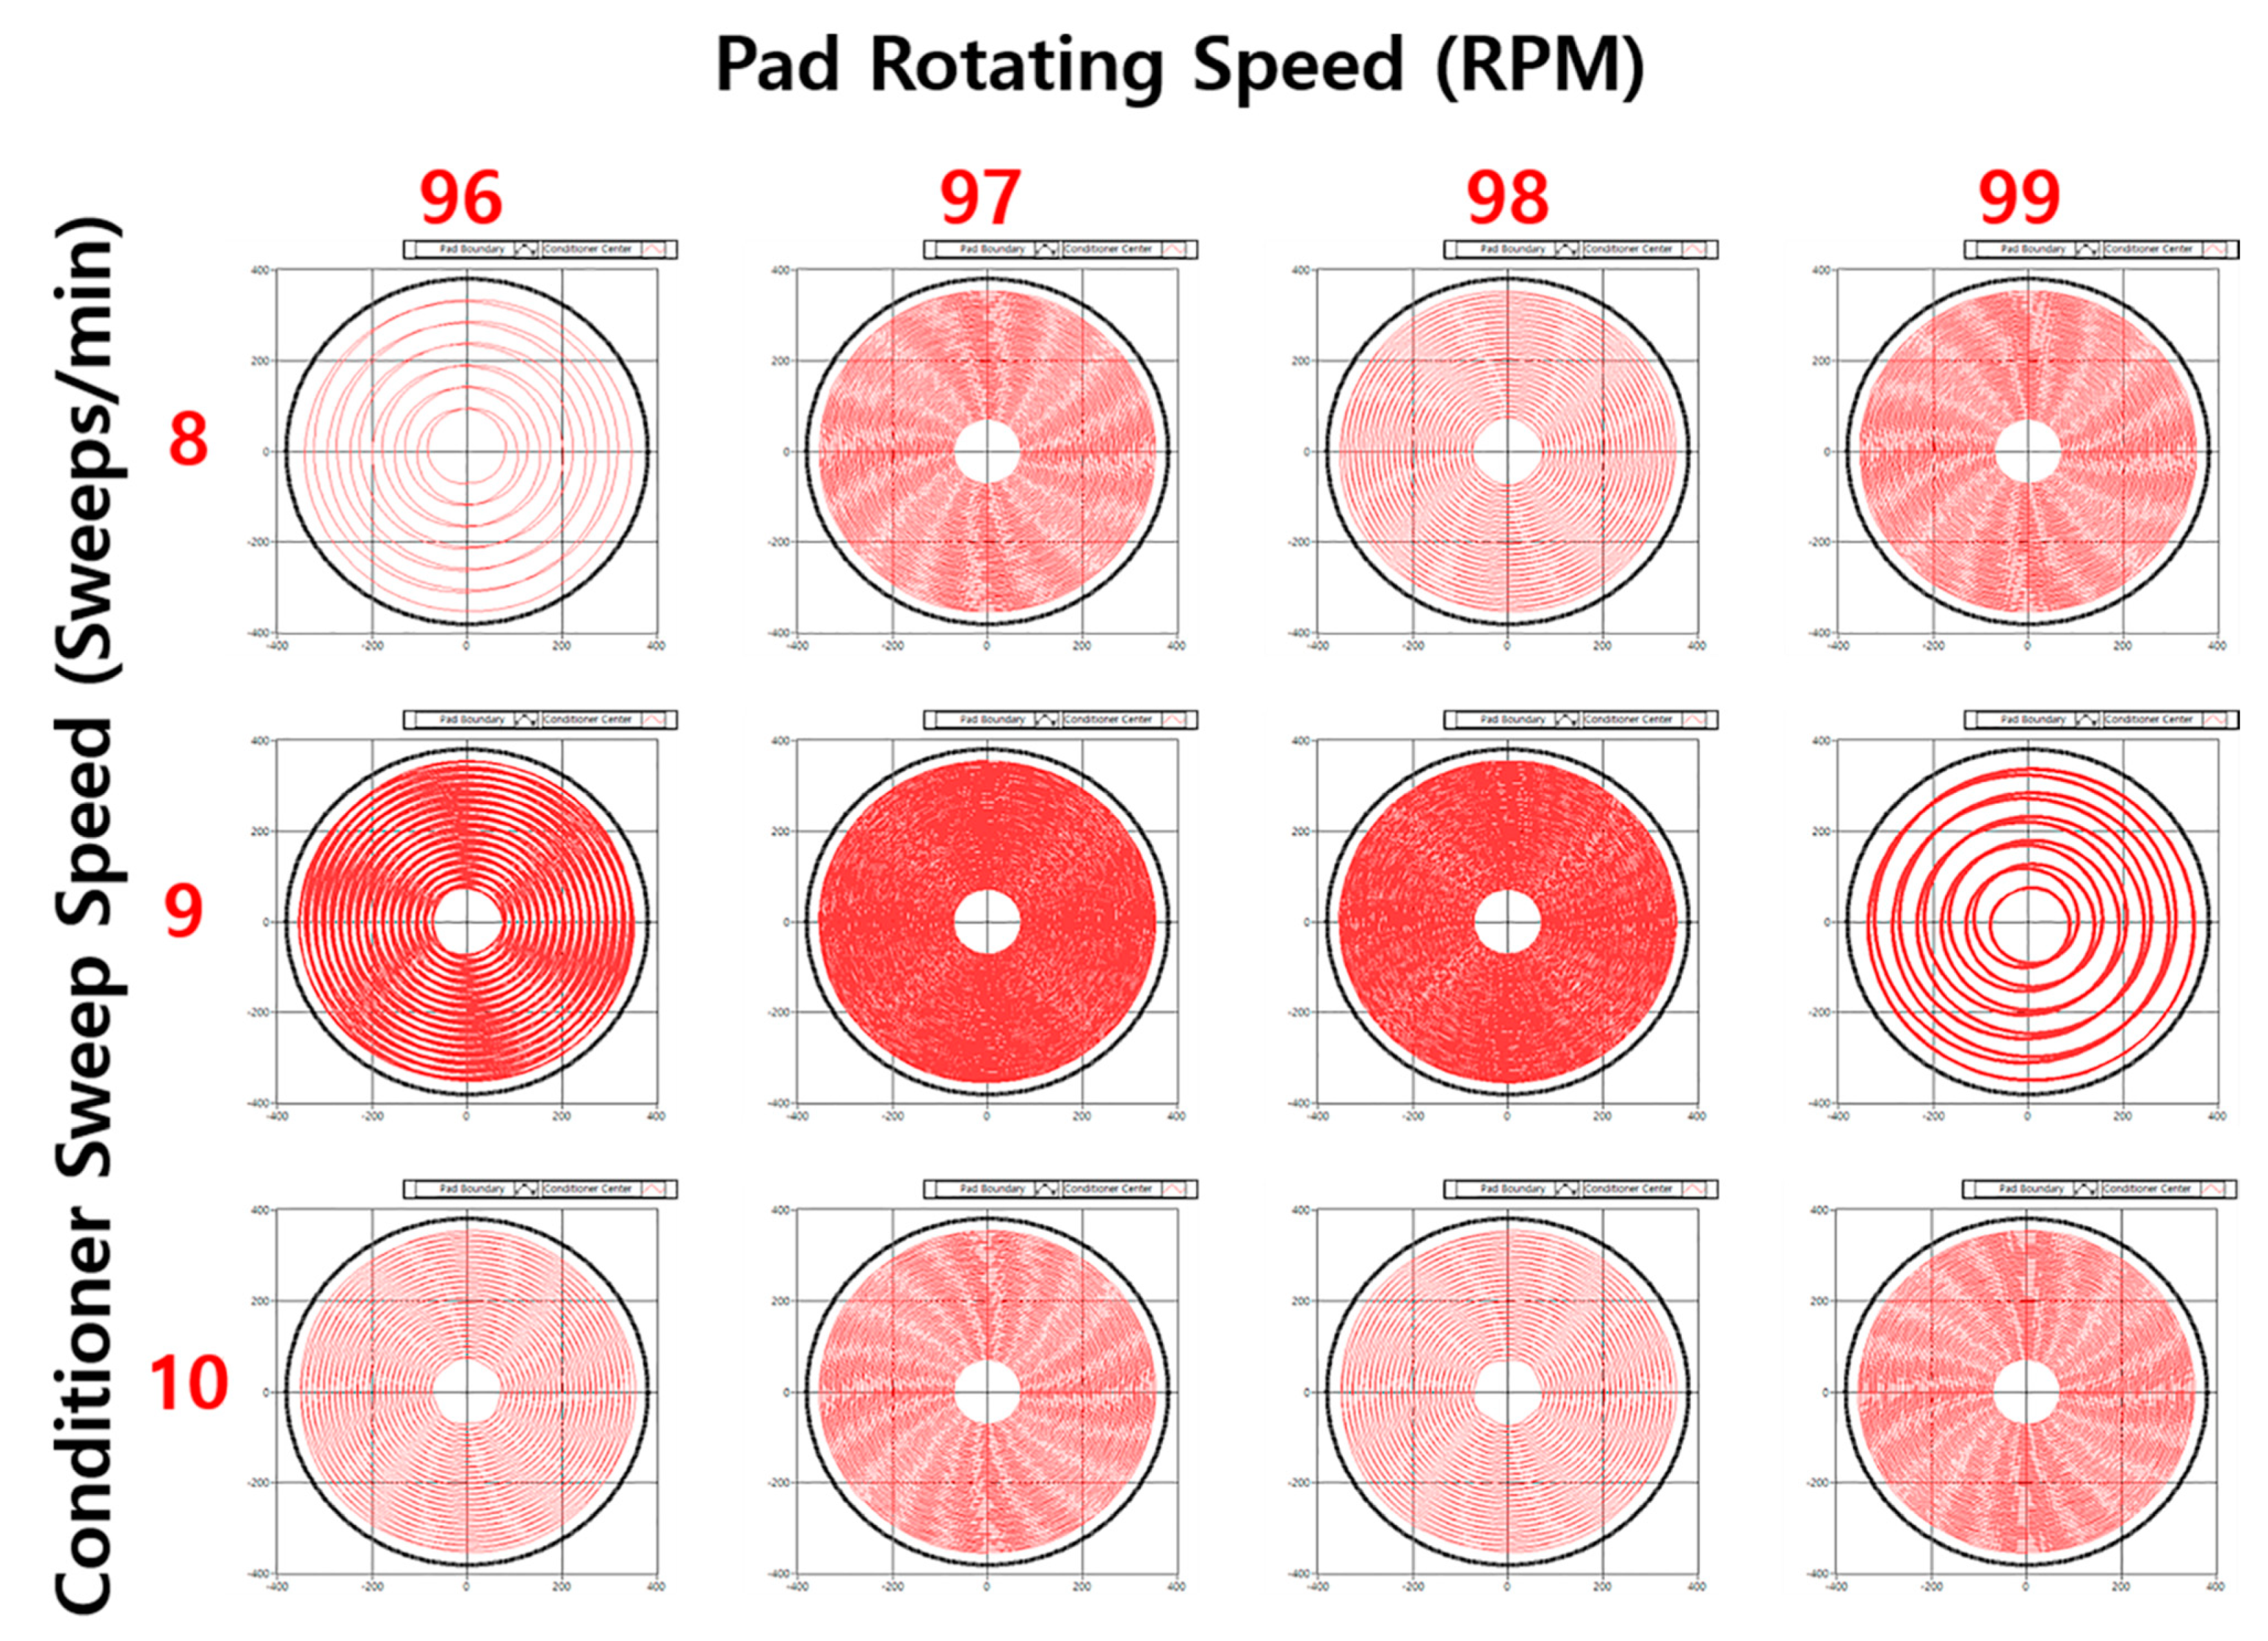
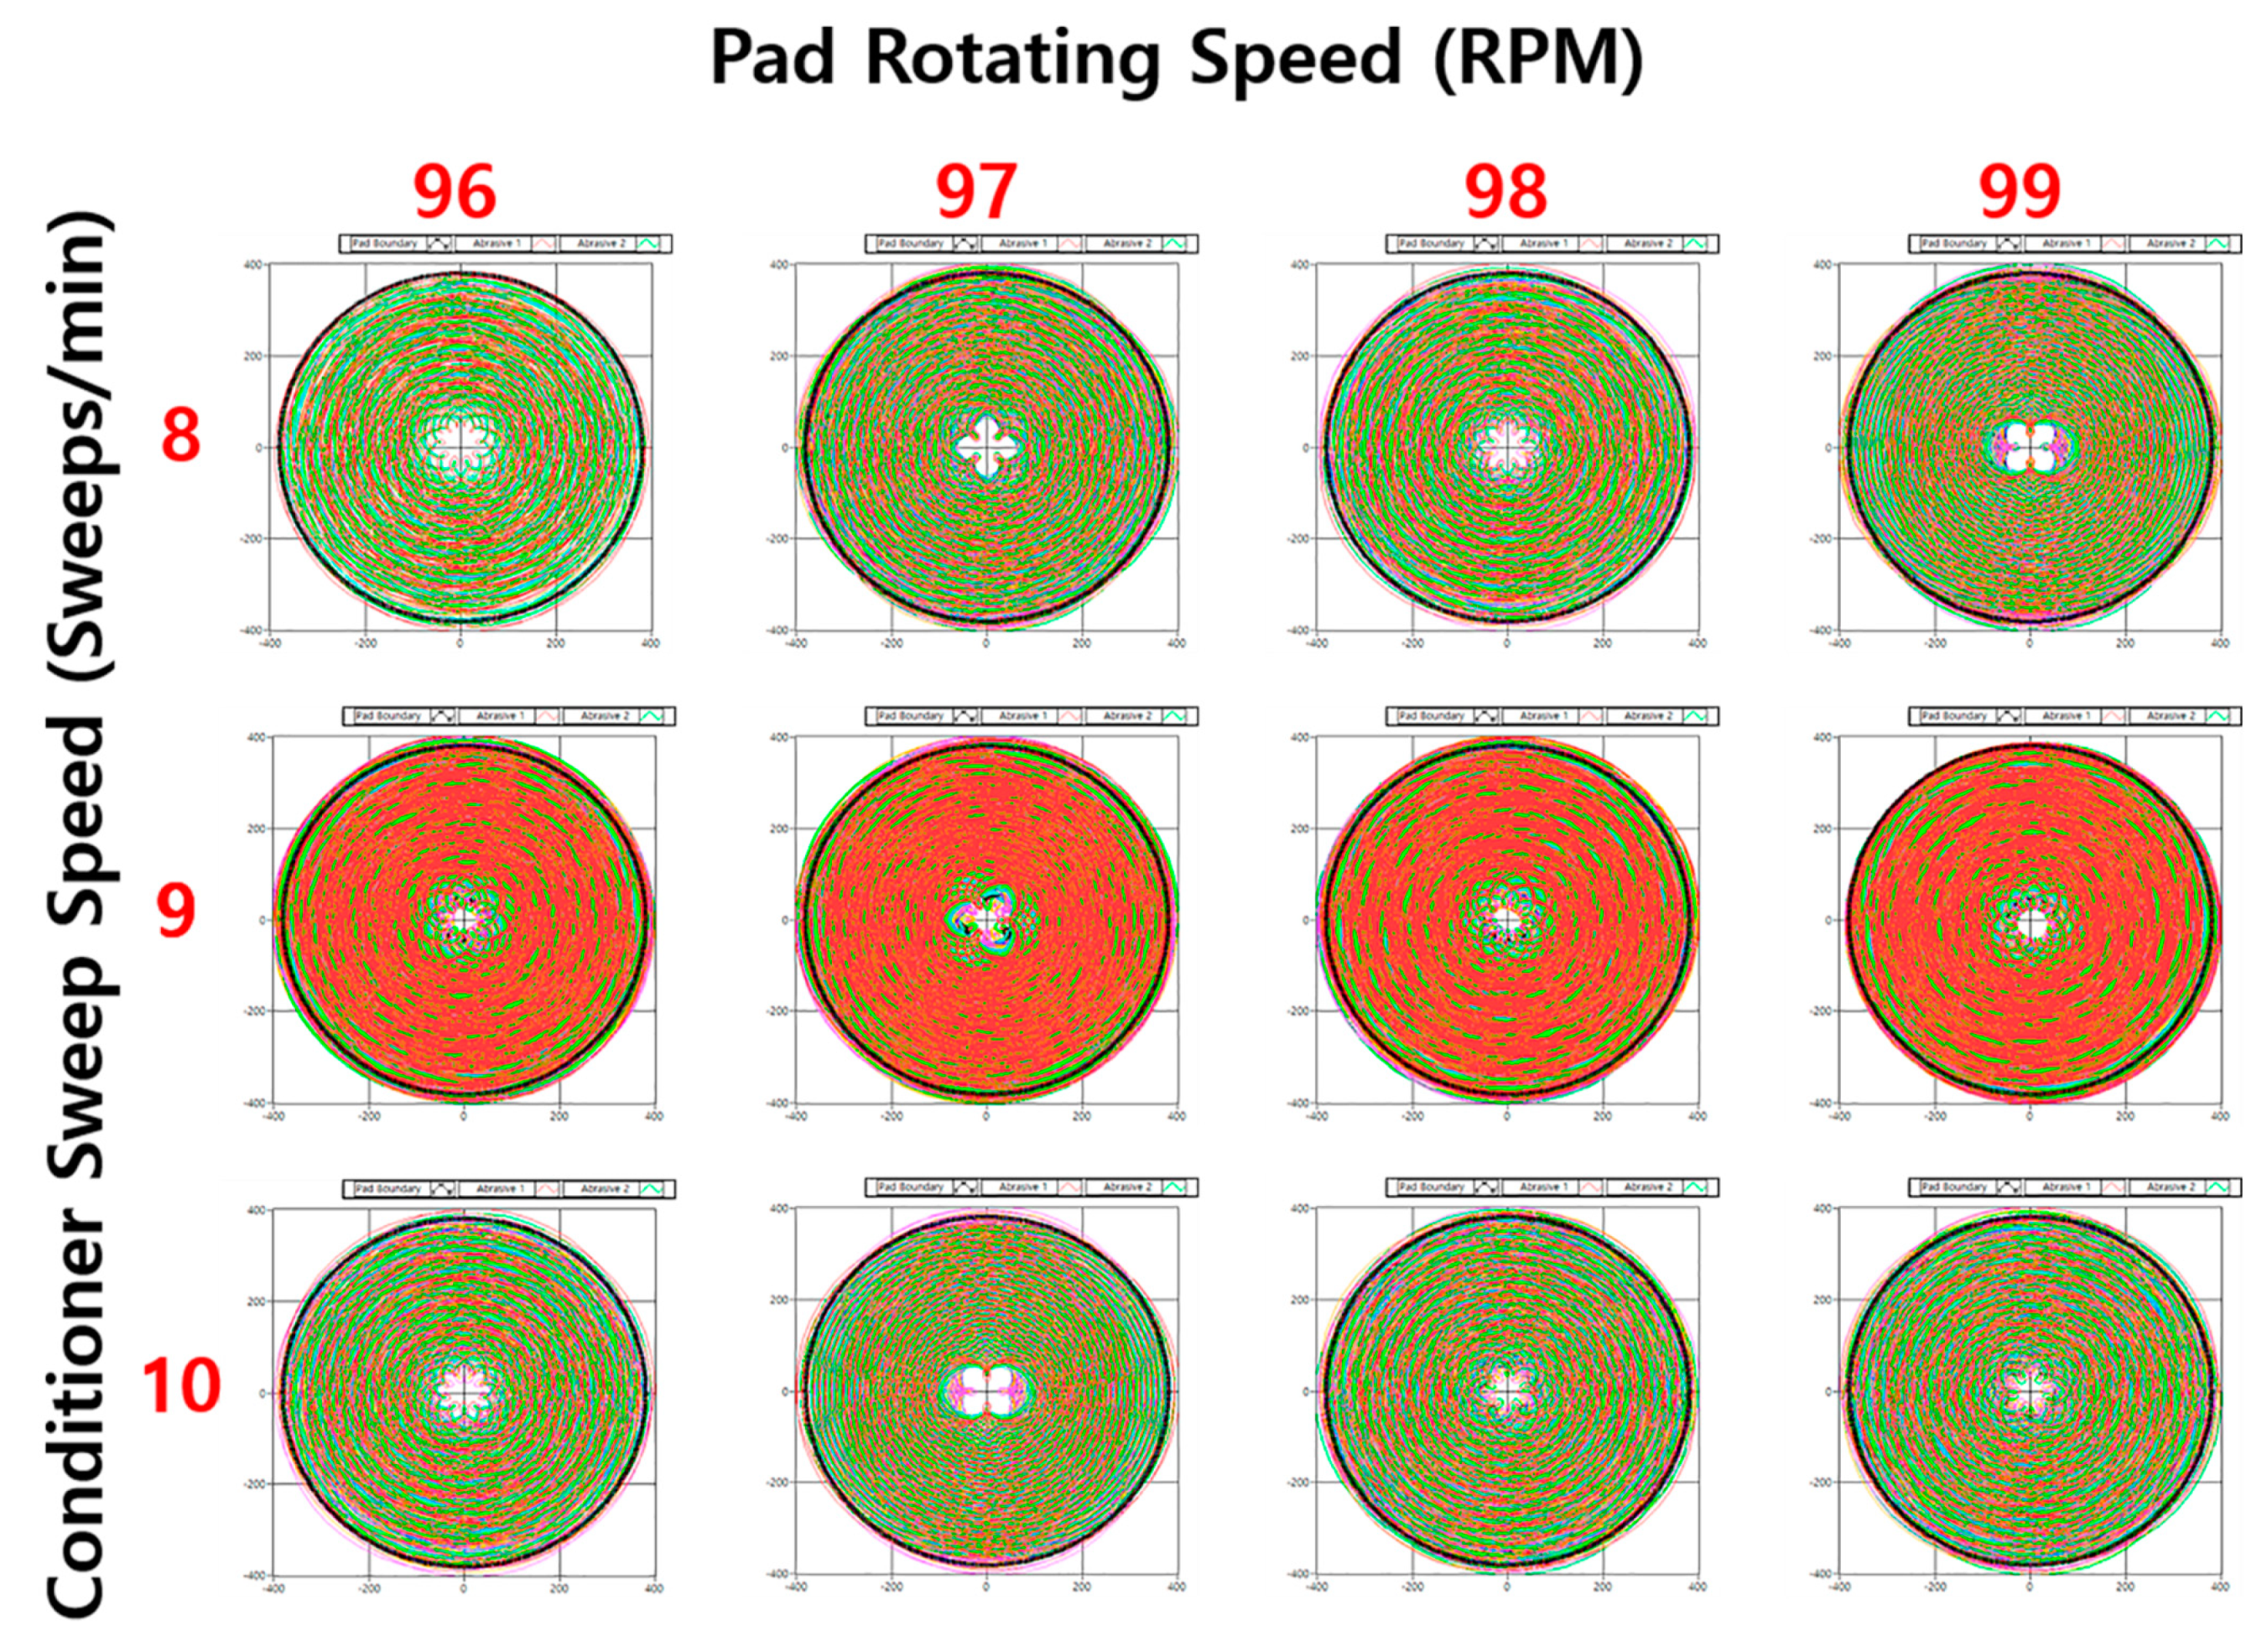
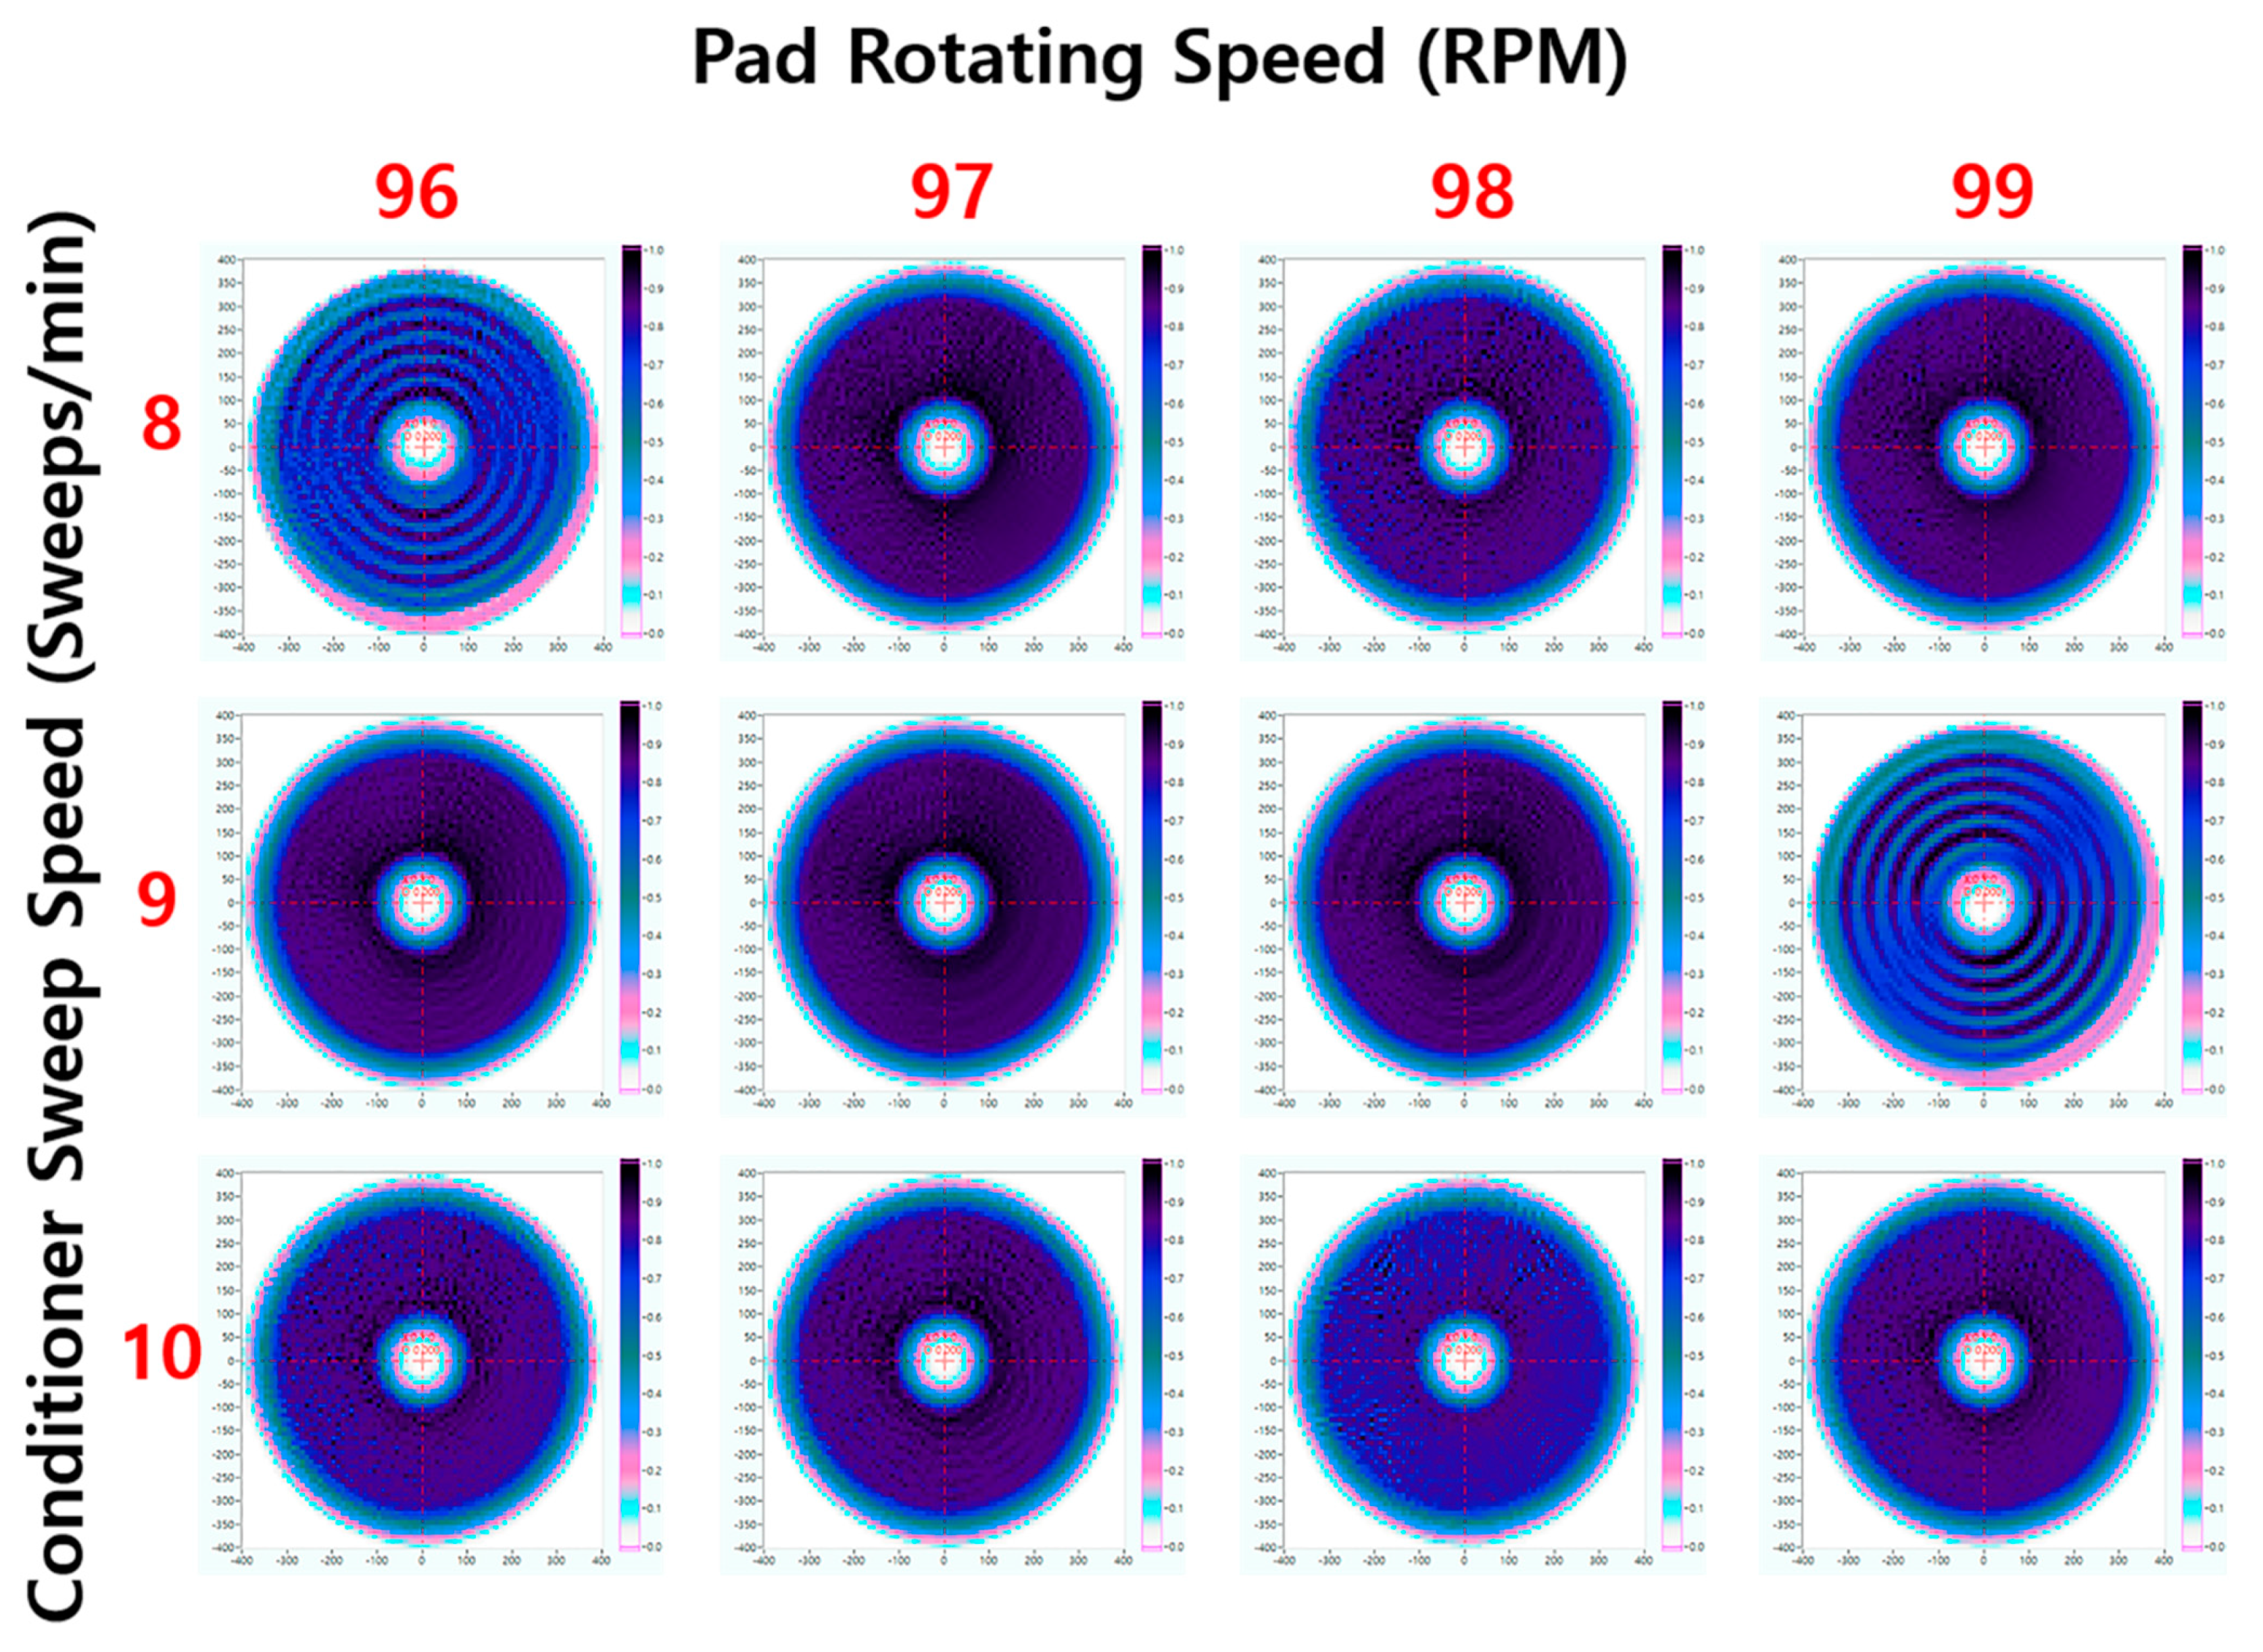
2.2. Pad Wear Shape Simulation
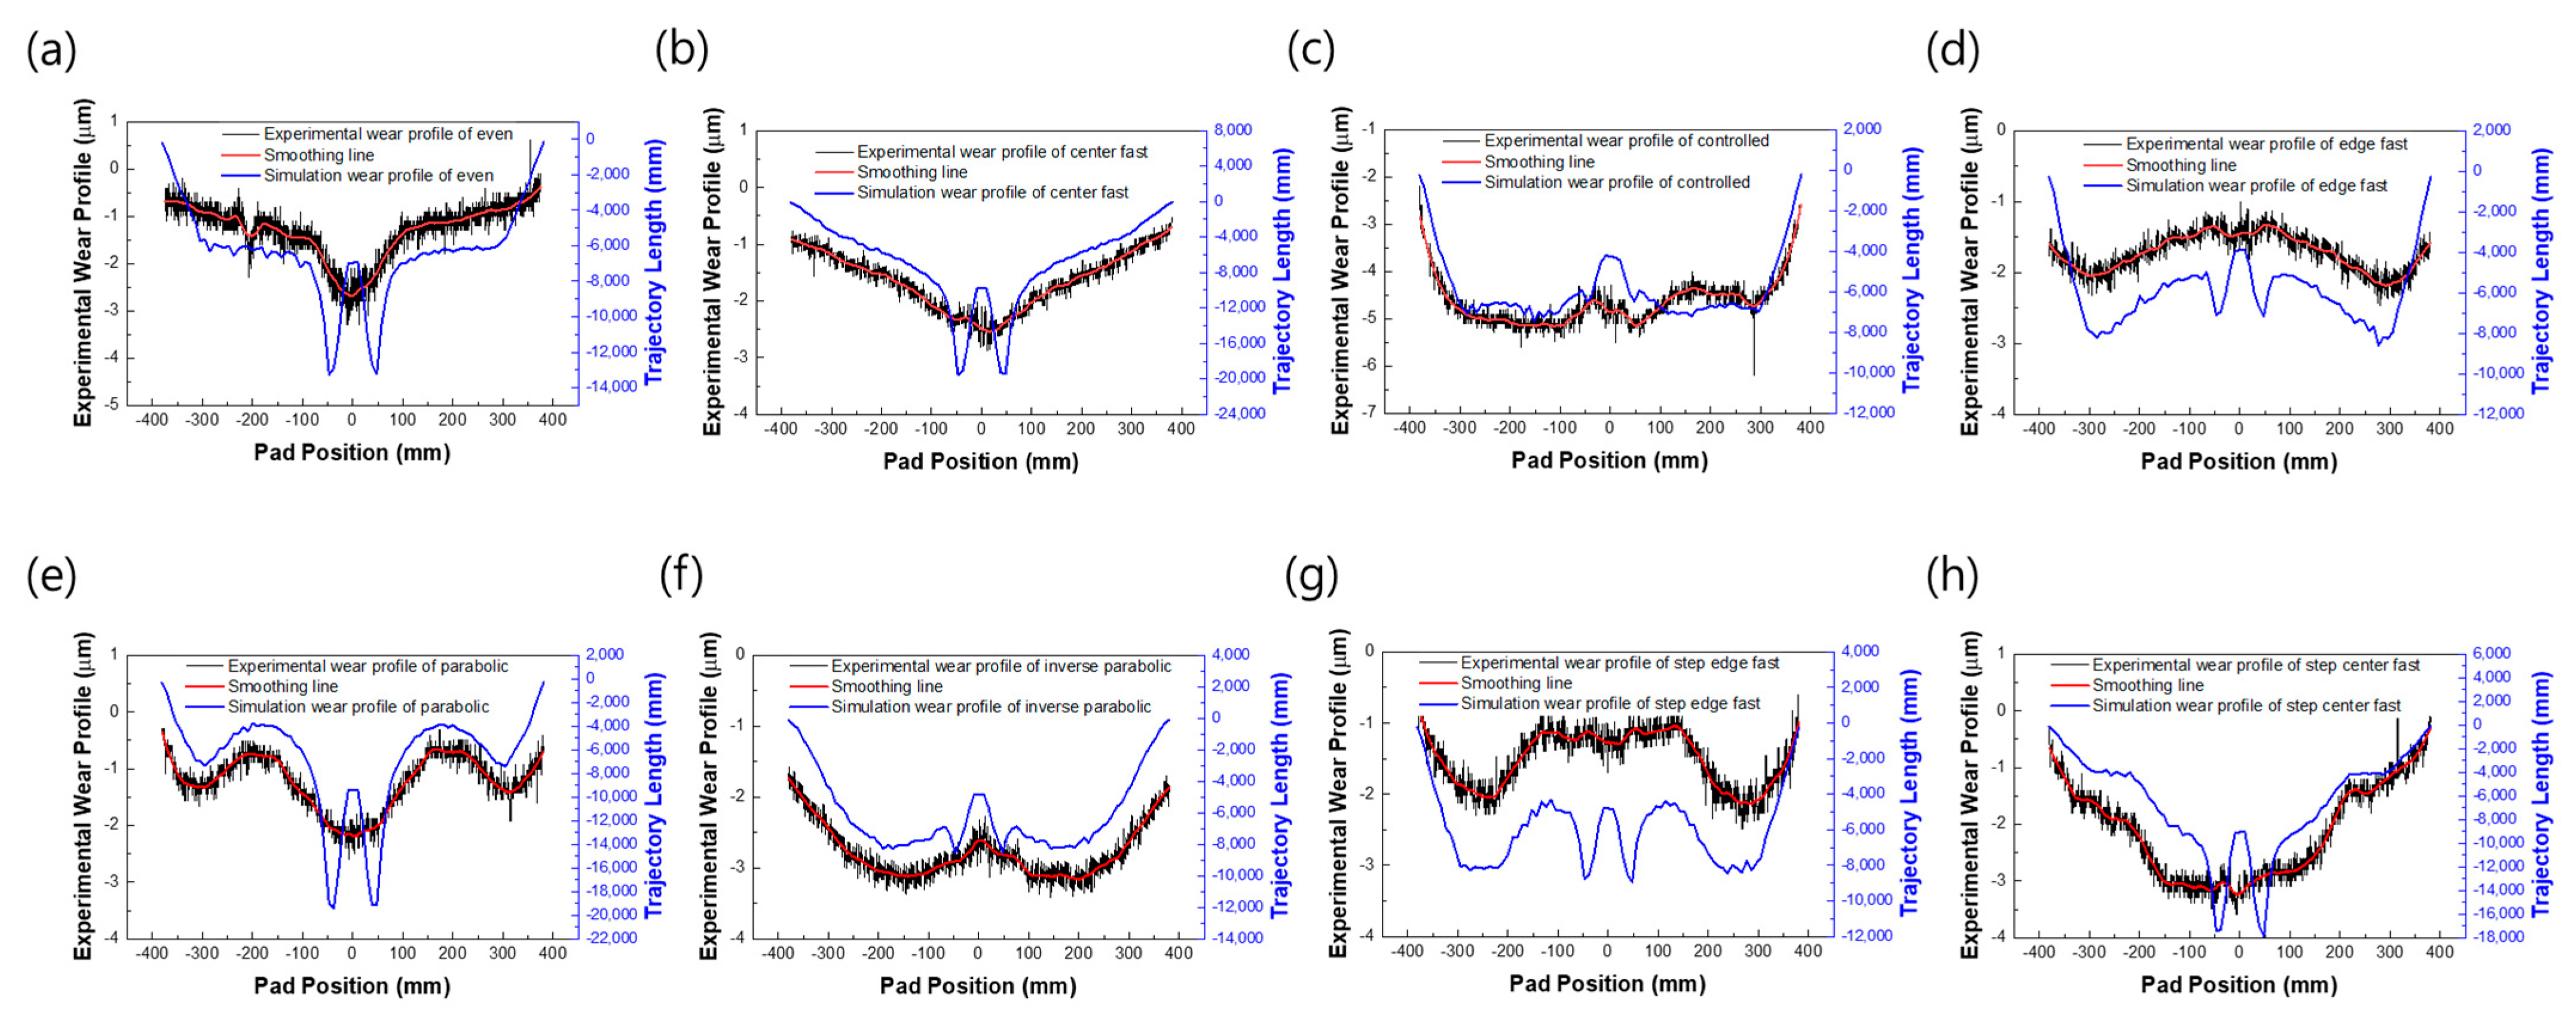
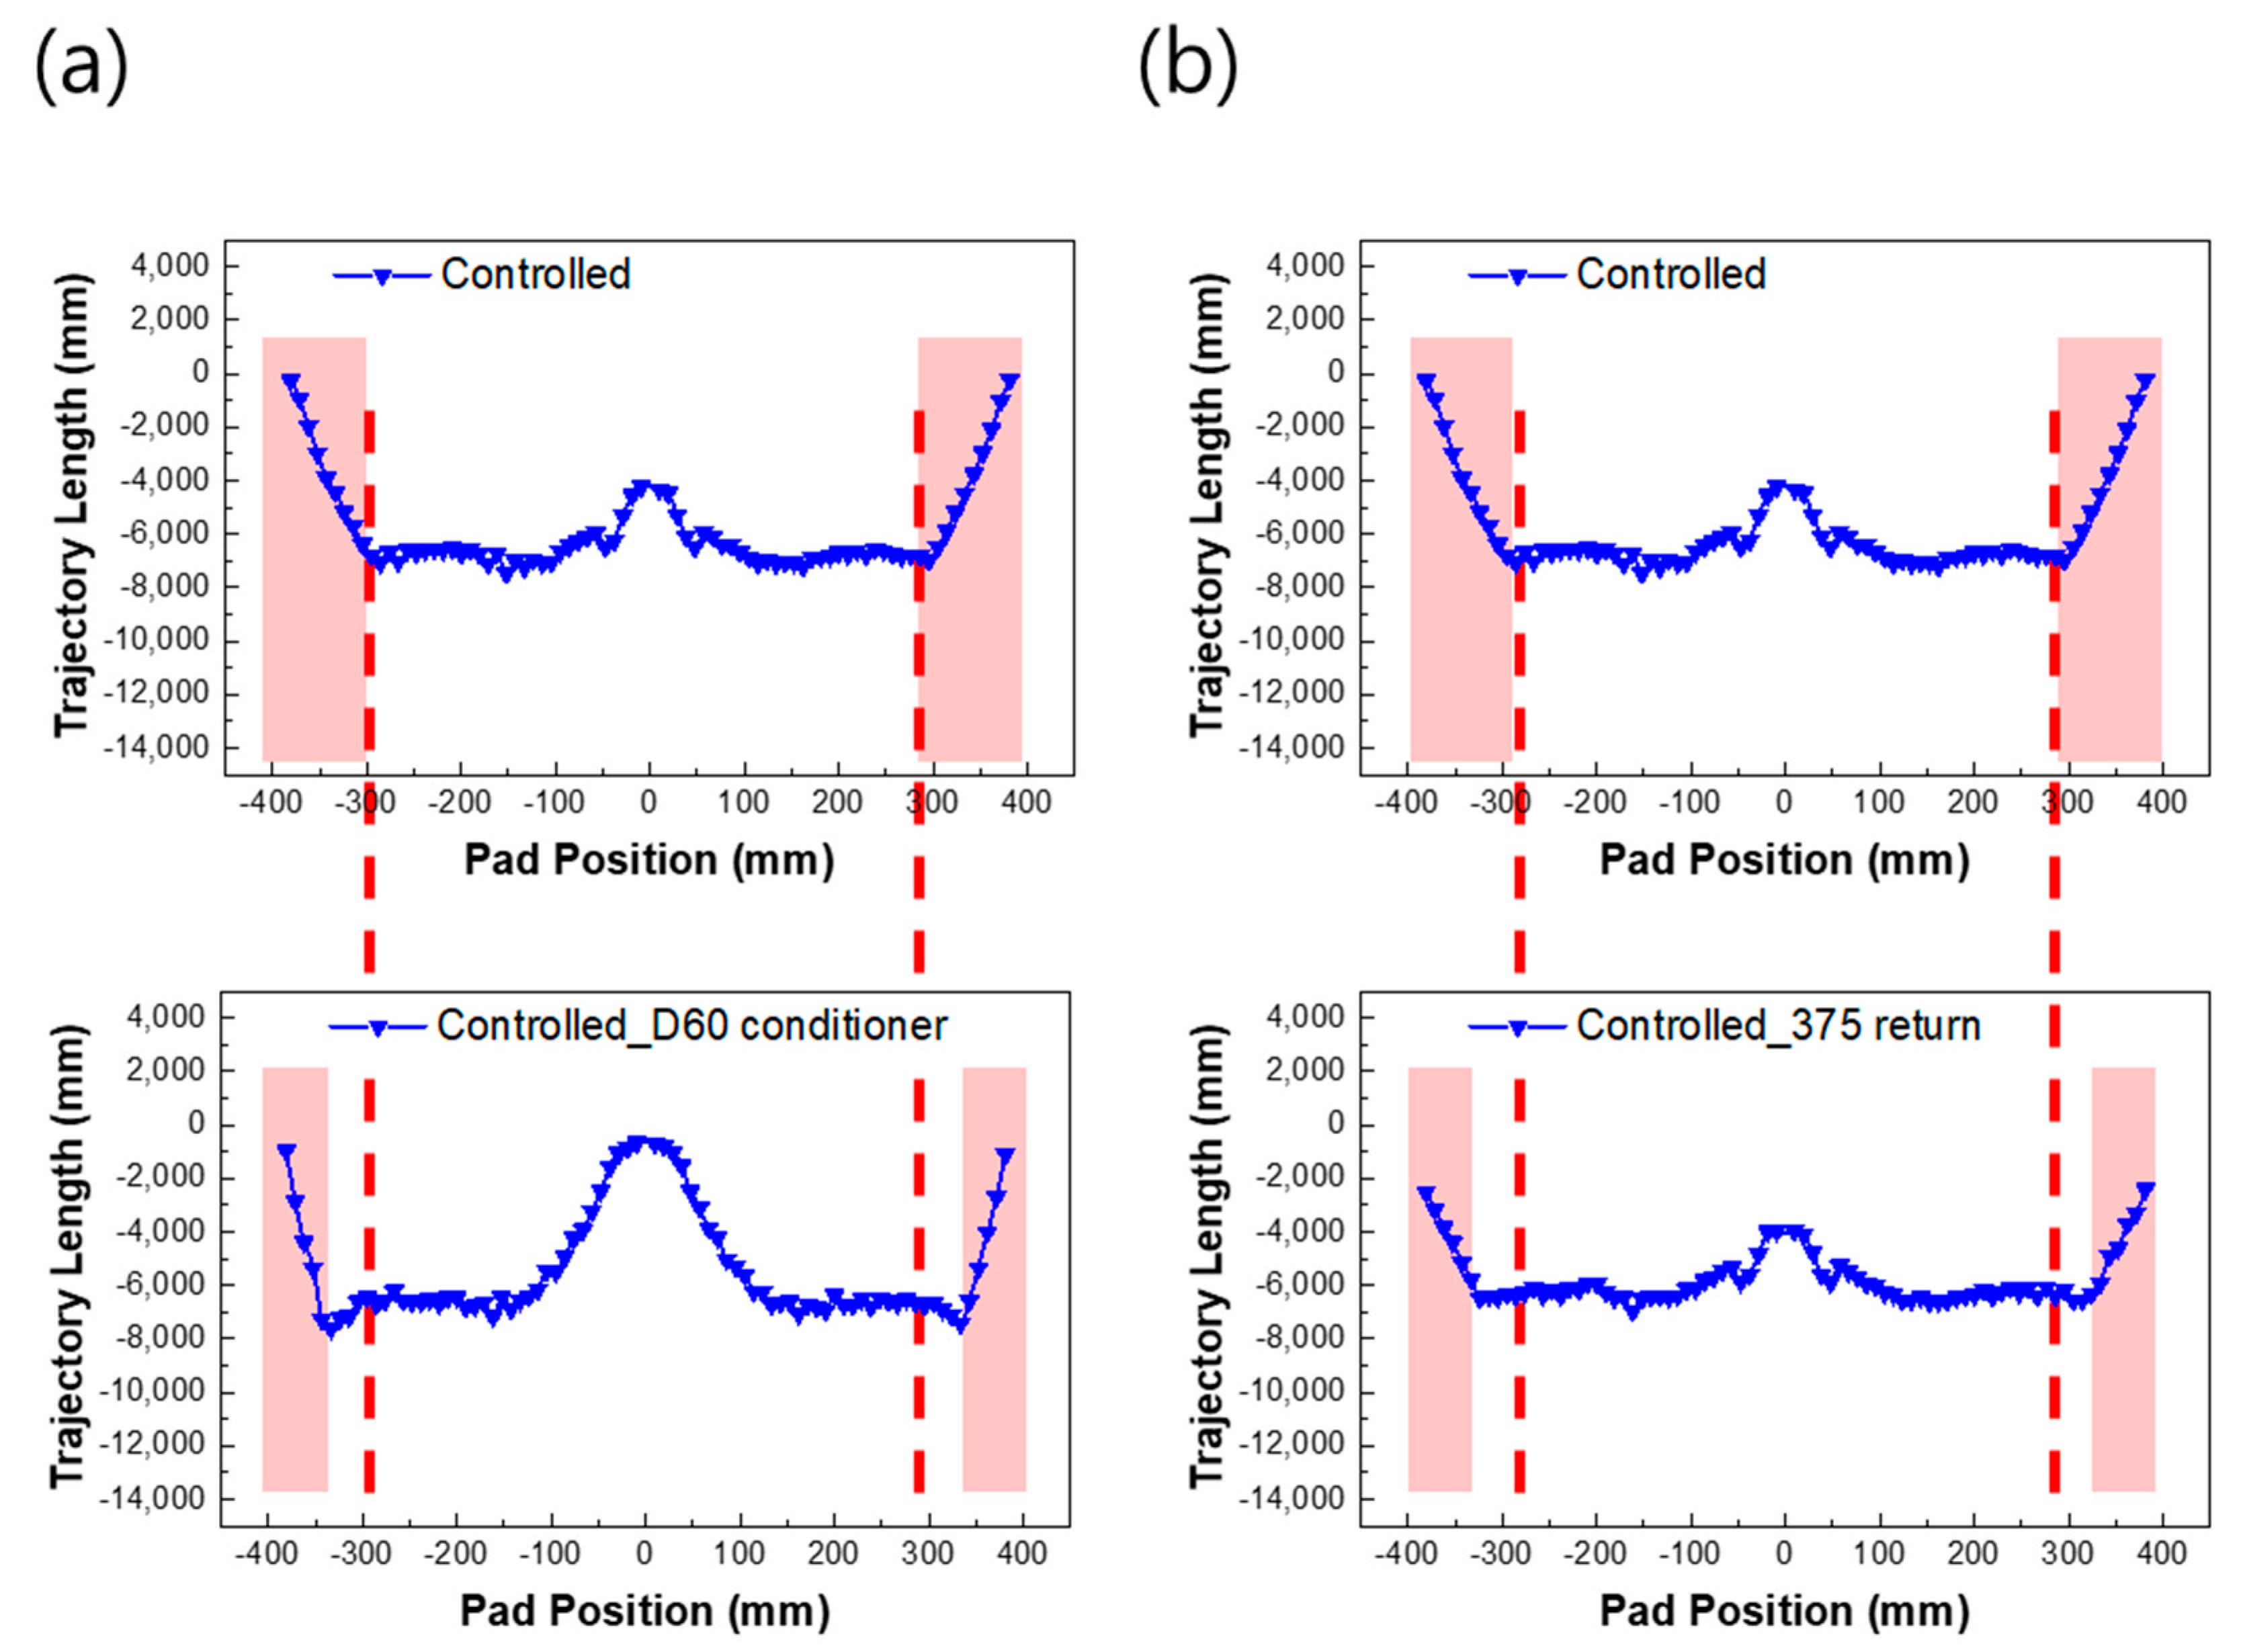
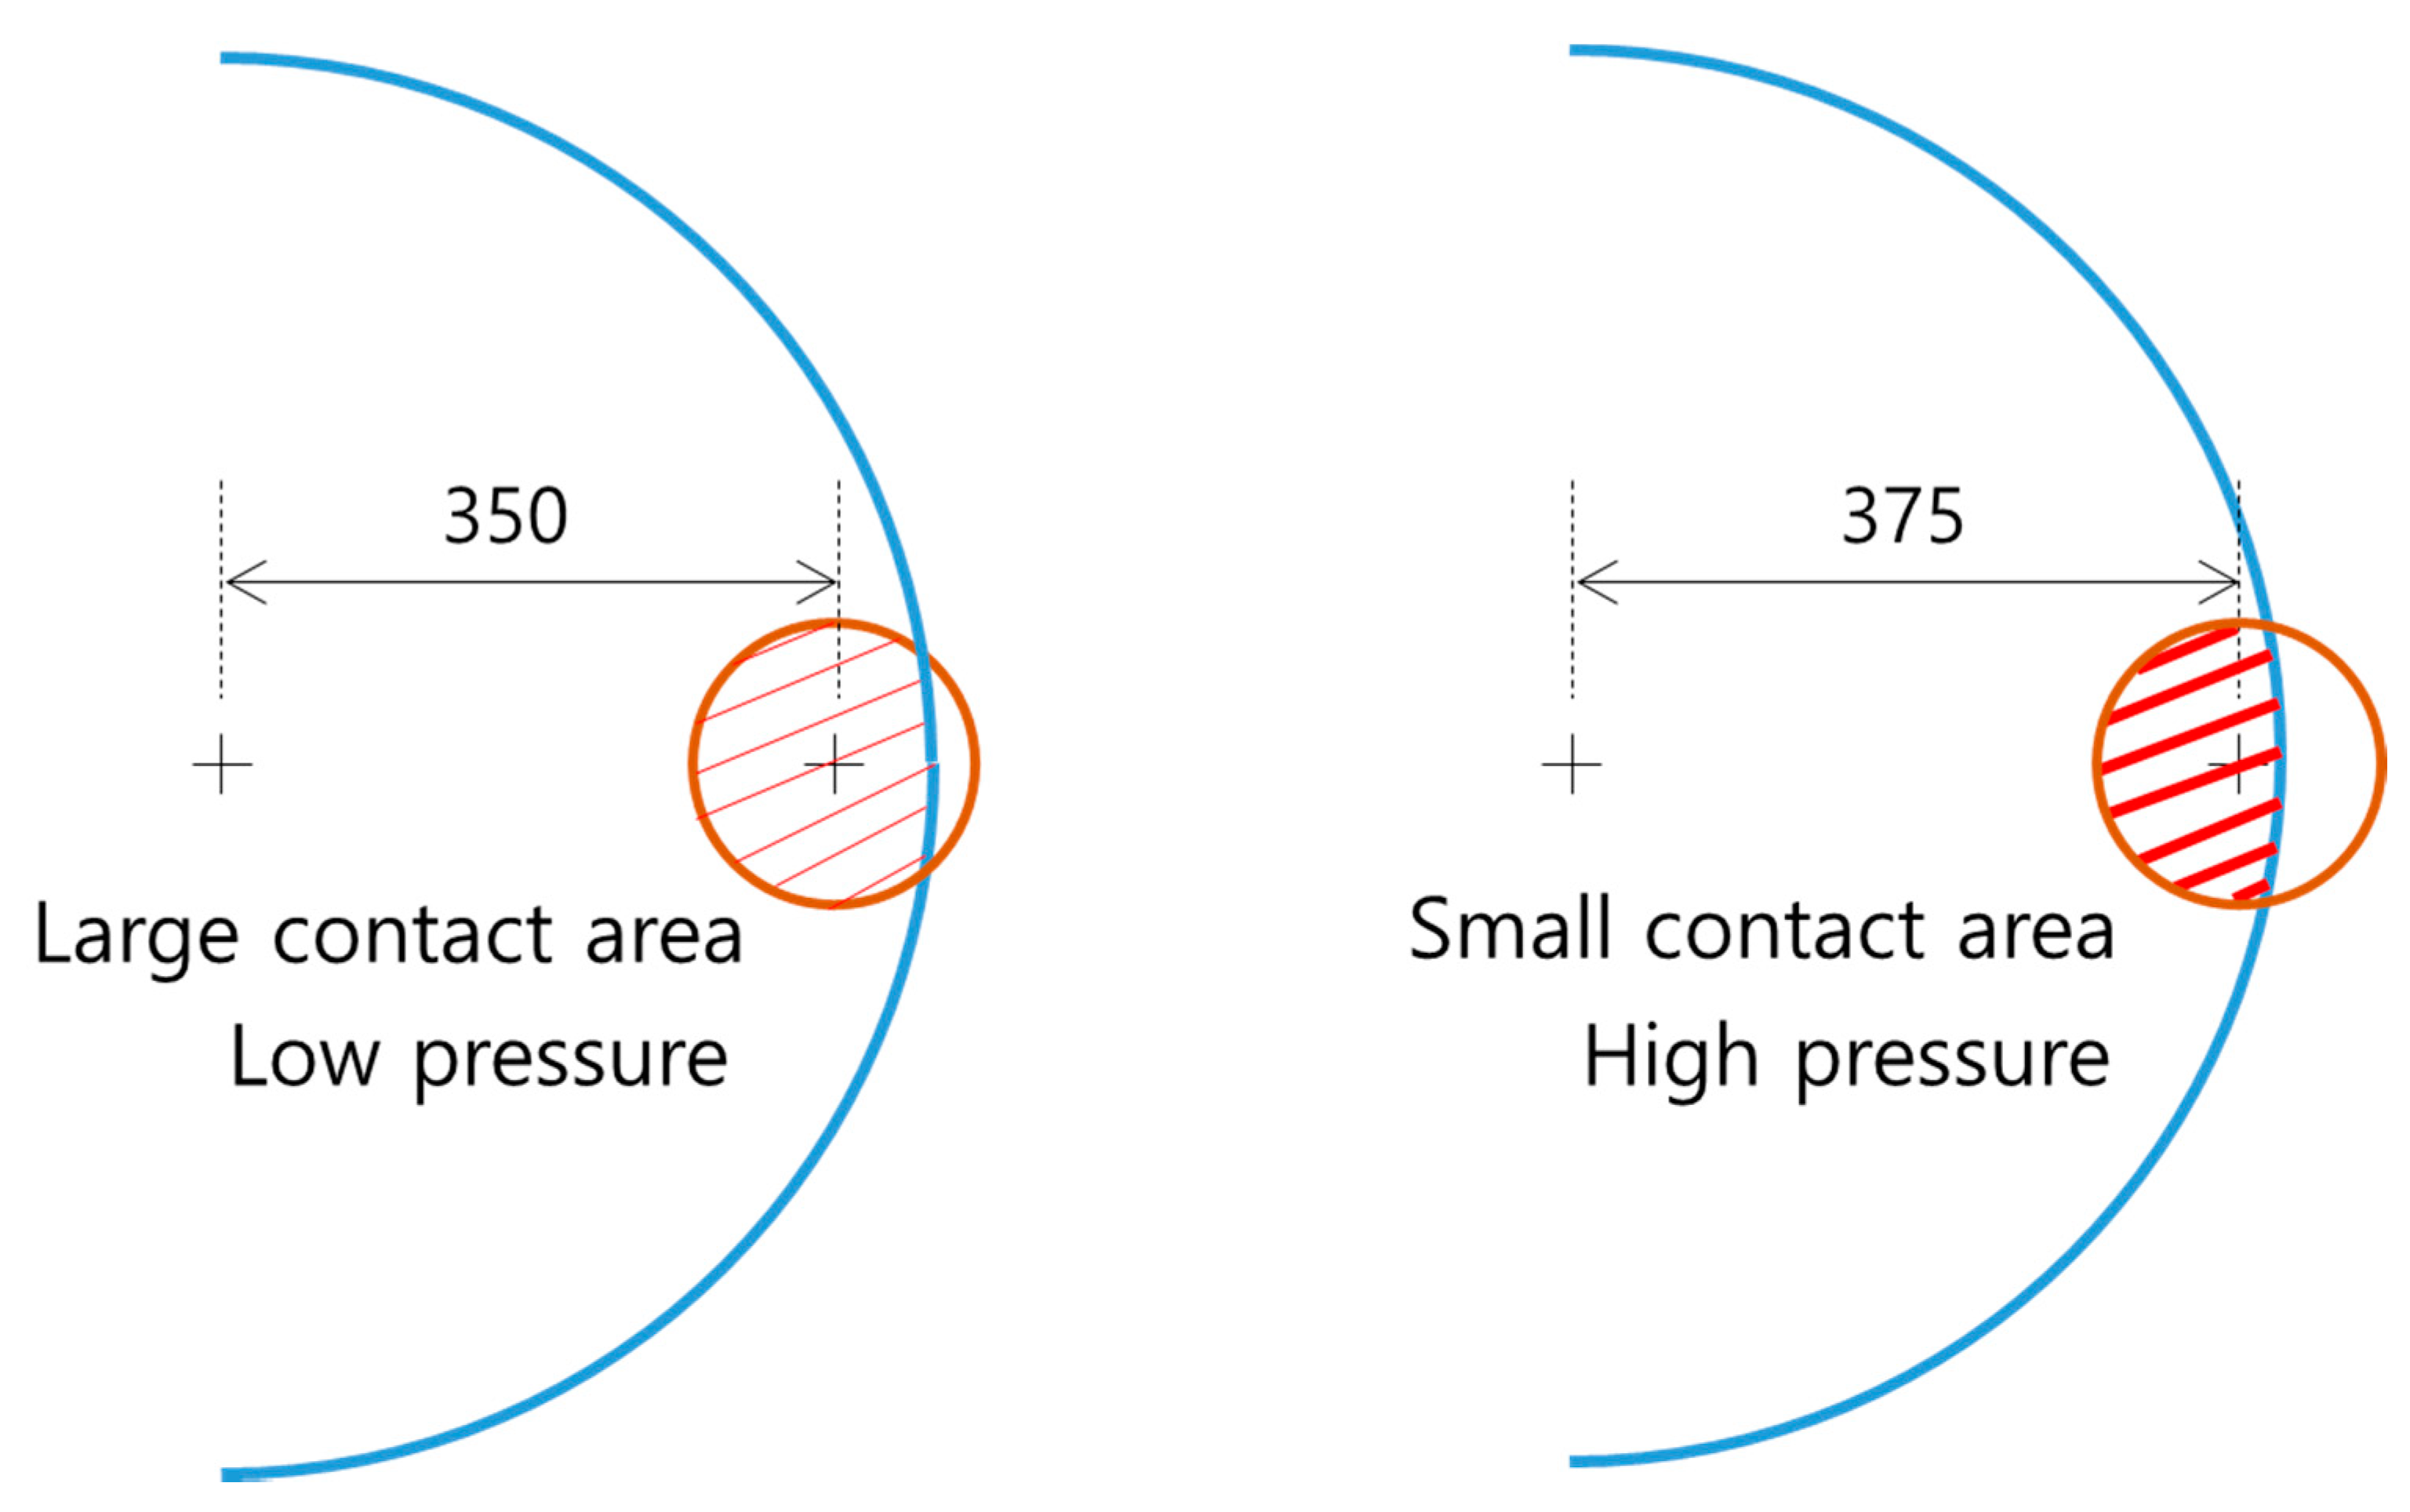
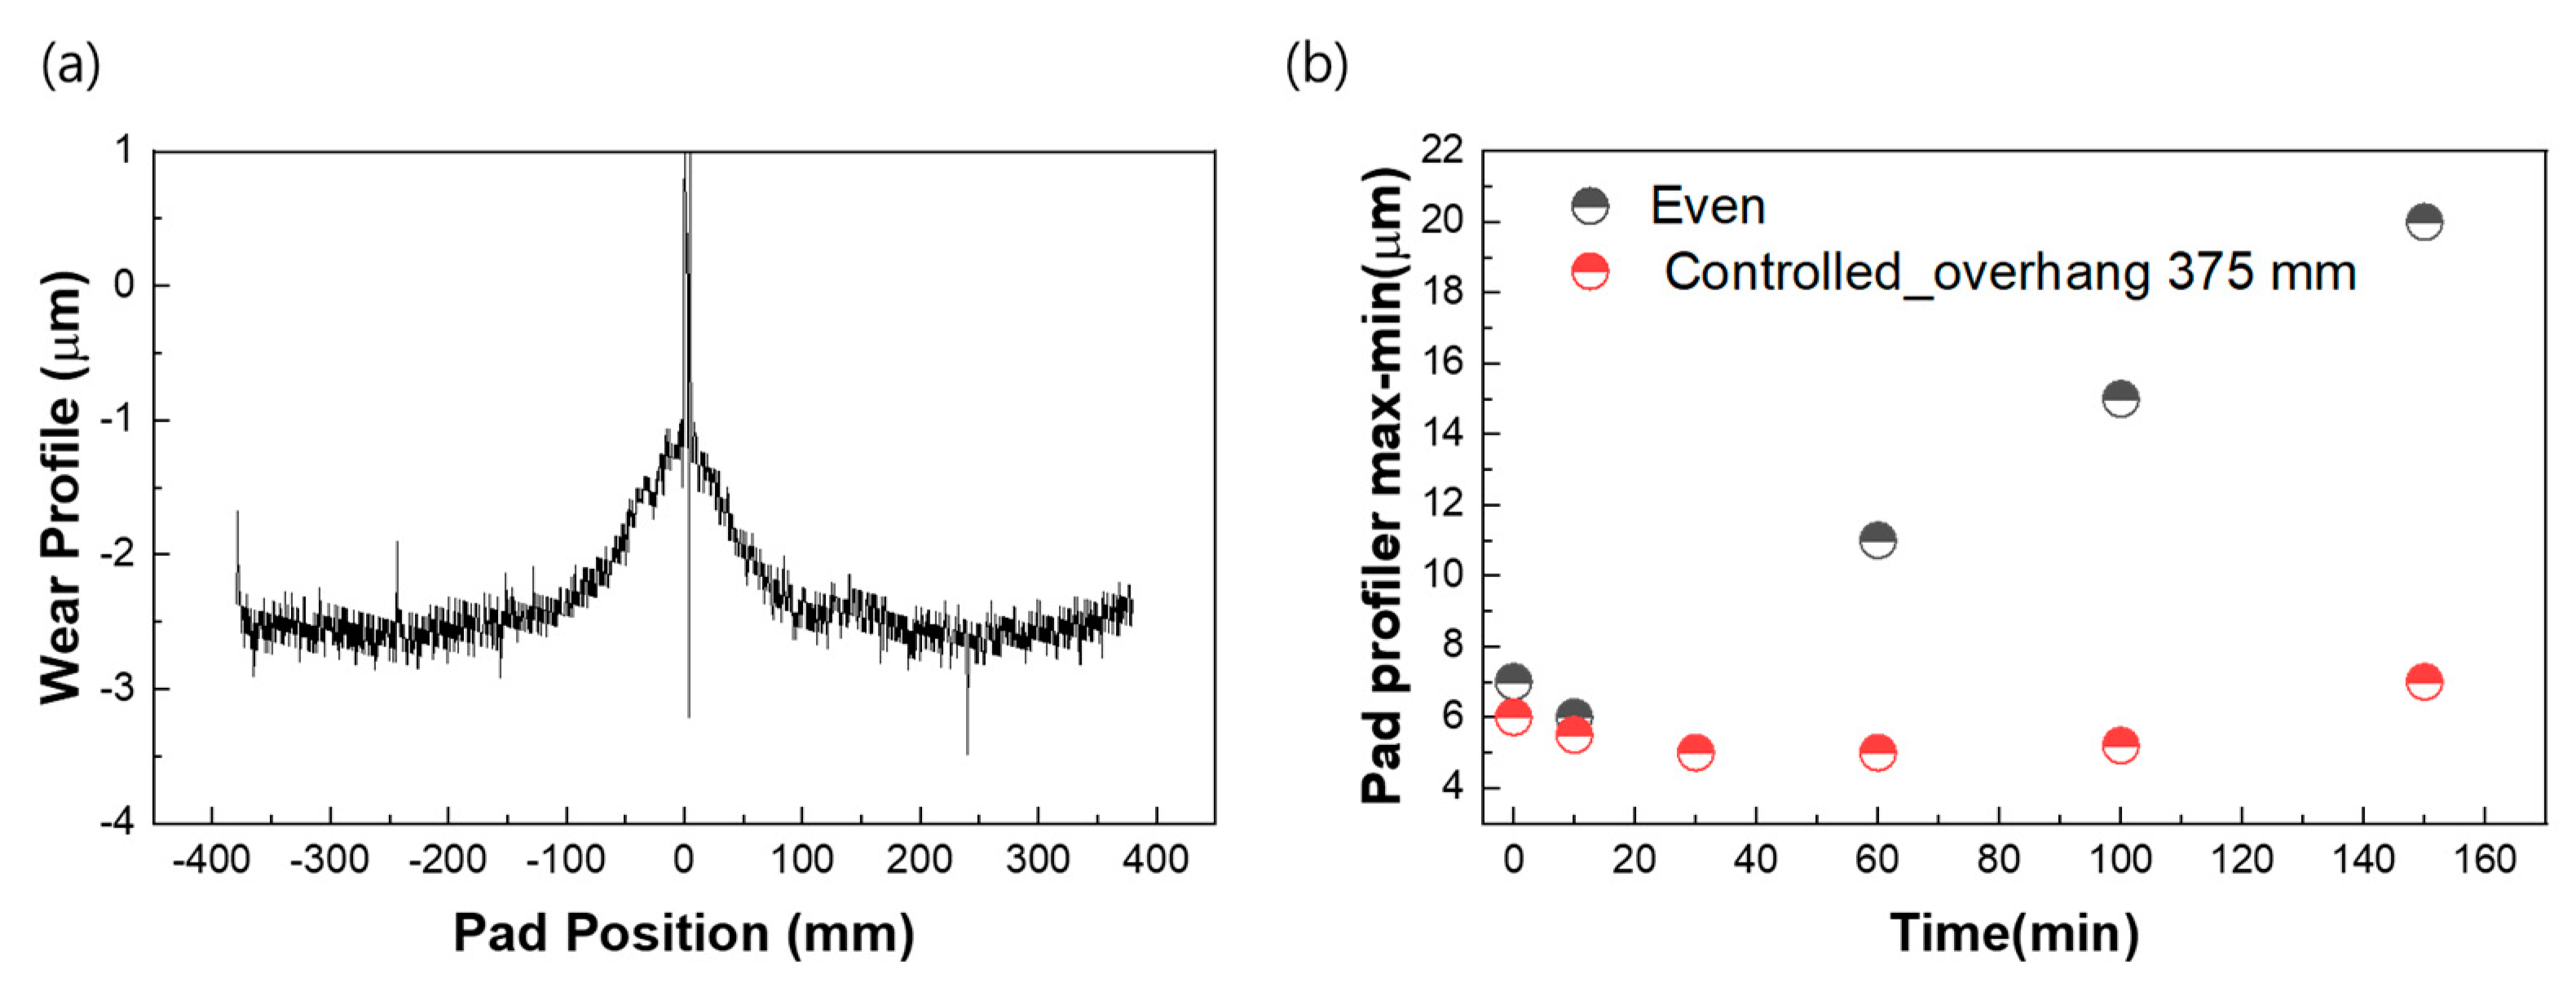
Figure 4a shows a schematic of the kinematic model related to the rotation of the conditioner disc, the sweep of the conditioning arm, and the rotation of the pad, where the distance between the rotational centers of the pad and the swing arm hinge is defined as L. The conditioner disc rotates in the same direction at an angular velocity ωc, sweep velocity of the swing arm ωs, and pad at angular velocity ωp. A conditioning arm of length l sweeps back and forth between the center of the pad and the edge of the pad.
The kinematics of an abrasive at point C on a conditioner disc can be described by the following equations:
R = L + l + r = { L x ( t ) + l x ( t ) + r x ( t ) }   ɩ ^ + { L y ( t ) + l y ( t ) + r y ( t ) }   J ^ ,
L x ( t ) = L cos ( θ 1 + ω p t ) ,
L y ( t ) = L sin ( θ 1 + ω p t ) ,
l x ( t ) = l cos ( θ 1 + θ 2 + ( ω p + ω s ) t ) ,
l y ( t ) = l sin ( θ 1 + θ 2 + ( ω p + ω s ) t ) ,
r x ( t ) = r cos ( θ 1 + θ 2 + θ 3 + ( ω p + ω s + ω c ) t ) ,
r y ( t ) = l sin ( θ 1 + θ 2 + θ 3 + ( ω p + ω s + ω c ) t )
where θ 1 ,   θ 2 ,   and   θ 3 denote the initial angular position of the center of the swing arm with respect to the center of the pad, the initial angular position of the center of the conditioner disc, and the initial angular position of an abrasive on the conditioner disc, respectively.
In this study, l and L are set the same. Figure 4b shows a schematic of the concept of integrating the trajectory made in a certain area where the working diamond abrasives are defined. We calculated the relative wear amount for the areas of dx and dy, and then integrated the length of the trajectory in the area of dx and dy. The total length trajectory is proportional to the amount of pad wear, which can represent the wear profile.

3. Results

We developed a prediction simulation to visualize the center of the conditioning disc, the trajectory of the working diamond abrasives, and the wear amount color contour using LabVIEW (National Instruments, Austin, TX, USA). Figure 5a shows an example of visualizing the trajectory made by the center of the conditioner disc on the pad. Figure 5b shows the visualization results of the trajectory of the entire working diamond abrasives. Figure 5c shows the wear amount color contour on a 2D plane. All the subsequent interpretations were performed on the basis of the aforementioned theory. Subsequently, the results of the prediction of the pad wear amount were compared with the profile in the pad radial direction considering the symmetrical motion characteristics of the CMP.
Based on the developed simulation shown in the example of Figure 5, the change in the pad shape was predicted for the rotational speed of the disc, the rotational speed of the pad, and the sweep speed of the swing arm. First, the rotation speed of the conditioner disc was fixed at 103 rpm, and the effects of the rotation speed of the pad and the sweep speed on the relative motion were analyzed. Figure 6 shows the results of the center trajectory of the conditioner disc under 12 conditions in which the pad speed was varied from 96 rpm to 99 rpm at a rate of 1 rpm, and the sweep speed was increased in steps of 1 sweep/min from 8 to 10 sweeps/min. When the sweep speed was 8 sweeps/min and the rotation speed of the pad was 96 rpm, the trajectory of the center did not spread evenly over the pad; it moved repeatedly in a certain trajectory. The same phenomenon was observed at 99 rpm and 9 sweeps/min. If the sweep speed is a divisor of the rotational speed of the pad, the center trajectory of the conditioner is not evenly distributed across the pad, and only the same path moves.
In Figure 7, the trajectory of all the working diamond abrasives on the pad is confirmed, and the trajectory is unevenly distributed over the entire surface of the pad under the two conditions mentioned in Figure 6. Figure 8 shows the result of integrating this within a 1 cm square meter and expressing it as a color contour. In Figure 6, under a pad rotation speed of 96 rpm and a sweep speed of 8 sweep/min, the shape of the pad worn by the entire working diamond abrasives is uneven. Under the other conditions, except for the two conditions, the pad is expected to wear evenly over its entire surface. When the above conditions are applied to the actual process, wafer polishing may be adversely affected by the nonuniform wear and shape of the pad. This suggests that the pad shape may change into an undesired shape in some cases, despite a slight change of 1 rpm. Based on these results, it is necessary to set the sweep speed such that it is not a divisor of the rotational speed of the pad.
To confirm that the developed pad wear prediction simulation is in good agreement with the actual experimental results, a comparison of the predicted shape and the actual shape was made under the eight conditions explained in the Materials and Methods section. In addition to the even condition with the same ROT in all the zones, seven conditions were verified: linear center fast, linear edge fast, controlled, parabolic, inverse parabolic, step edge fast, and step center fast. For various types of ROT, we confirmed whether the actual pad wear shape and the shape predicted by the developed simulation match. Figure 9a–h show the wear profile after the conditioning processes and the wear shape predicted by the developed simulation. Under all the conditions, the position of the inflection point and the overall shape are similar, except for the center region. In the case of a linear edge fast, a pad profile with an inflection point where the inclination of the pad shape changes at a distance of 300 mm from the center was obtained, and the prediction result also shows that the inflection point occurs at the same location. In addition, even in the case of a parabolic shape, as shown in Figure 9e, the shape is similar to the simulation result despite the complex shape in which the slope of the pad shape changes several times. The pad shape predicted by the developed simulation coincided well with the actual shape.
The controlled condition shown in Figure 9d is the condition where the pad is kept as flat as possible. The flat shape is maintained except for approximately 100 mm of the edge of the pad; however, the amount of wear of the pad decreases toward the edge of the pad in the area of 100 mm of the edge, and the pad becomes relatively thick. If the edge of the disc does not go over the edge of the pad sharply, the pad will have a kinematically W shape [18]. This value corresponds to the length of the diameter of the conditioner. As shown in Figure 9, approximately 100 mm of the edge zone has a shape with a slope under all conditions. To reduce the non-flat zone of the edge, we can use a conditioner disc with a small diameter or move the center of the conditioner disc closer to the edge of the pad. The graph in Figure 10a shows the result obtained when a conditioner with a diameter of 100 mm is applied under a controlled condition, and the graph below is the result obtained using a conditioner with a diameter of 60 mm. If the conditioner disc size is reduced from 100 mm to 60 mm by simulation, the slope zone decreases, as shown in Figure 10a. If the disc diameter is 100 mm, the inclined zone starts at 300 mm from the center of the pad. On the other hand, when the disc diameter is 60 mm, the start of the inclined zone changes to 340 mm, which is the difference in the size of the disc. Second, if the center of the conditioner disc is returned at 375 mm from the center of the pad, the slope zone is reduced compared with the return condition of 350 mm, as shown in Figure 10b and the graph below. The starting zone of the slope moves to the edge by 25 mm, which is the amount of change in the return position. However, because the developed simulation predicts the shape as a function of only the trajectory density, it is quite different from the actual pad shape. The left schematic shown in Figure 11 corresponds to when the return point is set to 350 mm. Compared with the case where the return point is set to 375 mm, the effect of increasing the pressure is insignificant owing to the large contact area and is largely consistent with the predicted results. On the other hand, if the amount of overhang is increased, as shown in the schematic on the right of Figure 11, the contact area rapidly narrows, and the pressure increases dramatically. The wear amount proportionally increases with the increase in the pressure [1]. Therefore, unlike the result of the trajectory density, in the real process, the pad edge area of the wear profile is flat, as shown in Figure 12a. As mentioned in the introduction, it is important to make the flat zone larger in terms of maintaining the pad shape, which is one of the main purposes of conditioning. The conditioning process was carried out for 2 h under the even condition and the 375 mm return point condition in which the overhang was applied under the controlled condition. Figure 12b shows the maximum and minimum pad thickness values measured over time, excluding the 40 mm radius of the center. As shown in the results, under the condition where the ROT control for the conditioning zone and the edge slope zone through the overhang are removed, the maximum and minimum deviations are 10 μm or less, despite performing the conditioning process for 2 h. On the other hand, under the even condition, the deviation becomes greater than 20 μm after 2 h of conditioning. As the conditioning time increases, the magnitude of the deviation between the two conditions increases. Although the developed simulation does not reflect the pressure, the limitations are clearly visible; nevertheless, it is still possible to quickly predict the wear shape of the pad.

4. Summary

In this paper, we presented the kinematic modeling of three-motion disc rotation, pad rotation, and sweep of the conditioning arm in CMP conditioning. Based on this, a simulation was developed to visualize the center trajectory of the disc and the entire trajectory of the working diamond abrasives. In addition, the trajectory density was quantified by integrating the trajectory of the working diamond abrasives within a certain area, and based on this, a simulation to predict the wear shape of the pad was developed. Based on the developed simulator, the trajectory with respect to the pad rotation speed and the sweep speed was visualized, and when the sweep speed became a divisor of the pad rotation speed, the center trajectory did not move evenly across the pad and only moved in a specific trajectory. Furthermore, the predicted results and the actual shape of the pad profile were compared and analyzed in the simulation developed for eight pad wear patterns through ROT control using an in situ pad profile device. The predicted results and the actual shape of the pad profile were found to have similar overall shapes, and in particular, the positions of the inflection points where the inclination changes were largely identical. The shape of the pad could be maintained, which is the purpose of CMP conditioning, by changing the size of the disc and the returning point. In addition, as the overhang length increased, the pressure effect increased, and it was experimentally proven that a flat area can be ensured over the entire pad. The final results showed that the maximum pad thickness deviation was less than 10 μm even after 2 h of conditioning. The developed simulation is expected to not only be able to quickly verify the various conditions of conditioning, but also ultimately help in deriving conditions that can maintain a constant shape of the pad. Maintaining the pad shape can help maintain the shape of the wafer in the CMP process.

Supplementary Materials

The following are available online at https://0-www-mdpi-com.brum.beds.ac.uk/article/10.3390/app11104358/s1, Videos S1 and S2: Pad profile measuring system.

Author Contributions

Conceptualization and developed the idea, H.C. and H.K.; methodology, H.C., H.K., and T.L.; validation, D.K. and T.L.; investigation, D.K.; resources, H.K.; writing—original draft preparation, H.C.; writing—reviewing, H.K.; supervision, H.K.; project administration, H.K. All authors have read and agreed to the published version of the manuscript.

Funding

This study has been conducted with the support of the Korea Institute of Industrial Technology as "Research equipment coordination project (KITECH JH-21-0008)". Additionally, this research was funded by the Ministry of Trade, Industry and Energy of the Republic of Korea (grant number 20013589).

Institutional Review Board Statement

Not applicable.

Informed Consent Statement

Not applicable.

Acknowledgments

We thank Saesol Diamond Co. for providing us the diamond disc.

Conflicts of Interest

The authors declare no conflict of interest.

References

  1. Preston, F.W. The Theory and Design of Plate Glass Polishing Machines. J. Soc. Glass Technol. 1927, 11, 227–228. [Google Scholar]
  2. Hooper, B.; Byrne, G.; Galligan, S. Pad conditioning in chemical mechanical polishing. J. Mater. Process. Technol. 2002, 123, 107–113. [Google Scholar] [CrossRef]
  3. Tsai, M.-Y.; Chen, S.-T.; Liao, Y.-S.; Sung, J. Novel diamond conditioner dressing characteristics of CMP polishing pad. Int. J. Mach. Tools Manuf. 2009, 49, 722–729. [Google Scholar] [CrossRef]
  4. Borucki, L.J.; Witelski, T.; Please, C.; Kramer, P.R.; Schwendeman, D. A theory of pad conditioning for chemical-mechanical polishing. J. Eng. Math. 2004, 50, 1–24. [Google Scholar] [CrossRef]
  5. Sun, T.; Borucki, L.; Zhuang, Y.; Philipossian, A. Investigating the effect of diamond size and conditioning force on chemical mechanical planarization pad topography. Microelectron. Eng. 2010, 87, 553–559. [Google Scholar] [CrossRef]
  6. Bozkaya, D.; Müftü, S. A Material Removal Model for CMP Based on the Contact Mechanics of Pad, Abrasives, and Wafer. J. Electrochem. Soc. 2009, 156, H890–H902. [Google Scholar] [CrossRef]
  7. Tsai, M.Y.; Chen, W.K. Effect of CMP conditioner diamond shape on pad topography and oxide wafer performances. Int. J. Adv. Manuf. Technol. 2011, 55, 253–262. [Google Scholar] [CrossRef]
  8. Srinivasa-Murthy, C.; Wang, D.; Beaudoin, S.; Bibby, T.; Holland, K.; Cale, T. Stress distribution in chemical mechanical polishing. Thin Solid Films 1997, 308–309, 533–537. [Google Scholar] [CrossRef]
  9. Wang, D.; Lee, J.; Holland, K.; Bibby, T.; Beaudoin, S.; Cale, T. Von Mises Stress in Chemical-Mechanical Polishing Processes. J. Electrochem. Soc. 1997, 144, 1121–1127. [Google Scholar] [CrossRef]
  10. Son, J.; Lee, H. Contact-Area-Changeable CMP Conditioning for Enhancing Pad Lifetime. Appl. Sci. 2021, 11, 3521. [Google Scholar] [CrossRef]
  11. Bajaj, R.; Desai, M.; Jairath, R.; Stell, M.; Tolles, R. Effect of polishing pad material properties on chemical mechanical pol-ishing (CMP) processes. MRS Online Proc. Libr. 1994, 337, 637–644. [Google Scholar] [CrossRef]
  12. Liang, H.; Kaufman, F.; Sevilla, R.; Anjur, S. Wear phenomena in chemical mechanical polishing. Wear 1997, 211, 271–279. [Google Scholar] [CrossRef]
  13. Fu, G.; Chandra, A. A model for wafer scale variation of material removal rate in chemical mechanical polishing based on viscoelastic pad deformation. J. Electron. Mater. 2002, 31, 1066–1073. [Google Scholar] [CrossRef]
  14. Tso, P.-L.; Ho, S.-Y. Factors influencing the dressing rate of chemical mechanical polishing pad conditioning. Int. J. Adv. Manuf. Technol. 2007, 33, 720–724. [Google Scholar] [CrossRef]
  15. Park, K.; Park, J.; Park, B.; Jeong, H. Correlation between break-in characteristics and pad surface conditions in silicon wafer polishing. J. Mater. Process. Technol. 2008, 205, 360–365. [Google Scholar] [CrossRef]
  16. Wang, H.; Zhang, X.; Kumar, A.; Huang, Q. Nonlinear Dynamics Modeling of Correlated Functional Process Variables for Condition Monitoring in Chemical–Mechanical Planarization. IEEE Trans. Semicond. Manuf. 2009, 22, 188–195. [Google Scholar] [CrossRef]
  17. Jeong, S.; Jeong, K.; Choi, J.; Jeong, H. Analysis of correlation between pad temperature and asperity angle in chemical me-chanical planarization. Appl. Sci. 2021, 11, 1507. [Google Scholar] [CrossRef]
  18. Chen, C.-C.A.; Li, J.-C.; Liao, W.-C.; Ciou, Y.-J.; Chen, C.-C. Dynamic Pad Surface Metrology Monitoring by Swing-Arm Chromatic Confocal System. Appl. Sci. 2020, 11, 179. [Google Scholar] [CrossRef]
  19. Freeman, P.W.; Markert, L. Characterization of pad conditioning profiles in oxide CMP. In Proceedings of the 1996 Chemical Me-chanical Polish for ULSI Multilevel, Interconnection Conference, Santa Clara, CA, USA, 22–23 February 1996; pp. 57–60. [Google Scholar]
  20. Chang, O.; Kim, H.; Park, K.; Park, B.; Seo, H.; Jeong, H. Mathematical modeling of CMP conditioning process. Microelectron. Eng. 2007, 84, 577–583. [Google Scholar] [CrossRef]
  21. Zhou, Y.-Y.; Davis, E.C. Variation of polish pad shape during pad dressing. Mater. Sci. Eng. B 1999, 68, 91–98. [Google Scholar] [CrossRef]
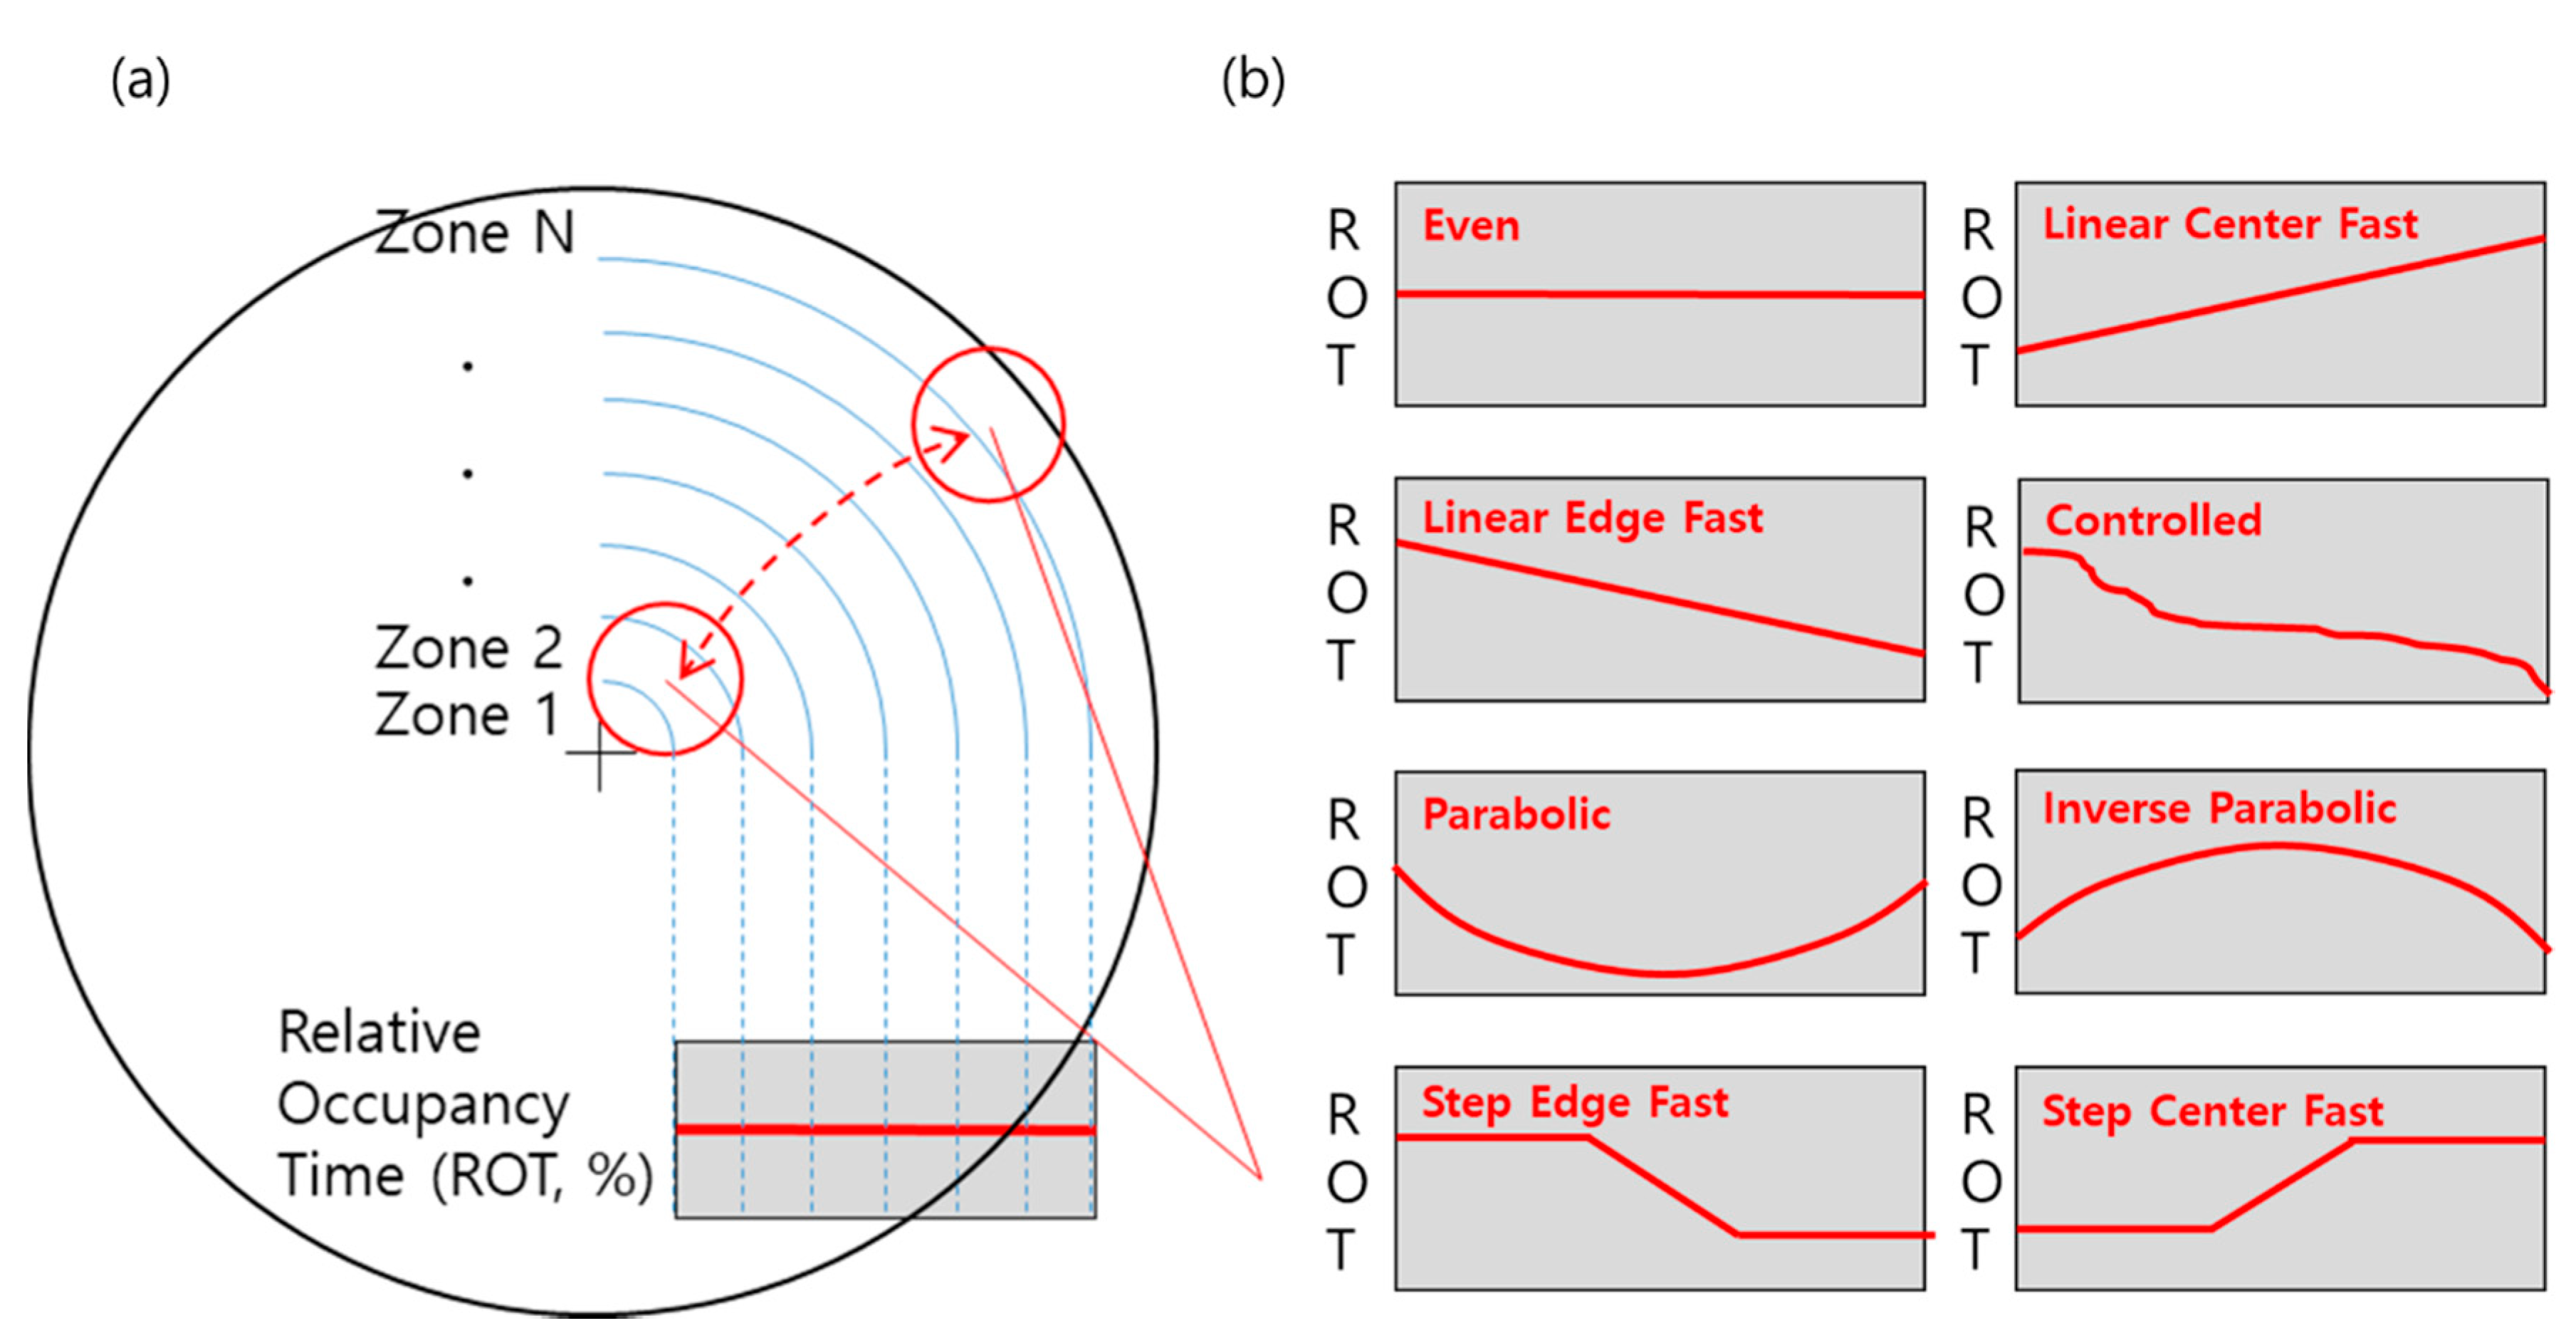
Figure 1. (a) Chemical mechanical polishing (CMP) conditioning equipment (b) profiling system.
Applsci 11 04358 g001
Figure 2. A typical pad profile (center fast) before and after abrasion, and a wear profile.
Applsci 11 04358 g002
Figure 3. (a) Schematic of conditioning zone and Relative occupancy time (ROT), (b) Schematic of the eight conditions used in experiments and predictions.
Applsci 11 04358 g003
Figure 4. (a) Conceptual diagram of a motion model comprising a rotating disc, a pad, and a swing arm, (b) Schematic of the integration of the trajectory length within a specific area for predicting the wear amount.
Applsci 11 04358 g004
Figure 5. (a) Disc-centered motion trajectory predicted by the developed simulation; (b) Trajectory of all working diamond abrasives; (c) Color contour through integration of the trajectory length.
Applsci 11 04358 g005
Figure 6. Conditioner disc center trajectory on the pad with respect to pad rotation speed and conditioning arm swing speed.
Applsci 11 04358 g006
Figure 7. Trajectory of working diamond abrasives on the pad with respect to the pad rotation speed and conditioning arm swing speed.
Applsci 11 04358 g007
Figure 8. Pad wear color contour with respect to pad rotation speed and conditioning arm swing speed.
Applsci 11 04358 g008
Figure 9. Results of comparing actual shape and predicted shape under eight ROT conditions: (a) Even, (b) Linear center fast, (c) Linear edge fast, (d) Controlled, (e) Parabolic, (f) Inverse parabolic, (g) Step edge fast, and (h) Step center fast.
Applsci 11 04358 g009
Figure 10. Results of comparing predicted shapes (a) Conditioner disc diameter; 100 mm (top), 60 mm (bottom), (b) Disc returning position; 350 mm (top), 375 mm (bottom).
Applsci 11 04358 g010
Figure 11. Schematic of the change in the contact area and pressure with respect to the overhang length (350 mm and 375 mm).
Applsci 11 04358 g011
Figure 12. (a) Pad wear profile under a controlled condition with a 375 mm overhang, (b) Pad thickness variation over time under even and controlled conditions with an overhang of 375 mm.
Applsci 11 04358 g012
Table 1. Relative occupancy time (ROT, %) of the profile cases; even, linear center fast, linear edge fast, and controlled.
Zone1234567891011
Case
Even9.19.19.19.19.19.19.19.19.19.19.1
Linear Center Fast13.612.711.810.9109.18.27.36.45.54.5
Linear Edge Fast4.55.56.47.38.29.11010.911.812.713.6
Controlled3.16.08.19.29.69.29.29.29.29.511
Table 2. Relative occupancy time (ROT, %) of profile cases; parabolic, inverse parabolic, step center fast, and step edge fast.
Zone123456789101112131415
Case
Parabolic119.17.66.35.34.64.14.04.14.65.36.37.69.111
Inverse Parabolic3.24.75.97.07.88.38.78.88.78.37.87.05.94.73.2
Step Center Fast8.08.08.08.08.08.08.06.04.04.04.04.04.04.04.0
Step Edge Fast4.04.04.04.04.04.04.06.08.08.08.08.08.08.08.0
Publisher’s Note: MDPI stays neutral with regard to jurisdictional claims in published maps and institutional affiliations.

