
Calculation of Transient Magnetic Field and Induced Voltage in Photovoltaic Bracket System during a Lightning Stroke


School of Electrical Engineering, Beijing Jiaotong University, Beijing 100044, China
*
Author to whom correspondence should be addressed.
Appl. Sci. 2021, 11(10), 4567; https://0-doi-org.brum.beds.ac.uk/10.3390/app11104567
Submission received: 26 April 2021
/
Revised: 11 May 2021
/
Accepted: 14 May 2021
/
Published: 17 May 2021
(This article belongs to the Special Issue Applications and Protections of High Voltage Power)
Abstract
:An effective method is proposed in this paper for calculating the transient magnetic field and induced voltage in the photovoltaic bracket system under lightning stroke. Considering the need for the lightning current responses on various branches of the photovoltaic bracket system, a brief outline is given to the equivalent circuit model of the photovoltaic bracket system. The analytic formulas of the transient magnetic field are derived from the vector potential for the tilted, vertical and horizontal branches in the photovoltaic bracket system. With a time–space discretization scheme put forward for theses formulas, the magnetic field distribution in an assigned spatial domain is determined on the basis of the lightning current responses. The magnetic linkage passing through a conductor loop is evaluated by the surface integral of the magnetic flux density and the induced voltage is obtained from the time derivative of the magnetic linkage. In order to check the validity of the proposed method, an experiment is made on a reduced-scale photovoltaic bracket system. Then, the proposed method is applied to an actual photovoltaic bracket system. The calculations are performed for the magnetic field distributions and induced voltages under positive and negative lightning strokes.
1. Introduction
As a kind of clean energy source, photovoltaic (PV) capacity has grown significantly in recent decades. The development of PV power generation systems encounters a serious problem concerning their operating safety under lightning threat. PV panels are usually installed in large exposed areas and away from tall objects; therefore, they are especially prone to lightning strike [1,2,3]. After a PV bracket system is struck by lightning, current surges will propagate along its conducting branches and flow into the ground. A transient magnetic field is produced around the current-carrying branches that is strong enough to interfere with proper operation of the sensitive electronics in the control units. Moreover, there are conductor loops formed by the aluminum alloy profiles, busbars and connecting wires in the PV bracket system. When the transient magnetic field penetrates through the conductor loops, the induced voltages are produced and often cause serious damage to PV modules, inverters, cables, etc. [4,5,6,7,8]. This leads to both high repair cost and great loss of profit for PV power stations [9]. To meet the increasing demand for lightning protection design of PV installations, it is necessary to calculate the transient magnetic field and induced voltage in PV bracket systems under lightning stroke. Previous studies have mainly concentrated on the circuit simulation of lightning transients in PV bracket systems. The circuit models have been built for calculating the lightning transient responses in PV bracket systems [10,11,12], from which the distributions of transient currents and potentials have been obtained in PV bracket systems. However, an appropriate algorithm has not been found in the literature for calculating the transient magnetic field around the current-carrying branches in PV bracket systems. The previous calculation of the transient magnetic field was usually based on oversimplified procedures [3,6,13], in which an adequate consideration had not been given to the complicated spatial location of the current-carrying branches. Although the approximate procedures were employed to estimate the induced voltage [3,4,5,6,14,15], they lacked a high calculation precision on account of their deficiency in exactly solving the transient magnetic field. In view of the imperfection in the previous studies, an efficient method is proposed in this paper for predicting the magnetic field distribution and induced voltage in PV bracket systems. The method provides a set of differential formulas for calculation of the transient magnetic field. These formulas are suitable to different spatial locations of the current-carrying branches. The induced voltage is obtained by evaluating the time derivative of the magnetic linkage through a conductor loop. The experimental measurement of the induced voltages is made in a reduced-scale PV bracket system and the calculated results are compared with the measured ones for confirming the validity of the proposed method. A numerical example is also furnished to examine the practical applicability of the proposed method.
2. Methodology for Calculating Transient Magnetic Field and Induced Voltage
2.1. Lightning Current Responses in Photovoltaic (PV) Bracket System
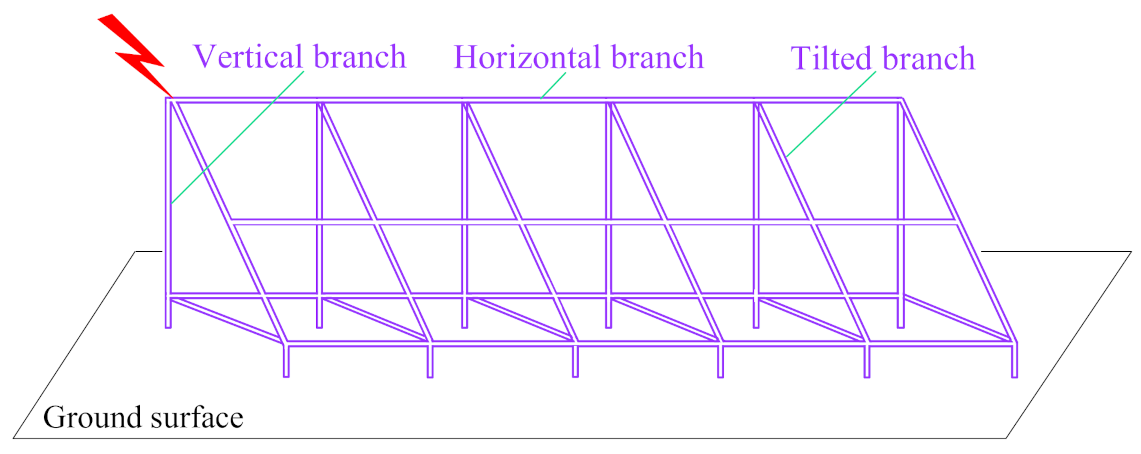
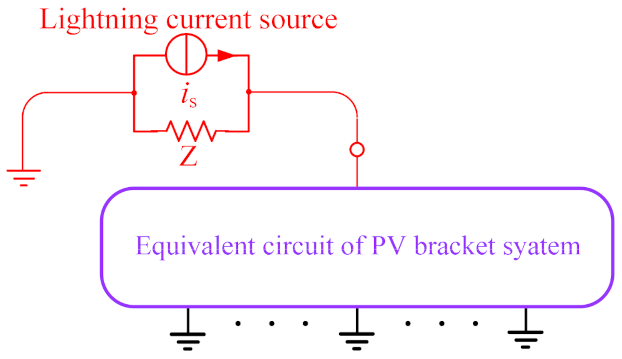
A PV bracket system is typically constructed by a series of tilted, vertical and horizontal conductor branches as shown in Figure 1. During a lightning stroke, the lightning current will inject into the PV bracket system from the attachment point and be distributed on all the branches. To calculate the lightning current responses, the PV bracket system is converted into an equivalent circuit consisting of a large number of resistances, inductances and capacitances. A current source is with specified lightning current parameter is applied to the node (corresponding to the attachment point) in the equivalent circuit to simulate the lightning stroke to the PV bracket system [16,17], as shown in Figure 2. Z denotes the surge impedance of the lightning discharge channel and its value ranges from several hundred ohms to kilohms, depending on the amplitude of the lightning current [18]. The lightning current responses on all the branches can be obtained by performing the transient calculation for the equivalent circuit. The associated calculation procedure has been reported in detail in [10,12]. In terms of the lightning current response on each branch, the transient magnetic field can be calculated in the PV bracket system.
2.2. Formula Derivation of Transient Magnetic Field
The transient magnetic field is described by Maxwell’s equations. The solution of the transient magnetic field is based on the vector potential [19]
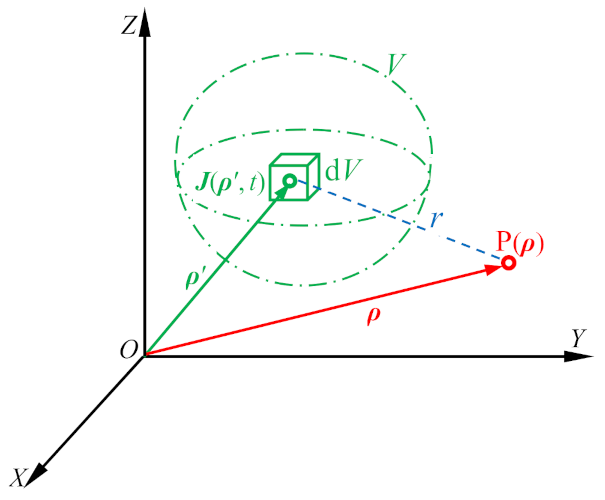
where B is the magnetic flux density and A is the vector potential. A is expressed by the current density [5,19]
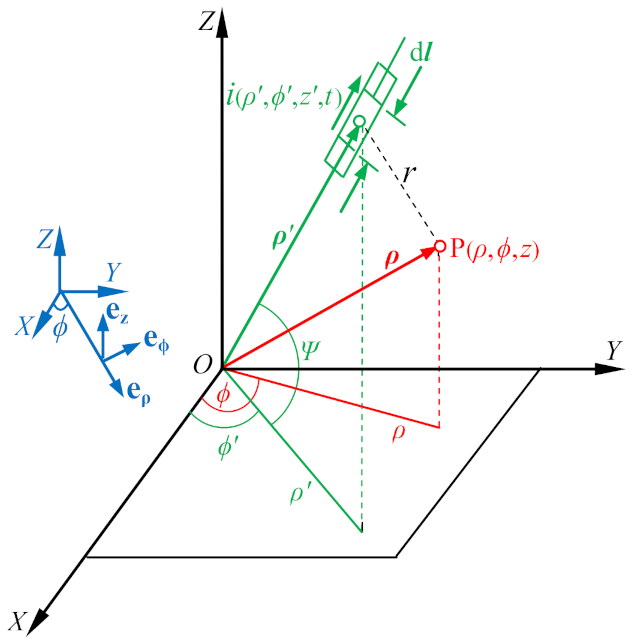
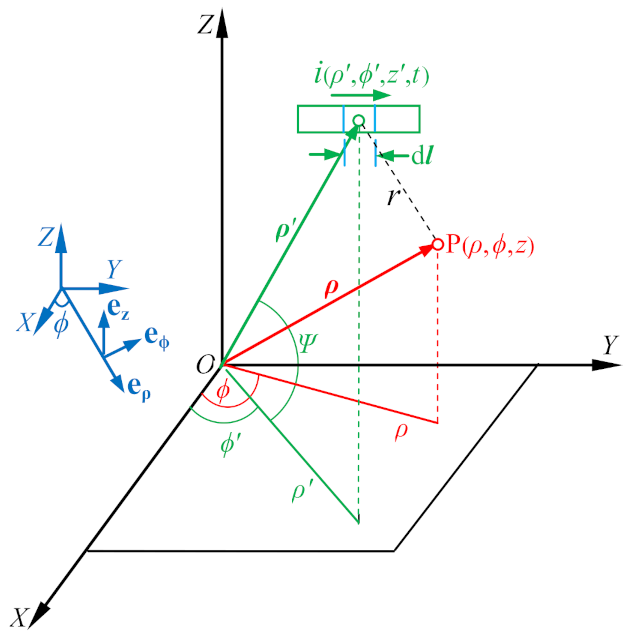
where μ0 is the permeability of free space (4π × 10−7 H/m), v is the velocity of light (3 × 10⁸/m/s) and J is the current density. The geometrical quantities in (2) are illustrated in Figure 3. According to Figure 1, the spatial locations of all the branches can be classified into three categories: tilted, vertical and horizontal. On a tilted branch shown in Figure 4, a differential carrying-current segment dl is taken into consideration. The differential current element J(ρ′, t − r/v)dV is written as i(ρ′, ϕ′, z, t − r/v) dl in the cylindrical coordinates. From (2) the differential vector potential is given by [20]
Using dl = dlcosΨeρ + dlsinΨez in (3) gives
where the distance r is
Evaluating the curl of dA for (1) gives
Making a change of variables η = t − r/v, the current derivatives with respective to ρ, ϕ, z and t become
Replacing the spatial derivative with the time derivative in (7) leads to
In terms of (5), the derivatives of (1/r) with respective to ρ, ϕ and z are written by
The differential magnetic flux density dB1 for the tilted branch can be given by substituting (4) and (8) ~ (9) into (6)
The differential magnetic flux density dB2 can be given for a vertical branch by putting Ψ = 90° into (10). The differential magnetic flux density dB3 can also be given for a horizontal branch (see Figure 5) by following a deriving procedure similar to (10)
In the calculation of the magnetic flux density, the image method needs to be employed to take account of the influence of the ground [21]. For each real branch in the bracket system, its image branch is symmetrically installed below the ground surface [22,23]. A segmentation is made for real and image branches. The length of each segment Δl is short enough for the current to be uniformly distributed over it and for dl to be replaced by Δl in (10) and (11). Furthermore, the time derivative of the current in (10) and (11) is approximated by
where Δt is the time step. With a discretization in space and time carried out for (10) and (11), the component of magnetic flux density contributed by a segment in different spatial location is calculated numerically. As a result, the magnetic flux density at an arbitrary point can be determined by vectorially summing the components contributed by the segments of all the real and image branches.
2.3. Calculation of Induced Voltage
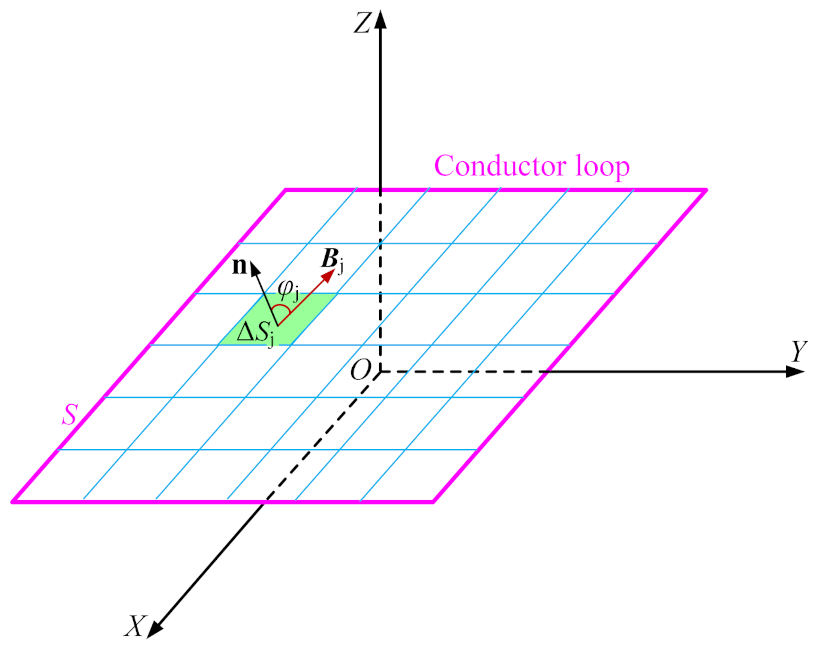
Figure 6 shows a conductor loop in the PV bracket system. The distribution of the magnetic flux density on the loop plane can be obtained by the algorithm stated above. The magnetic linkage through the loop is calculated by the surface integral [19]
To evaluate the magnetic linkage, the loop plane is subdivided into a considerable number of subareas (see Figure 6). The magnetic flux density is regarded as having a uniform distribution on each subarea. Using such a subdivision, the magnetic linkage at a discrete time (t = kΔt) is approximately calculated by
where M is the total number of the subareas and N is the maximum number of the time steps. According to Faraday’s law of electromagnetic induction, the induced voltage in the loop is determined by the time derivative of the magnetic linkage [24]
Considering (14), the induced voltage is calculated by
3. Experimental Verification
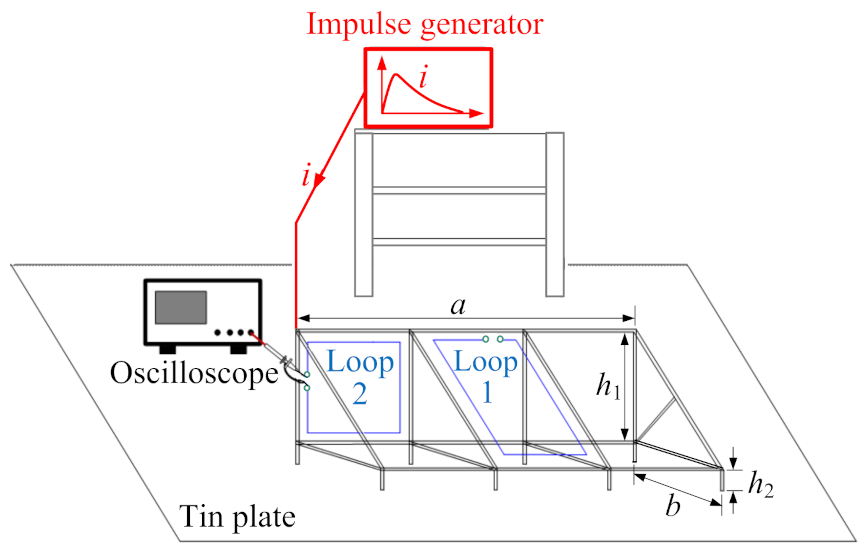
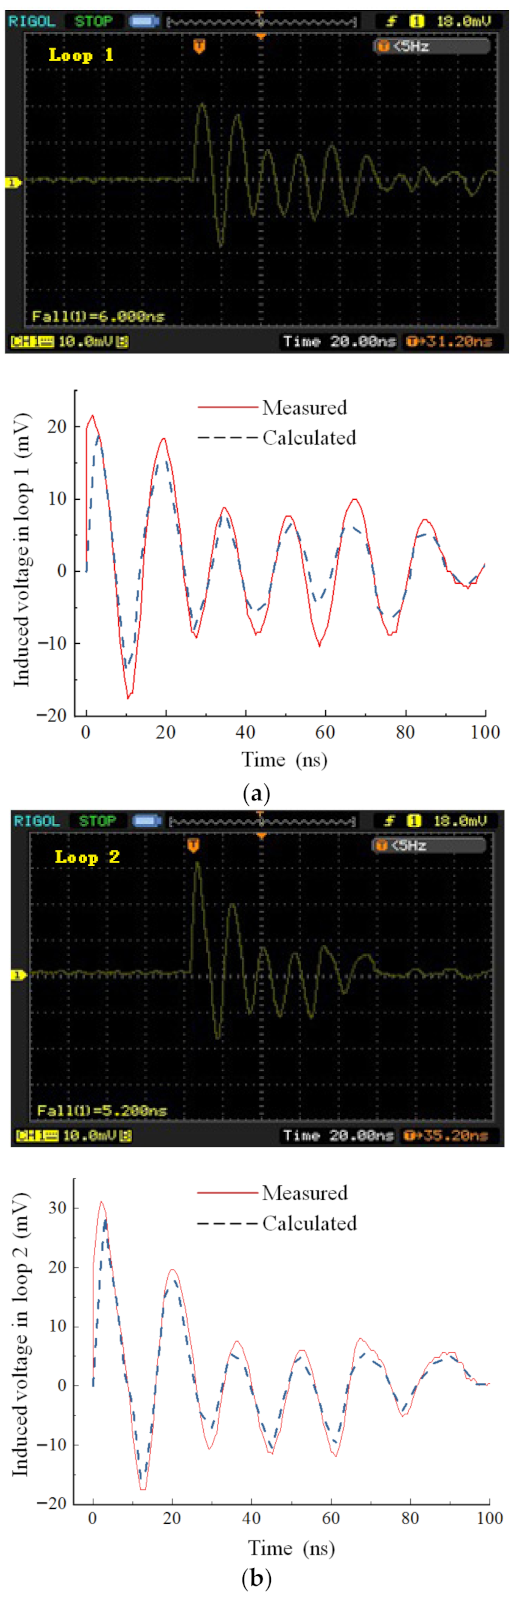
The induced voltages are measured by a reduced-scale experimental set-up of PV bracket system, as shown in Figure 7. Its sizes are a = 0.45 m, h1 = b = 0.15 m and h2 = 0.05 m.
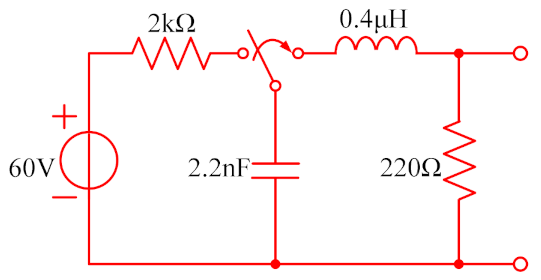
Rectangular loop 1 of 0.145 m × 0.12 m and square loop 2 of 0.12 m × 0.12 m are installed in the set-up. A fast impulse generator, whose circuit is shown in Figure 8 [25,26], is used to generate the impulse current i (15/295 ns). With i injected into the set-up, the induced voltages in the two loops are recorded by a digital oscilloscope with 200 MHz band width and their measured wavefiorms are shown in Figure 9. In fact, a conductor always has self inductance. The conductor also has the capacitance to ground, depending on its spatial location. As the inductance and capacitance are gratuitous (not deliberately included), they are called “parasitic inductance and capacitance”, respectively [27]. In Figure 7, the average length of the loop wire is 0.505 m. The parasitic inductance and capacitance of the loop are non-ignorable for the fast transient. Meanwhile, the oscilloscope has the input and probe capacitances. The actual presence of such parasitic circuit parameters causes the oscillating phenomenon to occur on the measured waveforms. The waveforms calculated by the proposed method are also plotted in Figure 9 together with the measured waveformes. In the calculation, the estimated parasitic circuit parameters (Rp, Lp and Cp) are given in Table 1. The measurement wire is quite short and its parasitic circuit parameters are ignored. A contrast between the measured and calculated waveforms indicates that a rough agreement appears between them. This confirms the validity of the proposed method.
4. Numerical Example
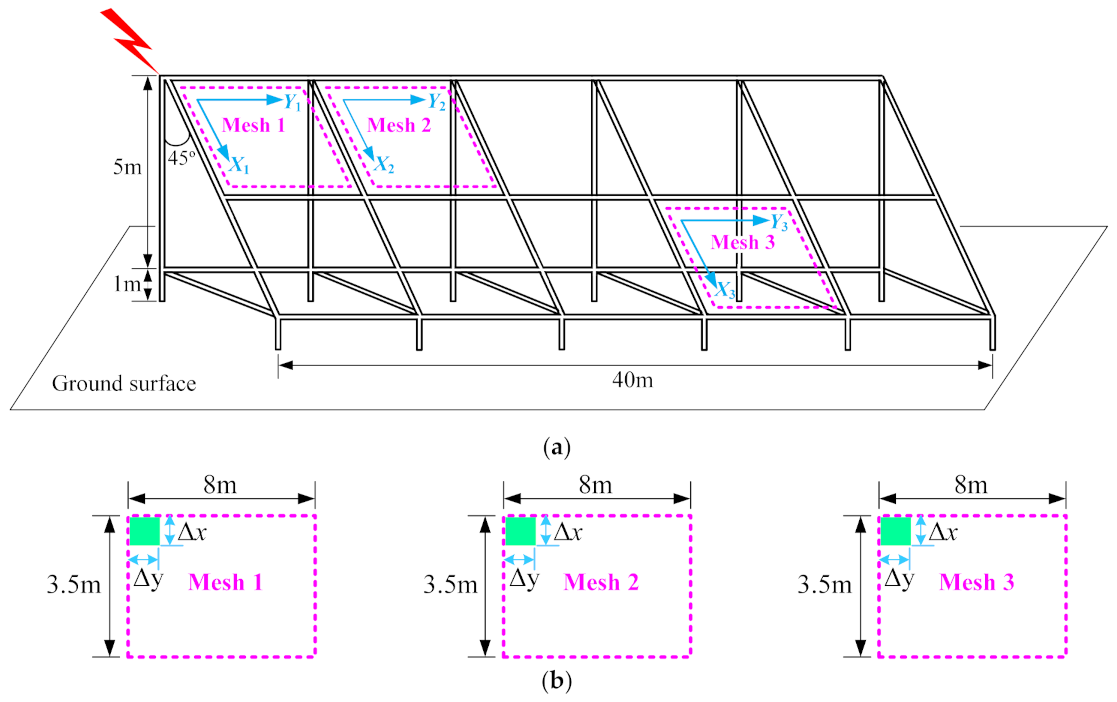
The structure of an actual PV bracket system is shown in Figure 10a. Three meshes are considered in the PV bracket system and their sizes are marked in Figure 10b. Using the proposed method, the magnetic field distributions and induced voltages are calculated under positive and negative lightning strokes, respectively. For each mesh plane, the step sizes of the subdivision grid are Δx = 0.08 m and Δy = 0.07 m.
4.1. Under Positive Lightning Stroke
4.2. Under Negative Lightning Stroke
4.3. Discussion
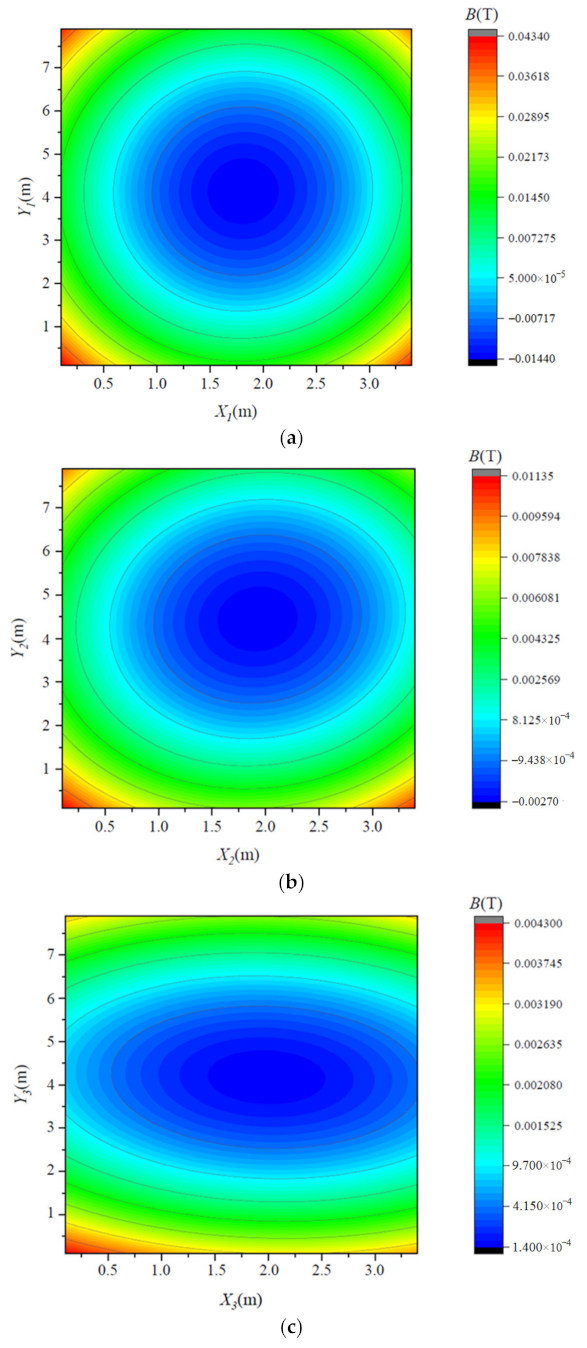
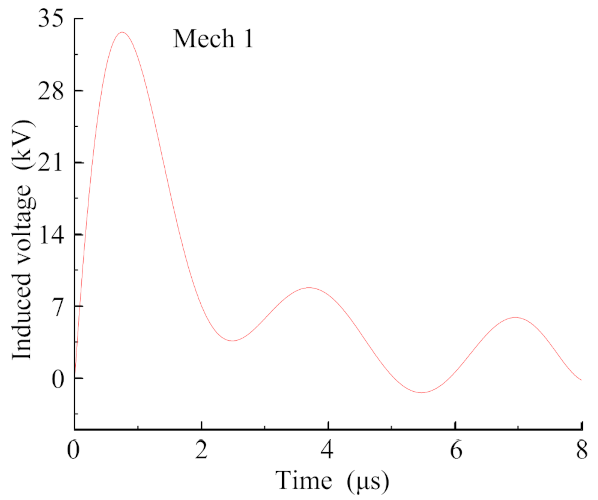
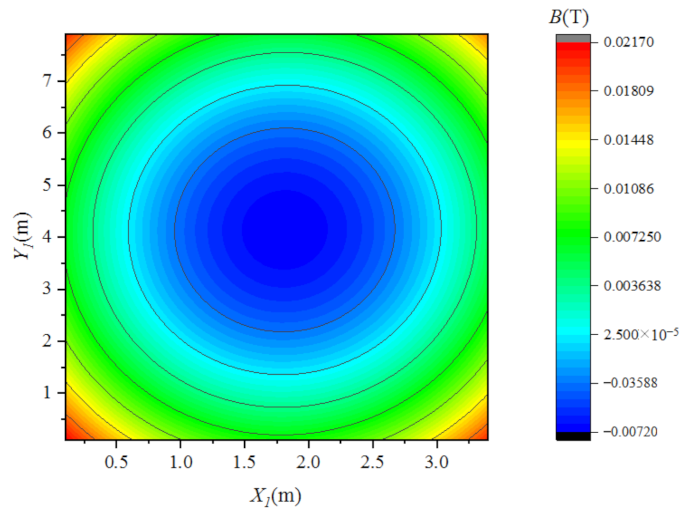
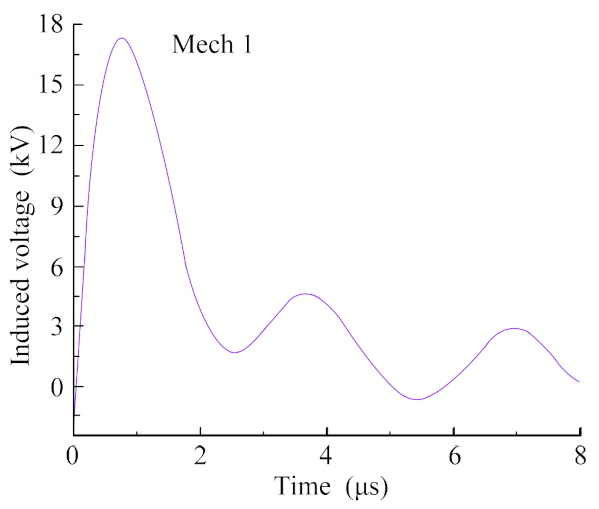
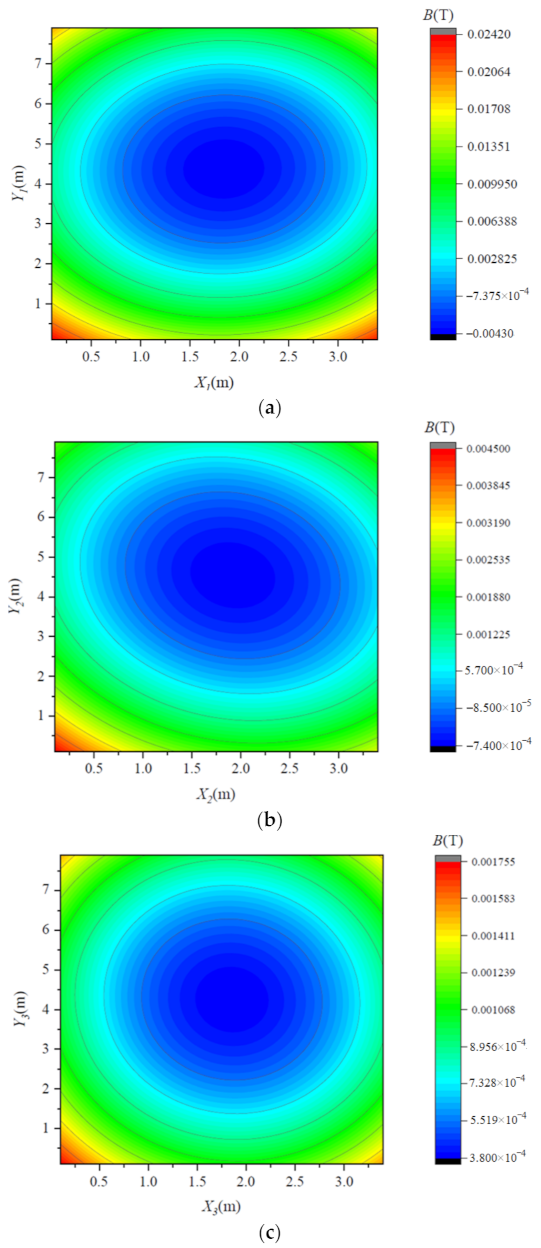
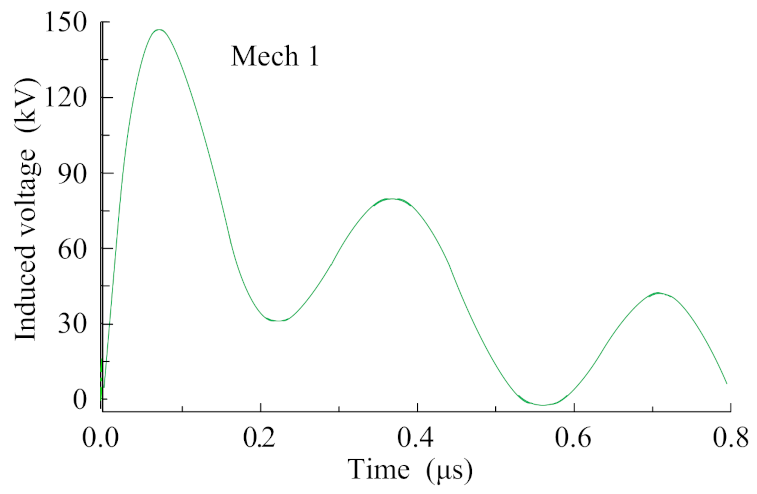
As can be seen from Figure 11, Figure 13 and Figure 15, the amplitude of the magnetic flux density is high near the edges and decreases to a very low level in the center on each mesh plane. Furthermore, the amplitude of magnetic flux density is higher under positive lightning stroke than in negative stroke for the same mesh plane. This is due to the fact that current amplitude of a positive lightning stroke is larger than that of a negative lightning stroke. Although the current wavefront steepness of the positive lightning stroke is much less than that of the negative lightning stroke, the field component depending on the instantaneous current (see (10) and (11)) plays a major role in the magnetic flux density at the close range of the magnetic field [20,24,28]. Contrary to the magnetic flux density, the induced voltage under positive lightning stroke is evidently lower than that under negative lightning stroke in the same mesh. The reason for this is that the induced voltage is in direct proportion to the time derivative of the magnetic linkage through the mesh (dΦ/dt). The time derivative depends mainly on the current wavefront steepness rather than its instantaneous value (see (15)). In addition, when the lightning currents under both polarities have the same amplitudes, the amplitude of the magnetic flux density under positive lightning stroke is slightly less than that under negative lightning stroke (see Figure 13 and Figure 15a). However, the induced voltage under positive lightning stroke is much lower than that under negative lightning stroke (see Figure 14 and Figure 16). This is because the current wavefront steepness under negative lightning stroke is far greater than that under positive lightning stroke in the case of the same current amplitude.
5. Conclusions
A set of analytic formulas have been derived for calculating the transient magnetic field under lightning stroke. The formulas are adaptable to the different spatial locations of the branches in actual PV bracket systems. A discretization scheme has been laid out for evaluating the magnetic linkage through a conductor loop. The induced voltage is determined by taking the time derivative of the magnetic linkage. The experimental measurement has been made for the induced voltages by a reduced-scale PV bracket system. An agreement between calculated and measured results confirms the validity of the proposed method. The calculation of the transient magnetic field and induced voltage has been performed for an actual PV bracket system. This shows that the magnetic flux density is mainly dependent on the instantaneous value of the lightning current injected into the PV bracket system and the induced voltage on its wavefront steepness. The proposed method is useful in quantitatively predicting the lightning electromagnetic effect and has the capability of affording a basis for the lightning design of PV bracket systems.
Author Contributions
Conceptualization, Z.X.; methodology, Z.X. and W.Y.; software, W.Y.; validation, W.Y.; formal analysis, Z.X.; investigation, W.Y.; resources, W.Y.; data curation, W.Y.; writing—original draft preparation, Z.X.; writing—review and editing, Z.X.; visualization, W.Y.; supervision, Z.X.; project administration, Z.X. All authors have read and agreed to the published version of the manuscript.
Funding
This research was funded by National Natural Science Foundation of China, grant number 51777007.
Institutional Review Board Statement
Not applicable.
Informed Consent Statement
Not applicable.
Data Availability Statement
The data present in this study are available on request from the corresponding author.
Conflicts of Interest
The authors declare no conflict of interest.
References
- Damianaki, K.; Christodoulou, C.A.; Kokalis, C.A.; Kyritsis, A.; Ellinas, E.D.; Vita, V.; Gonos, I.E. Lightning protection of photovoltaic systems: Computation of the developed potentials. Appl. Sci. 2021, 11, 337. [Google Scholar] [CrossRef]
- Ahmad, N.I.; Ab-Kadir, M.Z.A.; Izadi, M.; Azis, N.; Radzi, M.A.M.; Zaini, N.H.; Nasir, M.S.M. Lightning protection on photovoltaic systems: A review on current and recommended practices. Renew. Sustain. Energy Rev. 2018, 82, 1611–1619. [Google Scholar] [CrossRef]
- Benesova, Z.; Haller, R.; Birkl, J.; Zahlmann, P. Overvoltages in photovoltaic systems induced by lightning strikes. In Proceedings of the 2012 International Conference on Lightning Protection (ICLP), Vienna, Austria, 2–7 September 2012. [Google Scholar]
- Coetzer, K.M.; Wiid, P.G.; Rix, A.J. Investigating lightning induced currents in photovoltaic modules. In Proceedings of the 2019 International Symposium on Electromagnetic Compatibility (EMC Europe 2019), Barcelona, Spain, 2–6 September 2019. [Google Scholar]
- Formisano, A.; Petrarca, C.; Hemandez, J.C.; Munoz-Rodriguez, F.J. Assessment of induced voltages in common and differential-mode for a PV module due to nearby lightning strikes. IET Renew Power. Gener. 2019, 13, 1369–1378. [Google Scholar] [CrossRef]
- Sun, Q.Q.; Zhong, X.; Liu, J.Y.; Feng Wang, F.; Chen, S.; Zhong, L.P.; Bian, X.M. Three-dimensional modeling on lightning induced overvoltage for photovoltaic arrays installed on mountain. J. Clean. Prod. 2021, 288, 125084. [Google Scholar] [CrossRef]
- Belik, M. PV panels under lightning conditions. In Proceedings of the 2014 15th International Scientific Conference on Electric Power Engineering (EPE), Brno-Bystrc, Czech Republic, 12–14 May 2014. [Google Scholar]
- Vranjkovina, M.; Helac, V.; Grebovic, S. Lightning protection model of photovoltaic power plants. In Proceedings of the International Symposium INFOTEH-JAHORINA, East Sarajevo, Bosnia and Herzegovina, 17–19 March 2021. [Google Scholar]
- Dimitriou, A.; Charalambous, C.A.; Kokkinos, N. Integrating the loss of economic value in lightning-related risk assessments of large scale photovoltaic systems participating in regulated and competitive energy markets. In Proceedings of the 2016 33rd International Conference on Lightning Protection (ICLP), Estoril, Portugal, 25–30 September 2016. [Google Scholar]
- Wang, X.W.; Zhang, X.Q. Numerical method for lightning transient analysis of photovoltaic bracket systems. J. Renew. Sustain. Energy 2020, 12, 033501. [Google Scholar] [CrossRef]
- Matsuda, K.; Higo, T. A simple lumped-equivalent circuit of a photovoltaic panel for transient simulations. In Proceedings of the 2014 49th International Universities Power Engineering Conference (UPEC), Cluj-Napoca, Romania, 2–5 September 2014. [Google Scholar]
- Wang, X.W.; Zhang, X.Q. Modeling of lightning transients in photovoltaic bracket systems. IEEE Access 2019, 7, 12262–12271. [Google Scholar] [CrossRef]
- Stern, H.J.; Karner, H.C. Lightning induced EMC phenomena in photovoltaic modules. In Proceedings of the 1993 International Symposium on Electromagnetic Compatibility, Dallas, TX, USA, 9–13 August 1993. [Google Scholar]
- Fuangfung, Y.; Sinthusonthishat, S.; Yutthagowith, P. A software tool for induced voltages and currents calculation caused by lightning electromagnetic field in PV systems. In Proceedings of the 2015 12th International Conference on Electrical Engineering/Electronics, Computer, Telecommunications and Information Technology (ECTI-CON), Hua Hin, Thailand, 24–27 June 2015. [Google Scholar]
- Tu, Y.P.; Zhang, C.N.; Hub, J.; Wang, S.C.; Sun, W.; Li, H.J. Research on lightning overvoltages of solar arrays in a rooftop photovoltaic power system. Electr. Power Syst. Res. 2013, 94, 10–15. [Google Scholar] [CrossRef]
- IEC 6320-1. Protection against Lightning-Part 1: General Principles; IEC: Geneva, Switzerland, 2010. [Google Scholar]
- Chinese National Standard, GB 50057. Design Code for Protection of Structures against Lightning; Planning Press: Beijing, China, 2010. [Google Scholar]
- Chinese National Standard, GB/T 50063. Code for Design of Overvoltage Protection and Insulation Coordination for AC Electrical Installations; Planning Press: Beijing, China, 2014. [Google Scholar]
- William, H.H., Jr.; John, B. Engineering Electromagnetics, 7th ed.; McGraw Hill Company, Inc.: New York, NY, USA, 2005; pp. 243–308. [Google Scholar]
- Rubinstein, M.; Uman, M.A. Methods for calculating the electromagnetic fields from a known source distribution. IEEE Trans. Electromagn. Compat. 1989, 31, 183–189. [Google Scholar] [CrossRef]
- Ametani, A.; Kasai, Y.; Swaada, J.; Mochizuki, A.; Yamada, T. Frequency-dependent impedance of vertical conductors and multiconductor tower model. IEEE Proc. Gener. Transm. Distrib. 1994, 141, 339–345. [Google Scholar] [CrossRef]
- Chen, H.C.; Zhang, Y.; Du, Y.P.; Chen, Q.S. Lightning propagation analysis on telecommunication towers above the perfect ground using full-wave time domain. IEEE Trans. Electromagn. Compat. 2019, 61, 697–704. [Google Scholar] [CrossRef]
- Zhang, X.Q. An improved approach for modeling lightning transients of wind turbines. Int. J. Electr. Power. Energy Syst. 2018, 101, 429–438. [Google Scholar] [CrossRef]
- Feng, C.Z.; Ma, X.K. Introduction to Engineering Electromagnetic Field; High Education Press: Beijing, China, 2004; pp. 188–189. [Google Scholar]
- Yamamoto, K.; Takami, J.; Okabe, N. Overvoltages on DC side of power conditioning caused by lightning stroke to structure anchoring photovoltaic panels. Electr. Eng. Jpn. 2014, 187, 903–913. [Google Scholar] [CrossRef]
- Zhang, R.Y.; Chen, C.Y.; Wang, C.C. High-Voltage Testing Technology, 3rd ed.; Tsinghua University Press: Beijing, China, 2009; pp. 181–186. [Google Scholar]
- Ponald, B.S. Protection of Electronic Circuits from Overvoltages; John Wiley & Sons: New York, NY, USA, 2002; p. 202. [Google Scholar]
- Vagner, D.; Lembrikov, B.I. Quasi-Static Electromagnetic Field; Springer Publisher: Berlin, Germany, 2004; pp. 68–72. [Google Scholar]
Figure 1.
Photovoltaic (PV) bracket system.

Figure 2.
Circuit model of PV bracket system.

Figure 3.
Geometrical quantities.

Figure 4.
Tilted branch.

Figure 5.
Horizontal branch.

Figure 6.
Subdivision for conductor loop plane.

Figure 7.
Measurement on reduced-scale experimental set-up.

Figure 8.
Circuit of impulse generator.

Figure 9.
Measured and calculated induced voltage waveforms. (a) Loop 1, (b) loop 2.

Figure 10.
(a) PV bracket system, (b) three meshes.

Figure 11.
Magnetic field distributions under +10/350 μs and 100 kA. (a) Mesh 1, (b) mesh 2, (c) mesh 3.
Figure 11.
Magnetic field distributions under +10/350 μs and 100 kA. (a) Mesh 1, (b) mesh 2, (c) mesh 3.

Figure 12.
Induced voltage in mesh 1 under +10/350 μs and 100 kA.

Figure 13.
Magnetic field distribution on mesh plane 1 under +10/350 μs and 50 kA.

Figure 14.
Induced voltage in mesh 1 under +10/350 μs and 50 kA.

Figure 15.
Magnetic field distributions under −1/200 μs and 50 kA. (a) Mesh 1, (b) mesh 2, (c) mesh 3.
Figure 15.
Magnetic field distributions under −1/200 μs and 50 kA. (a) Mesh 1, (b) mesh 2, (c) mesh 3.

Figure 16.
Induced voltage in mesh 1 under −1/200 μs and 50 kA.


Table 1.
Parasitic circuit parameters.
| Parameters | Rp (Ω) | Lp (μH) | Cp (pF) |
|---|---|---|---|
| Loop 1 | 0.0082 | 0.22 | 148.0 |
| Loop 2 | 0.0068 | 0.19 | 114.0 |
| Oscilloscope | 50 | 20 |
Publisher’s Note: MDPI stays neutral with regard to jurisdictional claims in published maps and institutional affiliations. |
© 2021 by the authors. Licensee MDPI, Basel, Switzerland. This article is an open access article distributed under the terms and conditions of the Creative Commons Attribution (CC BY) license (https://creativecommons.org/licenses/by/4.0/).
Share and Cite
MDPI and ACS Style
Zhang, X.; Wang, Y. Calculation of Transient Magnetic Field and Induced Voltage in Photovoltaic Bracket System during a Lightning Stroke. Appl. Sci. 2021, 11, 4567. https://0-doi-org.brum.beds.ac.uk/10.3390/app11104567
AMA Style
Zhang X, Wang Y. Calculation of Transient Magnetic Field and Induced Voltage in Photovoltaic Bracket System during a Lightning Stroke. Applied Sciences. 2021; 11(10):4567. https://0-doi-org.brum.beds.ac.uk/10.3390/app11104567
Chicago/Turabian StyleZhang, Xiaoqing, and Yaowu Wang. 2021. "Calculation of Transient Magnetic Field and Induced Voltage in Photovoltaic Bracket System during a Lightning Stroke" Applied Sciences 11, no. 10: 4567. https://0-doi-org.brum.beds.ac.uk/10.3390/app11104567
Note that from the first issue of 2016, this journal uses article numbers instead of page numbers. See further details here.