Article

Coupling Effect of Air Flow Rate and Operating Conditions on the Performance of Electric Vehicle R744 Air Conditioning System

1
School of Energy and Power Engineering, Xi’an Jiaotong University, 28 Xianning West Road, Xi’an 710049, China
2
Department of Mechanical Engineering, Technical University of Denmark (DTU), Nils Koppels Allé, Building 403, 2800 Kgs. Lyngby, Denmark
*
Authors to whom correspondence should be addressed.
Submission received: 11 May 2021 / Revised: 23 May 2021 / Accepted: 24 May 2021 / Published: 25 May 2021

Abstract

:
The air flow rate on the gas cooler side is one of the key parameters affecting the performance and running safety of transcritical CO2 electric vehicle air conditioning systems. After experimentally analyzing the effects of the air volume flow rate in the gas cooler on the cycle parameters and system performance, a novel method to evaluate the optimal air flow rate was proposed. In addition, the effect of the gas cooler air volume flow rate on the key performance parameters of the system (e.g., optimal discharge pressure) was explored. Finally, the coupling effects of the compressor speed, ambient temperature and optimal air flow rate on the system performance was also exhaustively assessed. It was found that as the discharge temperature, the CO2 temperature at the gas cooler outlet and the discharge pressure did not vary more than ±2%, the corresponding gas cooler air volume flow rate was optimal. For the single-row and dual-process microchannel evaporator used in this work, the recommended value of the optimal gas cooler air volume flow rate was 2500 m3·h−1. The results could provide reference for the fan speed design of electric vehicle CO2 air conditioning systems, especially for the performance under idling model.

1. Introduction

Electric vehicles have been proved to be one of the most effective solutions to reduce greenhouse gas and air pollutant emissions in the transport sector, besides promoting low noise [1,2]. However, a considerable contribution to the environmental impact of cars is given by high global warming potential (GWP) refrigerants [3,4]. Therefore, ever-stricter regulations aiming at phasing out these working fluids are being implemented all over the world. Looking for new environmentally friendlier refrigerants for mobile air conditioning units has become one of the hottest research topics in the field of EVs in recent years [5]. Thanks to its negligible GWP, zero ozone depletion potential (ODP), non-toxicity, non-flammability and favorable thermo-physical properties [6,7], CO2 (R744) has become one of the most preferred working fluids for cooling systems of vehicles [8,9].
Since the introduction of the transcritical running mode [10], there have been countless studies on the performance of CO2 refrigeration systems. Compared with high-GWP working fluids, the performance of transcritical CO2 refrigeration units is lower at high cooling medium temperatures [11,12]. Therefore, in order to improve the performance of transcritical CO2 air conditioning systems, many methods have been studied [13,14]. The expedients to improve the performance of transcritical CO2 systems are based mainly on two approaches: optimizing system components and enhancing system layout. Regarding the optimization of system components, this method mainly includes the performance enhancement of the gas cooler, evaporator and compressor. Wang et al. [15] developed a simulation model of an automobile gas cooler and proposed a new heat exchanger optimization design method. Li et al. [16] proposed an integrated fin and micro-channel gas cooler and developed a segment-by-segment model to analyze the design scheme maximizing the heat exchange performance. Wang et al. [17] proposed a novel CO2 heat pump system with series gas cooler (SGC) configuration and compared its performance with that of the conventional CO2 system. The introduction of SGC was found to lead to an average increase of 33.7% in the system heating capacity and of 35.0% in the system coefficient of performance (COP). Yang et al. [18] implemented a fast and accurate genetic algorithm to predict the performance of CO2 microchannel gas coolers in automobile air conditioning systems. In addition, the performance of microchannel evaporators and its improved structure design were studied in [19,20,21]. Zheng et al. [22] explored the internal flow characteristics of a scroll compressor to enhance the performance of R744 mobile heat pump air conditioning systems. The above studies have resulted in significant advances in the investigation of maximizing the overall performance of the system by optimizing system components. Besides, regarding enhancing the system cycle to improve the transcritical CO2 cooling performance, various solutions have been implemented, such as overfed evaporators, two-phase ejectors and parallel compression [23].
A literature review revealed that the influence of the gas cooler air flow rate on the transcritical CO2 electric vehicle air conditioning system performance has not been investigated comprehensively. On the one hand, the efficiency of transcritical CO2 systems is significantly sensitive to the refrigerant temperature upstream of the expansion valve, which is affected by the air flow rate within the gas cooler substantially. On the other hand, the gas cooler air flow rate varies considerably in vehicles due to the running state and the stationary state. Thus, an in-depth study on the influence of the gas cooler air flow rate on the performance of transcritical CO2 mobile air conditioning units is needed to enhance their energy efficiency and provide reference for the fan design and speed control. Insufficient air flow rate leads to an inadequate heat transfer between the refrigerant and air in the gas cooler, reducing the system performance. As the air volume flow rate is sufficient for the gas cooler to meet the cooling demand, further increasing the air volume rate has a very limited degree of improvement in the cooling capacity. However, this will result in a significant increase in the power consumption of the fan, which leads to a decrease in the system performance. Hence, there is an optimal value of air volume flow rate at which the increase in fan power consumption exceeds the increase in the cooling capacity. In order to bridge the aforementioned knowledge gap, firstly, the effect of the gas cooler air volume flow rate on the system temperature and pressure, efficiency of the compressor and performance of the system was studied experimentally in this work. Furthermore, a reliable and novel approach to assess the optimal gas cooler air volume flow rate was implemented. Secondly, the influence of the operating conditions and optimal gas cooler air volume flow rate on the system performance was assessed. Based on the obtained results, the optimal gas cooler air volume flow rate for the full operating range in cooling mode was determined.

2. Materials and Methods

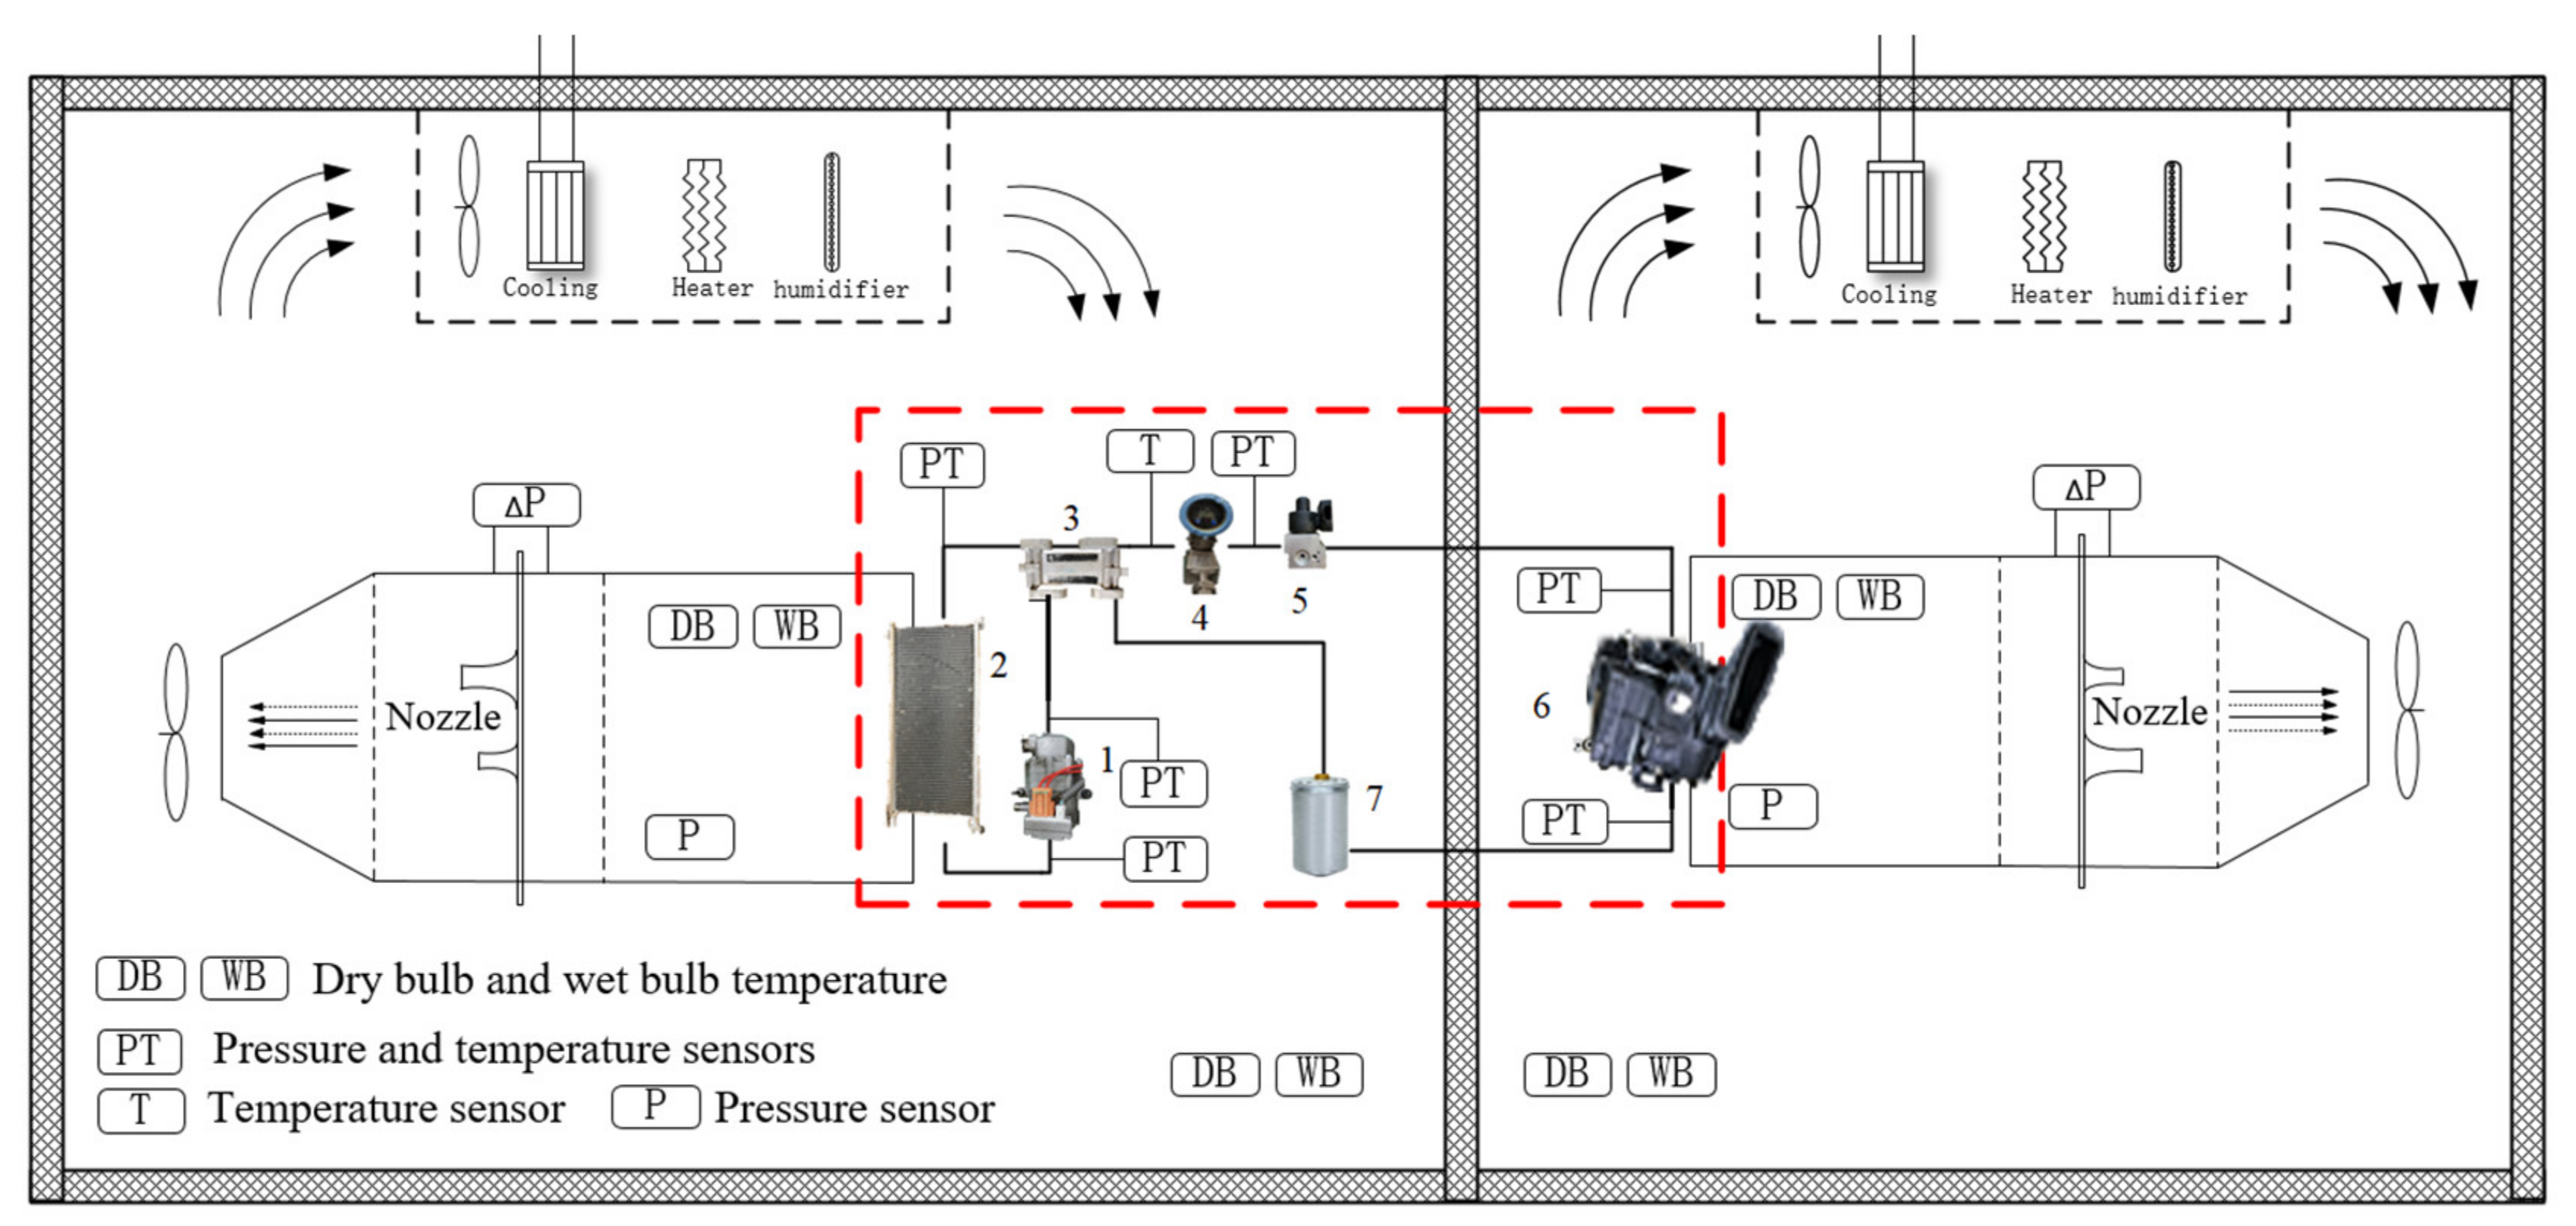
2.1. Experimental Setup Description

The test bench employed for evaluating the performance of the transcritical CO2 electric vehicle air conditioning system involved a compressor, a gas cooler, an internal heat exchanger (IHX), an expansion valve (EXV), a microchannel evaporator in the heating, ventilation and air conditioning (HVAC) unit and an accumulator (Figure 1). All the connecting pipes of the system were made of aluminum hose. The detailed parameters of the components are listed in Table 1.
Two temperature sensors were installed in the gas cooler air-side and two temperature sensors were mounted in the evaporator air-side. As for the CO2-side, nine temperature sensors, six pressure transmitters and a mass flow rate were installed. The air volume flow rate in the gas cooler side ranged from 600 m3·h−1 to 9000 m3·h−1 with an accuracy of ±0.01 m3·h−1. All the detailed parameters of the measurement instruments are listed in Table 2.

2.2. Experiment Conditions

The experimental setup of transcritical CO2 electric vehicle air conditioning system was built in an enthalpy difference chamber. The cooling COP was computed as follows:
h a i r = f T a i r W , T a i r D
Q ˙ c o o l i n g = V ˙ a i r ρ a i r h a i r , e v a   i h a i r , e v a   o / 3600
C O P = Q ˙ c o o l i n g W ˙ c o m p
In all cases, the volume flow rate of the air on the evaporator side was kept at 480 m3·h−1 and the compressor was varied between 3500 rpm and 6500 rpm. The upper limitation of the discharge temperature (Tdis) and pressure (Pdis) were 135 °C and 14 MPa, respectively. The detailed experimental conditions are listed in Table 3.

2.3. Uncertainty Analysis

The uncertainty propagation analysis for COP and cooling capacity was calculated by using the Kline and McClintock method [25] expressed in Equation (4):
ω R = R x 1 ω 1 2 + R x 2 ω 2 2 + + R x n ω n 2 1 2
in which ωR is the resulting uncertainty, while ω1,…, ωn are the uncertainties of the independent variables x1,…, xn. Uncertainties of cooling capacity and COP were obtained by Equations (5) and (6). The maximum uncertainty of the cooling capacity and COP were 3.83 % and 3.83 %, respectively.
ω Q c Q c = ω ρ α ρ α 2 + ω V ˙ α V ˙ α 2 + ω C p , α C p , α 2 + ω T α , i 2 + + ω T α , o 2 T α , i T α , o 2 1 2
ω C O P C O P = ω Q c Q c 2 + ω W W 2 1 2
The thermo-physical properties of CO2 and air were obtained from NIST REFPROP [26] during the data reduction process. Finally, it was observed that the maximum discrepancy regarding the heat balance between CO2 and the air was about 10% in the gas cooler.

3. Results and Discussion

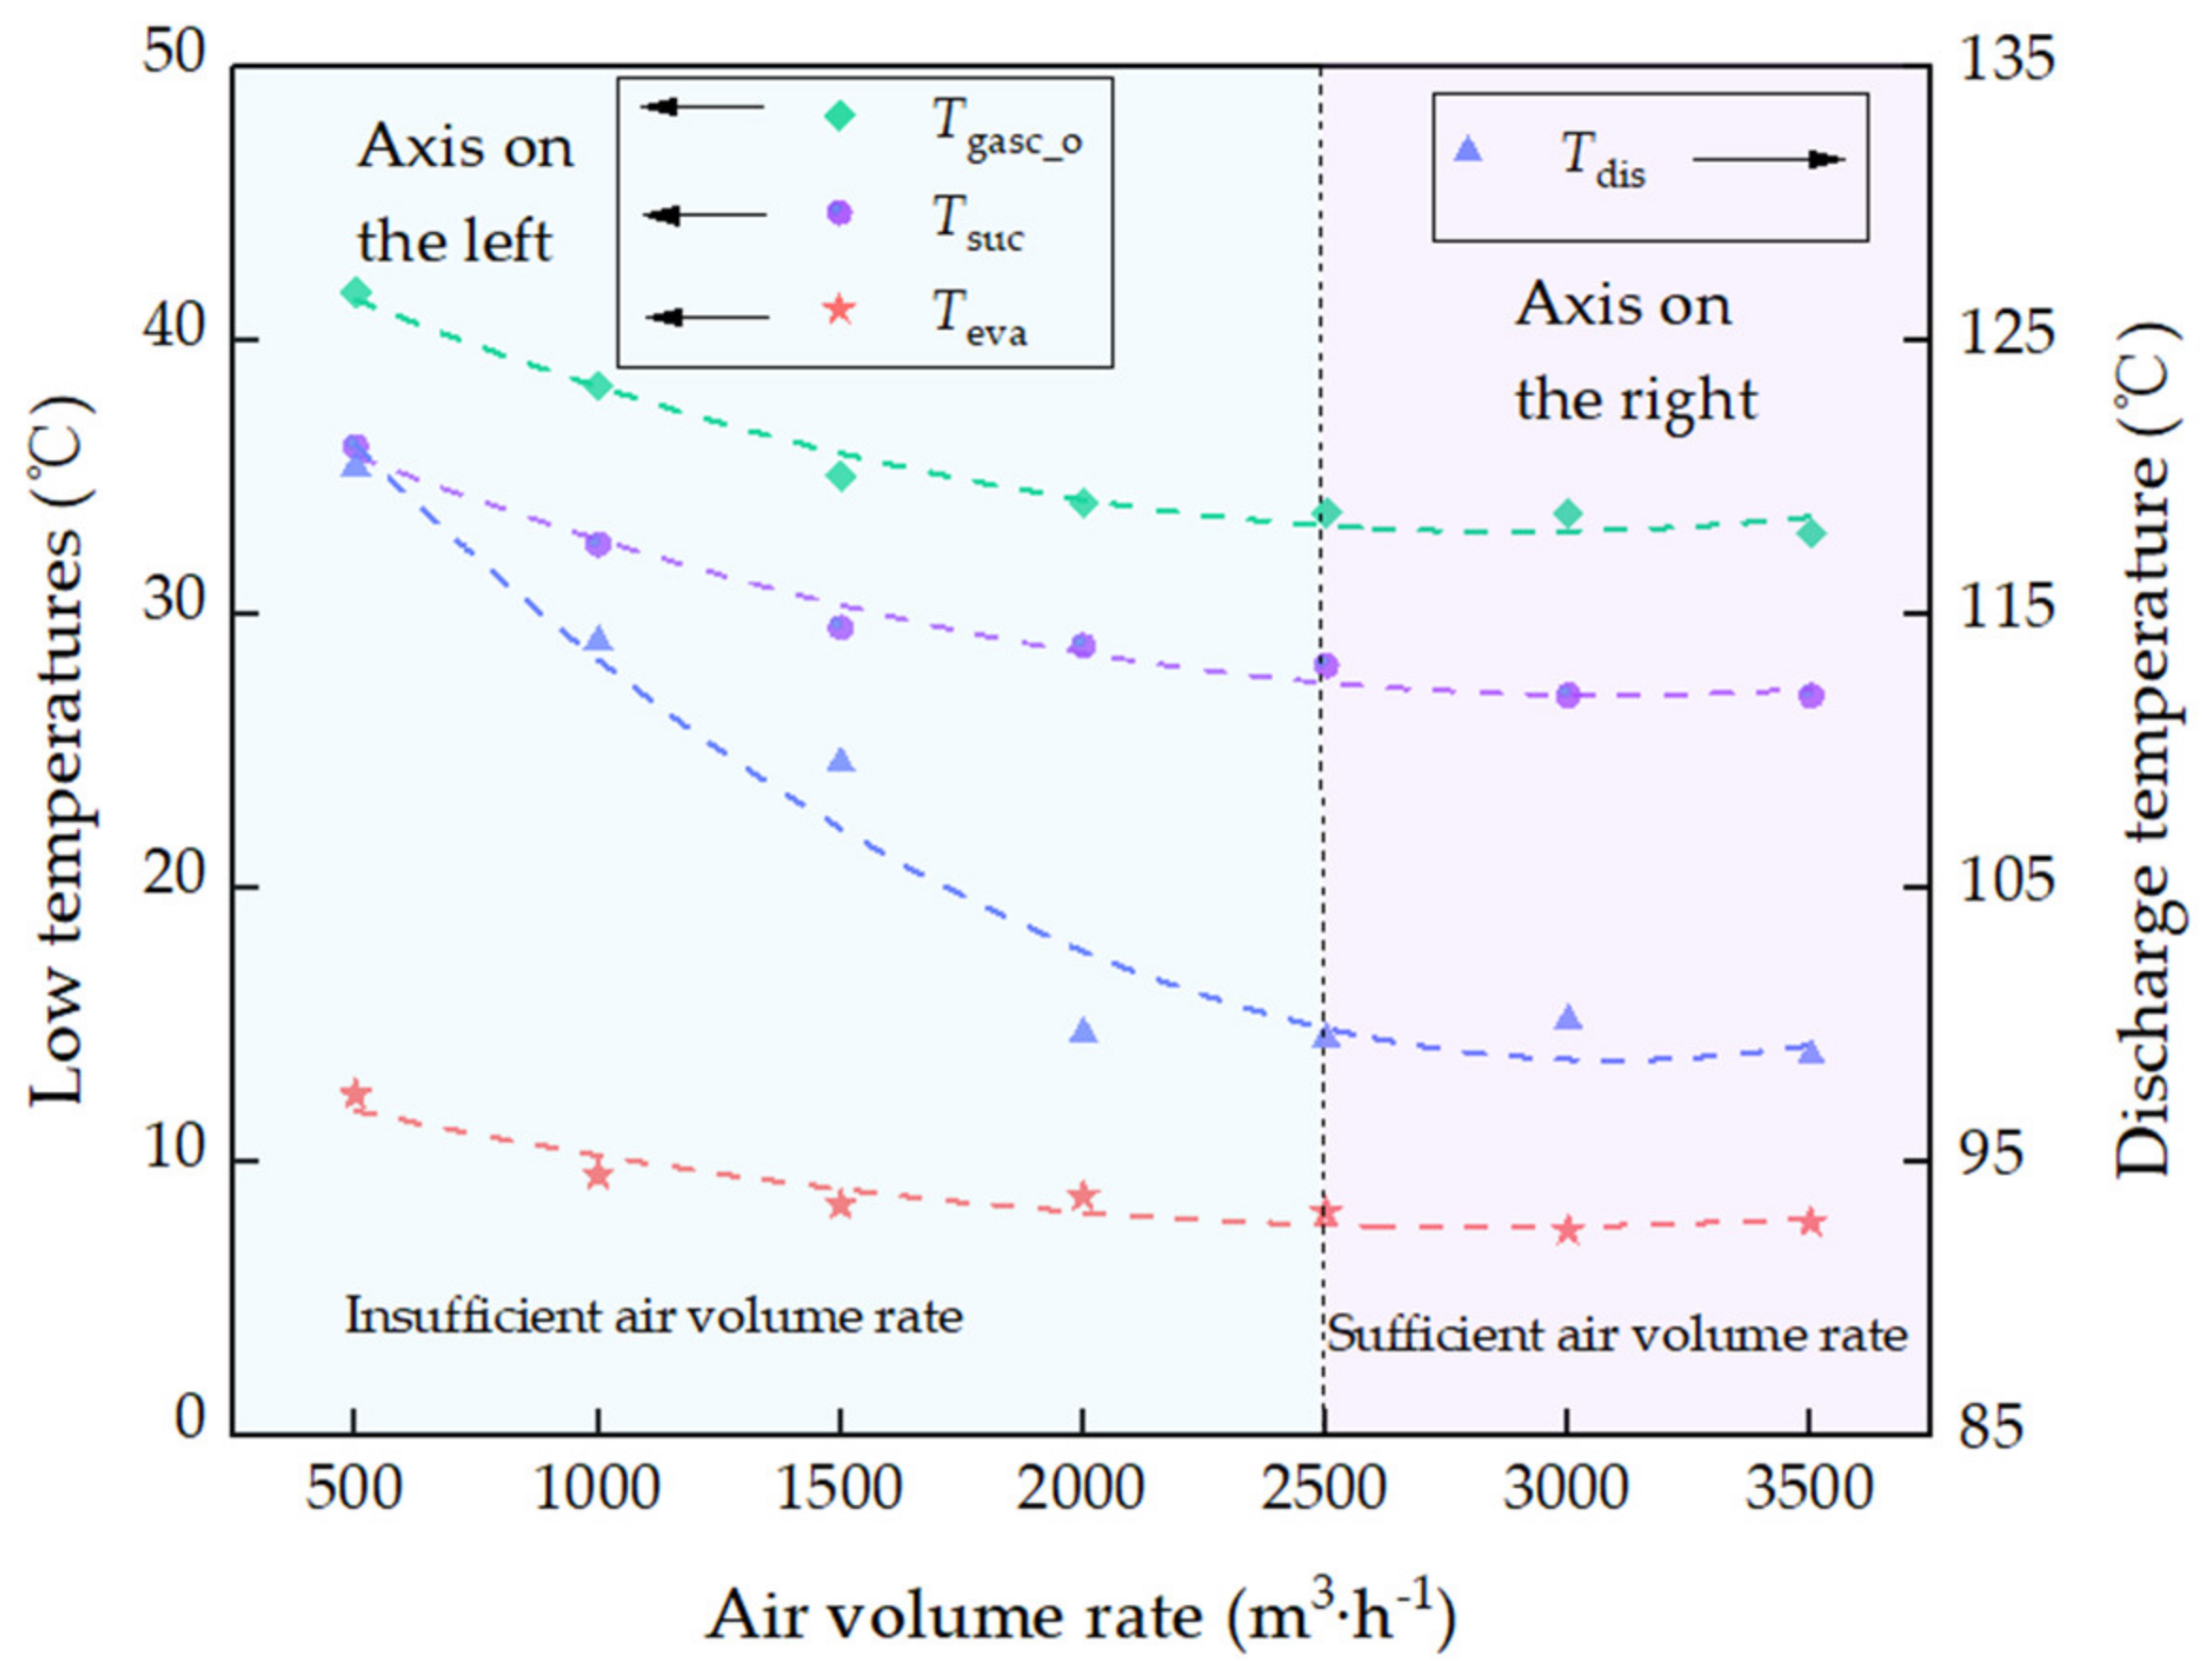
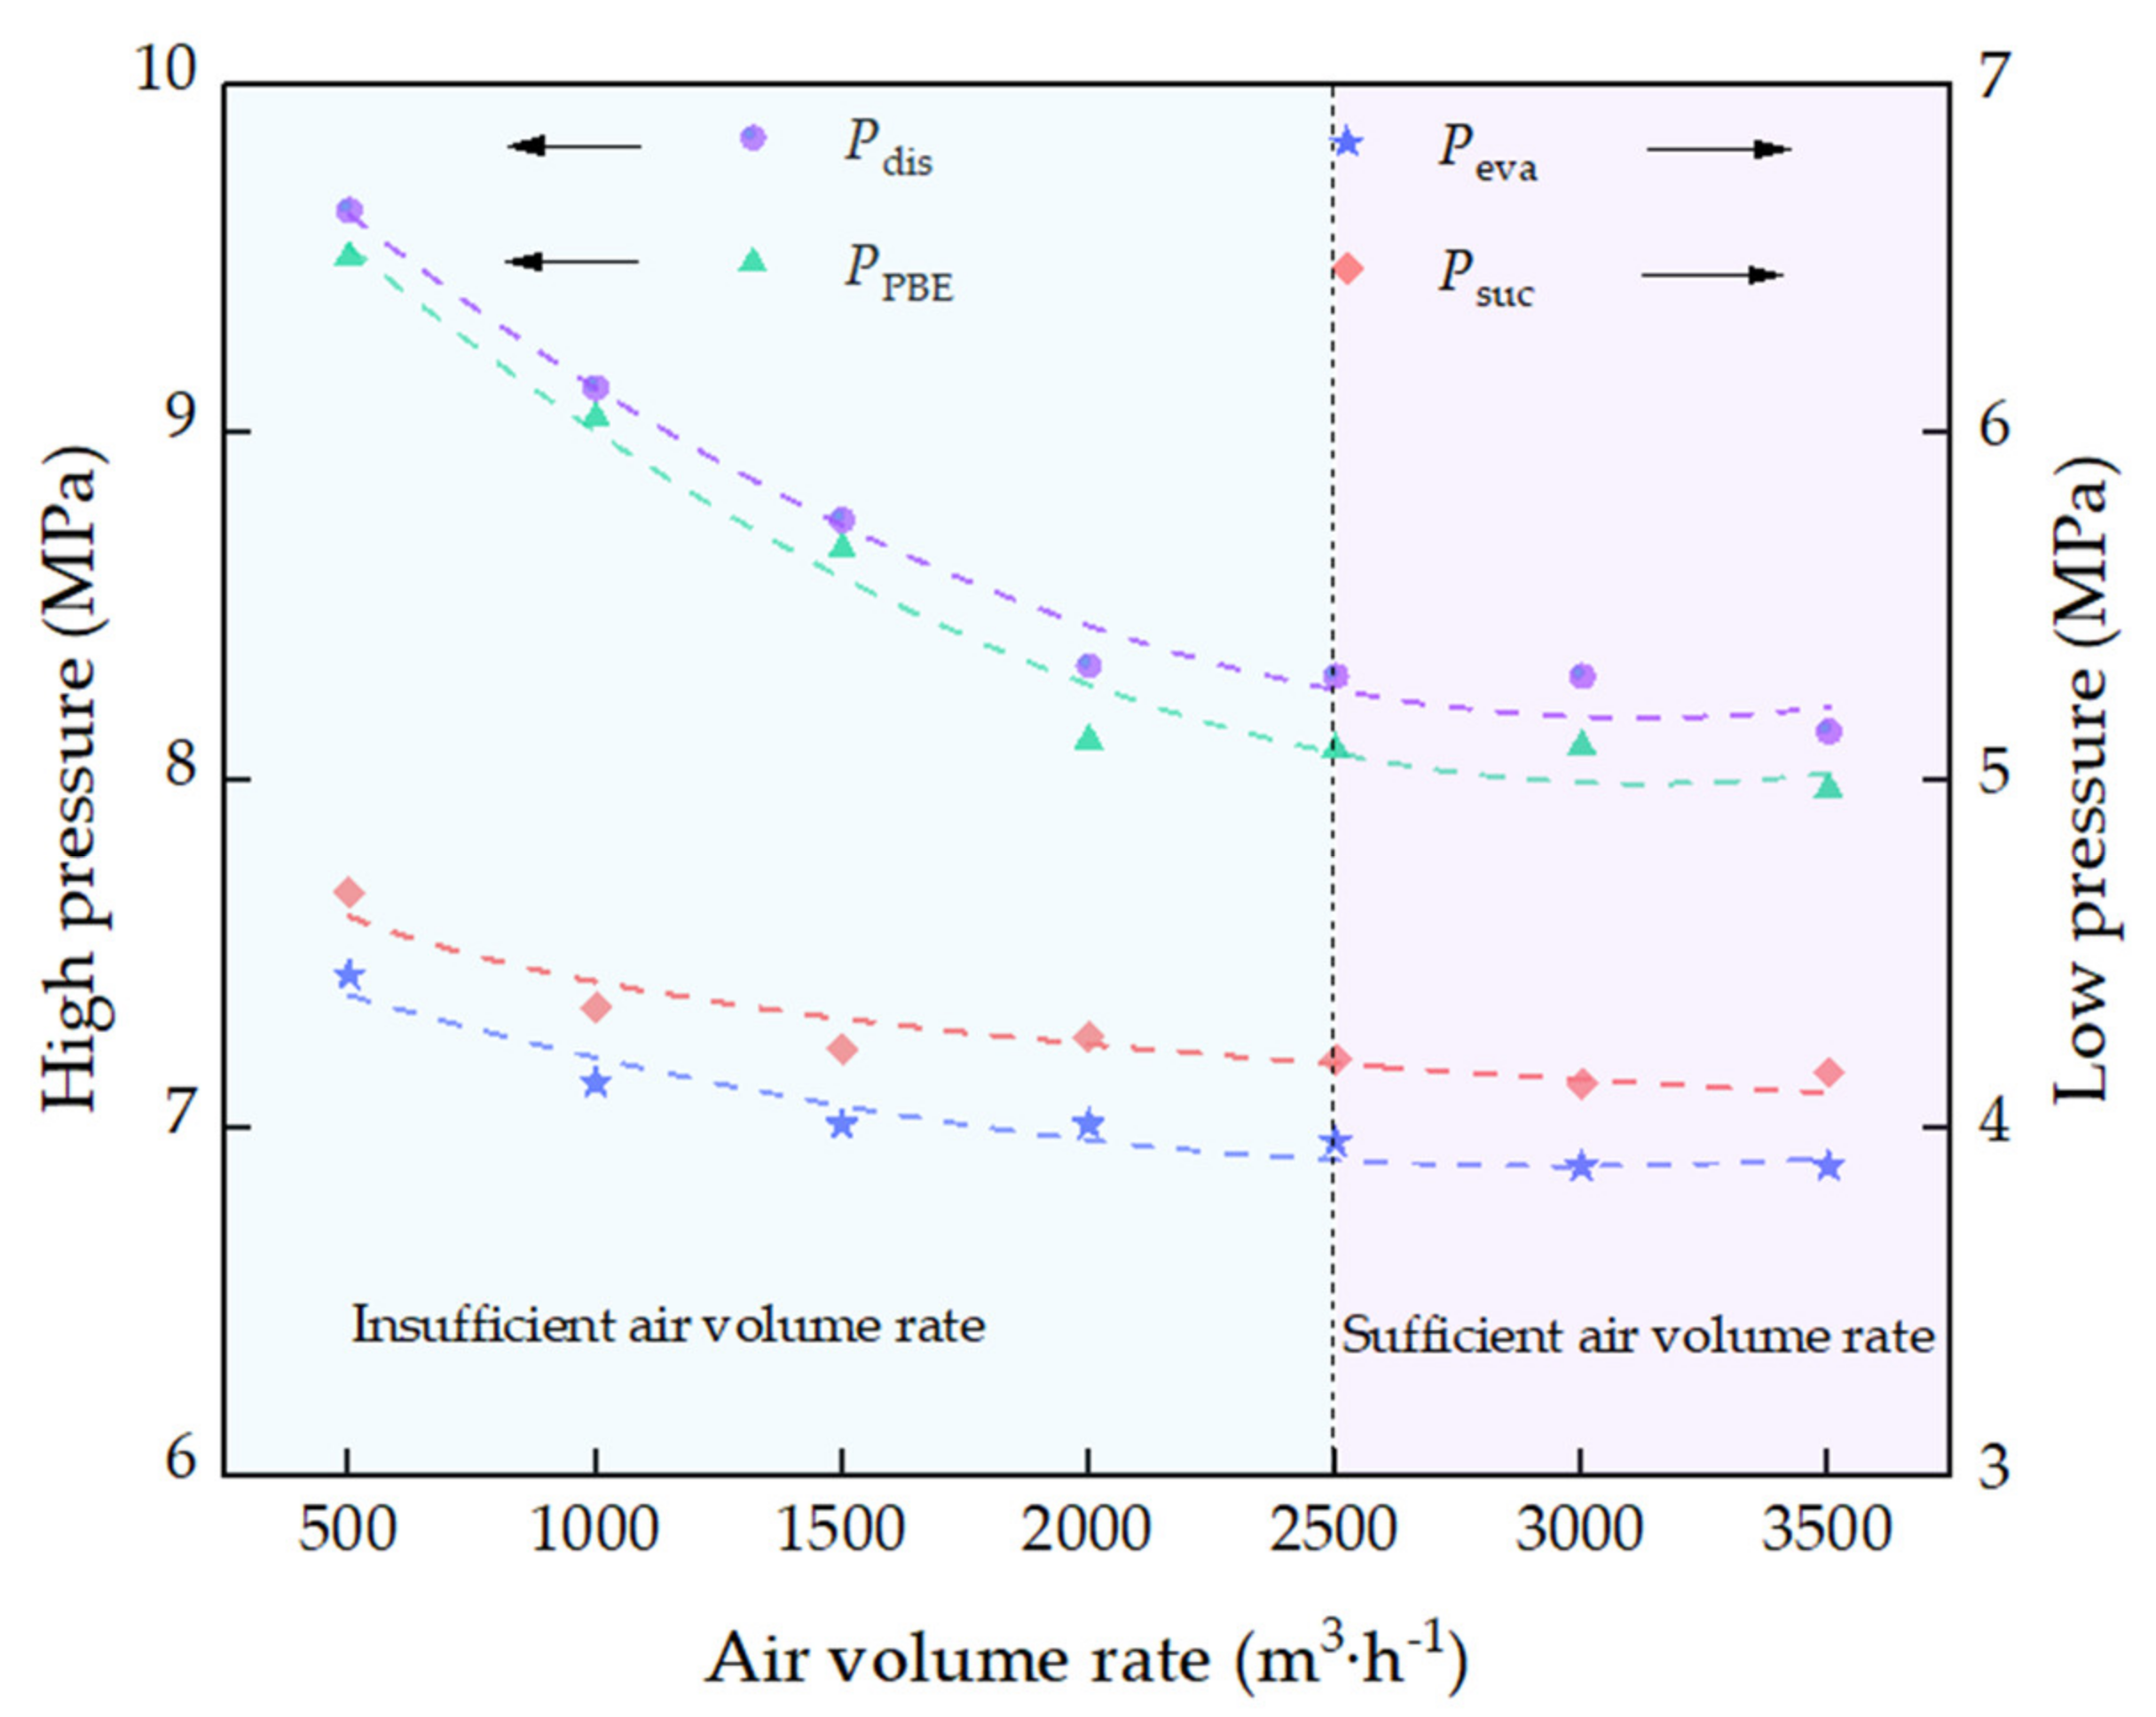
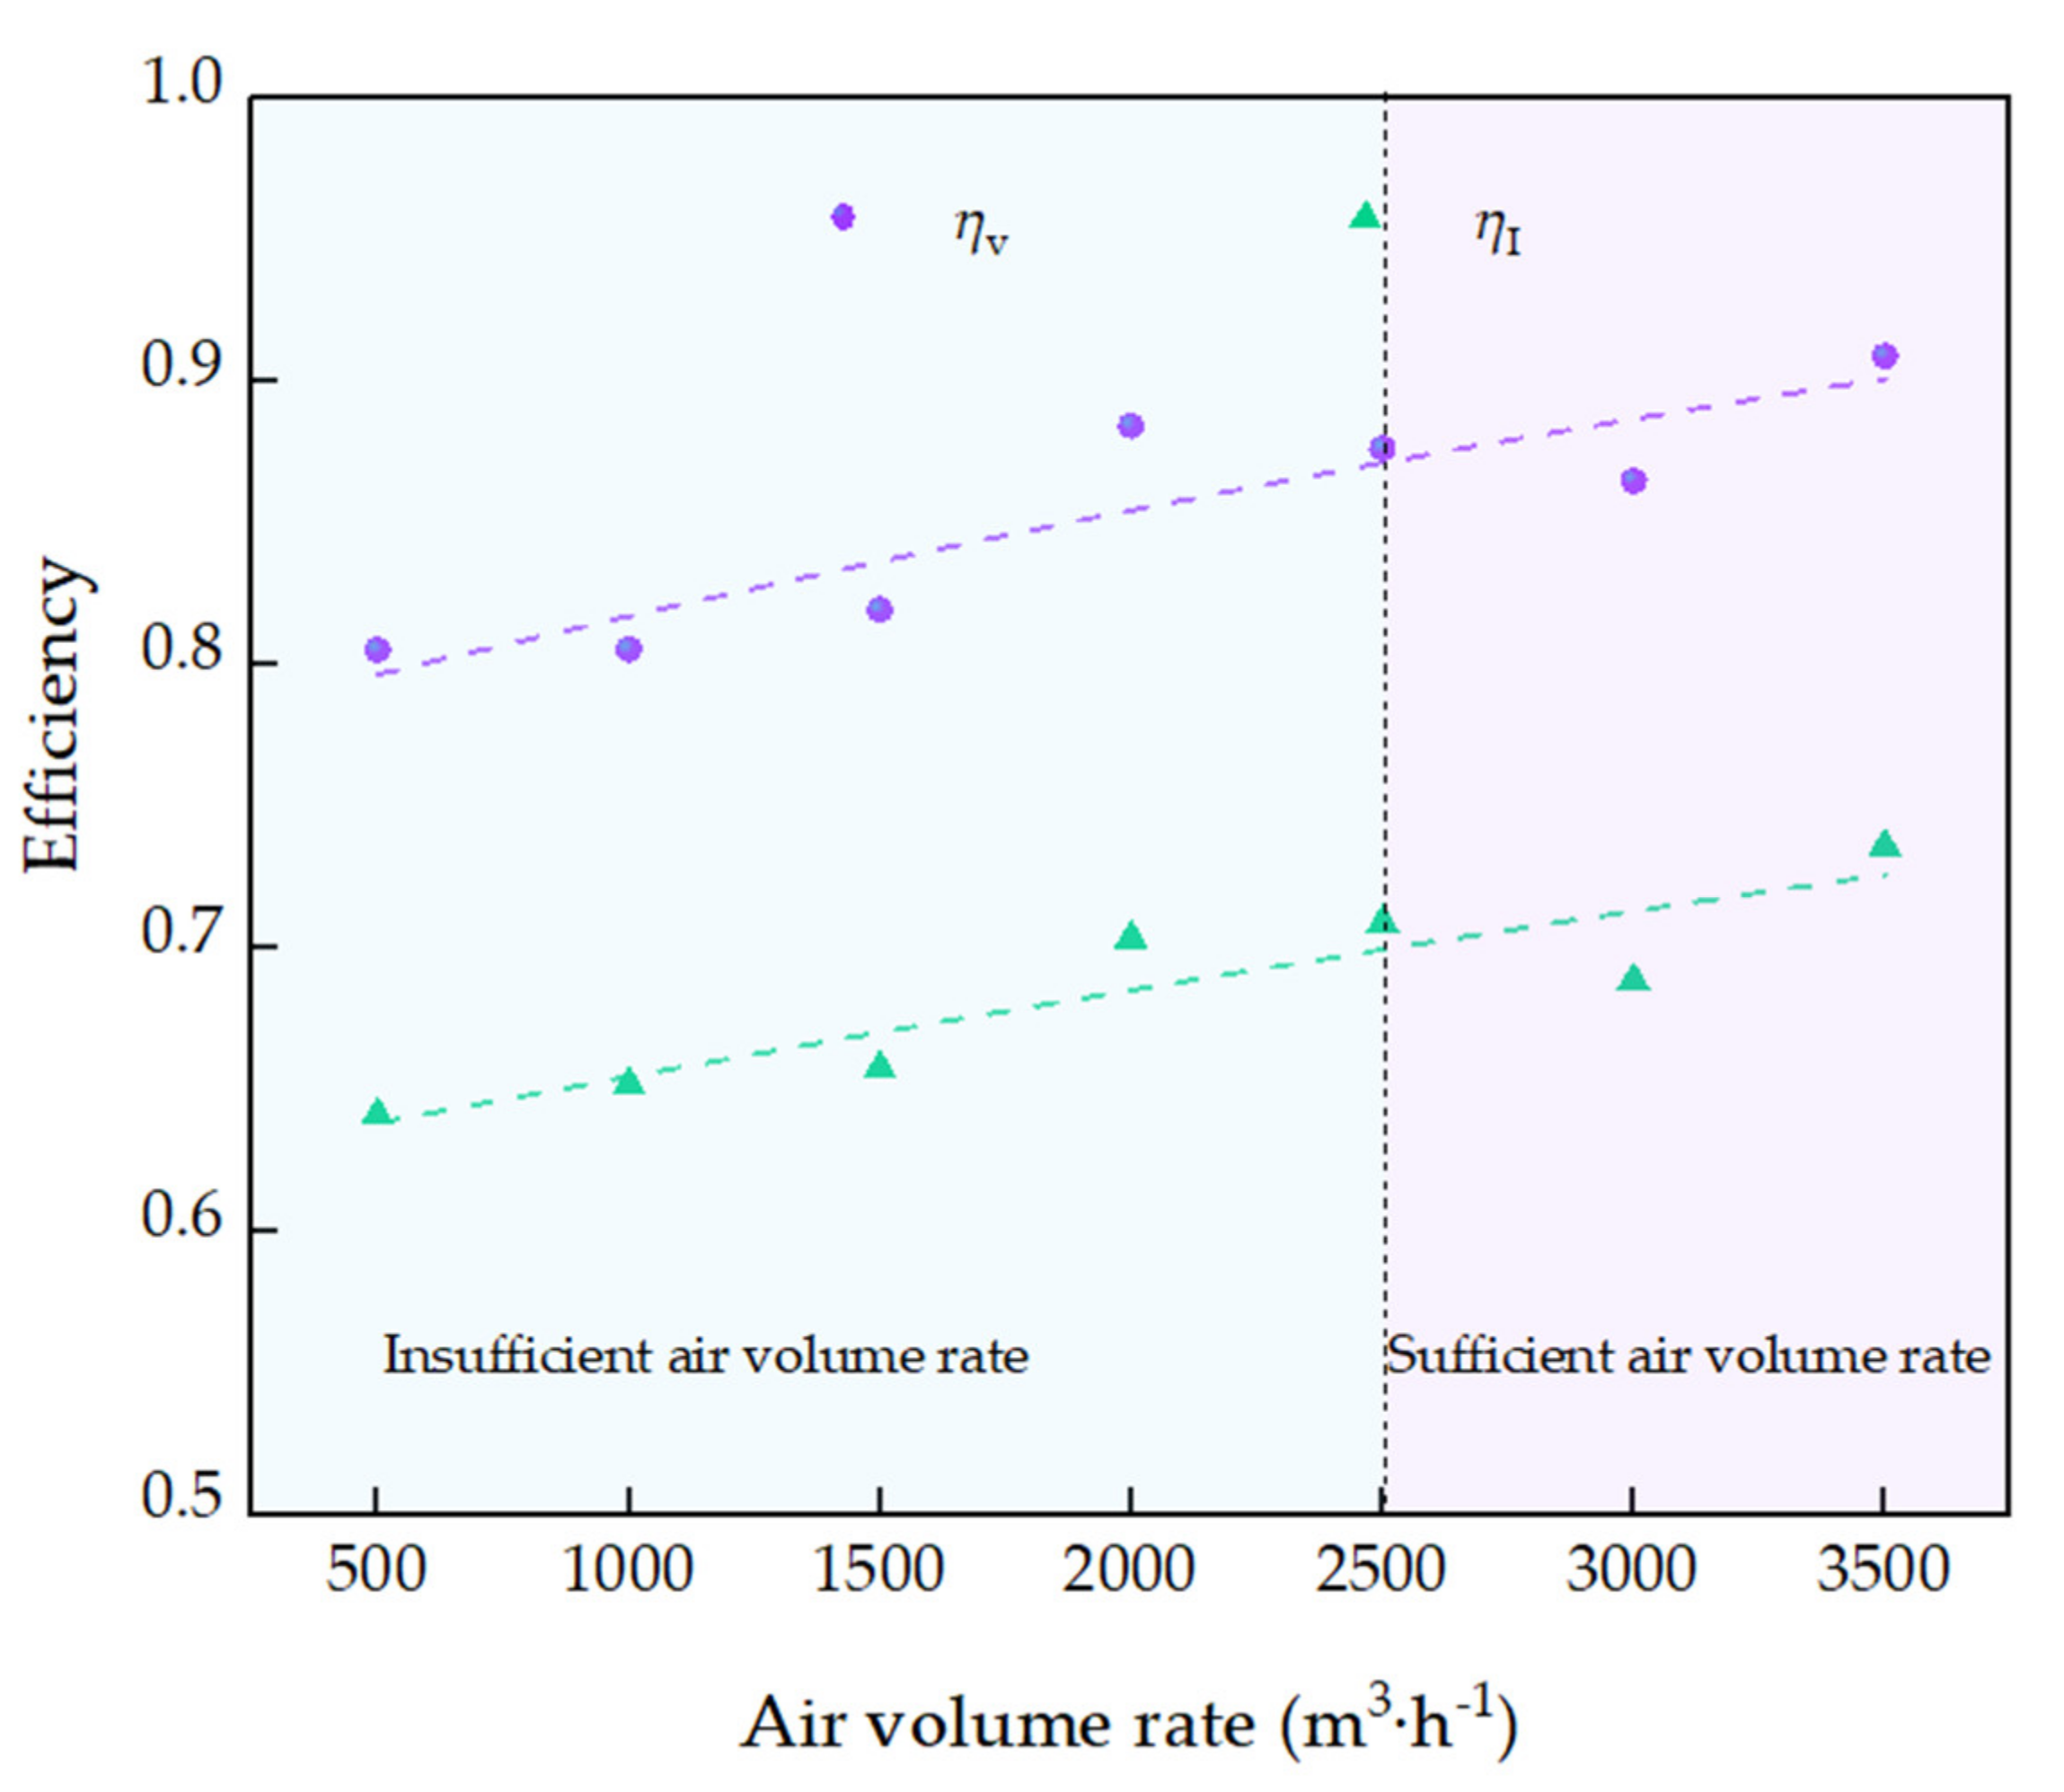
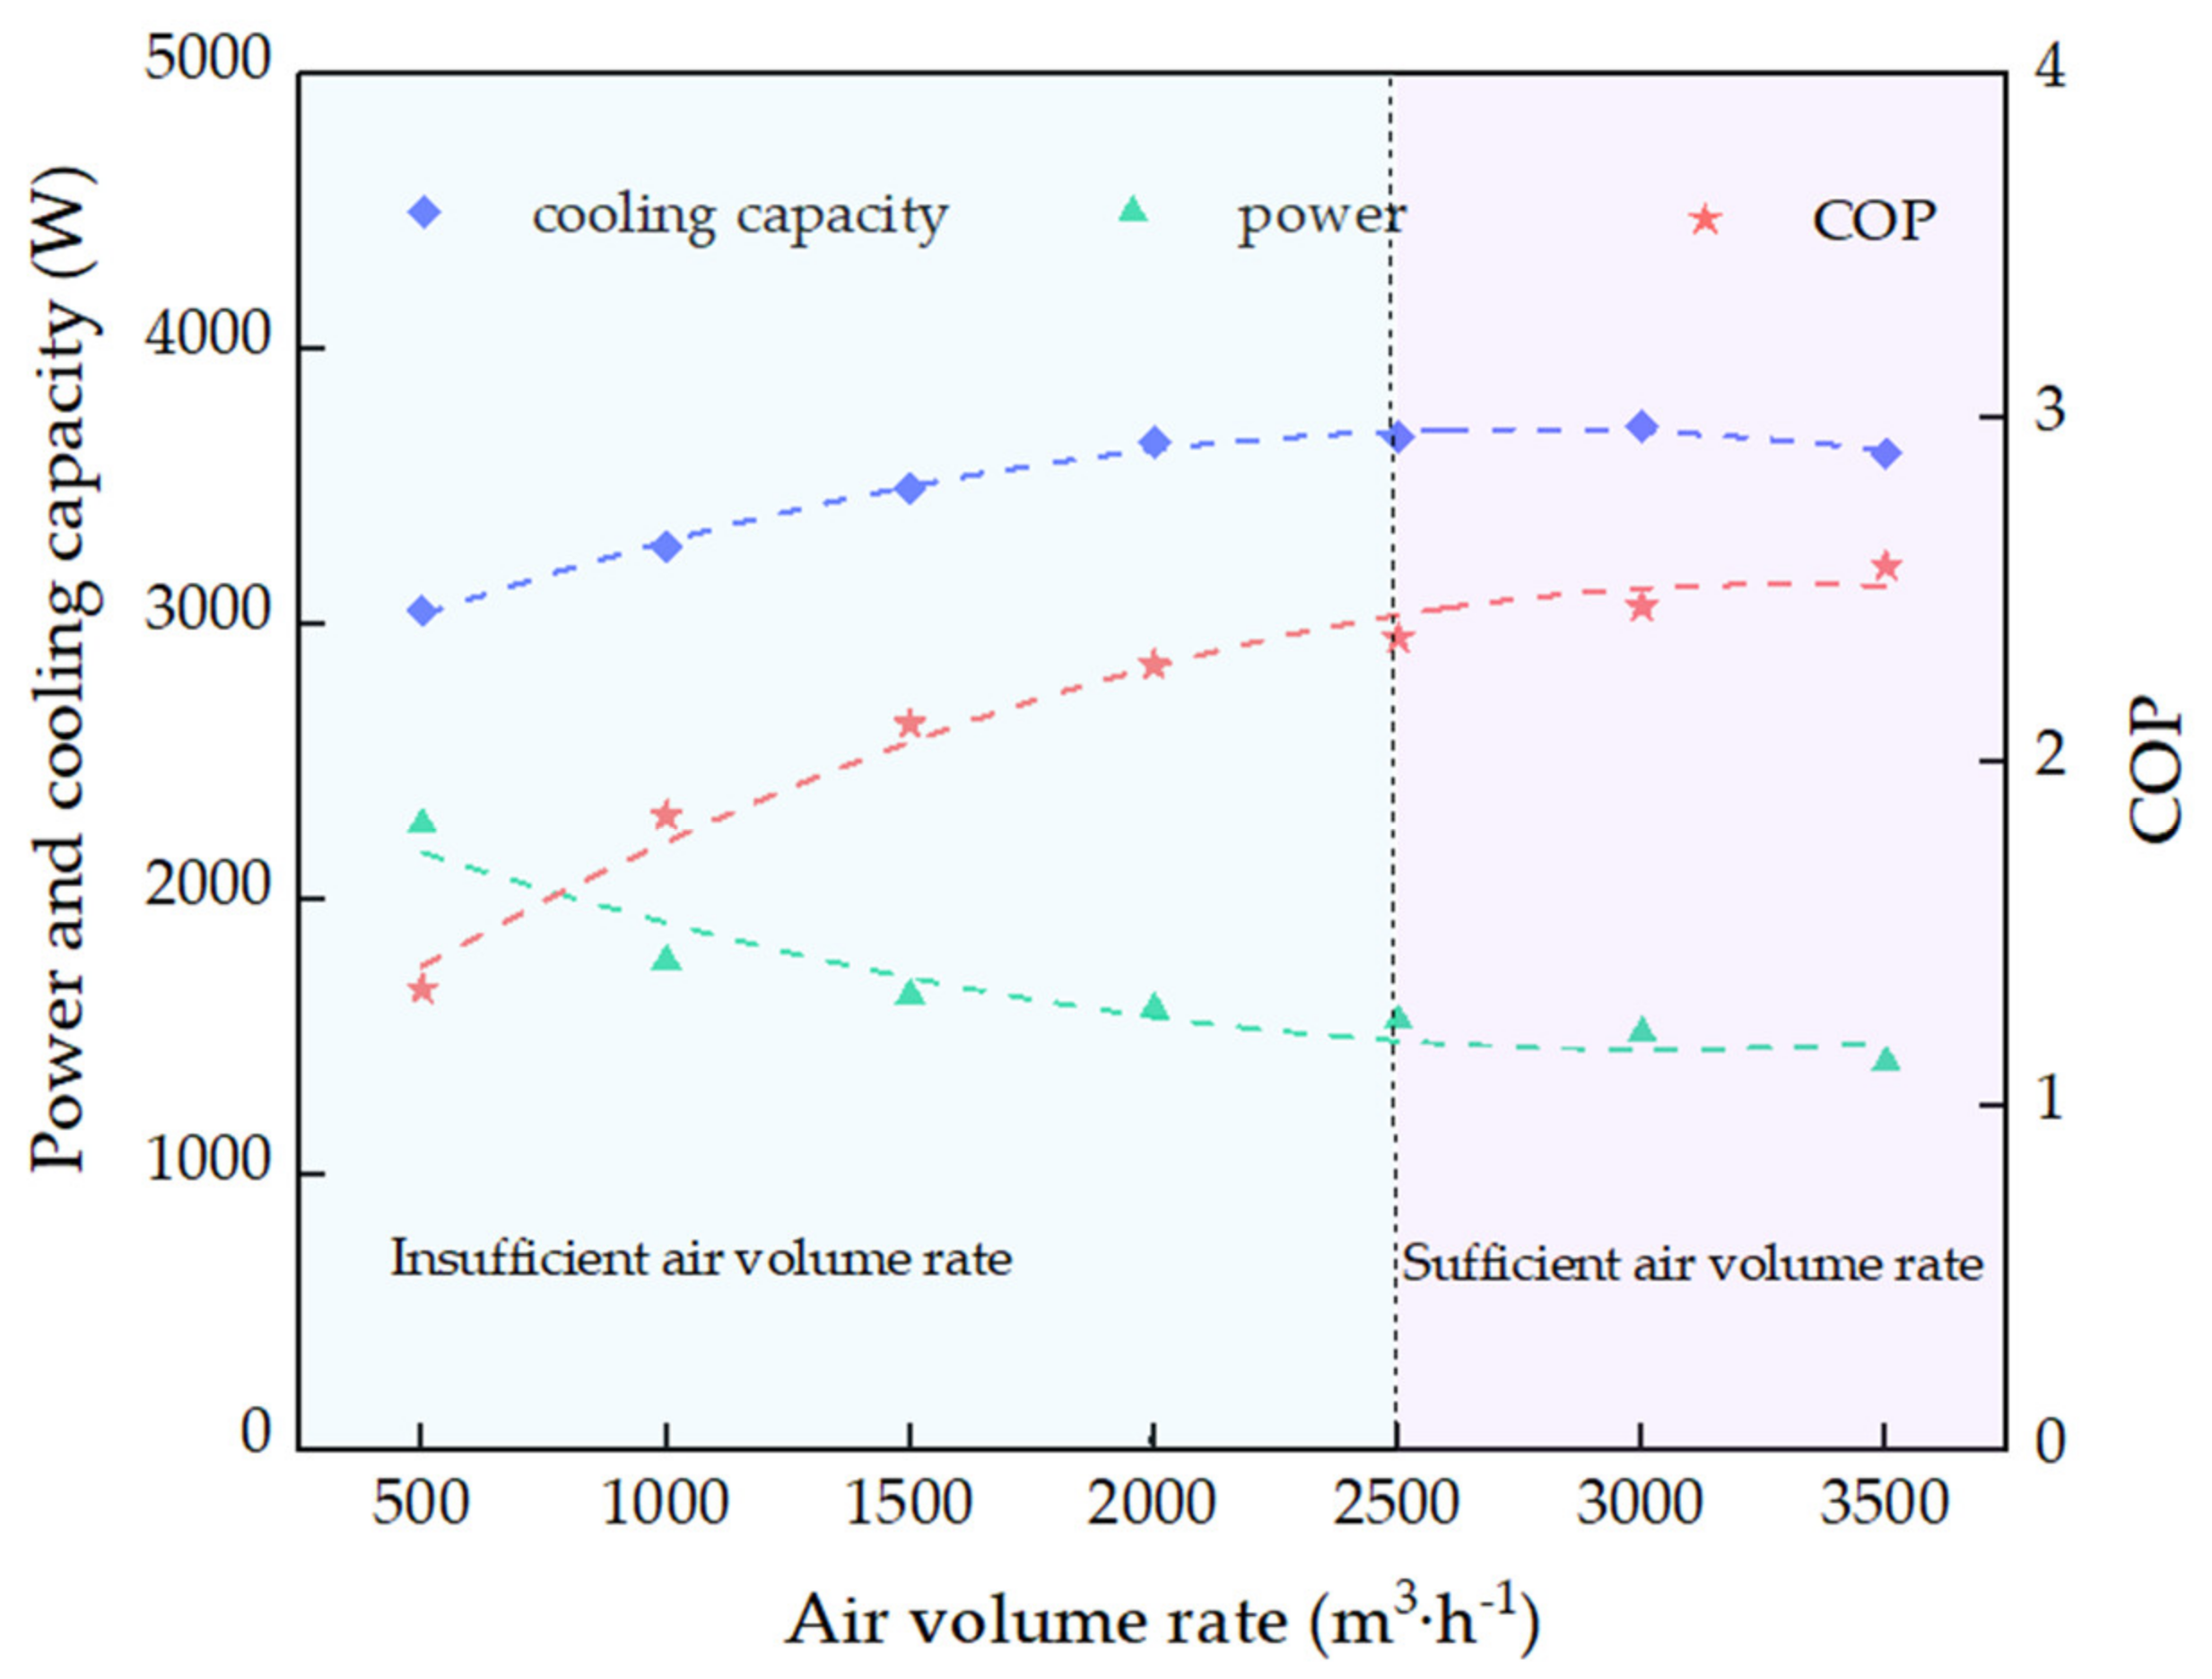
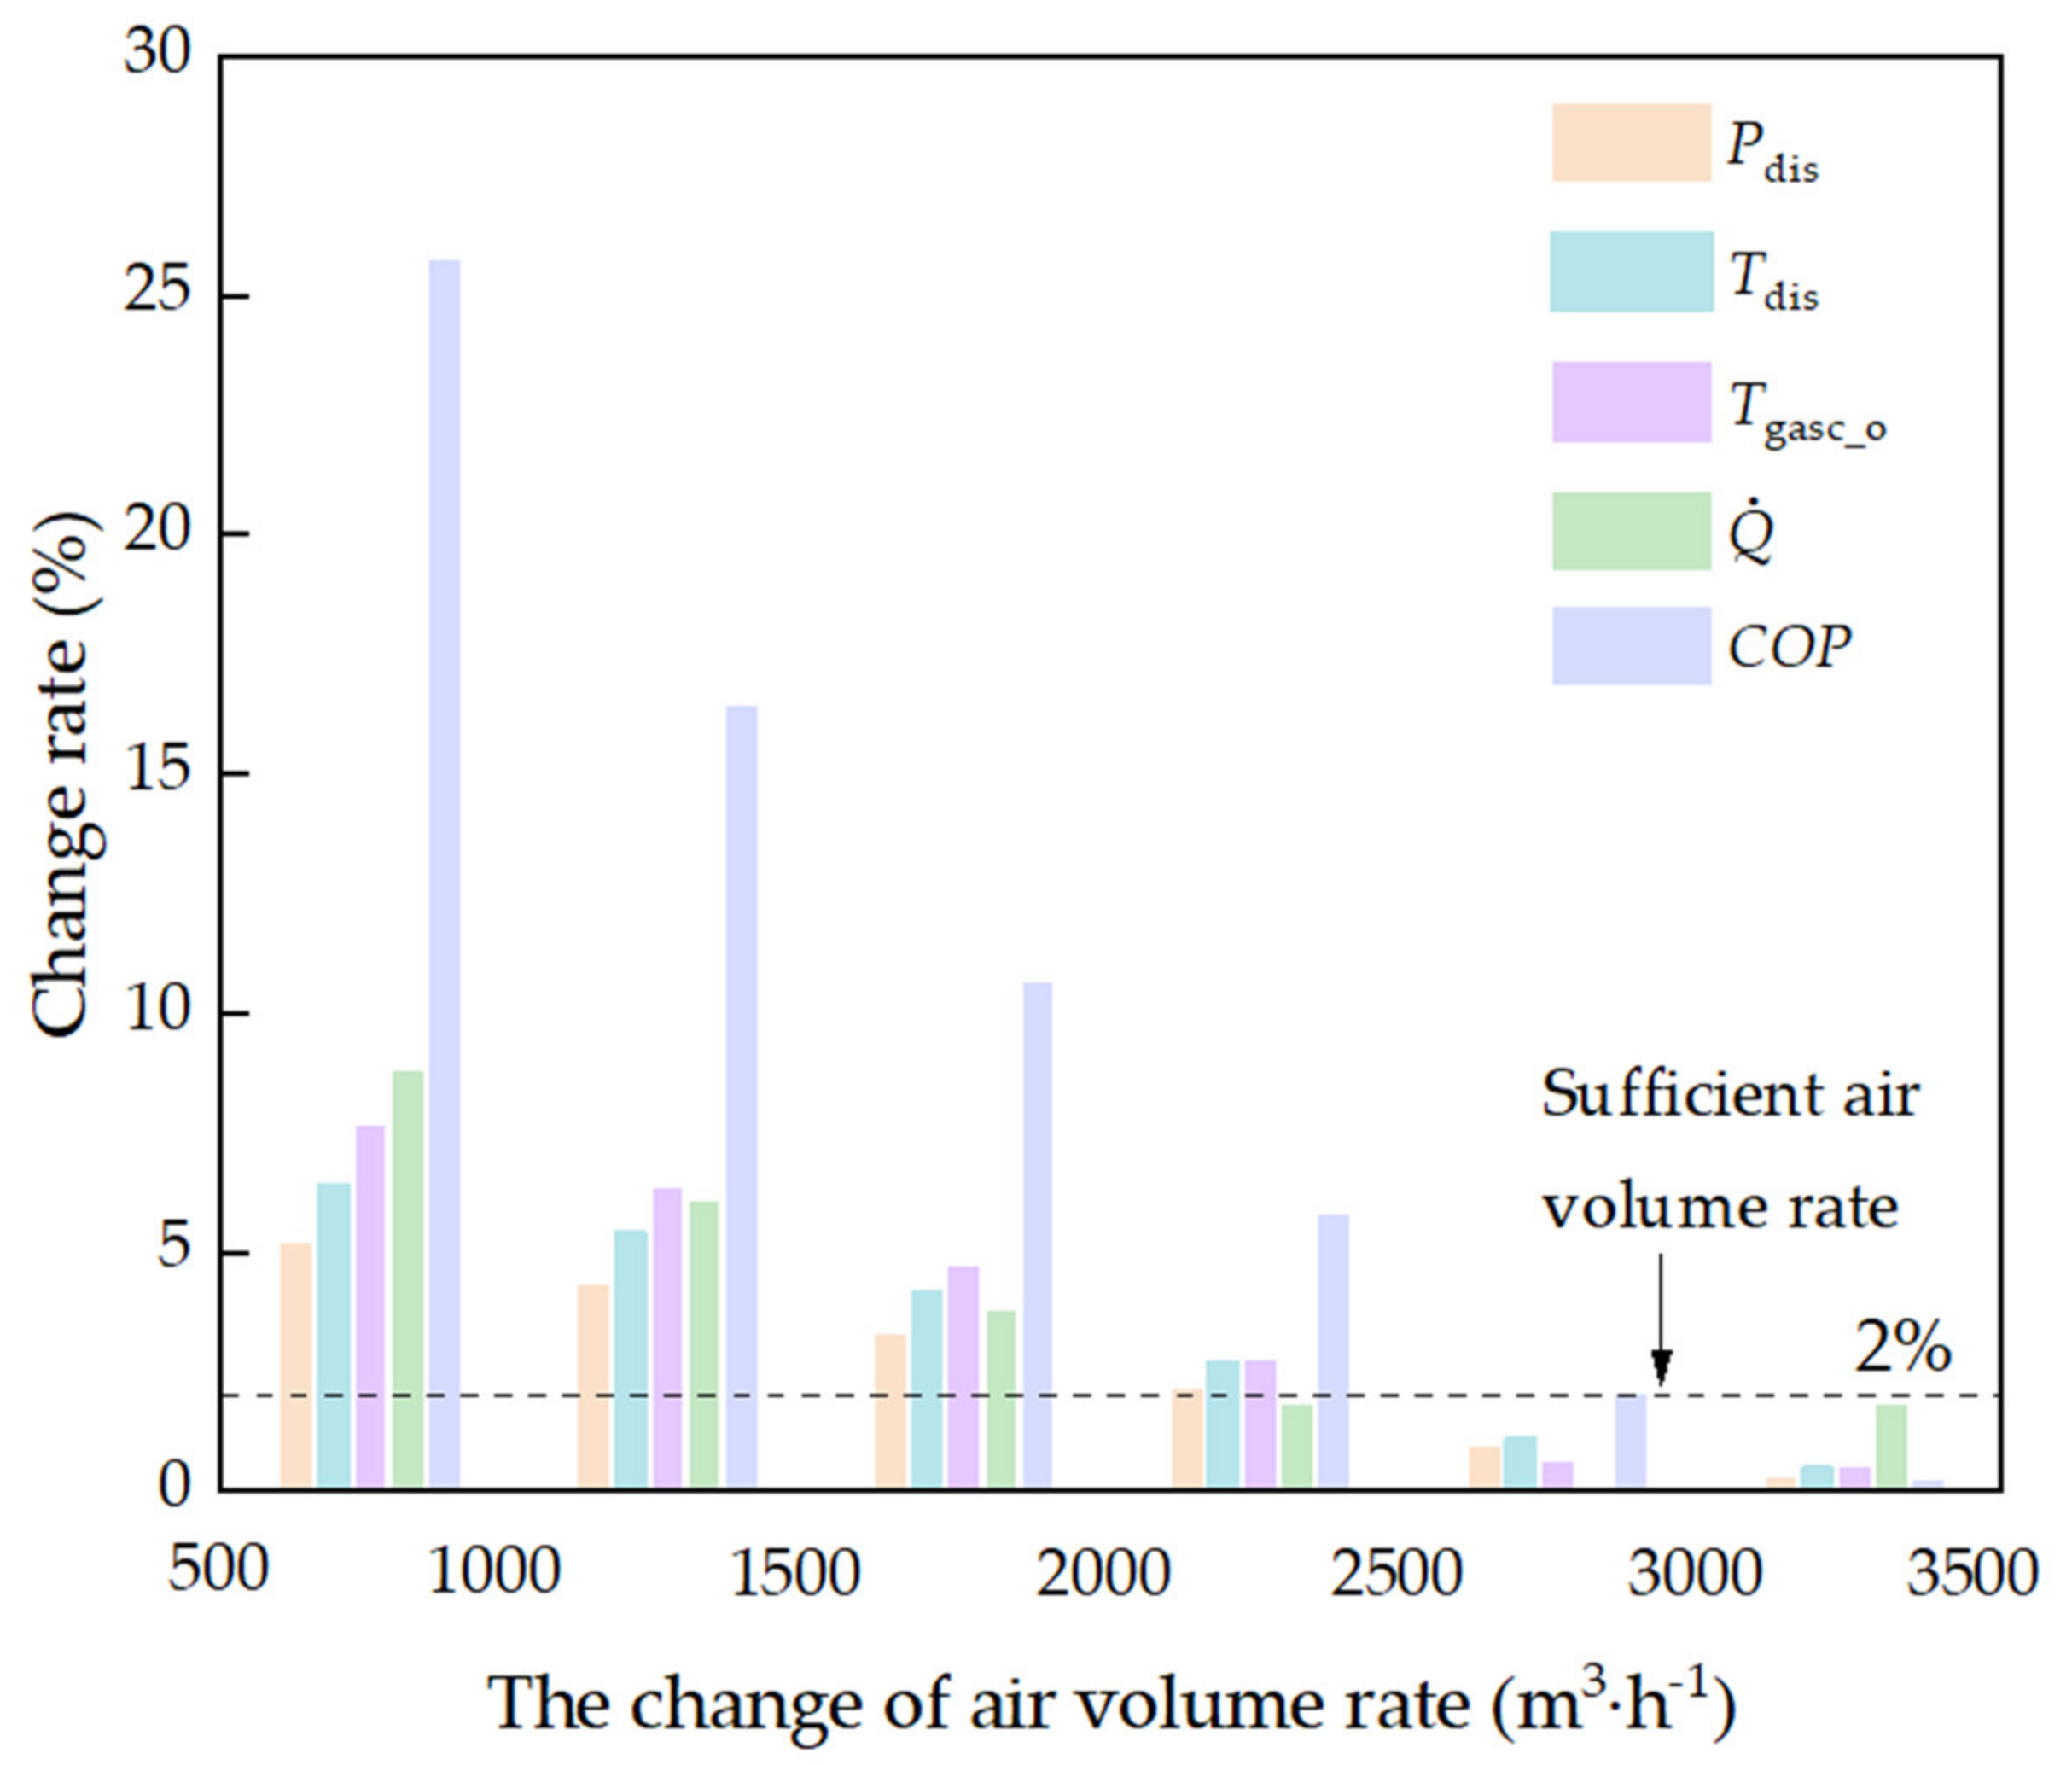
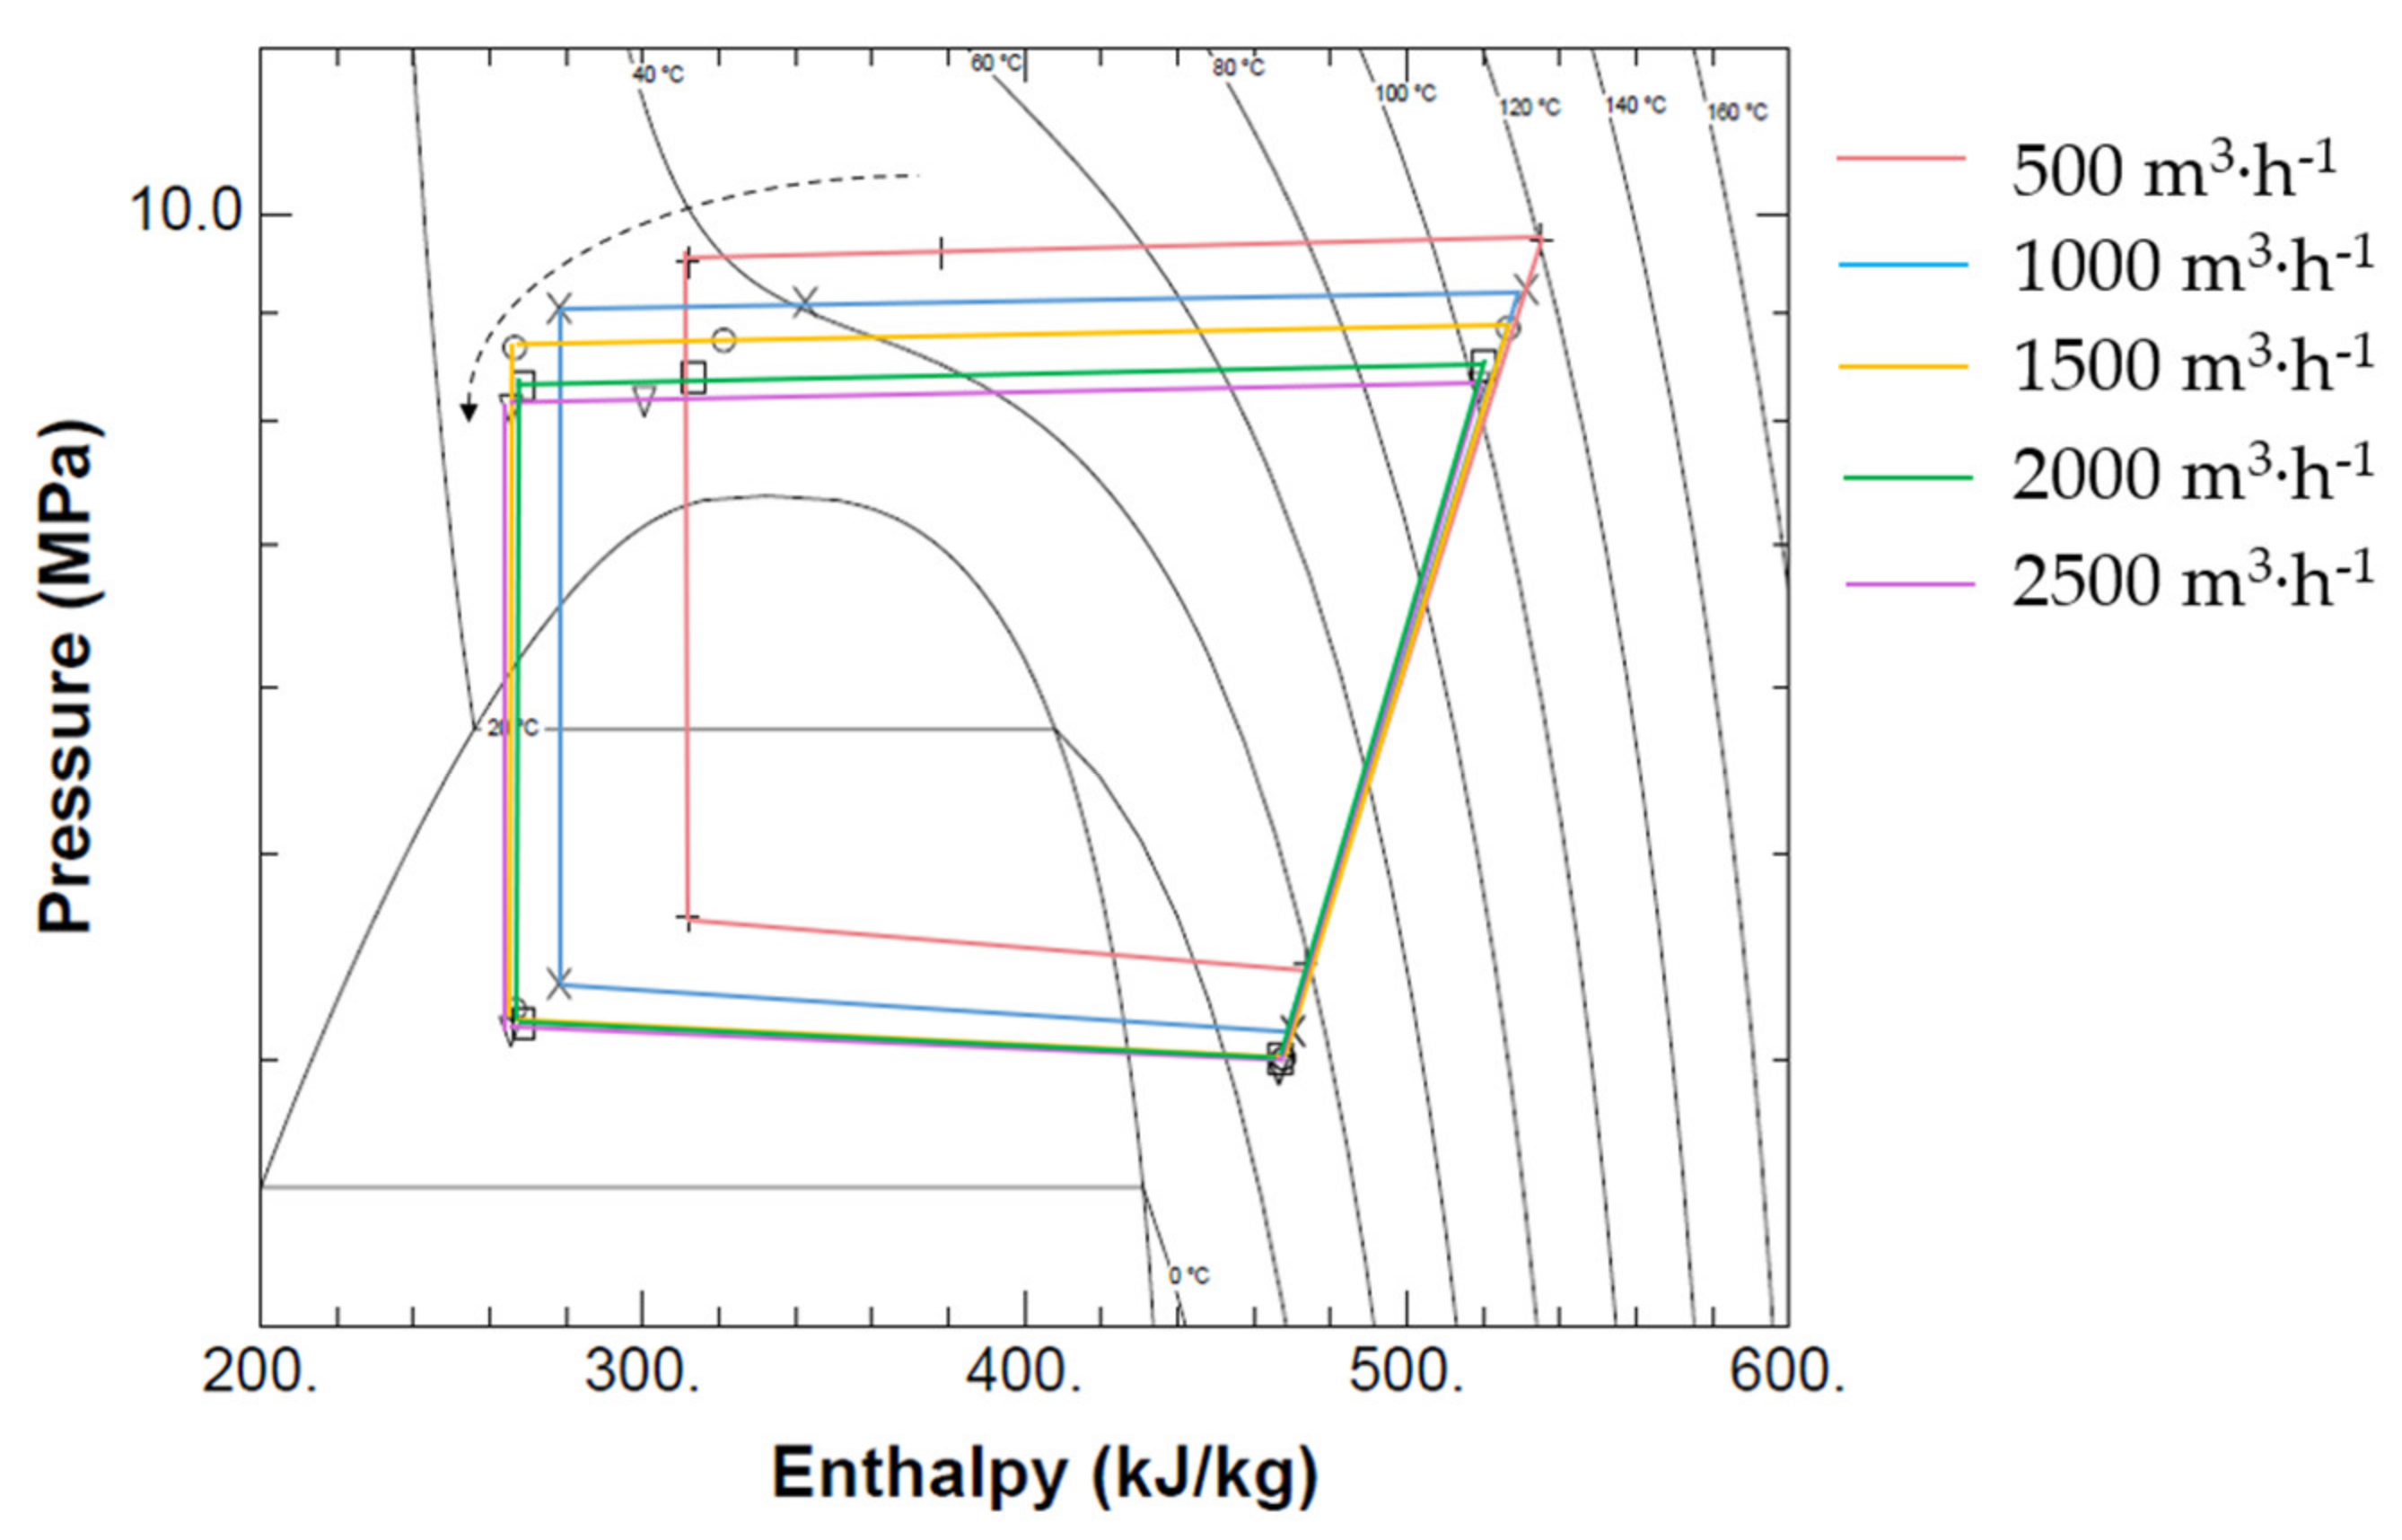
3.1. Influence of Gas Cooler Air Volume Flow Rate on Key Temperatures and Pressures

The effect of the gas cooler air volume flow rate on the COP, cooling capacity, compressor power input, key temperatures and pressures as well as on the compressor isentropic and volumetric efficiencies under the optimal discharge pressure was evaluated at the ambient temperature and compressor speed of 30 °C and 3500 rpm, respectively.
Figure 2 shows the variation characteristics of the evaporator (Teva), suction (Tsuc), discharge (Tdis) and CO2 gas cooler outlet (Tgasc_o) temperatures with the air volume flow rate on the gas cooler side. It could be seen that all the aforementioned temperatures decreased rapidly and then gradually became constant with the rise in gas cooler air volume flow rate. As the gas cooler air volume flow rate increased from 500 m3·h−1 to 2500 m3·h−1, the discharge temperature dropped by 20.88 K. Compared with the compressor discharge, the suction temperatures and the CO2 gas cooler outlet temperature showed less marked changes, which were equal to 8.00 K and 8.03 K, respectively. Additionally, the change in evaporation temperature was the smallest (i.e., 4.28 K). Therefore, the discharge temperature was the most suitable parameter for evaluating whether the gas cooler air volume flow rate was optimal. However, considering that the discharge temperature could not exceed 135 °C (i.e., the safety limit), another parameter for assessing the optimal gas cooler air volume flow rate was necessary. The CO2 gas cooler outlet temperature was found to be more affected by the air volume flow rate in the gas cooler than the evaporator and compressor suction temperatures. Moreover, it was the most directly influencing parameter of the air flow rate on the gas cooler side. Therefore, the CO2 gas cooler outlet temperature was taken as the second evaluation parameter.
Figure 3 illustrates the change characteristics of the evaporator (Peva), compressor discharge (Pdis) and suction (Psuc) pressures as well as the pressure upstream of the expansion valve (PPBE) with the gas cooler air volume flow rate. The discharge pressure and the pressure upstream the EXV were the high pressures, whereas the evaporation pressure and suction pressure were the low pressures. It could be concluded that the pressures decreased rapidly at first and then gradually stabilized as the gas cooler air volume flow rate increased. Moreover, it was found that the high pressures of the system changed more significantly with the gas cooler air volume flow rate than the low pressures. As the gas cooler air volume flow rate increased from 500 m3·h−1 to 2500 m3·h−1, the discharge pressure and PBE decreased by 1.34 MPa and 1.42 Mpa, respectively. However, the suction pressure and the evaporation pressure decreased only by 0.48 Mpa and 0.47 Mpa, respectively. Therefore, it could be stated that the discharge pressure and the PBE were more suitable as parameters for assessing whether the gas cooler air volume flow rate was optimal. Since the pressure difference between the discharge pressure and PBE was so small and constant, which was caused by the almost unchanged pressure drop in the gas cooler and pipes, only the discharge pressure was taken as parameters to evaluate the optimum gas cooler air volume flow rate.
It can be seen from Figure 4 that the isentropic (ηI) and volumetric (ηV) efficiencies of the compressor generally showed a slowly growing trend as the gas cooler air volume flow rate increased. Therefore, it could be concluded that the increase in air volume flow rate on the gas cooler side improves the isentropic efficiency and volumetric efficiency of the compressor. However, these efficiencies were not suitable as parameters for assessing whether the gas cooler air volume flow rate was optimal, since they were not significantly sensitive to changes in gas cooler air volume flow rate.
Figure 5 presents the characteristics of the cooling capacity, compressor power input and COP with respect to the gas cooler air volume flow rate. As the gas cooler air volume flow rate increased, the compressor power input decreased rapidly at first and then gradually stabilized. By contrast, the cooling capacity was found to first increase, then gradually stabilize and finally, slightly decrease. As the gas cooler air volume flow rate increased, the heat exchange rate between the refrigerant and the air in the gas cooler was noteworthy. The CO2 gas cooler outlet temperature gradually decreased, resulting in a progressive reduction in enthalpy of the refrigerant at the outlet of the gas cooler and thus in an increase in cooling capacity. By contrast, the optimal discharge pressure value gradually decreased as the gas cooler air volume flow rate increased, which had a negative impact on the increase in cooling capacity. In general, under the combined effect of the gas cooler outlet temperature and discharge pressure, the trend of the cooling capacity initially increased rapidly, then remained unchanged and finally decreased slightly. The COP of the air conditioning system first increased rapidly with the gas cooler air volume flow rate and then the rate of increase gradually reduced. Therefore, it could be concluded that there is an optimal air volume flow rate and the performance was no longer significantly improved as the air volume flow rate exceeded the optimal value.
The COP and the cooling capacity are the conventional evaluation parameters for directly judging whether the air volume flow rate of the gas cooler is optimal. However, in the actual driving process, the cooling capacity and COP of mobile air conditioner units cannot be measured. Therefore, it is necessary to propose some other criteria, which can be quantified in real time and used to intuitively reflect whether the air volume is optimal. After the above analysis, the discharge temperature, the CO2 gas cooler outlet temperature and the discharge pressure were adopted as evaluation parameters for assessing whether the gas cooler air volume flow rate was optimal. In order to further improve this evaluation, additional experimental exploration and data analysis were carried out. Figure 6 shows the evaluation parameters and the change rate of the cooling capacity and COP with gas cooler air volume flow rate. It was found that the change rate of the system evaluation parameters gradually decreased as the gas cooler air volume flow rate increased from 500 m3·h1 to 2500 m3·h1. Continuing to increase the gas cooler air volume flow rate, the change rate of the evaluation parameters considered in Figure 6 was less than 2%. Therefore, the change rate of these parameters less than 2% was determined as a quantitative indicator of whether the gas cooler air volume flow rate was optimal.

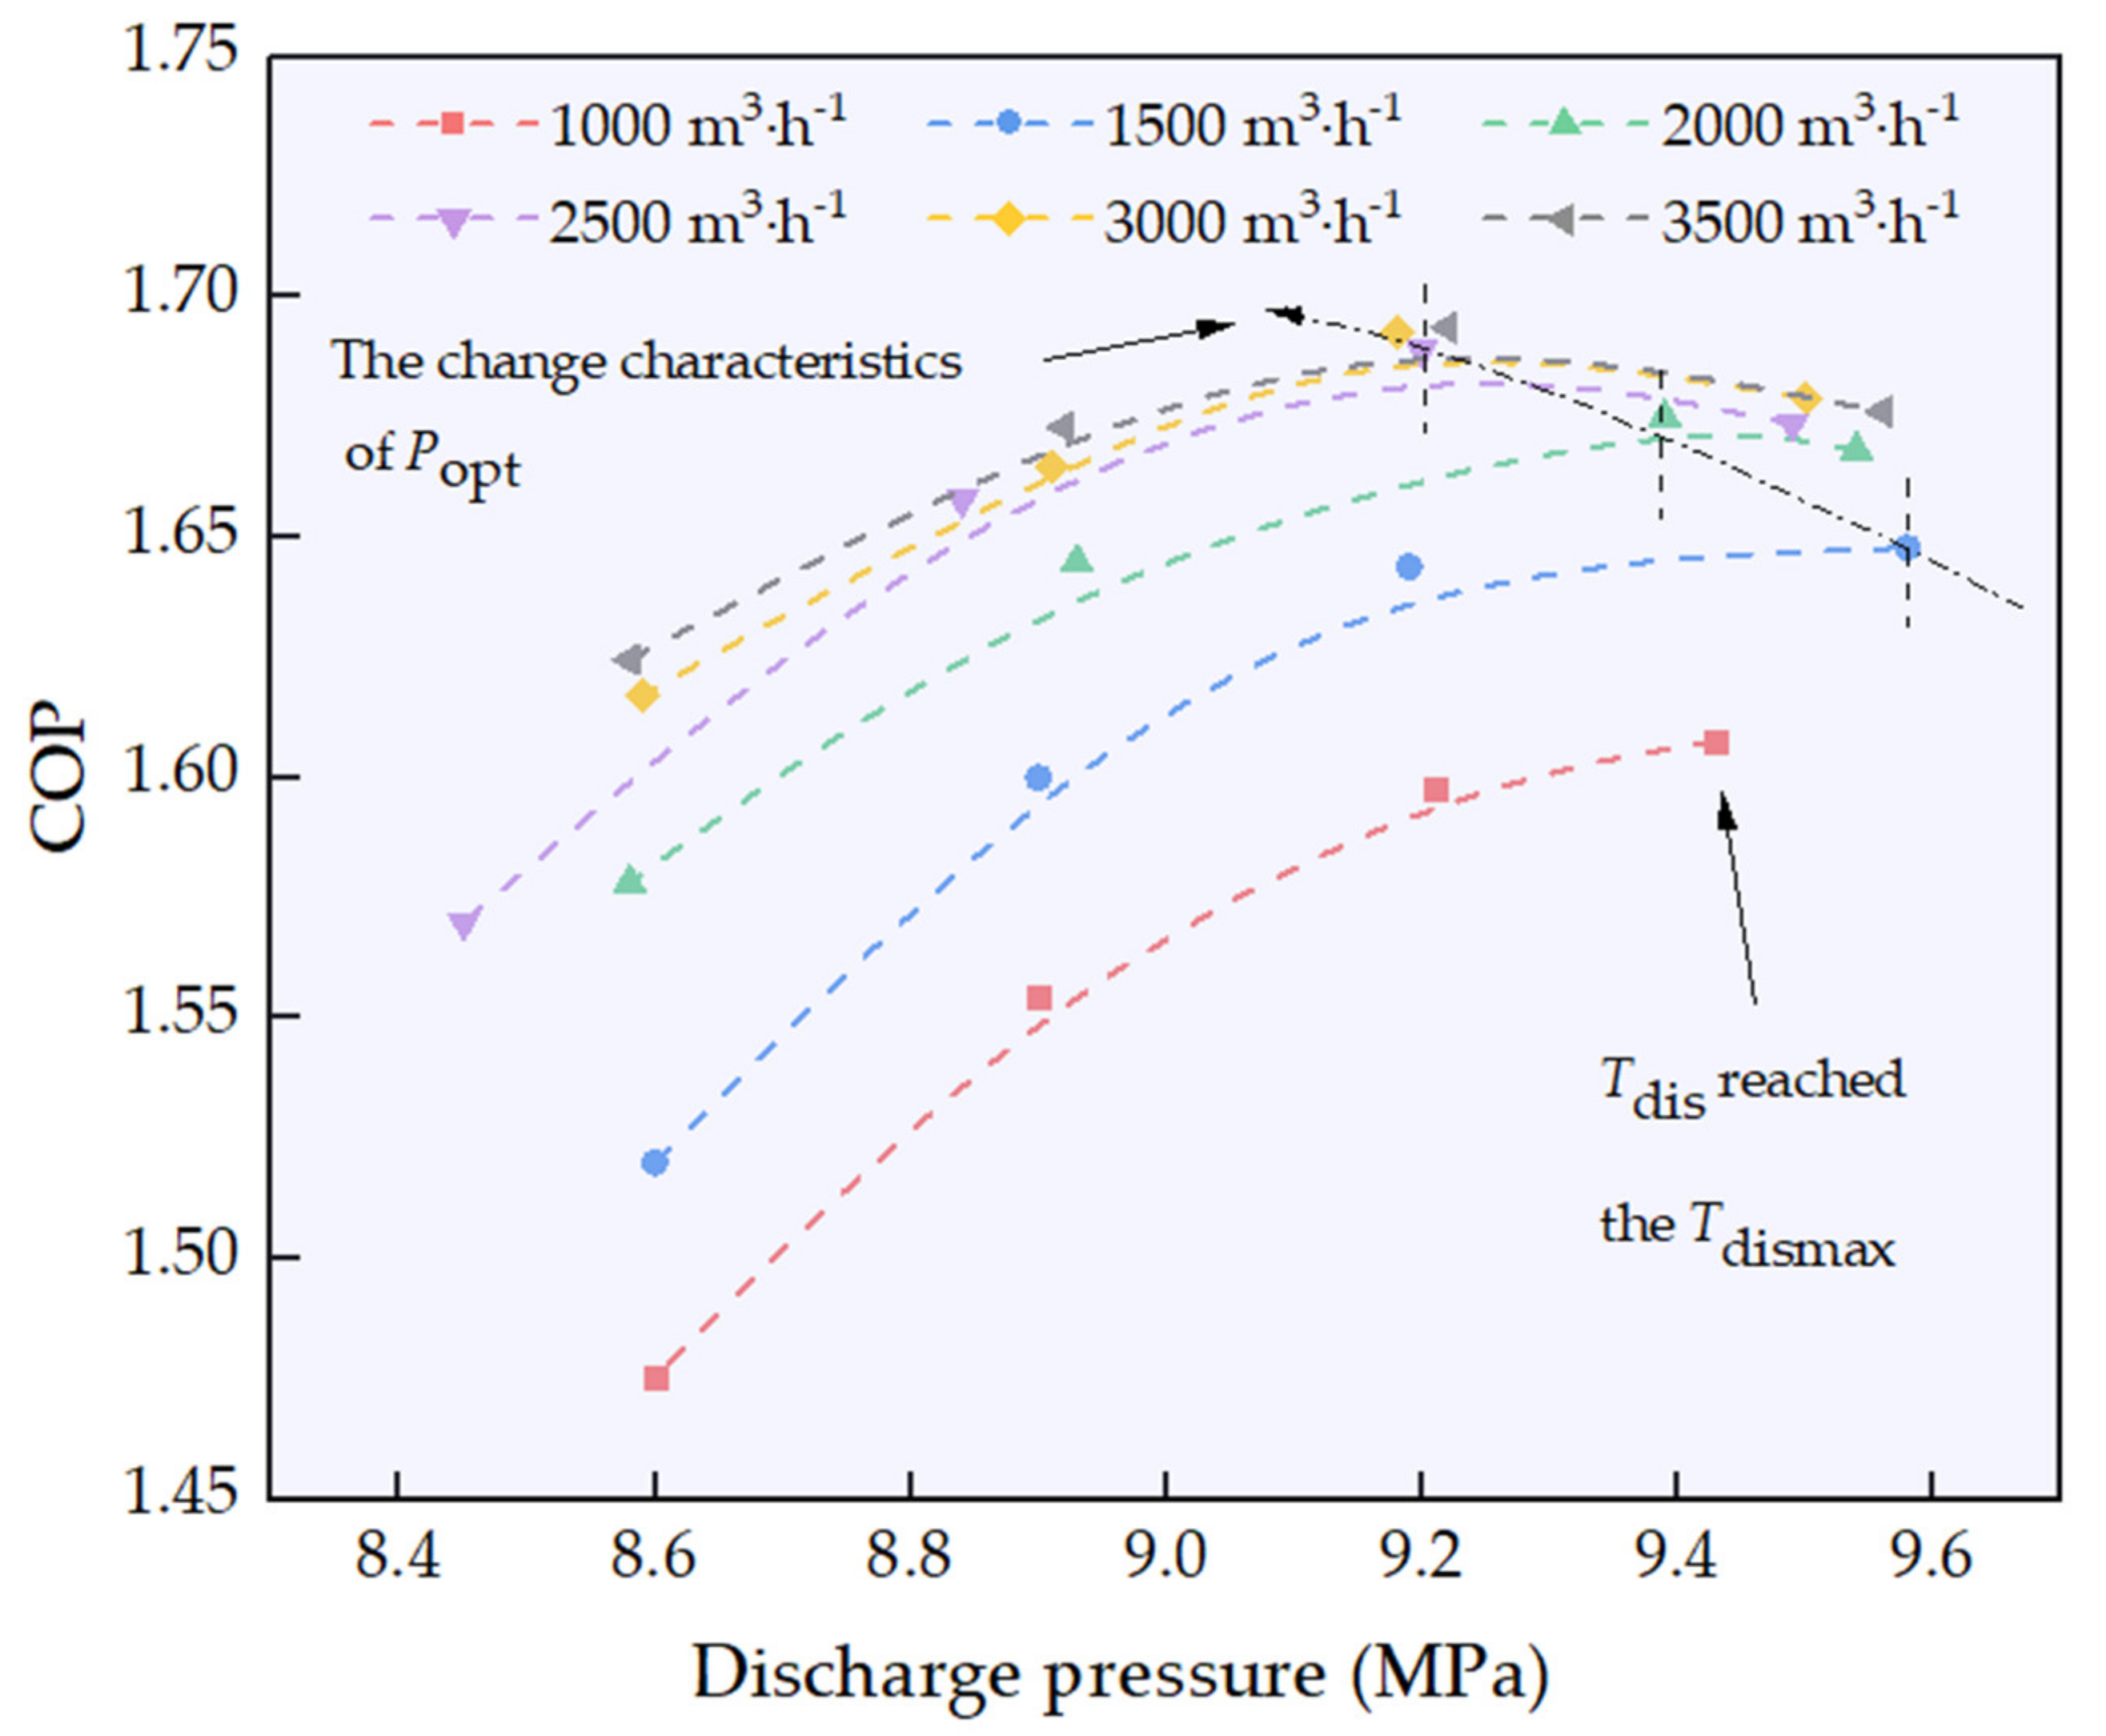
3.2. Influence of Gas Cooler Air Volume Flow Rate on Optimal Discharge Pressure

In this subsection, the effect of the air volume flow rate in the gas cooler on the optimal discharge pressure (Popt) was investigated at the ambient temperature and the air temperature at the evaporator inlet of 35 °C and 27 °C, respectively. The tests were carried out at the compressor speed of 5000 rpm and air volume flow rate in the gas cooler side was varied between 1000 m3·h−1 and 3500 m3·h−1.
Figure 7 shows that the COP increased first and then decreased with the rise in discharge pressure as the air flow rate was higher than 2000 m3·h−1. As the air flow rate was 1000 m3·h−1, the COP value kept increasing with the rise in discharge pressure and there was no COP peak value. This was due to the fact that the compressor discharge temperature had reached the safety limit, as the discharge pressure was 9.47 MPa. The optimal discharge pressure and the maximum COP were 9.6 MPa and 1.64 at the air flow rate of 1500 m3·h−1, 9.4 MPa and 1.67 at 2000 m3·h−1 and 9.2 MPa and 1.69 at 2500 m3·h−1, respectively. It could be concluded that the optimal discharge pressure gradually decreased as the air flow rate increased, whereas the COP gradually increased. As the air flow rate continued to increase, the optimal discharge pressure and COP value did not change significantly. As the air flow rate increased, the heat exchange performance of the gas cooler gradually improved. The temperature difference between the refrigerant at the outlet of the gas cooler and the air at the inlet gradually decreased, resulting in a gradual reduction in optimal discharge pressure value and a gradual increase in COP value. However, as the air flow rate was greater than 2500 m3·h−1, the heat exchange between the refrigerant in the gas cooler and the air was full. As the air flow rate increased, the change in temperature difference between the refrigerant and the air through the gas cooler decreased gradually. Therefore, the influence of air flow rate on the optimal discharge pressure and COP of the air conditioning system was gradually reduced.
Figure 8 illustrates the p–h diagrams of the investigated cases under different air flow rates. The temperature before the EXV gradually decreased as the air flow rate increased, resulting in a reduction in optimal discharge pressure. The decrease in the temperature upstream of the EXV led the enthalpy difference between the inlet and outlet of the evaporator to increase. The growth in cooling capacity reduced the HVAC supply air temperature, leading to a gradual decrease in evaporation temperature. However, with the further increase in the air flow rate, the p–h diagrams of the investigated cases almost overlapped. This suggests that the air flow rate was almost sufficient, as the effect of further increasing the air flow rate on the system was minimal.

3.3. Effect of Compressor Speed and Ambient Temperature on Optimal Gas Cooler Air Volume Flow Rate

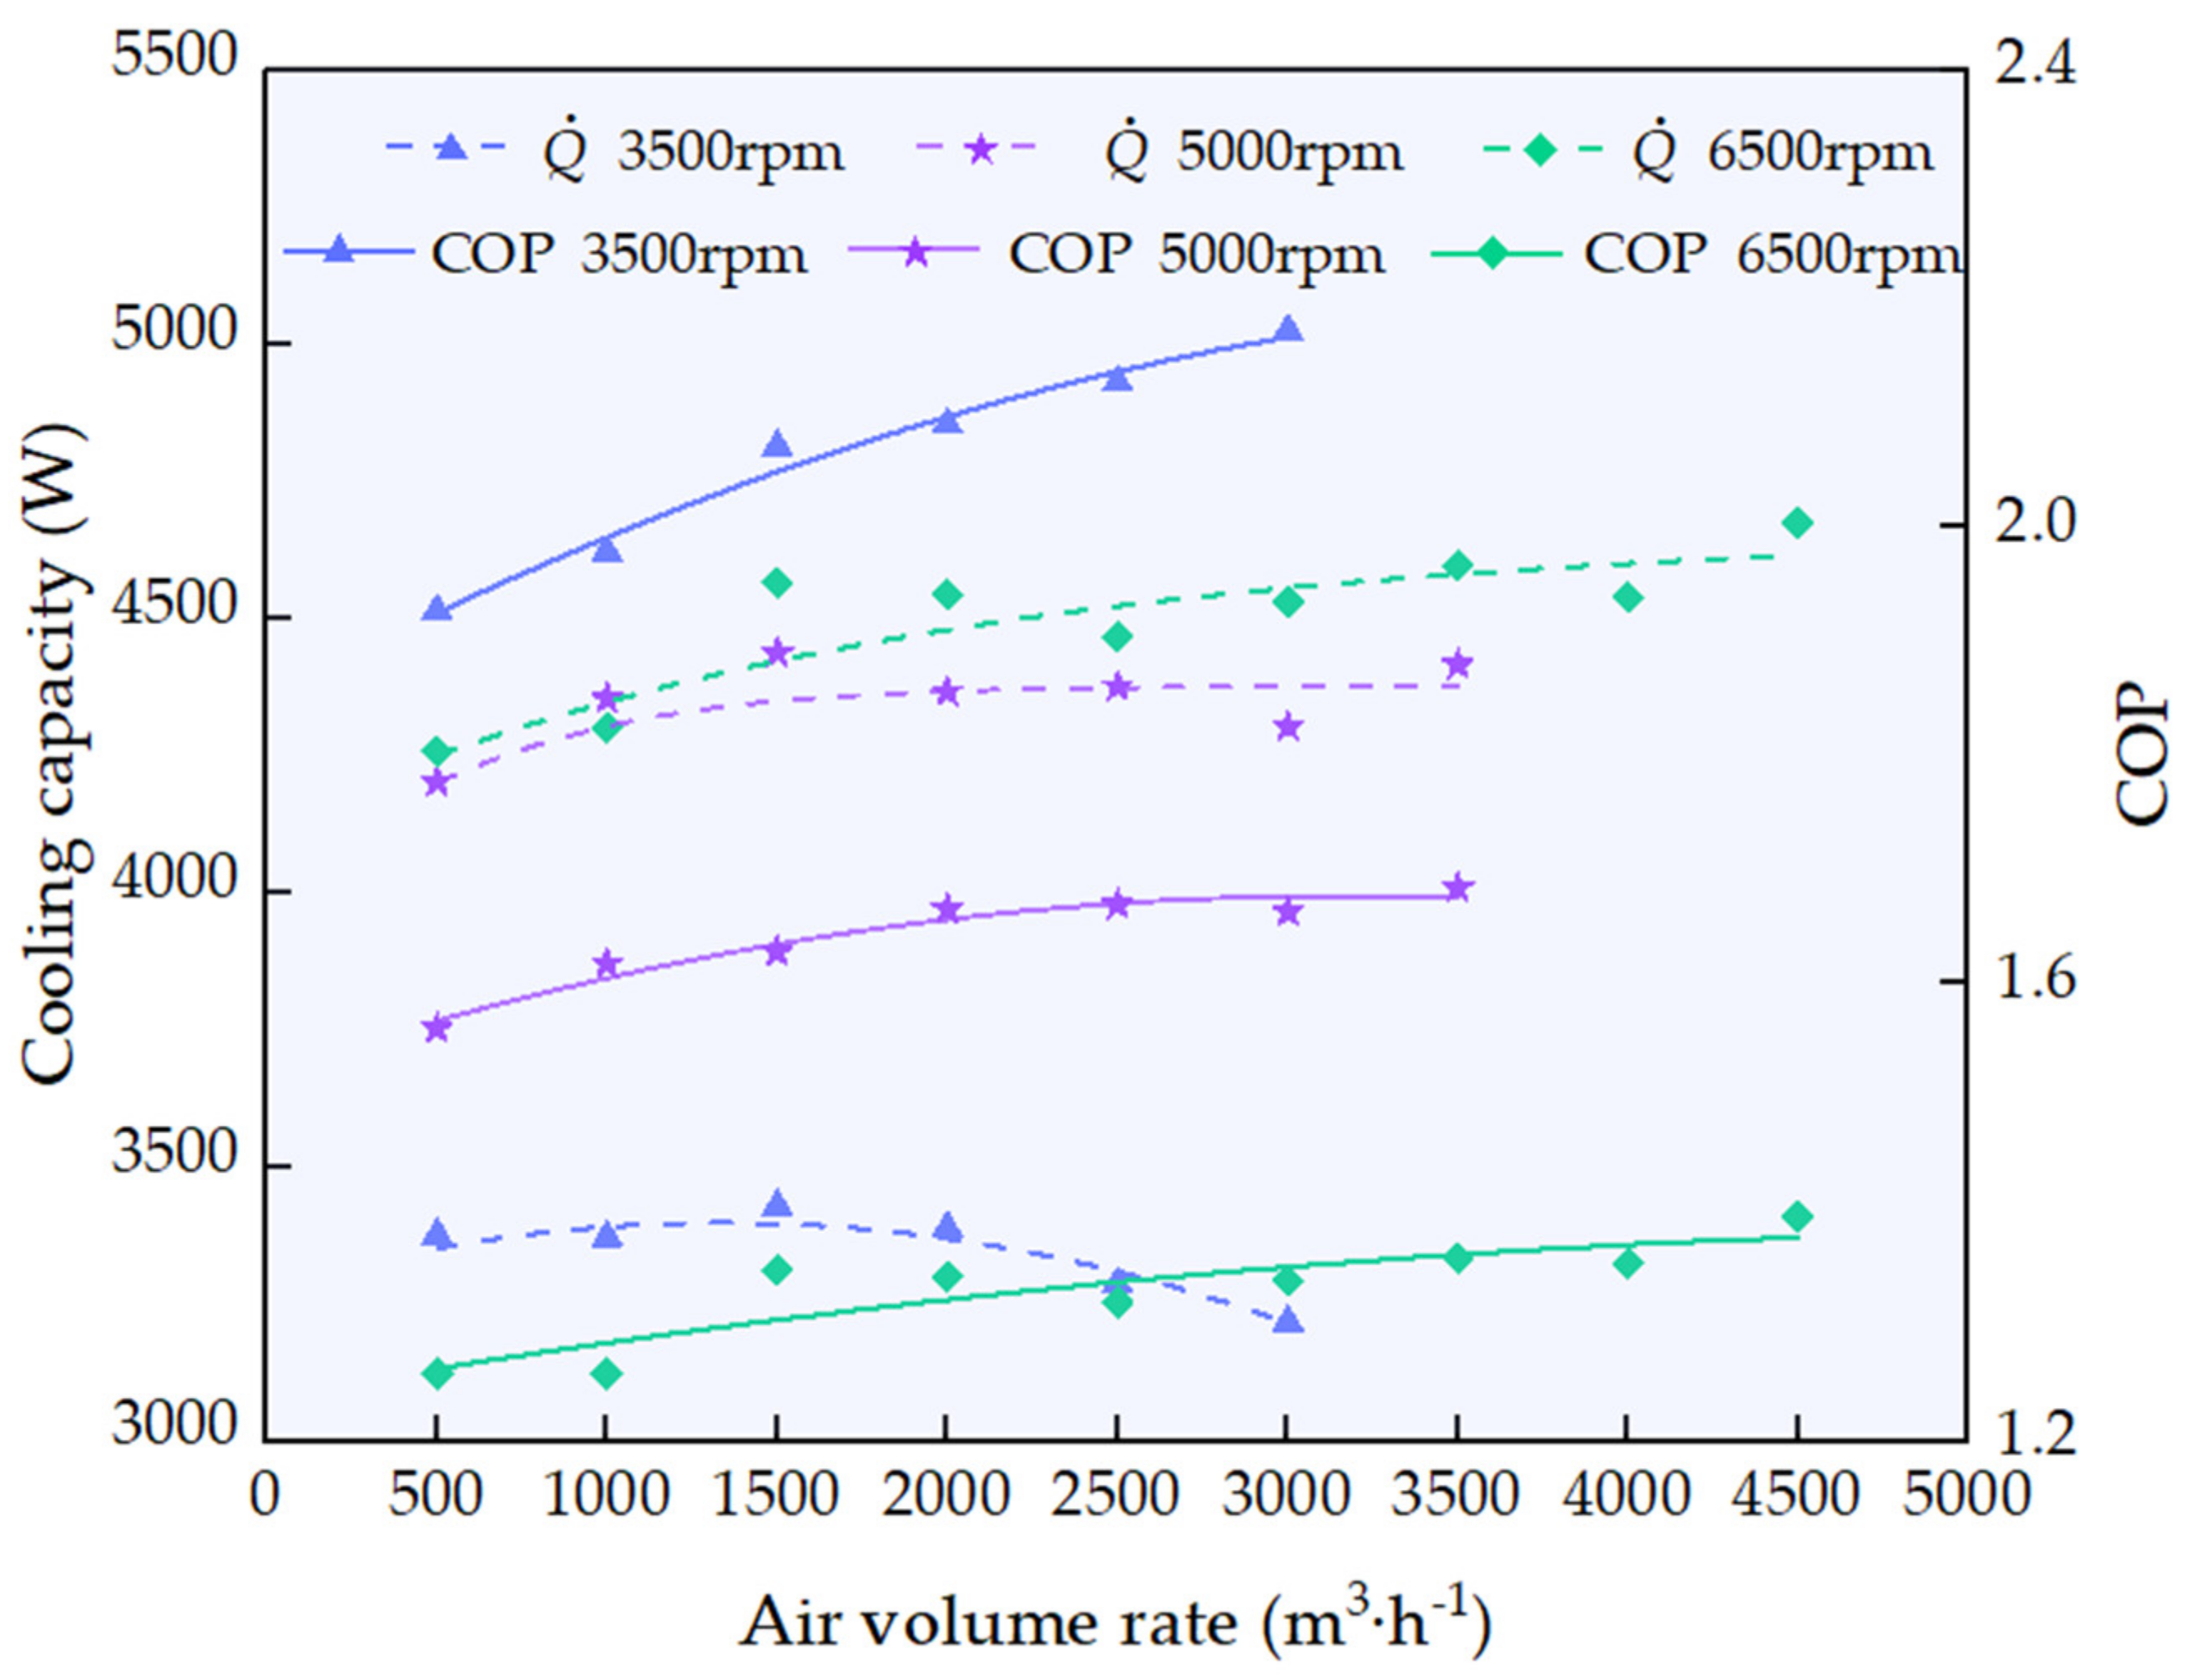
3.3.1. Influence of Compressor Speed on Optimal Gas Cooler Air Volume Flow Rate

At the ambient temperature of 35 °C, the influence of the compressor speed on the optimal air flow rate was studied in detail (Figure 9). The air flow rate and air temperature at the evaporator inlet were 340 m3·h−1 and 27 °C, respectively. As the compressor speed was 6500 rpm, the optimal discharge pressures were not found due to the safety limit regarding the discharge temperature (i.e., 135 °C). Therefore, all data were recorded at 135 °C, at which the highest COP values were observed. As the compressor speed was 5000 rpm, the optimal discharge was not found under the air flow rate of 500 m3·h−1 and 1000 m3·h−1. Therefore, the data were recorded at the discharge temperature of 135 °C. All other data were recorded under the optimal discharge pressure.
Figure 9 shows how the cooling capacity and the maximum/highest COP are affected by the compressor speed. As the speed was 3500 rpm, the cooling capacity increased at first and then decreased with the rise in air flow rate. As the compressor speed was 5000 rpm, the cooling capacity first increased and then there were no marked variations. As the compressor speed was 6500 rpm, the cooling capacity basically showed a gradually increasing trend as the air flow rate increased. The CO2 gas cooler outlet temperature decreased, leading to an increase in cooling capacity. By contrast, the optimal discharge pressure gradually decreased, which had a negative effect on the increase in cooling capacity. As the air flow rate was smaller than 1500 m3·h−1, the role of the CO2 gas cooler outlet temperature was in a dominant position, so the cooling capacity increased first. As the air volume exceeded 1500 m3·h−1, the role of the optimal discharge pressure was dominant, leading to the decrease in the cooling capacity.
Based on the above data analysis, it could be concluded that the optimal air flow rate would increase slightly as the compressor speed increases. However, the increase in air volume flow rate slowed down as the speed of the compressor increases.

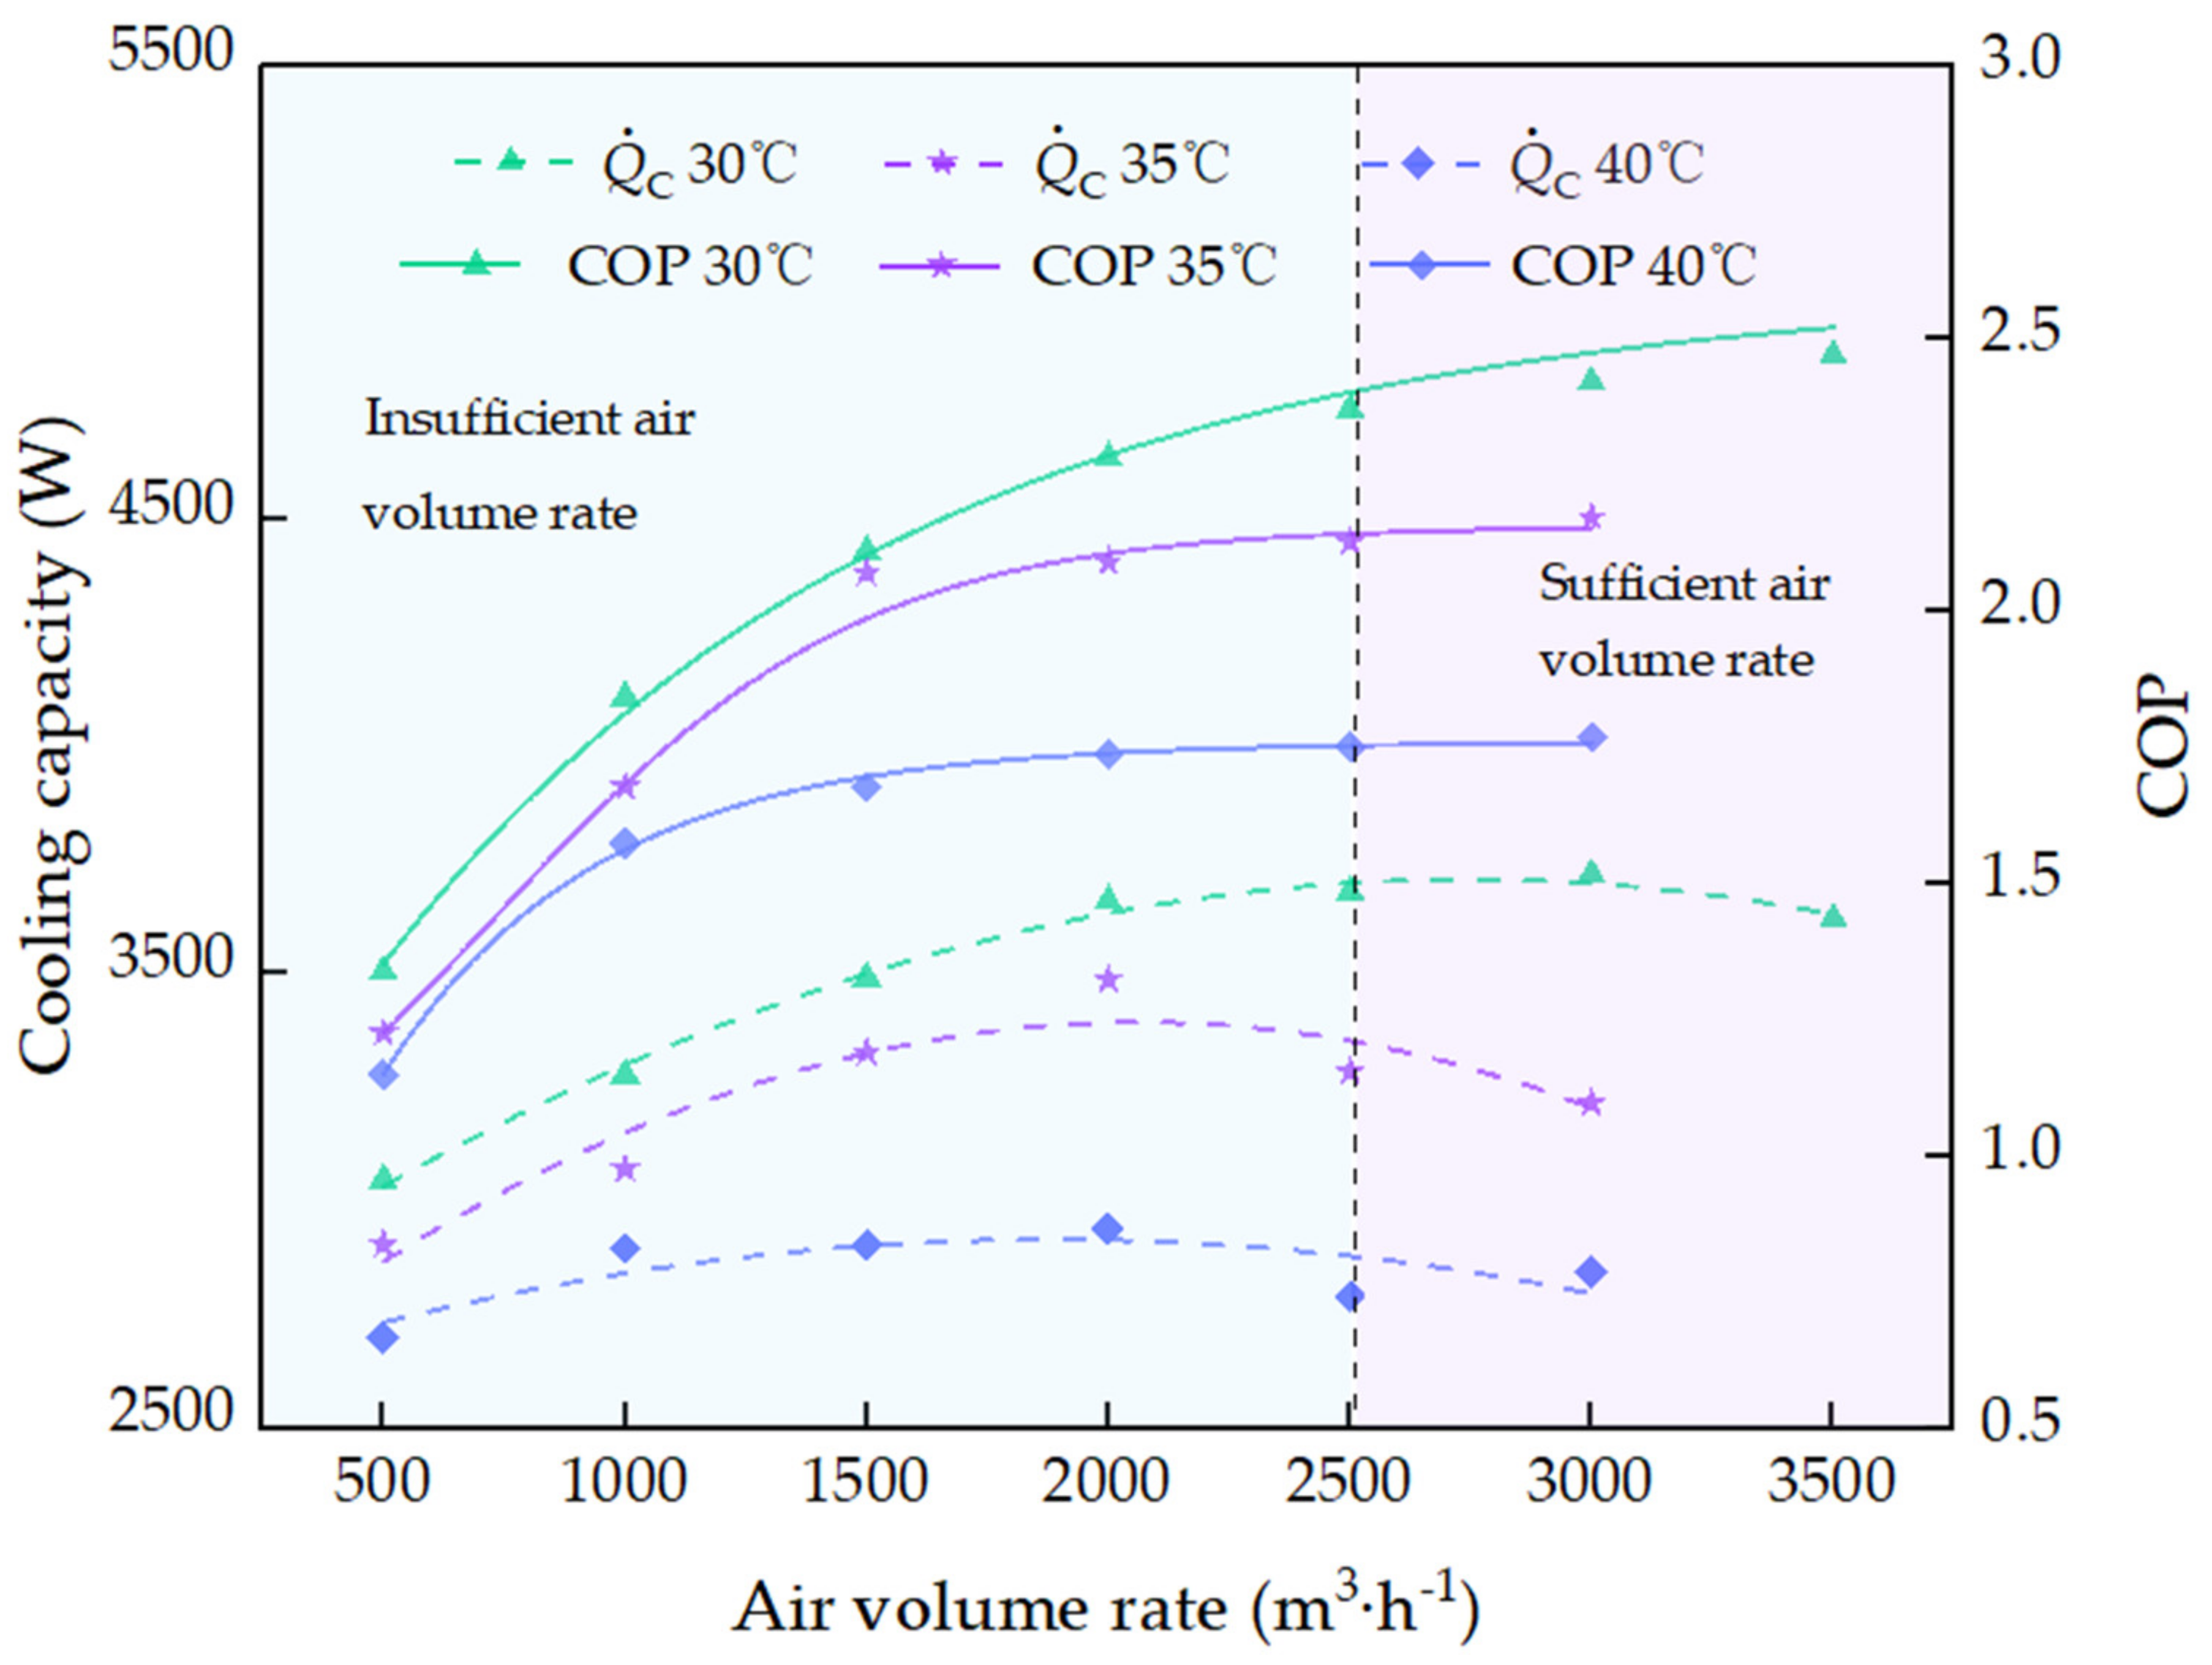
3.3.2. Influence of Ambient Temperature on Optimal Gas Cooler Air Volume Flow Rate

Figure 10 shows the cooling capacity and the maximum COP with the rise in air flow rate under different ambient temperatures. The air temperature at the gas cooler inlet was 30/35/40 °C, while the air temperature at the evaporator inlet was kept at 27 °C, respectively. Furthermore, the compressor speed was set to 3500 rpm. It is important to highlight that at the condition at the ambient temperature of 40 ℃ and the air volume flow rate of 500 m3·h−1, the discharge temperature and/or the discharge pressure were above the safety limits.
As the air volume increased from 2500 m3·h−1 to 3000 m3·h−1, the COP value increased from 2.37 to 2.42 at the ambient temperature of 30 °C (i.e., with a variation rate of 2%). Furthermore, the COP value increased from 2.13 to 2.17 at the ambient temperature of 35 °C (i.e., with a variation rate of 1.8%), while the COP value increased from 1.75 to 1.78 at the ambient temperature of 40 ℃ (i.e., with a variation rate of 1.7%). Therefore, it could be seen that the optimal air flow rate was basically the same under different ambient temperatures, which was about 2500 m3·h−1.

4. Conclusions

In order to enhance the performance of electric vehicle R744 air conditioning units, the effects of the gas cooler air volume flow rate on the key parameters have been experimentally studied. Furthermore, the coupling influence of operating conditions and air flow rate on the system performance have been studied in detail. As a result, a novel approach to evaluate the appropriateness of the gas cooler air volume flow rate has been implemented. The main conclusions of this work can be summarized as follows:
  • the new approach suggests that the optimal gas cooler air volume flow rate can be selected as the one, which results in the discharge temperature, gas cooler outlet temperature and discharge pressure change rates below 2%;
  • high compressor speeds are recommended in order to promote optimal gas cooler air volume rates;
  • the ambient temperature does not influence the optimal gas cooler air volume rate significantly;
  • for the single-row and dual-process microchannel heat exchanger used in the experiment, the recommended value of the optimal air flow rate is about 2500 m3·h−1.
Since the real time power consumption of the fan on the gas cooler side has not been measured to calculate the overall performance of the air conditioning system, there is still great potential for the enhancement of the evaluation criteria proposed in this article. In future work, the real time power consumption of the fan will be simultaneously assessed along with that of the compressor to evaluate the optimal air volume flow rate on the gas cooler side more accurately.

Author Contributions

Conceptualization, A.W. and X.Y.; methodology, A.W.; software, J.F.; validation, Y.S., F.C.; formal analysis, X.Y.; investigation, A.W. and J.F.; resources, F.C.; data curation, A.W.; writing—original draft preparation, A.W.; writing—review and editing, Y.S., J.F. and P.G.; visualization, P.G.; supervision, F.C.; project administration, F.C.; funding acquisition, F.C. and X.Y. All authors have read and agreed to the published version of the manuscript.

Funding

A.W., J.F., X.Y., Y.S. and F.C. are grateful to the National Natural Science Foundation of China [grant number 51976153], the National Natural Science Foundation of China [grant number 52006162] and the National Science and Technology Major Project [grant number 2017-Ⅲ-0010-0036] for funding this research.

Institutional Review Board Statement

Not applicable.

Informed Consent Statement

Not applicable.

Data Availability Statement

Not applicable.

Conflicts of Interest

The authors declare no conflict of interest.

Nomenclature

Nomenclature
COPCoefficient of performance
DDepth, mm
EXVExpansion valve
GWPGlobal warming potential
hSpecific enthalpy, kJ·kg−1
HHeight, mm
HVACHeating, ventilation and air conditioning
IHXInternal heat exchanger
LLength, mm
ODPOzone depletion potential
PPressure, MPa
PBEPressure upstream of expansion valve
Q ˙ Cooling capacity, W
SGCSeries gas cooler
TTemperature, °C
V ˙ Volume flow rate, m3·h−1
W ˙ Power input, W
xUncertainty of independent variable
Greek symbols
ωResulting uncertainty
ρDensity, kg·m−3
ηefficiency
Subscripts
airAir
airWWet bulb temperature of air
airDDry bulb temperature of air
disDischarge
evaEvaporation
eva iEvaporator inlet
eva oEvaporator outlet
gasc_oGas cooler outlet
optOptimal
sucSuction
VVolumetric
IIsentropic
RRepresentation of the parameter

References

  1. Kumar, R.R.; Alok, K. Adoption of electric vehicle: A literature review and prospects for sustainability. J. Clean. Prod. 2020, 253, 119911. [Google Scholar] [CrossRef]
  2. Hannan, M.A.; Azidin, F.A.; Mohamed, A. Hybrid electric vehicles and their challenges: A review. Renew. Sustain. Energy Rev. 2014, 29, 135–150. [Google Scholar] [CrossRef]
  3. Daviran, S.; Kasaeian, A.; Golzari, S.; Mahian, O.; Nasirivatan, S.; Wongwises, S. A comparative study on the performance of HFO-1234yf and HFC-134a as an alternative in automotive air conditioning systems. Appl. Therm. Eng. 2017, 110, 1091–1100. [Google Scholar] [CrossRef]
  4. Nekså, P.; Pettersen, J.; Hafner, A. Life Cycle Climate Performance (LCCP) of mobile air-conditioning systems with HFC-134a, HFC-152a and R-744. In Proceedings of the MAC (Mobile air Conditioning) Summit 2004, Washington, DC, USA, 14 April 2004. [Google Scholar]
  5. Meng, Z.; Zhang, H.; Lei, M.; Qin, Y.; Qiu, J. Performance of low GWP R1234yf/R134a mixture as a replacement for R134a in automotive air conditioning systems. Int. J. Heat Mass Transf. 2018, 116, 362–370. [Google Scholar] [CrossRef]
  6. Wang, Y.; Dong, J.; Jia, S.; Huang, L. Experimental comparison of R744 and R134a heat pump systems for electric vehicle application. Int. J. Refrig. 2021, 121, 10–22. [Google Scholar] [CrossRef]
  7. Wang, D.; Yu, B.; Hu, J.; Chen, L.; Shi, J.; Chen, J. Heating performance characteristics of CO2 heat pump system for electrical vehicle in a cold climate. Int. J. Refrig. 2018, 85, 27–41. [Google Scholar] [CrossRef]
  8. Gaurav, K.R. Sustainability of alternative material of R-134a in mobile air-conditioning system: A review. Mater. Today Proc. 2017, 4, 112–118. [Google Scholar] [CrossRef]
  9. Wu, J.; Zhou, G.; Wang, M. A comprehensive assessment of refrigerants for cabin heating and cooling on electric vehicles. Appl. Therm. Eng. 2020, 174, 115258. [Google Scholar] [CrossRef]
  10. Lorentzen, G.; Pettersen, J. A new, efficient and environmentally benign system for car air-conditioning. Int. J. Refrig. 1993, 16, 4–12. [Google Scholar] [CrossRef]
  11. Brown, J.S.; Yana-Motta, S.F.; Domanski, P.A. Comparitive analysis of an automotive air conditioning systems operating with CO2 and R134a. Int. J. Refrig. 2002, 25, 19–32. [Google Scholar] [CrossRef]
  12. Dong, J.; Wang, Y.; Jia, S.; Zhang, X.; Huang, L. Experimental study of R744 heat pump system for electric vehicle application. Appl. Therm. Eng. 2020, 116191. [Google Scholar] [CrossRef]
  13. Gullo, P.; Hafner, A.; Banasiak, K. Transcritical R744 refrigeration systems for supermarket applications: Current status and future perspectives. Int. J. Refrig. 2018, 93, 269–310. [Google Scholar] [CrossRef]
  14. Zhang, Z.; Wang, D.; Zhang, C.; Chen, J. Electric vehicle range extension strategies based on improved AC system in cold climate–A review. Int. J. Refrig. 2018, 88, 141–150. [Google Scholar] [CrossRef]
  15. Wang, D.; Wang, Y.; Yu, B.; Shi, J.; Chen, J. Numerical study on heat transfer performance of micro-channel gas coolers for automobile CO2 heat pump systems. Int. J. Refrig. 2019, 106, 639–649. [Google Scholar] [CrossRef]
  16. Li, J.; Jia, J.; Huang, L.; Wang, S. Experimental and numerical study of an integrated fin and micro-channel gas cooler for a CO2 automotive air-conditioning. Appl. Therm. Eng. 2017, 116, 636–647. [Google Scholar] [CrossRef]
  17. Wang, Y.; Wang, D.; Yu, B.; Shi, J.; Chen, J. Experimental and numerical investigation of a CO2 heat pump system for electrical vehicle with series gas cooler configuration. Int. J. Refrig. 2018, 100, 156–166. [Google Scholar] [CrossRef]
  18. Yang, J.; Yu, B.; Chen, J. Improved genetic algorithm-based prediction of a CO2 micro-channel gas-cooler against experimental data in automobile air conditioning system. Int. J. Refrig. 2019, 106, 517–525. [Google Scholar] [CrossRef]
  19. Jin, J.; Chen, J.; Chen, Z. Development and validation of a microchannel evaporator model for a CO2 air-conditioning system. Appl. Therm. Eng. 2011, 31, 137–146. [Google Scholar] [CrossRef]
  20. Qi, Z.; Chen, J.; Radermacher, R. Investigating performance of new mini-channel evaporators. Appl. Therm. Eng. 2009, 29, 3561–3567. [Google Scholar] [CrossRef]
  21. Shi, J.; Qu, X.; Qi, Z.; Chen, J. Investigating performance of microchannel evaporators with different manifold structures. Int. J. Refrig. 2011, 34, 292–302. [Google Scholar] [CrossRef]
  22. Zheng, S.; Wei, M.; Song, P.; Hu, C.; Tian, R. Thermodynamics and flow unsteadiness analysis of trans-critical CO2 in a scroll compressor for mobile heat pump air-conditioning system. Appl. Therm. Eng. 2020, 175, 115368. [Google Scholar] [CrossRef]
  23. Ye, Z.; Wang, Y.; Song, Y.; Yin, X.; Cao, F. Optimal discharge pressure in transcritical CO2 heat pump water heater with internal heat exchanger based on pinch point analysis. Int. J. Refrig. 2020, 118, 12–20. [Google Scholar] [CrossRef]
  24. Yin, X.; Wang, A.; Fang, J.; Cao, F.; Wang, X. Coupled effect of operation conditions and refrigerant charge on the performance of a transcritical CO2 automotive air conditioning system. Int. J. Refrig. 2021, 123, 72–80. [Google Scholar] [CrossRef]
  25. Kline, S.J.; McClintock, F.A. Describing uncertainties in single-sample experiments. Mech. Eng. 1953, 75, 3. [Google Scholar]
  26. Lemmon, E.W.; Bell, I.H.; Huber, M.L.; McLinden, M.O. NIST Standard Reference Database 23: Reference Fluid Thermodynamic and Transport Properties-REFPROP, Version 10.0; National Institute of Standards and Technology, Standard Reference Data Program: Gaithersburg, MD, USA, 2018. [Google Scholar]
Figure 1. Schematic of the experimental setup of the transcritical CO2 electric vehicle air conditioning system. 1—compressor, 2—gas cooler, 3—internal heat exchanger (IHX), 4—mass flow meter, 5—electromagnetic expansion valve (EXV), 6—heating, ventilation and air conditioning (HVAC) unit, 7—accumulator.
Applsci 11 04855 g001
Figure 2. Effect of the air volume flow rate in the gas cooler on the key temperatures of the investigated system.
Applsci 11 04855 g002
Figure 3. Effect of the air volume flow rate in the gas cooler on the pressures of the investigated system.
Applsci 11 04855 g003
Figure 4. Effect of the air volume flow rate in the gas cooler on the compressor isentropic (ηI) and volumetric (ηV) efficiencies.
Applsci 11 04855 g004
Figure 5. Effect of the air volume flow rate in the gas cooler on the compressor power input, cooling capacity and COP.
Applsci 11 04855 g005
Figure 6. Change rate of evaluation parameters and performance parameters with air volume flow rate in the gas cooler.
Applsci 11 04855 g006
Figure 7. Influence of discharge pressure on COP at gas cooler air volume flow rates between 1000 m3·h−1 and 3500 m3·h−1.
Applsci 11 04855 g007
Figure 8. P–h diagrams of the investigated air conditioning system at gas cooler air volume flow rates between 1000 m3·h−1 and 3500 m3·h−1.
Applsci 11 04855 g008
Figure 9. Influence of compressor speed on the optimal gas cooler air volume flow rate.
Applsci 11 04855 g009
Figure 10. Influence of ambient temperature on the optimal gas cooler air volume flow rate.
Applsci 11 04855 g010
Table 1. Detailed parameters of the components.
ComponentMain ParametersOther Parameters
Compressor6.8 cc, 1000 to 8000 rpmtwo-stage rotary type, aluminum
Gas cooler312 H·600 L·23 D (mm)aluminum micro-channel fin-tube, single-row
IHX5.8 H·30 L·0.6 D (mm) aluminum cross flow
EXVRange of 0 to 576 stepdriven by a stepper motor
Evaporator218 H·200 L·38 D (mm)aluminum micro-channel fin-tube, three-rows
Accumulator500 mLaluminum
Table 2. Detailed parameters of the measured instruments.
ComponentParameterCalibration rangeUncertainty
K-type thermocouples Temperature (°C)−50 °C to 200 °C±0.5 °C
PT100Temperature (°C)−50 °C to 200 °C±(0.15 + 0.2% of reading)
Pressure transmittersPressure (MPa)0 MPa to 20 MPa±2.5 ‰ of full scale
WT500 power meterPower (W)15 V to 1000 V and 0.5 A to 40 A±0.1% of reading
Electronic mass scaleCO2 charge (g)0 kg to 100 kg±0.02 kg
Mass flow meterCO2 mass flow rate (kg·h−1)0 kg·h−1 to 11,500 kg·h−1±1% of reading
Volume flow meterAir volume flow rate (m3·h−1) in gas cooler600 m3·h−1 to 9000 m3·h−1±0.01 m3·h −1 of reading
Table 3. Detailed experimental conditions.
ParameterEvaporator SideGas Cooler Side
Ambient
temperature and humidity
30 °C, 50%
27 °C, 50%35 °C, 50%
40 °C, 50%
Air volume flow rate480 m3·h−1500/1000/1500/2000/2500/3000/3500 m3·h−1
Refrigerant charge700 g [24]
Compressor speed3500/5000/6500 rpm
Publisher’s Note: MDPI stays neutral with regard to jurisdictional claims in published maps and institutional affiliations.

