1. Introduction
In many sports, such as handball, the main teams often consist of players of a broad age range. In the 2019 World Men’s Handball Championship, for example, the players mean age across all teams was 26 years, with ages ranging from 17 (Haukur Þrastarson, Iceland) to 42-years (Nikola Marinovic, Austria). In the 2018 European Championship, ages similarly ranged from 19 to 38 years while the mean age was 27 years. The advantages of a combination of younger and older players in team sports are obvious: the older players’ experience can help to bring calm and tactical stability into the game, while the often better physical fitness of young players can make the game fast and dynamic (e.g., in soccer [
1,
2]). This combination of skills and abilities can be an optimal prerequisite in order to meet the high physiological and psychological requirements of sports like handball—a multidirectional sport with very diverse muscle stress and metabolic processes [
3].
Over the last decades, only a few studies have dealt with the effects of ageing on the players’ ability to process exercise stimuli and their recovery kinetics. The recovery of the autonomic nervous system after an exercise stimulus can be detected by the measurement of cardiac vagal control using beat-to-beat heart rate recording in an orthostatic test and the calculation of heart rate variability (HRV) indices [
4,
5]. An age-related decline of resting HRV has already been established previously [
6]. However, research regarding the effects of acute high-intensity interval exercise on the recovery of vagal HRV in team sport athletes of different ages is so far lacking. In their review article, Fell and Williams [
7] concluded that an impaired recovery of older skeletal muscles could be the result of more severe exercise-induced skeletal muscle damage on the one hand, and of slower recovery and adaptive capabilities on the other hand. Research has also shown a delayed recovery of the maximum isometric force ([
8]; young athletes’
Mage = 31 years, older athletes’
Mage = 46 years) as well as altered twitching behavior ([
9]; young athletes’
Mage = 25 years, older athletes’
Mage = 66 years) when comparing older to young athletes with the same severity of exercise-induced skeletal muscle damage. This suggests that recovery and adaptive capabilities decrease with advancing age despite the severity of muscle damage remaining constant. Only a few studies have described that athletes show deficits in recovery kinetics at an advanced age [
10]. An age-related deceleration of recovery processes can have an impact on the subsequent training process, leading to decreases in the volume and quality of training, and potentially increases in the risk of overtraining or injury [
10].
Besides the training stimulus, the subsequent recovery is a decisive factor in the maintenance or enhancement of performance [
11]. The recovery phase occurs right after a physical exertion and often takes up to or sometimes longer than 72 h, depending on the intensity and duration of the training stimulus. This recovery phase involves the regulation of morphological, physiological, biomechanical, and psychological changes that have occurred due to the movement-induced oxidative and mechanical stresses (e.g., [
12]). As soon as an athlete has returned to the baseline values, it is assumed that he/she has physically recovered from the exercise stimulus [
10]. Recovery kinetics and recovery time primarily depend on the intensity, duration, extent, and type of the preceding exertion as well as the athlete’s performance capability and individual predisposition matrix [
13]. Research that has addressed the recovery kinetics of various performance parameters after acute training loads has mainly compared groups of young (ages of mostly < 30 years) and older (ages of mostly > 50 years) athletes (for a review, see [
7]).
However, previous research findings on the recovery of young and older trained athletes do not apply to multidirectional team sports directly, partly because most research studies include older people over the age of 50, which does not represent the age span typical for team sport athletes. Therefore, it is still unclear how the age composition of a main team may influence player recovery following training sessions. Findings of this study may assist coaches with planning training sessions to ensure optimal physiological states for players and promote training adaptation with reduced risk of injury. The current study explored whether physical performance and recovery are affected by age, within an age span typical for team sport athletes, after a high-intensity interval exercise. Recovery processes from repeated sprint interval exercise, both on a physiological and on a psychological level, were investigated as a function of age in semi-professional handball players. More specifically, the assumption was that older players would regain their maximum jump height at a later point in time (due to impaired muscle recovery) and that their creatine kinase (CK) value would decrease more slowly after repeated sprint intervals and return to baseline later, compared to young players. Furthermore, it was expected that the older players’ vagal HRV as indicated by the root mean square of successive differences (rMSSD), would return to its baseline value later in time and they were expected to feel muscle soreness for a longer period of time compared to the young players. It was also assumed that, due to the delayed recovery as a consequence of the repeated sprint interval exercise, increased skeletal muscle damage, measured by the free CK in the blood, would be observable in the older players compared to the young players.
2. Materials and Methods
2.1. Participants
To calculate sample size requirements, G*Power 3.1 was used. A power analysis for within and between interactions related to two groups and five measurement time points was conducted. No specific primary outcome was determined beforehand since all dimensions of fatigue (physiological, psychometric, and performance differences) were of similar interest. The power analysis indicated that a sample size of at least 22 participants would result in a power of 0.80 (α-level = 0.05, f = 0.25). In order to adjust for any potential technical problems, sick leaves, or injuries, we decided to request 35 subjects in advance. Finally, data was recorded from 29 semi-professional, male handball players. The prerequisite for participation in the study was that the players had to have trained for handball on a competitive level (i.e., they regularly participated in official handball games with their clubs—1st to 6th highest German league) at least throughout the preceding five years. In addition, all of them played handball for at least three times per week and/or were integrated in a handball specific (youth) performance center at the time of the data collection. Furthermore, they had to have reached at least stage 15 in the Yo-Yo Intermittent Recovery Level 1 Fitness Test (YoYoIR1; [
14]), so that their estimated VO
2max at the time of the study was above 43 mL/min/kg [
15].
Participants were divided into two different age groups, one with players under the age of 20 (U20 players; n = 12, Mage = 18.0 years, SD = 0.6 years, age range: 17 to 19 years), who were still allowed to play in the youth league at the time of the data collection, and the other with players of 20 years or older (senior players; n = 17, Mage = 27.3 years, SD = 5.7 years, age range: 20 to 42 years). The average height of the participants of the U20 age group was 181.8 cm (SD = 7.6 cm) and their average weight was 79.3 kg (SD = 8.5 kg). Participants of the older age group had an average height of 191.9 cm (SD = 9.2 cm) and a weight of 90.2 kg (SD = 13.9 kg). The average distance covered in the YoYoIR1 endurance test did not differ significantly between the U20 and older athletes, t(23) = 1.815, p = 0.083. The study was carried out in accordance with the Helsinki Declaration of 1975, and written informed consent was obtained from each participant prior to testing. Approval was obtained from the lead institution’s (Ruhr University Bochum, Germany) ethics board. (The declaration of the ethics committee is available by request to the first author or the journal’s editor.)
2.2. Materials and Procedure
Participants were required to take part in an acute one-day intervention study that used a single bout of repeated high-intensity sprint exercise as a treatment to compare responses between age groups.
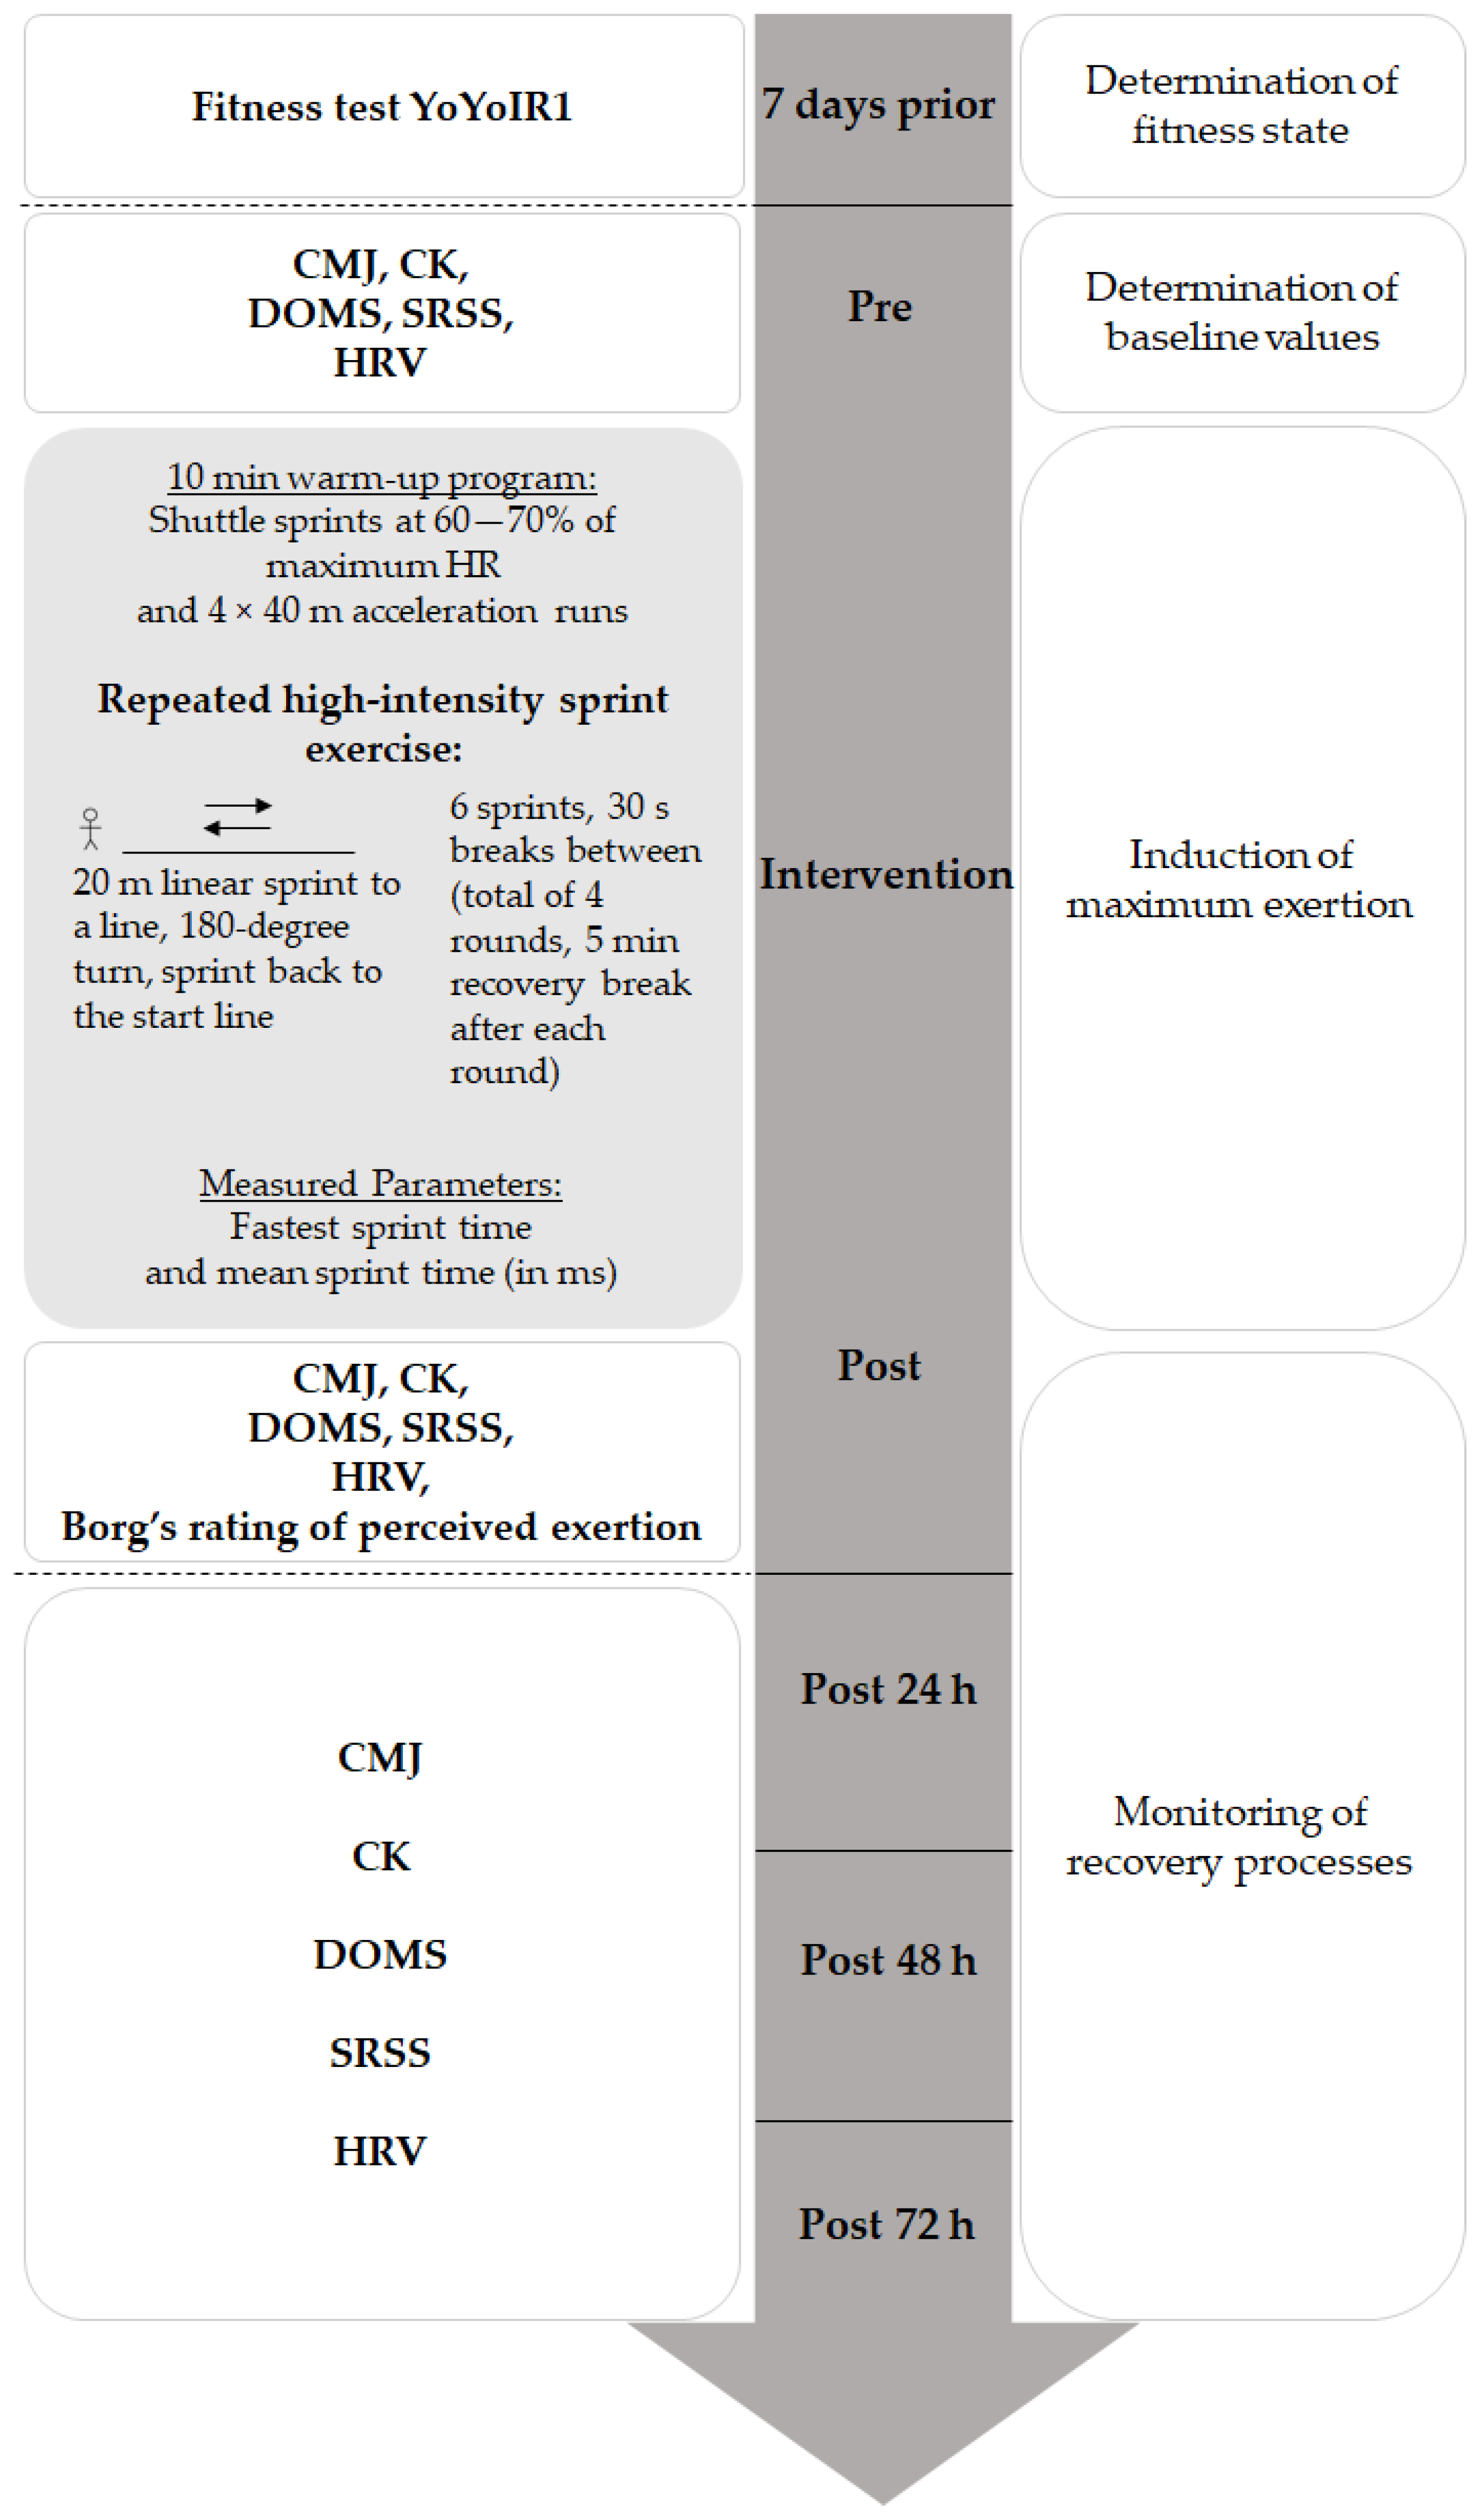
Figure 1 shows a flow chart presenting the process of cross-section measurement. One week before the intervention, all participants performed the YoYoIR1 Fitness Test supervised by a test administrator, to determine their state of fitness and assess their eligibility for the study.
The study was conducted during the winter break while the participants were engaged in a low-intensity training phase. On the day of the exercise and the subsequent day, the participants were requested to attend neither a team nor individual training. Leading up to the last measurement, all the participants performed only one low-intensity team training. Parameters to measure acute and chronic recovery processes were checked for all the participants at five measurement times: PRE (immediately before the intervention), POST (immediately after the intervention), POST 24 h (24 h after the intervention), POST 48 h (48 h after the intervention), and POST 72 h (72 h after the intervention). The following parameters were measured: counter movement jump (CMJ) height, creatine kinase (CK), an estimation of the delayed onset muscle soreness (DOMS) using the visual analogue scale (VAS), the short recovery and stress scale for sport (SRSS), and heart rate (HR) as well as heart rate variability (HRV).
2.3. Training Intervention
The exercise intervention consisted of a series of repeated sprint intervals [
16]. Participants started with a 10-min warm-up program consisting of shuttle sprints at 60–70% of the maximum heart rate, followed by four 40 m acceleration runs. A repeated high-intensity sprint exercise was used to induce the main exertion and fatigue. For this purpose, participants performed a total of four rounds of change-of-direction sprints (20 m linear sprint to a line, 180-degree turn, linear sprint back to the start line), with a five-minute recovery break after each round. One round consisted of six 40 m change-of-direction sprints (2 × 20 m) with 30-s breaks between the sprints. The sprints were carried out under the supervision of three test administrators. This repetition sprint protocol is based on previous research done by Wiewelhove and colleagues [
16], which demonstrated that such a protocol is valid and reliable to study fatigue and recovery.
In order to quantify the participants’ performances, sprint times were measured using light curtain systems placed at the start and finish lines. Moreover, participants wore a chest monitor measuring the heart rate during the testing. In order to determine the participants’ subjectively perceived physical stress, the Borg’s ratings of perceived exertion [
17] were obtained immediately after the completion of the sprint protocol. On this scale, physical exertion can be rated on a range that varies from 0 (no exertion at all) to 10 (maximum exertion).
Subsequently, participants performed three CMJs, estimated DOMS using the VAS scale, and completed the SRSS just as they did immediately before the intervention. Half an hour after the completion of the repeated high-intensity sprint exercise, blood was obtained from the participants’ earlobes to measure CK. Additionally 24, 48, and 72 h after the intervention ([
18] for a similar study design and selection of measurement time points), the orthostatic test and the three CMJs were repeated. Moreover, CK in the blood was again determined, the SRSS was completed, and estimations of muscle soreness using the VAS scale were obtained so that both objective and subjective measures were considered to assess the players’ recovery process.
2.4. Measurements
2.4.1. CMJ
To determine jump height, participants performed three CMJs on a contact plate (Haynl-Elektronik GmbH, Schönebeck, Germany) with their arms placed at the hips ([
19]). They started with a counter movement initiated by actively and quickly lowering the body’s center of gravity. Immediately after reaching a squat position, participants were instructed to jump vertically as high as possible. The flight time was measured (the time between take-off of the contact plate and landing) and, based on this value, the vertical jump height was calculated. The mean value for the three successive jumps was calculated as representative value for the respective measurement time point.
2.4.2. CK
In order to identify cellular muscle damage, capillary blood was collected from the hyperaemized earlobe and was analyzed for CK (and lactate values once every six min after the intervention). Blood samples were extracted using a 20 μL capillary tube and were hemolyzed in 1 mL macro test containers, and an enzymatic-amperometric analysis was conducted using the Biosen S-Line Sport device (EKF-diagnostic®).
2.4.3. DOMS
DOMS is a common form of musculoskeletal pain usually felt when exercised muscles are moved, stretched, or palpated and is often accompanied by increased muscle tenderness and stiffness [
20]. The VAS scale was used to quantify muscle soreness (e.g., [
21]). The participants were instructed to rate the intensity of their current muscle soreness after palpitation of the leg muscles. They were asked to mark a point on the VAS scale (a 10 cm line, ranging from 0 = no pain to 10 = extreme pain) which best reflected their current level of muscle pain.
2.4.4. SRSS
The subjective ratings of perceived recovery and stress were determined using the SRSS [
22]. The items of the SRSS were derived from the Acute Recovery and Stress Scale (ARSS; [
23]); the SRSS, therefore, represents a reduced version of the ARSS. The SRSS indicated acceptable homogeneity for both the short scales (Recovery: Cronbach’s alpha = 0.70; Stress: Cronbach’s alpha = 0.76; [
22]). While the Short Recovery Scale is represented by the items Physical Performance Capability, Mental Performance Capability, Emotional Balance, and Overall Recovery; the Short Stress Scale is represented by the items Muscular Stress, Lack of Activation, Negative Emotional State, and Overall Stress. There is no further aggregation to mean or overall scores. The participants were asked to provide responses to the eight items on a rating scale ranging from “0” (does not apply at all) to “6” (fully applies) putting their answers in relation to the highest state they have ever experienced (so far).
2.4.5. HRV
The players’ heart rate was recorded at beat-to-beat intervals (RR recording) in milliseconds with the RS800CX device (Polar Electro, Finland). The orthostatic test was performed to measure the heart rate and HRV in supine and the standing positions. For this test, athletes first lay in a supine position for three minutes remaining silent and breathing normally. Upon request by the test administrator, they then stood up and remained standing, calm, and silent for two minutes. The rMSSD was calculated for two minutes each in the supine and the standing position (one-minute stabilization period) using the software Kubios HRV-Standard 3.3.1 [
24].
2.5. Data Analysis
We analyzed performance outcome (i.e., sprint performance) as the dependent variable, conducting a repeated measures ANOVA with sprint test run (1. test run, 2. test run, 3. test run, 4. test run) as the intra-participant group factor and age group (U20 players, older players) as the between-subject factor.
Group differences (U20 players, older players) of blood lactate levels immediately before (PRE) and after (POST) the intervention were analyzed performing a repeated measures ANOVA. Moreover, we conducted repeated measures ANOVAs to test for any interaction effects between group (U20 players, seniors) and measurement time point (PRE, POST, POST 24 h, POST 48 h, POST 72 h) on the parameters CMJ height, CK, DOMS, and SRSS. In case of any violations of sphericity, Greenhouse-Geisser correction was applied. Bonferroni-corrected pairwise comparisons were used to follow up significant main effects. Significance level was α = 0.05. Concerning the effect sizes, either partial eta-squared (η2) or Cohen’s d was reported. However, as some subjects skipped at least one single test (e.g., CMJ) at one of the measurement time points, we performed the ANOVAs only with those few subjects who had measurements for a test at all five measurement time points, which implies that the various ANOVAs that had been performed for each task/parameter included a different number of participants.
The rMSSD was calculated from the heart rate data (RR-recording) for each player before (PRE) and after the intervention (POST, POST 24 h, POST 48 h, POST 72 h). Mean values and standard deviations were calculated for the U20 and older players at each measurement time point.
3. Results
3.1. Performance of High-Intensity Interval Exercise
Full data of all 24 sprints, that is, all four test runs consisting of six 40 m sprints each, was available for 10 U20 players and 17 older players. As demonstrated in
Table 1, sprint performance decreased both in U20 (
p = 0.019,
d = 0.897) and in older players (
p < 0.001,
d = 1.548) between the first and the last test run. The U20s outperformed the seniors across all test runs,
F(1,25) = 4.556,
p = 0.043, η
p2 = 0.154, but there was no difference between the age groups’ fastest sprints (
p = 0.193) (
Table 1).
The subjective Borg ratings by the U20 (M = 8.67, SD = 1.23) and the older players (M = 8.29, SD = 1.96) were nearly the same (p = 0.566).
Blood lactate levels were similar in both age groups, F(1,27) = 4.144, p = 0.052, ηp2 = 0.133, with higher levels after the intervention (M = 10.22 mmol/L, SD = 2.63 mmol/L) than immediately before the intervention (M = 0.91 mmol/L, SD = 0.26 mmol/L), F(1,27) = 403.000, p < 0.001, ηp2 = 0.937.
3.2. Measurements
The results of the ANOVAs are presented in
Table 2. A significant main effect of age group was found for the players’ jump performance. There were significant changes between the five time points for all single parameters. CK values varied as a function of age.
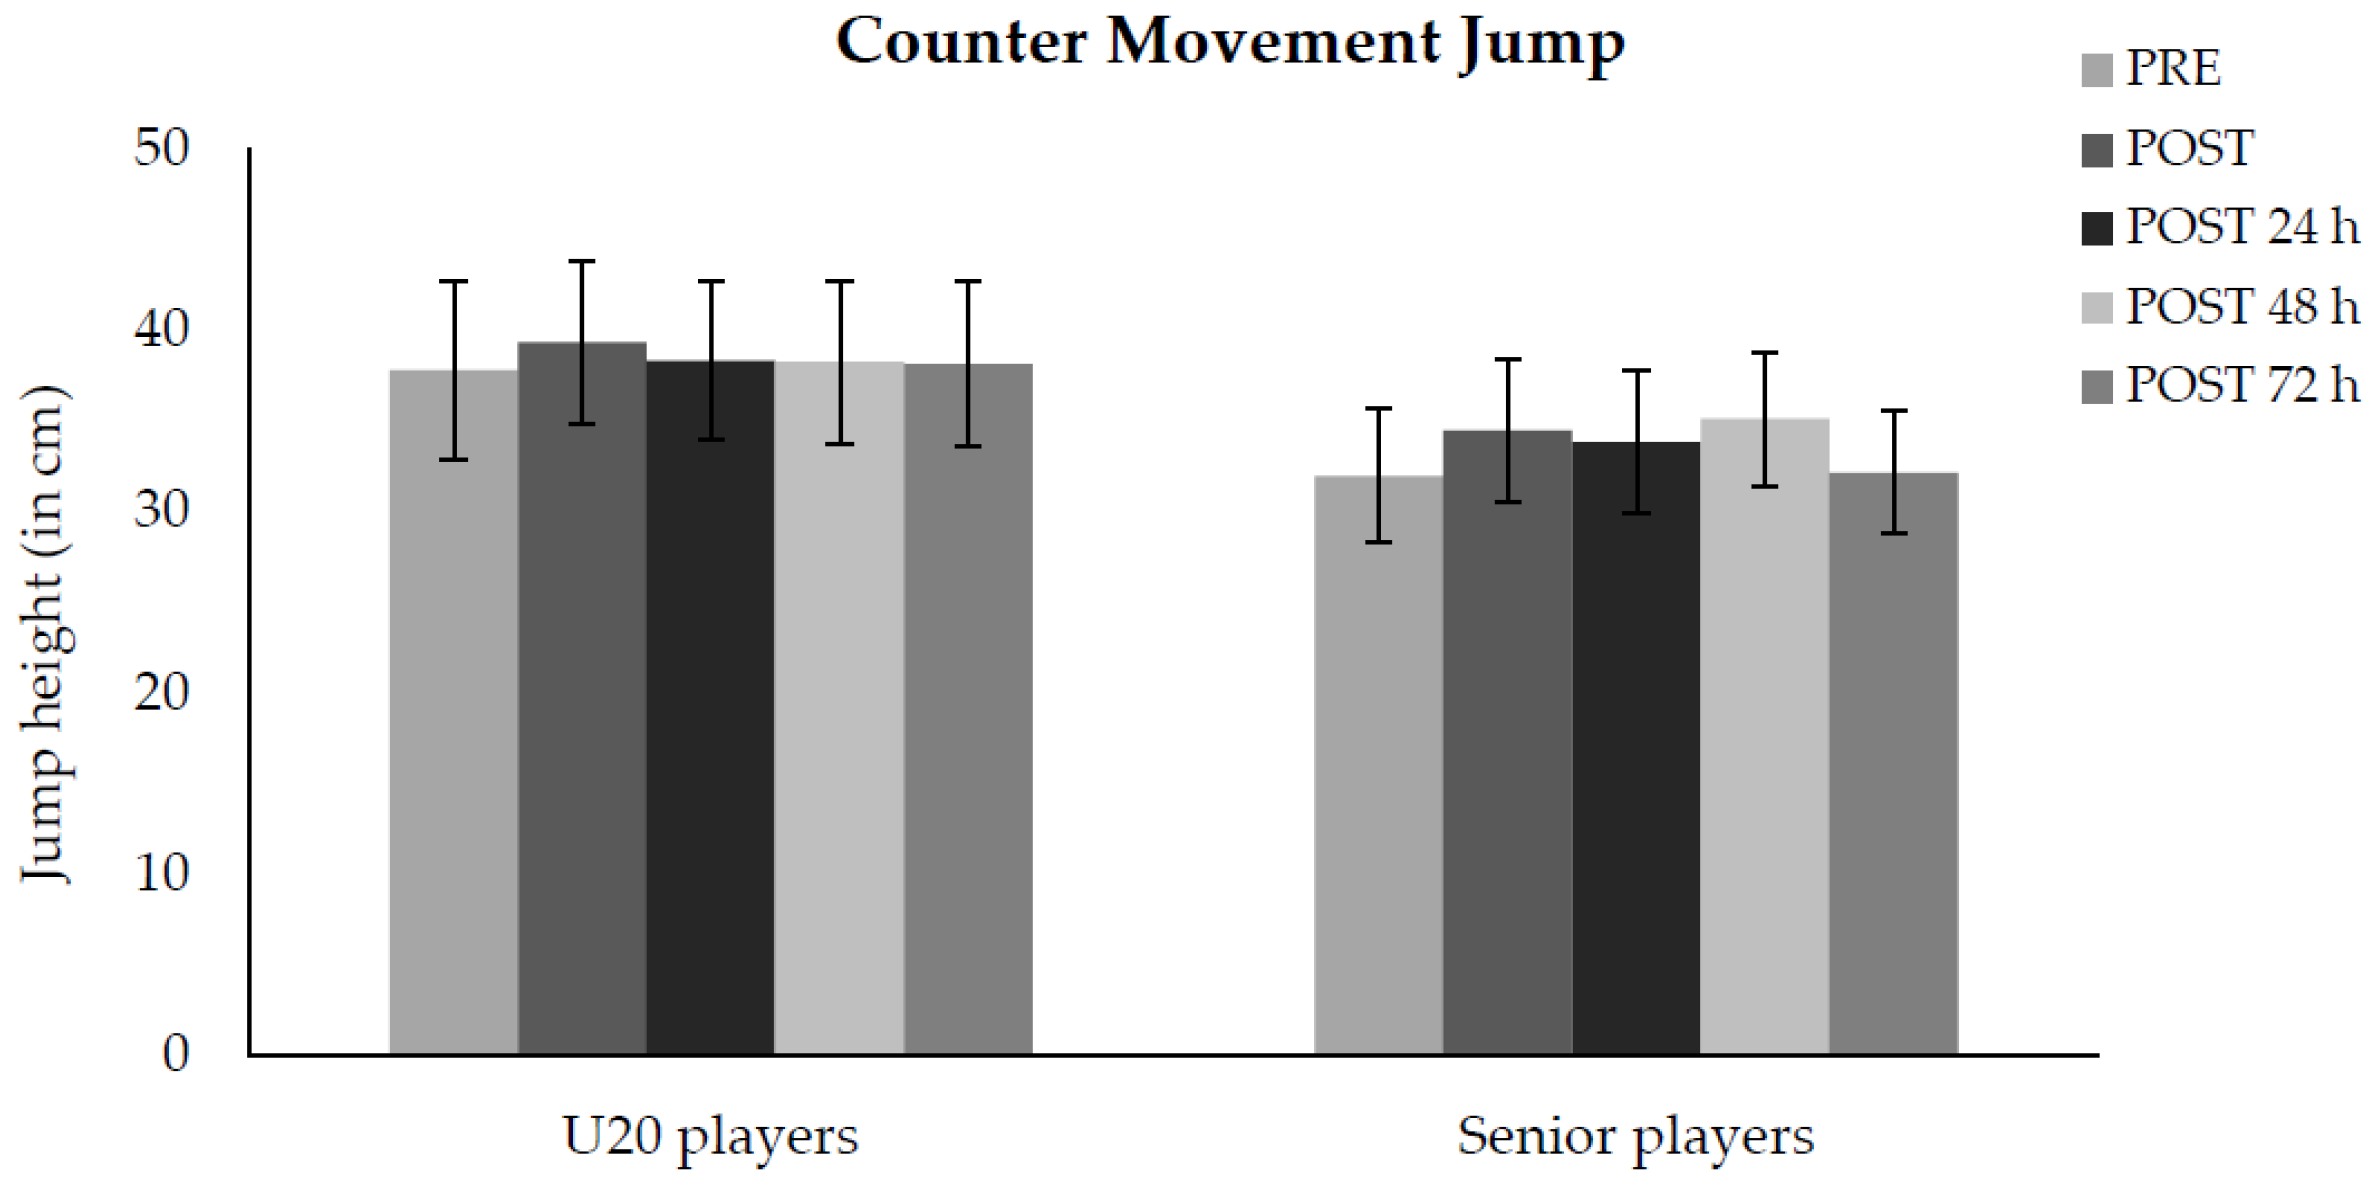
3.2.1. CMJ
Full data of the jump height for each measurement time point was available for 10 U20 and 14 older players. The U20s outperformed older players across all measurement points. On a descriptive level,
Figure 2 shows that the U20 players performed best in vertical jump height directly after the repetition sprint training (POST), while the older players delivered their maximum CMJ performance two days after the repeated high-intensity sprint exercise (POST 48 h).
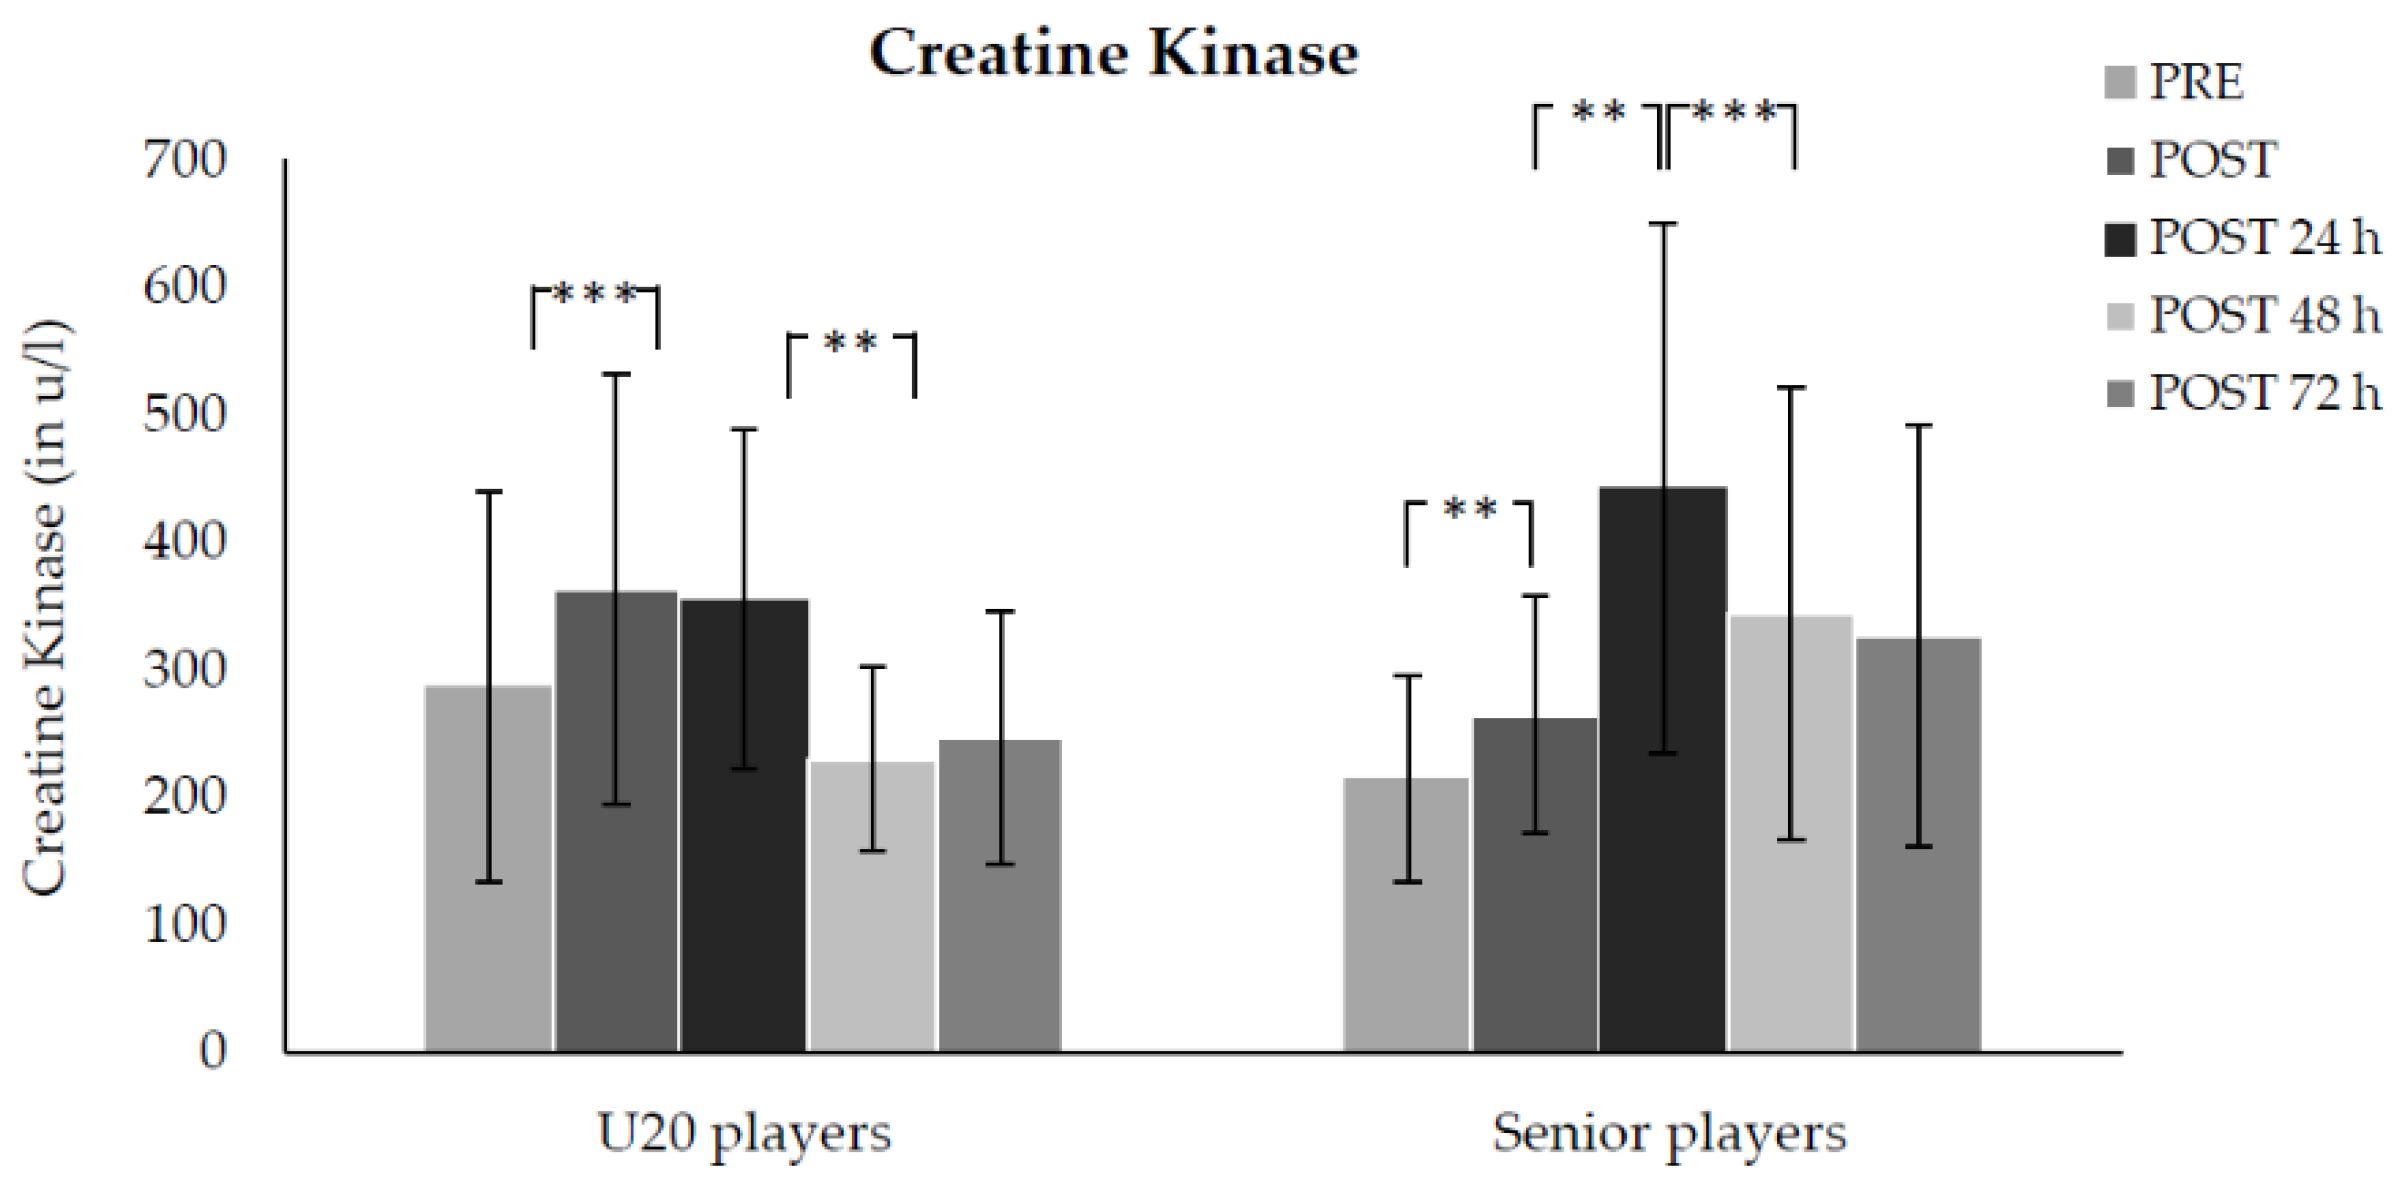
3.2.2. CK
Full data of the CK for each measurement time point was available for 9 U20 and 13 older players. Across both age groups, the participants’ CK was higher in the POST compared to the PRE test (
p < 0.001,
d = 1.229) and higher in the POST 24 h than in the POST 48 h test (
p < 0.001,
d = 1.479), with no difference between any other measurement time points (
Figure 3). There was no significant difference in CK values between age groups at any of the first four measurement time points, but the U20 players showed marginally lower values than the senior players at the POST 72 h measurement (
p = 0.039,
d = 0.96).
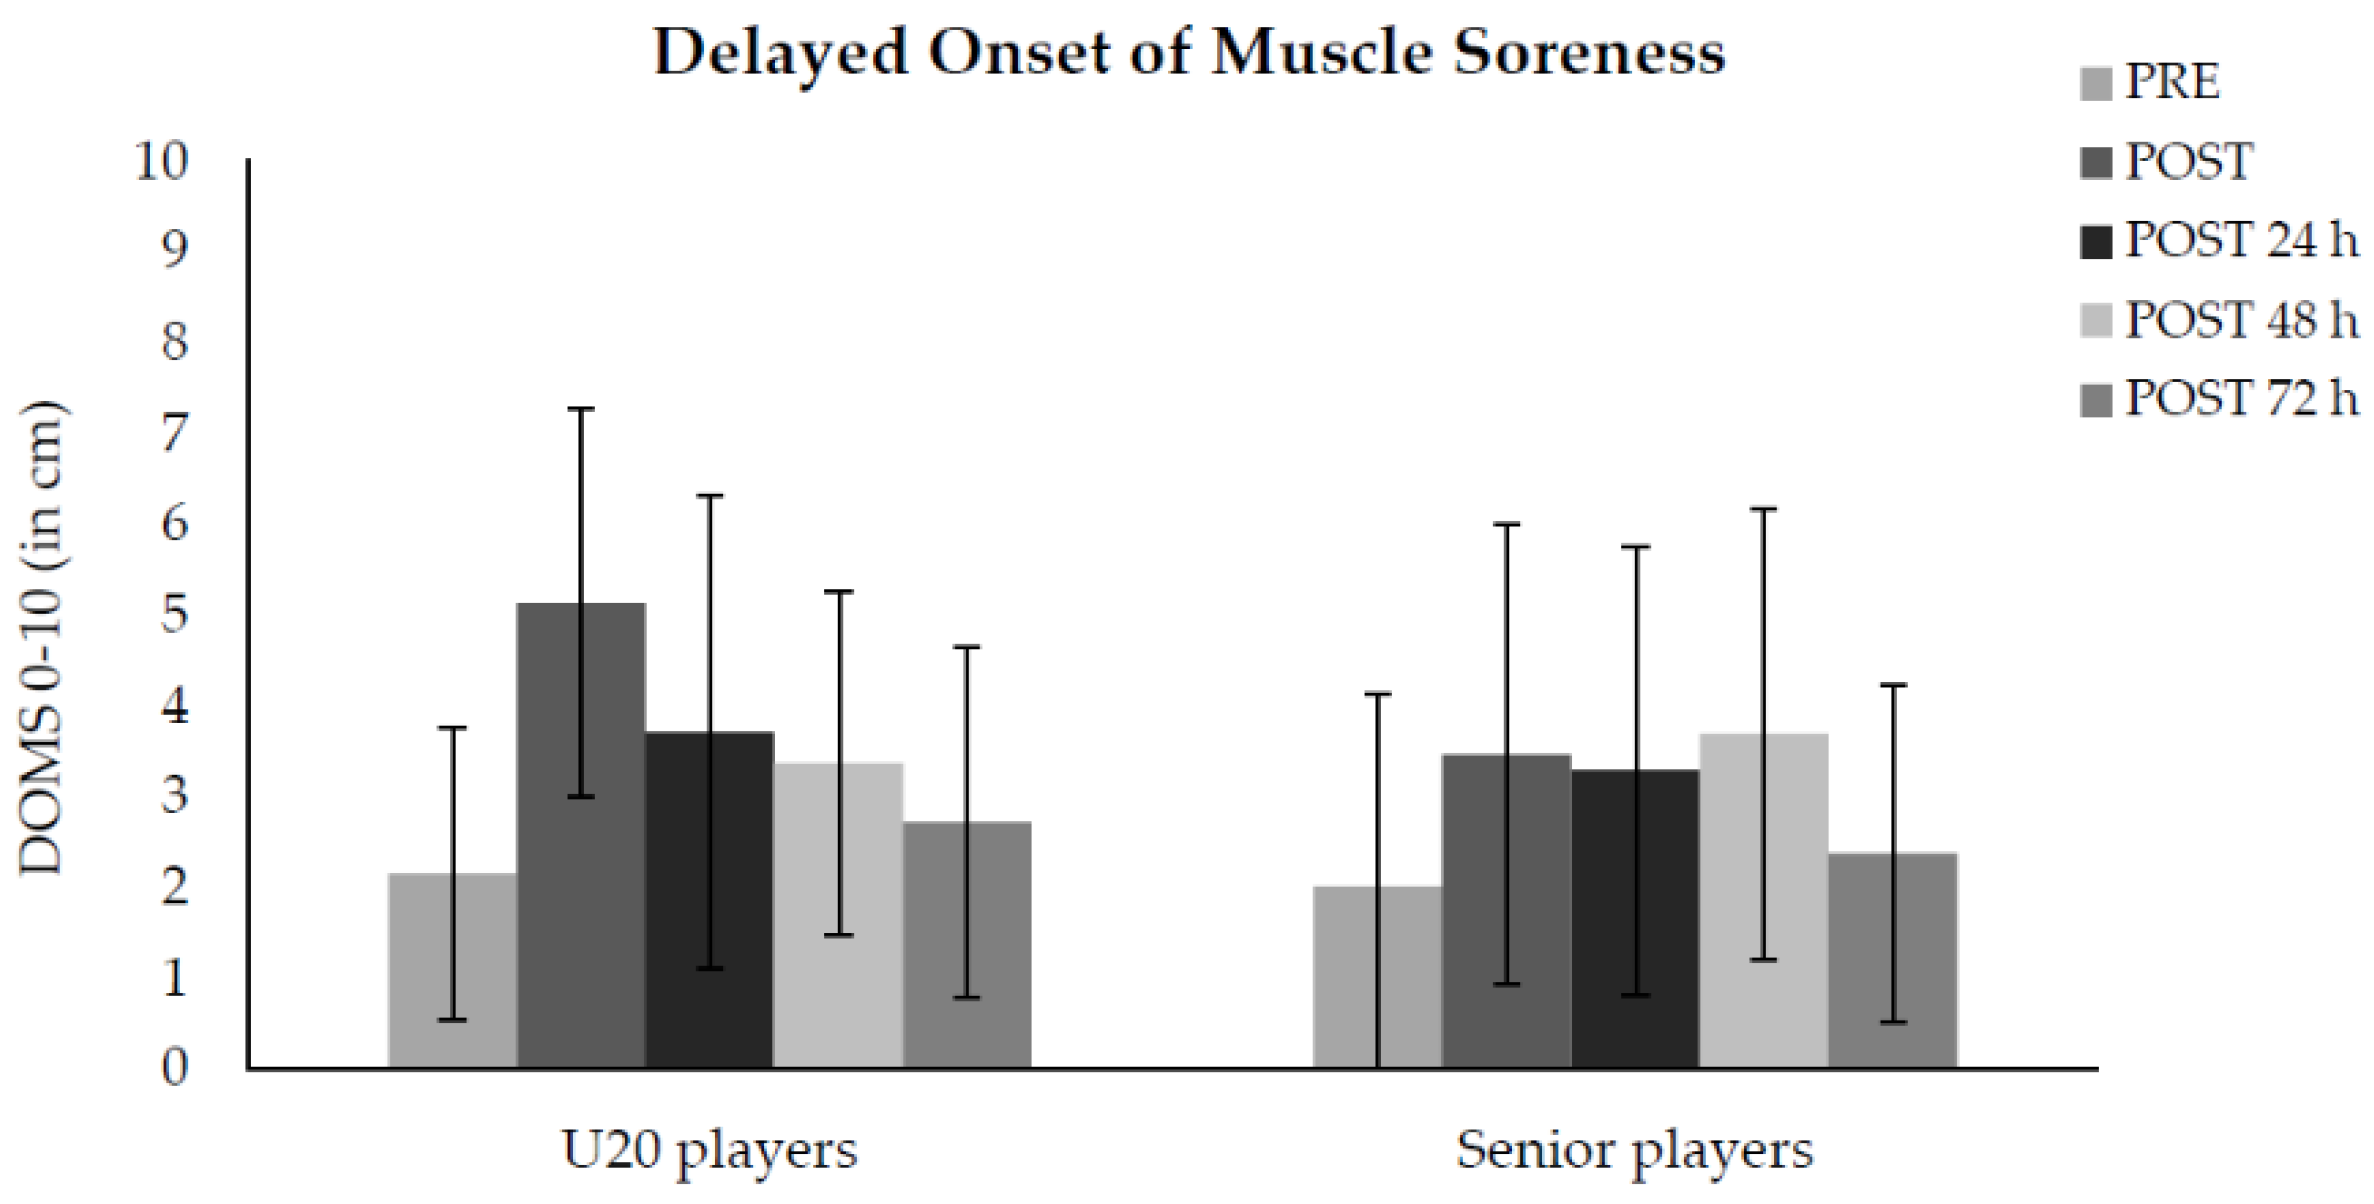
3.2.3. DOMS
Full data sets of the DOMS parameter for each measurement time point were available for 11 U20 and 11 older players. Across both age groups, the perceived muscle soreness was lower in the PRE test compared to the POST (
p < 0.001,
d = 1.08) and POST 48 h (
p < 0.001,
d = 0.89) tests, with no differences between any other measurement time points. The highest values were measured directly after the exercise (POST) for both groups. Three days after the intervention (POST 72 h) values for both groups returned close to their starting levels (
Figure 4).
3.2.4. SRSS
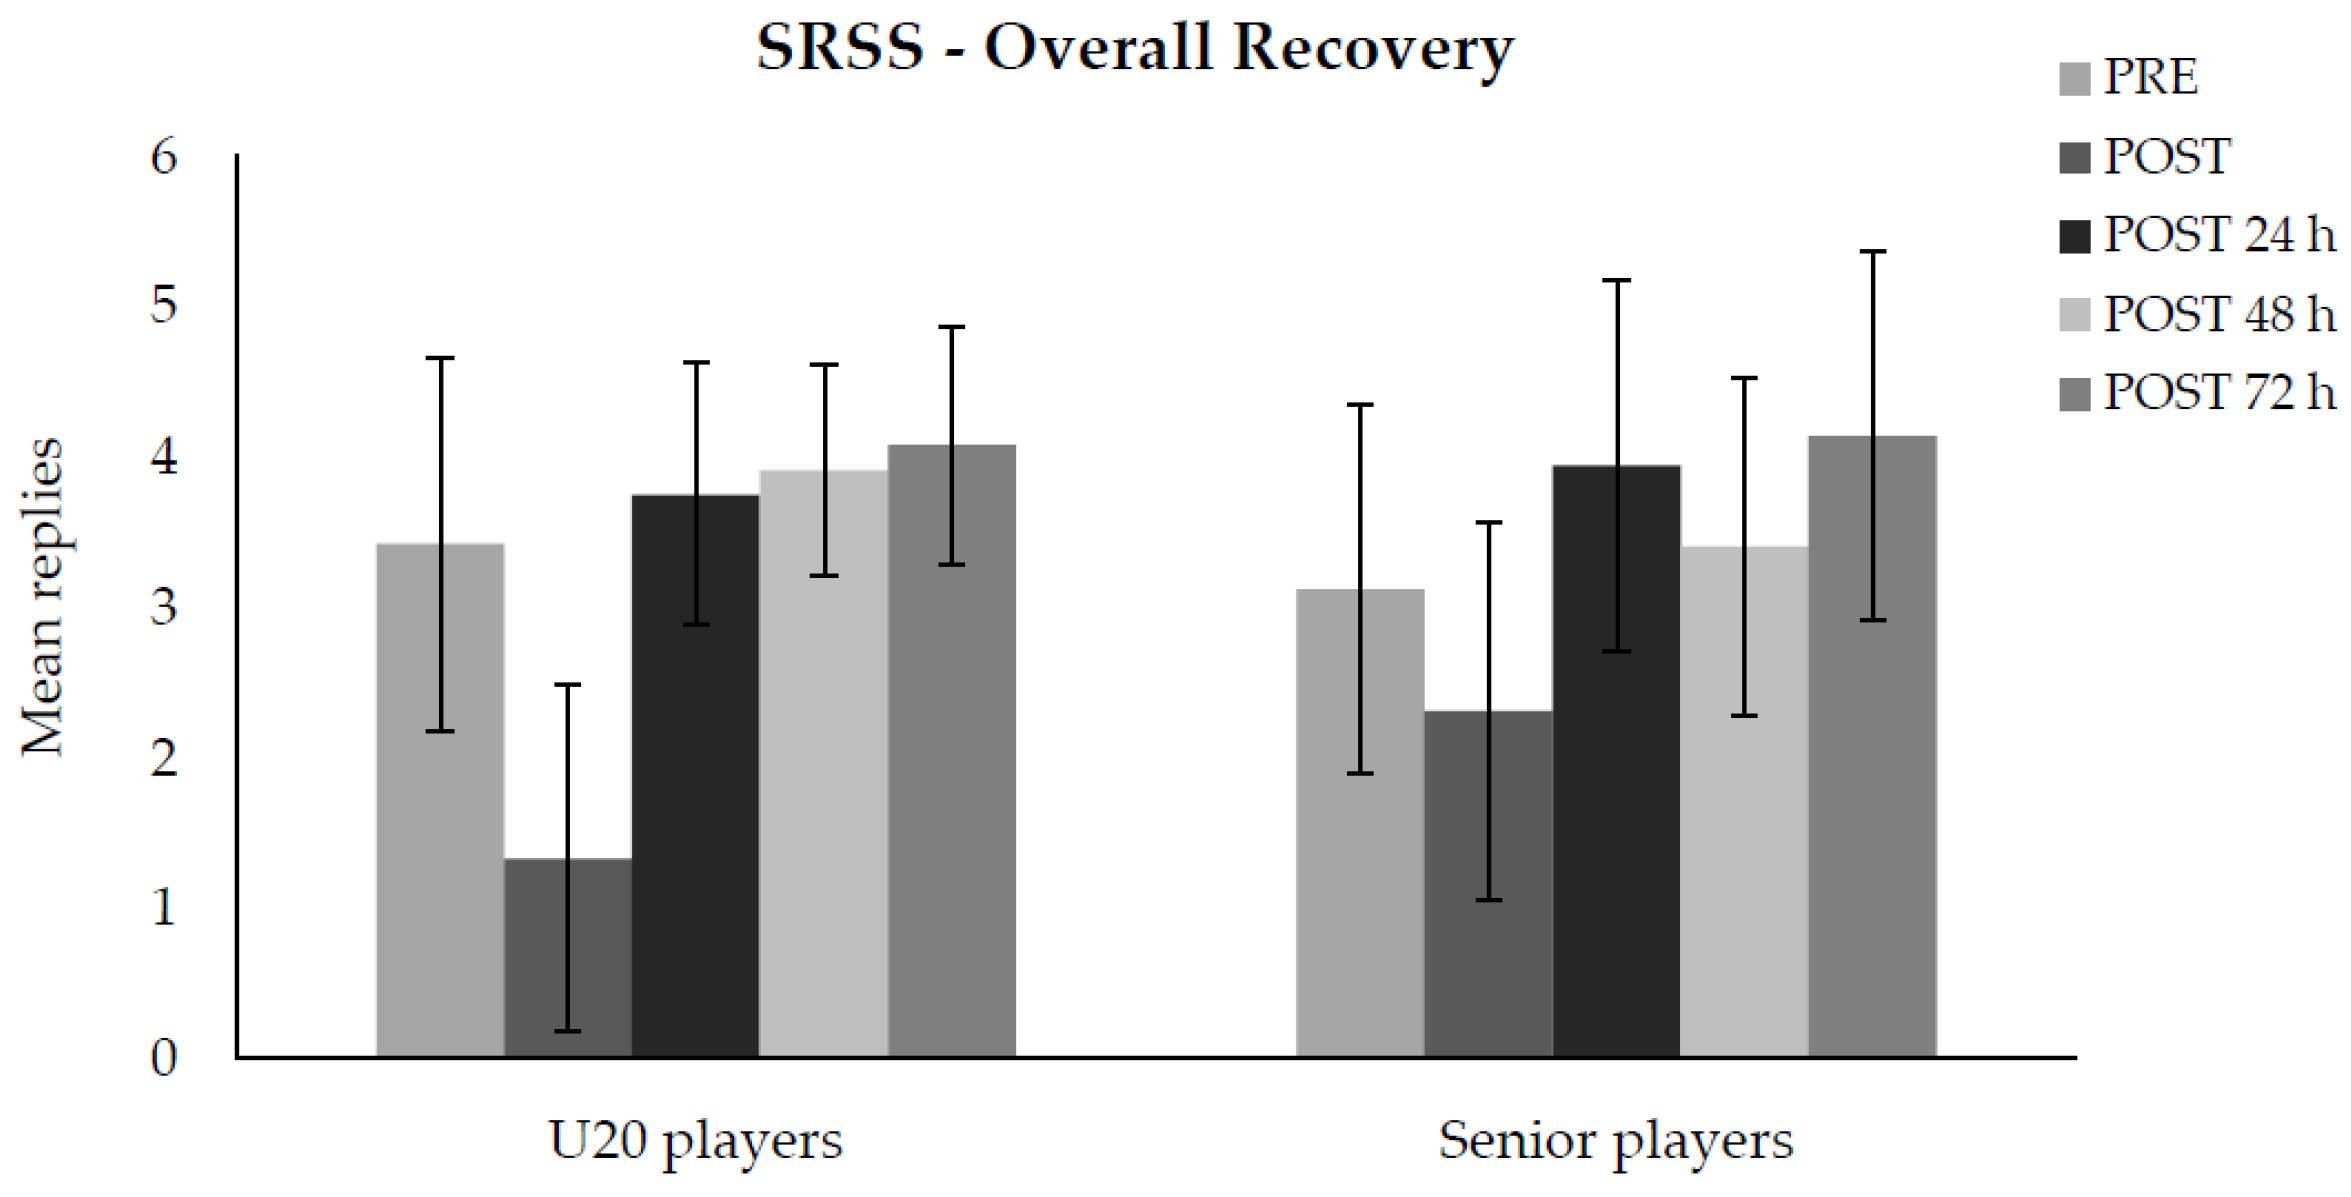
Full datasets of the eight subscales of the SRSS for each measurement time point were available for 10 U20 and 10 older players. We did not find any significant interaction effects between either of the subscales and age group.
Figure 5 shows the subjective evaluation of both age groups’ overall recovery based on their replies to the respective subscale in the SRSS. Both age groups (11 U20, 12 older players) felt the least recovered directly after the intervention, with a significant difference between the PRE and POST test (
p < 0.001,
d = 0.882) and between the POST and POST 24 h testing time points (
p < 0.001,
d = 1.499). Participants felt recovered to nearly the same degree at the POST 24 h and POST 48 h measurement time points (
p = 0.847,
d = 0.041), with no difference between POST 48 h and POST 72 h (
p = 0.015,
d = 0.552).
3.2.5. HRV
The mean rMSSD values in the supine and standing position were reduced for both the U20s and senior players directly after the intervention with no significant difference between the two groups (
Table 3). Twenty-four hours after the exercise (POST 24 h), the mean rMSSD values in the supine and the standing position exceeded the PRE values in the U20 group. There was a significant group difference for the mean rMSSD values in the supine position between age groups at POST 24 h (
p = 0.01); the senior players’ rMSSD values in the supine position were significantly lower compared to those of the U20s. Similarly, the senior players’ rMSSD values in the standing position were lower compared to the U20s’ values, but without reaching statistical significance (
p = 0.8). Two and three days after the training intervention no significant group differences were found.
4. Discussion
In this study, recovery following exercise depending on age in semi-professional handball players was investigated after a repeated high-intensity sprint exercise including four sets of 6 × 40 m all-out change-of-direction sprints. The fastest sprint times of both age groups were nearly the same, however, the mean sprint time across all 24 runs was better for the U20 group (mean age: 18 years) than for the older players (mean age 27 years). While the U20 players’ sprint performance decreased by an average of 0.2 s, older players’ performance decreased by 0.4 s. One possible explanation for the fact that the age groups’ fastest sprint times did not differ, while the total sprint performance did, could be that seniors did not exert themselves the way the U20 players did, meaning they might not have exerted themselves to their maximum limit as actually required for every single sprint. Alternatively, the finding could indicate that the older players became fatigued more quickly than the U20 players during the exercise, possibly reflecting different recovery processes. An age-related effect was observed for the players’ CK values and the vagal HRV parameter rMSSD: U20 players showed marginally lower CK values than the older players 72 h after the exercise. The rMSSD showed a faster recovery for the U20 compared to the senior players 24 h following the intervention. However, both age groups reported nearly the same subjective stress and recovery levels. Moreover, we did not find any age effects on the players’ subjectively perceived muscle soreness or on their jump performance after the exercise. It can, thus, be concluded that a repeated high-intensity sprint exercise does not differently affect the physical performance ability (i.e., jump height as an assessment that can be used to measure an aspect of physical performance) of U20 and older players. However, single parameters related to the players’ recoverability, such as CK and HRV values, vary as a function of age at least in part, while other recovery parameters (e.g., muscle soreness) do not differ depending on age following high physical stress.
Although U20s outperformed the seniors with regard to their jump height immediately after the sprints, as well as POST 24 h, POST 48 h, and POST 72 h, this effect is unlikely due to age-related differences in the recovery process, because this performance difference was already measured before the physical stress.
4.1. CMJ
Across both age groups, better jump performances were measured immediately, POST 48 h and POST 24 h compared to those immediately before the intervention (PRE). One possible explanation for this could be the concept of post-activation potentiation (PAP), which refers to an acute increase in muscular performance following very intensive, voluntary muscle contraction (i.e., submaximal levels of muscle activation). The PAP is generally explained by increased myosin light chain phosphorylation occurring in type II muscle fibers [
25]. Following intensive exercise, the athlete experiences a short-term performance increase in the execution of explosive movements. For the first time, the current study could demonstrate that the PAP is not affected by age within the age span typical for handball players. This finding could be of particular interest for coaches when conceptualizing any strength and power exercises for their team.
4.2. CK
Both the U20 and the older players’ CK values peaked on the day following the intervention (POST 24 h). While the value of the U20 age group was below the initial level within 48 h after the exercise, the older players’ value had not returned to its initial baseline level even at the last measurement time point, at 72 h after the intervention. However, no significant differences were found between both age groups’ CK values when comparing the single measurement time points except at the POST 72 h measurement. This indicates that younger players can recover more quickly and could return to the exercise earlier compared to older athletes whose CK values require more time to return to their base levels.
4.3. DOMS
Symptoms of DOMS can range from muscle tenderness to severe, debilitating pain. In the current study, the DOMS reports at the five different measurement time points did not vary as a function of age group. On a descriptive level, the U20 players reported the highest perceived muscle soreness immediately after the intervention (POST) and the older players, 48 h after the intervention. However, no significant differences between groups and measurement time points were found. Three days after the intervention (POST 72 h) the values of both groups nearly returned to their base levels. Previous research has discussed a time period in which DOMS typically develops: Some studies have found that DOMS often develops between 12 and 24 h after the muscle contractions end, with peak soreness being experienced 24 to 72 h after the exercise is completed. However, individual differences have been observed depending on the sport and athletes’ habituation to the exercise [
26]. The high standard deviations in
Figure 4 indicate great individual differences in players’ subjective DOMS. Any descriptive differences between the age groups might have occurred due to other reasons, for example, the older athletes might have had more prior experience with intense training impacts, or social desirability effects might have influenced younger athletes’ responses.
It is noteworthy and surprising that at the measurement points after the exercise, the CK values of both age groups were considerably different (even though the differences were not all significant), but the DOMS reports were not. It is presumably because the experienced athletes put in less effort and did not push their physical limits of performance capacity. The younger athletes seemingly misinterpreted the acute stress to be muscular pain. However, this pain turned out to be atypical for muscle soreness with lasting tissue damage, as shown in the data from the following days. Future studies may be required to further investigate the interaction between the athletes’ CK values and subjective DOMS in more detail.
4.4. SRSS
In addition to the parameters for assessing the quality and the temporal sequence of the skeletal muscle recovery, the SRSS was used to record the subjectively perceived effects of the exercise load. There were no differences between the various subscales, or between the two age groups, or even between the various measurement time points. However, the graphical illustrations of the results in
Figure 5 show that, on a descriptive level, participants of both age groups reported being less recovered immediately after the exercise than before or compared to the days following the exertion. Unlike the physiological parameters (e.g., CK, HRV) that seem to change as a function of age after a repeated high-intensity sprint exercise, the subjective perceptions of muscle damage and overall stress did not depend on age. Most of the time, training stress in handball consists of pressure on the upper body muscles and structures (in strength training) and in particular of highly intense duels with body contact [
27].
4.5. HRV
For the analysis of stress and recovery, handball players’ vagal HRV parameter rMSSD was used to reflect the autonomous regulation of the athletes’ nervous system. The rMSSD values at all measurement time points showed high standard deviations. Immediately after the acute intervention, a decrease of the mean rMSSD values in the supine and in the standing position was found for both age groups. This reflects the stress on the autonomic nervous system caused by the repeated high-intensity sprint exercise. During and immediately after the exercise, a high activation of the sympathetic nervous system. Consequently, greatly reduced rMSSD values compared to the baseline values were measured probably because the HR was still increased and the HRV normally decreases with a higher HR. One day after the exercise, the rMSSD values had already rebounded, and even risen above the PRE exercise values and remained elevated on the days following the exercise. This overcompensation of the rMSSD following an intensive exercise has already been shown in various previous studies [
28,
29,
30]. Parasympathetic reactivity leads to higher cardiac vagal control, which improves the self-regulation of the system for further training stimuli [
31]. This positive adaptation has only occurred with sufficient recovery in previous studies [
28,
29]. However, the significantly higher mean rMSSD values of the U20s compared to the older players on the first day after the intervention could be explained by a faster recovery of youth players’ autonomic system. These findings conform to the previously mentioned slower decrease of older players’ CK values.
There are some limitations of the current study and considerations for future research that should be addressed. Previous research that has investigated the effect of aging on muscle damage caused by resistance exercise, for example, has found contradicting results between men and women (e.g., [
32,
33]). As the current study analyzed only male handball players, future studies should investigate for any differences between the genders, too. It should also be noted that the observations in the current study were differentiated between a group of “young” and “older” players, even though, the mean age of both groups was under 30 years. Therefore, it would be advisable for future research to compare the athletes below 20 years and above 30 years with each other in order to exclude the possibility that age transition is fluid, thereby making it difficult to reveal any stable age effects. Furthermore, the age span was significantly greater in the seniors (20–42 years) than in the U20 players (17–19 years). Attention should be paid in selecting groups with similar age ranges (e.g., a gap of 5 years within each group) in future studies. Another limitation of the current study is that some subjects had to be excluded from the statistical analyses since they skipped single tests at distinct measurement time points leading to differing sample sizes and hindering a generalization of the findings. The focus on semi-professional handball players, who had to be tested at five different measurement time points, made the data collection unique but also more difficult. Future research, therefore, could consider studying non-expert and amateur handball players’ performance and recovery processes after the intervention. Changing or adapting the exercise could also be an option for future investigations. While the handball players in the current study performed a repeated high-intensity sprint exercise consisting of four sets of 6 × 40 m all-out change-of-direction sprints, future research could adapt the sprint track, the intervals, or also the performance test, in ways that correspond more to the multidirectional requirements of the game.
5. Conclusions
The current study, for the first time, investigated performance changes and recovery processes of handball players within an age span typical for team sport athletes, following a high-intensity sprint exercise. The results do not clearly indicate that exertion capacity and recoverability vary as a function of age. Although it was shown that the CK values differ between U20 and older players, at least around 48 h after the intervention, and that older players’ rMSSD values in the supine position were lower compared to those of the U20 players 24 h after the exercise, no significant interaction effect between measurement time point and age was found on the parameters CMJ, DOMS, and SRSS. Overall, the findings indicate that performance capacities can be maintained through systematic physical exercise (e.g., CMJ) and that recovery processes have to be controlled individually with respect to various physiological parameters (e.g., CK, HRV). Further research on the subject can indicate whether these findings can be applied to other team sports, such as basketball, football, or volleyball.
Author Contributions
Conceptualization, M.K., L.H., A.F. and F.F.; methodology, M.K., L.H., A.F. and F.F.; validation, M.K.; formal analysis, M.K.; investigation, M.K.; resources, M.K.; data curation, M.K.; writing—original draft preparation, S.K.; writing—review and editing, S.K., L.H., A.F. and F.F.; visualization, S.K.; supervision, S.K.; project administration, S.K. and A.F. All authors have read and agreed to the published version of the manuscript.
Funding
This research received no external funding.
Institutional Review Board Statement
The study was conducted according to the guidelines of the Declaration of Helsinki and approved by the ethics committee of the Ruhr University Bochum (date of approval: 19 February 2019). (The declaration of the ethics committee is available by request to the first author or the journal’s editor.)
Informed Consent Statement
Informed consent was obtained from all subjects involved in the study.
Data Availability Statement
The data and test protocols are available on request to the second author.
Conflicts of Interest
The authors declare no conflict of interest.
References
- Ashworth, J.; Heyndels, B. Selection bias and peer effects in team sports: The effect of age grouping on earnings of German soccer players. J. Sports Econ. 2007, 8, 355–377. [Google Scholar] [CrossRef]
- Figueira, B.; Gonçalves, B.; Masiulis, N.; Sampaio, J. Exploring how playing football with different age groups affects tactical behaviour and physical performance. Biol. Sport 2018, 35, 145–153. [Google Scholar] [CrossRef]
- Póvoas, S.C.A.; Ascensão, A.A.M.R.; Magalhães, J.; Seabra, A.F.; Krustrup, P.; Soares, J.M.C.; Rebelo, A.N.C. Physiological demands of elite team handball with special reference to playing position. J. Strength Cond. Res. 2014, 28, 430–442. [Google Scholar] [CrossRef]
- Hottenrott, K.; Hoos, O. Heart rate variability analysis in exercise physiology. In ECG Time Series Variability Analysis: Engineering and Medicine; Jelinek, H.F., Cornforth, D.J., Khandoker, A.H., Eds.; CRC Press: London, UK, 2017; pp. 245–273. [Google Scholar]
- Schneider, C.; Wiewelhove, T.; Raeder, C.; Flatt, A.A.; Hoos, O.; Hottenrott, L.; Schumbera, O.; Kellmann, M.; Meyer, T.; Pfeiffer, M.; et al. Heart rate variability monitoring during strength and high-intensity interval training overload microcycles. Front. Physiol. 2019, 10, 582. [Google Scholar] [CrossRef] [Green Version]
- Tan, J.P.H.; Beilharz, J.E.; Vollmer-Conna, U.; Cvejic, E. Heart rate variability as a marker of healthy ageing. Int. J. Cardiol. 2019, 275, 101–103. [Google Scholar] [CrossRef]
- Fell, J.; Williams, A.D. The effect of aging on skeletal-muscle recovery from exercise: Possible implications for aging athletes. J. Aging Phys. Act. 2008, 16, 97–115. [Google Scholar] [CrossRef] [PubMed] [Green Version]
- Easthope, C.S.; Hausswirth, C.; Louis, J.; Lepers, R.; Vercruyssen, F.; Brisswalter, J. Effects of a trail running competition on muscular performance and efficiency in well-trained young and master athletes. Eur. J. Appl. Physiol. 2010, 110, 1107–1116. [Google Scholar] [CrossRef] [Green Version]
- Bieuzen, F.; Hausswirth, C.; Louis, J.; Brisswalter, J. Age-related changes in neuromuscular function and performance following a high-intensity intermittent task in endurance-trained men. Gerontology 2010, 56, 66–72. [Google Scholar] [CrossRef] [PubMed]
- Borges, N.; Reaburn, P.; Driller, M.; Argus, C. Age-related changes in performance and recovery kinetics in master athletes: A narrative review. J. Aging Phys. Act. 2016, 24, 149–157. [Google Scholar] [CrossRef] [Green Version]
- Kellmann, M.; Bertollo, M.; Bosquet, L.; Brink, M.; Coutts, A.J.; Duffield, R.; Erlacher, D.; Halson, S.L.; Hecksteden, A.; Heidari, J.; et al. Recovery and performance in sport: Consensus statement. Int. J. Sports. Physiol. Perform. 2018, 13, 240–245. [Google Scholar] [CrossRef] [Green Version]
- Skorski, S.; Mujika, I.; Bosquet, L.; Meeusen, R.; Coutts, A.J.; Meyer, T. The temporal relationship between exercise, recovery processes, and changes in performance. Int. J. Sports Physiol. Perform. 2019, 14, 1015–1021. [Google Scholar] [CrossRef]
- Toigo, M.; Boutellier, U. New fundamental resistance exercise determinants of molecular and cellular muscle adaptations. Eur. J. Appl. Physiol. 2006, 97, 643–663. [Google Scholar] [CrossRef] [PubMed] [Green Version]
- Dupont, G.; Defontaine, M.; Bosquet, L.; Blondel, N.; Moalla, W.; Berthoin, S. Yo-Yo intermittent recovery test versus the Université de Montréal track test: Relation with a high-intensity intermittent exercise. J. Sci. Med. Sport 2008, 10, 392–397. [Google Scholar] [CrossRef]
- Krustrup, P.; Mohr, M.; Amstrup, T.; Rysgaard, T.; Johansen, J.; Steensberg, A.; Pedersen, P.K.; Bangsbo, J. The yo-yo intermittent recovery test: Physiological response, reliability and validity. Med. Sci. Sports Exerc. 2003, 35, 697–705. [Google Scholar] [CrossRef]
- Wiewelhove, T.; Raeder, C.; Meyer, T.; Kellmann, M.; Pfeiffer, M.; Ferrauti, A. Markers for routine assessment of fatigue and recovery in male and female team sport athletes during high-intensity interval training. PLoS ONE 2015, 10, e0139801. [Google Scholar] [CrossRef] [PubMed]
- Borg, G. Borg’s Perceived Exertion and Pain Scales; Human Kinetics: Champaign, IL, USA, 1998. [Google Scholar]
- Nédélec, M.; McCall, A.; Carling, C.; Legall, F.; Berthoin, S.; Dupont, G. Recovery in soccer: Part I-post-match fatigue and time course of recovery. Sports Med. 2012, 42, 997–1015. [Google Scholar] [CrossRef] [PubMed]
- Petrigna, L.; Karsten, B.; Marcolin, G.; Paoli, A.; D’Antona, G.; Palma, A.; Bianco, A. A review of countermovement and squat jump testing methods in the context of public health examination in adolescence: Reliability and feasibility of current testing procedures. Front. Physiol. 2019, 10, 1384. [Google Scholar] [CrossRef] [PubMed] [Green Version]
- Cheung, K.; Hume, P.; Maxwell, L. Delayed onset muscle soreness: Treatment strategies and performance factors. Sports Med. 2003, 33, 145–164. [Google Scholar] [CrossRef] [PubMed]
- Hosseninzadeh, M.; Andersen, O.K.; Arendt-Nielsen, L.; Madeleine, P. Pain sensitivity is normalized after a repeated bout of eccentric exercise. Eur. J. Appl. Physiol. 2013, 113, 2595–2602. [Google Scholar] [CrossRef] [PubMed]
- Hitzschke, B.; Kölling, S.; Ferrauti, A.; Meyer, T.; Pfeiffer, M.; Kellmann, M. Development of the short recovery and stress scale for sports (SRS). Z. Sportpsychol. 2015, 22, 146–162. [Google Scholar] [CrossRef] [Green Version]
- Kellmann, M.; Kölling, S.; Hitzschke, B. Das Akutmaß und die Kurzskala zur Erfassung von Erholung und Beanspruchung im Sport-Manual [The Acute and the Short Recovery and Stress Scale for Sports-Manual]; Sportverlag Strauß: Hellenthal, Germany, 2016. [Google Scholar]
- Tarvainen, M.P.; Niskanen, J.P.; Lipponen, J.A.; Ranta-Aho, P.O.; Karjalainen, P.A. Kubios HRV—heart rate variability analysis software. Comput. Methods Programs Biomed. 2014, 113, 210–220. [Google Scholar] [CrossRef] [PubMed]
- Blazevich, A.J.; Babault, N. Post-activation potentiation versus post-activation performance enhancement in humans: Historical perspective, underlying mechanisms, and current issues. Front. Physiol. 2019, 10, 1359. [Google Scholar] [CrossRef] [Green Version]
- Lavender, A.P.; Nosaka, K. Comparison between old and young men for changes in makers of muscle damage following voluntary eccentric exercise of the elbow flexors. Appl. Physiol. Nutr. Metab. 2006, 31, 218–225. [Google Scholar] [CrossRef] [PubMed] [Green Version]
- Karcher, C.; Buchheit, M. On-court demands of elite handball, with special reference to playing positions. Sports Med. 2014, 44, 797–814. [Google Scholar] [CrossRef]
- James, D.V.B.; Barnes, A.J.; Lopes, P.; Wood, D.M. Heart rate variability: Response following a single bout of interval training. Int. J. Sports. Med. 2002, 23, 247–251. [Google Scholar] [CrossRef] [PubMed]
- Mourot, L.; Bouhaddi, M.; Tordi, N.; Rouillon, J.D.; Regnard, J. Short-and long-term effects of a single bout of exercise on heart rate variability: Comparison between constant and interval training exercises. Eur. J. Appl. Physiol. 2004, 92, 508–517. [Google Scholar] [CrossRef] [PubMed]
- Terziotti, P.; Schena, F.; Gulli, G.; Cevese, A. Post-exercise recovery of autonomic cardiovascular control: A study by spectrum and cross-spectrum analysis in humans. Eur. J. Appl. Physiol. 2001, 84, 187–194. [Google Scholar] [CrossRef]
- Laborde, S.; Mosley, E.; Mertgen, A. Vagal tank theory: The three Rs of cardiac vagal control functioning–resting, reactivity, and recovery. Front. Neurosci. 2018, 12, 458. [Google Scholar] [CrossRef] [Green Version]
- Roth, S.M.; Martel, G.F.; Ivey, F.M.; Lemmer, J.T.; Metter, E.J.; Hurley, B.F.; Rogers, M.A. High-volume, heavy-resistance strength training and muscle damage in young and older women. J. Appl. Physiol. 2000, 88, 1112–1118. [Google Scholar] [CrossRef] [Green Version]
- Roth, S.M.; Martel, G.F.; Ivey, F.M.; Lemmer, J.T.; Tracy, B.L.; Hurlbut, D.E.; Metter, E.J.; Hurley, B.F.; Rogers, M.A. Ultrastructural muscle damage in young vs. older men after high-volume, heavy-resistance strength training. J. Appl. Physiol. 1999, 86, 1833–1840. [Google Scholar] [CrossRef]
Figure 1.
A flow chart demonstrating the process of the cross-section-measurement (YoYoIR1 = YoYo Intermittent Fitness Test, CMJ = counter movement jump, CK = creatine kinase, DOMS = delayed onset of muscle soreness, SRSS = short recovery and stress scale for sport, HRV = heart rate variability).
Figure 1.
A flow chart demonstrating the process of the cross-section-measurement (YoYoIR1 = YoYo Intermittent Fitness Test, CMJ = counter movement jump, CK = creatine kinase, DOMS = delayed onset of muscle soreness, SRSS = short recovery and stress scale for sport, HRV = heart rate variability).
Figure 2.
Mean jump height (in cm) as a function of measurement time point (PRE, POST, POST 24 h, POST 48 h, POST 72 h) for U20 and senior handball players. The error bars represent standard deviations.
Figure 2.
Mean jump height (in cm) as a function of measurement time point (PRE, POST, POST 24 h, POST 48 h, POST 72 h) for U20 and senior handball players. The error bars represent standard deviations.
Figure 3.
Mean CK value as a function of measurement time point (PRE, POST, POST 24 h, POST 48 h, POST 72 h) for U20 and senior handball players. The error bars represent standard deviations (*p < 0.05, **p < 0.01, ***p < 0.001).
Figure 3.
Mean CK value as a function of measurement time point (PRE, POST, POST 24 h, POST 48 h, POST 72 h) for U20 and senior handball players. The error bars represent standard deviations (*p < 0.05, **p < 0.01, ***p < 0.001).
Figure 4.
Mean DOMS value (in cm) as a function of measurement time point (PRE, POST, POST 24 h, POST 48 h, POST 72 h) for U20 and senior handball players. The error bars represent standard deviations.
Figure 4.
Mean DOMS value (in cm) as a function of measurement time point (PRE, POST, POST 24 h, POST 48 h, POST 72 h) for U20 and senior handball players. The error bars represent standard deviations.
Figure 5.
Mean replies to SRSS subscale “overall recovery” of U20 and senior handball players as a function of measurement time point (PRE, POST, POST 24 h, POST 48 h, POST 72 h).
Figure 5.
Mean replies to SRSS subscale “overall recovery” of U20 and senior handball players as a function of measurement time point (PRE, POST, POST 24 h, POST 48 h, POST 72 h).
Table 1.
Mean fastest sprint times and mean sprint times (and standard deviations) across all 24 sprints and across all sprints during each of the four test runs [in s] as a function of age (U20 and senior handball players).
Table 1.
Mean fastest sprint times and mean sprint times (and standard deviations) across all 24 sprints and across all sprints during each of the four test runs [in s] as a function of age (U20 and senior handball players).
| Mean Time (in s) |
|---|
| | Fastest Sprints | Across All 24 Sprints | Across All 6 Sprints in the First Test Run | Across All 6 Sprints in the Second Test Run | Across All 6 Sprints in the Third Test Run | Across All 6 Sprints in the Fourth Test Run |
|---|
| U20s | 6.99 (±0.17) | 7.39 (±0.26) | 7.24 (±0.19) | 7.38 (±0.27) | 7.48 (±0.24) | 7.47 (±0.35) |
| Seniors | 7.12 (±0.29) | 7.65 (±0.32) | 7.39 (±0.28) | 7.63 (±0.34) | 7.77 (±0.37) | 7.76 (±0.37) |
Table 2.
Results of ANOVAs and effect size calculations for group, measurement time point (PRE, POST, POST 24 h, POST 48 h, POST 72 h), and interaction effects concerning the test units CMJ, CK, DOMS, and SRSS.
Table 2.
Results of ANOVAs and effect size calculations for group, measurement time point (PRE, POST, POST 24 h, POST 48 h, POST 72 h), and interaction effects concerning the test units CMJ, CK, DOMS, and SRSS.
| Dependent Variable | Effect | F (dfs) | p | ηp2 |
|---|
| CMJ | Group | 9.61 (1, 22) | 0.005 | 0.304 |
| | Time point | 5.90 (2.85, 62.62) | 0.002 | 0.211 |
| | Group × Time point | 2.41 (4, 88) | 0.055 | 0.099 |
| CK | Group | 1.22 (1, 20) | 0.282 | 0.058 |
| | Time point | 8.37 (1.60, 31.89) | 0.002 | 0.295 |
| | Group × Time point | 5.73 (4, 80) | <0.001 | 0.223 |
| DOMS | Group | 0.34 (1, 20) | 0.569 | 0.016 |
| | Time point | 9.15 (2.74, 54.81) | <0.001 | 0.314 |
| | Group × Time point | 1.63 (4, 80) | 0.176 | 0.075 |
| SRSS | Group | 0.01 (1, 21) | 0.946 | <0.001 |
| | Time point | 24.44 (2.63, 55.23) | <0.001 | 0.538 |
| | Group × Time point | 0.04 (1, 21) | 0.854 | 0.002 |
Table 3.
Mean RMSSD values (and standard deviations) in the supine and in the standing position [in ms] as a function of age (U20 and senior handball players) for the five different measurement time points (PRE, POST, POST 24 h, POST 48 h, POST 72 h). Statistical values (p-values and Cohen’s d) are indicated for group differences between U20 and senior handball players.
| | Measurement Time Point |
|---|
| | PRE | POST | POST 24 h | POST 48 h | POST 72 h |
|---|
| Supine rMSSD | | | | | |
| U20s | 61 (±25) | 9 (±5) | 103 (±19) | 50 (±21) | 48 (±12) |
| Seniors | 68 (±40) | 7 (±2) | 65 (±14) | 53 (±16) | 54 (±12) |
| Group comparison | p = 0.79, d = −0.12 | p = 0.33, d = 0.47 | p= 0.01, d = 1.25 | p = 0.85, d = 0.09 | p = 0.54, d = −0.31 |
| Standing rMSSD | | | | | |
| U20s | 30 (±7) | 7 (±2) | 47 (±12) | 39 (±10) | 29 (±3) |
| Seniors | 26 (±10) | 6 (±3) | 34 (±7) | 42 (±18) | 28 (±6) |
| Group comparison | p = 0.53, d = 0.28 | p = 0.68, d = 0.20 | p= 0.08, d = 0.93 | p = 0.83, d = −0.11 | p = 0.69, d = 0.20 |
| Publisher’s Note: MDPI stays neutral with regard to jurisdictional claims in published maps and institutional affiliations. |
© 2021 by the authors. Licensee MDPI, Basel, Switzerland. This article is an open access article distributed under the terms and conditions of the Creative Commons Attribution (CC BY) license (https://creativecommons.org/licenses/by/4.0/).


 ,
, 


