2. Methodology
The proof-of-concept stages described herein include multiple components that rely on air sampling and pathogen capture, a pathogen dataset, and a decision tree designed to assist in rapid identification and characterization of airborne pathogens. The pathogen dataset (described below) includes only airborne bacterial pathogen identifying features that are compatible with microscopy. Bacteria were chosen because of their large size, easily identifiable characteristics, and slower mutation rates. They also have the largest number of pathogenic species for humans.
Electrospray Air Sampling: Traditional air filtration technology requires significant fan power. In addition, these systems require manual servicing that involves filter cleaning and exchange. Alternative filtration systems based on impaction require even greater fan power to accelerate the gas flow to speeds necessary for inertial deposition on a collecting surface. For nearly 100 years, “electrostatic precipitation” (EP) has been used in the industry to remove large quantities of smoke, mist, and dust from exhaust streams. EP’s characteristics consist of a few moving parts and very low-pressure drops; hence they require very modest levels of power consumption while still exhibiting high single-pass particle removal efficiencies of 99% [
2]. Electrostatic precipitators typically work in two steps: applying either a positive or negative charge to the particles via an electrostatic discharge and deposition of the charged particles on collecting electrodes biased with a high voltage of opposite polarity. Although the voltages are large, the currents are small, resulting in 50–500 watt of power consumption to clean 1000 CFM (Cubic Feet per Minute) of air while filter or impaction based techniques can require thousands of watts to process the same amount of air [
3]. Among the primary drawbacks of traditional EP is the possibility of toxic ozone production by corona discharge. An additional limitation is associated with the build-up of particle deposits with high electrical resistivity that can impede performance due to space charge effects.
Electrospray particle capture technology is a superior variant of electrostatic precipitation that eliminates the current drawbacks of conventional EP. This technology replaces a corona discharge with a mist of highly charged micro-droplets generated by electrospray ionization as the mechanism by which incoming particles are charged. In electrospray a very low flowrate (1 microliter/minute) of liquid, typically ordinary tap water, made conductive with trace amounts of dissolved salts such as NaCl, is fed from the tip of a needle held at several kilovolts (1–2 kV) relative to a counter electrode. At sufficient field strength, a sharp liquid meniscus forms, emitting millions of highly charged droplets that drift through the surrounding gas and are collected on the counter electrode. Particles in the gas have a high probability of interaction with the droplets, either adhering to them or otherwise acquiring a high level of charge. This causes droplets to be captured on the collecting electrode. The spray acts as a filtration material that is continuously introduced and removed from the gas flow. The primary advantage of using electrospray particle capture for droplet charging over EP is that ozone is not generated. Additional benefits include the reduction of space charge on the collected deposit, which is maintained in a conductive and cohesive state by the spray. In addition, there is zero pressure drop in the filtration process, which in of itself consumes only milliwatts of power [
4]. Importantly, biological species, such as bacteria and viruses, can be captured and nondestructively charged for manipulation using electrostatic fields. The manipulation capability of charged aerosol biologicals is crucial to potential airborne pathogen identification and monitoring.
Electrospray Pathogen Capture: Fundamental processes involved in electrospray ionization were predicted by Lord Rayleigh in 1883 and further characterized by other researchers, [
5,
6,
7], that culminated in definitive work by John Fenn [
8] that yielded a coherent description of the end-to-end process that has served as the foundation for further application studies including those described herein. While the aforementioned research is the foundation of electrospray as applied to mass spectrometry, where an unknown analyte is introduced in the needle solvent for electrospray conversion to individual intact ions with multiple charges, the present use for electrospray stems from an accidental discovery in John Fenn’s lab at Yale [
9] where desorbing electrospray droplets were discovered to also capture ambient polar or polarizable chemical species, as well as bacteria, viruses, and aqueous-based droplets containing bacteria and viruses. The basic mechanism of electrospray captures of polar or polarizable trace species from air, including pathogens, is depicted in
Figure 2.
The electrostatic field created as a result of the applied voltage to a conductive fluid exerts a force on the surface of the fluid, which when increased, a threshold is reached where the force due to the field equals the cohesive properties of the fluid, known as the “Rayleigh Limit” [
10]. A subsequent increase in the field then yields a rapid transition to form a “Taylor Cone” coupled with a subsequent emission of a “jet” of fluid. This jet ultimately breaks up into a plurality of droplets, which undergo fission due to the increase in droplet surface charge density [
11]. Ambient particles such as polar or polarizable molecules and pathogens are attracted to, and captured by, these desorbing droplets with high efficiency using only milliwatts of power and microliters of solvent, which can be water or an organic solvent.
Electrospray Concentration and Collection Capability: [
8] stated that sensors should not be referred to as detectors, but “identifiers”, and that a “detector” is really composed of a collection device and an identifier. If more analyte is collected from the surrounding air-diluent, a less sensitive identifier is needed and vice-versa. It is therefore ideal if the collection device captures and concentrates only the class of materials of interest while ignoring the background. This is incredibly beneficial as it offers a mechanism that has small size, low power consumption, reliability, ease of use, and low cost.
It is appropriate to note here the reasons for transforming neutral molecules into ions before attempting characterization. These include the ability to control the trajectories and destinations of charged species by appropriate combinations of electric and magnetic fields. Additionally, detectability is generally much greater for ions than for neutral molecules because each ion gives rise to at least one electron in a primary signal current that can be greatly amplified by well-established techniques such as using an electron multiplier. Multipliers can produce millions of electrons in signal current for each incident ion, coupled to a picoammeter. While it is true that some optical techniques, e.g., laser induced fluorescence, can sometimes provide larger signal/molecule ratios than can ion-multiplication techniques, the conditions required for such sensitivity are often more difficult to achieve, they vary much more from species to species, and require more expensive gear than is generally the case with ions. It is not by accident that in many laser-based detection techniques, the laser photons are used to transform target molecules into ions. This is due to the fact that detection methods for ions are often more sensitive and general than those for photons or electronically excited molecules. By transforming airborne pathogens into charged species, we can similarly achieve many of the advantages electrospray affords with analysis of molecules, that is, high charge to mass ratio, and ability to move microbes based on external fields for examination.
It is also appropriate to comment on how sensitivity is best-expressed, i.e., in what units? In chromatography, perhaps the most widely used of all analytical techniques, a specific quantity of analyte is injected into a flow of mobile phase species entering a separation column. Sensitivity is thus defined in terms of the smallest amount of injected analyte, e.g., in pico-grams or pico-moles that will give rise to a distinguishable peak in the effluent. Sensitivity defined in this manner is not very meaningful in applications where determination of concentration of a species in a gas or liquid of interest is needed or whether a particular species is present in that gas or liquid when the available quantity of that gas or liquid may be large relative to the quantity required for the analytical procedure. In such cases the appropriate measure of sensitivity is the lowest concentration of analyte in a sample liquid or gas at which detection and identification can be achieved. This minimum detectable concentration is therefore a relevant measure of sensitivity in a search for toxic chemical species by analyzing a stream of air from a region where they might be concealed.
At Yale, we observed years ago that electrospray ionization, now traditionally used for mass spectrometry, has the ability to capture polar or polarizable trace species from the air [
12] at levels as low as parts-per-billion without a pre-concentrator. Since the COVID-19 pandemic, there has been a flurry of development of many new methods and devices to identify potentially infectious disease transmitted by air. A key challenge in this scenario is the capture of sufficient concentrations of the target species for detection. As such, collection of more analyte from surrounding air will require a less sensitive identifier and the reverse is true. An ideal scenario is achieved if the collection device specifically captures and concentrates only the class of biomaterials of interest while ignoring the background. Indeed,
Figure 3 illustrates Penicillium Spores collected from ambient air on a culture plate using electrospray and visualized using an Amscope T390B optical microscope (×1000). Notably, greater than four times as many spores were collected using an electrospray source (ES) than from an open culture plate in 4 h without ES.
The use of electrospray can be better appreciated if a known concentration of particles in an enclosed space is subjected to a charged droplet electric field. This concept is illustrated in
Figure 4 where a glove box chamber is filled with 3.0-micron polystyrene microspheres to simulate bacterial human respiratory droplets and aerosolized using a collison nebulizer. The background aerosol concentration was then measured using a Met One laser particle counter in two modes, one mode where the electrospray source is turned on and the other mode where the electrospray source is turned off to illustrate electrospray collection efficiency between both modes.
Figure 4, [
13] clearly shows the dramatic overall background aerosol concentration drop during each cycle of electrospray operation. This is important because desorbing electrospray droplets are capable of pulling out polar or polarizable trace species out of the air, of which pathogens are, while ignoring the background air. The ability of electrospray to “getter” or collect pathogens affords a means to concentrate otherwise dilute targets in the ambient environment. Identification of pathogens such as viruses can then be accomplished based on charge-to-mass ratio using a charge detector flight tube [
14].
Droplets vs. Discrete Viral or Bacterial Species:
Separating viral or viral-like particles or bacteria or bacterial-like particles from an electrospray captured and charged droplet is a challenge to be addressed. As discussed earlier, electrospray produces charged droplets, that attract polar species, and can interact kinetically with ambient particles. Respiratory droplets have “diameters that cover a large size range from approximately 0.6 to more than 1000 µm” [
15]. The new-formed droplet will now carry the charges from the original electrospray droplet. In traditional electrospray mass spectrometry, the solvent species in the droplet evaporates while the droplet is in flight. This is assisted by the counter-current dry nitrogen flow between the electrospray source and the inlet capillary of the MS. The desolvation process or “Coulomb Explosion” continues until all solvent is removed by transitioning to the vapor phase, leaving a single intact ion. Similarly, in the proposed embodiment, a suitable solvent for the glycoproteins, proteoglycans, lipids, and other proteins contained in respiratory ejecta, can serve the same purpose in creating discrete charged species as in ESI-MS used to study organic macromolecules. One such potential solvent would be a 50:50 water-hexane mixture. Solid-liquid separation of porcine gastric mucins was successfully demonstrated to extract proteins [
16]. However, the use of polar and non-polar substances together requires another trick discussed later, known as coaxial electrospray.
Characterization and of Pathogens—Building a Database of Human Pathogen Features: Bacterial identification currently relies on biochemical processing, techniques that are labor intensive, require special skills, and are not real-time [
17]. Optical processing of bacteria would allow for much quicker identification and a concomitant rapid response by health care professionals when dealing with an outbreak, curtailing possible exponential spread, and shortages of essential personal protective equipment.
Bacterial pathogen features and characteristics were collected and a database with structural and visually identifiable patterns that have an affinity for binding oligonucleotide aptamers and enhancing visualization (described below) are listed in
Table 1. Bacteria come in a plethora of different shapes and sizes. It is this variability in phenotypic structure that allows researchers to differentiate between the approximately 10,000 known bacteria. For the proof of concept described herein, the dataset is focused on visually identifiable characteristics that include the gram stain, absence or presence of capsule, shape and arrangement of bacteria, presence of flagella or pili, and the type of flagella or pili present. The intent here would be o apply artifical intelligence (AI) with image analysis for microbe characterization and possible identification.
A Gram stain is used to separate between the two types of bacteria, Gram-positive and Gram-negative. The Gram-positive bacteria have a monoderm surrounded by a thick peptidoglycan layer (20–80 nm thick), and the Gram-negative bacteria have a thin peptidoglycan layer (5–10 nm thick) between diderms. Both bacteria types can form a capsule, which contributes to the overall thickness of bacteria. Capsules can be up to 10 µm thick and are composed of high molecular-weight viscous polysaccharides forming a thick gel outside the cell wall [
18].
Bacteria come in distinctive shapes, including coccus, bacillus, coccobacillus, spiral, and filamentous. For airborne bacteria, the most common forms encountered are cocci, bacilli, and coccobacilli. Bacteria also come in a multitude of arrangements, including mono-, diplo-, tetrad-, strepto-, staphlo-, and pleomorphic (multiple arrangements) forms [
19].
Surface appendages used in motility such as flagella and pili are also identifying features in bacteria. Flagella are filamentous surface appendages that are 3 to 12 µm in length and 12 to 30 nm in diameter while pili are thin hair-like appendages that are variable in length and are 6–7 nm in diameter. [
18]. Flagella can be monotrichious (one flagellum), lophotrichious (multiple flagella) at one pole, amphitrichious (a single flagellum at either pole) or peritrichious (multiple flagella around the entire bacteria) [
20]. Pili, on the other hand, fall into two categories, sex pili, which usually consist of 1–6 long fimbriae, and Type IV pili, which can consist of hundreds of short fimbriae distributed over the entire bacteria surface.
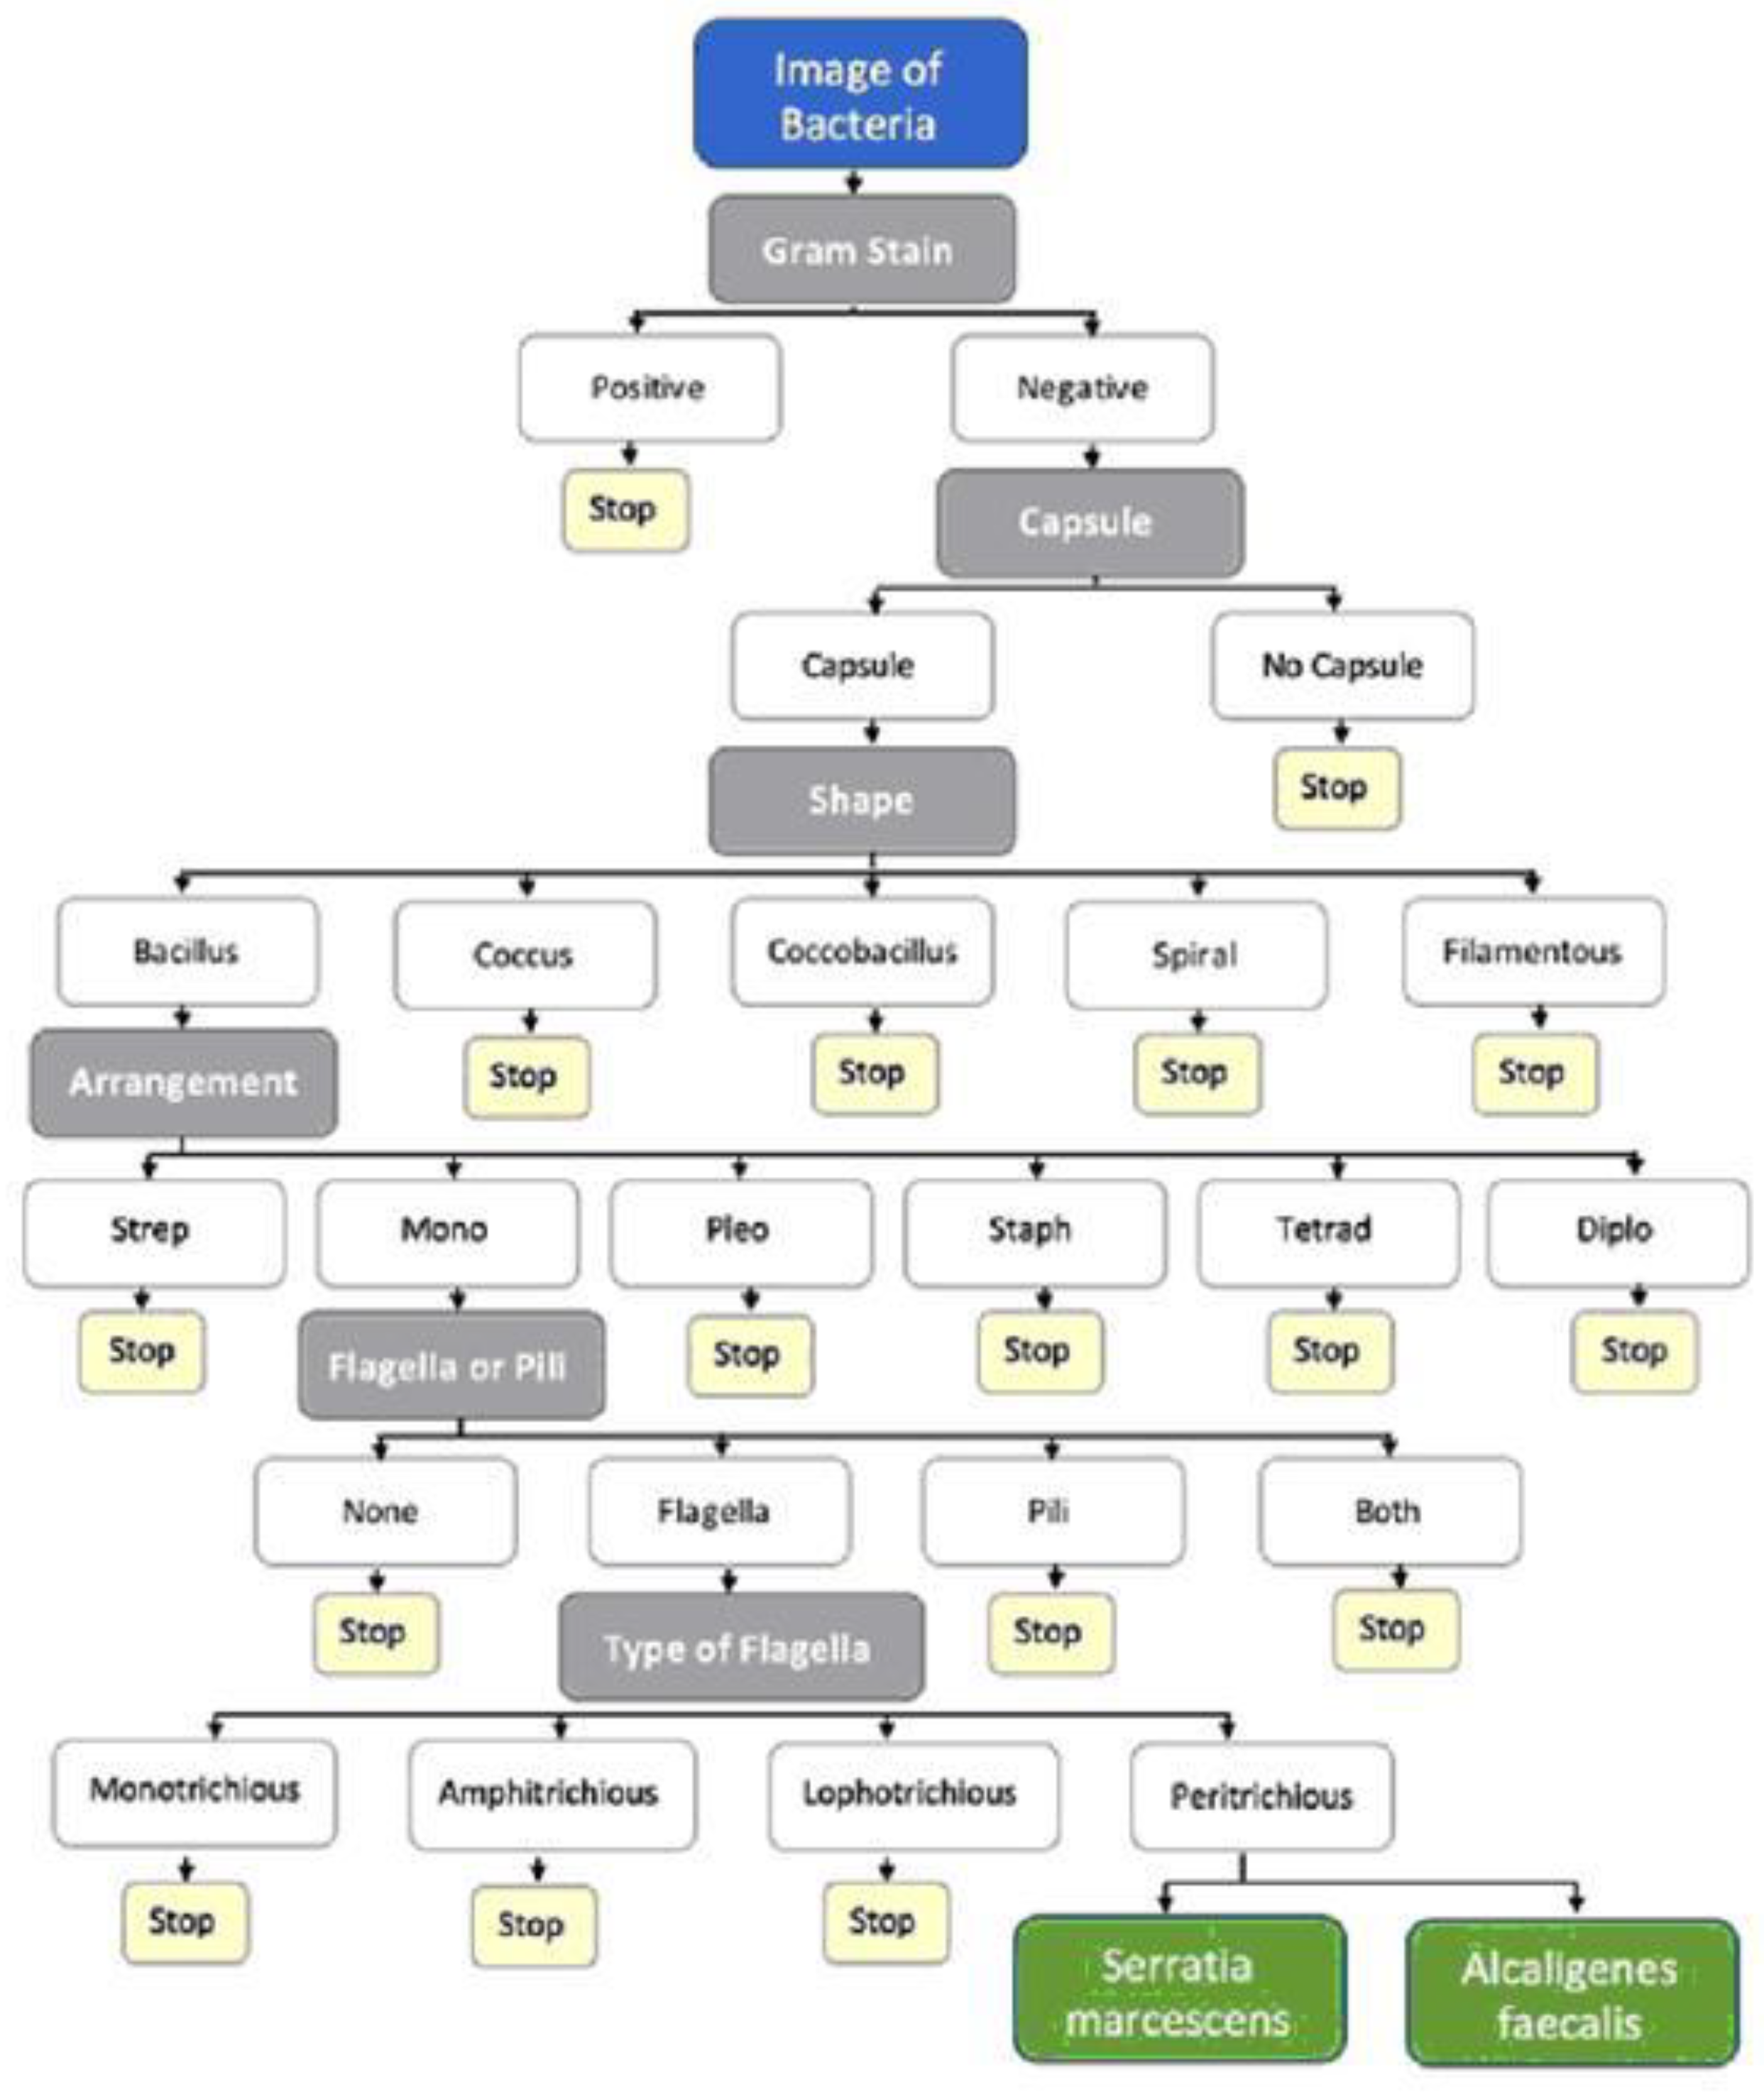
Decision Tree Analysis for Morphological Identification of an Unknown Bacteria: To classify and analyze morphological data collected on airborne bacterial pathogens, an excel-based decision matrix was designed and developed as a decision tree. The components to produce this decision tree consist of “IF Statements”, drop-down menus, airborne bacteria, and phenotypic characteristics. There are seven observable characteristics (
Table 1) that contain two to six identifiers in each of their drop-down menus. The drop-down menus are essential to input characteristics after identifying and analyzing an ambient air sample. The “IF Statement” function is used to produce one value when the provided statement is true and another value when the provided statement is false. With these functions, the output is very specific in listing the scientific name(s), i.e., and the identity of the pathogen that has been collected. Once the phenotypic (observable) characteristics such as gram stain, absence or presence of capsule, shape and arrangement of bacteria, presence of flagella or pili, and the type of flagella or pili are examined, then they can be further analyzed to determine their type.
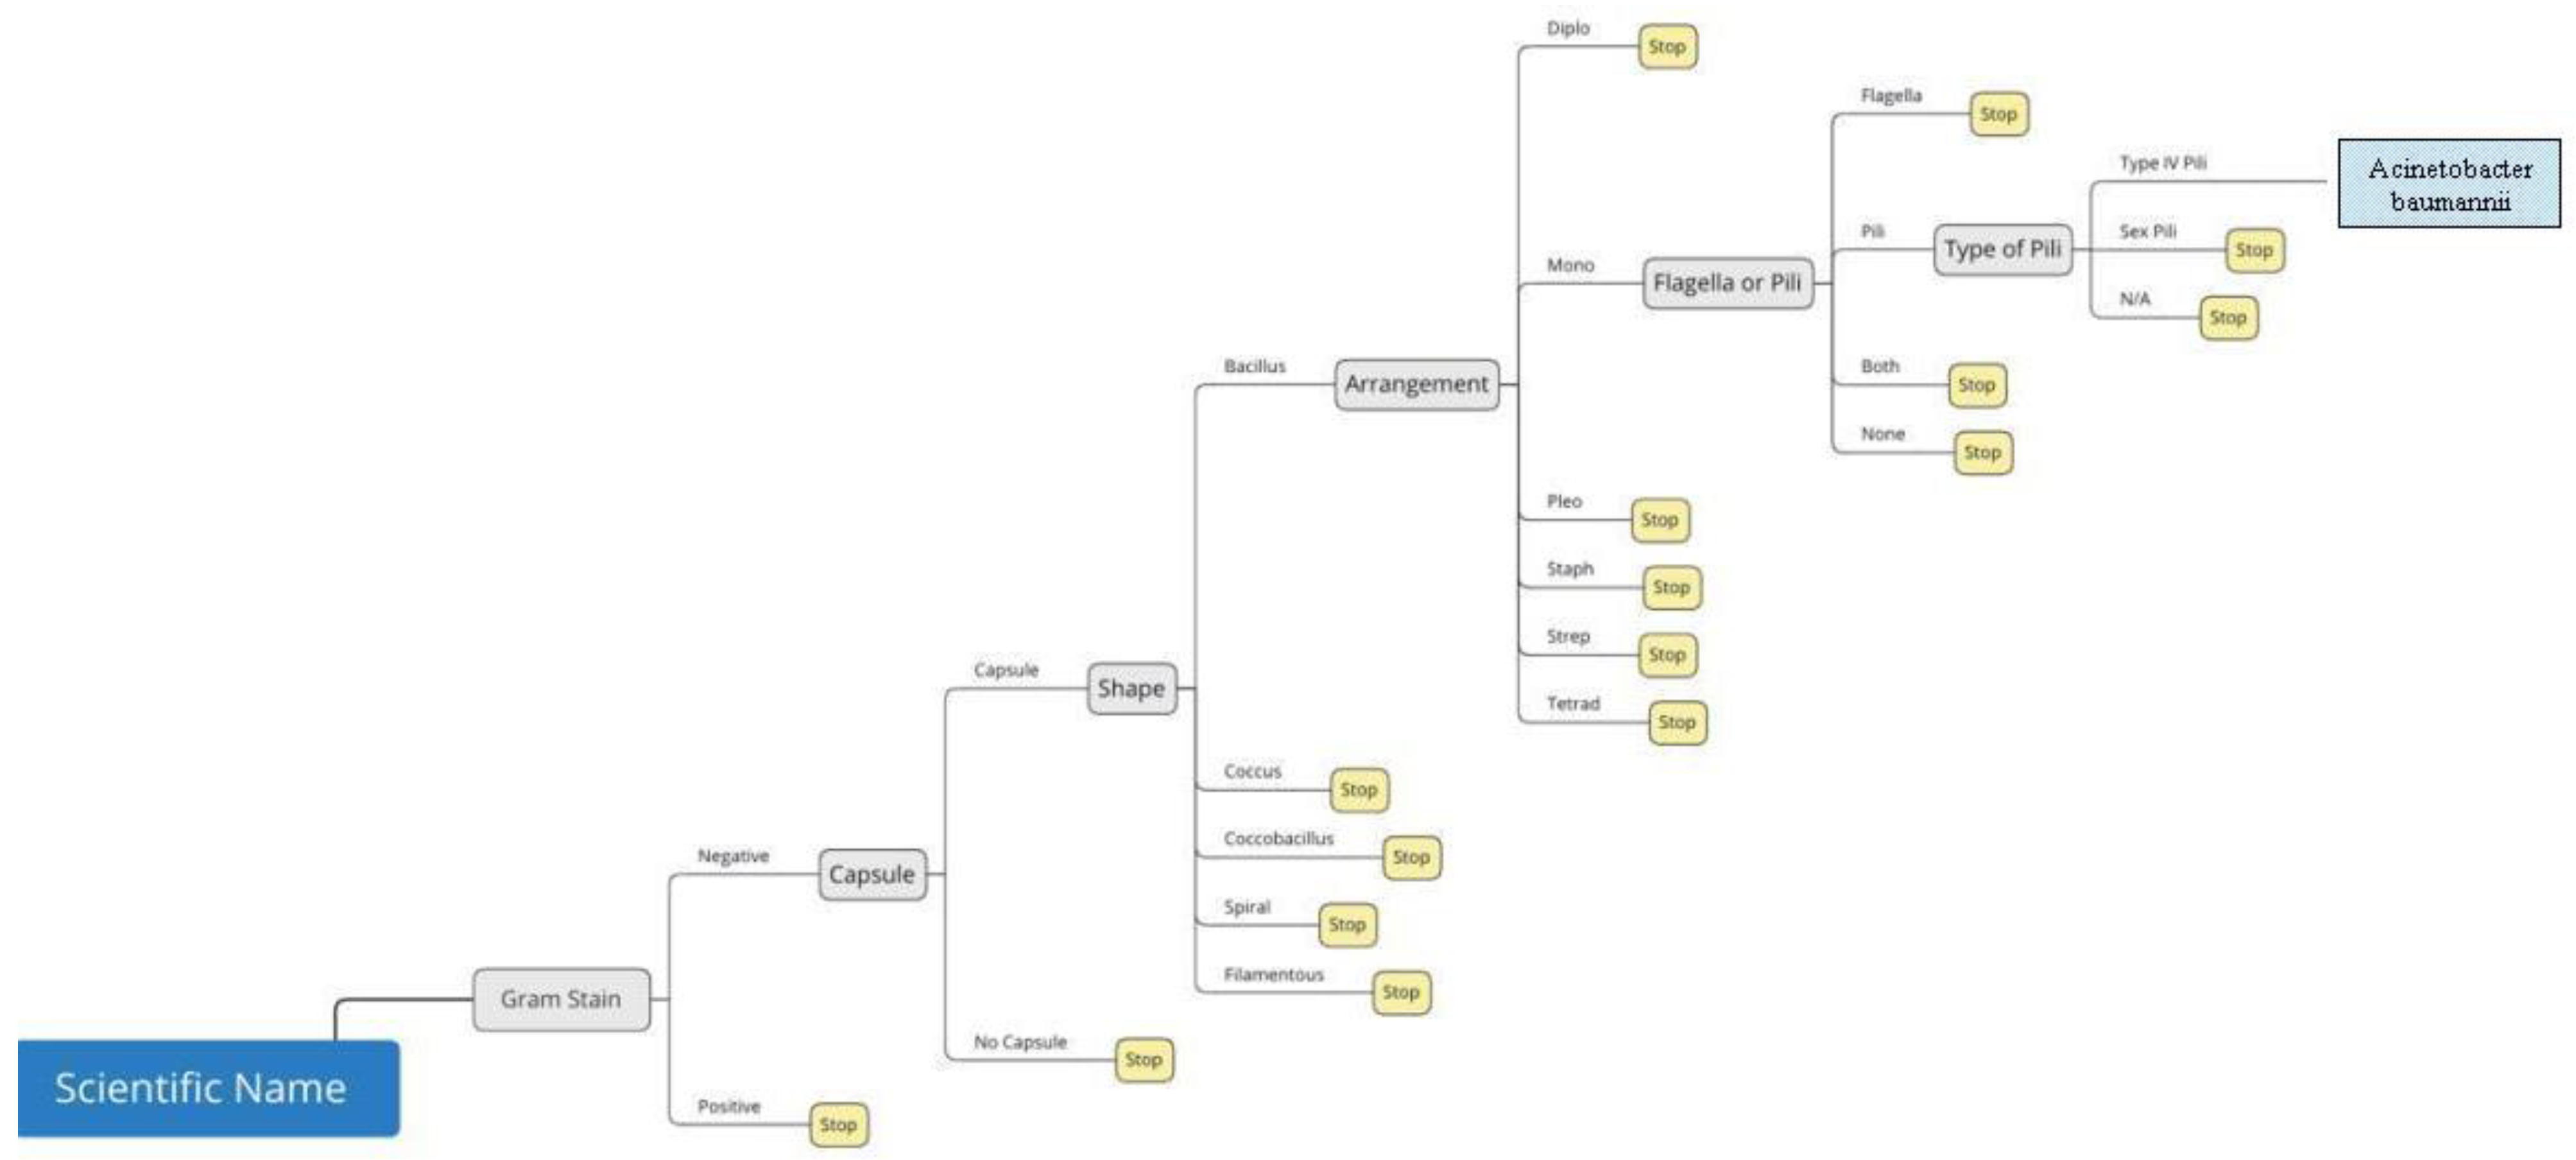
Four attributes should be understood to successfully interpret a decision tree. These attributes are a decision tree’s root node, internal nodes, leaf nodes, and branches.
Figure 5 is a visual representation of the decision tree for
Acinetobacter baumannii.The root node is the leftmost node (blue box) in the tree; it is what everything stems from and indicates the scientific name. Following this, the internal nodes are the phenotypic characteristics (light grey boxes) including gram stain, absence or presence of capsule, shape and arrangement of bacteria, presence of flagella or pili, and the type of flagella or pili present. Each of the yellow boxes are considered leaf nodes that are terminated based on the prior selection from the internal node. This is the reason why there are yellow boxes identified as “stop”. The green box is the results box and can be considered a leaf node as well. Branches are what connect all of the nodes and in this proof-of-concept and indicate the drop-down menu options. Another example is shown in
Figure 6 where five different branches stemming from the internal shape node represent five shape options in the shape drop-down menu.
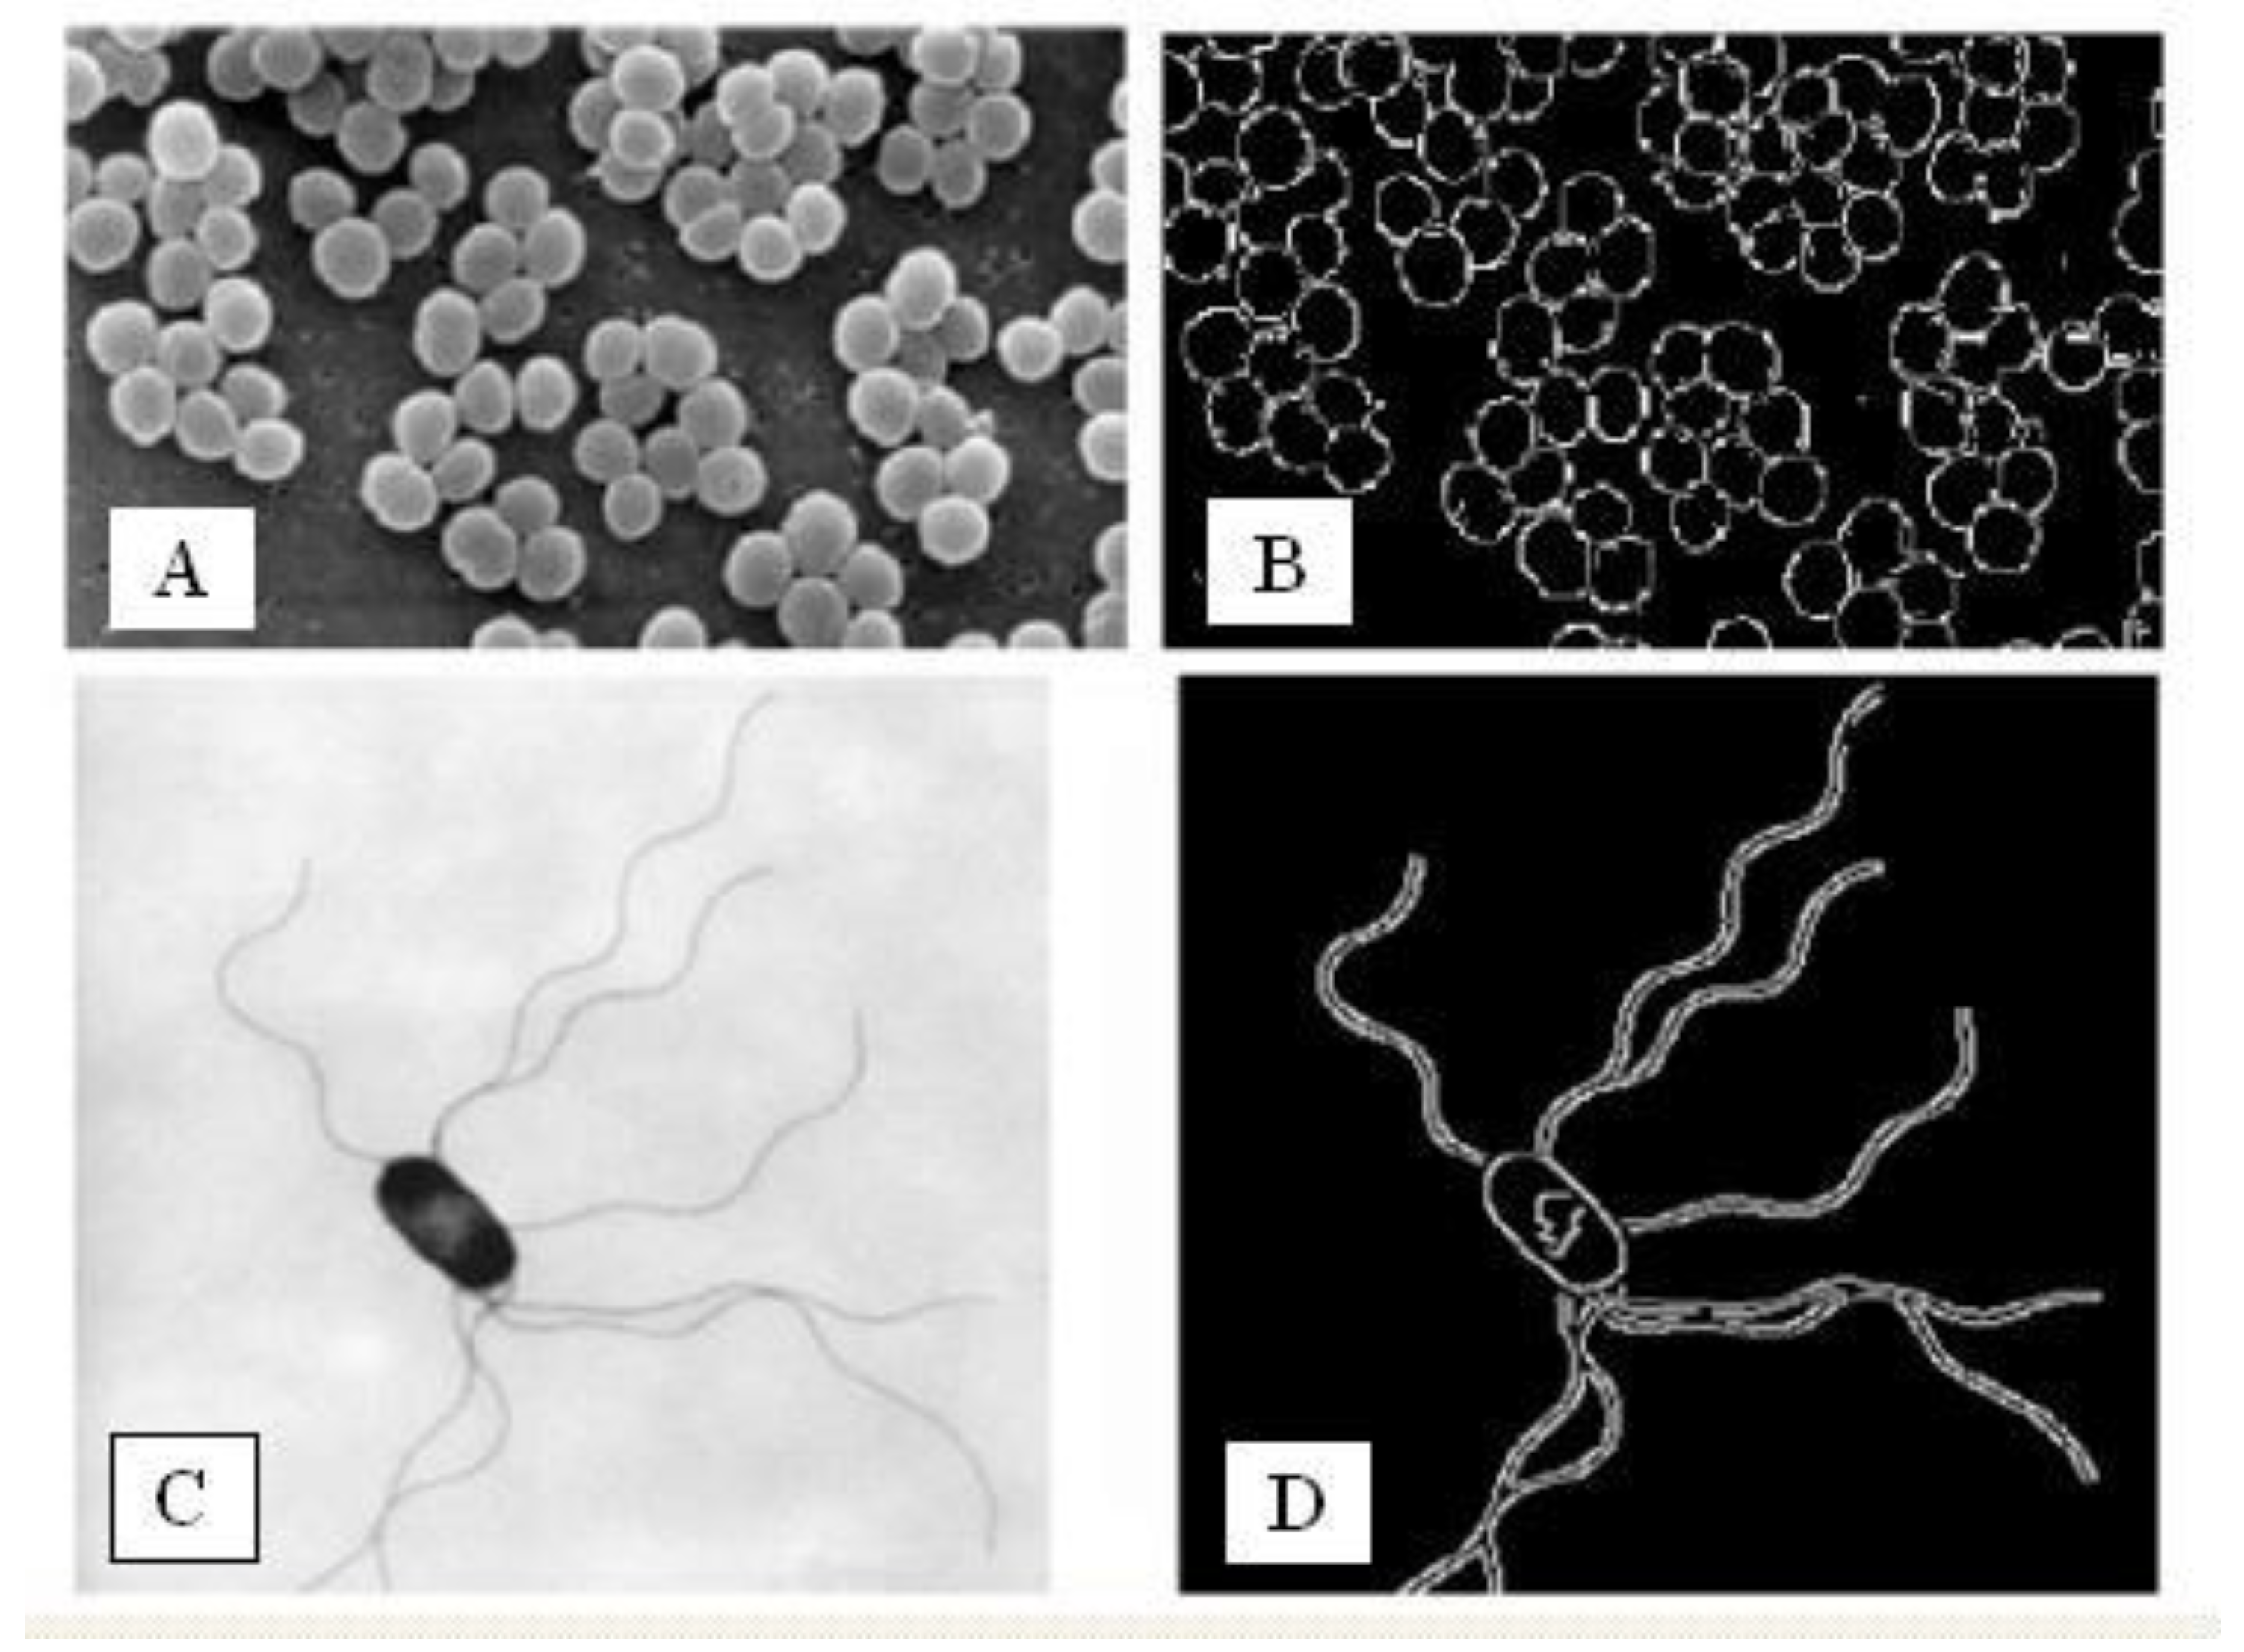
Pathogen Shape Detection Enhancement using Edge Detection: Captured aerosol pathogens often do not appear sharp and clear by optical microscopy owing to movement within the imaging media. One method of improving the outcomes of automated morphological detection of unknown pathogens using a decision matrix is employing edge detection.
Figure 7 shows representations of bacterial images that were processed with a Sobel convolution edge detection algorithm, MathCad, that detects edges by convolving various kernels over the matrix [
21]. These kernels provide uniform edge detection with increased weight to the orthogonal pixels over the diagonal pixels. Without suitable edge enhancement, artifacts due to debris in the fluid around the target pathogen, lack of image contrast, and out of focus elements can all lead to a false boundary of the pathogen target, thus impairing the probability of identification of the target when referenced to library examples. “Edge detection is an image processing technique for finding the boundaries of objects within images. It works by detecting discontinuities in brightness. Common edge detection algorithms include Sobel, Canny, Prewitt, Roberts, and fuzzy logic methods” [
22].
Sorting Virus, Bacterial, Debris: The reader will no doubt ask that in an aerosol sampling system, the electrospray source will tend to charge both potential pathogens as well as non-organic particulate matter. How do we parse out the debris from bacteria and/or viruses? The answer may be found by using Charge Detection Mass Spectrometry or CDMS. Conventional mass spectrometry is less effective at the mass ranges one would see when looking at viruses or bacteria. “As the analyte mass approaches the mega Dalton regime, the m/z spectrum is often comprised of a broad distribution of unresolved charge states. In such cases, mass determination is precluded. Charge Detection Mass Spectrometry (CDMS) is an emerging MS technique for determining the masses of heterogeneous, macromolecular complexes. In CDMS, the m/z and z of single ions are measured concurrently so that mass is easily calculated. With this approach, deconvolution of a m/z spectrum is unnecessary” [
21]. It is recognized that there is a potential for a non-microbe particulate to be identified as having the same mass as a virus or bacteria. For this reason, those species that are selected by CDMS will be described as “virus-like” and “bacterial-like”. However, the likelihood of debris to have the same mass as target pathogen stored in a lookup table, is expected to be low. Recent innovations have revealed that CDMS can resolve the difference between a filled and unfilled capsid of a virus. [
24]. The possible presence of a small amount of non-microbe material is not expected to affect morphological identification or chemical identification of a pathogen.
Virus-like species and bacterial-like species, once identified based on mass and charge state pass through a CDMS, may be now sorted using electrostatic deflection, and collected onto a suitable “witness plate” for further interrogation. Such interrogation may consist of SEM, or optical microscopy if of a sufficient size for morphologically defining features through the use of AI assisted image software. Genomic analysis may be achieved using a nanopore nucleotide sequencer, where an ionic liquid is employed as a potential low-pressure electrolyte.
Aptamer Identification of Pathogens: One approach that can make airborne pathogen identification easier for improved edge detection and by extension, improved artificial intelligence to identify, is to tailor specialized short segments of DNA or RNA known as aptamers to preferentially bind to the target pathogen of interest, fluorescing upon binding or using gold nanoparticle tags to enhance the outline of the target species as shown in
Figure 8. This process is similar to what is commonly used in lateral flow immunoassays, where gold nanoparticles aggregate over a target, resulting in a contrast change on the flow strip visible under ambient light by the user. Pregnancy test strips are an example of a gold aggregation lateral flow test. [
25].
Gold nanoparticles continue to cover the target pathogen, resulting in improved contrast ratio for optical identification of a specific pathogen for the Artificial Intelligence (AI) software.
Role of Aptamers in Pandemic Detection: There are several major challenges in any airborne pathogen detection system design. First of all, one needs to acquire enough target analyte, in this case human borne pathogens, in sufficient quantities to enable the identification process. Next, the target must be isolated from the background to effect morphological identification. Finally, a means must be implemented to positively categorize the target species. By using aptamers, we can accomplish a number of key objectives. While electrospray can help us parse out, sort, and concentrate airborne pathogens, aptamers can help us prepare the samples for identification. Aptamers can be created to bind only to a pathogen of interest. Aptamers, when combined with gold nanoparticles, help improve edge detection and thus increase the speed and accuracy of target identification based on morphological characteristics. Finally, aptamers can be designed with fluorophores that positively identify a target pathogen. [
26].


