Article

The Anatomy, Features and Sex Correlations (Dimorphism) of Tubero–Palato–Pterygoid Region among Adult Population—Single Center Study Based on 3D Printed Models

by
Stefan Ihde
1,*,
Łukasz Pałka
2,
Sławomir Jarząb
3,
Maciej Janeczek
4,
Karolina Goździewska-Harłajczuk
4,
Joanna Klećkowska-Nawrot
4,*,
Izabela Janus
5,
Maciej Dobrzyński
6 and
Aleksandra Karykowska
7
1
International Implant Foundation, Dental Implants Faculty, 116 Leopold Street, 80802 Munich, Germany
2
Reg-Med Dental Clinic, Rzeszowska 2, 68-200 Żary, Poland
3
Divison of Rehabilitation in the Movement Disorders, Department of Physiotherapy, Faculty of Health Sciences, Wroclaw Medical University, Grunwaldzka 2, 50-355 Wroclaw, Poland
4
Department of Biostructure and Animal Physiology, Wrocław University of Environmental and Life Sciences, Kozuchowska 1, 51-631 Wrocław, Poland
5
Department of Pathology, Division of Pathomorphology and Forensic Veterinary Medicine, Wrocław University of Environmental and Life Sciences, Norwida 31, 50-375 Wrocław, Poland
6
Department of Pediatric Dentistry and Preclinical Dentistry, Wroclaw Medical University, Krakowska 26, 50-425 Wroclaw, Poland
7
Department of Anthropology, Wroclaw University of Environmental and Life Sciences, Kozuchowska 5, 51-631 Wroclaw, Poland
*
Authors to whom correspondence should be addressed.
Submission received: 26 April 2021 / Revised: 3 June 2021 / Accepted: 9 June 2021 / Published: 11 June 2021
(This article belongs to the Special Issue Sports Science, Medicine and Rehabilitation)

Abstract

:
This study evaluates the differences in the dimension, symmetry, and anatomical characteristic of the tubero–palato–pterygoid region in adults using 3D printed models. The objective of this study was also estimation of how many tubero–pterygoid implants can be placed safely with enough distance between threads of implants. The investigation draws on 57 models of upper jaws, including the adjacent pterygoid process of the sphenoid bone from randomly selected cases. The consecutive measurements (lateral, medial, rostral, caudal, area, line-1 longitudinal, and line-2 transverse) on both sides of the body—right (R) and left (L)—were used for the purpose of this study. Among the group of 57 cases were 30 females (F) and 27 males (M). A strong correlation was identified between lateral and line-1 longitudinal across the sample group of both male and female cases (p ≤ 0.05; r ≥ 0.9). Moreover, a strong correlation was noted between medial and line-1 longitudinal in the whole group of cases and in the male group (p ≤ 0.05; r ≥ 0.9). Lateral and line-1 longitudinal demonstrated a weak positive relationship with the age of the female cases (p ≤ 0.05; 0.03 < r < 0.05). Medial and line-1 longitudinal showed a weak negative relationship with the age of the male cases (p ≤ 0.05; −0.05 < r < −0.03). The results of this study suggest that, in most cases, two such tubero–pterygoid implants may be placed, which is a good advantage for support of implant-based bridges.

1. Introduction

The tubero–palato–pterygoid region is formed through the junction of maxillary tuberosity, the pterygoid process of the sphenoid bone, and pyramidal process of the palatine bone. The upper limit of the junction creates the pterygomaxillary fissure (PMF). The PMF results from communication between the infratemporal fossa and the pterygopalatine fossa (PPF). The pterygoid fossa is formed by the divergence of the lateral pterygoid plate and the medial pterygoid plate of the pterygoid process. The contents of the pterygomaxillary fossa are divided into two distinct layers composed of nerves and vessels [1]. The pterygoid hamulus is the most prominent part of the medial pterygoid plate which is easily palpable in the oropharynx. The hamular notch is a groove between the maxillary tuberosity and the pterygoid hamulus, positioned at the posterior limit of the maxilla. The hamular notch is directed medially towards the pterygoid bony column between the medial and lateral pterygoid plates. The greater palatine foramen is located at the posterior-medial of the tuberosity which transmits the descending palatine vessels and greater palatine nerve. The pterygomaxillary suture is located at the inferior level to the pterygo-maxillary fissure and represents the contact zone between the maxillary tuberosity and the lateral plate of the pterygoid process of the sphenoid bone.
The pterygomaxillary region/area has been covered extensively in the literature on cadavers and dry skulls, particularly with regards to the use of radiographs, computed tomography exclusively, and with 3D reconstruction programs and printers [2,3,4].
Orthodontists are interested in the pterygomaxillary region’s postnatal development in children, as a result of its importance in facial growth and development. Craniofacial surgeons have also expressed interest because of the region’s critical role during orthoghnatic surgery, especially for LeFort I osteotomy procedure [2,3], whilst dental surgeons’ interest results from the region’s role in implant placement and anchorage, or anesthesia, in the treatment of trigeminal neuralgia [4]. In their study using CBCT scans, Icen et al., (2019) evaluated the PMF and the PPF shape and dimension, reporting an increase in the latter’s volume past the age of 40 [5]. In their radiological study, Puche-Torres et al. (2017) describe anatomical variations in the PMF, providing an evaluation that draws on age, gender, side, and width [6]. Similarly, Melsen et al.’s (1982) evaluative study of PMF’s sutural complexity suggests that remodeling processes in the area seem to reflect the bony pharynx and the maxillary complex’s different functional demands and, as a result, the palatine bone increases the extension of the contact surfaces with the adjacent bones, as a result of aging [7]. Kanazawa et al., (2013) report a negative correlation between the pterygoid junction’s thickness and the occurrence of the pterygoid plate fracture during surgical procedures [8]. Lee et al., (2001) focus on anatomical studies to precisely describe the palatine bone’s pyramidal process [9]. In their CBCT study, Icen et al. (2019) report a significant relationship between the morphology of the PMF and the position of the maxilla or mandible, noting differences in this area’s dimension and shape between each side [5]. Together with other studies, it can be concluded that this region’s anatomy, particularly the PMF, is related to age, gender, and the presence of dentition [5,10]. In this regard, this study’s aim was to use 3D printed models to evaluate the differences in dimension, symmetry, and anatomical characteristics of the tubero–palato–pterygoid region in the adult population. The objective of this study was also to determine if there is enough space in the fusion zone between pterygoid plate and distal maxilla to place a tubero–pterygoid screw implant, e.g., a corticobasal implant with basal thread diameter of 3.5 mm.

2. Materials and Methods

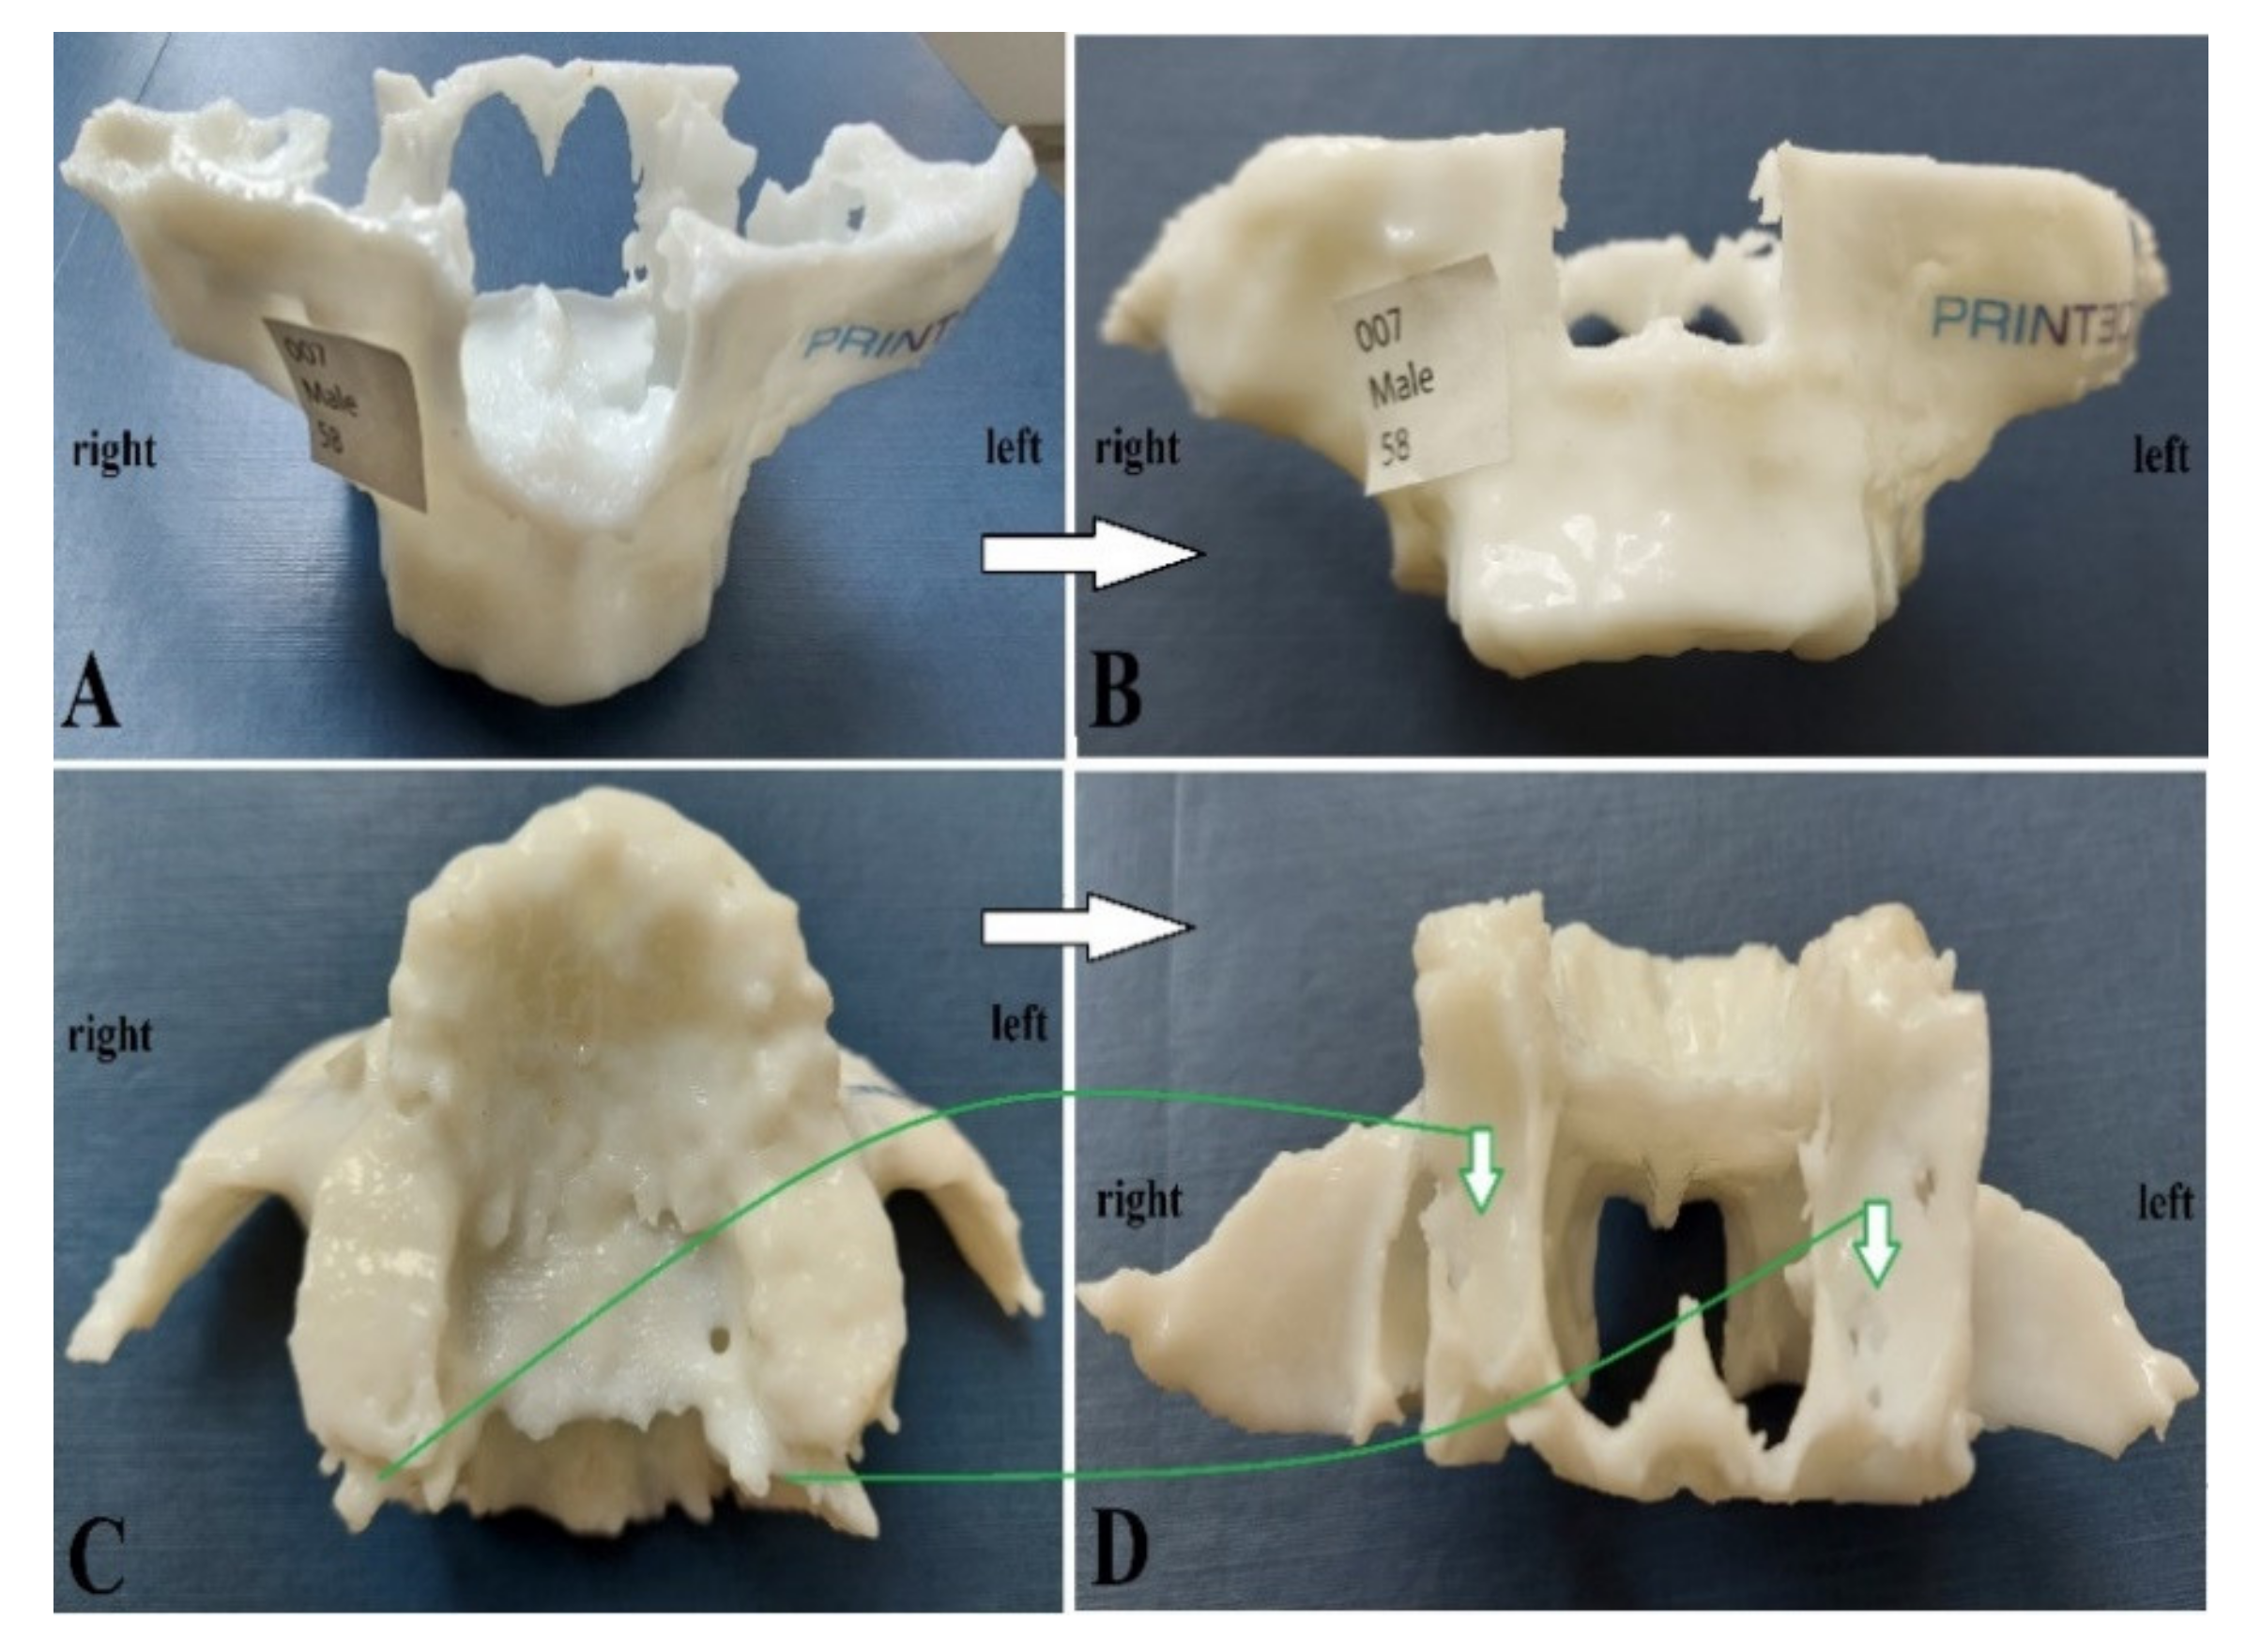
2.1. Study Group and Printed Models of Maxilla (CT)
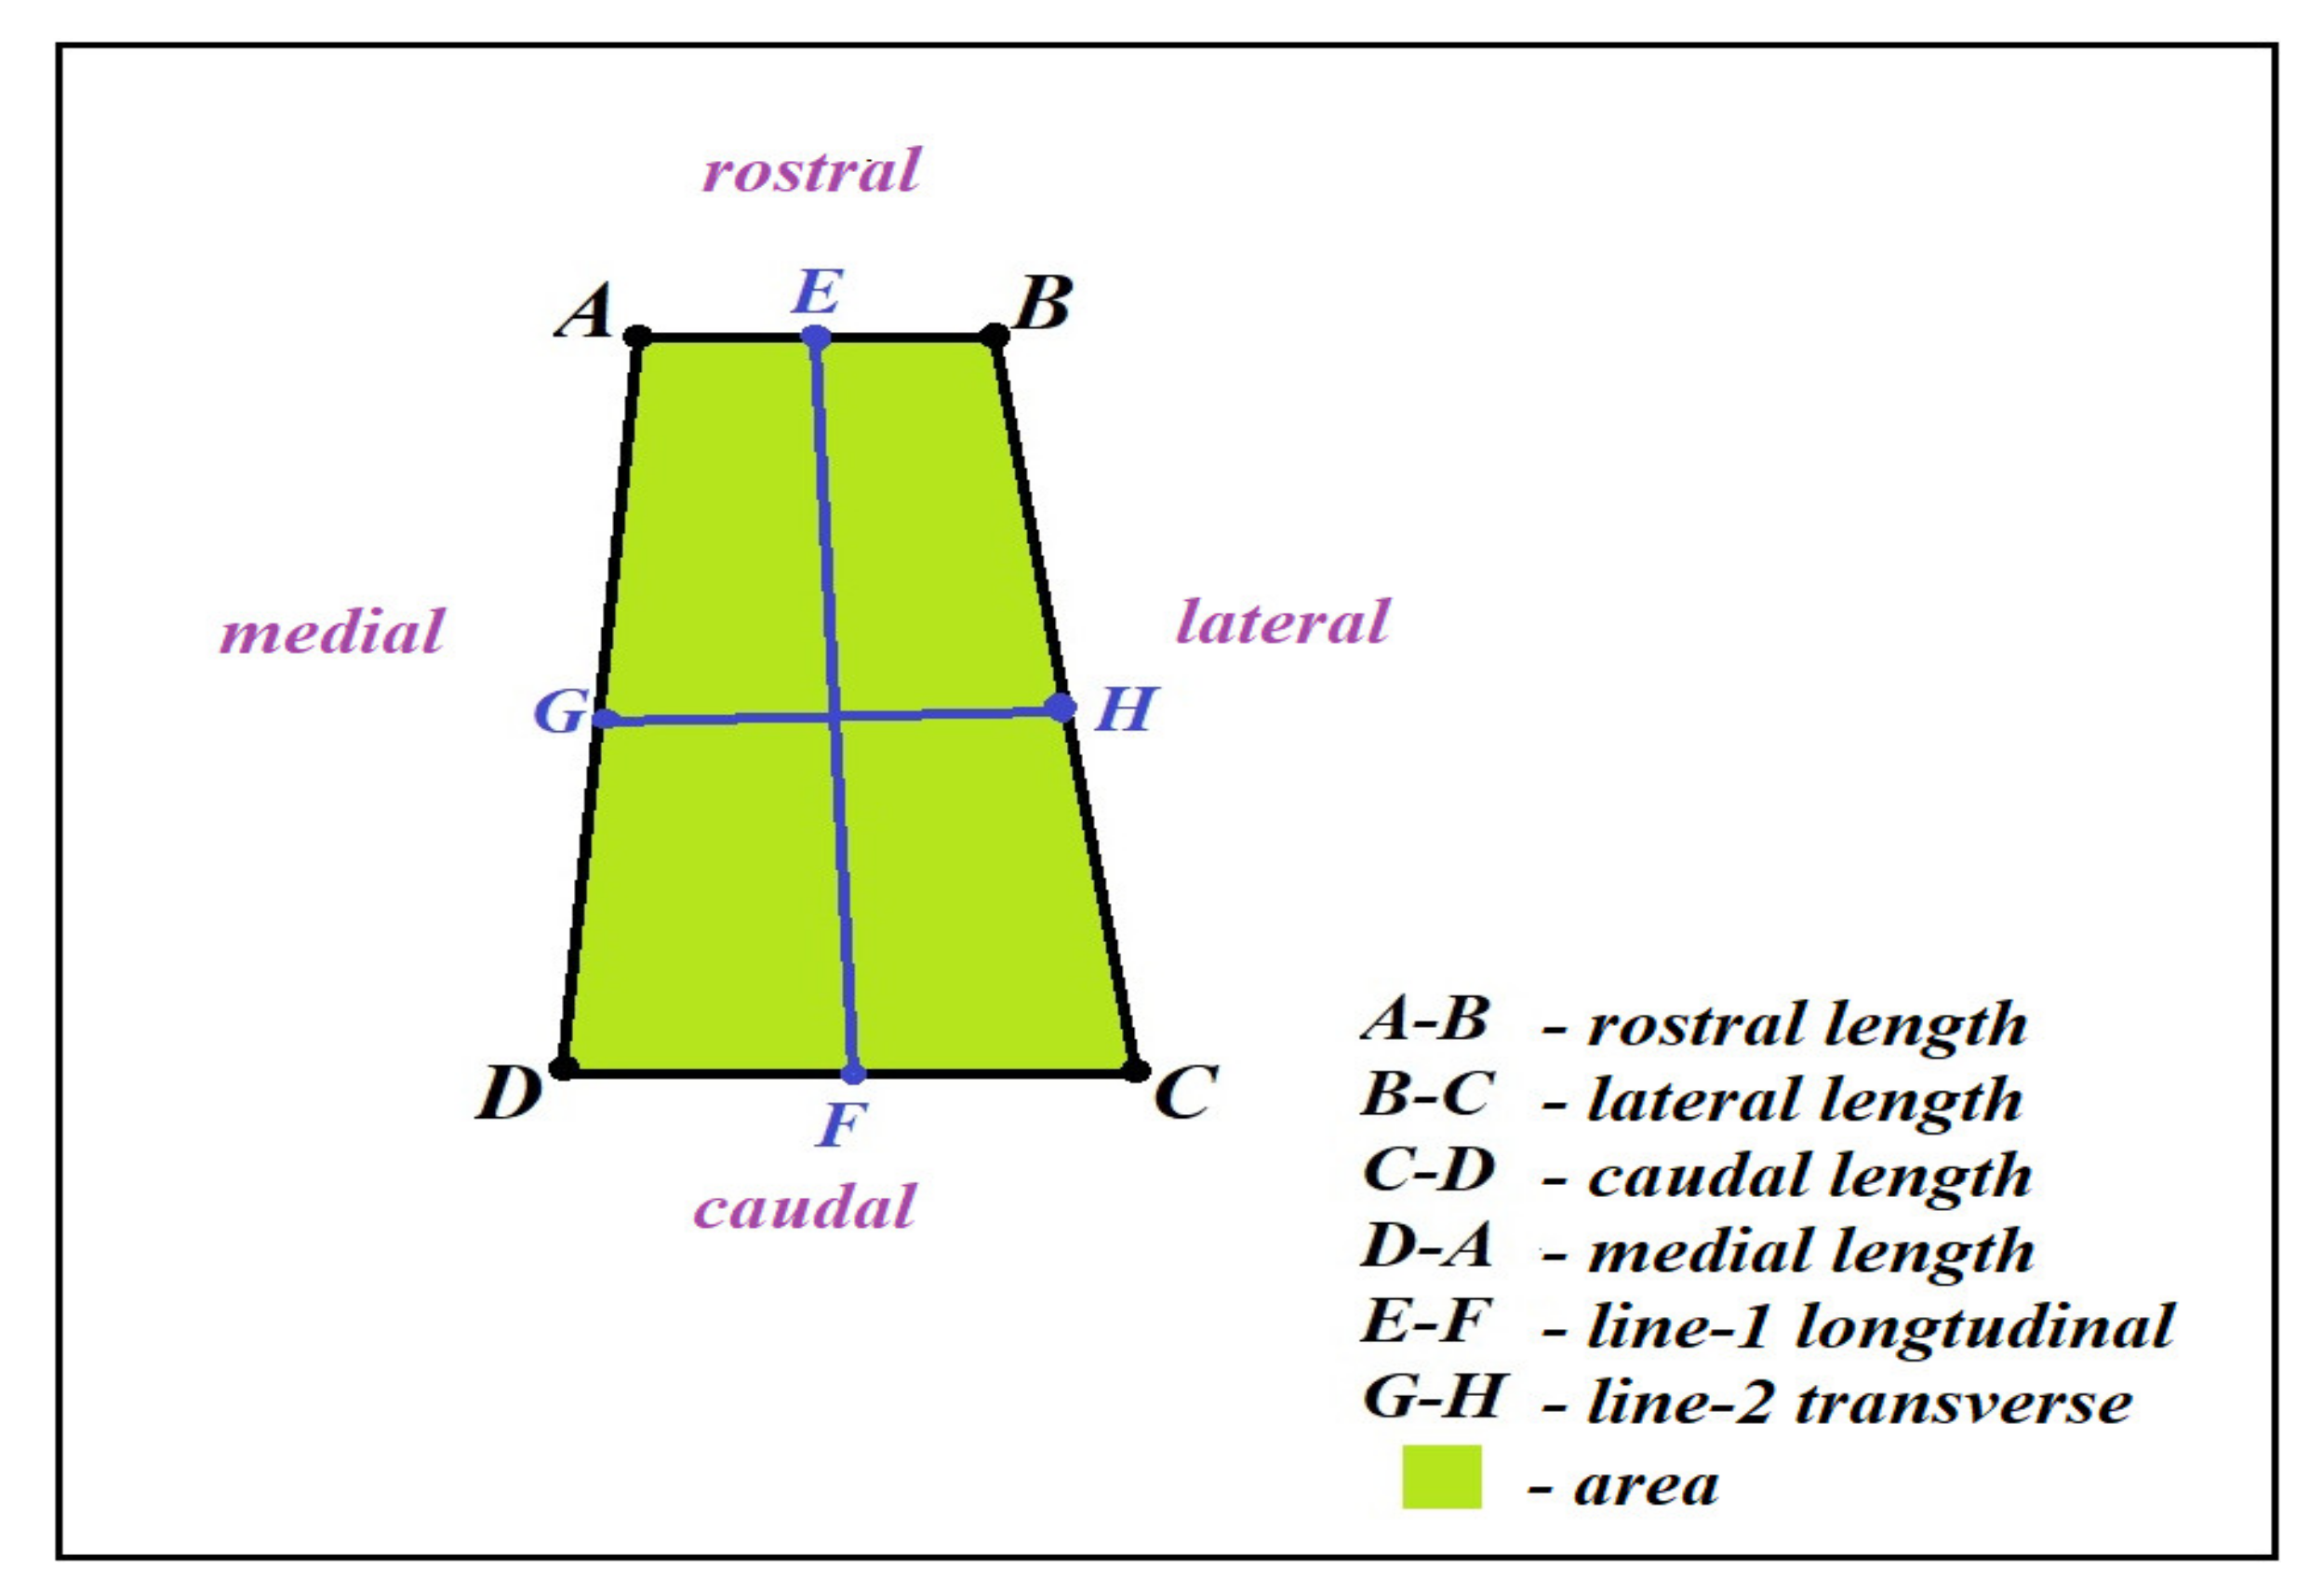
Printed models of maxillas (CT) were collected from the CBCT center. We had no influence on the decision to take CTs. We took all subsequently created CBCT data from the center and created the “cohort”. Among the group of 57 cases with complete data (age and sex was noted) were printed models of 30 females (F) and 27 males (M).
Based on data obtained from the CBCT center, the age range for the 57 cases (from which the printed models were obtained) varied from 49 to 76 years (average 61.74 years; SD = 6.01 years). The male age range was from 49 to 67 years (average 59.22 years; SD = 4.96 years). The female age range was from 52 to 76 years (average 64.00 years; SD = 6.04 years).

2.2. Measurements

The investigation utilized 57 models of maxillas, including the adjacent pterygoid process of the sphenoid bone from randomly selected cases. The only prerequisite for inclusion was either edentulousness in the upper jaw, and we did not include the CT models if tuberopterygoid region was not visible on a specific model in the distal maxilla on both sides. All CTs were obtained during regular CT-appointments, data included anonymized copies of the CT data, and only gender and age were noted for each case. As a result, permission from an ethics committee was not required because all collected CTs were ordered by physicians independently of this study (CBCT made these models long before the current analysis). CTs were collected from the same center; thus, this study group represents a “cohort” involving a single recording (CT) session [11].
Printing was carried out using the printing device Inspire A370, which is very accurate.
Build Volume 320 × 330 × 370 mm.
12.6 × 13.0 × 14.6 in.
Layer Thickness 0.175, 0.2, 0.25, 0.3, 0.35, 0.4 mm.
Build Speed 5~60 cm3/h.
Jetting Head Single.
Build Material ABS B501.
Support Material ABS S301.
The example of the 3D printed model of maxilla is presented in Figure 1. The craniometrical measurements were taken using an electronic caliper (GEODORE No. 711 with accuracy 0.03 mm–0.001 inch)–(size of the junction region and orientation of the junction region), with three repetitions in each 3D model for seven measurements (lateral, medial, rostral, caudal, area, line-1 longitudinal, and line-2 transverse) on both sides of the 3D printed model of maxilla—right (R) and left (L) (Figure 2) [11]. The measurements were taken by the same operator, and the operator was experienced. A second person verified where the points (from A to G) were made and corrected, or discussed with the first observer and they agreed where to put the points. The measurements were also calculated with the use of the AxioVision Rel 4.8.2 program (Carl Zeiss, Oberkochen, Germany).

2.3. Statistical Analysis

Received data were analyzed using Statistica 12 software (StatSoft, Kraków, Poland) and the following tests: Shapiro–Wilk analysis to test for data normality, Pearson correlation test (parametric data) and Spearman correlation test (nonparametric data) to check the correlations between the acquired data and the age of the patients. The r-coefficient showed the strength of the relationship: r ≤ 0.03 = no correlation; 0.3 < r ≤ 5 = weak correlation; 0.5 < r ≤ 0.7 = medium correlation; 0.7 < r ≤ 0.9 = strong correlation; r > 0.9 = very strong correlation. The statistical significance was set at p ≤ 0.05.

3. Results

3.1. Descriptive Analysis
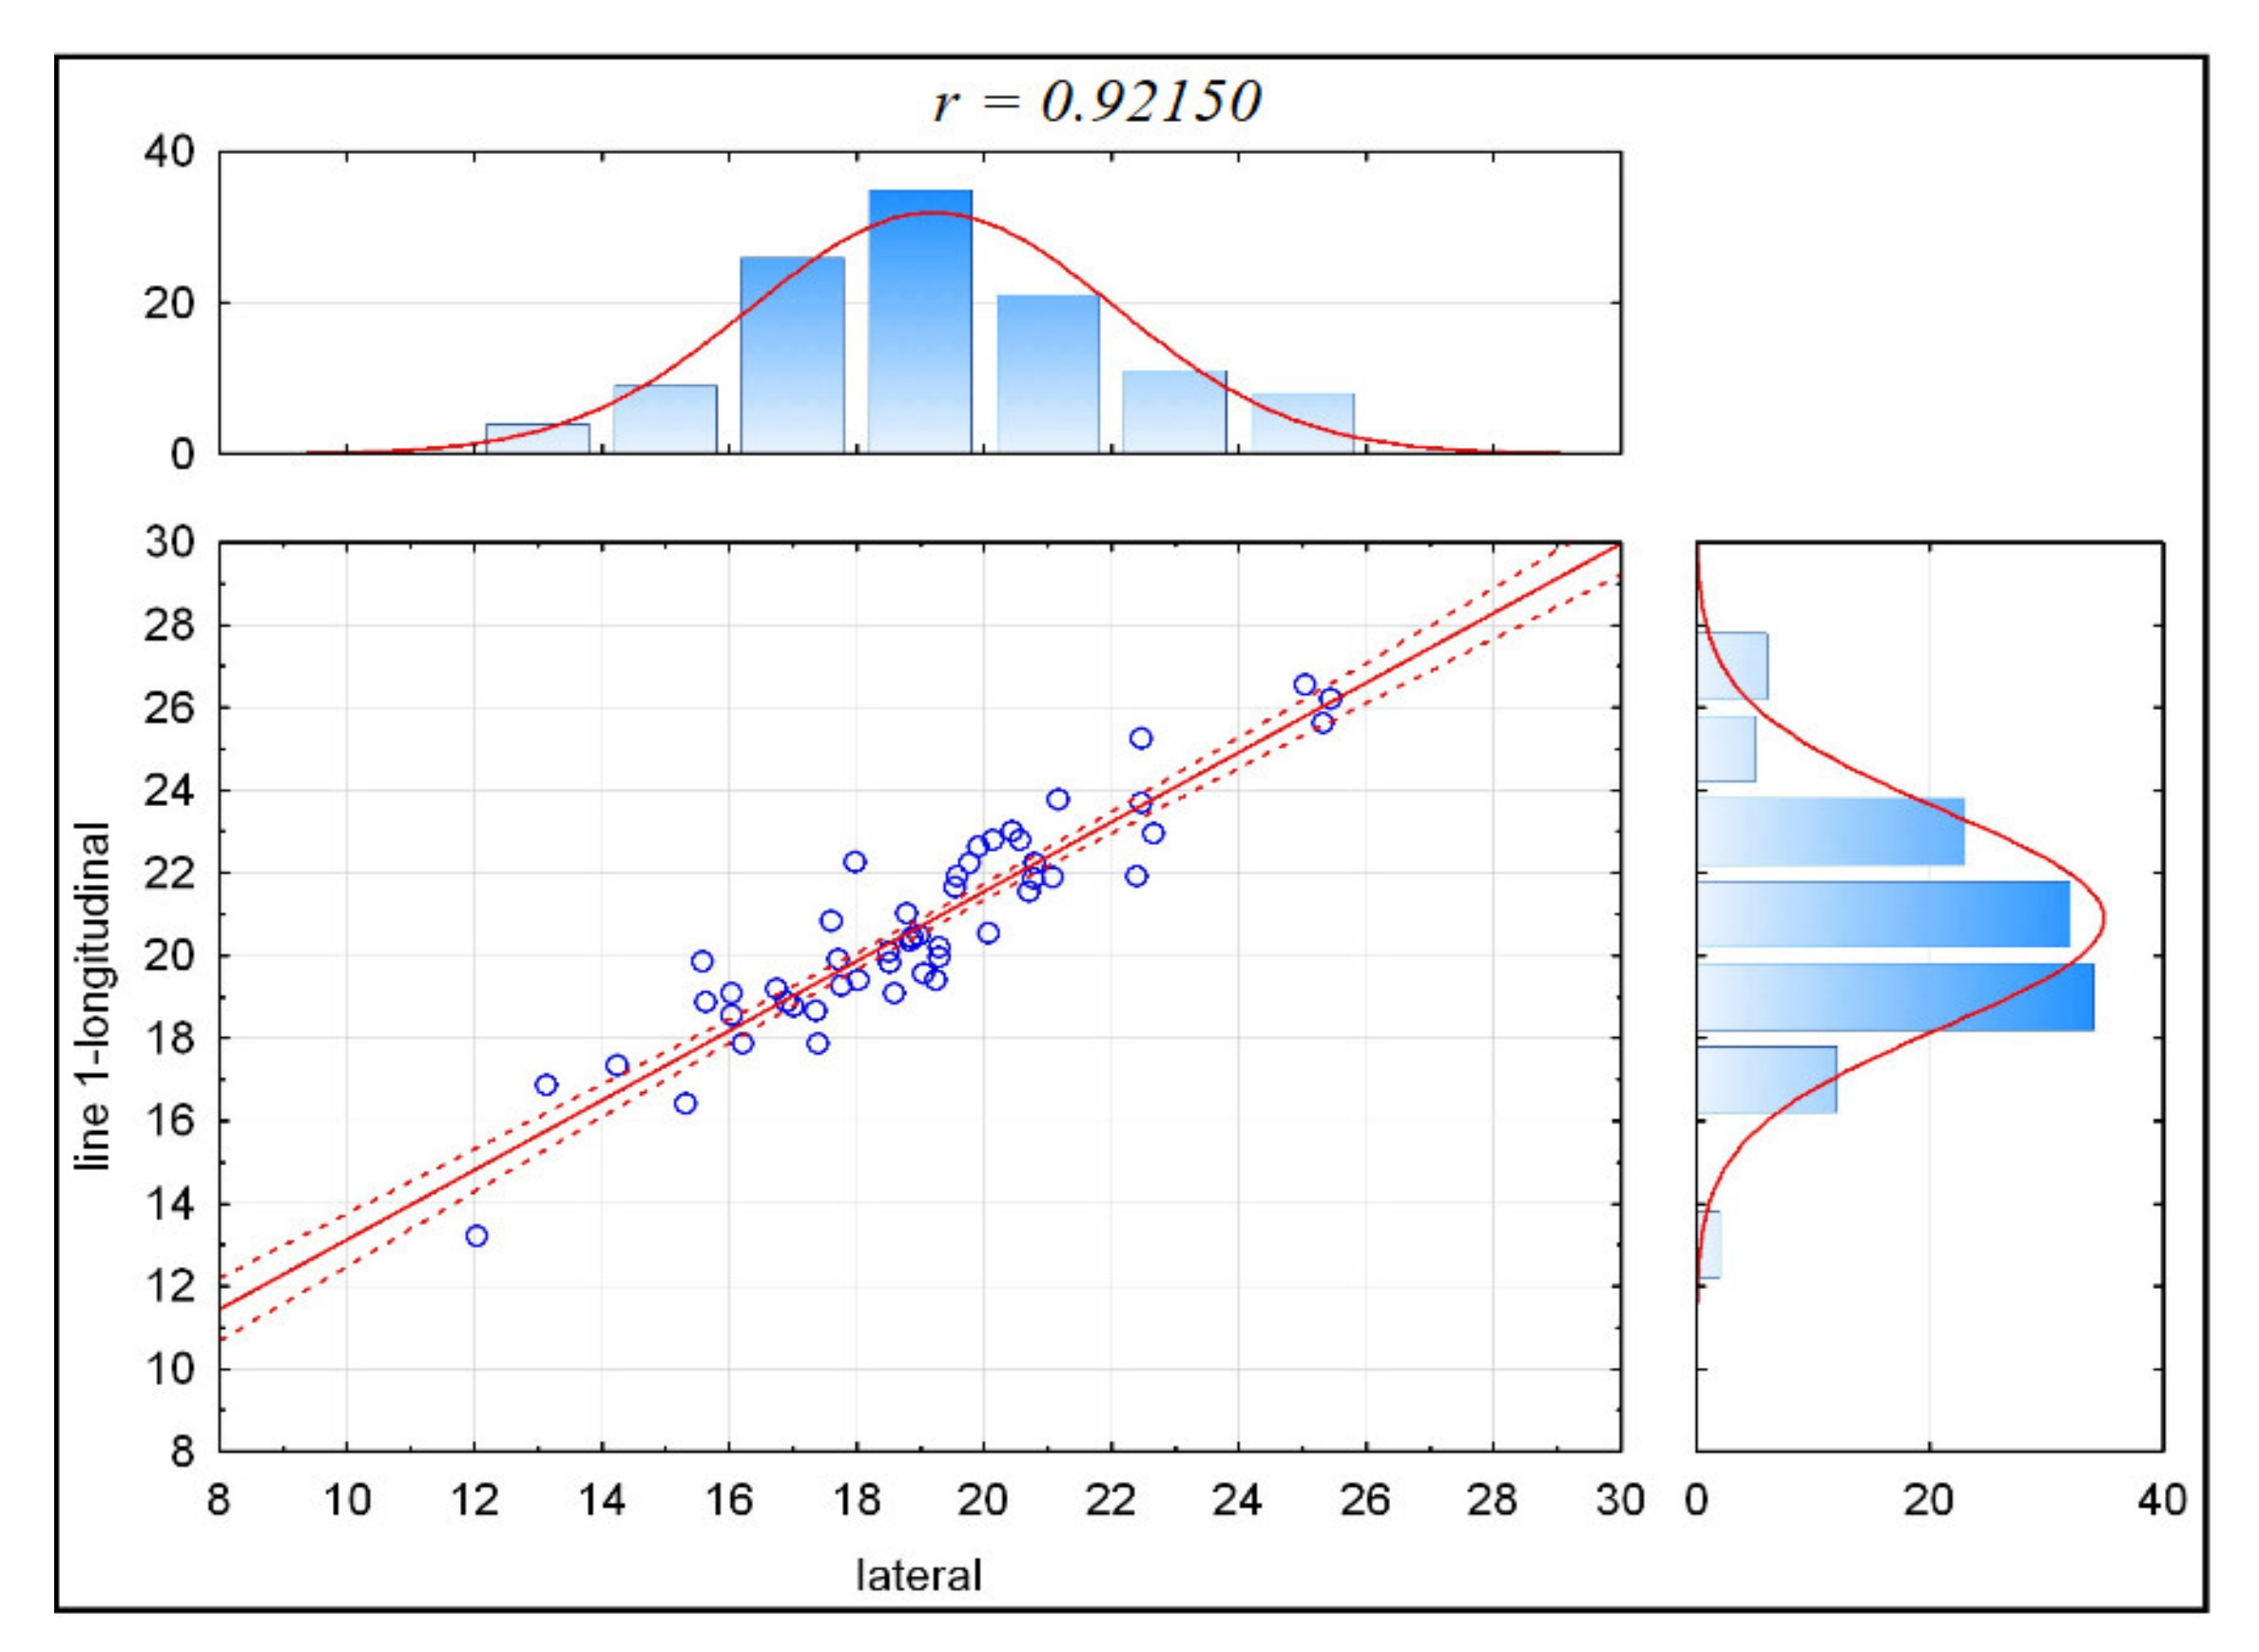
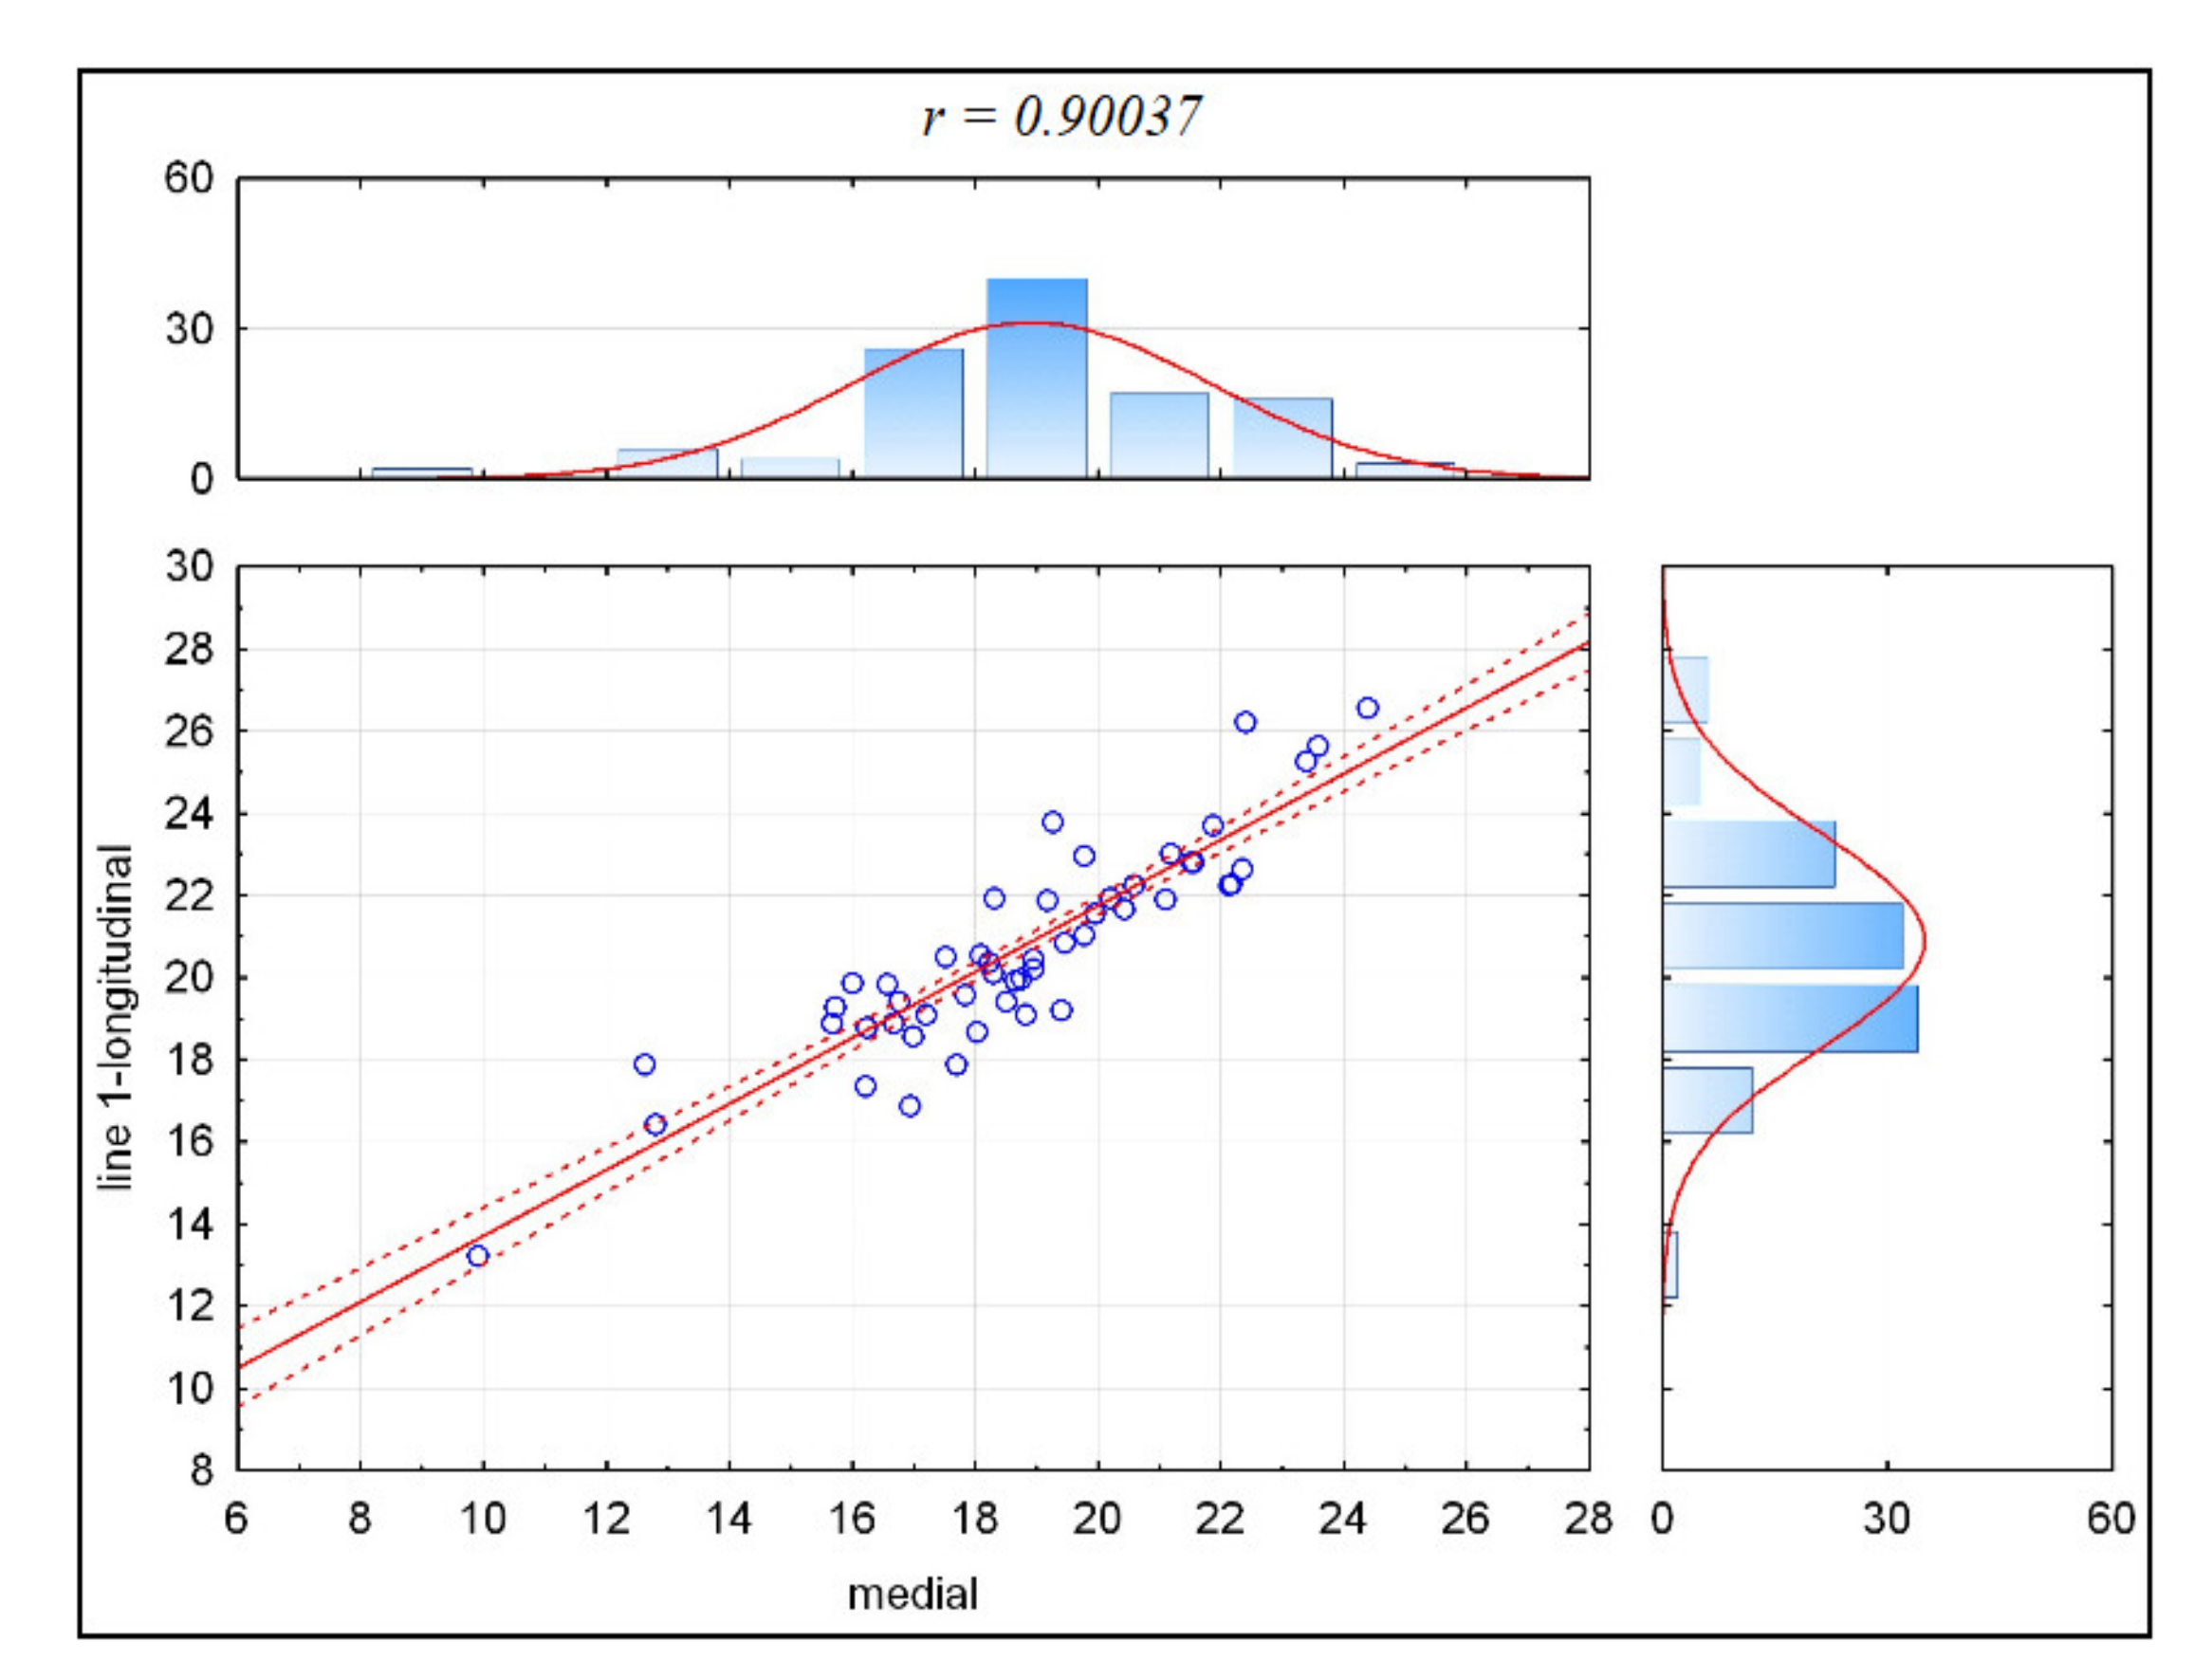
The descriptive analysis of obtained results is presented in Table 1.

3.2. Correlations

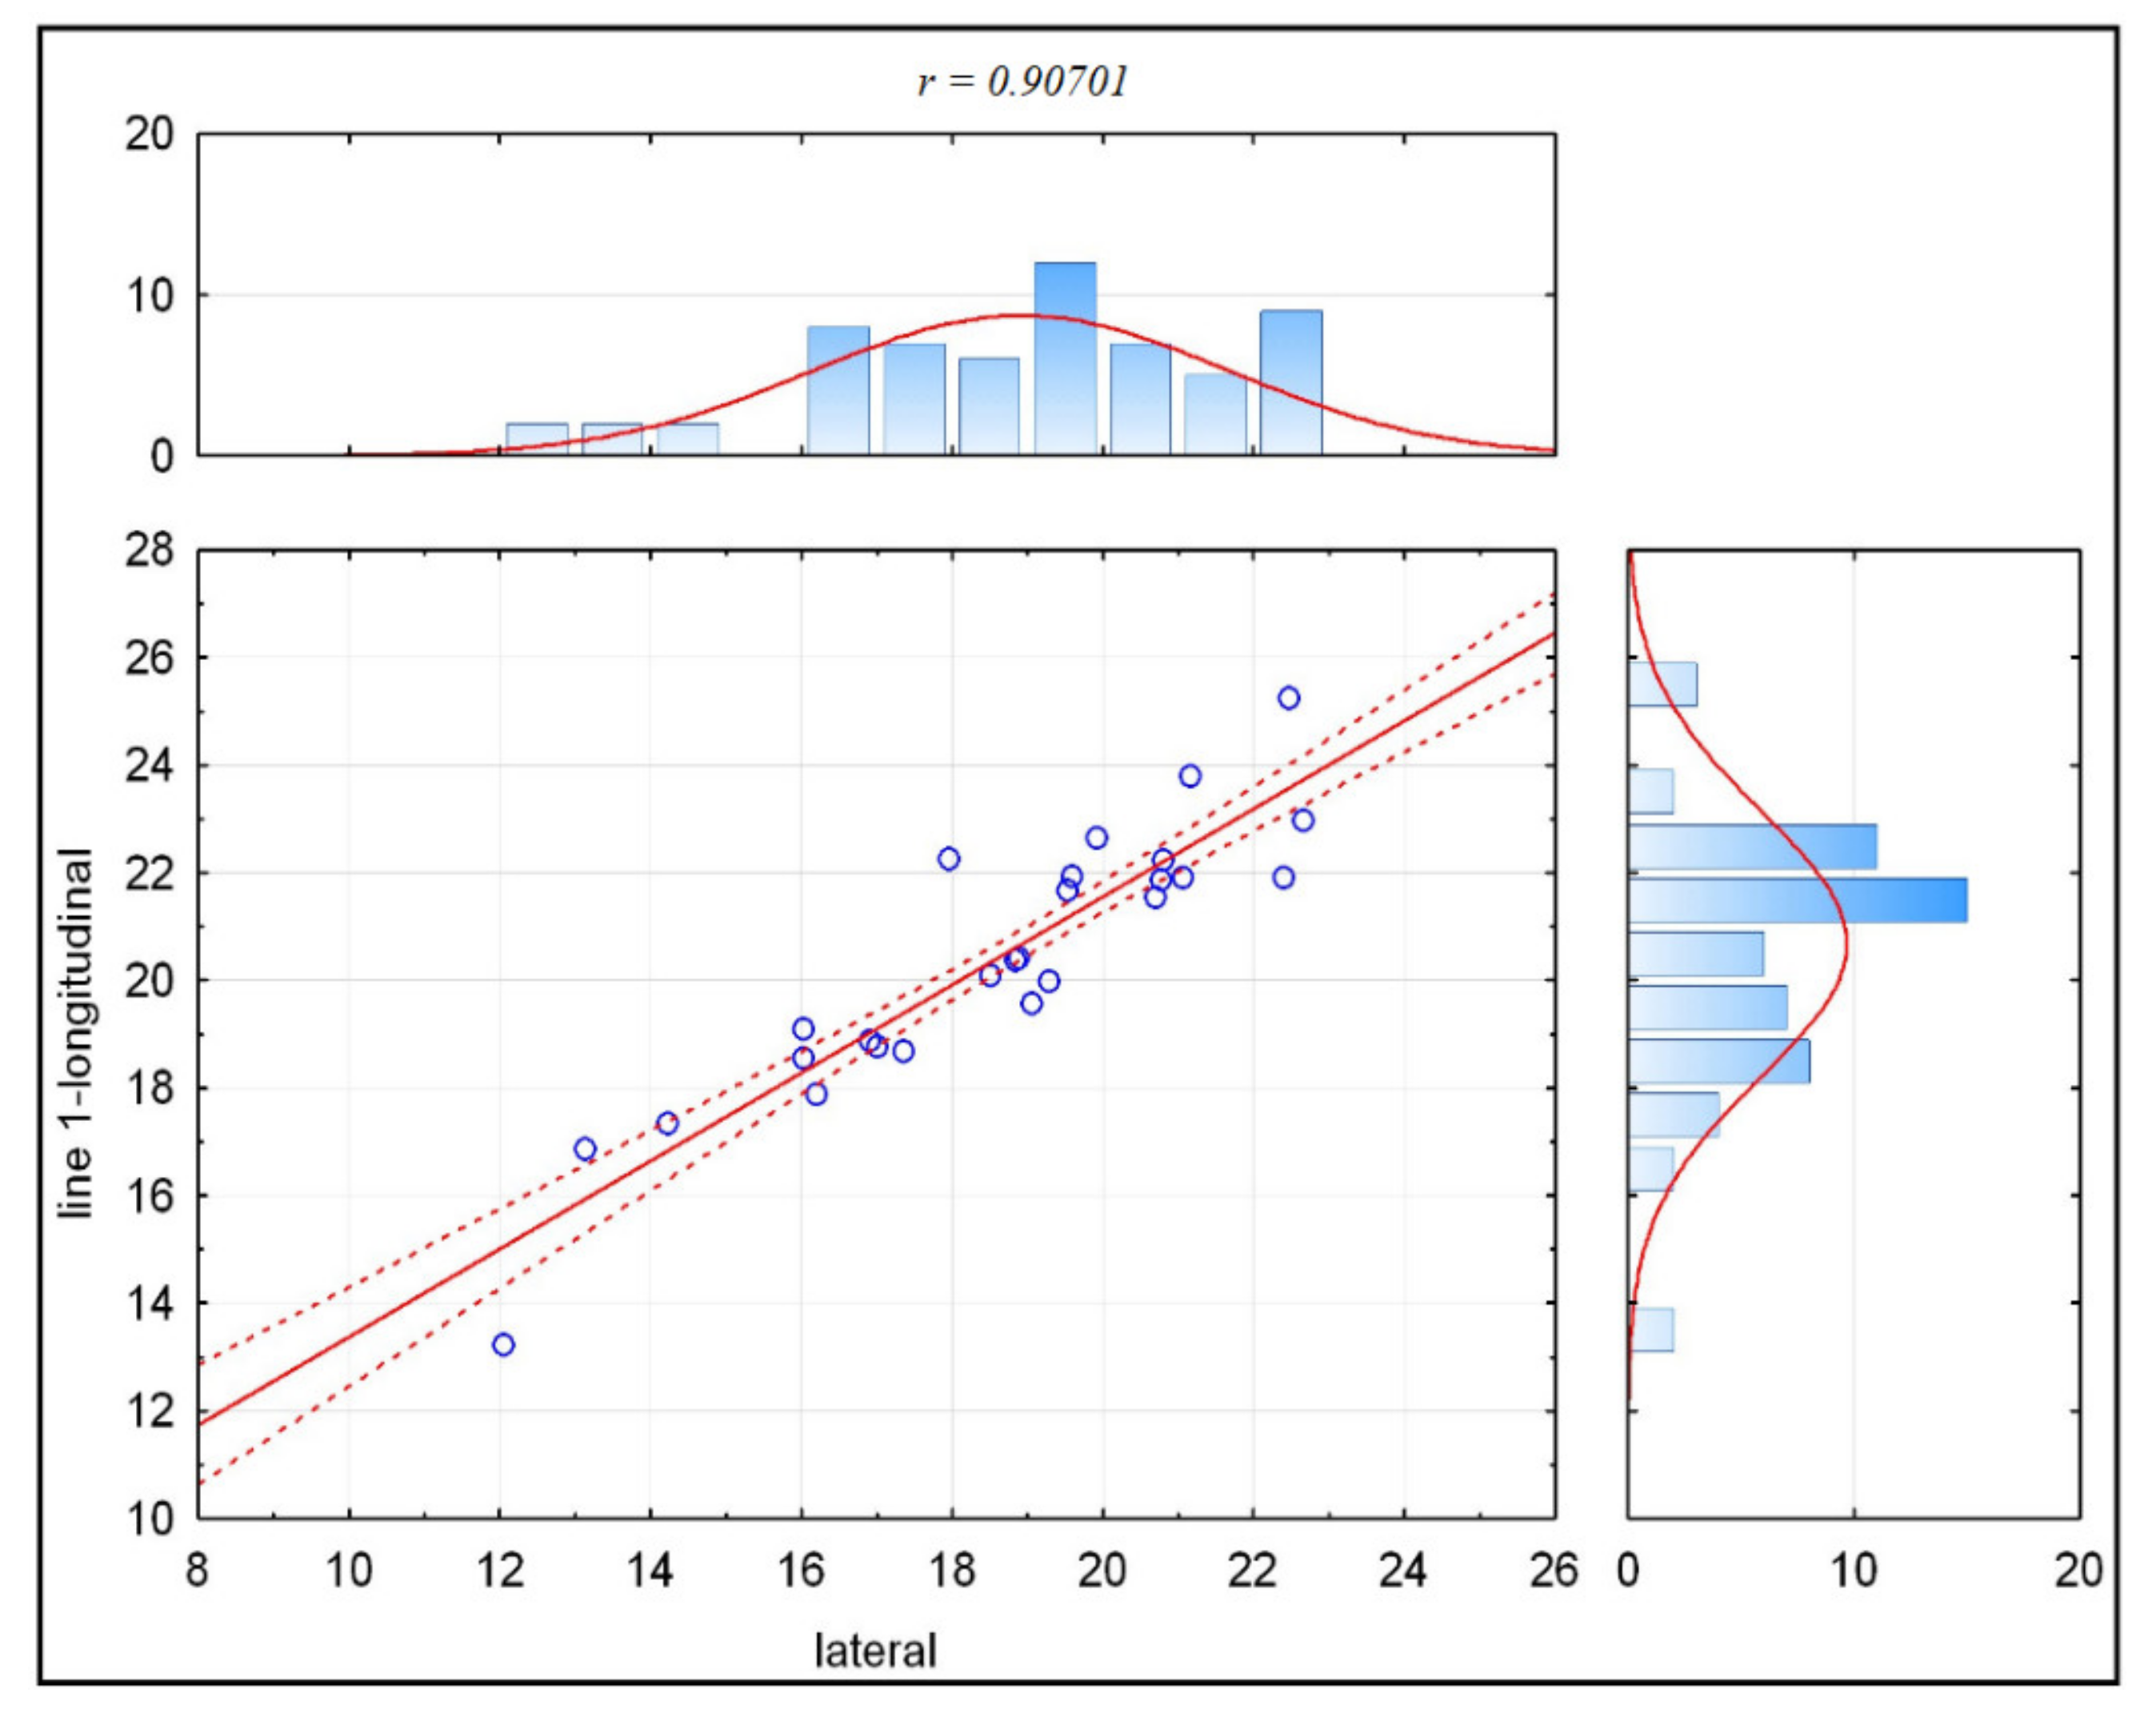
3.2.1. Whole Population Correlation

Table 2 illustrates the correlation between the pairs of parameters across the whole population. A very strong or strong correlation was identified between measurements of the lateral and line-1 longitudinal (p ≤ 0.05; r = 0.92) (Figure 3) and medial and line-1 longitudinal (p ≤ 0.05; r = 0.9) (Figure 4).

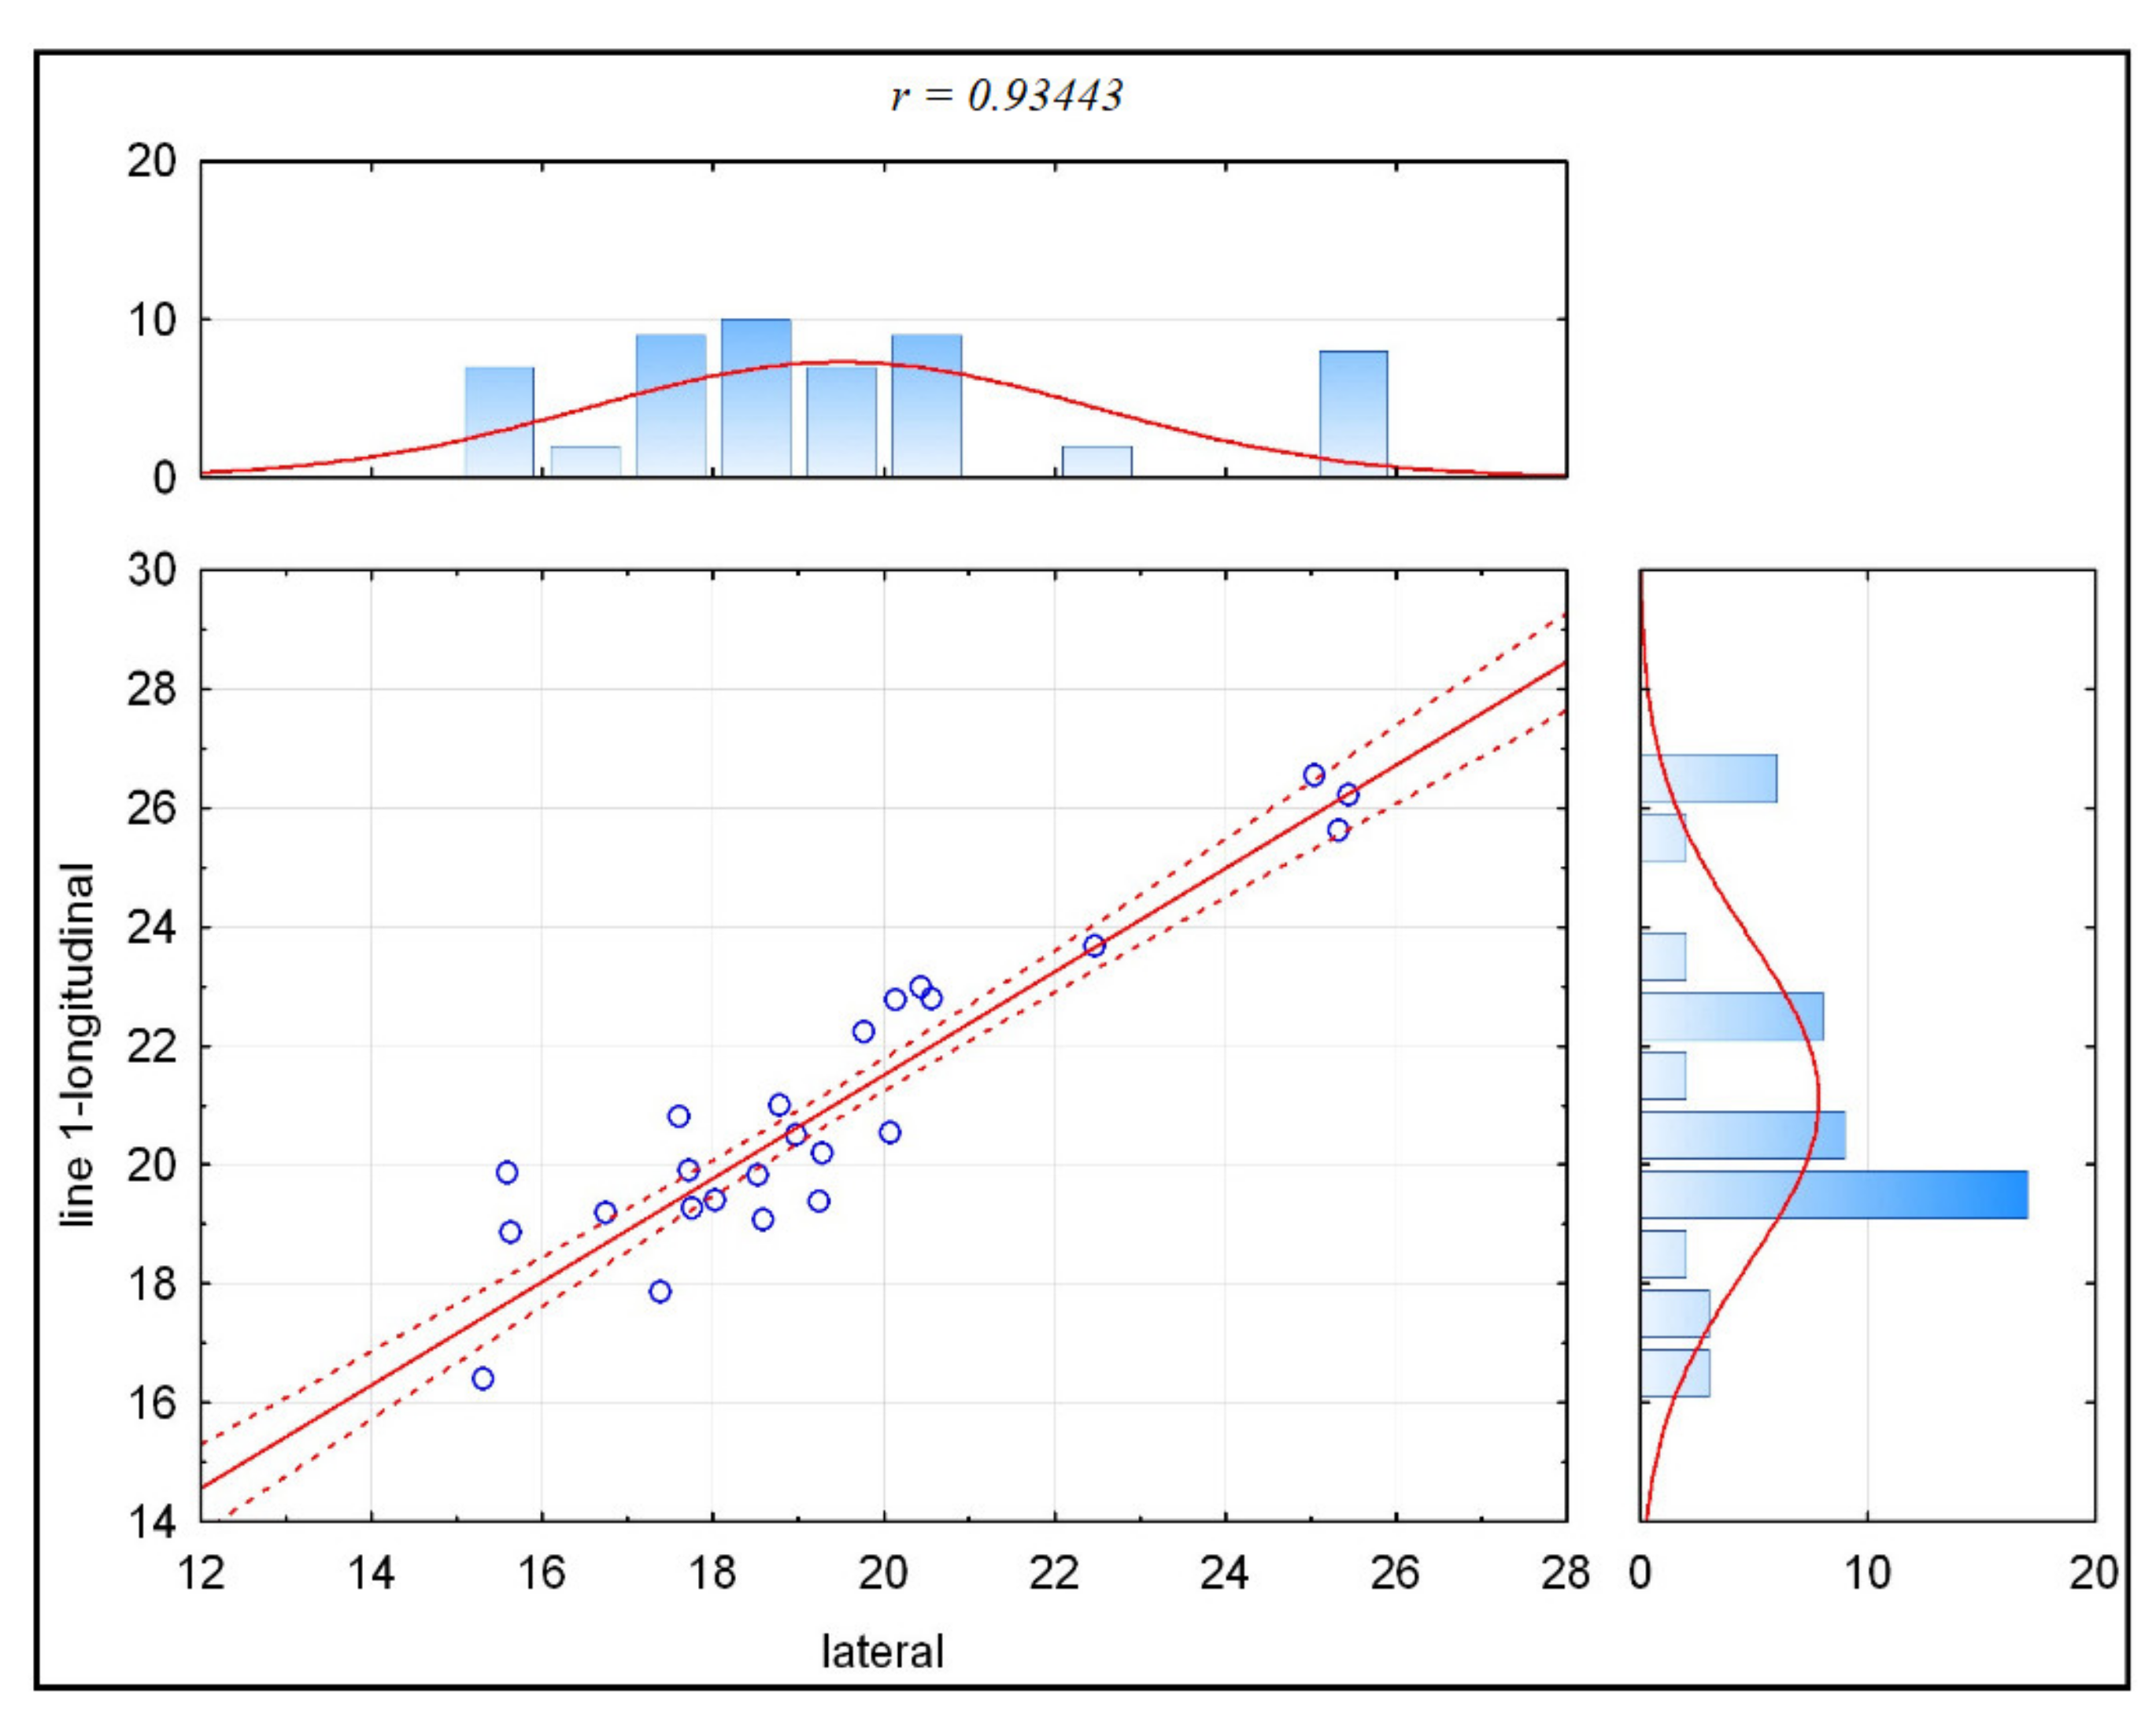
3.2.2. Female Group Correlation

Table 3 illustrates the correlation between the pairs of parameters in the female group. A very strong correlation was identified between the lateral and line-1 longitudinal (p ≤ 0.05; r = 0.91) (Figure 5). A correlation was also noted between age and lateral, as well as between age and line-1 longitudinal measurements. Other measurements showed no correlation with female patients’ age (p > 0.05 or p ≤ 0.05 r ≤ 0.03).

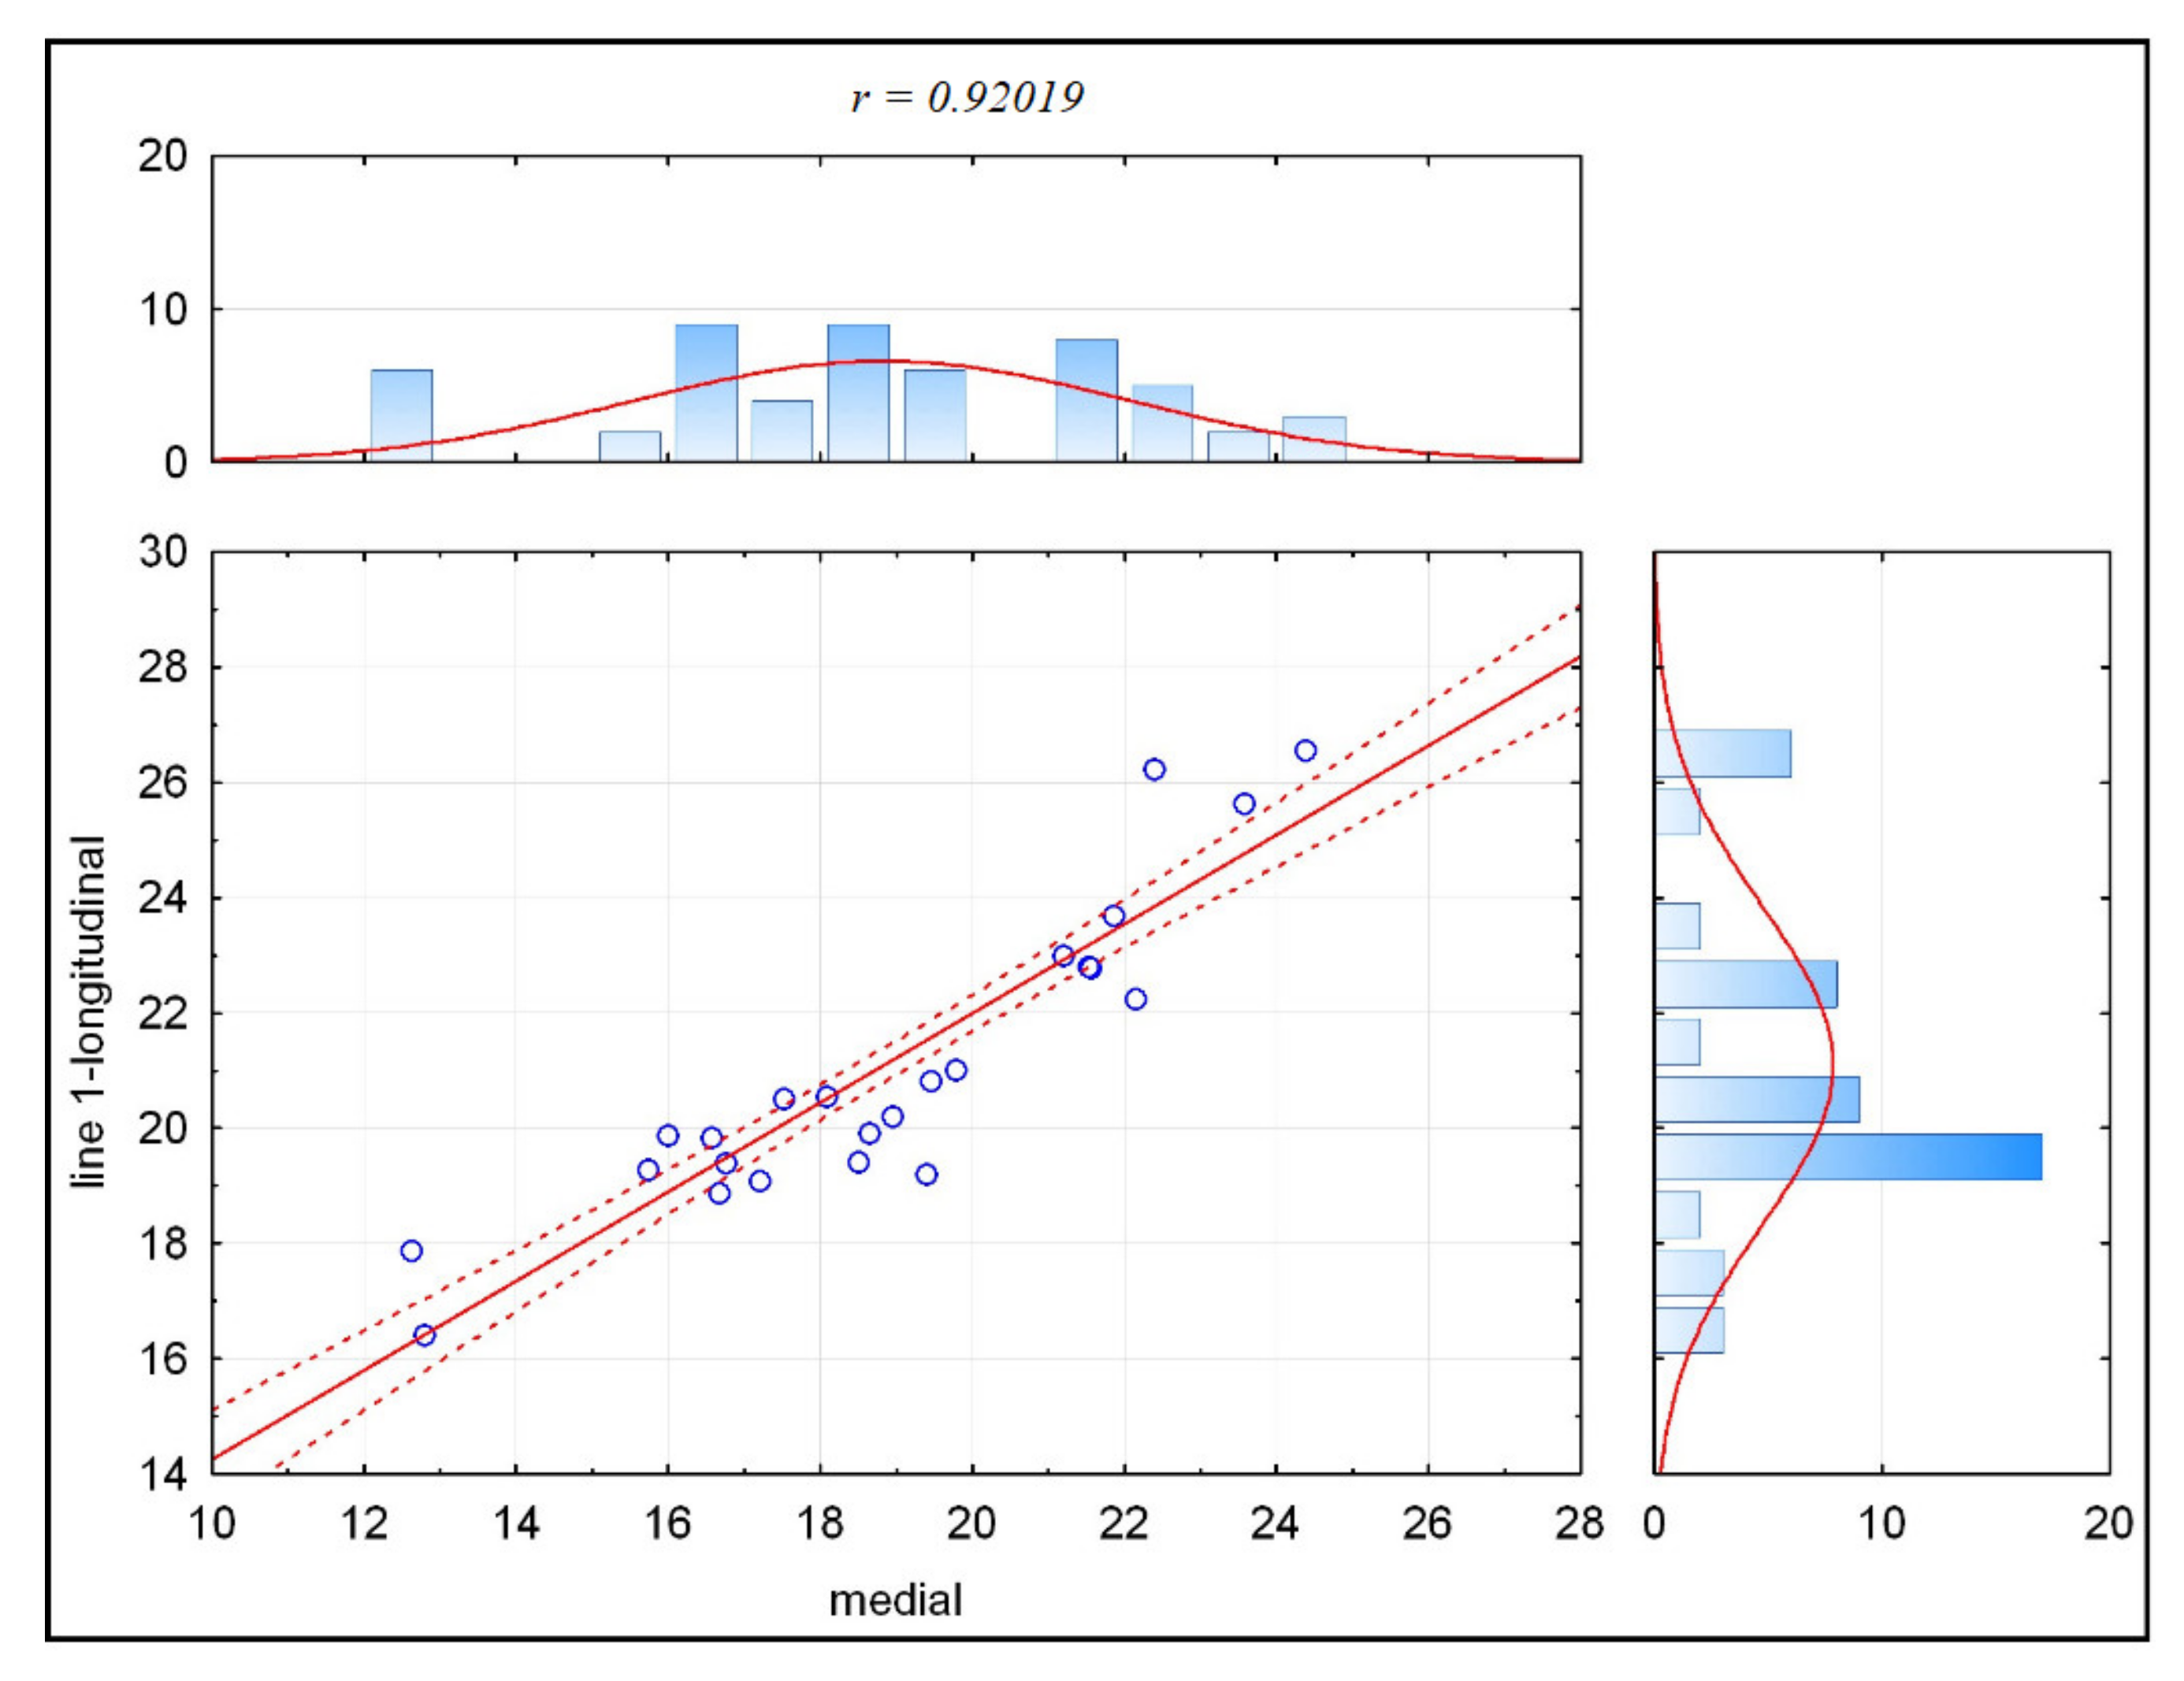
3.2.3. Male Group Correlation

Table 4 illustrates the correlation between the pairs of parameters in the male group. A very strong correlation was identified between the lateral and line-1 longitudinal (p ≤ 0.05; r = 0.93) (Figure 6) and between the medial and line-1 longitudinal (p ≤ 0.05; r = 0.92) (Figure 7). A weak negative correlation was identified between age and medial, and also between age and line-1 longitudinal. The other measurements showed no correlation with male patients’ age (p > 0.05 or p ≤ 0.05 r ≤ 0.03).

4. Discussion

Numerous scholars posit that knowledge relating to the morphometry of the tubero–palato–pterygoid region can be helpful to surgeons during surgical treatment (e.g., LeFort I osteotomy procedure) and is an important consideration in the reduction of intraoperative complications [12,13]. Data relating to the physical measurements of the pterygomaxillary region is required by clinicians for pterygoid implant placement, for example [13].
The available literature has not yielded other studies that measure the parameters of the tubero–palato–pterygoid region, which excludes opportunities for comparison of results. Alternatively, numerous scholars have analyzed neighboring regions’ dimensions. Odobasi et al. (2020) have drawn attention to the clinical significance of the pterygomaxillary region, noting that this region may have different anatomies and may also lead to specific complications during surgery [14]. Their study illustrates significant gender differences in the distance between the descending palatine canal and the piriform rim. In this regard, the distance was significantly greater in males (p = 0.037) [14]. The measurements of the medial plate of the pterygoid process of the sphenoid bone, and the thickness of the pterygomaxillary region, demonstrate that these parameters were also longer on either side in females. Icen et al.’s (2020) study indicates dimorphic differences in the measurements of the PMF [15]. Males displayed significantly greater PMF length and width (p < 0.001). This is confirmed by Lentzen et al.’s (2020) research, which demonstrates significant morphological differences in the width of structures in this area in both males and in females [16]. In their study on the PMF and PPF, Icen and Orhan (2019) indicate a significantly larger PMF area in males [5]. All of the measurements (in the frontal, axial, and sagittal plane) were significantly larger on the right side of the skull. The authors emphasize that knowledge of these anatomical variations will allow surgeons to avoid damage to the neurovascular structures passing through the area.
Uchida et al. (2017) note a significant variation in the values in the pterygomaxillary region measured across different locations [13]. These were the measured distance between maxillary tuberosity and the most lateral lowest point of the PMF, as well as between the PMF and the greater palatine canal [13].
Some studies have indicated a relationship between certain cranial dimensions [8,17]. Some studies emphasize the effect these dimensions have on the predisposition of intraoperative complications [8]. It is imperative to have a thorough knowledge of the anatomy involved, given the presence of vital structures in the vicinity of this region that can be injured during surgical treatment. Kanazawa et al., (2013) concluded that the low pterygomaxillary junction thickness and low maxillary tuberosity length may influence the statistically significant risk of pterygoid process features during surgical treatments [8]. Oliveira et al., (2013) clearly state that gender and skeletal pattern, and craniofacial pattern, may influence the anatomy of the pterygopalatine region [17]. Imam et al. (2020) state that all of the skull’s dimorphic parameters (e.g., the distance between maxillary tuberosity and spinous foramen) have a big effect size and are in favor of males [18]. Thus, there is a great deal of research on the nature of morphological variation in structures located in the vicinity of the tubero–palato–pterygoid region. Most of these studies emphasize the importance of knowing the structures in this area in clinical management and during surgical procedures.
Because the objective of our study was also to determine if there is enough space in the fusion zone between pterygoid plate and distal maxilla, to place a tubero–pterygoid screw implant, the results suggest that this is possible. Data also suggest that, in most cases, two such tuberopterygoid implants may be placed, which is a good advantage for support of implant-based bridges. Problematic for all treatments is the weak bone in the distal maxilla; loss rates and the rate of periimplantitis is high there.
If we use, however, for cortical anchorage the tuberopterygoid plate, we can work in immediate loading, and data suggests that, on average, there is chance to place even two such implants. Clinical data suggests that survival rate for tuberopterygoid implants is 99% [19]. Two implants there would be even better. The minimal distance between the threads is 2.5 mm (that is what we know from experience); also we know that remodeling around cortically anchored trauma screws is close to zero. Lazarov published data about success rates in 2019 [20]. There is a potential for forensic evidence significance, also, if we detected sexual dimorphism in these measurements. If there is a certainty of 70% and above for gender identification, that is good evidence.

5. Conclusions

This study demonstrates significant correlations between individual measurements in this region and their relation to gender. This confirms the existence of sexual dimorphism and the variability of the surrounding anatomical structures, an observation supported by other scholars. Thus, given that no previous scientific study has analyzed the tubero–palato–pterygoid region in this way, the results of the present study may have important cognitive significance for clinical practice.

Author Contributions

Conceptualization, S.I. and Ł.P.; methodology, S.I., Ł.P., M.J. and M.D.; software, S.J.; validation, S.I. and S.J.; formal analysis, S.I.; investigation, S.I. and Ł.P.; resources, S.J.; data curation, S.J., J.K.-N. and I.J.; writing—original draft preparation, S.I., Ł.P., M.J. and A.K.; writing—review and editing, S.I., K.G.-H. and J.K.-N.; visualization, K.G.-H., J.K.-N. and I.J.; supervision, M.D.; project administration, S.I., Ł.P. and M.J.; funding acquisition, M.J. All authors have read and agreed to the published version of the manuscript.

Funding

This research received no external funding.

Institutional Review Board Statement

Not applicable.

Informed Consent Statement

Not applicable.

Conflicts of Interest

The authors declare no conflict of interest.

References

  1. Wentges, R.T. Surgical anatomy of the pterygopalatine fossa. Laryngology meeting. R. Soc. Med. 1974, 89, 35–45. [Google Scholar]
  2. Hwang, K.; Lee, D.K.; Chung, I.H.; Lee, S.I. Le Fort I osteotomy with sparing fracture of lateral pterygoid plate. J. Craniofac. Surg. 2001, 12, 48–52. [Google Scholar] [CrossRef] [PubMed]
  3. Chin, Y.P.; Leno, M.B.; Dumrongwongsiri, S.; Chung, K.H.; Lin, H.H.; Lo, L.J. The pterygomaxillary junction: An imaging study for surgical information of LeFort I osteotomy. Sci. Rep. 2017, 7, 9953. [Google Scholar] [CrossRef] [PubMed] [Green Version]
  4. Nish, I.; Pynn, B.; Holmes, H.; Young, E. Maxillary nerve block: A case report and review of the intraoral technique. J. Can. Assoc. 1995, 61, 305–310. [Google Scholar]
  5. Icen, M.; Orhan, K. Cone-beam computed tomography evaluation of the pterygomaxillary fissure and pterygopalatine fossa using 3D rendering programs. Surg. Radiol. Anat. 2019, 41, 513–522. [Google Scholar] [CrossRef] [PubMed]
  6. Puche-Torres, M.; Blasco-Serra, A.; Campos-Peláez, A.; Valverde-Navarro, A.A. Radiological anatomy assessment of the fissura pterygomaxillaris for a surgical approach to ganglion pterygopalatinum. J. Anat. 2017, 231, 961–969. [Google Scholar] [CrossRef] [PubMed] [Green Version]
  7. Melsen, B.; Melsen, F. The postnatal development of the palatomaxillary region studied on human autopsy material. Am. J. Orthod. 1982, 82, 329–342. [Google Scholar] [CrossRef]
  8. Kanazawa, T.; Kuroyanagi, N.; Miyachi, H.; Ochiai, S.; Kamiya, N.; Nagao, T.; Shimozato, K. Factors predictive of pterygoid process fractures after pterygomaxillary separation without using an osteotome in Le Fort I osteotomy. Oral Surg. Oral Med. Oral Pathol. Oral Radiol. 2013, 115, 310–318. [Google Scholar] [CrossRef] [PubMed]
  9. Lee, S.P.; Paik, K.S.; Kim, M.K. Anatomical study of the pyramidal process of the palatine bone in relation to implant placement in the posterior maxilla. J. Oral Rehabil. 2001, 28, 125–132. [Google Scholar] [CrossRef] [PubMed]
  10. Dargaud, J.; Cotton, F.; Buttin, R.; Morin, A. The maxillary sinus: Evolution and function in aging. Morphologie 2003, 87, 17–22. [Google Scholar] [PubMed]
  11. Ihde, S.; Pałka, Ł.; Jarząb, S.; Janeczek, M.; Goździewska-Harłajczuk, K.; Klećkowska-Nawrot, J.; Janus, I.; Dobrzyński, M. Three-dimensional determination of the fusion zone between the distal maxilla and the pterygoid plate of the sphenoid bone and considerations for implant Treatment Procedure. Appl. Sci. 2021, 11, 30. [Google Scholar] [CrossRef]
  12. Neema, B.; Olabu, B.O.; Butt, F.M.A.; Idenya, P.M.; Cheruiyot, I.; Misiani, M. Computed tomography scan assessment of the anatomy of the pterygomaxillary junction and its relevance in Le Fort I Osteotomy. J. Craniofac. Surg. 2020, 7, 2017–2020. [Google Scholar] [CrossRef] [PubMed]
  13. Uchida, Y.; Yamashita, Y.; Danjo, A.; Shibata, K.; Kuraoka, A. Computed tomography and anatomical measurements of critical sites for endosseous implants in the pterygomaxillary region: A cadaveric study. Int. J. Oral Maxillofac. Surg. 2017, 46, 798–804. [Google Scholar] [CrossRef] [PubMed]
  14. Odabaşı, O.; Erkmen, E.; Özlem Üçok, C.; Akif Bakir, M.; Yıldızer Keriş, E.; Şahin, O. Morphometric analysis of pterygomaxillary region by using cone beam computed tomography. J. Stomatol. Oral Maxillofac. Surg. 2021, 122, 273–277. [Google Scholar] [CrossRef] [PubMed]
  15. Icen, M.; Orhan, K.; Oz, U.; Horasan, S.; Avsever, H. Relationship between pterygomaxillary fissure morphology and maxillary/mandibular position: A cone beam computed tomography assessment. J. Orofac. Orthop. 2020, 81, 183–191. [Google Scholar] [CrossRef] [PubMed]
  16. Lentzen, M.P.; Safi, A.F.; Riekert, M.; Visser-Vandewalle, V.; Grandoch, A.; Zirk, M.; Zöller, J.E.; Kreppel, M. Analysis of the pterygomaxillary fissure for surgical approach to sphenopalatine ganglion by radiological examination of cone beeam computed tomography. J. Craniofac. Surg. 2020, 31, e95–e99. [Google Scholar] [CrossRef] [PubMed]
  17. Oliveira, G.Q.V.; Rossi, M.A.; Vasconcelos, T.V.; Neves, F.S.; Crusoé-Rebello, I. Cone beam computed tomography assessment of the pterygomaxillary region and palatine canal for Le Fort I osteotomy. Int. J. Oral Maxillofac. Surg. 2017, 46, 1017–1023. [Google Scholar] [CrossRef] [PubMed]
  18. Al-Imam, A.; Abdul-Wahaab, I.T.; Konuri, V.K.; Sahai, A. Reconciling artificial intelligence and non-Bayesian models for pterygomaxillary morphometrics. Folia Morphol. 2021. [Google Scholar] [CrossRef]
  19. Schatzker, J.; Horne, J.G.; Sumner-Smith, G. The reaction of cortical bone to compression by screw threads. Clin. Orthop. Relatt. Res. 1975, 111, 263–265. [Google Scholar] [CrossRef] [PubMed]
  20. Lazarov, A. Immediate functional loading: Results for the concept of the strategic implant®. Ann. Maxillofac. Surg. 2019, 9, 78–88. [Google Scholar] [CrossRef] [PubMed]
Figure 1. The example of the 3D printed model of maxilla of the 58-year-old male (AD). (A,B) anterior aspect; (C)—inferior aspect; (D)—posterior aspect (arrows show the right area and left area of the posterior aspect).
Applsci 11 05450 g001
Figure 2. The schematic illustration of the seven measurements (rostral (from point A to point B); lateral (from point B to point C); caudal (from point C to point D); medial (from point D to point A); line-1 longitudinal (from point E to point F); line-2 transverse (from point G to point H); area (green color)) situated on one side of the 3D printed model (CT). The orientation of each measurement was appointed (rostral, caudal, medial, lateral). Point E = ½ AB rostral length; point F = ½ CD caudal length; point G = ½ DA medial length; point H = ½ BC lateral length.
Applsci 11 05450 g002
Figure 3. Correlation between the pairs of parameters (lateral and line-1 longitudinal) in whole population.
Applsci 11 05450 g003
Figure 4. Correlation between the pairs of parameters (medial and line-1 longitudinal) in whole population.
Applsci 11 05450 g004
Figure 5. Correlation between the pairs of parameters (lateral and line-1 longitudinal) in female group.
Applsci 11 05450 g005
Figure 6. Correlation between the pairs of parameters (lateral and line-1 longitudinal) in male group.
Applsci 11 05450 g006
Figure 7. Correlation between the pairs of parameters (medial and line-1 longitudinal) in male group.
Applsci 11 05450 g007
Table 1. The descriptive analysis of obtained results in the whole population.
ParametersMeanMedianSD
lateral [mm]18.2818.813.38
medial [mm]18.5919.013.04
rostral [mm]6.025.870.91
caudal [mm]8.668.361.36
area [mm2]150.99151.5239.76
line-1 longitudinal [mm]19.920.143.25
line-2 transverse [mm]7.587.630.93
Table 2. The r-value for the whole population correlations (r-value presented only for pairs showing statistically significant correlation, p ≤ 0.05).
ParametersLateralMedialRostralCaudalAreaLine-1 LongitudinalLine-2 Transverse
lateral 0.75 0.480.620.920.51
medial0.75 0.510.590.900.41
rostral 0.59
caudal0.480.51 0.600.420.76
area0.620.59 0.60 0.650.62
line-1 longitudinal0.920.90 0.420.65 0.46
line-2 transverse0.510.410.590.760.620.46
Table 3. The r-value for the female group correlations (r-value presented only for pairs showing statistically significant correlation, p ≤ 0.05).
ParametersAgeLateralMedialRostralCaudalAreaLine-1 LongitudinalLine-2 Transverse
age 0.360.27 0.31
lateral0.36 0.71 0.400.570.910.46
medial0.270.71 0.490.890.40
rostral 0.49
caudal 0.40 0.590.300.89
area 0.570.49 0.59 0.570.63
line-1 longitudinal0.310.910.89 0.300.57 0.40
line-2 transverse 0.460.400.490.890.630.40
Table 4. The r-value for the male group correlations (r-value presented only for pairs showing statistically significant correlation, p ≤ 0.05).
ParametersAgeLateralMedialRostralCaudalAreaLine-1 LongitudinalLine-2Ttransverse
age −0.30−0.38 −0.45
lateral−0.30 0.81 0.580.760.930.60
medial−0.380.81 0.560.820.920.50
rostral 0.76
caudal 0.580.56 0.630.560.49
area 0.760.82 0.63 0.830.66
line-1 longitudinal−0.450.930.92 0.560.83 0.57
line-2 transverse 0.600.500.760.490.660.57
Publisher’s Note: MDPI stays neutral with regard to jurisdictional claims in published maps and institutional affiliations.

