
GIS-Based Evaluation Method for Accessibility of Social Infrastructure Facilities

1
Department of Civil & Environmental Engineering, Incheon National University, 119 Academy-ro, Yeonsu-gu, Incheon 22012, Korea
2
DoIT, A-521, 12 Gaetbeol-ro, Yeonsu-gu, Incheon 21999, Korea
*
Author to whom correspondence should be addressed.
Appl. Sci. 2021, 11(12), 5581; https://0-doi-org.brum.beds.ac.uk/10.3390/app11125581
Submission received: 20 April 2021
/
Revised: 9 June 2021
/
Accepted: 10 June 2021
/
Published: 16 June 2021
(This article belongs to the Special Issue Application of Geographic Information System and Building Information Modelling)
Abstract
:Social infrastructure is provided to improve the quality of life of residents. There are two approaches to social infrastructure planning: (1) a population-based approach and (2) an access-based approach. A plan for the social infrastructure facilities in South Korea has been developed based on the population or number of households in a region. Recently, the South Korean government presented a guideline in which accessibility is included in the criteria. This study proposes a comprehensive evaluation method for the accessibility of social infrastructure and for identifying residential areas with poor access. To obtain the travel time between the residence and the social infrastructure facility, we employed a navigation application programming interface that provides a travel time that reflects the resistances in an actual situation. The accessibility index (AI) is defined as a population-weighted average travel time. We also identified residential areas with poor access to social infrastructure by creating accessibility maps. This study includes social infrastructure facilities, such as parks, libraries, elementary schools, childcare centers, kindergartens, and sports facilities. The method proposed in this study was applied to Namdong-gu, Incheon Metropolitan City, South Korea, to evaluate its applicability. The proposed method has advantages in that (1) the AI is easy to understand because it represents an intuitive index for the overall accessibility in minutes of a region, and (2) accessibility maps effectively identify residential areas with poor access.
1. Introduction
Social infrastructure is defined as a complex system of facilities, programs, and social networks that aim to improve the quality of life [1]. It includes educational, medical, cultural, and sports facilities that are essential for the everyday life of citizens. Central and local governments have developed a social infrastructure plan to ensure the following: (1) the areas are sufficiently supplied with social infrastructure; (2) social infrastructure is as equitably distributed as possible; (3) social infrastructure is effectively and efficiently configured so that service providers can flexibly respond to changing local community needs over a long time period [2]. New towns or cities built through systematic planning are generally considered to have an adequate level of social infrastructure facilities. However, old towns or cities do not have an adequate level of social infrastructure. Local governments that administer old towns are interested in improving social infrastructure. Accordingly, financial investment is increasing in these regions.
The scope and definition of a social infrastructure varies depending on the characteristics and circumstances of a country. In Melbourne, Australia, swimming pools, recreation centers, community conference spaces, nurseries, libraries, senior welfare facilities, disabled welfare facilities, parks, hospitals, elementary schools, and middle schools are defined as social infrastructure [3]. In Germany, public services include education, welfare, health care, community, electricity, and water and sewage, which are basic services in everyday life of the people [4]. London, UK, social infrastructure includes health and social care, education, childcare center, recreation facilities, public toilets, and burial space [5]. Facilities and services necessary for a city are classified into culture, welfare, childcare, education, health care, commerce, and finance, which include facilities and services such as childcare centers, kindergartens, schools, hospitals, markets, welfare centers, post offices, and banks in Japan [6].
There have been two approaches to social infrastructure planning in cities. The first is a population-based approach, and the other is an access-based approach. An example of a population-based approach is presented in Healthy Urban Planning. Basic social infrastructure is needed within 1 km of the home for the community of 4000 to 5000 people [7]. Similarly, the only criterion for providing social infrastructure in South Korea was the population or number of households in the region. However, if only the population is considered in social infrastructure planning, the convenience of the residents might be overlooked. For example, a study found that the average distance from old-age, low-rise housing to social infrastructure in some areas in South Korea was approximately 2.7 km [8]. The elderly cannot walk 2.7 km to use the facilities. Therefore, these social infrastructure facilities do not effectively increase the convenience or quality of life of residents.
In order to resolve this problem, the Korea Ministry of Land, Infrastructure, and Transport (KMoLIT) put forward access-based guidelines in 2018 for social infrastructure planning. The new guidelines use travel time to a facility (on foot or by vehicle) as the threshold for determining the satisfaction in terms of residents’ convenience [9]. For example, the Korean government is planning to build a park so that anyone can use the park within 15 min of walking from home. This threshold seems reasonable because although sufficient social infrastructure facilities are provided in a region, they do not enhance residents’ satisfaction and quality of life if they are located in a poorly accessible location. However, any explicit method of evaluating the accessibility of social infrastructure facilities has not been proposed.
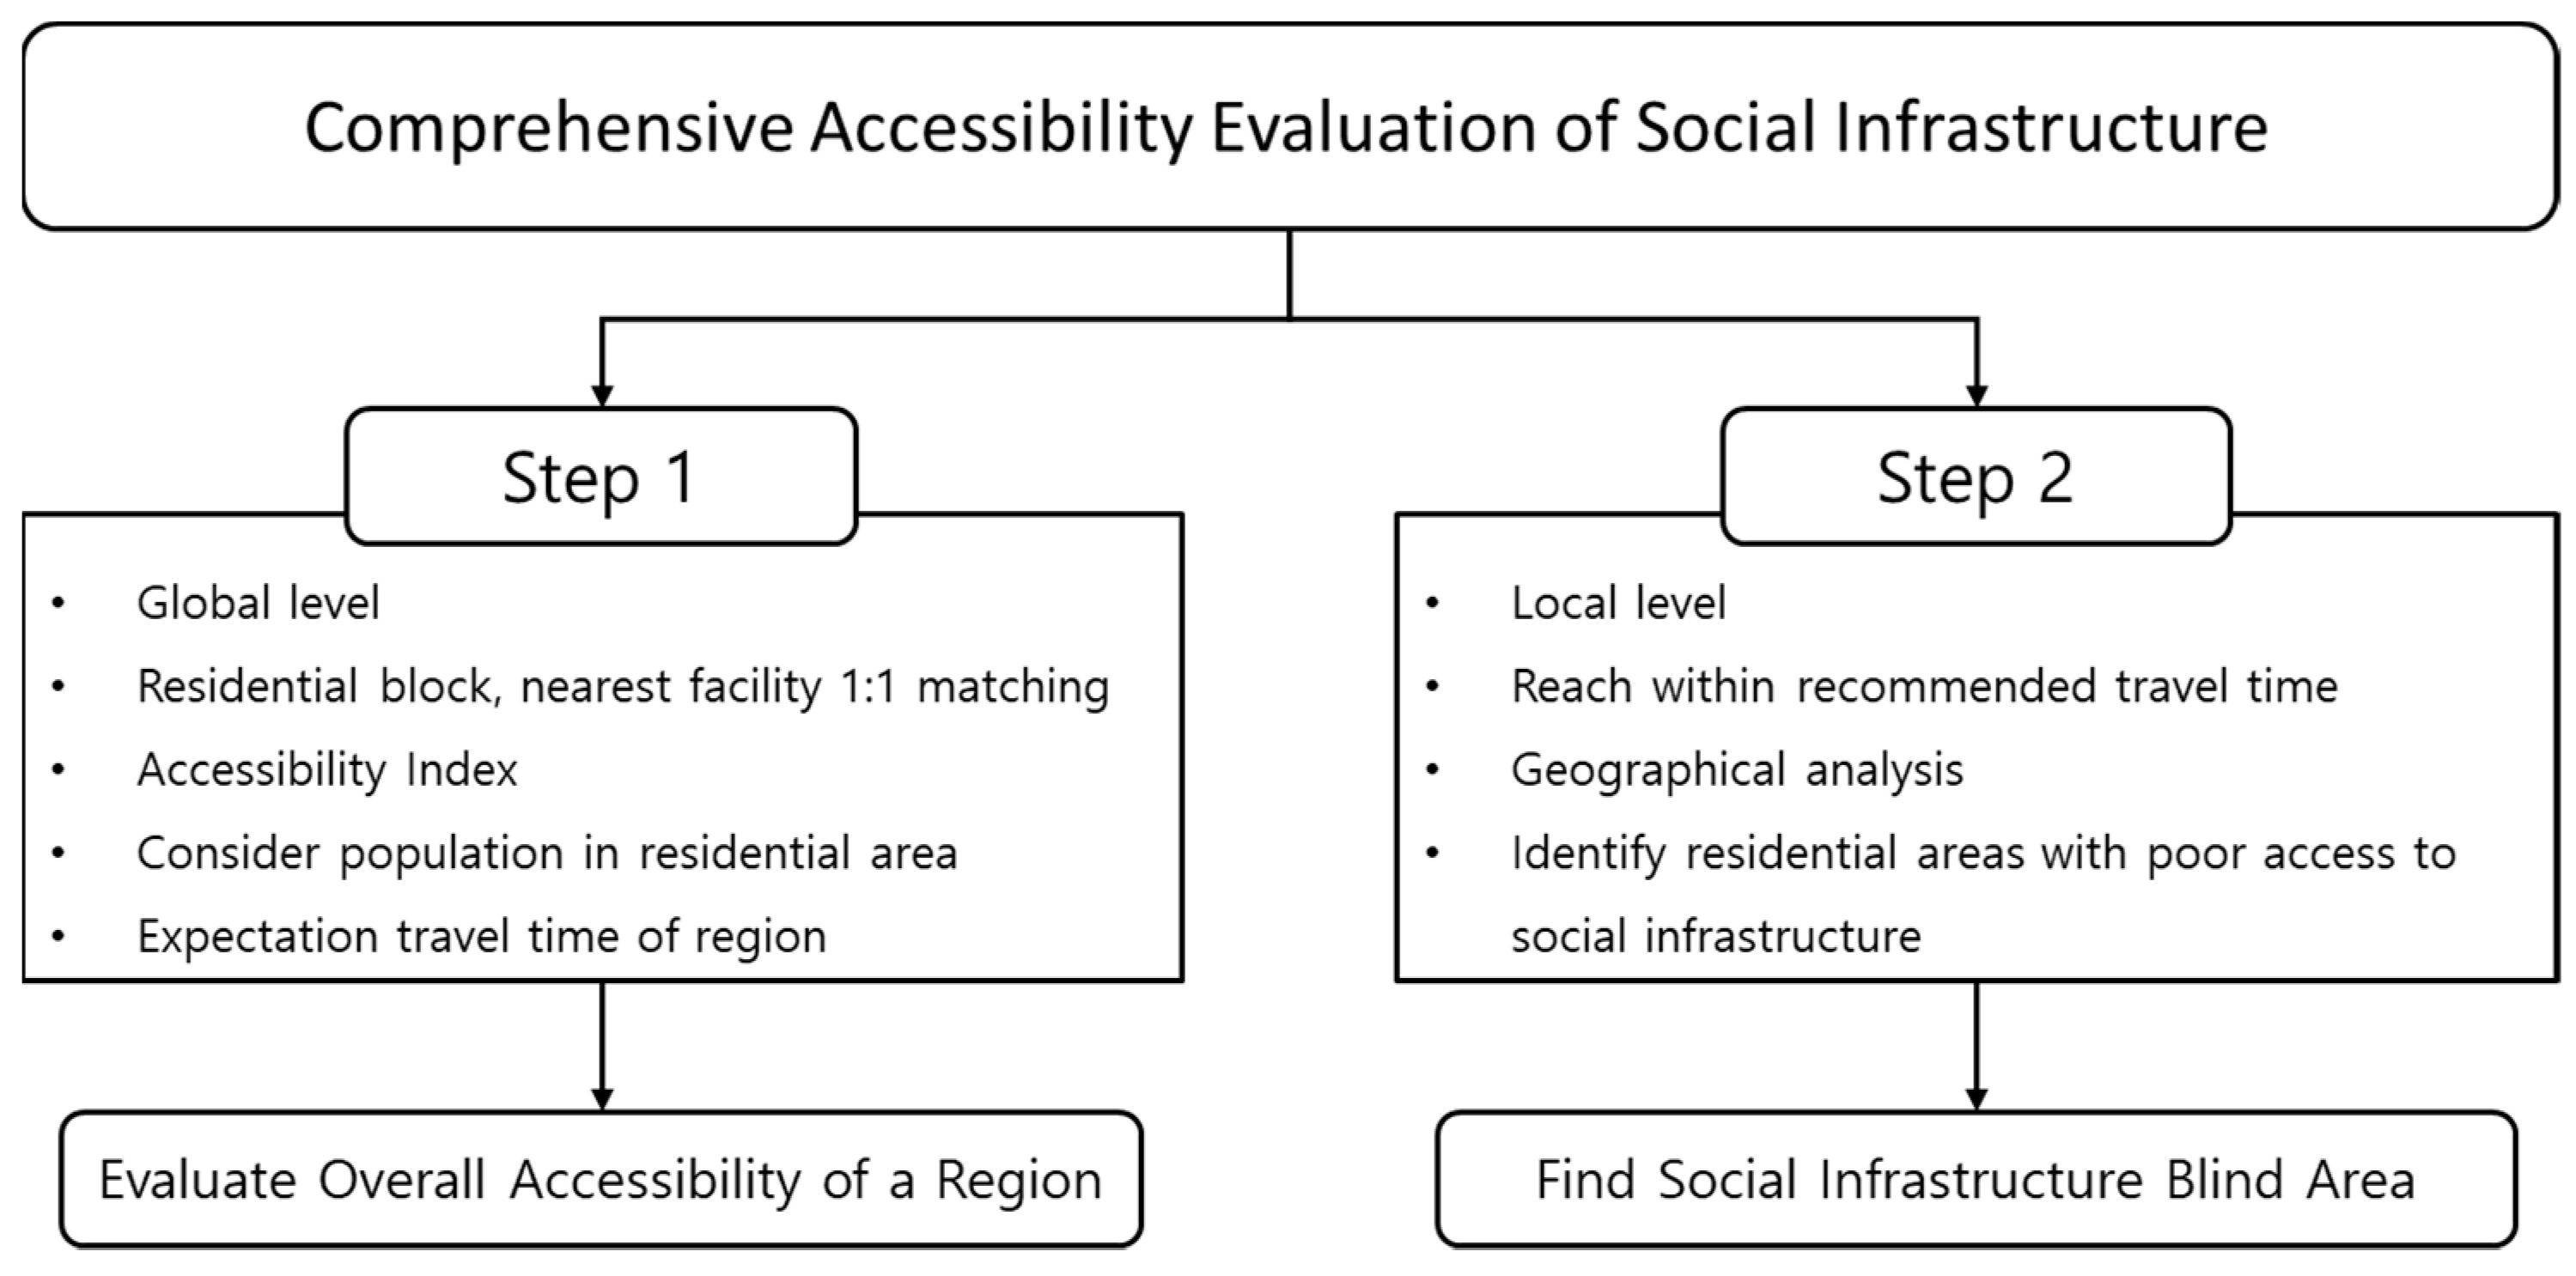
The present study proposes a comprehensive evaluation method for social infrastructure planning regarding accessibility, as shown in Figure 1. This method consists of two steps: (1) evaluating the overall accessibility of social infrastructure in a region such as a neighborhood (town) or city by computing the Accessibility Index (AI) and (2) identifying the social infrastructure “blind area” of the region. AI is an index representing accessibility to a region’s social infrastructure. A social infrastructure blind area is a residential area with poor access to social infrastructure. The overall research process was conducted using Geographic Information Systems (GIS). Data collection, manipulation (such as joining the spatial and non-spatial data), spatial-query analysis, and spatial display were performed using GIS. In addition, a navigation application programming interface (API) was employed to calculate the walking time and vehicle travel time between a residence and a social infrastructure facility.
The social infrastructure facilities investigated in this study are elementary schools, parks, childcare facilities, kindergartens, sports facilities, and libraries. Elementary schools, neighborhood parks, childcare facilities, kindergartens, neighborhood sports facilities, and neighborhood libraries are town-level facilities that citizens can generally use within walking distance. City parks, city sports facilities, and city libraries are city-level facilities relatively more extensive than the town-level facilities, and citizens usually drive to use them. The reasons for setting up the research facilities are as follows: First, these facilities are usually provided and operated mainly by the public; thus, more careful planning is required. Second, we selected the facilities that can guarantee data reliability. Data on the information of facilities, such as usage, size, and location, were obtained through local governments. Finally, the proposed method was applied to a real case in Namdong-gu, Incheon, South Korea.
2. Accessibility
Accessibility, which is mainly measured by travel distance or travel time, can be calculated using various methods. First, buffer analysis is a method of evaluating an area within which access is good based on the boundaries created by a set of points within a specific distance based on a facility. Lim et al. [10]. analyzed the accessibility of natural green spaces and urban parks according to the income-class factors in South Korea. GIS buffer analysis was used to measure the accessibility of local green spaces and urban parks. Ashiagbor et al. [11] measured the accessibility of healthcare facilities in Ashanti, Ghana. They identified the accessible areas using buffer analysis around the healthcare facilities. Wang et al. [12] used buffer analysis to measure the accessibility score of care facilities by residents in residential care facilities in Guangzhou, China.
Second, network analysis in GIS has been used to measure accessibility. For example, Islam and Aktar [13] proposed measuring the accessibility to health services in Khulna, Bangladesh. The travel time-based accessibility measurement method was proposed by computing the average travel time to the nearest hospital using various modes of transportation. Chen et al. [14] and Hu et al. [15] used the two-step floating catchment area to measure the accessibility of healthcare services and urban parks. The distance was measured using road network analysis to calculate the accessibility.
Finally, the navigation API has been recently used for accessibility calculation. Several studies have been performed using navigation API, such as using Google Maps to calculate the travel time. Wang and Xu [16] compared the travel time provided by Google Map Navigation API, which was calculated using the road network provided by the GIS software. Their study proved that the navigation API of Google Maps provided more accurate results than the road network analysis using the GIS software. Haitao et al. [17] used the Google Maps navigation API to develop a method of measuring the Beijing public transportation accessibility.
The travel time calculated using buffer analysis or network analysis in GIS may not be accurate because it does not reflect the actual resistance, such as the crosswalks and slopes of walkways. However, the travel time provided by a navigation API is more accurate because it can reflect various resistances on the roads. Therefore, navigation API was employed to calculate the travel time to social infrastructure facilities in this study. The navigation API has not been used for the accessibility calculation of social infrastructure planning in South Korea.
3. Methodology
3.1. Social Infrastructure Planning
This paper deals with social infrastructure planning issues. Social infrastructure planning authorities want to know where the social infrastructure is vulnerable because they have a limited budget and need to prioritize their investment. They want to determine where to place the social infrastructure facilities and the capacity of those facilities. As previously mentioned, there have been two approaches to social infrastructure planning: (1) population-based approach and (2) access-based approach. The main problem with the population-based approach is that new suburbs are not serviced with social infrastructure until a residential population gets large enough. This is a problem in suburban areas with low population densities, promoting deprivation amplification [18]. There is no indication of maximum distances to social infrastructure services or the size of catchment areas in a population-based approach.
The access-based approach is a relatively recent concept. Accessibility is also one factor determining a suitable location for green infrastructure and defining future scenarios of public space in cities [19,20]. The so-called ‘20-min neighborhood’ concept gives people the ability to fulfill most of their day-to-day life within 20 min of walking from home, and access to safe biking and local transportation options [21]. These communities are planned using strategic planning guidelines that incorporate maximum distances or maximum time as the basis for social infrastructure provision. The planning strategy ensures that urban areas have good access to social services.
However, it is not easy to find explicit methods for implementing such strategies. Social infrastructure planning authorities need to know where to place social infrastructure facilities. To this end, authorities first need to know where social infrastructure is vulnerable. Therefore, this study suggests a method to comprehensively evaluate neighborhoods or cities regarding accessibility and identify blind spots in social infrastructure.
3.2. Accessibility Index
The accessibility index is mainly used to evaluate the overall accessibility of a region. For example, Witten et al. created buffers along with road networks to develop a neighbor destination accessibility index for urban facilities and services in four cities in New Zealand and developed an accessibility index using the weighting facilities in the buffer [22]. Haitao et al. computed the accessibility index for the transit point of public transportation. They divided the entire region into cells and defined the average distance of the accessible transfer points from the cell’s center point within the cell as the accessibility index [17]. Matachowski et al. calculated the accessibility index for a comparative study of public service accessibility in Warsaw, Poland. The accessibility index was calculated by giving one point for kindergartens, two points for elementary schools, and three for high schools [23]. Lotfi and Koohsari divided the accessible distance range into three categories: shorter than 800 m, 800 m–1200 m, and longer than 1200 m to calculate the accessibility index considering the population of the census blocks [24]. Ashik et al. computed the accessibility index with population proportion and distance for spatial equity of urban facilities [25]. de Alba-Martinez et al. defined access to sustainable transport from university index using total nodes and routes weighted by attractiveness at service areas [26].
This study defines the accessibility index (AI) as shown in Equation (1). AI in a neighborhood is calculated using Equation (1), where is the AI of th-neighborhood in a city, is the total population of the city, is the population of the th residential block (RB) in -neighborhood, and is the travel time between the RB and nearest social infrastructure facility. Thus, AI represents the population-weighted expected travel time (mathematical expectation) required to reach a social infrastructure facility in a town. For example, when AI for a library of a town is 4.3 min, the town’s citizens need an average of 4.3 min to get to a library.
3.3. Data
ArcGIS [27] as GIS software was used in this study to create spatial data, connect (join) the spatial and attribute data, identify the nearest social infrastructure facility from a residential block (RB), and for spatial query. First, the census shapes were processed to create RBs. Second, the population data were combined with the associated RB spatial feature. Third, the spatial data, including the coordinates of social infrastructure facilities, were created. Fourth, we obtained the travel time between the RBs and infrastructure facilities using the navigation API.
3.3.1. Spatial Data
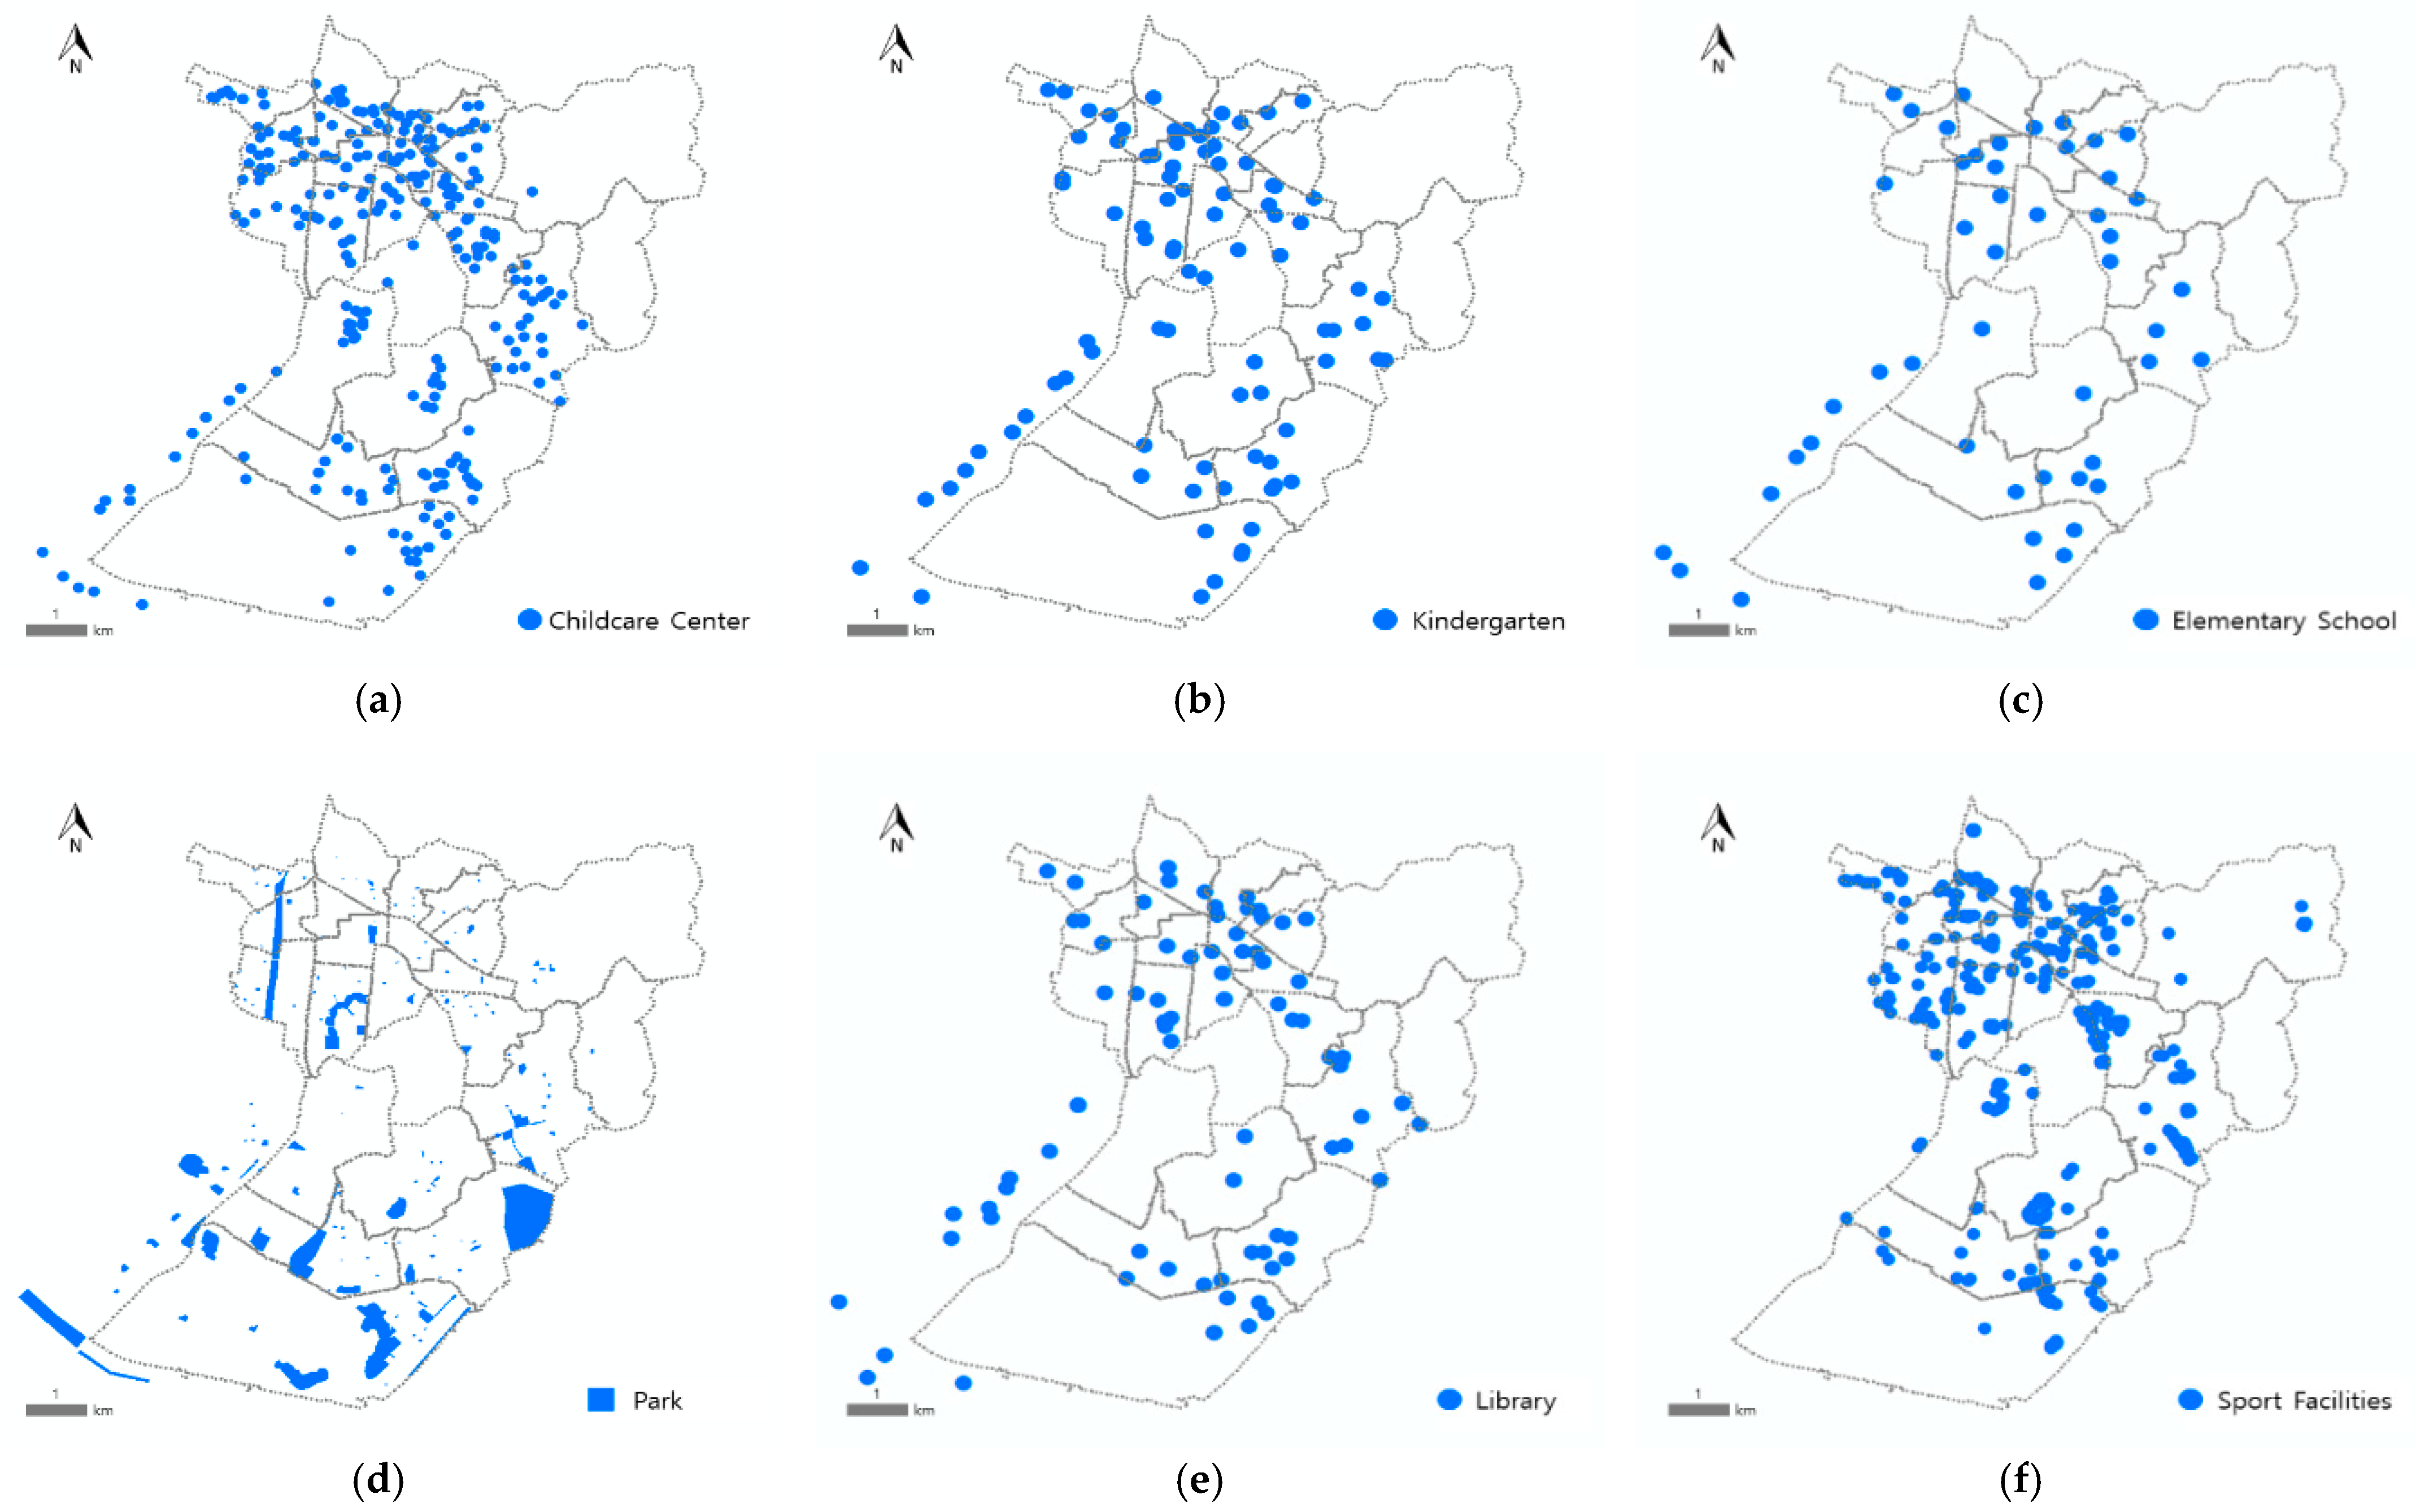
Namdong-gu (Namdong District), Incheon Metropolitan City, South Korea, was selected as the case study area. Namdong-gu (Namdong District) has 22 administrative dongs, the smallest urban-area division in South Korea with its own office and staff. The walking or vehicle travel time between the RBs and social infrastructure facilities was required to compute the AI. The RBs and social infrastructure facilities in Namdong-gu were created as spatial features in the GIS environment (Figure 2 and Figure 3). The population data obtained from National Spatial Data Infrastructure Portal were combined with the corresponding spatial feature [28].
We obtained the location information of the infrastructure facilities from the administrative office [29]. Information about the childcare centers and kindergartens was collected from Child School Info [30]. Then, we created spatial features of the social infrastructure facilities as polygons for parks and as points for the others. Table 1 lists the data sources and data types by facility.
3.3.2. Travel Time Calculation Using Navigation API
The walking and vehicle travel times from the RBs to the social infrastructure facilities were calculated using the navigation API (T-map API). T-Map, which was provided by SK Telecom in South Korea, is a commercial navigation system similar to the Google navigation system. The origin and destination information are needed to calculate the travel time. The nearest destination facility from each origin RB was identified in GIS. Then, the travel time was calculated via the navigation API and added to the attribute table of the corresponding RB spatial features for further analysis.
T-map API provides a function to calculate the distance and time traveled by walking and riding vehicles. We needed to automate the travel time calculation because many combinations of origin and destination (RBs and infrastructure facilities) are possible. Therefore, this study automated T-map API using Java8.1 and Javascript-based programming. This customized code extracted data on the origin and destination, such as origin longitude, origin latitude, destination longitude, and destination latitude, from the RB spatial features combined with the nearest facility data. The extracted data were sent to T-map API to obtain the path-search results of travel distance (unit: meter), travel time (unit: second) between the origin and destination. According to the abovementioned process, the distance and travel time between the RBs and social infrastructure facilities were obtained.
3.4. Identifying Social Infrastructure Blind Spot
AI provides an indicator for evaluating a region in terms of population-weighted average travel time to social infrastructure. However, an AI of 10 does not mean that every resident in the region has access to a social infrastructure facility in 10 min because AI is only a representative average value. Some RBs may have AIs that exceed 10 min and some less than 10 min. We performed a spatial query to find RBs that have poor access. We used the national recommendation time as a criterion for determining good access and poor access (Table 2).
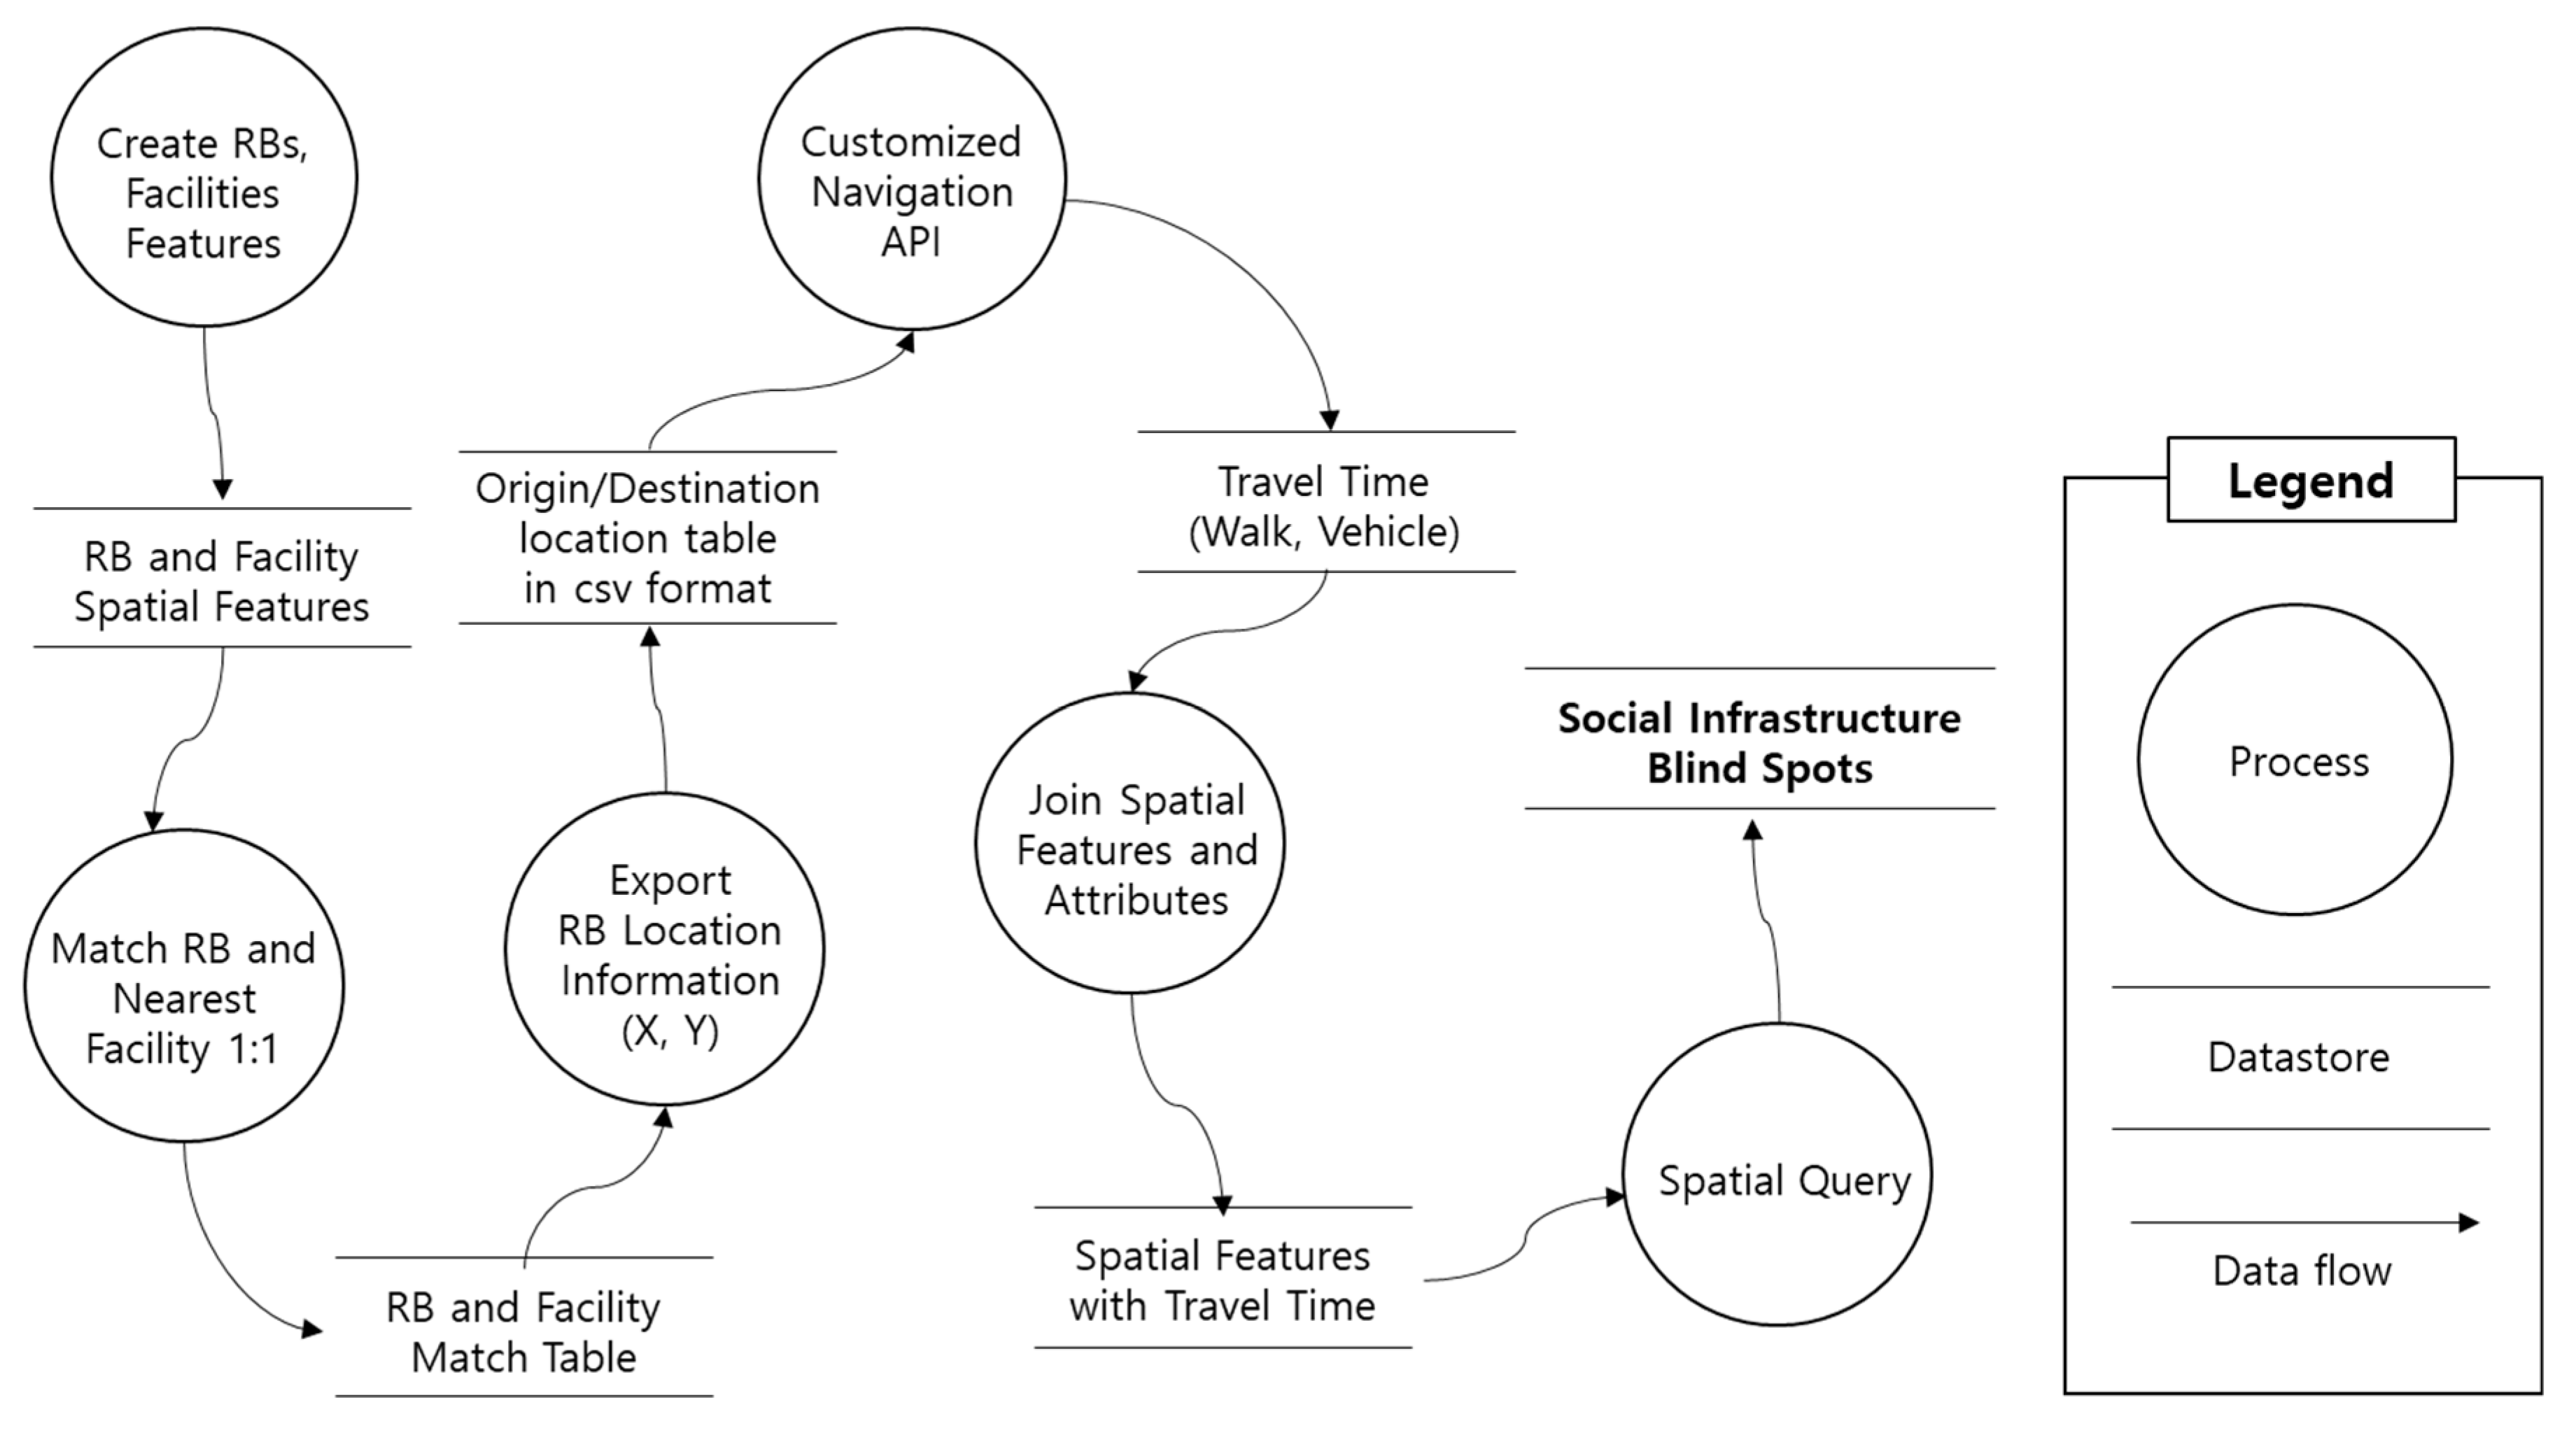
As described above, the attribute table of each RB contains the travel time and distance to the nearest social infrastructure. Therefore, we can identify social infrastructure blind spots by a spatial query. Figure 4 is the data flow diagram that shows the process and data flow to identify social infrastructure blind spots. A data flow diagram describes how data is processed by a system in terms of inputs and outputs. A circle represents a process that transforms incoming data flow into outgoing data flow. Two horizontal straight lines represent datastores; arrows show the flow of data. For example, the ‘Customized Navigation API’ process receives the ‘Origin/Destination location table in a csv format’ and outputs the ‘Travel Time (Walk, Vehicle)’ table.
4. Results
4.1. AI
Table 3 lists the AIs of the dongs in Namdong-gu for social infrastructure facilities that citizens can access by walking. The Namdong-gu AIs were 6.8, 4.2, 4.2, 3.5, 6.0, and 7.1 min for libraries, parks, sports facilities, childcare centers, kindergartens, and elementary schools, respectively. The average AIs were 8.5, 4.3, 5.1, 4.3, 7.2, and 8.4 min for libraries, parks, sports facilities, childcare centers, kindergartens, and elementary schools, respectively. All average AIs were less than 10 min, which demonstrated that accessibility by walking to the social infrastructure facilities in Namdong-gu is generally good. However, the difference between the minimum and maximum values, which were 21.1, 11.2, 25.5, 22.3, 25.8, and 25.6 min, respectively, were considerable.
The interesting thing was that the Unyeon-dong AIs were the highest for all facility types. This is because most areas in Unyeon-dong are mountains, vacant lots, and subway stations and their subsidiary facilities. Except for industrial complexes, few RBs and commercial stores exist; thus, Unyeon-dong demonstrated the highest AIs for all types of social infrastructure facilities. In addition, the AIs of Jangsu-dong for libraries, kindergartens, and elementary schools were higher than the average. This is because only 4678 people (0.9%), which accounts for a tiny portion in Namdong-gu, live in Jangsu-dong. In addition, Jangsu-dong has a large public park and sports facilities. Further, private alternative schools are available for children with developmental disabilities. On the other hand, we found that the AIs in Namchon-dong for libraries and Mansu 4-dong for kindergartens were relatively high.
Table 4 lists the AIs for social infrastructure facilities that citizens can access by vehicle. The AIs of Namdong-gu were 5.4, 7.0, and 5.2 min for city libraries, city parks, and sports facilities, respectively. The average AIs were 5.6, 7.3, and 5.1 min for city libraries, city parks, and sports facilities, respectively. Similar to the accessibility by walking, all average AIs were found to be reasonable. This result shows that the accessibility by vehicle to social infrastructure facilities in Namdong-gu satisfies national recommendations. Ganseok3-dong demonstrated the lowest AI of 1.8 min for city libraries, whereas Nonheon2-dong showed the highest AI of 9.8 min. Guwol1-dong residents need 2 min and Ganseok4-dong residents need 17.7 min to access city parks. The differences between the minimum and maximum values were 8, 15.7, and 7.3 min for city libraries, city parks, and sports facilities, respectively.
4.2. RBs with Poor Access to Social Infrastructure
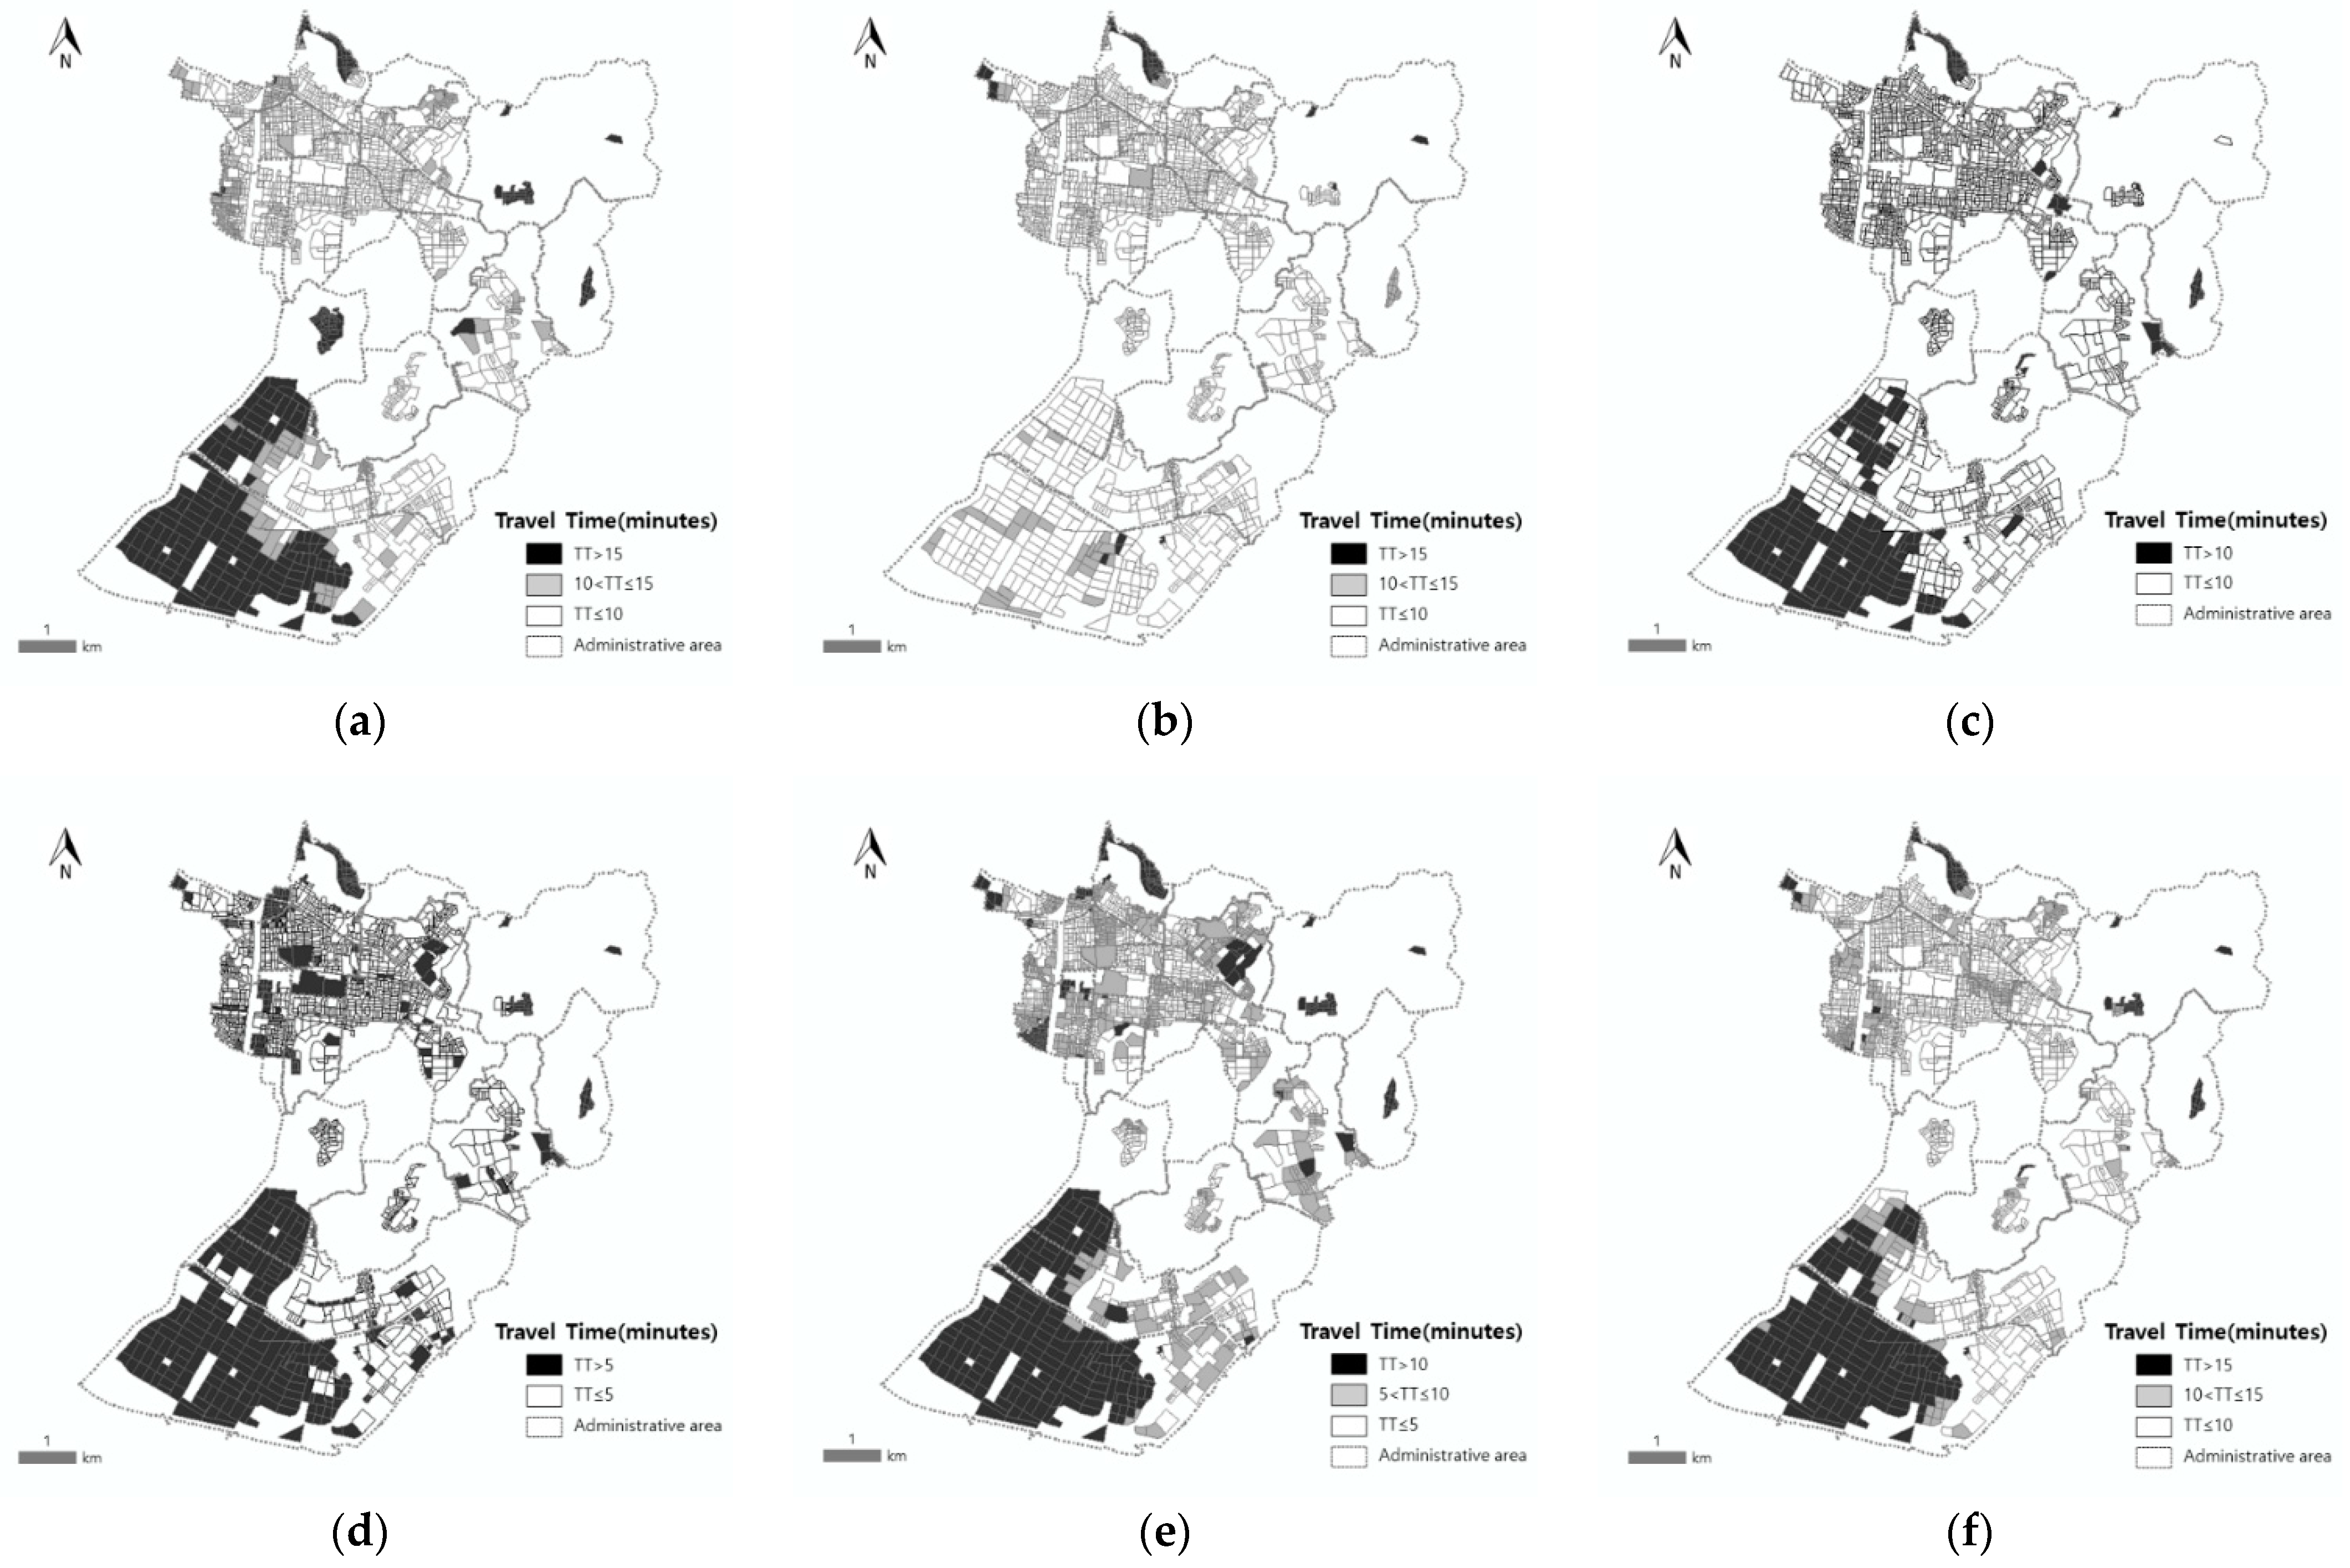
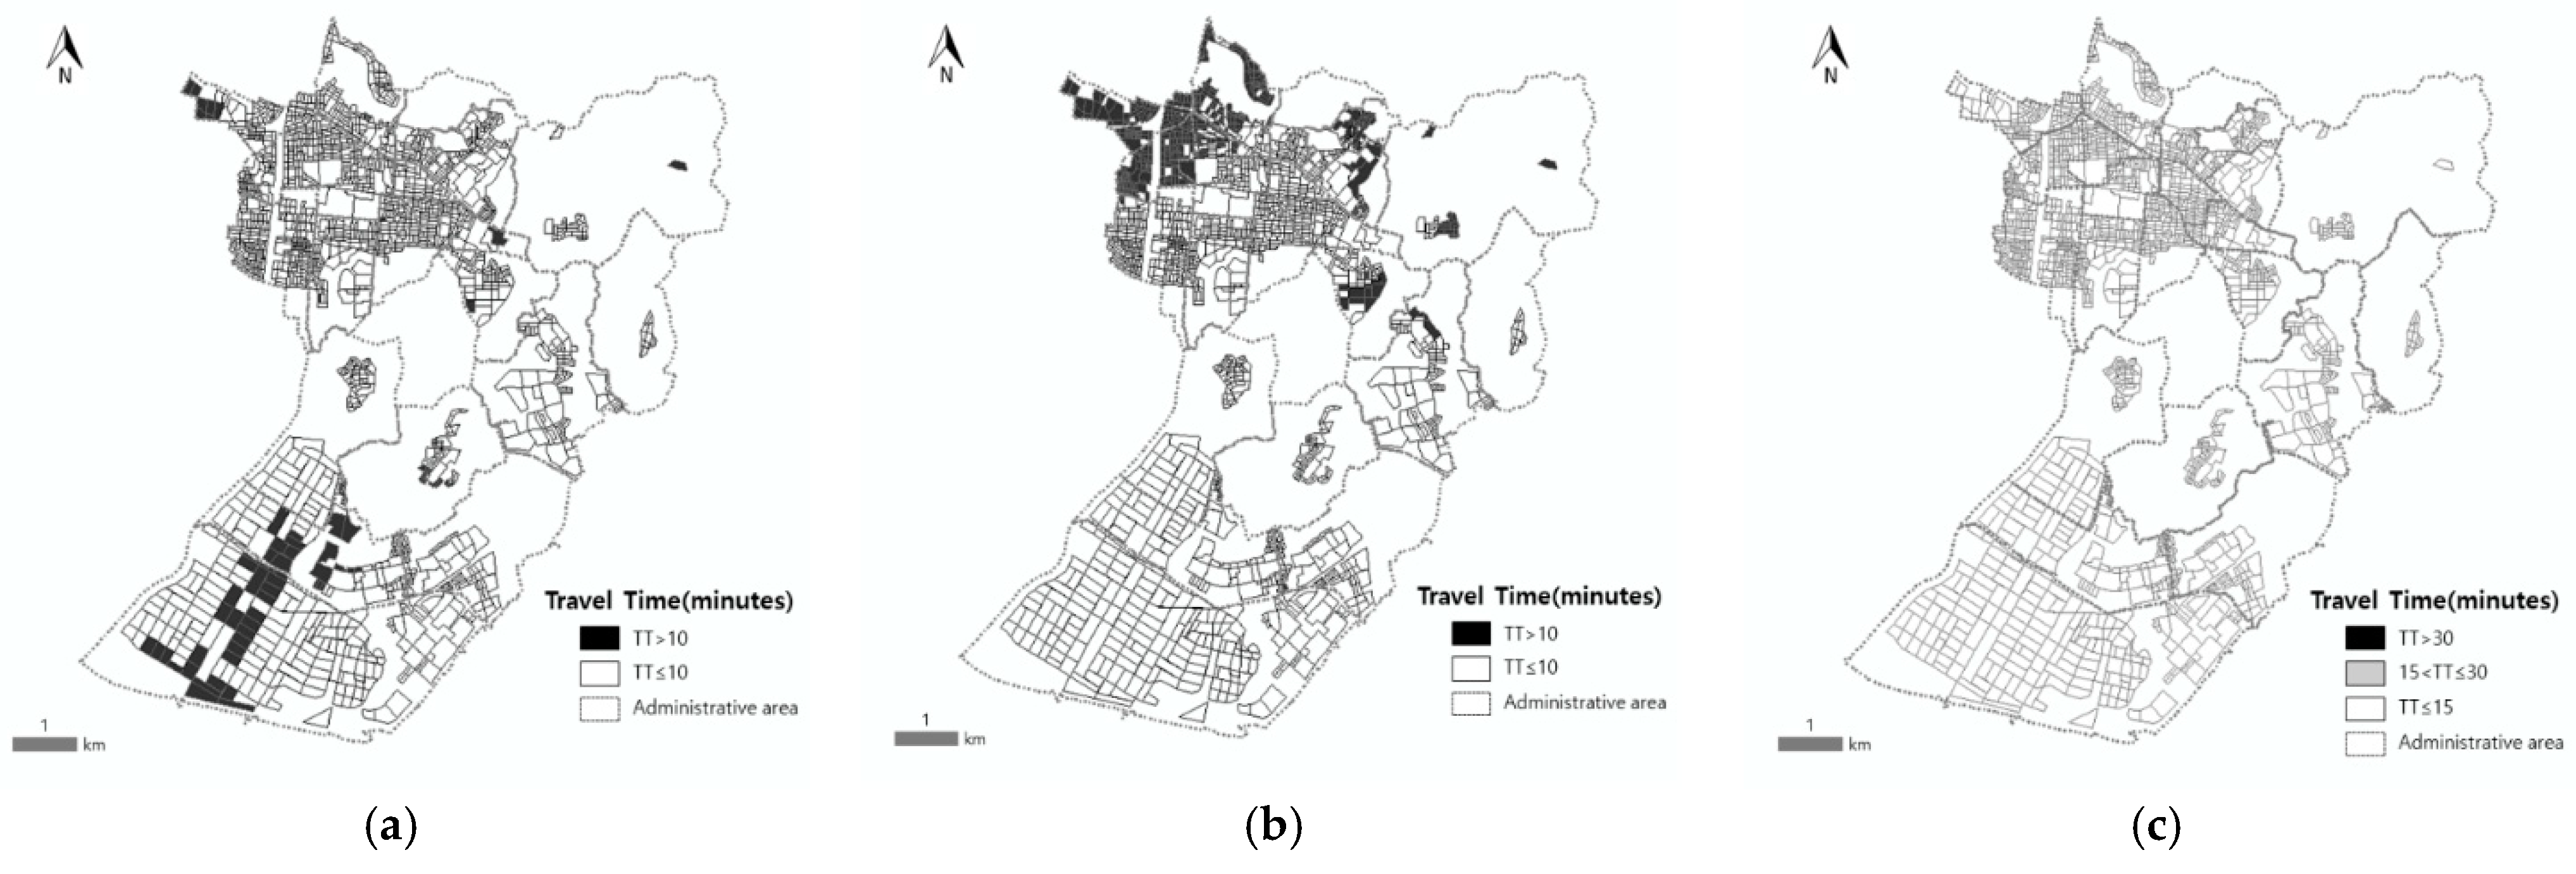
A spatial query was performed to identify RBs with poor accessibility, considered as social infrastructure blind spots (Figure 5 and Figure 6). As mentioned above, we used the South Korean national recommended travel time. For example, KMoLIT recommended less than 5 min to reach a childcare facility from home. RBs that could reach childcare facilities within 5 min are indicated in white, and those that could not are indicated in black. On the other hand, the national recommendations for elementary schools are 10 to 15 min. Therefore, RBs with a travel time between 10 and 15 min are colored in gray, those less than 10 min in white, and those greater than 15 min in black. Table 5 lists the population for each category in the national recommendations.
In total, 82% of the population requires less than 10 min to access the library, 13% need between 10 and 15 min, and 5% exceed 15 min. On the other hand, 99.6% of the population has good access, whereas 0.4% in Namdong-gu has poor access to a park by walking. In the cases of childcare facilities and kindergartens, 111,429 people (21%) and 53,061 (10%), respectively, live in childcare service blind spots. Furthermore, 4% of Namdong-gu live in sports facility service blind spots, and 10,612 people (2%) live in spots with poor access to elementary schools.
Table 6 shows the population and proportion of residents with poor access and good access to the city libraries, city parks, and sports facilities by vehicles. In total, 95% of the population has good access to the city libraries, while 5% has poor access, requiring longer than 15 min to reach a library. In the case of the sports facility, no residents were living in blind spots. Accessibility to the city libraries and sports facilities was found to be excellent. On the other hand, 77% of the population spends within 10 min of travel time to access the city parks, and 23% spend longer than 10 min.
5. Discussions
From the results, we can evaluate the overall accessibility of social infrastructure for residents. From the AIs, we found that neighborhood libraries are needed in Unyeon-dong, Jangsu-dong, and Namchon-dong. For example, the residents in Unyeon-dong spend 24.7 min on average to use neighborhood libraries. As previously mentioned, the South Korean government recommends 10 to 15 min to reach a neighborhood library from home. In particular, Unyeon-dong demonstrated poor accessibility in most facility types, such as parks, sports facilities, and childcare centers. Jangsu-dong also has poor accessibility to kindergartens and elementary schools. It was found that more kindergartens should be built in Mansu4-dong to improve accessibility.
Most of the dongs in Namdong-gu had satisfactory AIs for city-level facilities. They have reasonable accessibility to city libraries, city parks, and sports facilities. However, the AIs show that Ganseok1-dong, Ganseok2-dong, Ganseok4-dong, and Jangsu-dong have poor accessibility to city parks. Therefore, the Namdong-gu authorities should consider city parks first among city libraries, city parks, and sports facilities for social infrastructure planning.
As shown in the social infrastructure blind maps in Figure 5, it was found that residents in the left bottom area of Namdong-gu have poor access to libraries, sports facilities, childcare centers, kindergartens, and elementary schools. This is because there are industrial complexes in the area. In this case, it is necessary to interpret the map carefully. For city-level facilities, the left bottom area of the map shows poor access to city libraries (Figure 6a), whereas the top area of the map shows poor accessibility to city parks (Figure 6b). Therefore, urban planners should consider geographical and social situations. For example, the type of facilities that residents mainly use may vary depending on the age distribution of the residents. Parks and libraries are facilities for all ages, while kindergartens, elementary schools, and childcare centers are facilities for specific ages.
The comprehensive accessibility evaluation method proposed in this study provides the following advantages:
- The travel time used in this study was obtained by navigation API that provided more accurate travel time and distance than those by any other tools. Therefore, the results in this study are closer to the actual value. This has not been attempted in the field of social infrastructure planning. Most previous studies used distance as access data [17,22,25]; however, the travel time may be different even at the same distance, especially in cities.
- The AI is easy to understand because it represents an intuitive index for the overall accessibility in minutes of a region. Accessibility index in a score is difficult to understand and to use to set a goal, even if the relative comparison is possible [23,24,25,31]. Therefore, urban planners can understand and compare the overall accessibility to social infrastructure and identify regional gaps.
- This study suggested a method to identify the residential areas with poor access to social infrastructure and compute the population residing in those areas. The method was applied to an actual case to validate the applicability. The results showed that the method effectively identified residential areas with poor access to social infrastructure. This result can help authorities establish social infrastructure planning when determining which facilities to supply to which area.
- The two-step evaluation method presented in this study provides a comprehensive understanding of the social infrastructure accessibility of a region. Previous studies have often been limited to global evaluation by computing accessibility indices of cities or neighborhoods and showing them on a map [17,22,23,25,31]. However, this study includes not only global evaluation, but also individual residential block-level analysis based on the same database.
The limitations of this study are as follows. First, we only dealt with accessibility to social infrastructure on the assumption that the capacity of the facilities is sufficiently satisfied. However, the capacity that represents the facility’s size, such as a park area and the number of library seats, should also be considered when social infrastructure planning. Second, we assumed that residents use only facilities located in the study area, Namdong-gu. However, residents living near the administrative boundary can use facilities outside the study area. Third, the shortest linear distance was used to match an RB and the nearest facility at a ratio of 1:1. In this case, the distance may be the closest, but the travel time may not be the shortest.
6. Conclusions
State and local government planning authorities provide the master plan for social infrastructure service provision. These plans have been delivered based on a minimum population threshold approach for social infrastructure planning. However, recent cities are suggesting strategies to establish social infrastructure planning based on accessibility. For example, in the Metropolitan Melbourne Strategic Plan, the Victorian government provides a vision for a 20-min neighborhood based on a proximity or accessibility approach [21].
This study proposed a method to evaluate neighborhoods or cities based on an accessibility approach comprehensively. AI was defined as the population-weighted expected travel time required to reach a social infrastructure facility. Urban planners can compare the overall accessibility to social infrastructure and identify regional gaps as AI provides an indicator for evaluating a region in terms of overall accessibility. This study also suggested a method to identify the residential areas with poor access to social infrastructure. The case study results can help planning authorities establish social infrastructure planning when prioritizing investment of social infrastructure.
Author Contributions
Conceptualization, H.Y. and S.K. (Sanghyeok Kang); methodology, H.Y. and S.K. (Sanghyeok Kang); software, S.K. (Sungpyo Kim) and H.Y.; investigation, H.Y. and S.K. (Sanghyeok Kang); data curation, S.K. (Sungpyo Kim) and H.Y.; writing—original draft preparation, H.Y. and S.K. (Sanghyeok Kang); writing—review and editing, S.K. (Sanghyeok Kang); visualization, S.K. (Sungpyo Kim); supervision, S.K. (Sanghyeok Kang); funding acquisition, S.K. (Sanghyeok Kang). All authors have read and agreed to the published version of the manuscript.
Funding
This research was funded by Incheon National University research fund in 2018.
Institutional Review Board Statement
Not applicable.
Informed Consent Statement
Not applicable.
Conflicts of Interest
The authors declare no conflict of interest.
References
- United Way of Greater Toronto and Canadian Council on Social Development. Poverty by Postal Code: The Geography of Neighbourhood Poverty, 1981–2001; United Way of Greater Toronto: Toronto, ON, Canada, 2004. [Google Scholar]
- Cronin, B. Guide to Social Infrastructure Planning; Wyndham City Council: Wyndham, VIC, Australia, 2009.
- City of Melbourne. Community Infrastructure Development Framework; City of Melbourne: Melbourne, Australia, 2014.
- Bundesministerium für Verkehr und digitale Infrastruktur. Regionalstrategie Daseinsvorsorge: Leitfaden für die Praxis; Bundesministerium für Verkehr und digitale Infrastruktur: Berlin, Germany, 2016.
- London Plan Team. The Draft London Plan; London Plan Team: London, UK, 2019.
- MLIT (Ministry of Land Infrastructure, Transport and Tourism, Japan). Guidelines for Effective Use of Public Real Estate (PRE) for Community Development; MLIT: Tokyo, Japan, 2014.
- Barton, H.; Tsourou, C. Healthy Urban Planning in Practice: Experience of European Cities; WHO Regional Office for Europe: Copenhagen, Denmark, 2000. [Google Scholar]
- Seong, E.Y.; Lim, Y.K.; Lim, H.S. Accessibility and Availability of Neighborhood Facilities in old Residential Area. In All Public Information In-One; Architecture & Urban Research Institute: Sejong-si, Korea, 2013; pp. 1–151. [Google Scholar]
- Ministry of Land, Infrastructure and Transportation. National City Regeneration Basic Policy Partial Revision (Social Infrastructure Revision of National Minimum Standards); Notice No. 2018-1790; Ministry of Land, Infrastructure and Transportation: Sejong-si, Korea, 2018.
- Lim, Y.-R.; Chu, J.-M.; Shin, J.-Y.; Bae, H.-J.; Park, C.-S. Analysis on the Accessibility to Natural Greenspace and Urban Parks by Income Class Factors-Focusing on Seongnam-si, Gyeonggi-do. J. Korea Plan. Assoc. 2009, 44, 133–146. [Google Scholar]
- Ashiagbor, G.; Ofori-Asenso, R.; Forkuo, E.K.; Agyei-Frimpong, S. Measures of geographic accessibility to health care in the Ashanti Region of Ghana. Sci. Afr. 2020, 9, e00453. [Google Scholar] [CrossRef]
- Wang, D.; Qiao, C.; Liu, S.; Wang, C.; Yang, J.; Li, Y.; Huang, P. Accessibility of Spatial Accessibility to Residential Care Facilities in 2020 in Guangzhou by Small-Scale Residential Community Data. Sustainability 2020, 12, 3169. [Google Scholar] [CrossRef] [Green Version]
- Islam, M.S.; Aktar, S. Measuring physical accessibility to health facilities—A case study on Khulna City. World Health Popul. 2011, 12, 33–47. [Google Scholar] [CrossRef] [PubMed]
- Chen, B.Y.; Cheng, X.-P.; Kwan, M.-P.; Schwanen, T. Evaluation Spatial Accessibility to Healthcare Services under Travel time Uncertainty: A reliability-based floating catchment area approach. J. Transp. Geogr. 2020, 87, 102794. [Google Scholar] [CrossRef]
- Hu, S.; Song, W.; Li, C.; Lu, J. A multi-mode Gaussian-based two-step floating catchment area method for measuring accessibility of urban parks. Cities 2020, 105, 102815. [Google Scholar] [CrossRef]
- Wang, F.; Xu, Y. Estimating O-D Travel Time Matrix by Google Maps API: Implementation, Advantages and Implications. Ann. GIS 2011, 17, 199–209. [Google Scholar] [CrossRef]
- Jin, H.; Jin, F.; Hao, Q.; Zhu, H.; Yang, X. Measuring Public Transit Accessibility Based on Google Direction API. Open Transp. J. 2019, 13, 93–100. [Google Scholar]
- Macintyre, S. Deprivation amplification revisited; or, is it always true that poorer places have poorer access to resources for healthy diets and physical activity? Int. J. Behav. Nutr. Phys. Act. 2007, 4, 32. [Google Scholar] [CrossRef] [PubMed] [Green Version]
- Rodríguez-Espinosa, V.M.; Aguilera-Benavente, F.; Gómez-Delgado, M. Green infrastructure design using GIS and spatial analysis: A proposal for the Henares Corridor (Madrid-Guadalajara, Spain). Landsc. Res. 2020, 45, 26–43. [Google Scholar] [CrossRef]
- Vukmirovic, M.; Gavrilovic, S.; Stojanovic, D. The Improvement of the Comfort of Public Spaces as a Local Initiative in Coping with Climate Change. Sustainability 2019, 11, 6546. [Google Scholar] [CrossRef] [Green Version]
- Victoria State Government. Plan Melbourne 2017–2050. In Metropolitan Planning Strategy; Victoria State Government: Melbourne, Australia, 2017. [Google Scholar]
- Witten, K.; Pearce, J.; Day, P. Neighbourhood Destination Accessibility Index: A GIS tool for measuring infrastructure support for neighbourhood physical activity. Environ. Plan. A 2011, 43, 205–223. [Google Scholar] [CrossRef]
- Malachowski, A.; Dabski, M.; Wilk, W. Accessibility of public services in districts of Warsaw a comparative study. Miscellanea Geographica 2020, 24, 176–182. [Google Scholar] [CrossRef]
- Lotfi, S.; Koohsari, M.J. Measuring objective accessibility to neighborhood facilities in the city (A case study: Zone 6 in Tehran, Iran). Cities 2009, 26, 133–140. [Google Scholar] [CrossRef]
- Ashik, F.R.; Mim, F.R.; Neema, M.N. Towards vertical spatial equity of urban facilities: An integration of spatial and aspatial accessibility. J. Urban Manag. 2020, 9.1, 77–92. [Google Scholar] [CrossRef]
- De Alba-Martínez, H.; Grindlay, A.L.; Ochoa-Covarrubias, G. (In)Equitable Accessibility to Sustainable Transport from Universities in the Guadalajara Metropolitan Area, Mexico. Sustainability 2021, 13, 55. [Google Scholar] [CrossRef]
- Environmental Systems Research Institute (ESRI). ArcMAP 10.6.1; ESRI: Redlands, CA, USA, 2018. [Google Scholar]
- National Spatial Data Infrastructure Portal. Available online: http://www.nsdi.go.kr (accessed on 1 May 2020).
- Administrative Office of Namdong-gu. Available online: http://www.namdong.go.kr (accessed on 15 June 2020).
- Child School Info. Available online: http://e-childschoolinfo.moe.go.kr (accessed on 15 June 2020).
- Mavoa, S.; Witten, K.; McCreanor, T.; O’sullivan, D. GIS based destination accessibility via public transit and walking in Auckland, New Zealand. J. Transp. Geogr. 2012, 20, 15–22. [Google Scholar] [CrossRef]
Figure 1.
Comprehensive accessibility evaluation of social infrastructure.

Figure 2.
RBs in Namdong-gu, Incheon: (a) residential blocks in polygon features; (b) residential blocks in point features.
Figure 2.
RBs in Namdong-gu, Incheon: (a) residential blocks in polygon features; (b) residential blocks in point features.

Figure 3.
Social infrastructure facility spatial data: (a) childcare centers; (b) kindergartens; (c) elementary schools; (d) parks; (e) libraries; (f) sports facilities.
Figure 3.
Social infrastructure facility spatial data: (a) childcare centers; (b) kindergartens; (c) elementary schools; (d) parks; (e) libraries; (f) sports facilities.

Figure 4.
Data flow diagram to find social infrastructure blind spots.

Figure 5.
Maps of residential areas with poor access—walking time: (a) library; (b) park; (c) sports facility; (d) childcare center; (e) kindergarten; (f) elementary school.
Figure 5.
Maps of residential areas with poor access—walking time: (a) library; (b) park; (c) sports facility; (d) childcare center; (e) kindergarten; (f) elementary school.

Figure 6.
Maps of residential areas with poor access—vehicle time: (a) city library; (b) city park; (c) sports facility.
Figure 6.
Maps of residential areas with poor access—vehicle time: (a) city library; (b) city park; (c) sports facility.


Table 1.
Data sources and types.
| Data | Source | Spatial Data Type |
|---|---|---|
| Childcare centers | Child School Info [30] | Point |
| Kindergartens | Child School Info [30] | Point |
| Elementary Schools | Administrative Office [29] | Point |
| Parks | Administrative Office [29] | Polygon |
| Libraries | Administrative Office [29] | Point |
| Sports facilities | Administrative Office [29] | Point |
| Residential blocks | Census Shapes [28] | Point, Polygon |
| Population | Census of Population Data [28] | Text |
Table 2.
Travel Time National Recommendation, South Korea.
| Region | Class | Facility | Description | National Recommendation (min) |
|---|---|---|---|---|
| Town (Walki ng) | Learning | Library | Public, Private, Small library | 10~15 |
| Rest | Park | Neighborhood Park | 10~15 | |
| Athletic | Sports facility | Pool, Playground, PE Studio | Less than 10 | |
| Care | Childcare center | Public, Private | Less than 5 | |
| Education | Kindergarten | Public, Private | 5~10 | |
| Elementary school | - | 10~15 | ||
| City (Vehicle) | Learning | City library | Public | Less than 10 |
| Rest | City Park | Over 100,000 | Less than 10 | |
| Athletic | Sports facility | Stadium, Gym, Pool | 15~30 |
Table 3.
AI by dong—walking time.
| Dong | Population | Population (%) | Library (min) | Park (min) | Sports Facility (min) | Childcare Center (min) | Kindergarten (min) | Elementary School (min) |
|---|---|---|---|---|---|---|---|---|
| Ganseok1 | 23,975 | 4.5 | 5.9 | 3.9 | 4.1 | 2.4 | 4.4 | 8.0 |
| Ganseok2 | 23,856 | 4.5 | 7.6 | 5.9 | 3.9 | 5.0 | 6.2 | 8.2 |
| Ganseok3 | 25,616 | 4.8 | 5.9 | 3.7 | 3.8 | 3.6 | 6.7 | 8.0 |
| Ganseok4 | 26,723 | 5.0 | 7.6 | 6.1 | 3.7 | 3.7 | 6.4 | 7.7 |
| Guwol1 | 32,488 | 6.1 | 4.3 | 3.1 | 3.5 | 2.8 | 5.1 | 5.6 |
| Guwol2 | 38,472 | 7.3 | 6.1 | 6.8 | 3.8 | 7.8 | 5.2 | 5.2 |
| Guwol3 | 27,196 | 5.1 | 8.7 | 3.2 | 2.9 | 3.6 | 6.5 | 8.7 |
| Guwol4 | 16,487 | 3.1 | 4.2 | 2.8 | 2.8 | 2.7 | 4.6 | 7.6 |
| Nonhyeon1 | 33,545 | 6.3 | 4.9 | 4.2 | 4.2 | 3.3 | 5.6 | 6.8 |
| Nonhyeon2 | 32,550 | 6.1 | 7.1 | 3.7 | 3.4 | 3.3 | 6.2 | 8.2 |
| Mansu1 | 16,597 | 3.1 | 4.7 | 2.9 | 6.8 | 2.6 | 5.0 | 7.3 |
| Mansu2 | 25,424 | 4.8 | 7.4 | 4.1 | 2.9 | 2.7 | 5.5 | 8.4 |
| Mansu3 | 18,070 | 3.4 | 4.1 | 2.5 | 2.4 | 1.8 | 2.8 | 3.7 |
| Mansu4 | 23,559 | 4.4 | 6.2 | 3.4 | 5.2 | 4.1 | 10.8 | 6.0 |
| Mansu5 | 16,336 | 3.1 | 3.8 | 3.7 | 2.4 | 2.2 | 3.7 | 8.4 |
| Mansu6 | 26,441 | 5.0 | 4.7 | 4.0 | 3.9 | 2.9 | 5.7 | 5.4 |
| Nonhyeon-gojan | 41,503 | 7.8 | 7.1 | 3.2 | 6.3 | 3.1 | 6.3 | 6.5 |
| Dorim | 9550 | 1.8 | 7.1 | 3.5 | 5.1 | 2.1 | 4.7 | 7.8 |
| Seochang | 54,513 | 10.3 | 8.3 | 5.3 | 5.3 | 3.4 | 7.5 | 7.3 |
| Unyeon | 454 | 0.1 | 24.7 | 13.7 | 27.9 | 24.1 | 28.6 | 29.3 |
| Jangsu | 4678 | 0.9 | 24.9 | 2.9 | 4.6 | 5.4 | 16.2 | 16.2 |
| Namchon | 12,538 | 2.4 | 21.0 | 3.0 | 2.4 | 2.2 | 4.3 | 4.6 |
| Min | 454 | 0.1 | 3.8 | 2.5 | 2.4 | 1.8 | 2.8 | 3.7 |
| Max | 54,513 | 10.3 | 24.9 | 13.7 | 27.9 | 24.1 | 28.6 | 29.3 |
| Average | 24,417 | 4.5 | 8.5 | 4.3 | 5.1 | 4.3 | 7.2 | 8.4 |
Table 4.
AI by dong—vehicle time.
| Dong | Population | Population (%) | City Library (min) | City Park (min) | Sports Facility (min) |
|---|---|---|---|---|---|
| Ganseok1 | 23,975 | 4.5 | 3.2 | 12.7 | 5.5 |
| Ganseok2 | 23,856 | 4.5 | 3.9 | 10.2 | 5.1 |
| Ganseok3 | 25,616 | 4.8 | 1.8 | 9.9 | 3.3 |
| Ganseok4 | 26,723 | 5.0 | 7.3 | 17.7 | 6.5 |
| Guwol1 | 32,488 | 6.1 | 5.7 | 2.0 | 5.8 |
| Guwol2 | 38,472 | 7.3 | 4.8 | 5.7 | 6.4 |
| Guwol3 | 27,196 | 5.1 | 4.9 | 6.0 | 8.3 |
| Guwol4 | 16,487 | 3.1 | 4.2 | 2.5 | 3.6 |
| Nonhyeon1 | 33,545 | 6.3 | 6.4 | 4.7 | 5.4 |
| Nonhyeon2 | 32,550 | 6.1 | 9.8 | 3.4 | 6.0 |
| Mansu1 | 16,597 | 3.1 | 7.3 | 4.7 | 4.1 |
| Mansu2 | 25,424 | 4.8 | 4.3 | 9.0 | 5.6 |
| Mansu3 | 18,070 | 3.4 | 3.4 | 6.6 | 6.5 |
| Mansu4 | 23,559 | 4.4 | 6.6 | 9.3 | 2.7 |
| Mansu5 | 16,336 | 3.1 | 4.5 | 4.0 | 4.0 |
| Mansu6 | 26,441 | 5.0 | 7.7 | 9.7 | 2.6 |
| Nonhyeon-gojan | 41,503 | 7.8 | 4.0 | 4.4 | 7.5 |
| Dorim | 9550 | 1.8 | 8.6 | 3.7 | 3.5 |
| Seochang | 54,513 | 10.3 | 5.2 | 6.3 | 4.8 |
| Unyeon | 454 | 0.1 | 6.3 | 9.1 | 6.4 |
| Jangsu | 4678 | 0.9 | 7.0 | 11.6 | 7.1 |
| Namchon | 12,538 | 2.4 | 6.4 | 6.5 | 1.0 |
| Min | 454 | 0.1 | 1.8 | 2.0 | 1.0 |
| Max | 54,513 | 10.3 | 9.8 | 17.7 | 8.3 |
| Average | 24,417 | 4.5 | 5.6 | 7.3 | 5.1 |
Table 5.
Population by legend—walking time.
| Facility Type | National Recommendation (min) | Population | Percent |
|---|---|---|---|
| Library | TT * ≤ 10 | 435,103 | 82% |
| 10 < TT ≤ 15 | 68,980 | 13% | |
| TT > 15 | 26,531 | 5% | |
| Park | TT ≤ 10 | 509,389 | 96% |
| 10 < TT ≤ 15 | 19,102 | 3.6% | |
| TT > 15 | 2122 | 0.4% | |
| Sports Facility | TT ≤ 10 | 509,389 | 96% |
| TT > 10 | 21,225 | 4% | |
| Childcare Center | TT ≤ 5 | 419,184 | 79% |
| TT > 5 | 111,429 | 21% | |
| Kindergarten | TT ≤ 5 | 233,470 | 44% |
| 5 < TT ≤ 10 | 244,082 | 46% | |
| TT > 10 | 53,061 | 10% | |
| Elementary School | TT ≤ 10 | 451,021 | 85% |
| 10 < TT ≤ 15 | 68,980 | 13% | |
| TT > 15 | 10,612 | 2% |
* TT: travel time.
Table 6.
Population by legend—vehicle time.
| Facility Type | National Recommendation (min) | Population | Percent |
|---|---|---|---|
| City Library | TT * ≤ 10 | 504,082 | 95% |
| TT > 10 | 26,531 | 5% | |
| City Park | TT * ≤ 10 | 408,572 | 77% |
| TT > 10 | 122,041 | 23% | |
| Sports Facility | TT ≤ 15 | 530,613 | 100% |
| 15 < TT ≤ 30 | 0 | 0% | |
| TT > 30 | 0 | 0% |
* TT: travel time.
Publisher’s Note: MDPI stays neutral with regard to jurisdictional claims in published maps and institutional affiliations. |
© 2021 by the authors. Licensee MDPI, Basel, Switzerland. This article is an open access article distributed under the terms and conditions of the Creative Commons Attribution (CC BY) license (https://creativecommons.org/licenses/by/4.0/).
Share and Cite
MDPI and ACS Style
Yhee, H.; Kim, S.; Kang, S. GIS-Based Evaluation Method for Accessibility of Social Infrastructure Facilities. Appl. Sci. 2021, 11, 5581. https://0-doi-org.brum.beds.ac.uk/10.3390/app11125581
AMA Style
Yhee H, Kim S, Kang S. GIS-Based Evaluation Method for Accessibility of Social Infrastructure Facilities. Applied Sciences. 2021; 11(12):5581. https://0-doi-org.brum.beds.ac.uk/10.3390/app11125581
Chicago/Turabian StyleYhee, Hayeon, Sungpyo Kim, and Sanghyeok Kang. 2021. "GIS-Based Evaluation Method for Accessibility of Social Infrastructure Facilities" Applied Sciences 11, no. 12: 5581. https://0-doi-org.brum.beds.ac.uk/10.3390/app11125581
Note that from the first issue of 2016, this journal uses article numbers instead of page numbers. See further details here.