
Analyzing and Modeling of Water Transport Phenomena in Open-Cathode Polymer Electrolyte Membrane Fuel Cell


1
Department of Mechanical Engineering, Chonnam National University, Gwangju 61186, Korea
2
School of Mechanical Engineering, Fuzhou University, Fuzhou 350108, China
*
Authors to whom correspondence should be addressed.
Appl. Sci. 2021, 11(13), 5964; https://0-doi-org.brum.beds.ac.uk/10.3390/app11135964
Submission received: 3 June 2021
/
Revised: 21 June 2021
/
Accepted: 22 June 2021
/
Published: 26 June 2021
(This article belongs to the Special Issue Intelligent Renewable Energy System: A Focus on Hydrogen Fuel Cells and Battery Storage with AI)
Abstract
:Water management is one issue that must be surpassed to ensure high membrane proton conductivity and adequate reactant transport in the membrane-electrode assembly (MEA) simultaneously. A well-designed water management system is based on a comprehensive understanding of water transport in the inner part of the polymer electrolyte membrane (PEM) fuel cell. In this work, the water transport phenomena in the MEA PEM fuel cell are analyzed by using a mathematical model. The transport of diluted species interface is used to model the transport of water in the ionomer phase in the catalytic layer and the membrane domains. The molecular flux of water is defined using Nernst–Planck equations, including migration and Fickian diffusion using parameters obtained experimentally for diffusivity and mobility based on water drag for a fully humidified membrane. The proposed model 1D model includes anode gas channel, cathode gas channel, anode gas diffusion layer (GDL), cathode GDL, anode catalyst layer, cathode catalyst layer, and proton exchange membrane. Water activity, ionomer conductivity, and output voltage are predicted by changing the humidity on the anode side of the fuel cell.
1. Introduction
Fuel cells currently have many applications in vehicles, spaceflight, ship, and building due to the advantages of generating electricity continuously, zero-emission, and high efficiency [1]. However, the commercialization of fuel cells still needs to overcome many obstacles, including the problems of high cost and durability. The durability of fuel cells benefits from a good design of Balance of Plant (BOP) which affects the performance of fuel cells [2,3]. Issues of water management are relevant to guarantee electrical conductivity in the membrane and prevent redundant water from obstructing the reactant delivery [4,5]. Therefore, better water management requires a comprehensive understanding of the water activity in the interior of the fuel cell, especially the water transportation in the membrane-electrode assembly (MEA).
The redox reaction of hydrogen and oxygen occurs in MEA to produce electricity, heat, and water. Water is the only emission from fuel cells. And water management is considered a critical issue in the commercialization of PEM fuel cells [6]. Researchers working on fuel cells have described the transport model of water in various components of fuel cells [7]. Only a small part of water passes through the membrane and the electrode, and the rest is transmitted through the gas channels. This small amount of water is transported through porous media, but this complicates the overall water transport mechanism. Normally, water transport in the membrane is governed by the following basic modes: back diffusion, electro-osmotic drag, hydraulic permeation, and thermo osmosis flux [2]. Back diffusion is the transfer of molecules from a region of high concentration to a region of low concentration until a uniform distribution is achieved. The rate of diffusion is proportional to the concentration gradient of the substance. In fuel cells, the diffusion of water molecules from the cathode to the anode side is usually observed [8]. Electro-osmotic drag in membranes refers to the movement of water through a membrane as a result of the movement of ions caused by the electric field [9]. Hydraulic permeation can be described as water transported through the membrane as a result of gas or capillary pressure gradient between the anode and cathode side. Thermo-osmosis water flux is caused by the temperature gradient [10]. Compared with the transport mechanisms of thermo-osmosis flux and hydraulic permeation, electro-osmotic drag and back diffusion have a more profound effect on water transport processes [11]. In the gas diffusion layer (GDL), water exists in the forms of vapor and liquid in the pore region under normal working conditions. Meanwhile, water molecules in the gas phase are free to condense back into the liquid, and vice versa. Liquid water transmitted in GDL is very complicated [12]. Muirhead et al. [13] illustrates that the water transport in GDL mainly consists of two transport mechanisms, namely, liquid percolation and vapor diffusion, and the liquid water configuration in high-current density in GDLs is highly affected by the relative humidity of the cathode. Gholizadeh et al. [14] believed that the required data for electro-osmotic flow and back diffusion can be calculated by changing the humidity on both sides of the fuel cell. Experiments about the effect of water balance variation on electro-osmotic flow were implemented, and the optimum values for the humidity of the anode side and cathode side were determined [15,16]. Sanchez et al. [17] studied the influence of temperature and gas humidity on the performance stability of PEM fuel cells. They believed that the performance stability of a fuel cell possesses a relatively stable behavior when the relative humidity of the cathode side was in the range between 20% and 50%. Water transport is strongly determined by current density but also depends on stoichiometry and humidity level [18]. Much of the research in water transport in the membrane in the last two decades examined water content of the membrane and the inlet humidity of gases affect proton conductivity, activation overpotentials, and durability [19]. However, most of these studies did not involve open-cathode fuel cells. Open-cathode PEM fuel cells are commonly found in low-power stacks with the cathode air supply subsystem coupled to an air-cooled coolant system [20]. Affected by the structure of open-cathode fuel cells, the catalytic layer (CL) of the cathode side is exposed to the atmosphere; consequently, the relative humidity of the cathode side is highly nonlinear to the flow speed of input air and ambient humidity [21]. The open-cathode PEM fuel cell also has the characteristics of low pressure of the input gas and small pressure difference between the cathode and anode, which indicates that the open-cathode fuel cell has low requirements on the auxiliary system.
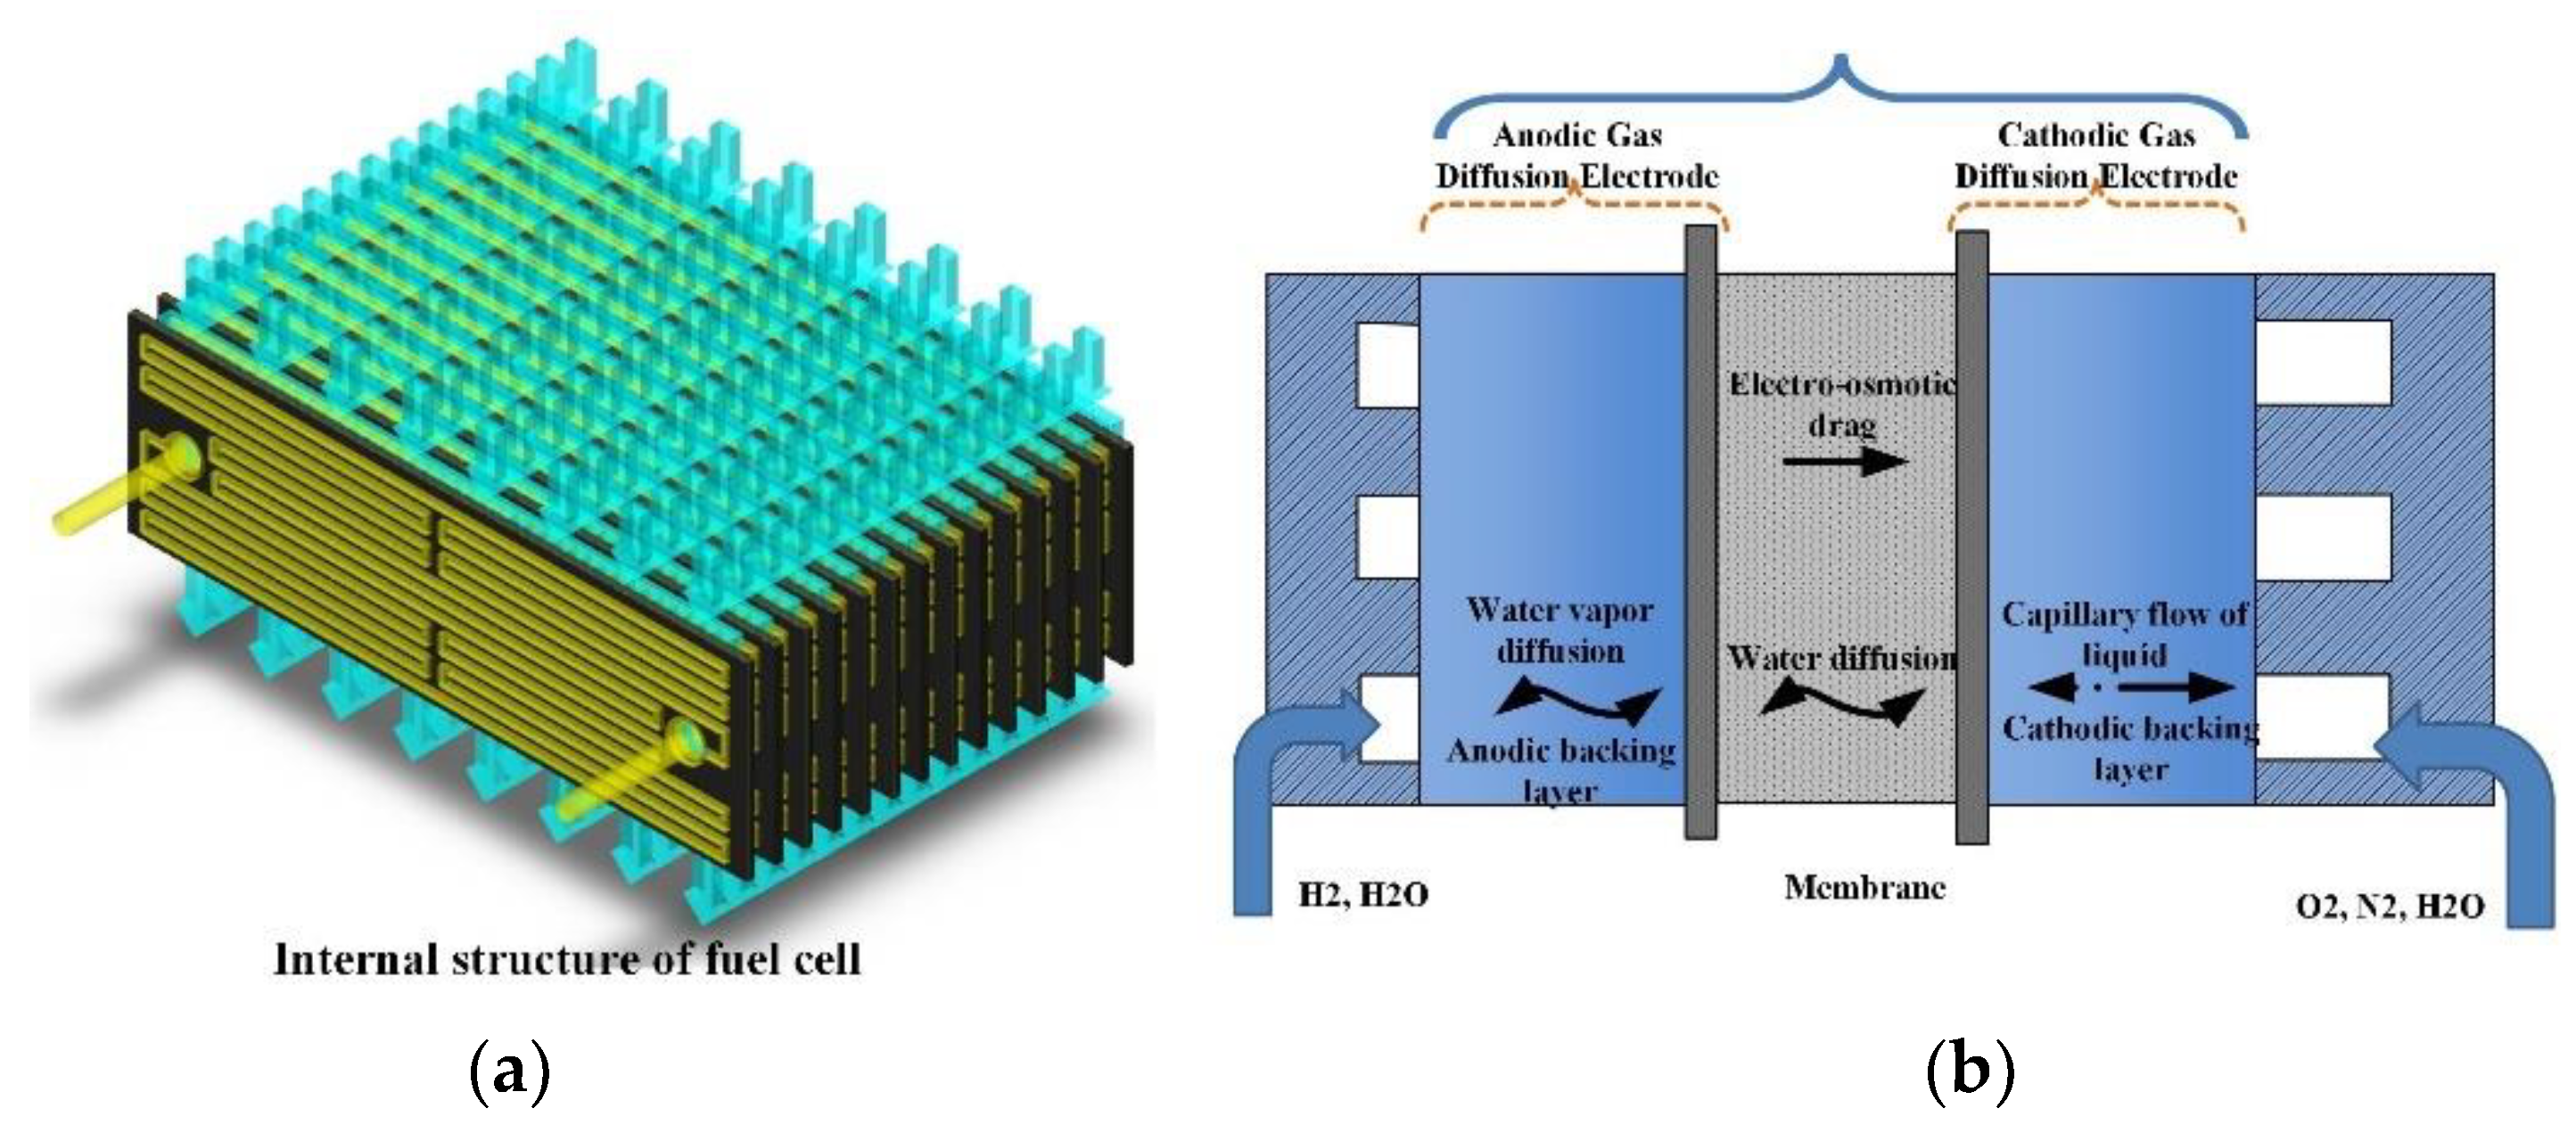
The MEA of a PEM for an open-cathode fuel cell is the core component of the fuel cell system. The central part of the MEA is the PEM, which acts as a gas separator and an ion conductor. Porous CLs (gas diffusion electrodes) are located adjacent to the membrane, one on each side as shown in Figure 1a. The catalytic layers contain three separate phases: gas pores for the reactants, an electron conducting electrode phase, and an ion-conducting polymer (ionomer) electrolyte phase as shown in Figure 1b. The surface of the electrode phase in the CLs contains noble metal catalysts to minimize the reaction overpotentials. GDLs are placed outside the CLs. GDLs are also porous and carry out the task of conducting electrons and allowing the passage of gases. For low-temperature fuel cells, water management is of crucial importance for the performance of the MEA. Running the cell under excessively wet conditions may result in mass transport limitations of gases due to the flooding of liquid water in the pores, whereas running the cell under excessively dry conditions may result in poor performance due to the low ohmic conductivity in the ionomer used in the membrane and CLs. Therefore, modeling is needed to investigate the effect of relative humidity of the inlet gases on the performance of a low-temperature polymer electrolyte MEA. The model includes gas-phase mass transport, water transport in the ionomer, and humidity-dependent ionomer conductivity. Hydrogen cross-diffusion over the ionomer membrane is not included in the model. The developed model is coupled with multiple physical fields. The manuscript of the study is presented as follows: The mathematical model with mass transport phenomena is described, and the MEA component with a focus on water transport is presented in Section 2. The numerical approach is introduced in Section 3. The simulation results and some experimental data are presented with further analysis and deep discussion in Section 4. The conclusion is drawn in Section 5.
2. Mathematical Description
Electrochemical Model
A comprehensive 1D model is employed to depict the water transport in the through-plane direction of a single fuel cell MEA. The Nernst equation employed to describe the reversible cell potential is given as [22]:
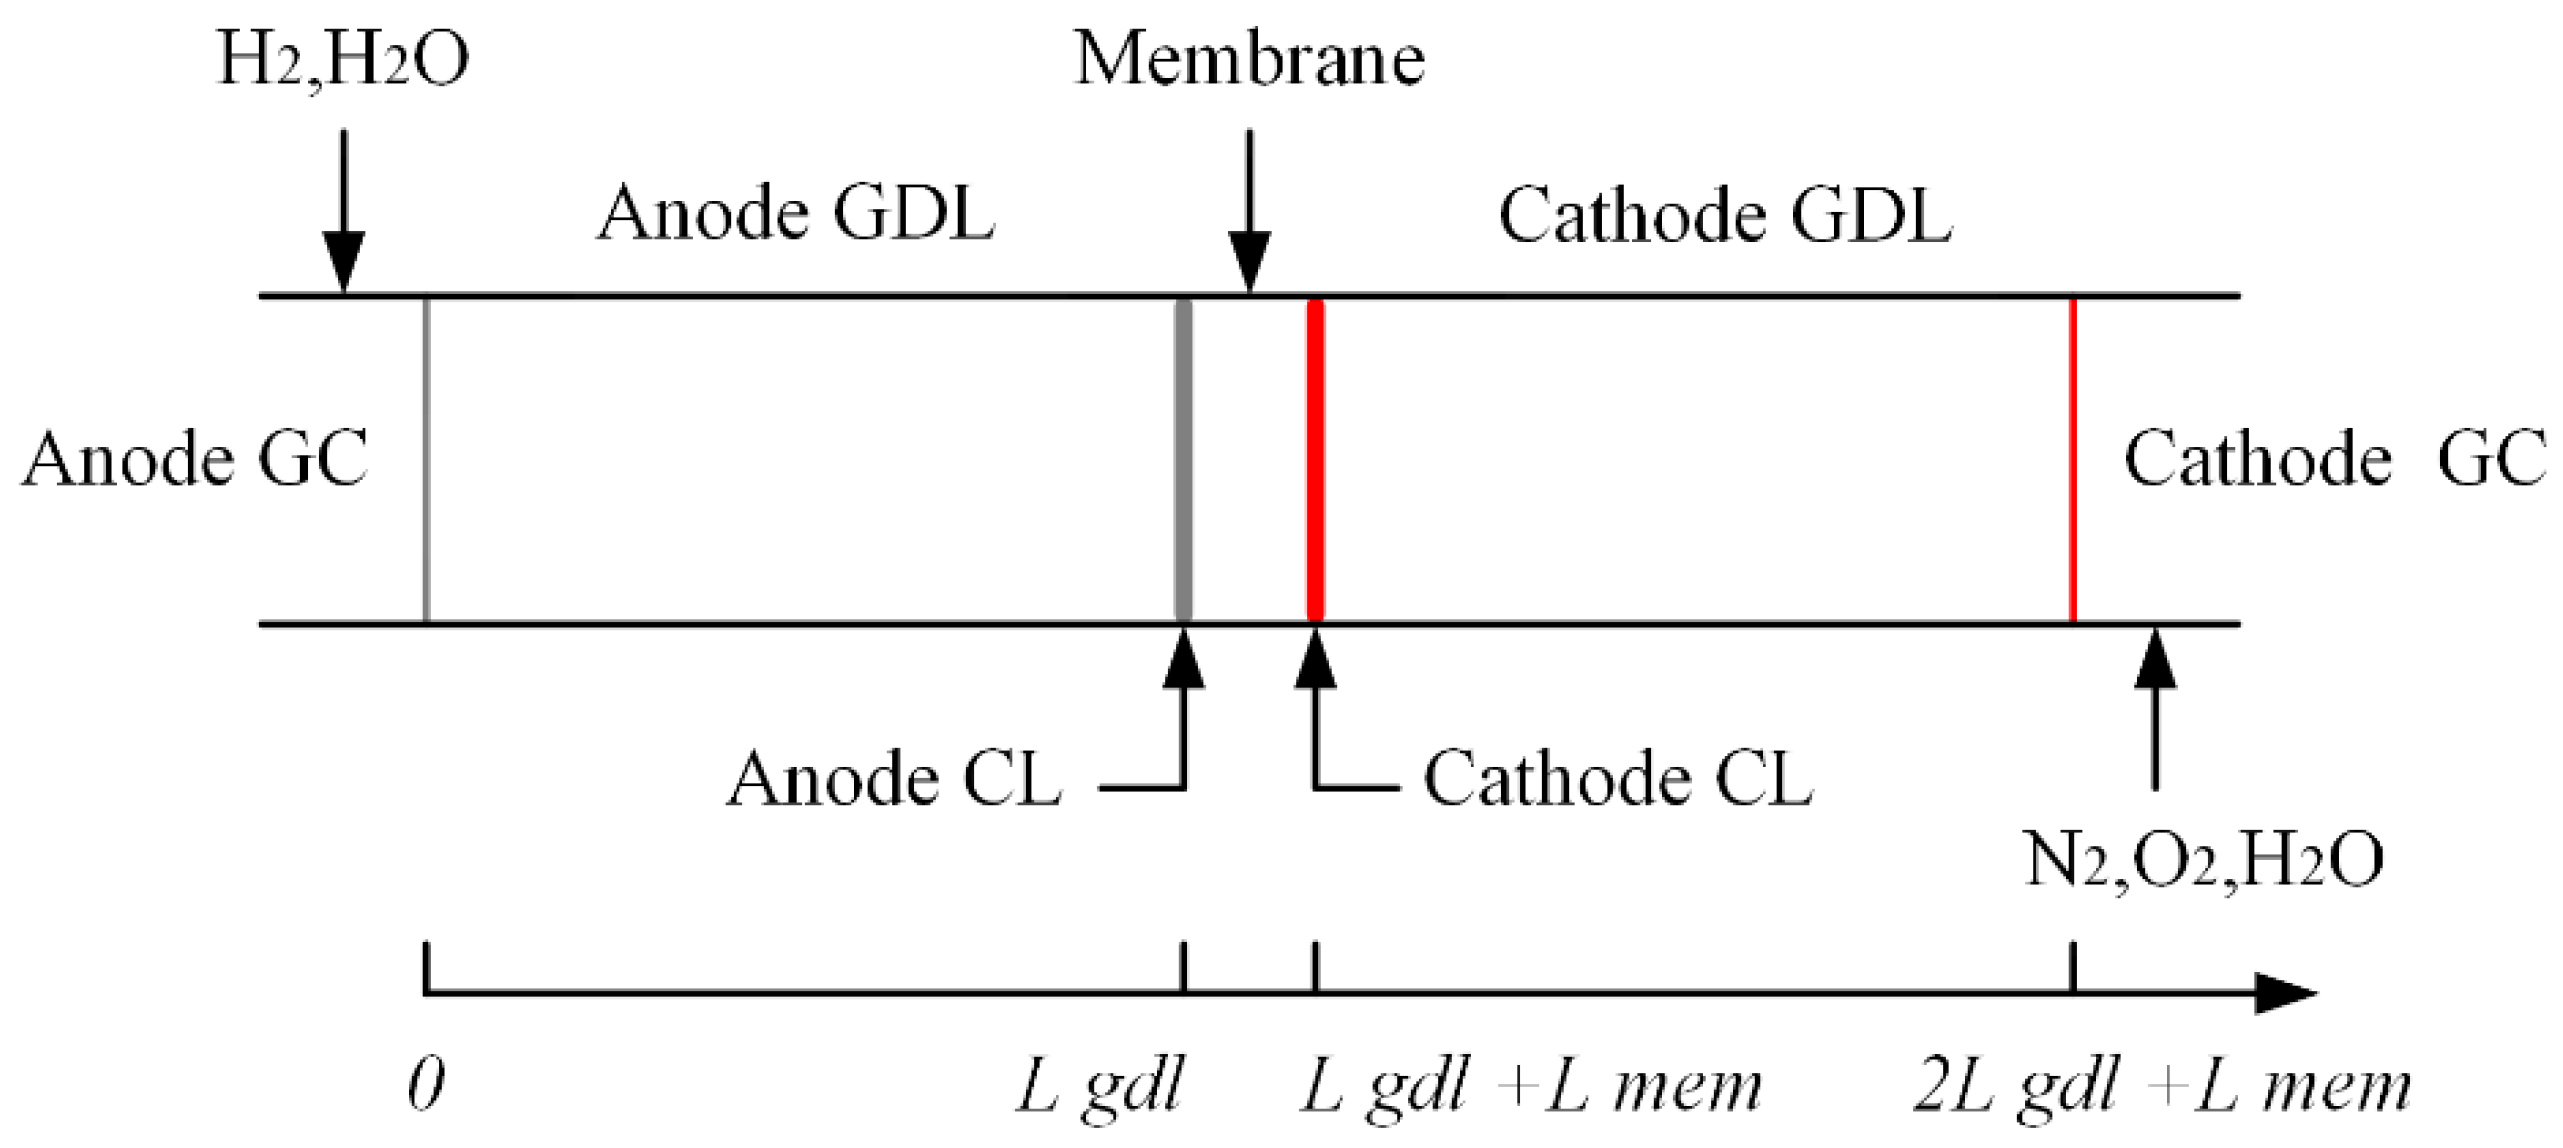
Figure 2 shows the schematic diagram of the 1D model domains consisting of anode and cathode GDLs, CLs, and ionomer membrane [23,24]. The central part of the MEA is the PEM as a semipermeable membrane separating gases and allowing ions to pass through it. The model accounts for mass transport in the gas and polymer phases coupled to the current distribution in the electrolyte and gas-diffusion electrodes. The domains of this schematic model are described in Figure 2. The overall redox reaction can be divided into two single steps in anode catalyst layer (ACL) and cathode catalyst layer (CCL) separately by Butler–Volmer kinetics given by [22].
where β = 0.5 is the half-reaction symmetry factor, η is the activation overpotential defined as [25]:
The inner potential difference between two points in the bulk of two conducting phases of electron and proton can be defined as:
The reversible potential difference is split into two parts based on the different catalyst layers:
The direction from the anode side to the cathode side is defined as a positive direction. The proposed model is depicted as steady state, isobaric, and laminar flow in all channels. Detailed governing equations contain the transport of gas species, water, heat, and energy. Related partial differential equations of the steady state are summarized in Table 1.
3. Results
The gases mixed with vapor in anode and cathode are regarded as ideal gases. CLs are attached to each side of the membrane, that is, the anode and the cathode layers. Conventional CLs include nanoscale particles of platinum uniformly distributed on a high-specific surface-area carbon carrier. In the CLs and GDLs, the flux of electrons is assumed governed by Ohm’s law, and Eelec is driven by the gradient of the electronic phase potential. The equation of the flux of proton Eprot in the electrolyte phase of the CLs and membrane is derived by an analogous equation, as shown in Table 1. The length of every domain is given in Table 2.
3.1. Gas Diffusion Layer
GDLs play an important role in the current collection, offering an electrically conductive pathway. The electronic connection function between the bipolar plate with channel-land structure and the electrode is very important [26,27,28]. Furthermore, other remarkable features of GDL contain passage for reactant transport and heat/water removal, mechanical support to the MEA, and protection of the CL from corrosion or erosion caused by flows or other factors [29,30,31]. To simplify the transport model, the phenomenon of diffusion is expressed by Fick’s law rather than the Stefan–Maxwell equation to describe the gradient in mole fraction of the multicomponent diffusion shown in Table 1. In this step, the gases in anode and cathode mixed with vapor are regarded as ideal gases. The diffusion coefficient, also known as diffusivity, describes how fast one material can diffuse through another material. With the correct diffusion coefficient, the model is close to reality. The mass diffusivity is modified from Chapman–Enskog theoretical equation given as [32]:
where Di is the diffusivity of O2, H2, and H2O in the gas mixture; ε is the porosity of the GDLs; s is the liquid water saturation. The diffusion equation for water vapor contains a source term that accounts for the phase change of water in GDLs and CLs.
3.2. Catalyst Layers
The CL is attached to each side of the membrane—the anode layer and the cathode layers. Conventional CLs include nanoscale particles of platinum uniformly distributed on a high-specific surface-area carbon carrier. The carbon-supported platinum catalyst is mixed with an ionomer and located between the membrane and the GDLs [33]. It is the thinnest layer in the MEA but the most complicated part of the operation. Based on the classical porous-electrode theory of Newman, ΔE is defined by the two electrostatic phase potentials Eelec and Eprot coexisting in the CLs. Accordingly, the flux that occurs at the anode can be determined by Dcl, which is the Knudsen diffusion of water vapor in the void. The Knudsen diffusion coefficient is expressed by the following equation.
3.3. Water Transport in Membrane
The transportation of gas species on the MEA domain exists on both sides of the membrane. Crossover gases are ignored due to low-pressure conditions in the open-cathode fuel cell. The transport of oxygen and hydrogen occurs only on the cathode side and the anode side, respectively. Water vapor also exists in mixtures on both sides. The only interdiffusion of the gas species is considered with the assumption of uneven distribution pressure in the steady state [34,35].
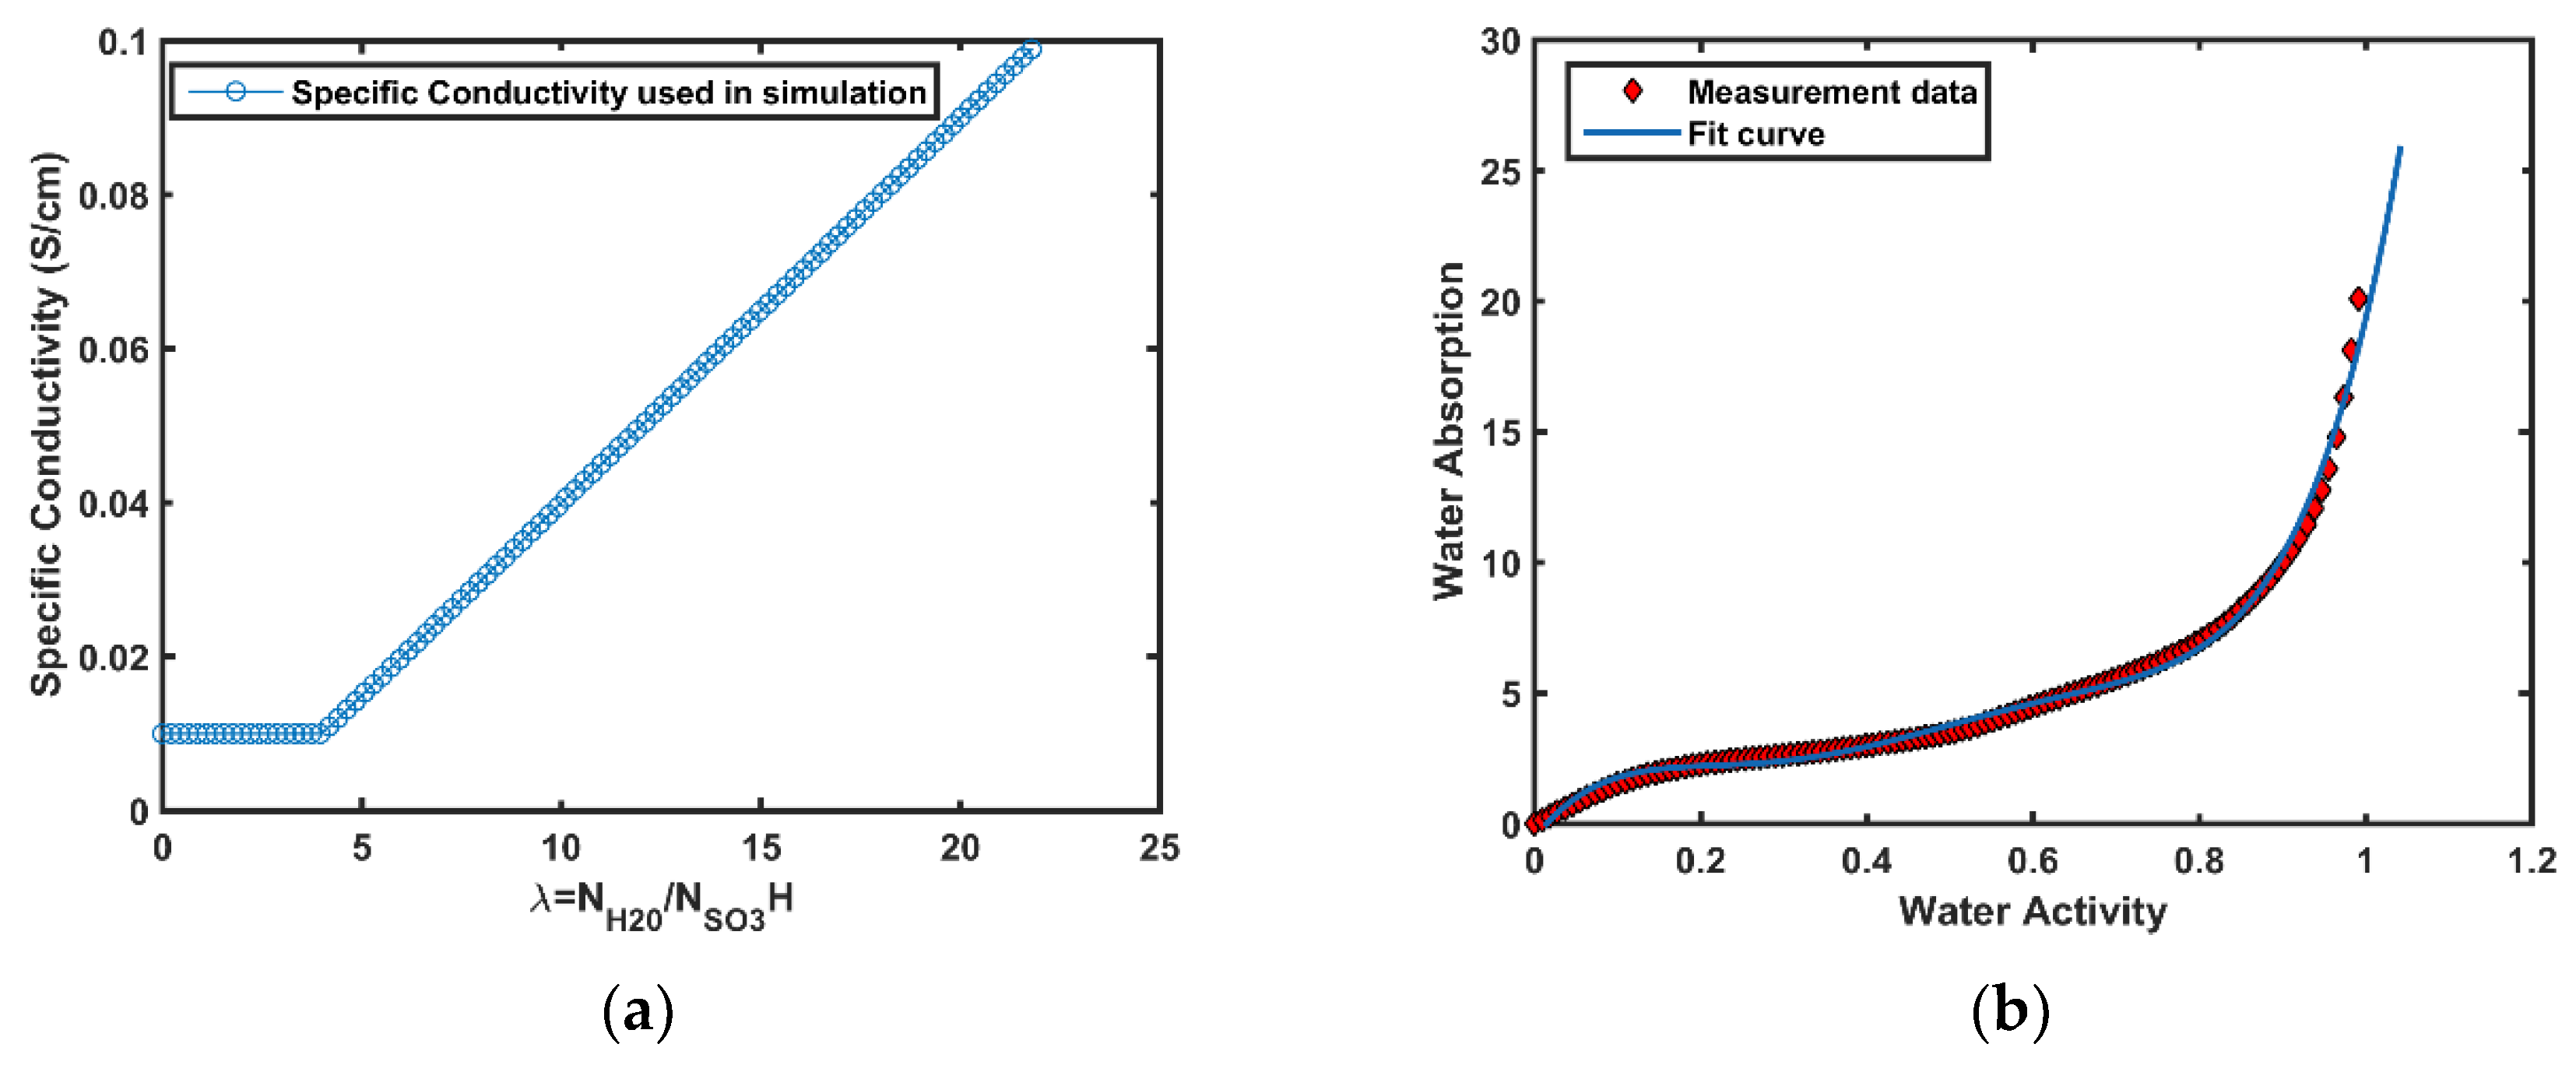
The water and charge transport in the ionomer are determined by ionomer conductivity, water activity, and diffusivity. The unsaturated flow theory based on soil physics is employed to depict the liquid water transport of the fuel cell model, which is also commonly utilized in two-phase MEA modeling. λ represents the humidification degree by estimating the water molecule number in each acidic group. Water transport through the membrane is mainly caused by electro-osmotic drag and osmotic diffusion. The calculation of the molar flux of dissolved water also refers to the superposition of electro-osmotic drag and osmotic diffusion phenomena. The phenomenon of electro-osmotic drag refers to hydrogen ions dragging water molecules through a membrane under the influence of an electric field. The related parameters of water activity are provided in Figure 3. The phenomenon can be described by the following equation:
Diffusion through the membrane also occurs due to the different gradient of water concentration ∇s between the anode and cathode channels. The osmotic diffusion process is determined by the following Equation [36]:
where cv,ca and cv,an are the water concentration on the surface area of the membrane at cathode side and anode side, respectively defined by the following equations.
Dw is the water diffusion coefficient related to the water activity, which is determined by the water content of the membrane as the following Equation [17].
where Dλ is a function of the water content of the membrane.
3.4. Source Terms
The definitions of the source term for one species in different domains are different due to the varied sites of the reactions. In ACL, the hydrogen/oxygen consumption rate is related to the current density based on Faraday’s law [37]. The source terms for hydrogen, oxygen consumption, and water production can be determined by the quantitative relationship in the hydrogen and oxygen redox formula. The source term of hydrogen and oxygen can be defined as follows:
The source term of electrons and protons in ACL and CCL are represented by Selectron and Spronton as
The interfacial water transport mainly involves the process of absorption and desorption. The process of water absorption and desorption on the ionic polymer is realized on an hourly time scale, and water is generated from the electro-chemical reaction of the cathode side not in vapor phase due to the fuel cell working temperature lower than boiling point [38].
The water produced at the surface of the solid catalyst is in the form of dissolved water from the electro-chemical reaction. The way water molecules leaving the polymer phase depends on whether the gas phase is saturated, and sufficiently high-energy to enable water to evaporate. Alternatively, when the gas phase is saturated, the water leaves the interface as a liquid, and which is forced to be transported away by the capillary diffusion or other forced mechanisms. In this study, the source term of water can be described as follows:
Liquid water exists in the polymer’s pores, and protons can migrate through liquid water in principle, enabling electrochemical reactions to occur in the liquid phase, which may produce water directly rather than as dissolved water. However, the diffusion of protons occurring in liquid water is considerably smaller than the ionomer. Hence, the mechanism of dissolved water should be considered. The dissolved water is expressed by Jλ, which is contributed mainly by back diffusion and electro-osmotic drag. Back diffusion is caused by the moisture content gradient of ▽λ as shown in Table 1. Electro-osmotic drag occurs in the action of an electric field, the solution moving in a certain direction. The flux of the dragged water is related to Faraday constant and current as shown in Equation (18). The produced dissolved water at the platinum-ionomer phase is affected by the consumption rate [28], which is given by the following:
Absorption and desorption in the membrane are accompanied by phenomena with exothermic and endothermic processes. Water vapor absorption and vapor condensation are considered as the processes of heat-releasing [39]. By contrast, the water molecules desorption from the membrane and the evaporation of water should absorb heat to drive them. The latent heat involved in the two-phase transitions can be regarded as follows:
The description of the heat generated by the electric and ionic current is based on the theory of Joule’s first law. The two heat sources contribute to ACL and CCL. The redox reaction on the CLs is considered an endothermic process, and the dissipated heat is determined by the sum of activation and Peltier heats.
3.5. Boundary Conditions and Initial Values
Accurate boundary conditions are required for a mathematical model that can successfully analyze the transport characteristics of each species. Initial value setting is also one of the key steps to achieve the convergent simulation results in iterative solvers.
In the study, the normal fluxes are too tiny to account for the membrane boundaries; hence, all species, as well as electrons, disappear at the membrane boundaries. The membrane is also assumed as impermeable for all gases. The dissolved water and protons mainly transport through the ionomer phase supporting the assumption that these two species have zero fluxes at both external surfaces of CLs [39].
Based on the Dirichlet boundary conditions, the values of electrostatic potentials of φe at the end of the surface boundary of MEA are 0 and U, respectively. The hydrogen in anode side boundary condition can be given as follows:
where is the boundary condition of vapor in the anode, which is expressed by
In a similar fashion, the gases in the cathode side are listed as follows:
As temperature exists in all domains in this study, the values at the anode and the cathode sides are given as Ta and Tc, respectively.
The parameters involved in this simulation model are referred from the presented literature and some public data of the commercial products. These specified characteristics are substantial to furnish the established model. Many parameters are not fixed values, but often, assumptions must be made and some parameters must be set to a constant within a reasonable range of variation to simplify the model and reduce the calculation cost. The saturated pressure of water vapor is a remarkable parameter related to the phase change of liquid vapor in macro homogeneous MEA modeling. The temperature within the water boiling point is estimated using the Antoine equation as follows [38]:
Condensation/evaporation is another important water activity, and the related coefficients are as follows:
The accurate expression of current density plays a crucial role in modeling the distribution of temperature, gas concentration, gas consumption. By measurement of equivalent weight ionomer, the Bulter–Volmer equation is expressed by the following [21]:
Bruggeman correction s used in the calculations of ionic conductivity and water diffusivity. It is important in water transport in the ionomer and shown as follows [21]:
Dλ is corrected water diffusion coefficient used in any temperature, which is represented as follows:
The water content of the membrane is determined by the ratio of the number of water molecules to the number of charge (SO3H+) sites [24]:
where RH is the relative humidity determined by The mass diffusivity derived from Chapman–Enskog theoretical equation is very important in the calculation of gas diffusivities in porous media, as given in Equation (6).
4. Mathematical Description
The governing equilibriums represent the transport phenomena in MEA of open-cathode PEM fuel cell, given in Table 1. The initial values inside every domain can refer to the boundary conditions, shown in Table 3. The mass transportation phenomena expressed by several coupled partial differential equations include the transports of proton, electron, heat conduction, dissolved water, water vapor diffusion, hydrogen diffusion, oxygen diffusion, and liquid water. MATLAB is utilized to solve the differential equations. The boundary conditions are applied by purely algebraic simplifications to be used in the solver based on the real running condition of the open-cathode PEM fuel cell. The anode and cathode side temperatures are measured by experiments, and the results show that the cathode side temperature is 2 °C below the anode side because the cathode side is exposed to ambient and touched cooling flow directly. The humidity of the cathode side is measured from the real running condition.
5. Results and Discussion
In this study, the proposed two-phase model is used to describe the different physical through-plane transport processes by eight coupled PDEs (electron transport, proton transport, heat conduction, dissolved water transport, water vapor diffusion, hydrogen diffusion, oxygen diffusion, and liquid water transport). Among them, water transport considerably affects the performance of the fuel cell. The coexistence of unsaturated vapor and liquid water is considered causing the complexity of calculation solutions. The generation of dissolved water is important in proton conductivity, and the liquid water may fill the pores of the ionomer, which becomes an obstacle in gas transport. This model is mainly developed at macroscopical aspects based on many professional and special experimental devices. The study referred to many previous studies from others’ research because the involved parameters are difficult to obtain.
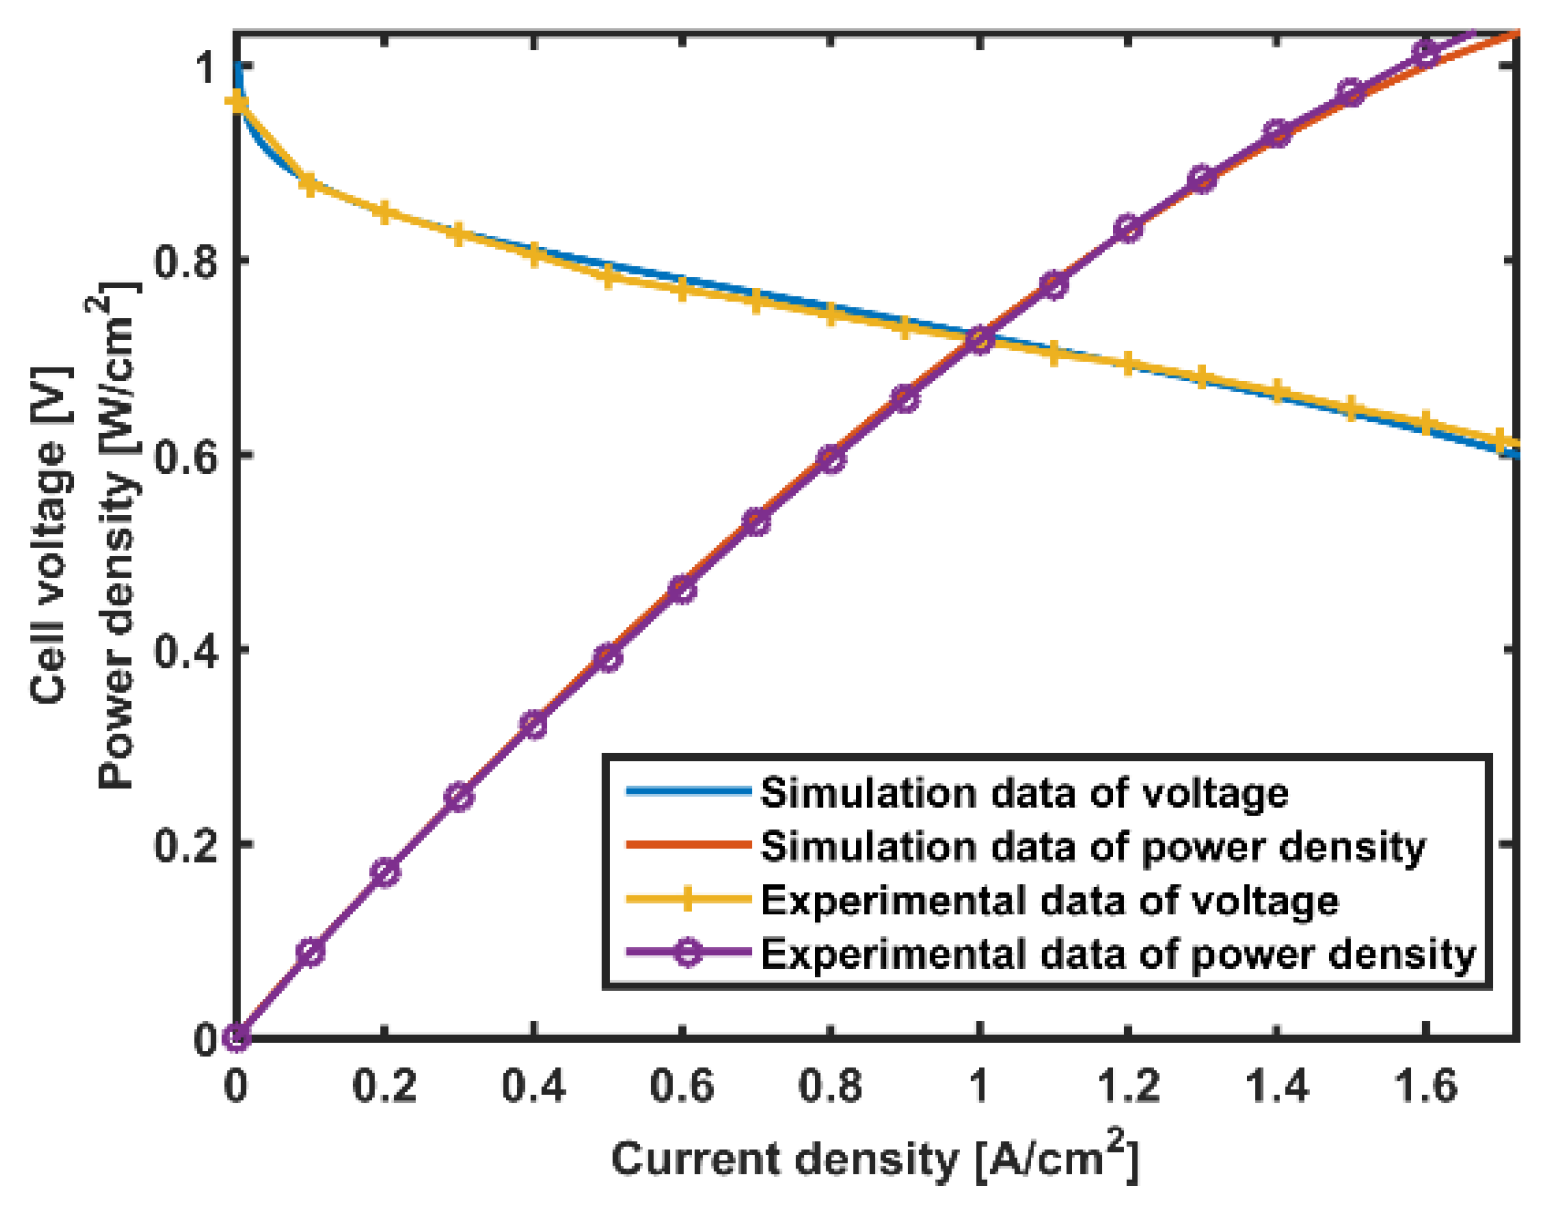
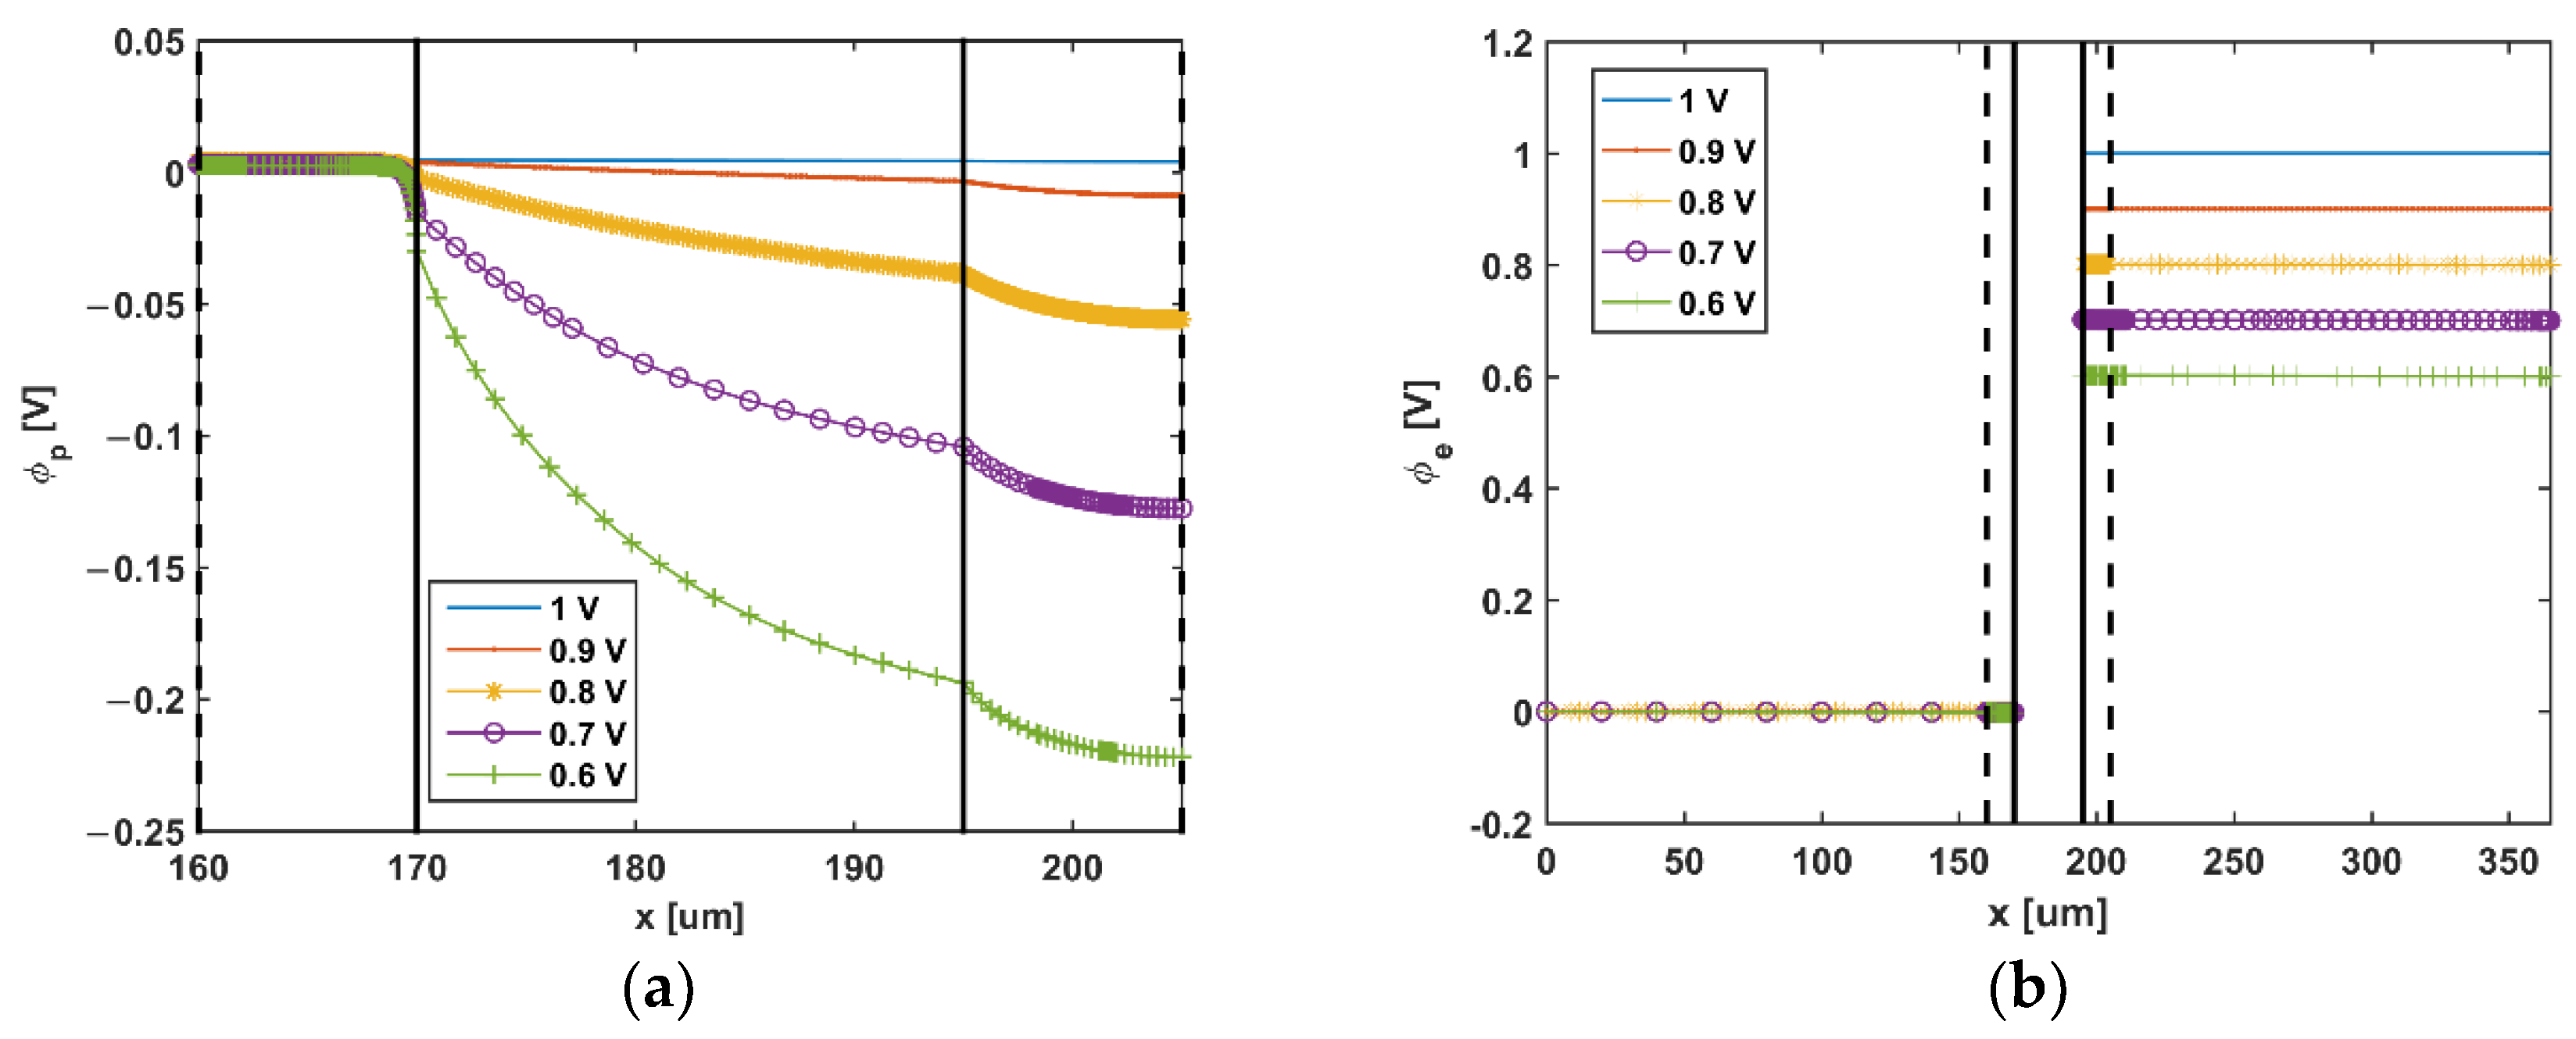
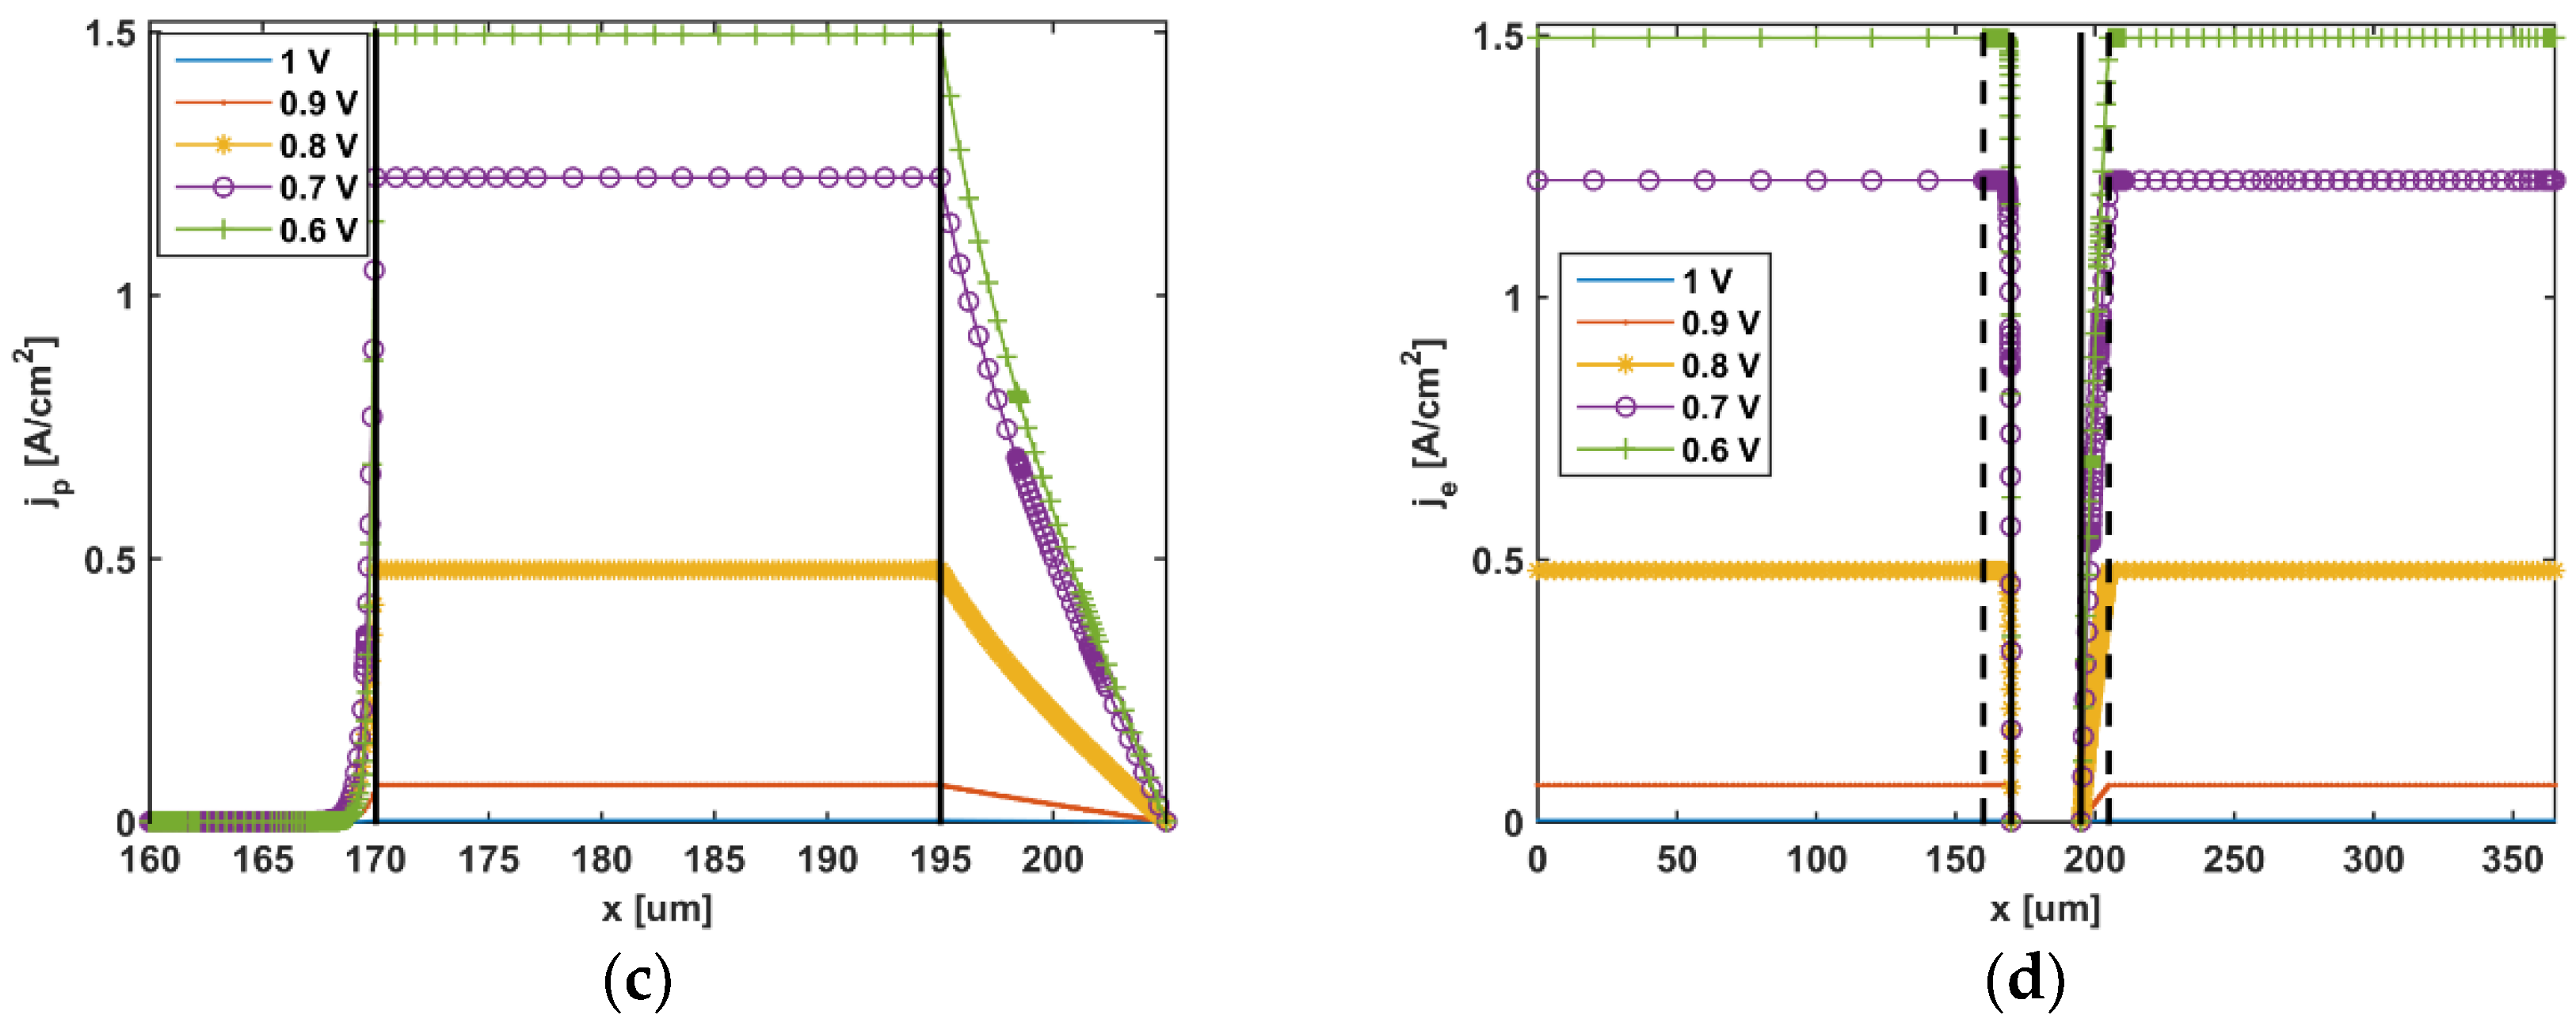
The polarization curve as the main characteristic of fuel cell performance is shown in Figure 4 with experimental data. The power density information also shows in Figure 4. The simulation curve is almost identical to the experimental curve. Under different cell voltages, the Galvani potential difference between the electron and proton-conducting phases is presented in Figure 5a,b. Figure 5a shows the conduction of protons in ACL, PEM, and CCL, whereas Figure 5b represents the conduction process of the electron in AGDL, ACL, CCL, and CGDL. The corresponding fluxes are shown in Figure 5c,d.
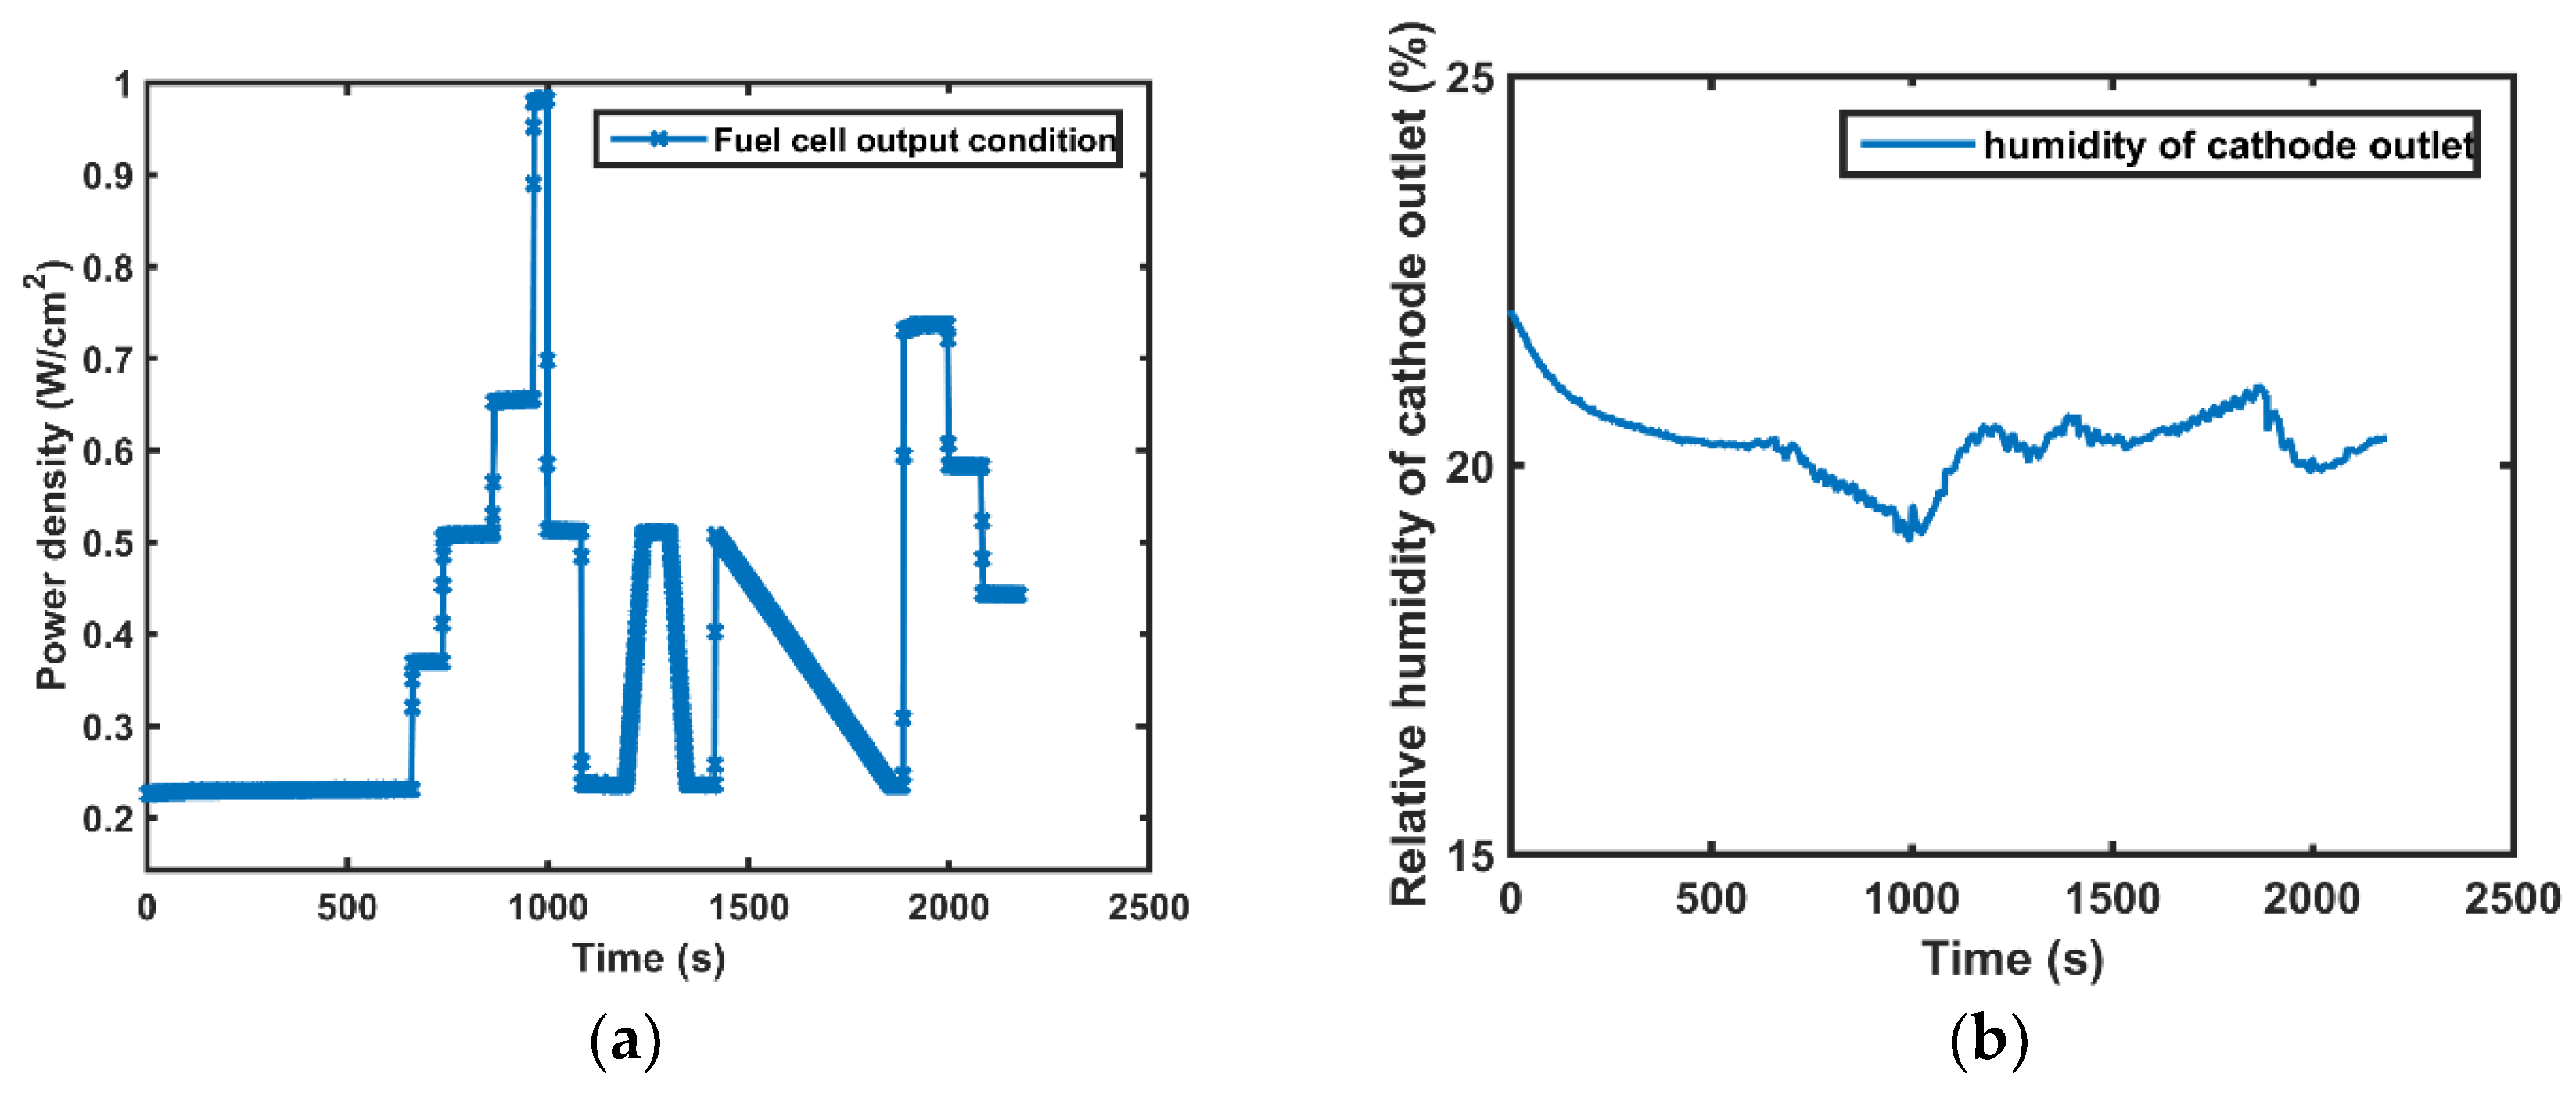
Over time, the anode side of the fuel cell continues to expel liquid water. Although multiple processes such as water generation, evaporation, and liquefaction are continuously occurring simultaneously in the anode of the fuel cell, the internal relative humidity of the anode of the fuel cell can be considered 100% after it enters the steady state. The relative humidity in the cathode cannot be directly determined by analysis because the axial flow fan blows directly on the cathode channel. Hence, the experimental data are obtained through the sensor measurement applied on the simulation shown in Figure 6.
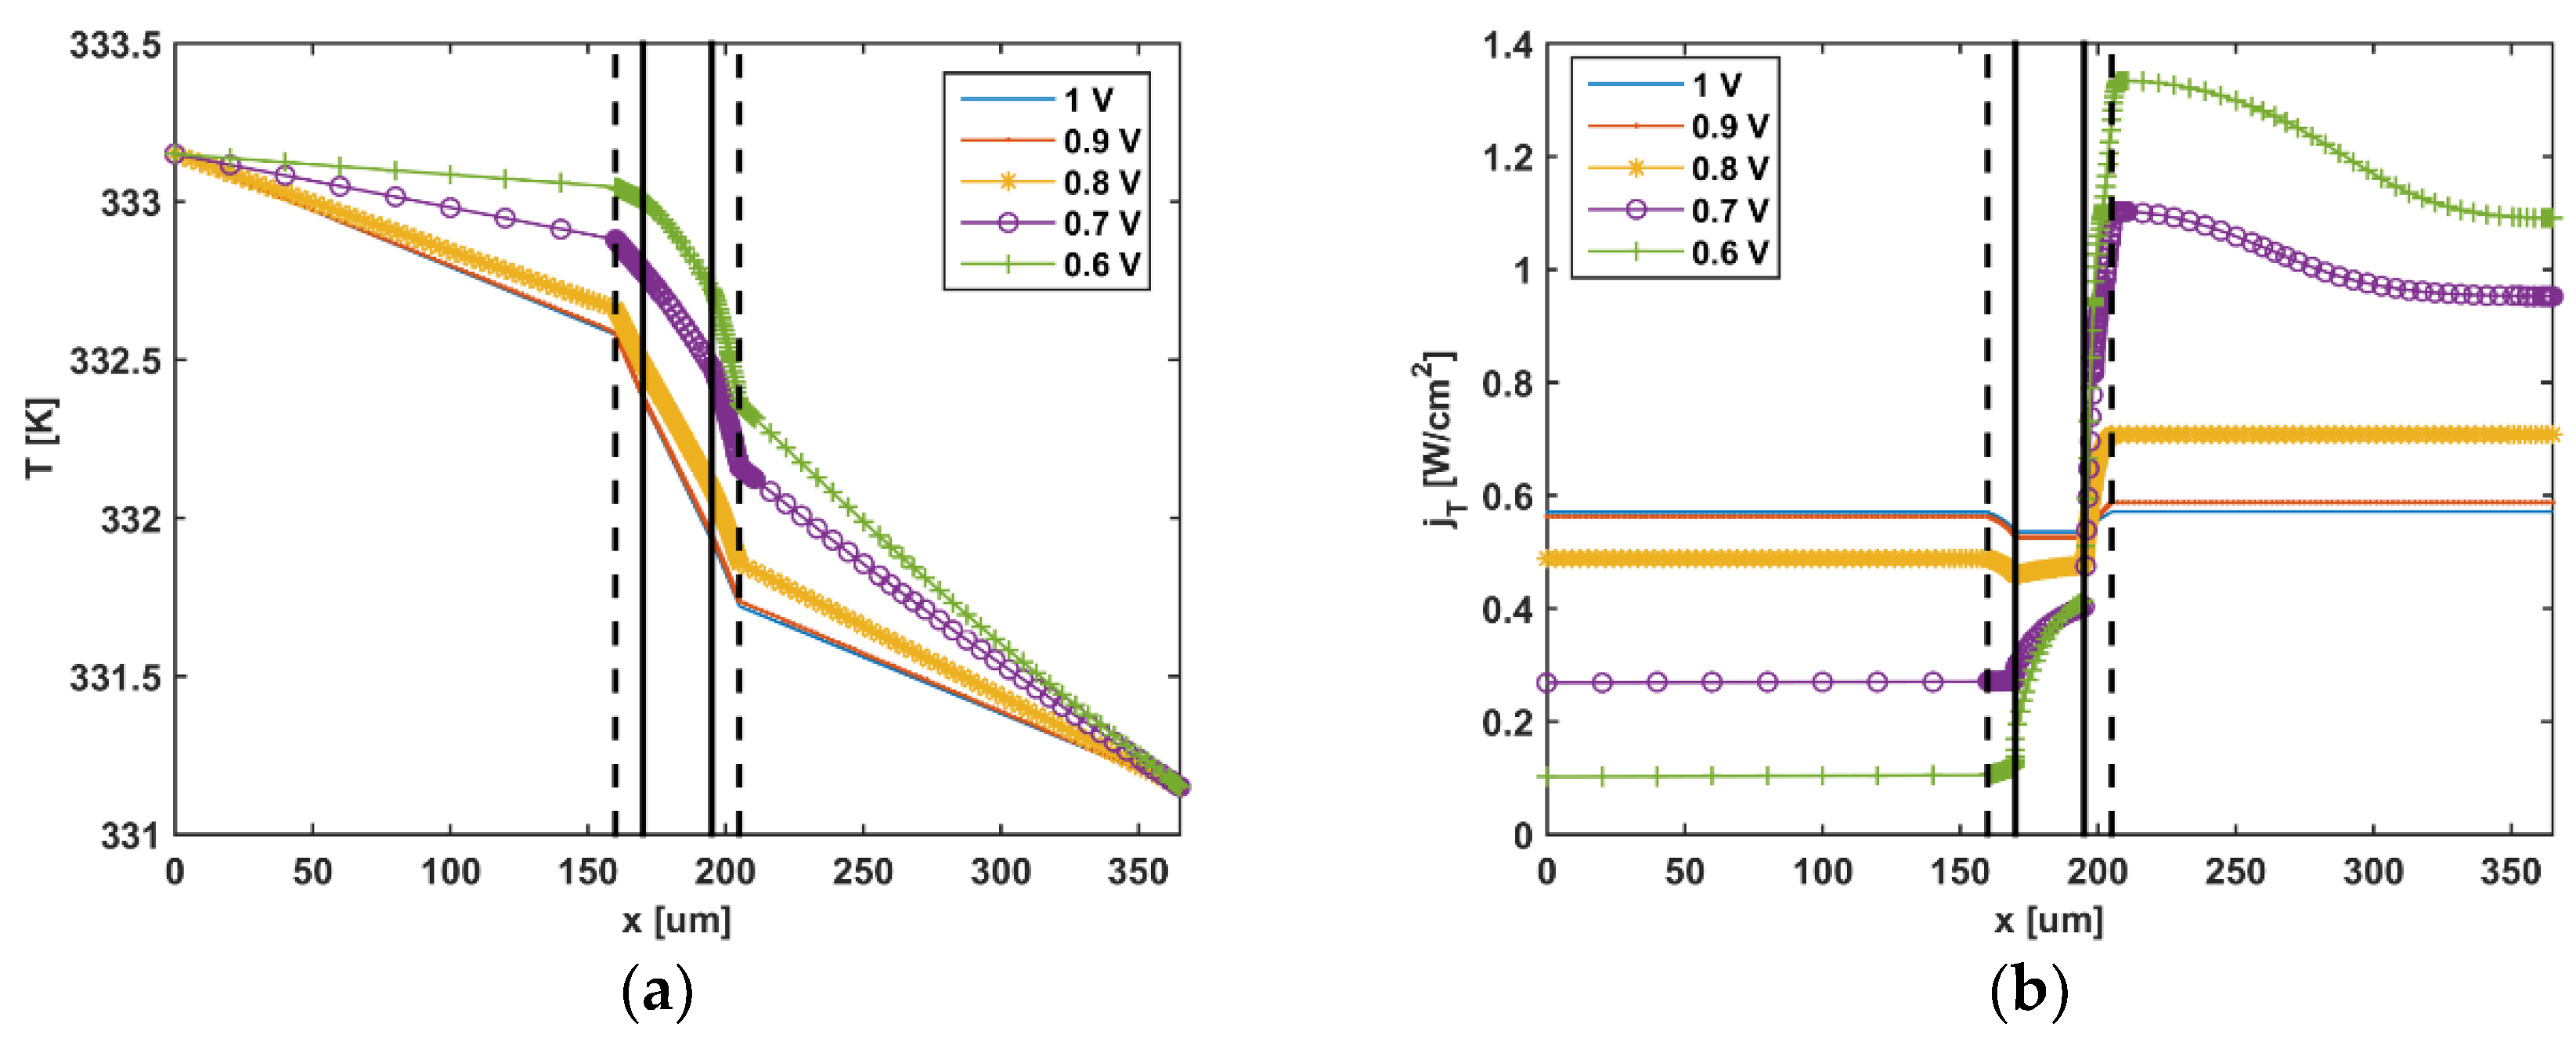
The processes of evaporation and condensation involve thermal absorption/desorption. The non-isothermal phenomenon existing in MEA is indisputable. The temperature distribution is modeled by PDE, and the result is shown in Figure 7. The temperatures of the open-cathode PEM fuel cell at the anode and cathode sides are different because the cathode channel is coupled with the cooling channel. The axial fan cools the channel directly, causing the temperature of the cathode side to be 2 °C below than that of the anode side. The heat flux jT determined by Fourier’s low is described in all subdomains as shown in Figure 7b.
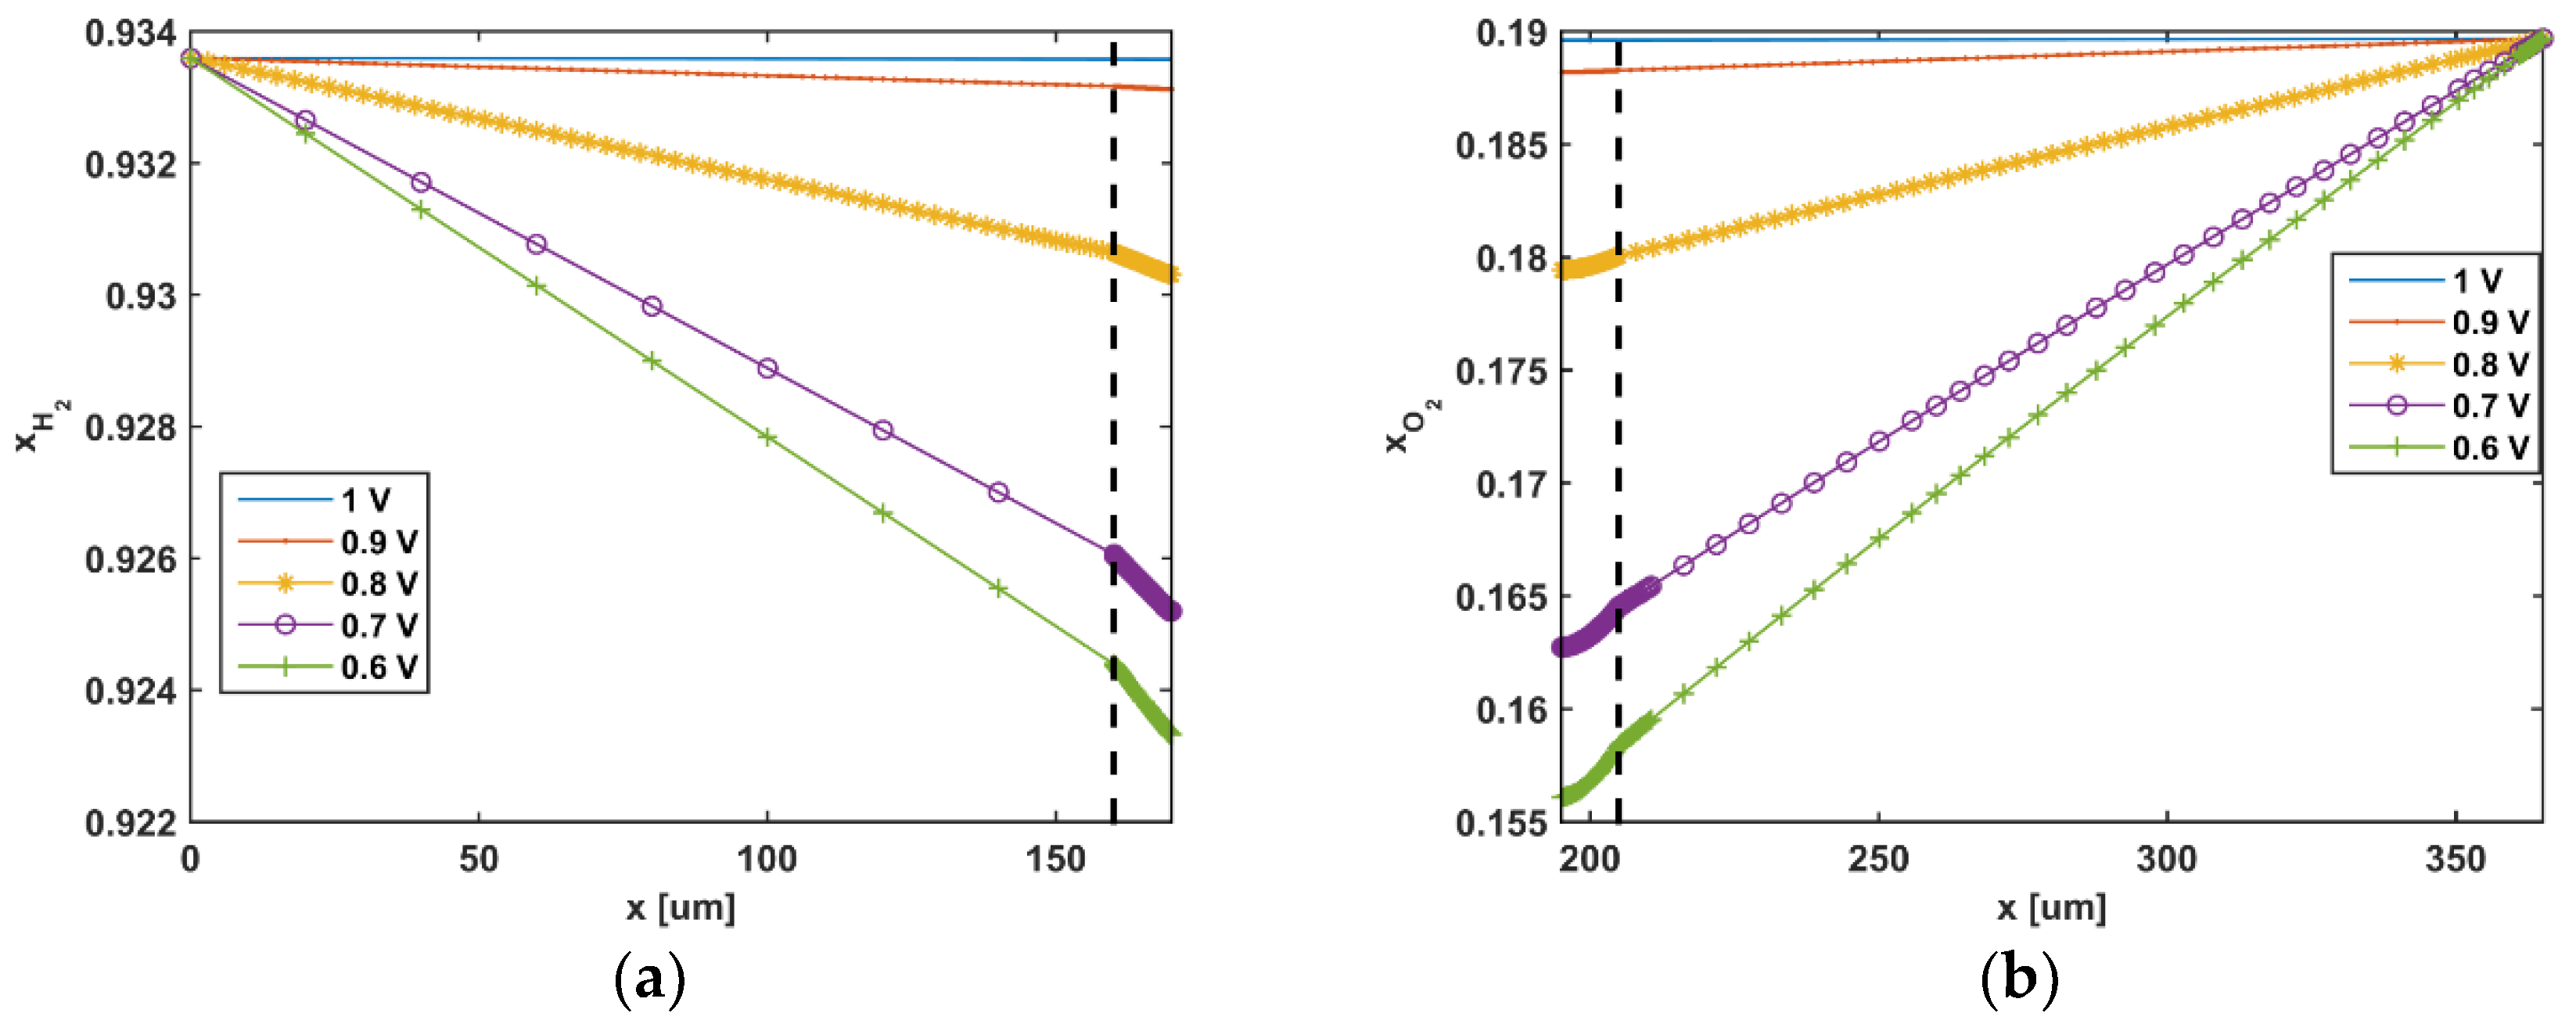
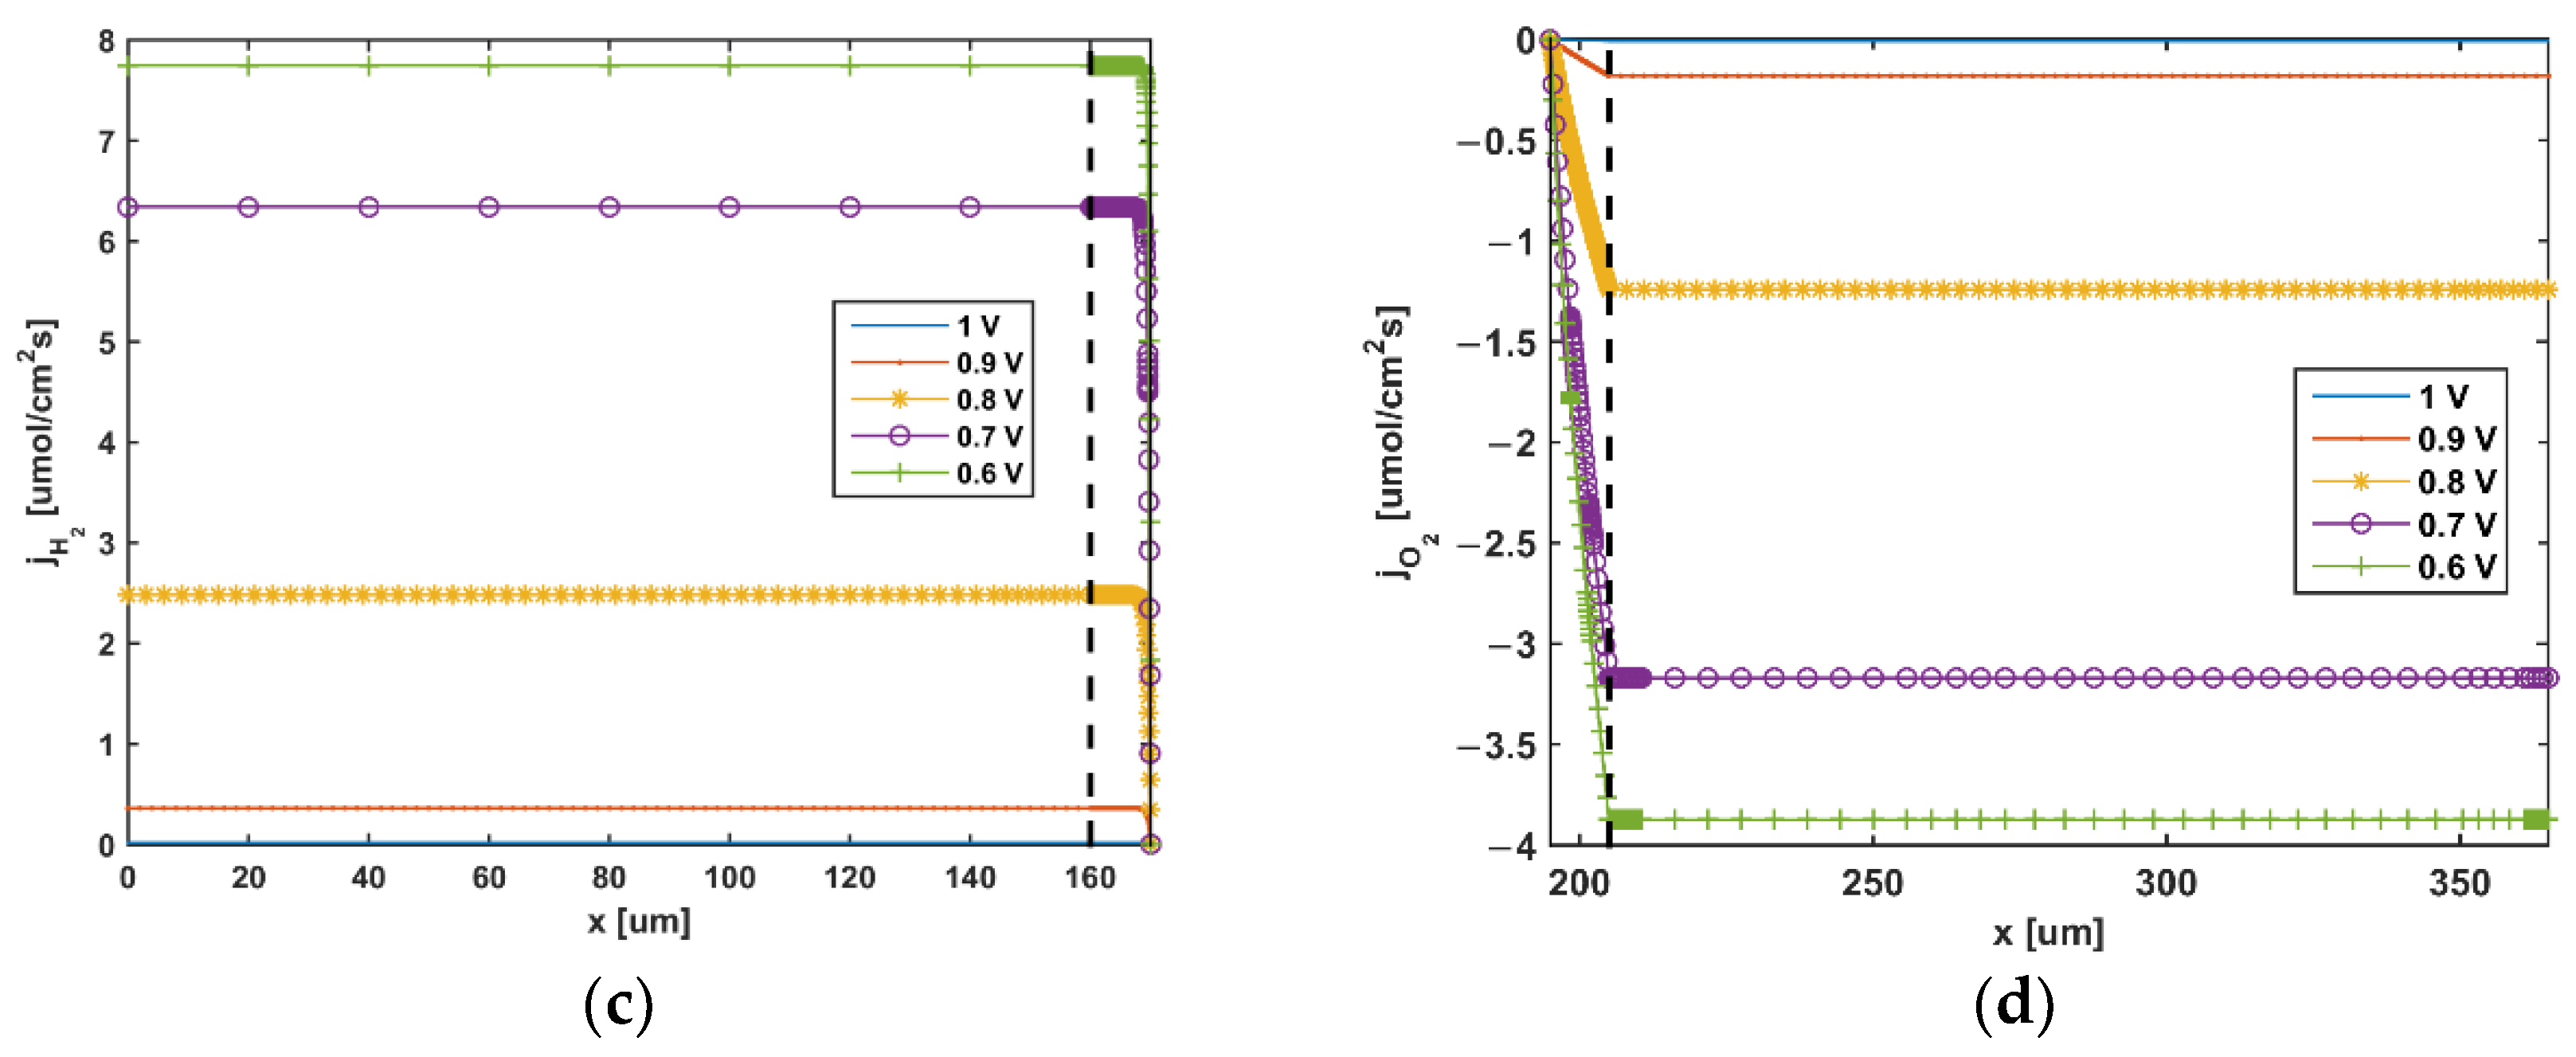
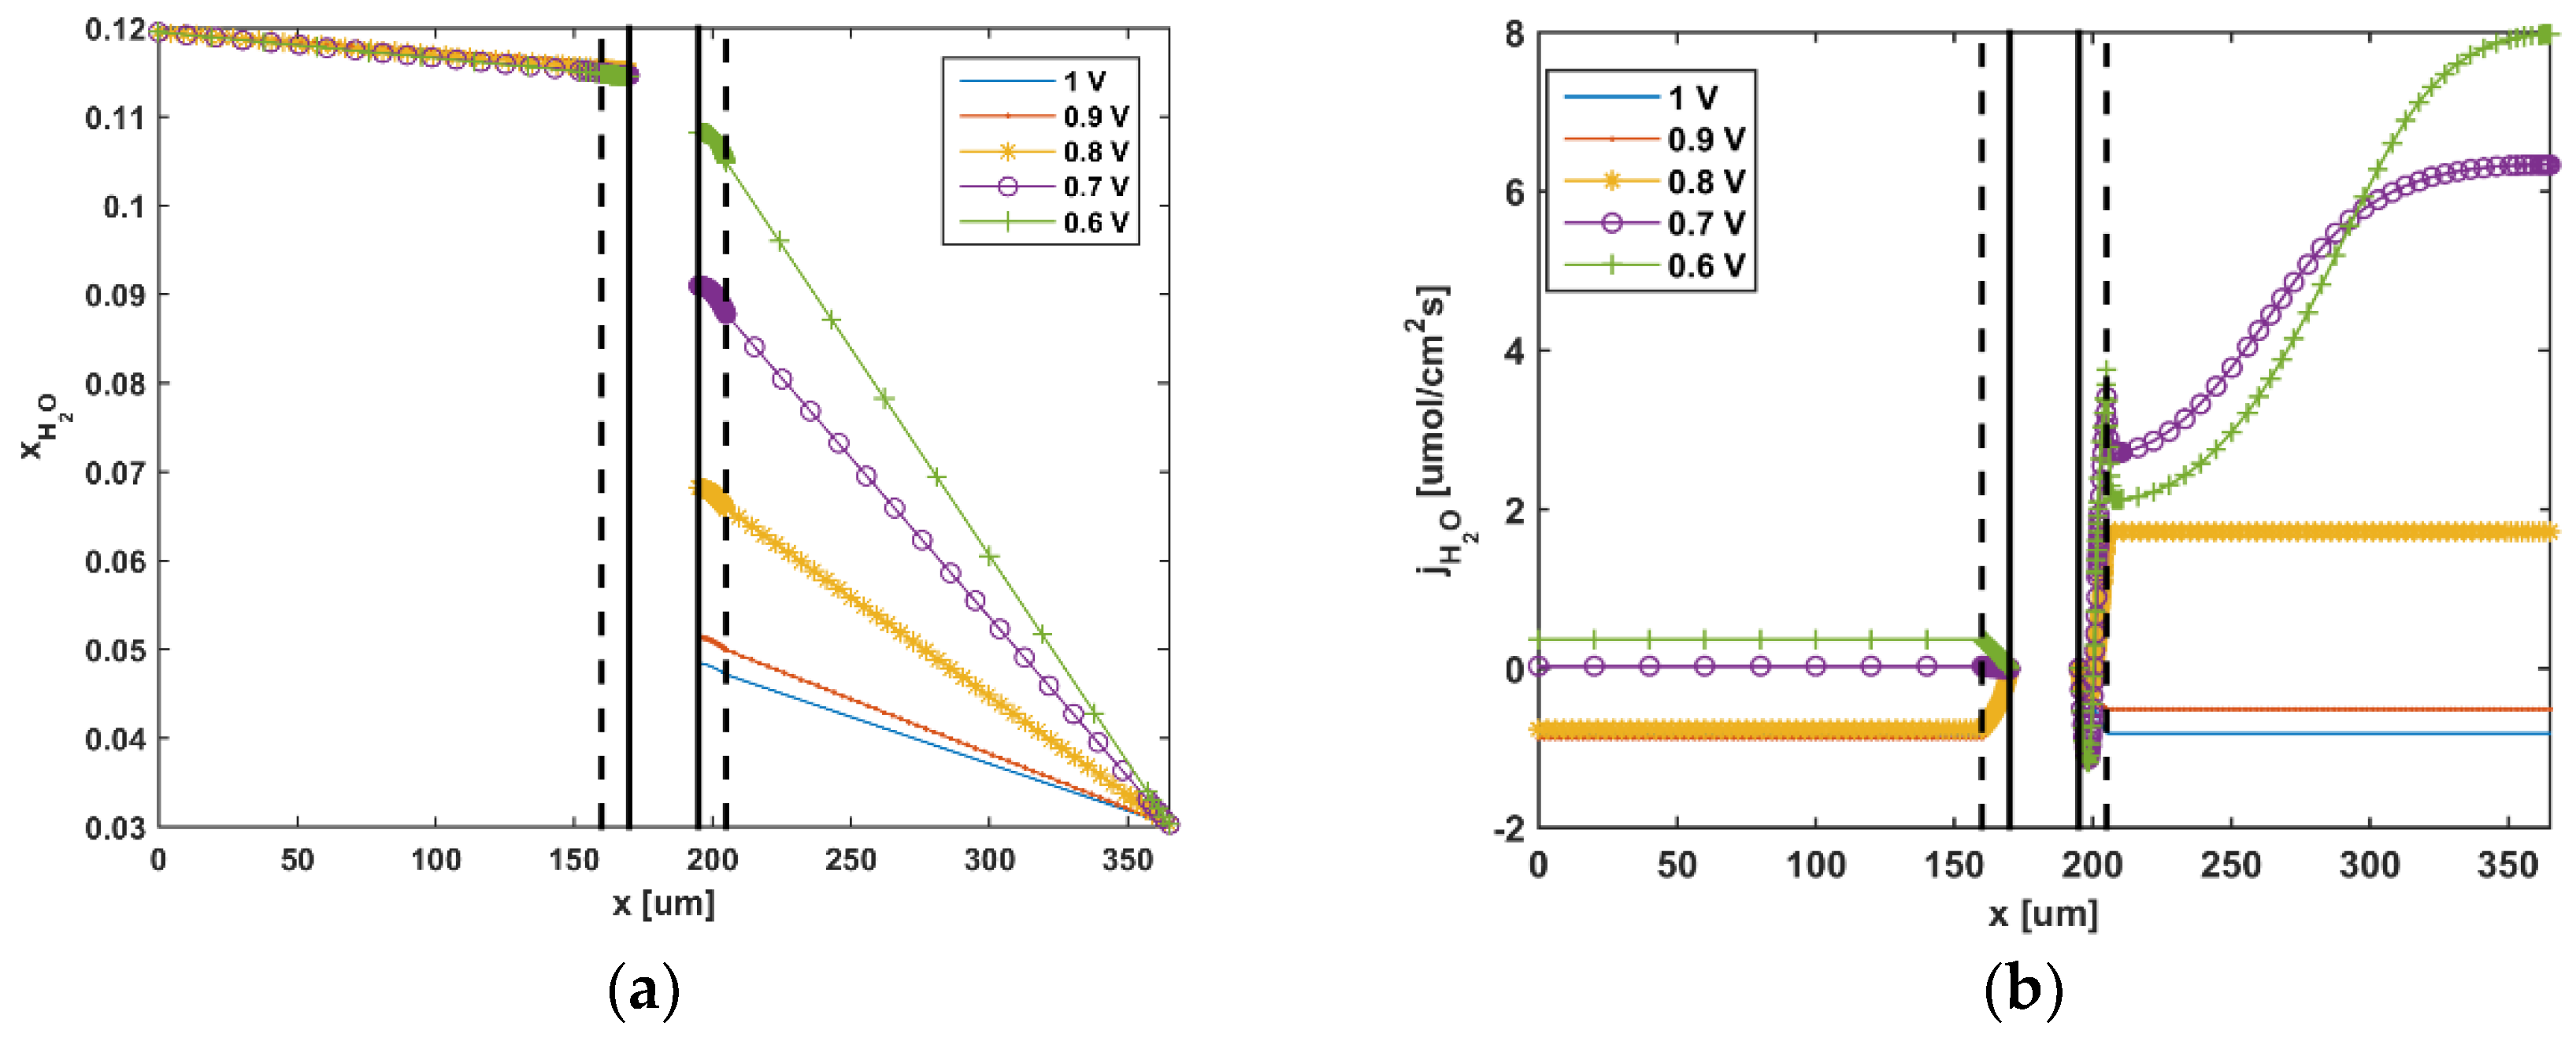
In this study, the membrane is assumed impermeable to gas based on the simulation for the open-cathode PEM fuel cell. Open-cathode PEM fuel cells are common in low-power stacks and operate at a low pressure. The membrane is assumed impermeable to gas to reduce the complexity of the calculation. Even if infiltration occurs at all, the amount of gas seepage through the membrane is negligible. Thus, hydrogen is only present at the anode, whereas oxygen is only at the cathode side, as shown in Figure 8a,b, respectively. The molecular number of hydrogen and oxygen on the side near the CL is relatively low, which is due to the constant consumption of fuel on each side of the CLs. As cell voltage decreases, the diffusion capacity of hydrogen and oxygen in the anode and cathode decreases. The corresponding change of gas flux also verifies this phenomenon, as shown in Figure 8c,d. The mechanism of water transport is complicated because it involves phase transition. The distribution of water vapor and the transport of water in the ionomer are discussed in the simulation. As mentioned above, the fuel cell stabilization after a period of time, and the anode water molecules are almost in a saturated state. The purge valve of the gas supply system will regularly trigger to update the internal gas and remove excess water, and water in liquid form is observed. Therefore, the gas inside the anode is basically saturated. However, the cathode side is affected by the fan, which can be taken away by the flowing air in a time when the fuel cell produces water, failing to gather liquid water. For these reasons, the water vapor in the cathode runner cannot reach the saturation state, which causes the rapid diffusion of water molecules. The diffusion of water is more active on the cathode side, as shown in Figure 9a,b.
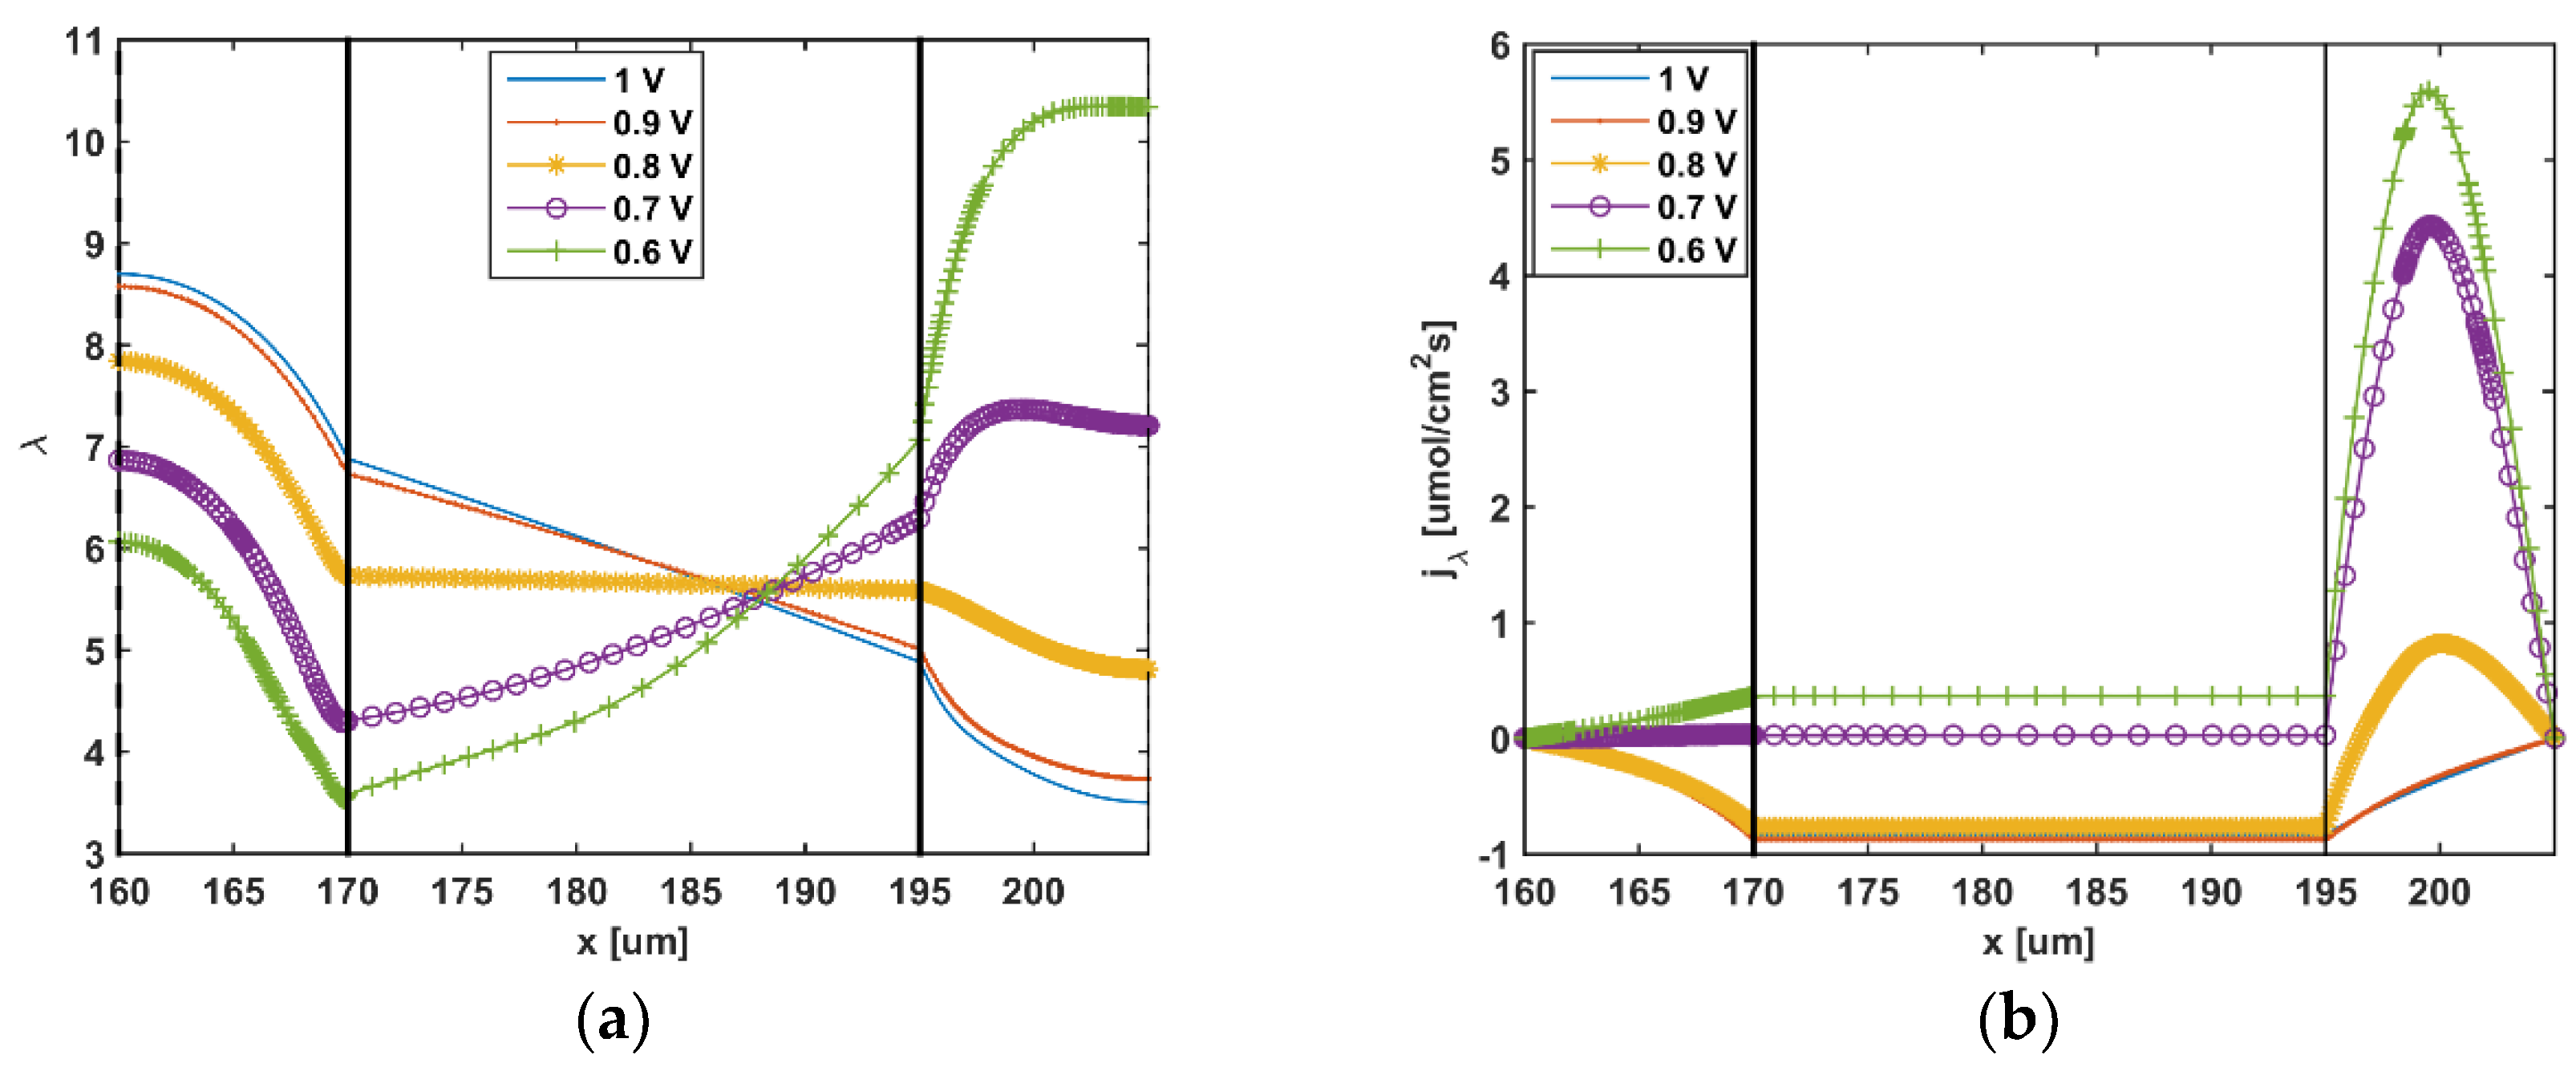
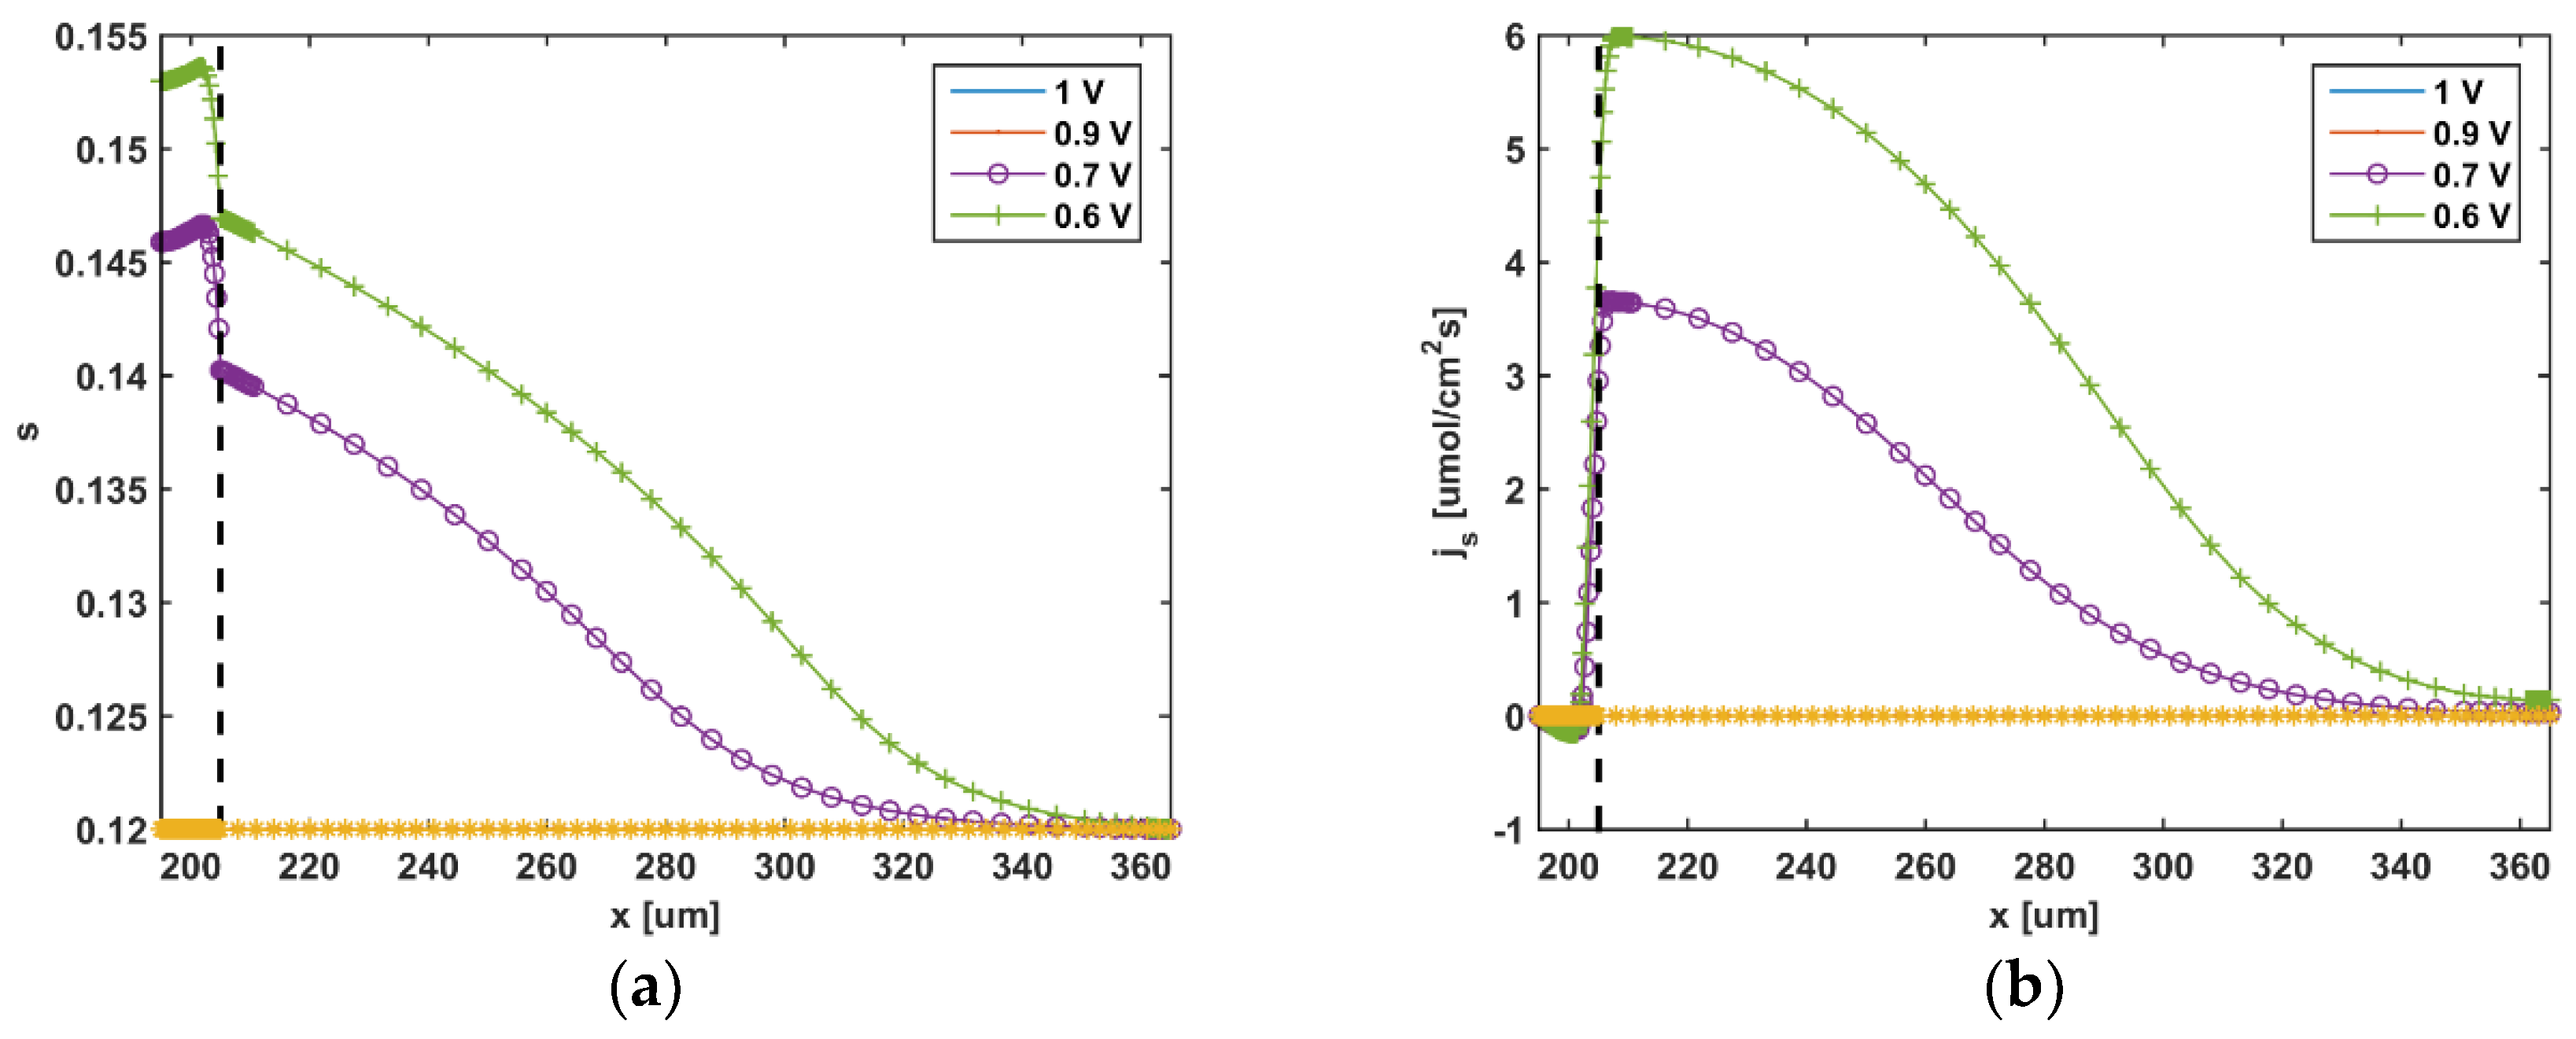
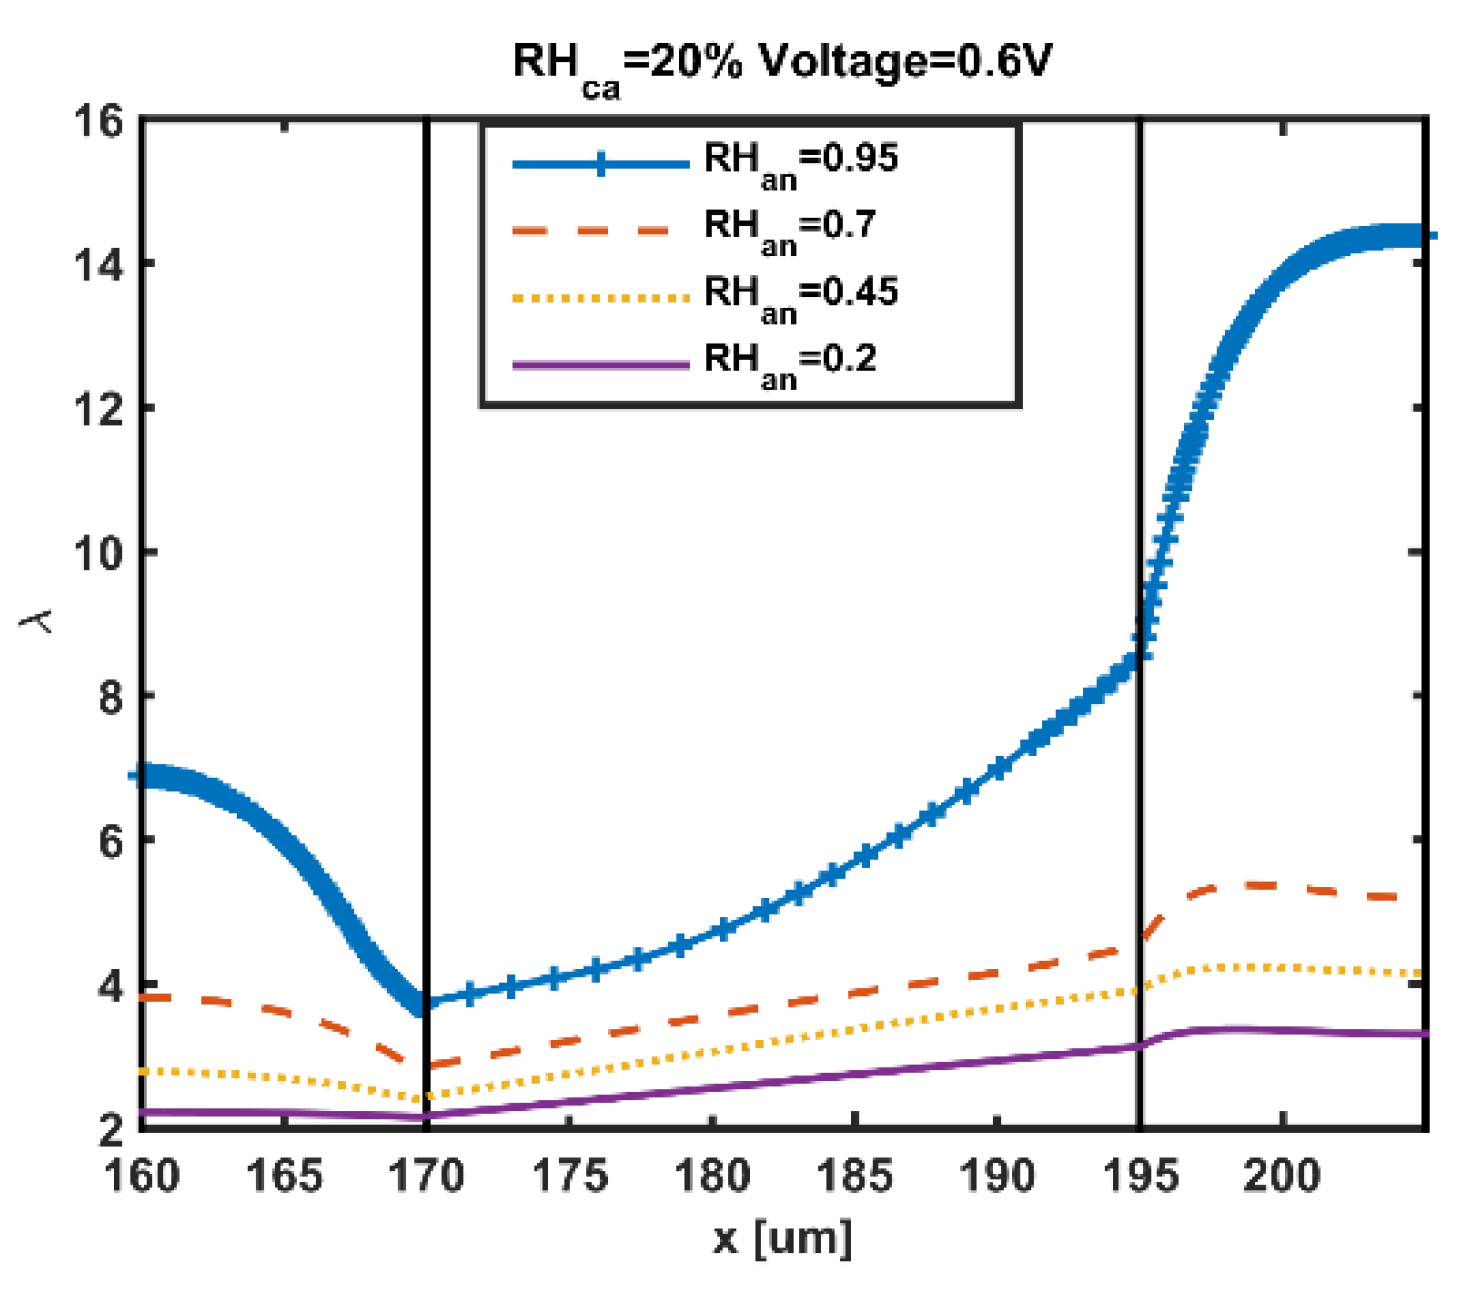
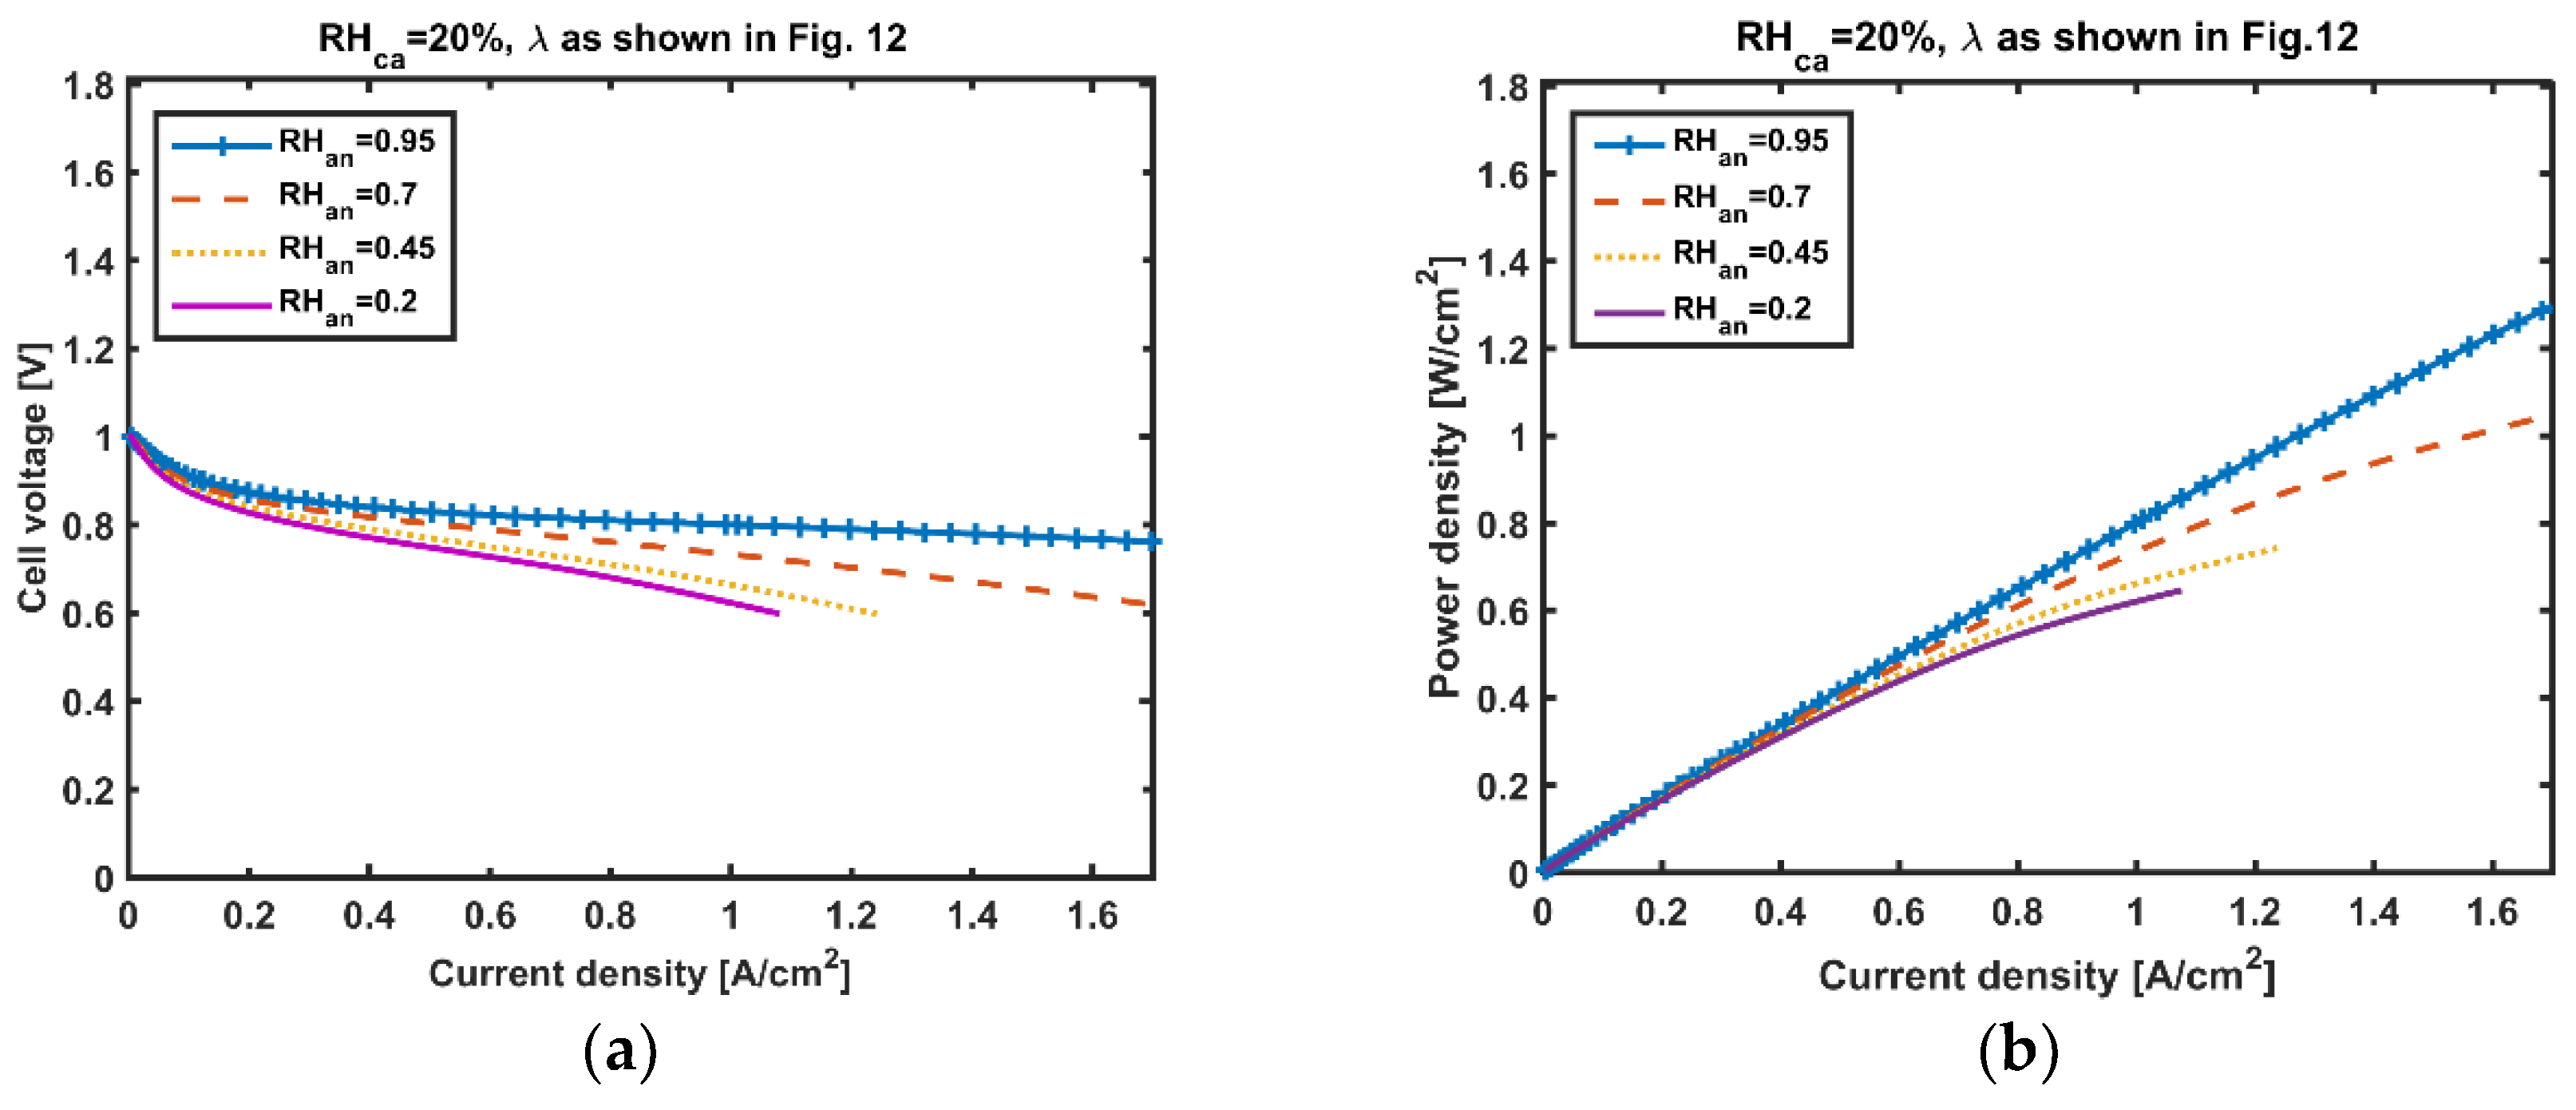
The content of dissolved water in the membrane is not high, but it has a remarkable influence on proton conductivity, and its related activity subdomain is mainly on the cathode side. In this simulation, the distribution and diffusion of dissolved water are shown in Figure 10a,b, respectively. When the relative humidity of the gas in the channel is saturated, the water generated by the fuel cell reaction will be directly precipitated out in the form of liquid. In case water cannot be purged out in time, the porous media will be blocked by water, thus reducing the contact area between the catalyst and the reaction gas, resulting in a decrease in reaction rate. The transport state of liquid water is described in Figure 11a,b. The theory of describing the transport of liquid water is based on Darcy’s law. The activity of liquid water is mainly affected by pressure difference and gas saturation. At the same time, RHca = 20% at a given humidity on one side of the cathode, the voltage at the maximum output power is 0.6 V, and the water distribution on the fuel cell proton exchange membrane is observed at a different anode humidity, as shown in the results Figure 12. The water content of the membrane on the anode side is affected by the water content on the cathode side. This phenomenon is mainly caused by osmotic pressure difference and electric traction. In the case of fixed cathode humidity, the influence of different anode humidity on fuel cell output performance is presented in Figure 13. The results show that the output performance is more superior when the anode membrane is adequately humidified.
6. Conclusions
In this work, the two-phase model with non-isothermal phenomena for an open-cathode PEM fuel cell is studied, including gas-phase mass transport, water transport in the ionomer, and humidity-dependent ionomer conductivity. The simulation mainly focuses on the fuel cell in the steady state, such that the temperature and humidity on both sides of the cathode and anode are assumed to be fixed. The gas pressure on both sides of the cathode and anode is relatively low because it is an open cathode fuel cell. The diffusion of oxygen and hydrogen is only on the cathode side and the anode side respectively, and no penetration occurs in MEA. However, as the dissolved water moves freely on both sides of the MEA, the phenomenon is analyzed in detail, as shown in Figure 10. The channel humidity of the open-cathode side is measured by an experiment that is referred to as a parameter in the analysis model. Models illustrated that the performance of a low-temperature PEM fuel cell is affected by the relative humidity of the inlet gases. The simulation results show that the diffusion ability of all species on the cathode side is more evident for an open-cathode PEM fuel cell.
Author Contributions
Conceptualization, all authors; writing—original draft preparation, W.-W.Y.; software, W.-W.Y. and K.O.; formal analysis, all authors; writing—review and editing, S.J. and Y.-B.K.; Funding acquisition, K.O. All authors have read and agreed to the published version of the manuscript.
Funding
This work was supported by the Qishan Scholar Program (GXRC-20104) in Fuzhou University and the National Research Foundation of Korea (18R1D1A1B07044005).
Institutional Review Board Statement
Not applicable.
Informed Consent Statement
Not applicable.
Data Availability Statement
Data are contained within this study.
Conflicts of Interest
The authors declare no conflict of interest.
Nomenclature
| Abbreviations | |
| ACL | Anode catalyst layer |
| CCL | Cathode catalyst layer |
| CL | Catalyst layer |
| EW | Equivalent weight |
| GC | Gas channel |
| GDE | Gas-diffusion electrode |
| GDL | Gas diffusion layer |
| HOR | Hydrogen oxidation reaction |
| MEA | Membrane-electrode assembly |
| MPL | Microporous layer |
| ORR | Oxygen reduction reaction |
| PEM | Polymer electrolyte membrane |
| PDE | Partial differential equation |
| Symbols | |
| C | Total interstitial gas concentration [mol/m3] |
| Cv,an | Water concentration on the surface area of the membrane at the anode side [mol/m3] |
| Cv,ca | Water concentration on the surface area of the membrane at the cathode side [mol/m3] |
| Di | Diffusivity of O2, H2, and H2O in the gas mixture [m2/s] |
| Di,ref | Diffusivity of i at reference conditions [m2/s] |
| Dcl | Knudsen diffusion coefficient [m2/s] |
| Dλ | Diffusion coefficient of dissolved water [m2/s] |
| Dw | Water diffusion coefficient related to the water activity [m2/s] |
| F | Faraday’s constant (96,485 C mol−1) |
| Had | Water ab-/desorption enthalpy [J/mol] |
| Hec | Evaporation/condensation enthalpy [J/mol] |
| J | Flux [A/m2] |
| L | Layer thickness [m] |
| Mw | Molar mass of water [kg/mol] |
| Mm,dry | Molar mass of water [kg/mol] |
| Nelectro | The net transport water caused by electro-osmotic drag [mol/(s∙cm2)] |
| Ndiffusion | The net transport water caused by back-diffusion [mol/(s∙cm2)] |
| P | Absolute gas pressure [Pa] |
| Pref | Reference pressure (1 atm, 101,325 Pa) |
| Psat | Saturation water vapor pressure [Pa] |
| Pa | Gas pressure in anode gas channel [Pa] |
| Pc | Gas pressure in cathode gas channel [Pa] |
| R | Gas constant (8.31446 J/mol K) |
| RH | Relative gas humidity [–] |
| RHa | Relative humidity in anode gas channel [–] |
| RHc | Relative humidity in cathode gas channel [–] |
| SH2O | Source term of hydrogen |
| SO2 | Source term of oxygen |
| Selectron | Source term of electrons |
| Sproton | Source term of protons |
| Swater | Source term of water |
| Sλ | Dissolved water reaction rate [mol/m3s] |
| ST | Heat source [W/m3] |
| Sred | Reduced liquid water saturation [–] |
| T | Absolute temperature [K] |
| Tref | Reference temperature [K] |
| Tst | Stack temperature [K] |
| Ta | Temperature of anode plate and GC [K] |
| Tc | Temperature of cathode plate and GC [K] |
| U | Open voltage of single fuel cell [V] |
| VW | Molar volume of liquid water [m3/mol] |
| Vm | Acid equivalent volume of membrane [m3/mol] |
| a | Active surface area density [1/m] |
| alg | Liquid–gas interfacial area density prefactor [1/m] |
| i | Electrochemical reaction rate [A/m3] |
| i0 | Exchange current density [A/m2] |
| ki | Water absorption/desorption transfer coefficient [m/s] |
| ke | Water evaporation transfer coefficient [m/s] |
| kc | Water condensation transfer coefficient [m/s] |
| nd | Electro-osmotic drag coefficient |
| Equivalent capillary radius [m] | |
| s | Liquid water saturation [–] |
| tm | Membrane thickness |
| ΔE | Galvani potential difference [V] |
| ΔE0 | Reversible potential difference [V] |
| ΔG | Gibbs free energy difference [J/mol] |
| ΔH | Enthalpy of formation of liquid water [J/mol] |
| ΔSHOR | Hydrogen oxidation reaction entropy [J/mol K] |
| ΔSORR | Oxygen reduction reaction entropy [J/mol K] |
| Greek letters | |
| αH2 | Mole fraction of hydrogen in dry fuel gas [–] |
| αO2 | Mole fraction of oxygen in dry oxidant gas [–] |
| β | Half-reaction symmetry factor [–] |
| γi | Water evaporation/condensation rate [1/s] |
| σe | Electric conductivity [S/m] |
| σp | Protonic conductivity [S/m] |
| εP | Porosity of the GDLs [–] |
| η | Activation overpotential [V] |
| κ | Hydraulic permeability [m2] |
| λ | Ionomer water content [–] |
| λan | Ionomer water content in anode [–] |
| λca | Ionomer water content in cathode [–] |
| λeq | Equilibrium ionomer water content [–] |
| μ | Dynamic viscosity of liquid water [Pa s] |
| ξ | Electro-osmotic drag coefficient [–] |
| π | Ratio of circumference to diameter [–] |
| ρm,dry | Dry density of membrane [kg m−3] |
| ϕe | Electrode phase potential [V] |
| ϕp | Electrolyte phase potential [V] |
| Water vapor mole fraction [–] | |
| Saturation water vapor mole fraction [–] | |
| Hydrogen mole fraction in anode GC [–] | |
| Water vapor mole fraction in anode GC [–] | |
| Oxygen mole fraction in cathode GC [–] | |
| Water vapor mole fraction in cathode GC [–] | |
| ψ | Empirical coefficient |
References
- Weber, A.Z.; Borup, R.L.; Darling, R.M.; Das, P.K.; Dursch, T.J.; Gu, W.; Harvey, D.B.; Kusoglu, A.; Litster, S.; Mench, M.M.; et al. A Critical Review of Modeling Transport Phenomena in Polymer-Electrolyte Fuel Cells. J. Electrochem. Soc. 2014, 161, F1254–F1299. [Google Scholar] [CrossRef] [Green Version]
- Uddin, K.M.S.; Saha, L.K.; Oshima, N. Water Transport through the Membrane of PEM Fuel Cell. Am. J. Comput. Appl. Math. 2014, 4, 225–238. [Google Scholar] [CrossRef]
- Omasta, T.J.; Wang, L.; Peng, X.; Lewis, C.A.; Varcoe, J.R.; Mustain, W.E. Importance of balancing membrane and electrode water in anion exchange membrane fuel cells. J. Power Sources 2018, 375, 205–213. [Google Scholar] [CrossRef] [Green Version]
- Iranzo, A.; Boillat, P. Liquid water distribution patterns featuring back-diffusion transport in a PEM fuel cell with neutron imaging. Int. J. Hydrogen Energy 2014, 39, 17240–17245. [Google Scholar] [CrossRef]
- Zhang, G.; Jiao, K. Multi-phase models for water and thermal management of proton exchange membrane fuel cell: A review. J. Power Sources 2018, 391, 120–133. [Google Scholar] [CrossRef]
- Jiao, K.; Li, X. Water transport in polymer electrolyte membrane fuel cells. Prog. Energy Combust. 2011, 37, 221–291. [Google Scholar] [CrossRef]
- Wiley, D.; Weihs, G.F. Electroosmotic Drag in Membranes. Encycl. Membr. 2016. [Google Scholar] [CrossRef]
- Kalantari, H. Numerical Analysis of Water Distribution in the Various Layers of Proton Exchange Membrane Fuel Cells. Comput. Chem. Eng. 2018, 118, 14–24. [Google Scholar] [CrossRef]
- Kim, S.; Mench, M.M. Investigation of temperature-driven water transport in polymer electrolyte fuel cell: Thermo-osmosis in membranes. J. Membr. Sci. 2009, 328, 113–120. [Google Scholar] [CrossRef]
- Gandomi, Y.A.; Edmundson, M.D.; Busby, F.C.; Mench, M.M. Water Management in Polymer Electrolyte Fuel Cells through Asymmetric Thermal and Mass Transport Engineering of the Micro-Porous Layers. J. Electrochem. Soc. 2016, 163, F933. [Google Scholar] [CrossRef] [Green Version]
- Li, S.; Sundén, B. Effects of gas diffusion layer deformation on the transport phenomena and performance of PEM fuel cells with interdigitated flow fields. Int. J. Hydrogen Energy 2018, 43, 16279–16292. [Google Scholar] [CrossRef]
- Iranzo, A.; Boillat, P. CFD simulation of the transient gas transport in a PEM fuel cell cathode during AC impedance testing considering liquid water effects. Energy 2018, 158, 449–457. [Google Scholar] [CrossRef]
- Muirhead, D.; Banerjee, R.; Lee, J.; George, M.G.; Ge, N.; Liu, H.; Chevalier, S.; Hinebaugh, J.; Han, K.; Bazylak, A. Simultaneous characterization of oxygen transport resistance and spatially resolved liquid water saturation at high-current density of polymer electrolyte membrane fuel cells with varied cathode relative humidity. Int. J. Hydrogen Energy 2017, 42, 29472–29483. [Google Scholar] [CrossRef]
- Gholizadeh, M.; Ghazikhani, M.; Khazaee, I. Effect of changing the water balance on electro-osmotic flow in an elliptical single proton exchange membrane fuel cell. Energy Convers. Manag. 2016, 120, 44–50. [Google Scholar] [CrossRef]
- AlRwashdeh, S.S.; Markötter, H.; Haußmann, J.; Arlt, T.; Klages, M.; Scholta, J.; Banhart, J.; Manke, I. Investigation of water transport dynamics in polymer electrolyte membrane fuel cells based on high porous micro porous layers. Energy 2016, 102, 161–165. [Google Scholar] [CrossRef]
- Yan, Q.; Toghiani, H.; Wu, J. Investigation of water transport through membrane in a PEM fuel cell by water balance experiments. J. Power Sources 2006, 158, 316–325. [Google Scholar] [CrossRef]
- Sanchez, D.G.; Ruiu, T.; Friedrich, K.A.; Sanchez-Monreal, J.; Vera, M. Analysis of the Influence of Temperature and Gas Humidity on the Performance Stability of Polymer Electrolyte Membrane Fuel Cells. J. Electrochem. Soc. 2015, 163, F150. [Google Scholar] [CrossRef] [Green Version]
- Bezmalinović, D.; Strahl, S.; Roda, V.; Husar, A. Water transport study in a high temperature proton exchange membrane fuel cell stack. Int. J. Hydrogen Energy 2014, 39, 10627–10640. [Google Scholar] [CrossRef] [Green Version]
- Edwards, R.L. Simplified, Alternative Formulation of Numerical Simulation of Proton Exchange Membrane Fuel Cell. Ph.D. Thesis, Doctor of Philosophy, Department of Mechanical Aerospace Engineering, Old Dominion University, Norfolk, VA, USA, 2018. [Google Scholar] [CrossRef]
- Zamel, N.; Li, X. Effective transport properties for polymer electrolyte membrane fuel cells—With a focus on the gas diffusion layer. Prog. Energy Combust. 2013, 39, 111–146. [Google Scholar] [CrossRef]
- Kurnia, J.C.; Chaedir, B.A.; Sasmito, A.P.; Shamim, T. Progress on open cathode proton exchange membrane fuel cell: Performance, designs, challenges and future directions. Appl. Energy 2021, 283, 116359. [Google Scholar] [CrossRef]
- Vetter, R.; Schumacher, J.O. Free open reference implementation of a two-phase PEM fuel cell model. Comput. Phys. Commun. 2019, 234, 223–234. [Google Scholar] [CrossRef]
- Hu, J.; Li, J.; Xu, L.; Huang, F.; Ouyang, M. Analytical calculation and evaluation of water transport through a proton exchange membrane fuel cell based on a one-dimensional model. Energy 2016, 111, 869–883. [Google Scholar] [CrossRef]
- Rakhshanpouri, S.; Rowshanzamir, S. Water transport through a PEM (proton exchange membrane) fuel cell in a seven-layer model. Energy 2013, 50, 220–231. [Google Scholar] [CrossRef]
- Song, G.H.; Meng, H. Numerical modeling and simulation of PEM fuel cells: Progress and perspective. Acta Mech. Sin. 2013, 29, 318–334. [Google Scholar] [CrossRef]
- Wang, Z.; Zeng, Y.; Sun, S.; Shao, Z.; Yi, B. Improvement of PEMFC water management by employing water transport plate as bipolar plate. Int. J. Hydrogen Energy 2017, 42, 21922–21929. [Google Scholar] [CrossRef]
- Wawdee, P.; Limtrakul, S.; Vatanatham, T.; Fowler, M.W. Water transport in a PEM fuel cell with slanted channel flow field plates. Int. J. Hydrogen Energy 2015, 40, 3739–3748. [Google Scholar] [CrossRef]
- Jeon, D.H. The impact of rib structure on the water transport behavior in gas diffusion layer of polymer electrolyte membrane fuel cells. J. Energy Inst. 2019, 92, 755–767. [Google Scholar] [CrossRef]
- Aslam, R.M.; Ingham, D.B.; Ismail, M.S.; Hughes, K.J.; Ma, L.; Pourkashanian, M. Simultaneous thermal and visual imaging of liquid water of the PEM fuel cell flow channels. J. Energy Inst. 2019, 92, 311–318. [Google Scholar] [CrossRef]
- Huo, S.; Jiao, K.; Park, J.W. On the water transport behavior and phase transition mechanisms in cold start operation of PEM fuel cell. Appl. Energy 2019, 233–234, 776–788. [Google Scholar] [CrossRef]
- Bhaiya, M.; Putz, A.; Secanell, M. Analysis of non-isothermal effects on polymer electrolyte fuel cell electrode assemblies. Electrochim. Acta 2014, 147, 294–309. [Google Scholar] [CrossRef]
- Yoshimune, W.; Kato, S.; Yamaguchi, S. Multi-scale pore morphologies of a compressed gas diffusion layer for polymer electrolyte fuel cells. Int. J. Heat Mass Transf. 2020, 152, 119537. [Google Scholar] [CrossRef]
- Liu, X.; Peng, F.; Lou, G.; Wen, Z. Liquid water transport characteristics of porous diffusion media in polymer electrolyte membrane fuel cells: A review. J. Power Sources 2015, 299, 85–96. [Google Scholar] [CrossRef]
- Martinez, N.; Peng, Z.; Morin, A.; Porcar, L.; Gebel, G.; Lyonnard, S. Real time monitoring of water distribution in an operando fuel cell during transient states. J. Power Sources 2017, 365, 230–234. [Google Scholar] [CrossRef]
- Duan, Q.; Wang, H.; Benziger, J. Transport of liquid water through Nafion membranes. J. Membr. Sci. 2012, 392–393, 88–94. [Google Scholar] [CrossRef]
- Wijmans, J.G.; Baker, R.W. The solution-diffusion model: A review. J. Membr. Sci. 1995, 107, 1–21. [Google Scholar] [CrossRef]
- Cha, D.; Ahn, J.H.; Kim, H.S.; Kim, Y. Effects of clamping force on the water transport and performance of a PEM (proton electrolyte membrane) fuel cell with relative humidity and current density. Energy 2015, 93, 1338–1344. [Google Scholar] [CrossRef]
- Sundén, B. Transport phenomena in fuel cells. In Hydrogen, Batteries and Fuel Cells, 1st ed.; Jones, G., Ed.; Academic Press: Cambridge, MA, USA, 2019; Chapter 9; pp. 145–166. [Google Scholar]
- Jithin, M.; Siddharth, S.; Das, M.K.; De, A. Simulation of coupled heat and mass transport with reaction in PEM fuel cell cathode using lattice Boltzmann method. Therm. Sci. Eng. Prog. 2017, 4, 85–96. [Google Scholar] [CrossRef]
Figure 1.
Structure of open-cathode PEM fuel cell: (a) anode channel and cathode channel diagram; (b) the through-plane configuration of Open-cathode PEM figure.
Figure 1.
Structure of open-cathode PEM fuel cell: (a) anode channel and cathode channel diagram; (b) the through-plane configuration of Open-cathode PEM figure.

Figure 2.
Schematic diagram of the 1-D model domains.

Figure 3.
(a) The relationship between electrolyte conductivity and water absorption; (b) The relationship between water absorption and water activity in ionomers.
Figure 3.
(a) The relationship between electrolyte conductivity and water absorption; (b) The relationship between water absorption and water activity in ionomers.

Figure 4.
Polarization curve and power density of fuel cell.

Figure 5.
At different cell voltages, calculation of the electrode-electrolyte potentials on through-plane. Subdomain boundaries are indicated by vertical lines. The anode is on the left, the cathode on the right-hand side. (a) The Galvani potential of proton-conducting phase; (b) the Galvani potential of electron-conducting phase; (c) the flux of proton-conducting phase; (d) the flux of electron-conducting phase.


Figure 6.
Measurement of relative humidity variation at the cathode: (a) power density varied condition; (b) relative humidity of cathode.
Figure 6.
Measurement of relative humidity variation at the cathode: (a) power density varied condition; (b) relative humidity of cathode.

Figure 7.
Thermal profiles along through-plane (a) temperature distribution; (b) heat flux profile.

Figure 8.
Evolution of the gas profiles on through-plane (a) hydrogen diffusion profile; (b) oxygen diffusion profile; (c) hydrogen flux profile; (d) oxygen flux profile.
Figure 8.
Evolution of the gas profiles on through-plane (a) hydrogen diffusion profile; (b) oxygen diffusion profile; (c) hydrogen flux profile; (d) oxygen flux profile.


Figure 9.
Evolution of the water vapor profiles on through-plane (a) water vapor diffusion profile; (b) water vapor flux profile.
Figure 9.
Evolution of the water vapor profiles on through-plane (a) water vapor diffusion profile; (b) water vapor flux profile.

Figure 10.
Profiles of water transport in ionomer: (a) prediction of the water content of membrane in different domains; (b) prediction of the flux of water content of membrane in different domains.
Figure 10.
Profiles of water transport in ionomer: (a) prediction of the water content of membrane in different domains; (b) prediction of the flux of water content of membrane in different domains.

Figure 11.
Evolution of the liquid water profiles on through-plane: (a) liquid water diffusion profile; (b) liquid water flux profile.
Figure 11.
Evolution of the liquid water profiles on through-plane: (a) liquid water diffusion profile; (b) liquid water flux profile.

Figure 12.
Simulation result of the water content of membrane at different RHan and RHca = 20%.

Figure 13.
Voltage and power information of fuel cell at RHca = 20%: (a) fuel cell voltage at different relative humidity of anode; (b) fuel cell power density at different relative humidity of anode.
Figure 13.
Voltage and power information of fuel cell at RHca = 20%: (a) fuel cell voltage at different relative humidity of anode; (b) fuel cell power density at different relative humidity of anode.


Table 1.
Governing equations.
| Description | Symbol | Flux Equation | Continuity Equation |
|---|---|---|---|
| Fourier’s heat conduction | |||
| Water transport in ionomer | |||
| Ohm’s law of electrons | |||
| Ohm’s law of proton | |||
| Fickian oxygen diffusion | |||
| Fickian hydrogen diffusion | |||
| Fickian water vapor diffusion | |||
| Liquid water transport (Darcy’s law) |
Table 2.
Material and through-plane transport parameters.
| Symbol | Explanation | AGDL&CGDL | ACL&CCL | PEM |
|---|---|---|---|---|
| L | Layer thickness | 160 μm | 10 μm | 25 μm |
Table 3.
Operation condition.
| Symbol | Explanation | Value |
|---|---|---|
| RHC | Relative humidity in cathode GC | 20% |
| SC | Liquid saturation at CGDL/GC interface | 0.12 |
| TA | Temperature of anode plate and GC | 60 °C |
| TC | Temperature of cathode plate and GC | 58 °C |
| αH2 | Hydrogen mole fraction in dry fuel gas | 1.00 |
| αO2 | Oxygen mole fraction in dry oxidant gas | 0.21 |
Publisher’s Note: MDPI stays neutral with regard to jurisdictional claims in published maps and institutional affiliations. |
© 2021 by the authors. Licensee MDPI, Basel, Switzerland. This article is an open access article distributed under the terms and conditions of the Creative Commons Attribution (CC BY) license (https://creativecommons.org/licenses/by/4.0/).
Share and Cite
MDPI and ACS Style
Yuan, W.-W.; Ou, K.; Jung, S.; Kim, Y.-B. Analyzing and Modeling of Water Transport Phenomena in Open-Cathode Polymer Electrolyte Membrane Fuel Cell. Appl. Sci. 2021, 11, 5964. https://0-doi-org.brum.beds.ac.uk/10.3390/app11135964
AMA Style
Yuan W-W, Ou K, Jung S, Kim Y-B. Analyzing and Modeling of Water Transport Phenomena in Open-Cathode Polymer Electrolyte Membrane Fuel Cell. Applied Sciences. 2021; 11(13):5964. https://0-doi-org.brum.beds.ac.uk/10.3390/app11135964
Chicago/Turabian StyleYuan, Wei-Wei, Kai Ou, Seunghun Jung, and Young-Bae Kim. 2021. "Analyzing and Modeling of Water Transport Phenomena in Open-Cathode Polymer Electrolyte Membrane Fuel Cell" Applied Sciences 11, no. 13: 5964. https://0-doi-org.brum.beds.ac.uk/10.3390/app11135964
Note that from the first issue of 2016, this journal uses article numbers instead of page numbers. See further details here.