
Structure Optimization of Battery Thermal Management Systems Using Sensitivity Analysis and Stud Genetic Algorithms


Department of Mechanical and Electrical Engineering, University of Wenzhou, Wenzhou 325035, China
*
Author to whom correspondence should be addressed.
Appl. Sci. 2021, 11(16), 7440; https://0-doi-org.brum.beds.ac.uk/10.3390/app11167440
Submission received: 16 June 2021
/
Revised: 26 July 2021
/
Accepted: 10 August 2021
/
Published: 13 August 2021
(This article belongs to the Special Issue Intelligent Renewable Energy System: A Focus on Hydrogen Fuel Cells and Battery Storage with AI)
Abstract
:Battery thermal management systems (BTMS) are hugely important in enhancing the lifecycle of batteries and promoting the development of electric vehicles. The cooling effect of BTMS can be improved by optimizing its structural parameters. In this paper, flow resistance and heat dissipation models were used to optimize the structure of BTMS, which were more efficient than the computational fluid dynamics method. Subsequently, five structural parameters that affect the temperature inside the battery pack were analyzed using single-factor sensitivity analysis under different inlet airflow rates, and three structural parameters were selected as the constraints of a stud genetic algorithm. In this stud genetic algorithm, the maximal temperature difference obtained by the heat dissipation model was within 5K as the constraint function, where the objective function minimized the overall area of the battery pack. The BTMS optimized by the stud genetic algorithm was reduced by 16% in the maximal temperature difference and saved 6% of the battery package area compared with the original BTMS. It can be concluded that the stud genetic algorithm combined with the flow resistance network and heat dissipation models can quickly and efficiently optimize the air-cooled BTMS to improve the cooling performance.
1. Introduction
With the increasing problems of environmental pollution and energy shortages, electric vehicles have received special attention because of their advantages in energy conservation and emissions reduction. The core to developing electric vehicles is the power battery, and one of the main factors in the lifecycle of a battery is temperature. The power battery pack of an electric or hybrid vehicle is more likely to cause a large amount of heat generation and accumulation under high current charging and discharging conditions. If the heat cannot be released in time, the battery is prone to safety problems such as overheating, burning, and explosions [1,2,3]. Moreover, elevated local temperatures cause an increase in the temperature difference within the battery pack. Previous research shows that the optimal operating temperature range of lithium-ion batteries is 25–40 °C, and the battery pack temperature difference is less than 5 °C [4]. Hence, a reasonable BTMS can greatly lengthen the cycle life of batteries and accelerate the development of electric automobiles.
Depending on whether the air-cooling systems are affected by the external environment, electric vehicles can have either active or passive cooling modes. Passive cooling modes dissipate heat through natural air intake. Due to the influence of the external environment, they can only dissipate heat from the battery pack within a certain range. However, active cooling can reduce the influence of environmental factors and ensure that the battery remains within suitable working temperatures. Active cooling mainly includes forced air cooling [5,6,7], liquid cooling [8,9,10], and phase change material cooling [11,12,13,14,15]. Forced air cooling systems are widely used in battery thermal management systems because of their simple structure, low cost, and light weight.
According to the arrangement of the batteries, the air-cooling system can be either serial or parallel. Pesaran et al. [16,17] showed that serial ventilation with air flowing through the battery from the inlet causes the temperature to gradually rise, so that the battery temperature at the outlet of the battery pack is much higher than the temperature of the battery at the inlet. In parallel ventilation modes, the wedge-shaped inlet and outlet allow the air to be more evenly distributed between the batteries, thereby reducing the temperature difference.
Many previous studies have improved the heat dissipation performance by adjusting the structure of the BTMS. Wang et al. [18] evaluated the fans in different positions in air-cooled battery packs, and the results showed that when the fans are installed above the battery pack, a better cooling effect can be obtained. Xun et al. [19] and He et al. [20], respectively, studied the effect of battery spacing and battery-to-wall distance on the heat dissipation performance. It was found that when the distance increases, the system power consumption and the temperature difference of the battery pack decrease but the battery temperature increases.
In order to improve the cooling effect, some structural optimization approaches were introduced to adjust the structure of the battery pack to improve the heat dissipation performance of the BTMS. Severino et al. [21] used a particle swarm optimization algorithm to adjust the battery spacing and air intake position, reducing the temperature rise of the battery pack by 2 °C. Qian et al. [22] used a neural network to predict the temperature of the battery and optimized the thermal performance of BTMS by changing the battery spacing. The result showed that the temperature uniformity in the battery pack was improved after optimization.
The computational fluid dynamics (CFD) method is widely used in battery thermal management simulation because of its high accuracy. However, when optimizing the battery module, the CFD method usually requires multiple sets of simulations, and each simulation requires several hours of simulation. Especially when implementing a battery pack with many module simulations, it takes several weeks to get the optimal battery pack structure. The time consumed by CFD method is unacceptable in situations where a battery pack needs to be designed quickly, so Liu et al. [23] and Chen et al. [24] proposed the flow resistance network model and the heat transfer model to quickly estimate the temperature inside the battery pack. Compared with the CFD method, the flow resistance network model and the heat transfer model have a much smaller calculation amount, which greatly shortens the calculation time of the temperature, thereby also accelerating the process of system structure optimization.
In the previous literatures, many of them reduced the temperature by increasing the volume of the battery pack. Chen et al. [25] used the greedy algorithm to optimize the BTMS while increasing the size of the battery pack. Chen et al. [26] used Newton’s algorithm to reduce the temperature of the battery on the basis of increasing the volume of the battery pack. However, increasing the volume will reduce the number of batteries in the electric vehicle and reduce the driving time of the electric vehicle. This article used stud genetic algorithms to reduce the volume of the battery pack, which can increase the energy density of the battery pack. At the same time, the temperature in the battery pack was within a reasonable range to ensure the safe operation of the battery.
The structure of this article is organized as follows: a mathematical model of the heat dissipation of the battery pack is established in Section 2, and its accuracy is verified. In Section 3, structural parameters affecting the temperature inside the battery pack are analyzed using sensitivity analysis. Section 4 uses a stud genetic algorithm to optimize the area of the battery pack. Section 5 summarizes the conclusions.
2. Battery Pack Cooling Mathematical Model
2.1. Air-Cooled Battery Pack Structure Introduction
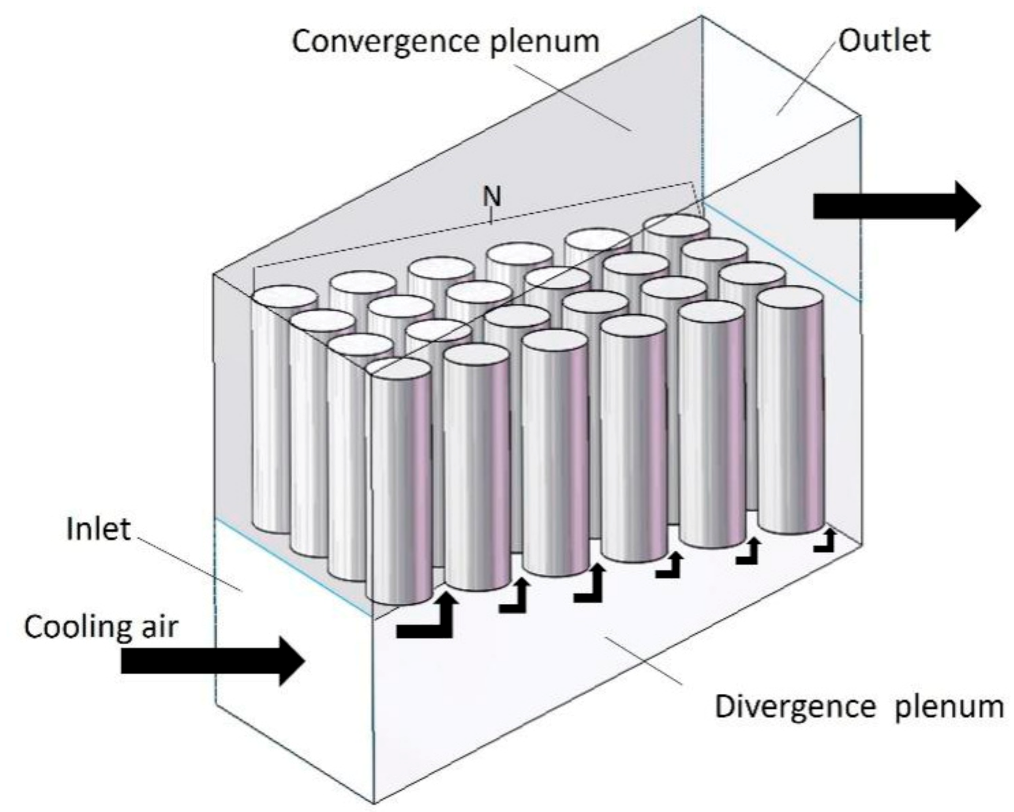
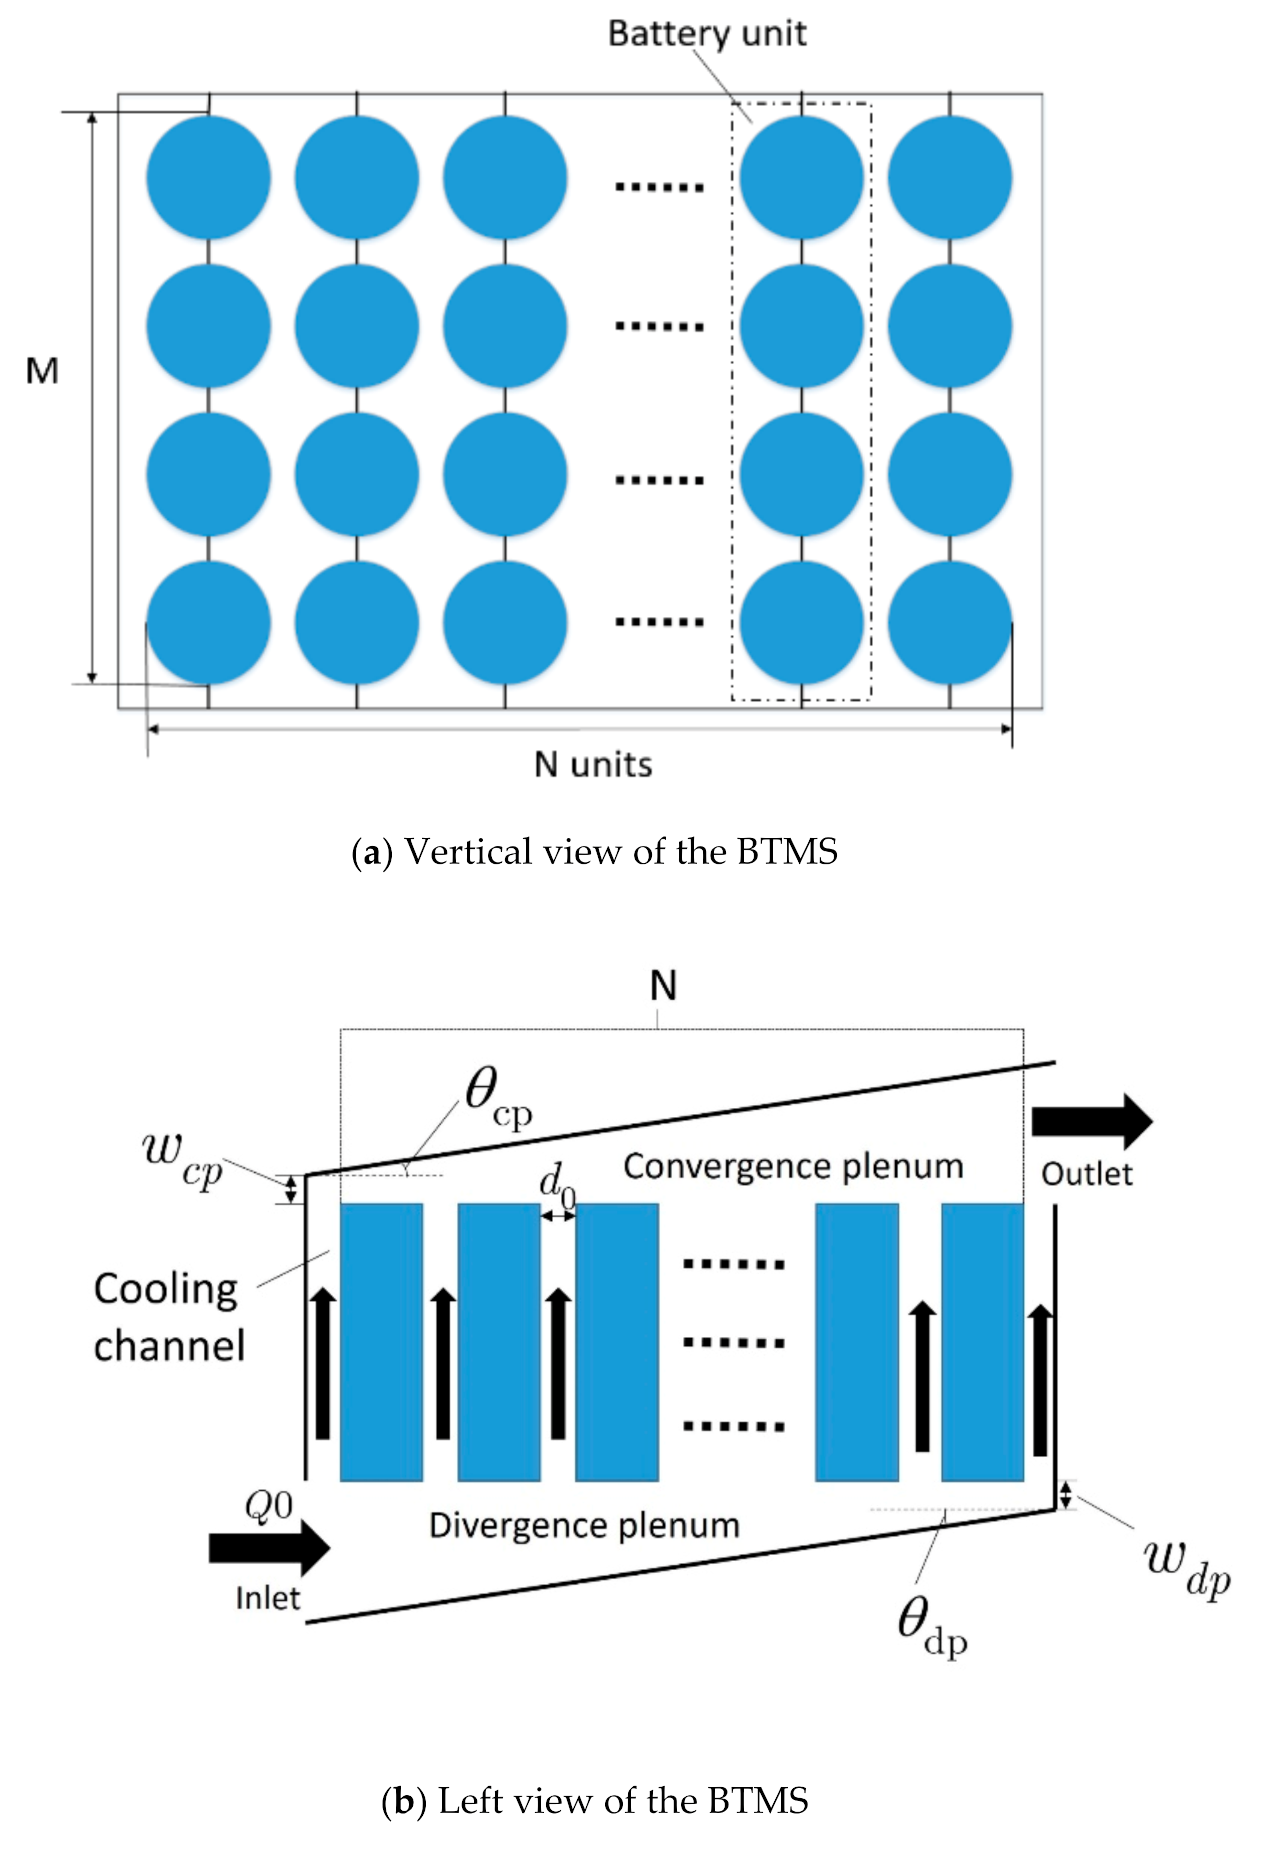
According to Pesaran et al. [16,17], the heat dissipation efficiency of a battery pack can be improved by using a parallel air supply system. Therefore, as shown in Figure 1, a parallel air supply cooling structure was used in this paper. There were 18,650 batteries in the battery pack. The battery was surrounded by baffles that regulated the flow of air. The cooling air flowed in from the inlet and through the wedge-shaped baffle of the divergence plenum (DP) and entered the cooling channel (CC) to cool the battery. Then the air flowed through the wedge-shaped baffle of the convergence plenum (CP) and flowed out of the battery pack. Figure 2a is a vertical view of the parallel air-cooled BTMS, where battery cells in each column are one battery unit, that is, there are battery units. Figure 2b is a left view of the parallel BTMS. The minimal widths of the battery units () in the battery pack were the same. The angle of the plate to the convergence () and divergence () plenums, as well as the minimal widths of the convergence () and divergence () plenums, affected the temperature field and the volume of the battery pack. When simulating the temperature field in the battery pack, computational fluid dynamics (CFD) was generally used for calculation because of its high accuracy. Compared with the CFD method, the mathematical model analyzed the heat dissipation process of the battery pack from the mechanism, clearly clarified the principle of the heat dissipation of the battery pack, and optimizing the battery pack with the mathematical model saved a lot of simulation time.
2.2. Flow Resistance Model
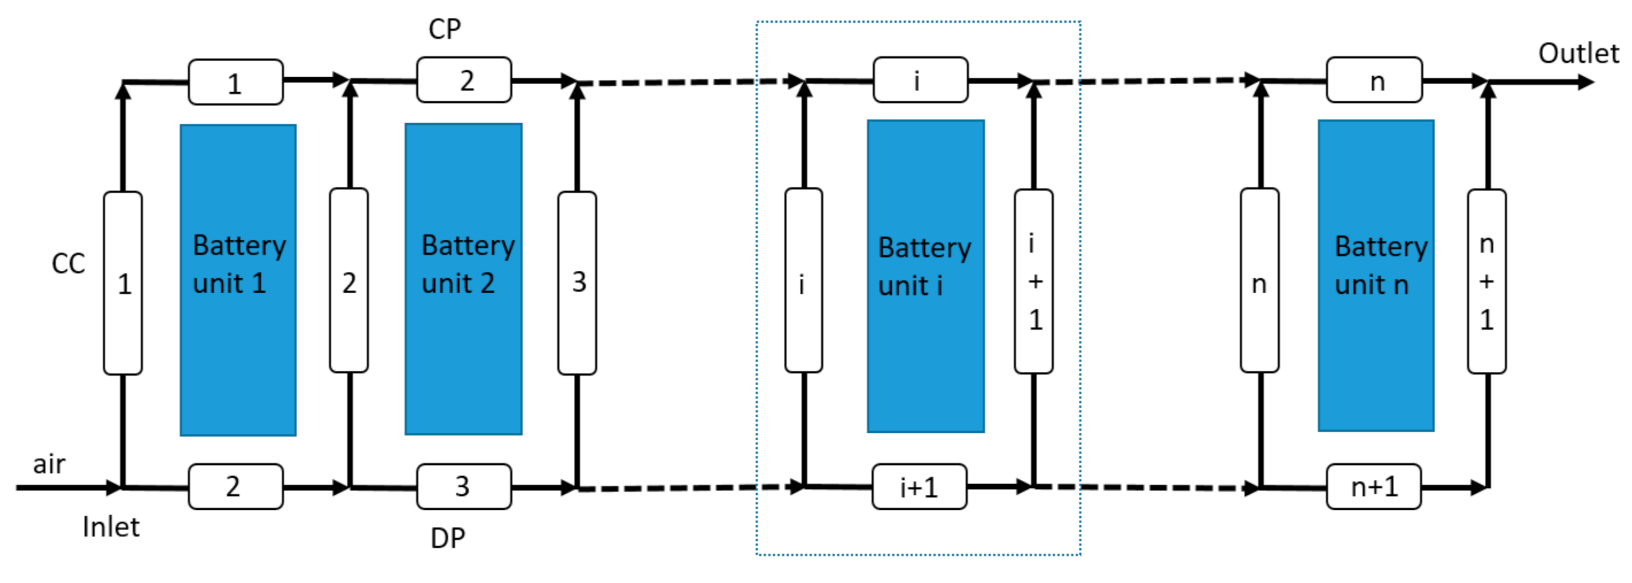
In previous studies, the CFD simulation of heat dissipation was computationally intensive [27,28,29]. Therefore, the flow resistance model was used to quickly estimate the flow field in the battery pack. The flow resistance model is shown in Figure 3. Since the cooling air diverged first and then converged, the divergence points and the convergence points are used as nodes to calculate each section. The blocks in the Figure 3 represent the static pressure lost when the air flowed. The static pressure loss consists of friction loss and local loss. The friction loss was caused by the friction of the air as it flowed. The local loss was caused by the air divergence and convergence. Since the air velocity was much less than acoustic sound, it is assumed that the air is an incompressible Newtonian fluid [30]. In the dotted box in Figure 3, the static pressure loss equation similar to Kirchhoff’s voltage law can be derived as [31]:
where , , , respectively correspond to the static pressure loss of the divergence plenum, the cooling channel, and the convergence plenum.
The total static pressure loss of each channel is equal to the sum of the friction pressure loss and the local pressure loss [31].
Local loss is caused by the large number of eddies that air produces during divergence and convergence. The local loss of each channel was calculated as follows [31]:
wher e is the local loss coefficient, and is the average velocity in each channel. The friction loss was calculated as follows [31]
where is the dimensionless friction factor, is the length of the segment and is the equivalent diameter of the segment.
The local loss coefficient is related to the geometric dimensioning of the battery pack and the direction of air. Based on the research of Basset et al. [32], the local loss coefficient of each divergence and convergence point can be expressed as:
where is the ratio of the sectional area of the convergence plenum and the divergence plenum to the cooling channel and is the ratio of the airflow rate of the sub-channel to the main channel.
The friction factor is related to the flow state of the air and can be expressed as [33]:
where is the shape factor, which is equal to 0.89 for rectangular cross-section channel. is the local Reynolds number and can be expressed as [33]:
where is the dynamics viscosity of the air, and is the air density.
It is assumed that air is an incompressible fluid, flow conservation is satisfied at each of the divergence and convergence points, similar to Kirchhoff’s current law. The following equations can be obtained [34]:
where is the inlet airflow rate, and is the average cross-sectional area of the channel. Equations (2)–(14) are related to the solution of the air velocities in Equation (1). When solving the flow resistance model, varies from 1 to . As shown in Figure 3, air is diverged and converged at the inlet and outlet of the cooling channel, and the model has cooling channels, so Equations (16)–(17) provide equations. There are battery units and loops in Figure 3, so Equation (1) provides equations. Since there are unknown air velocities to be sought in the model, when in Equation (15) is given, the unknown velocity in each segment can be obtained.
2.3. Heat Dissipation Model
According to the air velocity obtained from the flow resistance model, the faster the airflow velocity, the better the heat dissipation performance, and the difference of airflow velocities between cooling channels can reflect the temperature difference between battery units. In this section, the heat dissipation model was used to calculate the cylindrical battery temperature. In order to simplify the model, the following assumptions were made:
1. Since the temperature difference in the battery cell was smaller than that in the battery pack, the uneven temperature distribution on battery cell was ignored and we calculated the volume-averaged temperature of battery unit [25].
2. Due to the complex thermophysical parameters of the materials of the battery components, the weighted average method was used to calculate the physical parameters of the battery [35,36].
3. The air and the battery only exchanged heat in the cooling channel [25].
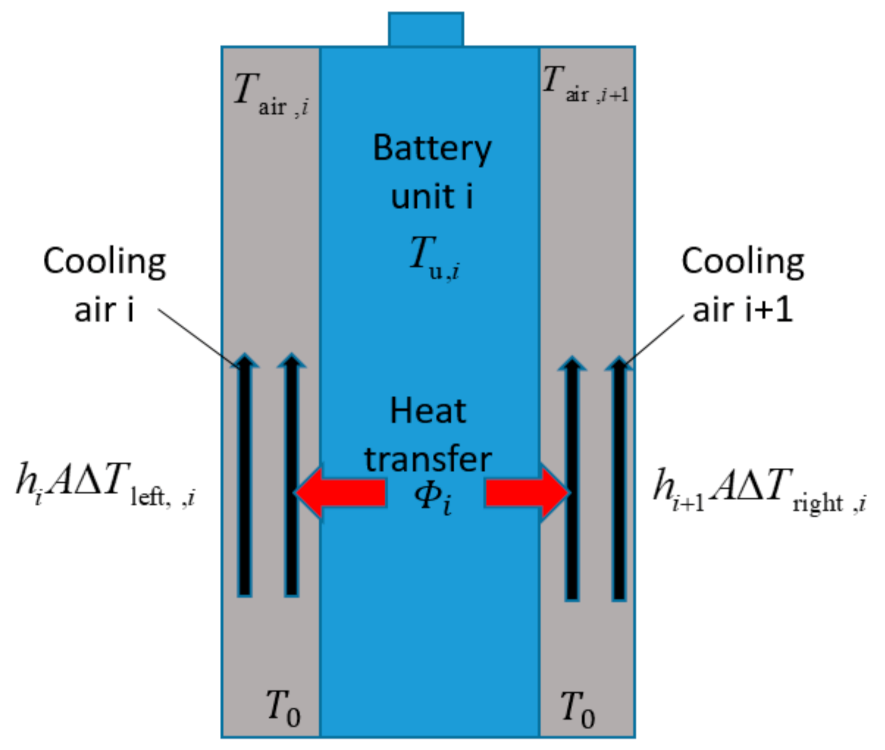
As shown in Figure 4, when air entered the cooling channel, the heat generated by the battery unit was taken away by the cooling air at the left and right sides, and the temperature of the battery unit was lowered. According to the principle of energy conservation, the heat dissipation equations can be obtained [37]:
where is the thermal power production by the th battery unit, is the convective heat transfer coefficient between the cooling air and the surface of th battery unit, and are the density and the heat capacity of the air, respectively, is the contact area between the battery unit and the cooling air on either cooling channel side, is the airflow rate of the th cooling channel, is the initial temperature of battery unit and air, is the outlet temperature of the air in the th cooling channel, and and are the temperature difference between the battery unit and either side of the air. The latter two can be calculated by [25]:
where is the volume-averaged temperature of the th battery unit. The convective heat transfer coefficient is given by Ref. [33]:
where is the thermal conductivity of the air, is the diameter of battery cell, and is the Prandtl Number of air. Y and y are empirical parameters and are given in Table 1. The convective heat transfer coefficient can be obtained by taking the air velocities solved in the flow resistance model into the calculation of . Therefore, the convective heat transfer coefficient is a key parameter that links the two models.
In the heat dissipation model, varies from 1 to . There are battery units, so there are equations for Equation (18) describing the heat dissipation of battery unit. There are cooling channels, so there are equations for Equation (19) describing the temperature rise of the air in the cooling channel. There are unknown variables and unknown variables in the model, so when the velocities of the air are introduced, the temperature of the battery unit can be obtained.
2.4. Validation of the Mathematical Model
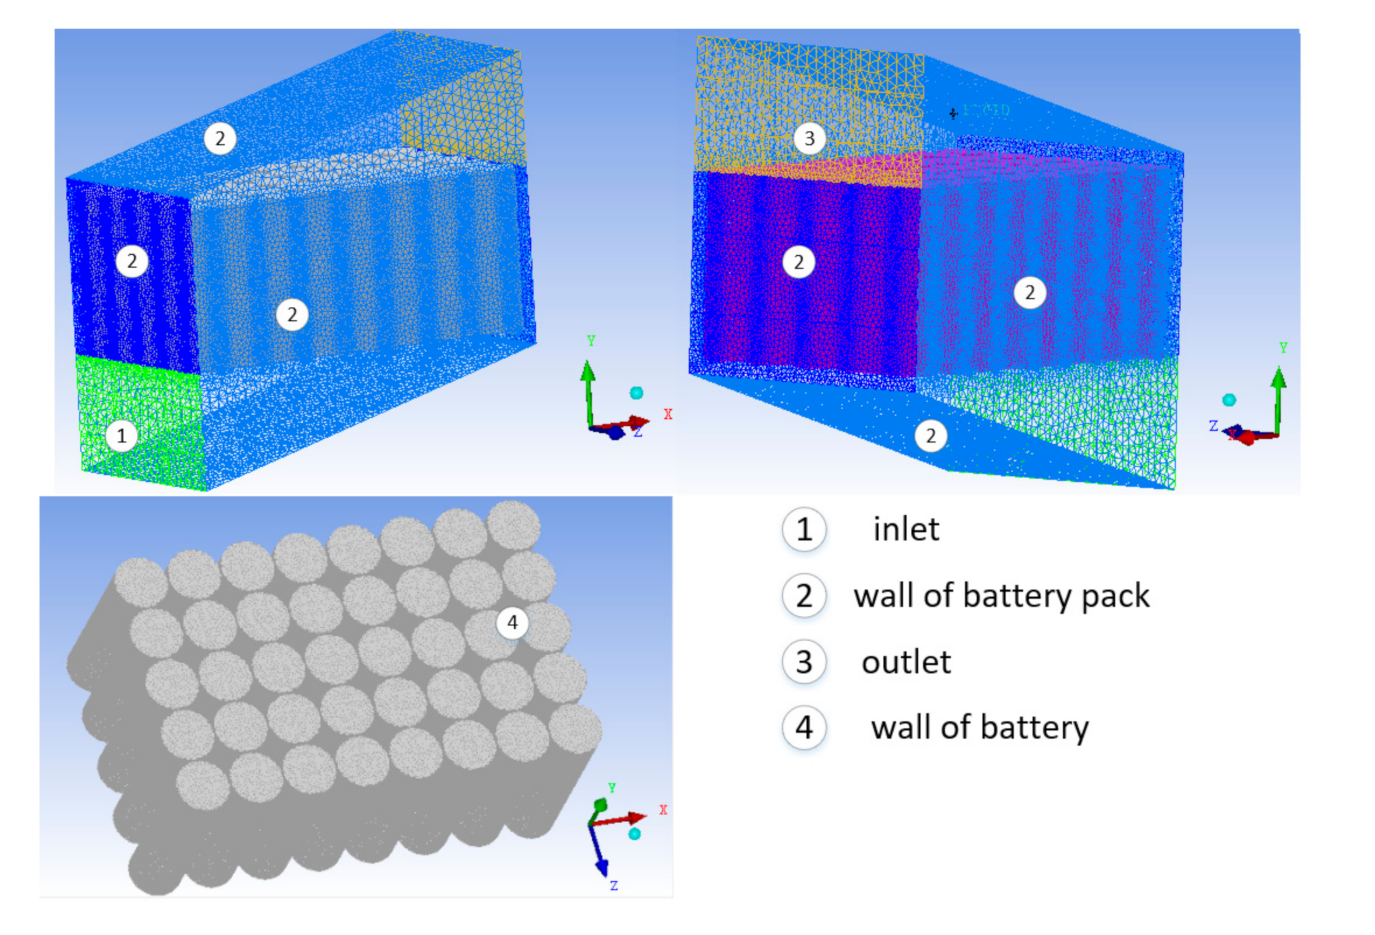
In order to verify the accuracy of the proposed flow resistance and heat dissipation models, this section establishes a battery pack model with 5 8 battery cells.
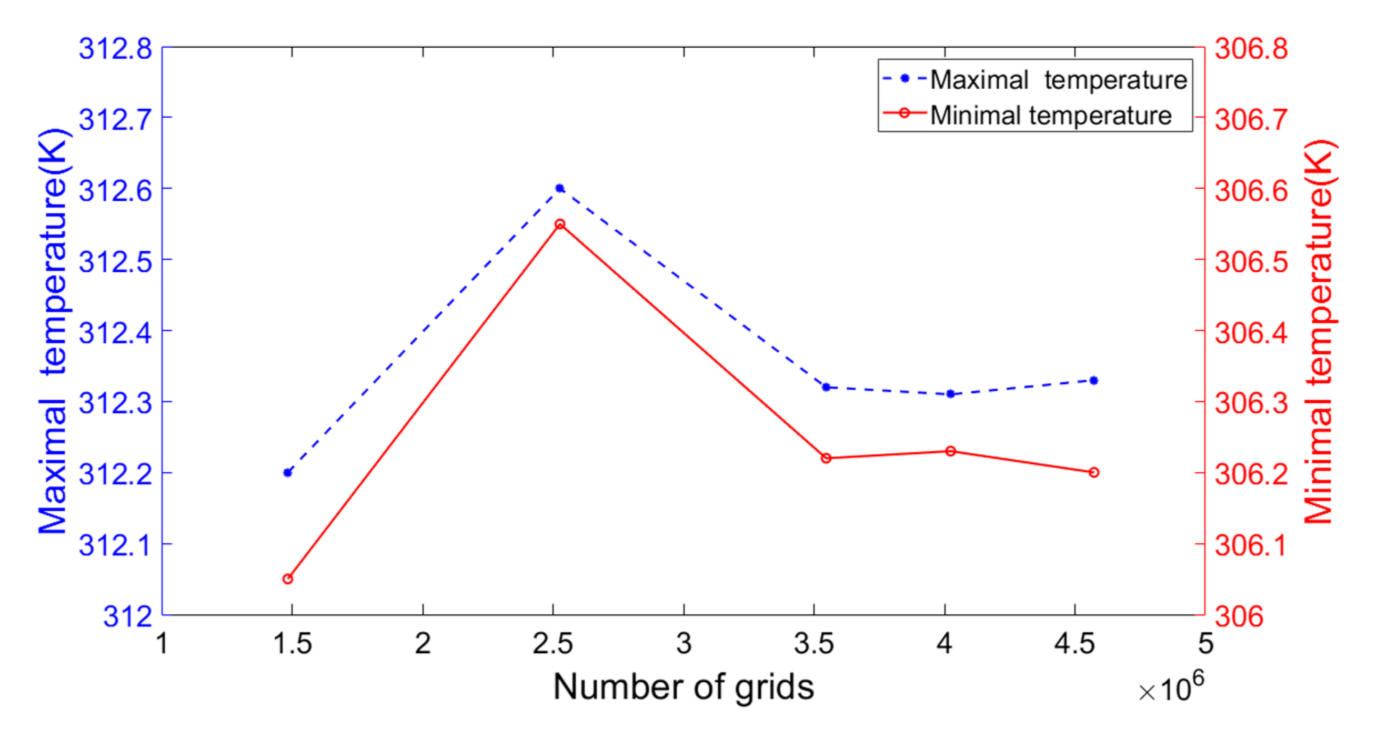
Due to the high calculation accuracy of the CFD method, this paper used FLUENT software for CFD simulation to verify the proposed mathematical model. The properties used in the CFD method and the mathematical model are shown in Table 2. The Realizable k-epsilon model was used to simulate the calculation of the three-dimensional battery pack. The air inlet uses a velocity inlet boundary condition, which describes the velocity of the cooling air at the inlet. The outlet uses outflow boundary condition. The boundary between the battery and the air uses a temperature continuity boundary condition. The computational region is discretized in space by finite volume method, and the discrete equation is solved using SIMPLE algorithm. The condition of iterative convergence is that the residual value of the energy equation is reduced below 10−6, the residual values of other equations are reduced below 10−3, and the inlet and outlet flow rates are balanced and stable. There are 3.5 million grids in the model. Figure 5 is the geometry and grids of the battery pack. Figure 6 is the result of mesh sensitivity analysis. It can be seen that the temperature basically did not change after the number of meshes exceeded 3.5 million, so 3.5 million meshes were used for subsequent simulations.
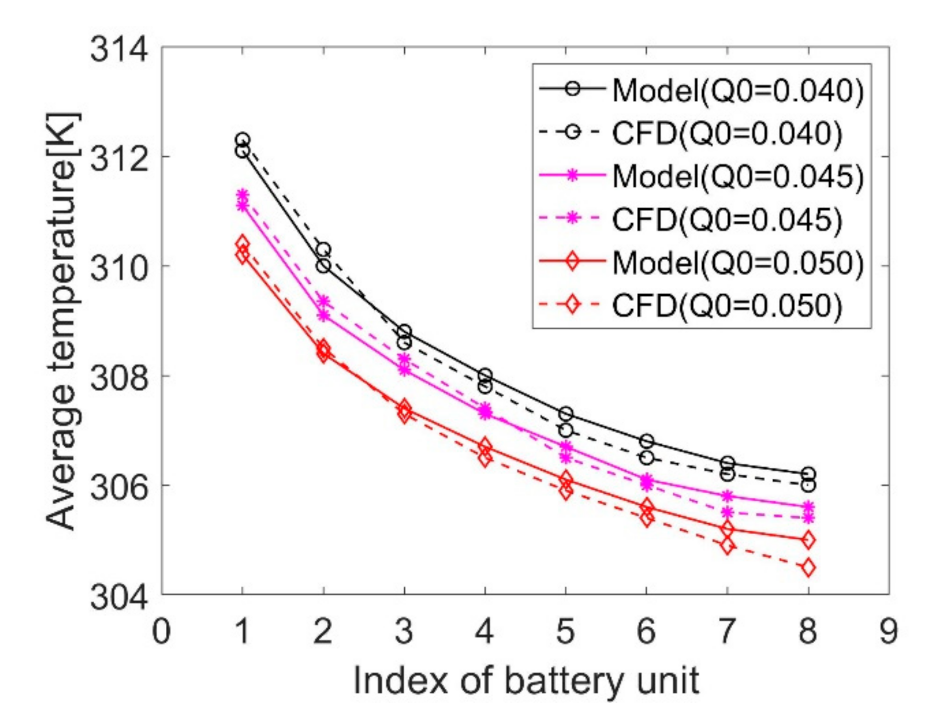
The battery unit temperatures obtained by the mathematical model and the CFD method are shown in Figure 7. It can be seen that the battery unit temperatures calculated by the CFD method and the mathematical model were in good agreement. Under three inlet airflow rates, the maximum errors between the two methods were 0.3 K (Q0 = 0.040), 0.3 K (Q0 = 0.045), 0.5 K (Q0 = 0.050), respectively. Since the CFD method is calculated using nonlinear partial differential equations, the calculation was very complicated and CPU-intensive, requiring a large amount of time for each calculation. In contrast, the flow resistance model and the heat dissipation model calculated the battery unit temperatures much faster, saving a lot of time in the optimization process that required repeated modification of the model parameters. Therefore, in the next structural optimization section, the flow resistance and heat dissipation models were used instead of the CFD method to calculate the temperature distribution in the battery pack.
3. Single Factor Variable Sensitivity Analysis
The factors affecting the heat dissipation were: 1. The minimal width of the battery unit ; 2. the plate angle of the convergence plenum (); 3. the plate angle of the divergence plenum(); 4. the minimal width of the divergence plenum() and 5. the minimal width of the convergence plenum(). In an electric vehicle, in order to save power consumption, the fan can be set to low, medium, or high speed levels. In this paper, the size of the inlet airflow rate represents the three levels of the fan. We discuss the influence of the above five parameters on the battery unit temperatures under different inlet airflow rates. Furthermore, the structural parameters most sensitive to the heat dissipation of the battery pack are analyzed.
In order to work properly, the maximum temperature of battery units should be within 313 K, and the maximum temperature difference between battery units should be within 5K. The maximum temperature difference between battery units can be expressed as:
s.t.
where is the maximum volume-averaged temperature of a battery unit obtained by the heat dissipation model and is the minimum volume-averaged temperature.
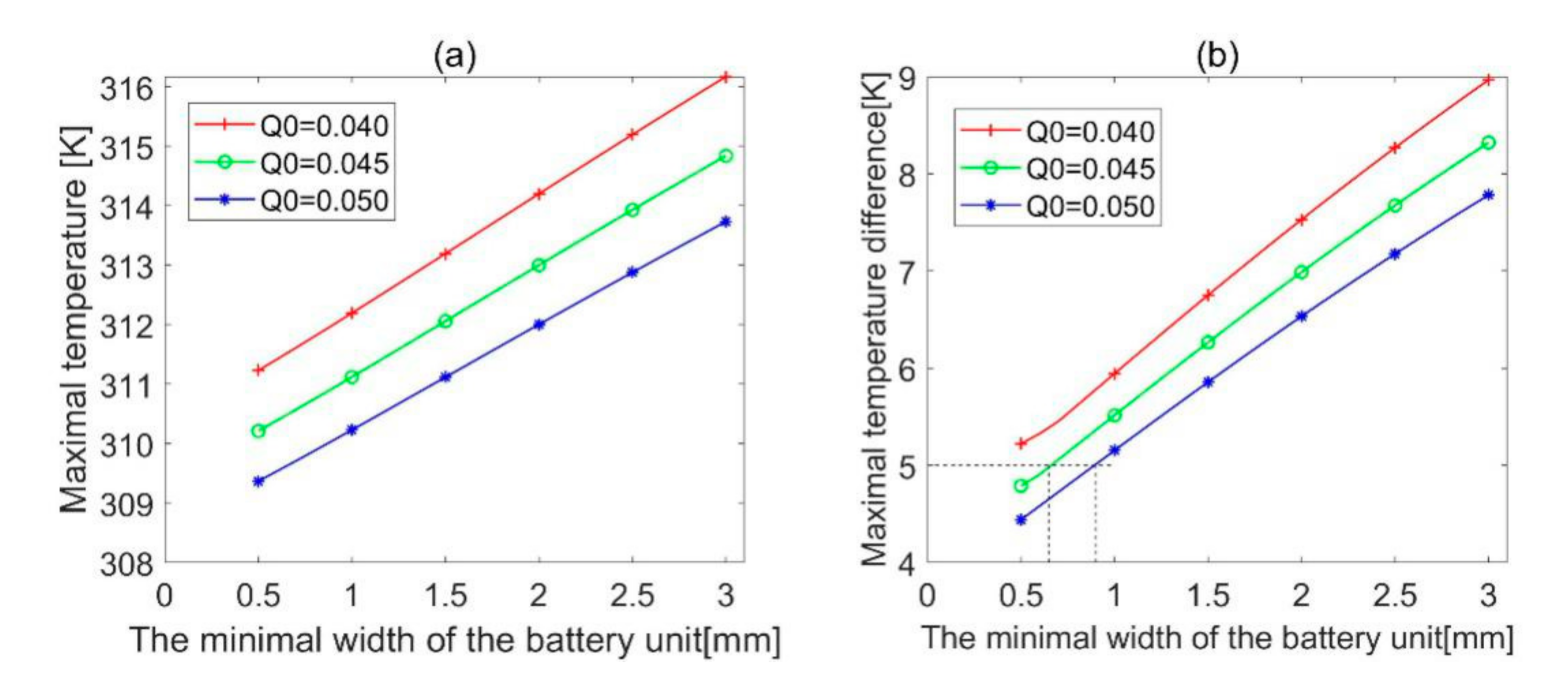
3.1. The Minimal Width of Battery Unit ()
It can be seen from Figure 8, and increase with the increase of . The value of increased by an average of 4.6K, and increased by an average of 3.5 K. In the case of ensuring that the maximum temperature difference is within 5K, the minimal width of battery unit must be less than 0.95 mm (Q0 = 0.050), 0.65 mm (Q0 = 0.045). Therefore, a minimum of is advantageous for the heat dissipation.
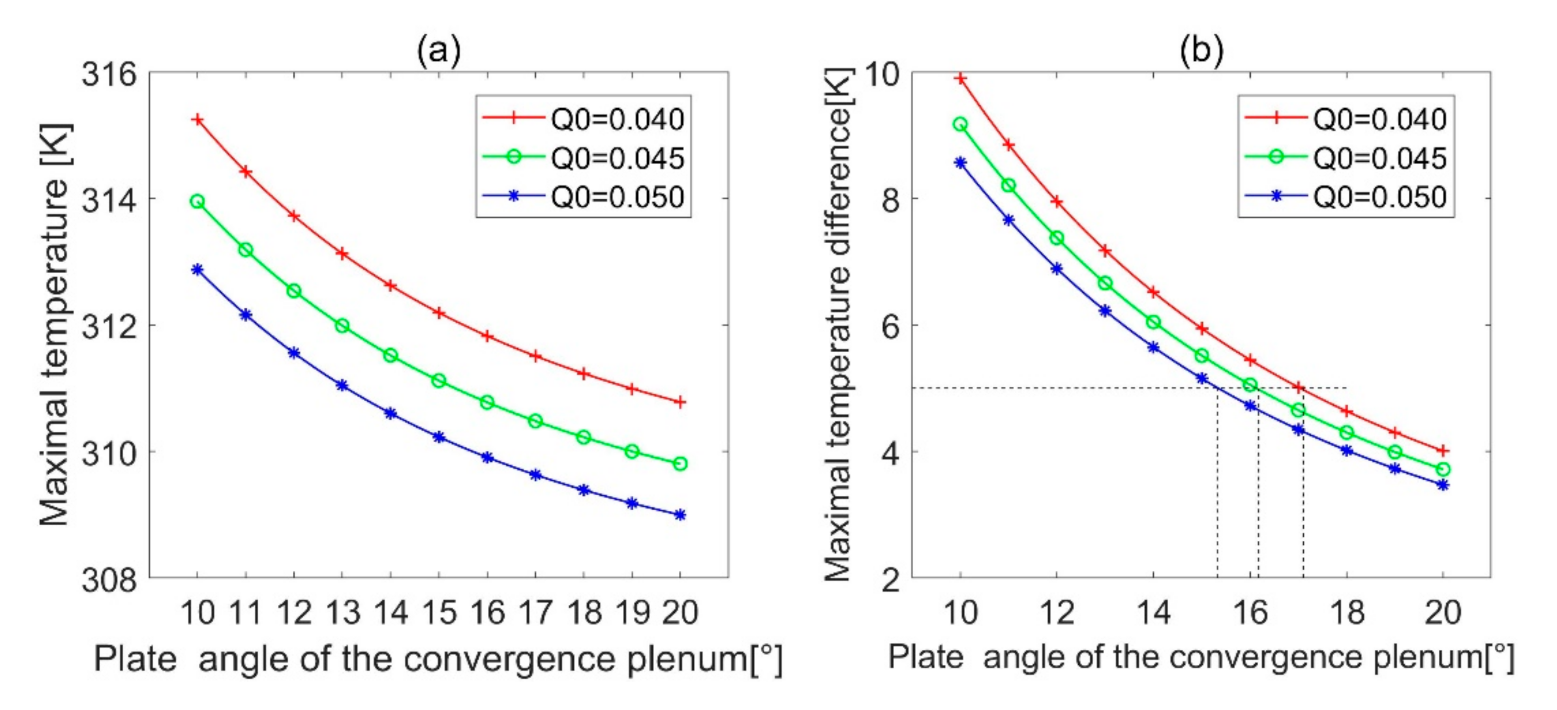
3.2. Plate Angle of the Convergence Plenum ()
As shown in Figure 9, as the angle of the convergence plenum increased, the maximal temperature and the maximal temperature difference decreased. dropped by an average of 4.2 K and dropped by an average of 5.5 K. In the case of the inlet airflow rate Q0 = 0.05 m3/s, every convergence plenum angle in Figure 8a satisfies < 313 K. In order to ensure that is within 5K, the minimum must be greater than 15.3° (Q0 = 0.050), 16.2° (Q0 = 0.045), and 17.1° (Q0 = 0.040).
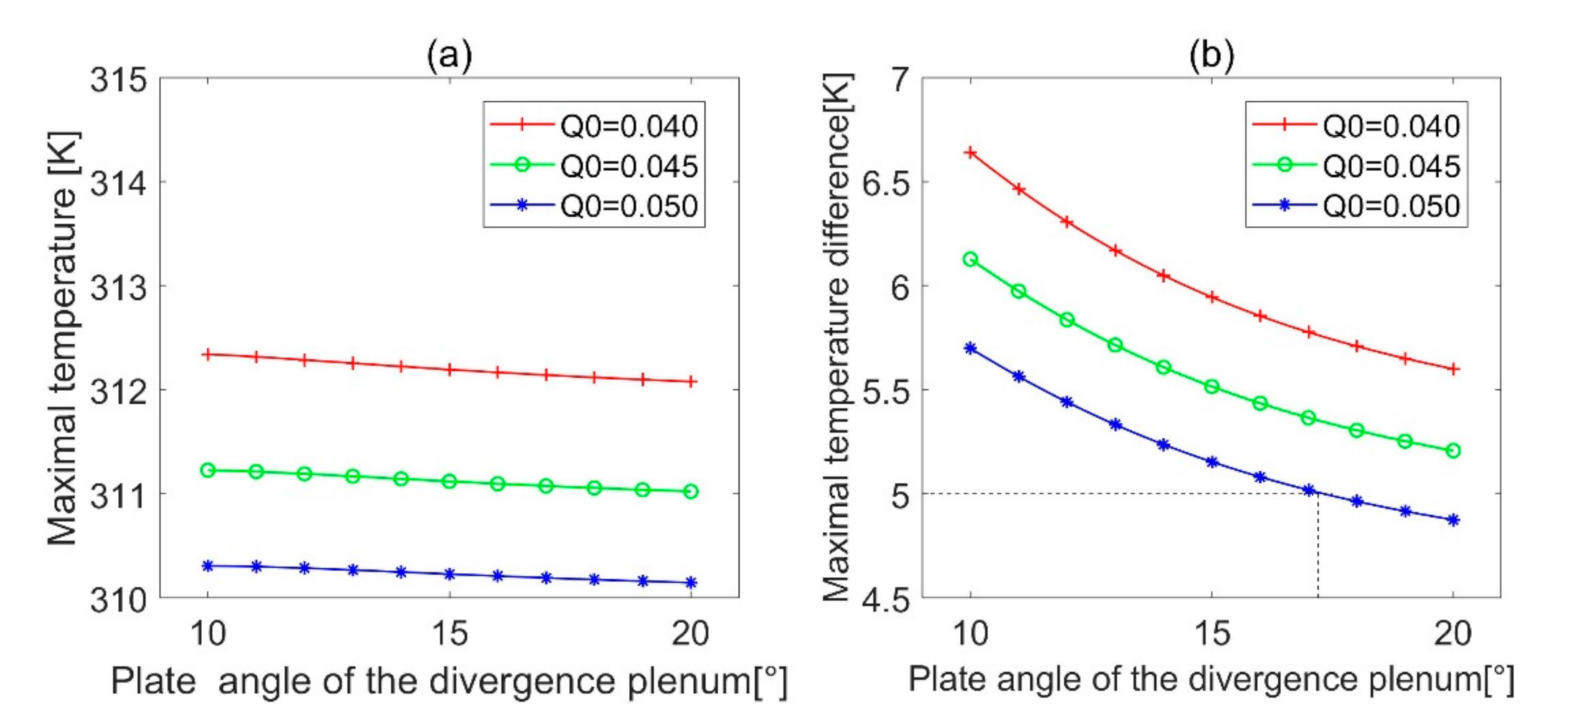
3.3. Plate Angle of the Divergence Plenum ()
As shown in Figure 10a, changing did not substantially affect , but was below 313 K under the three inlet airflow rates. As shown in Figure 10b, from the perspective of the maximum temperature difference, decreased by an average of 0.9K. In order to have < 5K, the inlet airflow rate must satisfy Q0 = 0.50 and > 17.2°. Therefore, it is not desirable to optimize the temperature by changing compared with changing .
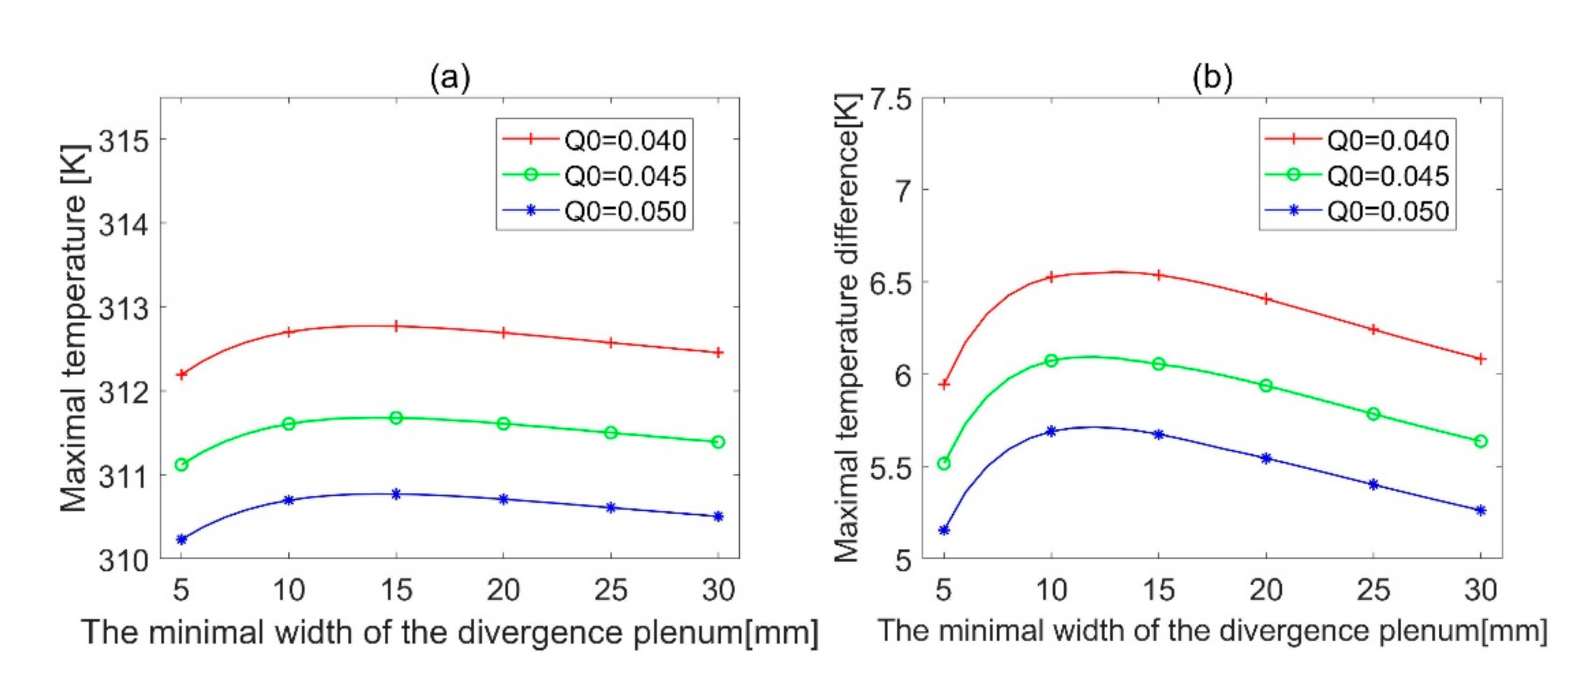
3.4. The Minimal Width of the Divergence Plenum ()
From the point of view of the maximal temperature, as shown in Figure 11a, was less than 313 K under the three inlet airflow rates. It can also be seen that changing did not effectively reduce . From the perspective of the maximal temperature difference, as shown in Figure 10b, first rose by an average of 0.6K and then decreased by an average of 0.4 K. It can also be seen that even at the highest flow rate, no matter how changed, was still not less than 5K. Therefore, it is not economical to change . The minimum value of is taken when is 5 mm. Therefore, choosing = 5mm saves area and helps to dissipate heat.
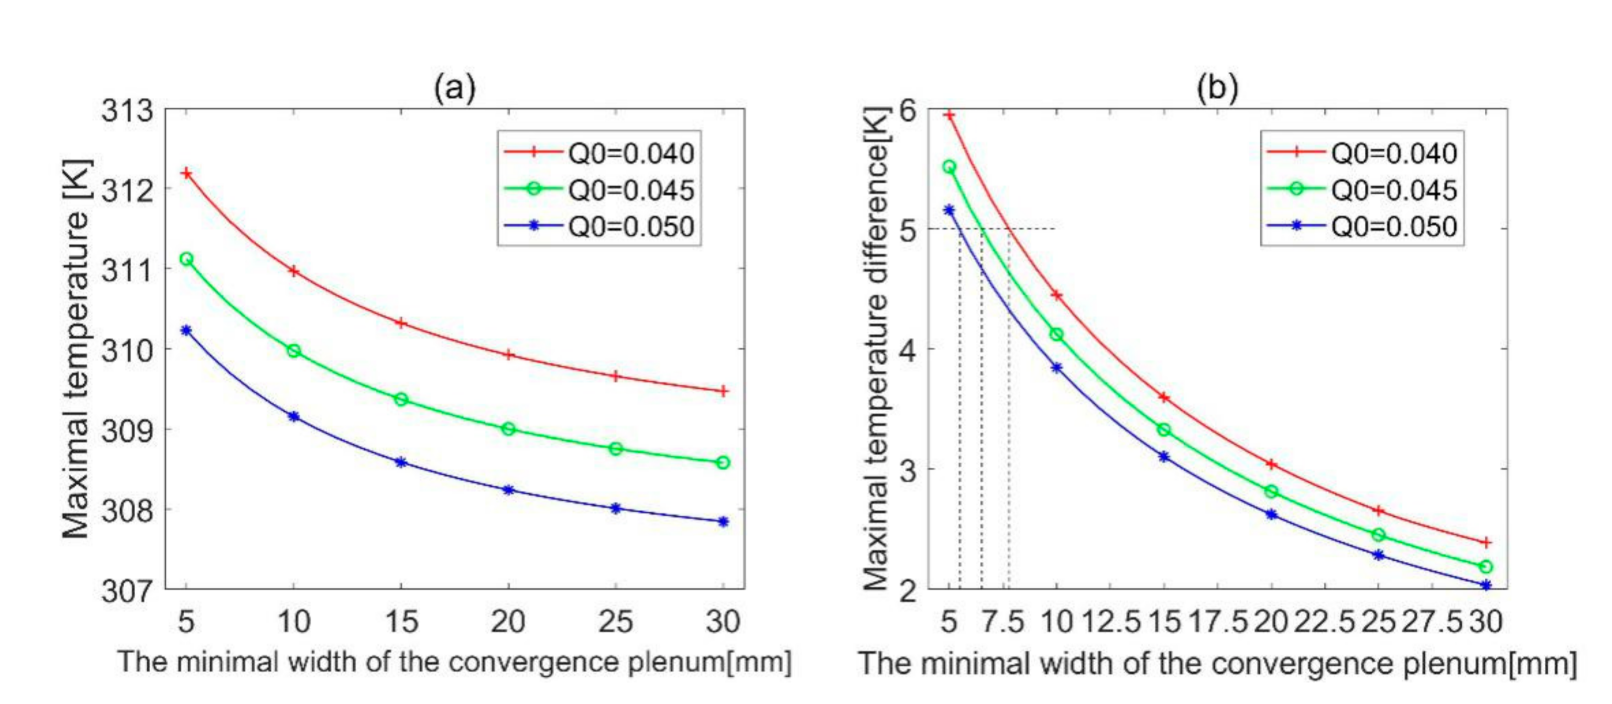
3.5. The Minimal Width of the Convergence Plenum ()
Figure 12a shows that, in terms of the maximal temperature, changing can satisfy the criterion < 313 K in three kinds of Q0, and the maximum temperature drops by an average of 2.5 K. As can be seen from Figure 11b, considering the maximal temperature difference, dropped by an average of 3.3 K. In order to ensure that is within 5K, must be greater than 5.5 mm (Q0 = 0.050), 6.5 mm (Q0 = 0.045), and 7.8 mm (Q0 = 0.040). Compared with other structural parameters, changing can easily make the maximal temperature difference be within 5K.
In summary, the maximum temperature in the battery pack is not sensitive to changes of and . The changes of and can significantly reduce the maximum temperature, but a very small will cause the maximum temperature to exceed 313K. From the maximal temperature difference analysis, the structural variable that has the greatest influence on is , followed by , and finally . When changes, it is found that the smallest can not only reduce , but also reduce the battery pack area. In order to ensure that is within 5K, only adjusting requires a larger angle to meet the temperature condition and thus wastes space. In contrast, the temperature condition can be satisfied by adjusting in a small range. It can be seen that is inversely proportional to and , so the minimum can increase the cooling performance and save space.
4. Optimization of Battery Pack Area Based on Stud Genetic Algorithm
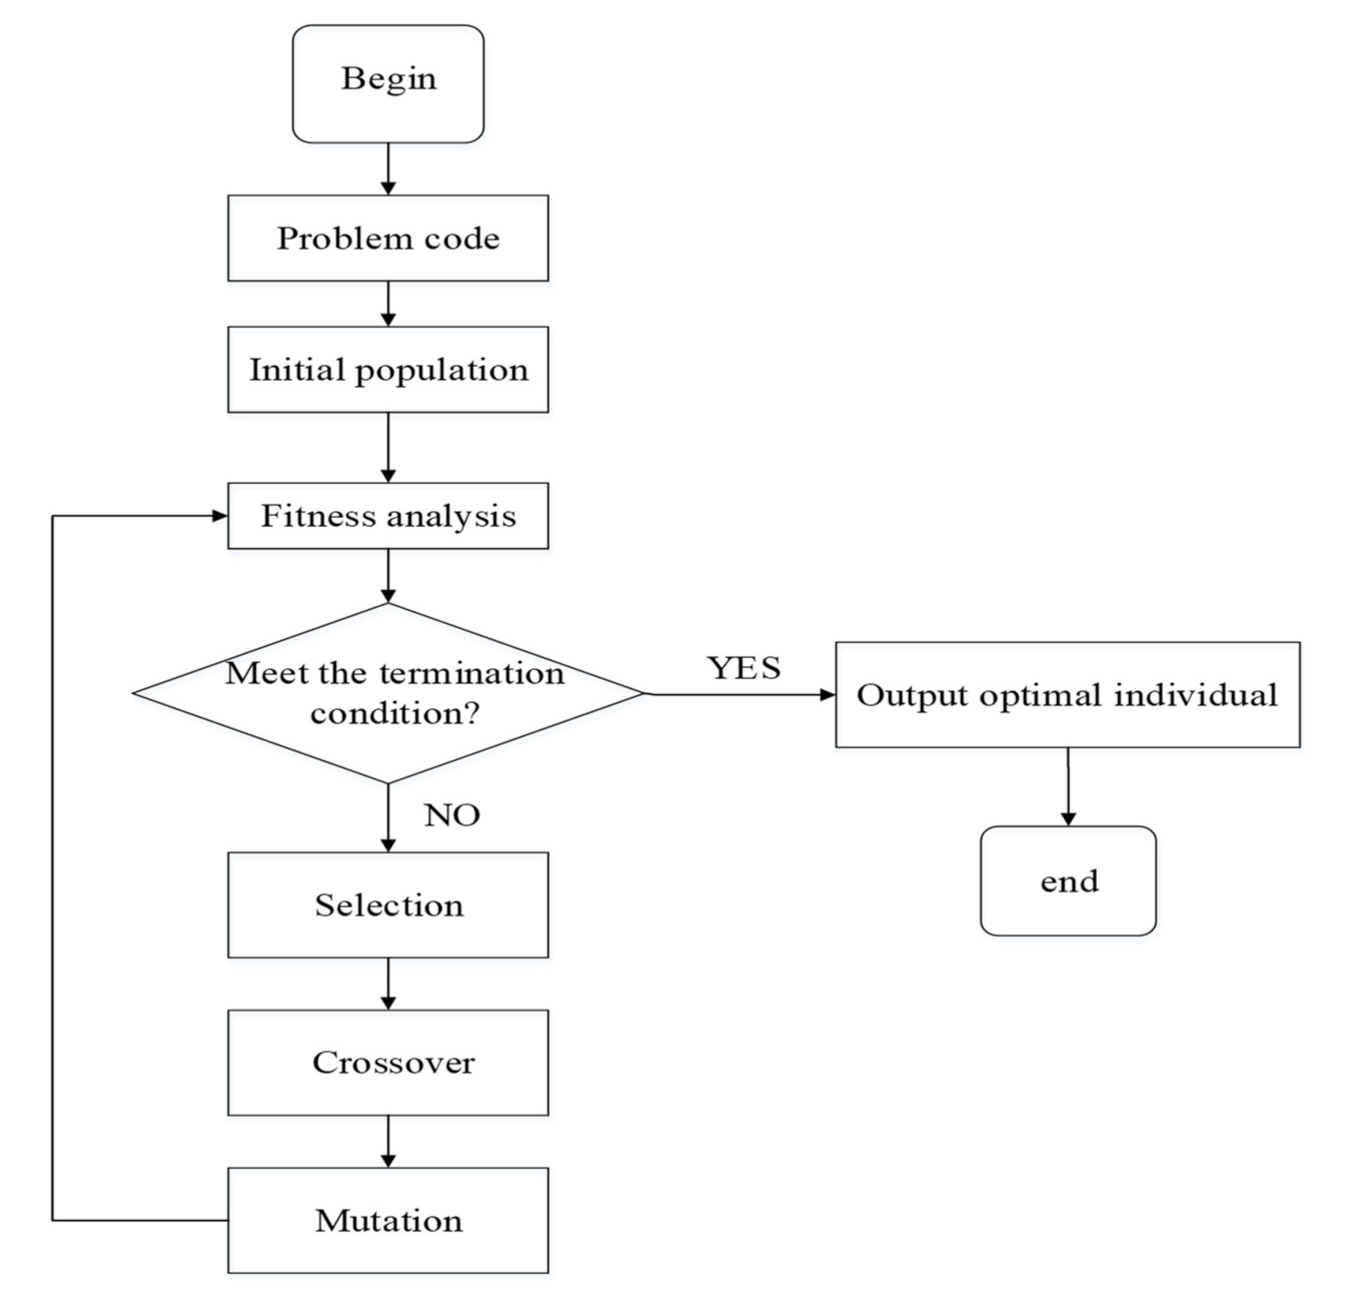
In recent years, genetic algorithms (GA) have been widely used for structural optimization, but the disadvantage of genetic algorithms is that they are easy to fall into local optimization. Therefore, Khatib et al. [38] improved the traditional GA and proposed the stud GA. Instead of stochastic selection, the fittest individual, the stud, shares its genetic information with all others using simple GA operators. The basic idea behind the stud GA is to use the best individual in the population to mate with all others to produce the new offspring. Gray coding is used throughout this work. This implementation of the stud GA uses an elitist strategy by carrying through the best individual. This method improves the efficiency and accuracy of the traditional genetic algorithm. In order to make full use of the valuable space in the car, a global search is performed by setting fitness function and design variables to meet the minimum value of the area () when obtained by the heat dissipation model is less than 5K.
The method for generating the next generation of stud genetic algorithm is based on the hamming distance, that is, when the diversity is greater than a preset threshold, crossover is performed, and when the diversity is less than a preset threshold, mutation is performed. The probability of mutation and crossover are 0.002 and 0.8, respectively, and the threshold is adopted to be 10% throughout. The stud GA flow chart is shown in Figure 13.
4.1. Establishment of Objective Function and Constraint
According to the analysis in Section 3, if was within 5K when the inlet airflow rate was the smallest, it would be satisfied under other large inlet airflow rates. Therefore, the volume of the battery was optimized when the inlet airflow rate was minimized (Q0 = 0.04). As can be seen from Figure 1, the three-dimensional volume can be simplified to a two-dimensional area (Figure 2b) for optimization.
According to the analysis in the previous section, it can be concluded that and are positively correlated. The value of increased first and then decreased as increased, and the minimum was taken when was at a minimum. Figure 2a shows that the battery pack area and the five structural parameters were positively related. Therefore, both and were minimized, which reduced and saved space. Thus, was set to 0.5 mm and was set to 5 mm. The battery area can be expressed by:
where is the length of battery with a value of 65 mm, and is the diameter of a single cell with a value of 18 mm.
As , and increased, the maximum temperature difference gradually decreased, but meanwhile, the battery pack area increased. The target of minimizing the area of the battery pack was optimized under the condition of Q0 = 0.04 m3/s. The mathematical description of the optimization problem can be expressed by:
(1) Objective function:
(2) Structure variables:
(3) Constraint:
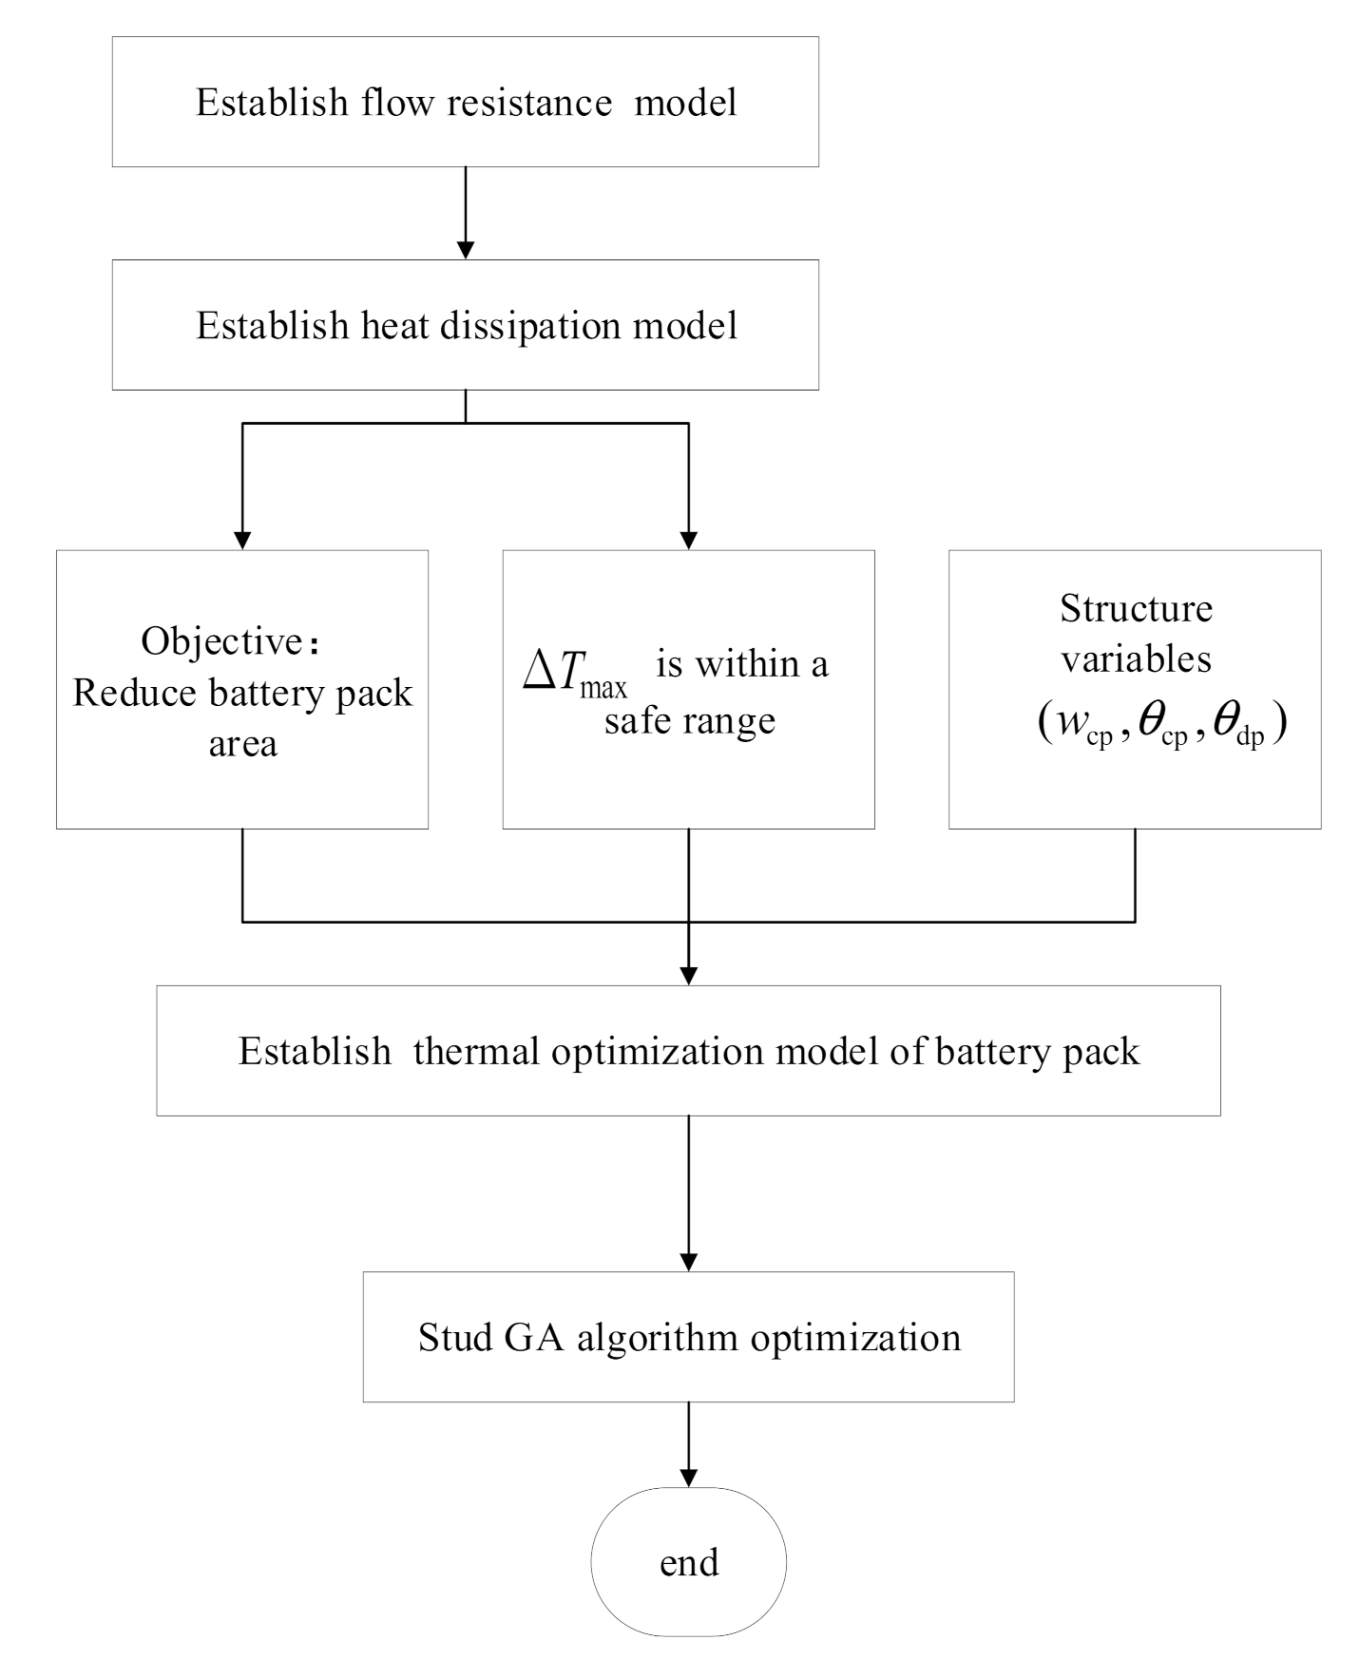
The initial capacity of the sample was designed to be 50. Through the above steps, a new generation of individuals could be obtained, and the pros and cons of individuals in the population could be judged. Thus, when GA evolved to the K th generation, the calculation was stopped if the population converged, otherwise the iterative calculation was continued until the termination condition was satisfied. A flow chart of battery pack optimization is shown in Figure 14.
4.2. Result Analysis
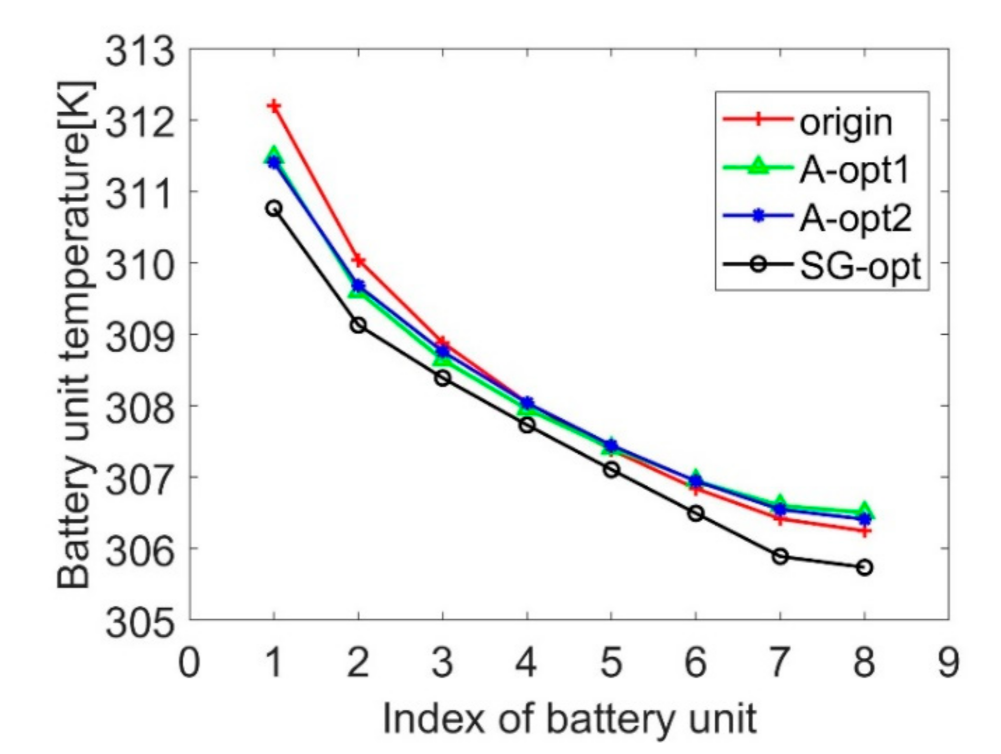
The initial condition was = 15°, = 15°, = 5 mm. After iterative calculation, the optimal solution was = 14.0°, = 10.1°, = 10.2 mm. The structure parameters and optimization results of various BTMSs are shown in Table 3. The stud GA-optimized BTMS was denoted as SG-opt. The BTMS optimized by sensitivity analysis was recorded as A-opt.
The temperature of battery unit for various BTMSs calculated by the heat dissipation model is shown in Figure 15. Compared with A-opt1 and A-opt2, the original BTMS had a high and a low , which made the maximum temperature difference greater than that of A-opt1 and A-opt2. The maximum temperature difference was 5.9 and 5.0 K for the original BTMS and stud GA-optimized BTMS, respectively. Furthermore, it also indicated that the temperature dropped overall after stud GA optimization. Compared with the original BTMS, not only did the maximum temperature difference decrease by 1.4 K but also the area of battery pack was reduced.
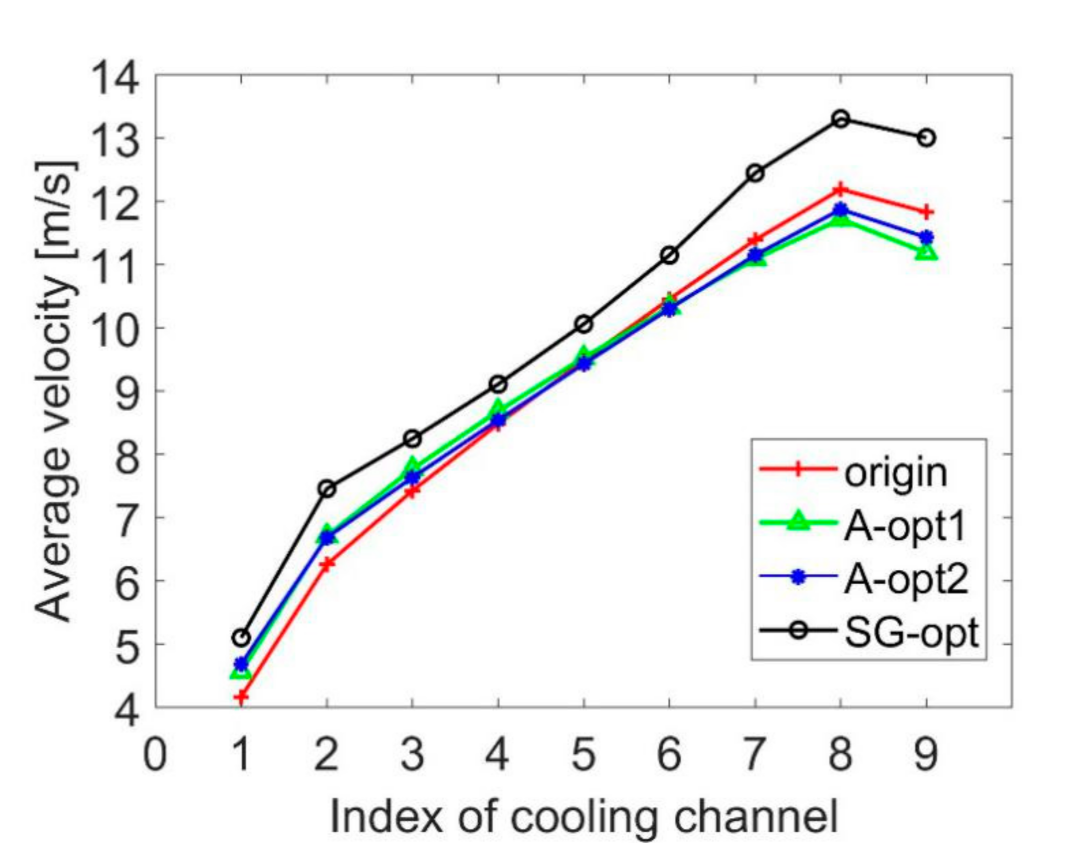
The air velocity in each BTMS cooling channel is shown in Figure 16. It can be seen that the air velocities near the inlet were low. The faster the air velocity in the cooling channel, the more heat the air could take away, which caused the temperature of the battery unit near the inlet to be higher than the temperature of the battery unit near the outlet. Compared to A-opt1 and A-opt2, the minimum air velocity of the original BTMS is lower and the maximum air velocity was higher, which made the air velocity difference in original BTMS the largest, which in turn caused the maximum temperature difference to be the largest. Furthermore, the air velocity optimized by stud GA became higher overall so that the air took away more heat, making the temperature optimized by stud GA decline overall.
The optimization result was then analyzed. As shown in Table 3, in the case that the maximal temperature difference was within 5K, the BTMS optimized by the stud GA saved 8.64% (A-opt1) and 8.46% (A-opt2) of the area, respectively. Compared with the original BTMS, the BTMS optimized by stud GA reduced the maximal temperature difference by 15.99% and reduced the area by 6.24%. Therefore, the stud genetic algorithm-optimized BTMS had a better heat dissipation effect than the original BTMS, which not only made the maximum temperature difference within 5K, but also saved more area.
5. Conclusions
In this paper, a mathematical model of BTMS was established, and the structure of the battery pack was optimized by adjusting parameters. The flow resistance model calculated the air velocity in the cooling channel, and the heat dissipation model calculated the temperature of battery unit. Based on these two models, the influence of five structural parameters on the maximal temperature and the maximal temperature difference under different inlet airflow rates was studied. Through sensitivity analysis, the design variables affecting the area of the battery pack were selected, and the stud GA was used to optimize the battery pack area. It can be concluded as follows:
- Under various inlet airflow rates, comparing the temperature of battery unit calculated by the proposed mathematical model and the CFD method, it was found that the degree of coincidence was very good. Compared to the CFD method, which requires more than a dozen hours of calculation, the flow resistance and heat dissipation model can be calculated in a few seconds, which can save a lot of time.
- Through sensitivity analysis, it was found that the structural variable that had the greatest influence on the maximal temperature difference was , followed by , and finally . These three parameters were positively correlated with the maximum temperature difference. and were minimized to facilitate the heat dissipation and reduce the size of the battery pack.
- In the case of the minimum inlet airflow rate, the minimum area of the battery pack was targeted, and the maximum temperature difference obtained by the heat dissipation model was required to be less than 5K as the constraint function. The stud GA was used to optimize , and . The final results show that compared to the original battery pack structure, the optimized battery pack meets the requirements that the maximal temperature difference be less than 5K and saves 6.24% area. The use of the heat dissipation mathematical model can greatly accelerate the design cycle of the battery industry, and at the same time increase the energy density of the battery pack to ensure that the battery works safely at a suitable temperature.
Author Contributions
Conceptualization, R.J.; writing—review and editing, J.C.; visualization, B.W.; supervision, R.J.; project administration, D.X.; funding acquisition, D.X. All authors have read and agreed to the published version of the manuscript.
Funding
This research was funded by Whenzhou Scientific and Technological Project, grant number 2018ZG007.
Institutional Review Board Statement
This study did not involve humans or animals.
Informed Consent Statement
This study did not involve humans.
Data Availability Statement
This study did not report any data.
Conflicts of Interest
The authors declare no conflict of interest.
References
- Williford, R.E.; Viswanathan, V.V.; Zhang, J.G. Effects of entropy changes in anodes and cathodes on the thermal behavior of lithium ion batteries. J. Power Sources 2009, 189, 101–107. [Google Scholar] [CrossRef]
- Tamura, K.; Horiba, T. Large-scale development of lithium batteries for electric vehicles and electric power storage applications. J. Power Sources 1999, 81, 156–161. [Google Scholar] [CrossRef]
- Onda, K.; Ohshima, T.; Nakayama, M.; Fukuda, K.; Araki, T. Thermal behavior of small lithium-ion battery during rapid charge and discharge cycles. J. Power Sources 2006, 158, 535–542. [Google Scholar] [CrossRef]
- Pesaran, A.A. Battery thermal models for hybrid vehicle simulations. J. Power Sources 2002, 110, 377–382. [Google Scholar] [CrossRef]
- Ou, K.; Wang, Y.X.; Li, Z.Z.; Shen, Y.-D.; Xuan, D.-J. Feedforward fuzzy-PID control for air flow regulation of PEM fuel cell system. Int. J. Hydrogen Energy 2015, 40, 11686–11695. [Google Scholar] [CrossRef]
- Mi, C.; Li, B.; Buck, D.; Ota, N. Advanced electro-thermal modeling of lithium-ion battery system for hybrid electric vehicle applications. In Proceedings of the 2007 IEEE Vehicle Power and Propulsion Conference, Arlington, TX, USA, 9–12 September 2007; pp. 107–111. [Google Scholar]
- Chen, K.; Chen, Y.; Li, Z.; Yuan, F.; Wang, S. Design of the cell spacings of battery pack in parallel air-cooled battery thermal management system. Int. J. of Heat Mass Transf. 2018, 127, 393–401. [Google Scholar] [CrossRef]
- Wang, J.; Lu, S.; Wang, Y.; Ni, Y.; Zhang, S. Novel investigation strategy for mini-channel liquid-cooled battery thermal management system. Int. J. Energy Res. 2020, 44, 1971–1985. [Google Scholar] [CrossRef]
- Yang, X.H.; Tan, S.C.; Liu, J. Thermal management of Li-ion battery with liquid metal. Energy Convers Manag. 2016, 117, 577–585. [Google Scholar] [CrossRef]
- Qian, Z.; Li, Y.; Rao, Z. Thermal performance of lithium-ion battery thermal management system by using mini-channel cooling. Energy Convers. Manag. 2016, 126, 622–631. [Google Scholar] [CrossRef]
- Zhu, Y.; Fang, Y.; Su, L.; Fei, Y. Experimental study on thermal performance of a pumped two-phase battery thermal management system. Int. J. Energy Res. 2020, 44, 4664–4676. [Google Scholar] [CrossRef]
- Amalesh, T.; Lakshmi Narasimhan, N. Cooling of a lithium ion battery using phase change material with air/dielectric fluid media: A numerical study. Proc. Inst. Mech. Eng. Part. A J. Power Energy 2020, 234, 722–738. [Google Scholar] [CrossRef]
- Rao, Z.; Huo, Y.; Liu, X.; Zhang, G. Experimental investigation of battery thermal management system for electric vehicle based on paraffin/copper foam. J. Energy Inst. 2015, 88, 241–246. [Google Scholar] [CrossRef]
- Alipanah, M.; Li, X. Numerical studies of lithium-ion battery thermal management systems using phase change materials and metal foams. Int. J. Heat Mass Trandf. 2016, 102, 1159–1168. [Google Scholar] [CrossRef]
- Jiang, Z.Y.; Qu, Z.G. Lithium–ion battery thermal management using heat pipe and phase change material during discharge–charge cycle: A comprehensive numerical study. Appl. Energy 2019, 242, 378–392. [Google Scholar] [CrossRef]
- Pesaran, A.A. Battery thermal management in EVEs and HEVs: Issues and solutions. In Proceedings of the Nevada, Advanced Automotive Battery Conference, Como, Italy, 6–8 February 2001. [Google Scholar]
- Pesaran, A.; Keyser, M.; Burch, S. An Approach for Designing Thermal Management Systems for Electric and Hybrid Vehicle Battery Packs; National Renewable Energy Laboratory: Golden, CO, USA, 1999. [Google Scholar]
- Wang, T.; Tseng, K.J.; Zhao, J.; Wei, Z. Thermal investigation of lithium-ion battery module with different cell arrangement structures and forced air-cooling strategies. Appl. Energy 2014, 134, 229–238. [Google Scholar] [CrossRef]
- Xun, J.; Liu, R.; Jiao, K. Numerical and analytical modeling of lithium ion battery thermal behaviors with different cooling designs. J. Power Sources 2013, 233, 47–61. [Google Scholar] [CrossRef]
- He, F.; Li, X.; Ma, L. Combined experimental and numerical study of thermal management of battery module consisting of multiple Li-ion cells. Int. J. Heat Mass Transf. 2014, 72, 622–629. [Google Scholar] [CrossRef]
- Severino, B.; Gana, F.; Palma-Behnke, R.; Estévez, P.A.; Williams, R.C.-M.; Marcos, E.O.; Jorge, R.; Marcelo, C. Multi-objective optimal design of lithium-ion battery packs based on evolutionary algorithms. J. Power Sources 2014, 267, 288–299. [Google Scholar] [CrossRef]
- Qian, X.; Xuan, D.; Zhao, X.; Shi, Z. Heat dissipation optimization of lithium-ion battery pack based on neural networks. Appl. Therm. Eng. 2019, 162, 114289. [Google Scholar] [CrossRef]
- Liu, Z.; Wang, Y.; Zhang, J.; Liu, Z. Shortcut computation for the thermal management of a large air-cooled battery pack. Appl. Therm. Eng. 2014, 66, 445–452. [Google Scholar] [CrossRef]
- Chen, K.; Song, M.; Wei, W.; Wang, S. Structure optimization of parallel air-cooled battery thermal management system with U-type flow for cooling efficiency improvement. Energy 2018, 145, 603–613. [Google Scholar] [CrossRef]
- Chen, K.; Wang, S.; Song, M.; Chen, L. Configuration optimization of battery pack in parallel air-cooled battery thermal management system using an optimization strategy. Appl. Therm. Eng. 2017, 123, 177–186. [Google Scholar] [CrossRef]
- Chen, K.; Wang, S.; Song, M.; Chen, L. Structure optimization of parallel air-cooled battery thermal management system. Int. J. Heat Mass Transf. 2017, 111, 943–952. [Google Scholar] [CrossRef]
- Fan, L.; Khodadadi, J.M.; Pesaran, A.A. A parametric study on thermal management of an air-cooled lithium-ion battery module for plug-in hybrid electric vehicles. J. Power Sources 2013, 238, 301–312. [Google Scholar] [CrossRef]
- Park, H. A design of air flow configuration for cooling lithium ion battery in hybrid electric vehicles. J. Power Sources 2013, 239, 30–36. [Google Scholar] [CrossRef]
- Chen, K.; Chen, Y.; Song, M.; Wang, S. Multi-parameter structure design of parallel mini-channel cold plate for battery thermal management. Int. J. Energy Res. 2020, 44, 4321–4334. [Google Scholar] [CrossRef]
- Loh, B.G.; Hyun, S.; Ro, P.I.; Kleinstreuer, C. Acoustic streaming induced by ultrasonic flexural vibrations and associated enhancement of convective heat transfer. J. Acoust. Soc. Am. 2002, 111, 875–883. [Google Scholar] [CrossRef] [PubMed] [Green Version]
- Perry, R.H.; Green, D.W. Perry’s Chemical Engineers’ Handbook, 7th ed.; McGraw-Hill Professional: New York, NY, USA, 1997. [Google Scholar]
- Bassett, M.D.; Winterbone, D.E.; Pearson, R.J. Calculation of steady flow pressure loss coefficients for pipe junctions. Proc. Inst. Mech. Eng. Part. C 2001, 215, 861–881. [Google Scholar] [CrossRef]
- Shi, Y.; Wang, J.; Yu, G.; Chen, M. Chemical Engineering Handbook, 2nd ed.; Chemical Industry Press: Beijing, China, 1996. [Google Scholar]
- Thomas, P.D.; Lombard, C.K. Geometric conservation law and its application to flow computations on moving grids. AIAA J. 1979, 17, 1030–1037. [Google Scholar] [CrossRef]
- Saw, L.H.; Ye, Y.; Tay, A.A.O. Electrochemical–thermal analysis of 18650 Lithium Iron Phosphate cell. Energy Convers. Manag. 2013, 75, 162–174. [Google Scholar] [CrossRef]
- Jeon, D.H.; Baek, S.M. Thermal modeling of cylindrical lithium ion battery during discharge cycle. Energy Convers. Manag. 2011, 52, 2973–2981. [Google Scholar] [CrossRef]
- Winterton, R.H.S. Newton’s law of cooling. Contemp. Phys. 1999, 40, 205–212. [Google Scholar] [CrossRef]
- Khatib, W.; Fleming, P.J. The stud GA: A mini revolution? In International Conference on Parallel Problem Solving from Nature; Springer: Berlin/Heidelberg, Germany, 1998; pp. 683–691. [Google Scholar]
Figure 1.
Three-dimension of the parallel air-cooled BTMS.

Figure 2.
Diagram of the parallel air-cooled BTMS.

Figure 3.
Schematic of the flow resistant model.

Figure 4.
Heat transfer between the battery unit and the air.

Figure 5.
The geometry and grids of battery pack.

Figure 6.
Result of mesh sensitivity analysis.

Figure 7.
Battery unit temperatures comparison obtained by mathematical model and CFD method.

Figure 8.
The effect of the minimal width of battery unit on the temperature distribution for various inlet airflow rates: (a) effect on maximal temperature, (b) effect on maximal temperature difference. (, , mm, mm).
Figure 8.
The effect of the minimal width of battery unit on the temperature distribution for various inlet airflow rates: (a) effect on maximal temperature, (b) effect on maximal temperature difference. (, , mm, mm).

Figure 9.
The effect of plate angle of the convergence plenum on the temperature distribution for various inlet airflow rates: (a) effect on maximal temperature, (b) effect on maximal temperature difference. (, mm, mm, mm).
Figure 9.
The effect of plate angle of the convergence plenum on the temperature distribution for various inlet airflow rates: (a) effect on maximal temperature, (b) effect on maximal temperature difference. (, mm, mm, mm).

Figure 10.
The effect of plate angle of the divergence plenums on the temperature distribution for various inlet airflow rates: (a) effect on maximal temperature, (b) effect on maximal temperature difference. ( mm, , mm, mm).
Figure 10.
The effect of plate angle of the divergence plenums on the temperature distribution for various inlet airflow rates: (a) effect on maximal temperature, (b) effect on maximal temperature difference. ( mm, , mm, mm).

Figure 11.
The effect of the minimal width of the divergence plenum on the temperature distribution for various inlet airflow rates. (a) effect on maximal temperature, (b) effect on maximal temperature difference. (, , mm, mm).
Figure 11.
The effect of the minimal width of the divergence plenum on the temperature distribution for various inlet airflow rates. (a) effect on maximal temperature, (b) effect on maximal temperature difference. (, , mm, mm).

Figure 12.
The influence of the minimal width of the convergence plenum on the temperature distribution for various inlet airflow rates. (a) effect on maximal temperature. (b) effect on maximal temperature difference. (, , mm, mm).
Figure 12.
The influence of the minimal width of the convergence plenum on the temperature distribution for various inlet airflow rates. (a) effect on maximal temperature. (b) effect on maximal temperature difference. (, , mm, mm).

Figure 13.
Flow chart of stud GA.

Figure 14.
Flow chart of battery pack optimization.

Figure 15.
Comparison of the battery unit temperature before and after optimization.

Figure 16.
Comparison of air velocities in the cooling channels before and after optimization.


Table 1.
Values of Y and y under various Reynold numbers in Equation (22).
| Re | Y | y |
|---|---|---|
| 1–4 | 0.989 | 0.330 |
| 4–40 | 0.911 | 0.385 |
| 40–4000 | 0.683 | 0.466 |
| 4000–40,000 | 0.193 | 0.618 |
| 40,000–250,000 | 0.0266 | 0.805 |
Table 2.
Parameters of battery and air.
| Parameter | Air | Battery |
|---|---|---|
| Density [kg/m3] | 1.1614 | 5400 |
| Intensity of heat generated [W/m3] | - | 264,170 |
| Specific heat capacity [J/(kg K)] | 1007 | 502.35 |
| Thermal conductivity [W/(m K)] | 0.0263 | 1.37 x/17.33 z |
| Dynamic viscosity [kg/(m s)] | 1.85 10−5 | - |
x represents the parameter in the radial direction; z represents the parameter in the axial direction.
Table 3.
Comparison before and after optimization at inlet airflow rate of 0.040 m3/s.
| BTMS | (°) | (°) | (mm) | (K) | Area(m2) |
|---|---|---|---|---|---|
| origin | 15.0 | 15.0 | 5.0 | 5.9 | 1.7747 × 10⁻² |
| A-opt1 | 17.1 | 15.0 | 5.0 | 5.0 | 1.8212 × 10⁻² |
| A-opt2 | 15.0 | 15.0 | 7.8 | 5.0 | 1.8176 × 10⁻² |
| SG-opt | 14.0 | 10.1 | 10.2 | 5.0 | 1.6639 × 10⁻² |
Publisher’s Note: MDPI stays neutral with regard to jurisdictional claims in published maps and institutional affiliations. |
© 2021 by the authors. Licensee MDPI, Basel, Switzerland. This article is an open access article distributed under the terms and conditions of the Creative Commons Attribution (CC BY) license (https://creativecommons.org/licenses/by/4.0/).
Share and Cite
MDPI and ACS Style
Chen, J.; Xuan, D.; Wang, B.; Jiang, R. Structure Optimization of Battery Thermal Management Systems Using Sensitivity Analysis and Stud Genetic Algorithms. Appl. Sci. 2021, 11, 7440. https://0-doi-org.brum.beds.ac.uk/10.3390/app11167440
AMA Style
Chen J, Xuan D, Wang B, Jiang R. Structure Optimization of Battery Thermal Management Systems Using Sensitivity Analysis and Stud Genetic Algorithms. Applied Sciences. 2021; 11(16):7440. https://0-doi-org.brum.beds.ac.uk/10.3390/app11167440
Chicago/Turabian StyleChen, Jiahui, Dongji Xuan, Biao Wang, and Rui Jiang. 2021. "Structure Optimization of Battery Thermal Management Systems Using Sensitivity Analysis and Stud Genetic Algorithms" Applied Sciences 11, no. 16: 7440. https://0-doi-org.brum.beds.ac.uk/10.3390/app11167440
Note that from the first issue of 2016, this journal uses article numbers instead of page numbers. See further details here.