
Metal Bioaccumulation by Carp and Catfish Cultured in Lake Chapala, and Weekly Intake Assessment

 ,
,  ,
,
Abstract
:1. Introduction
2. Materials and Methods
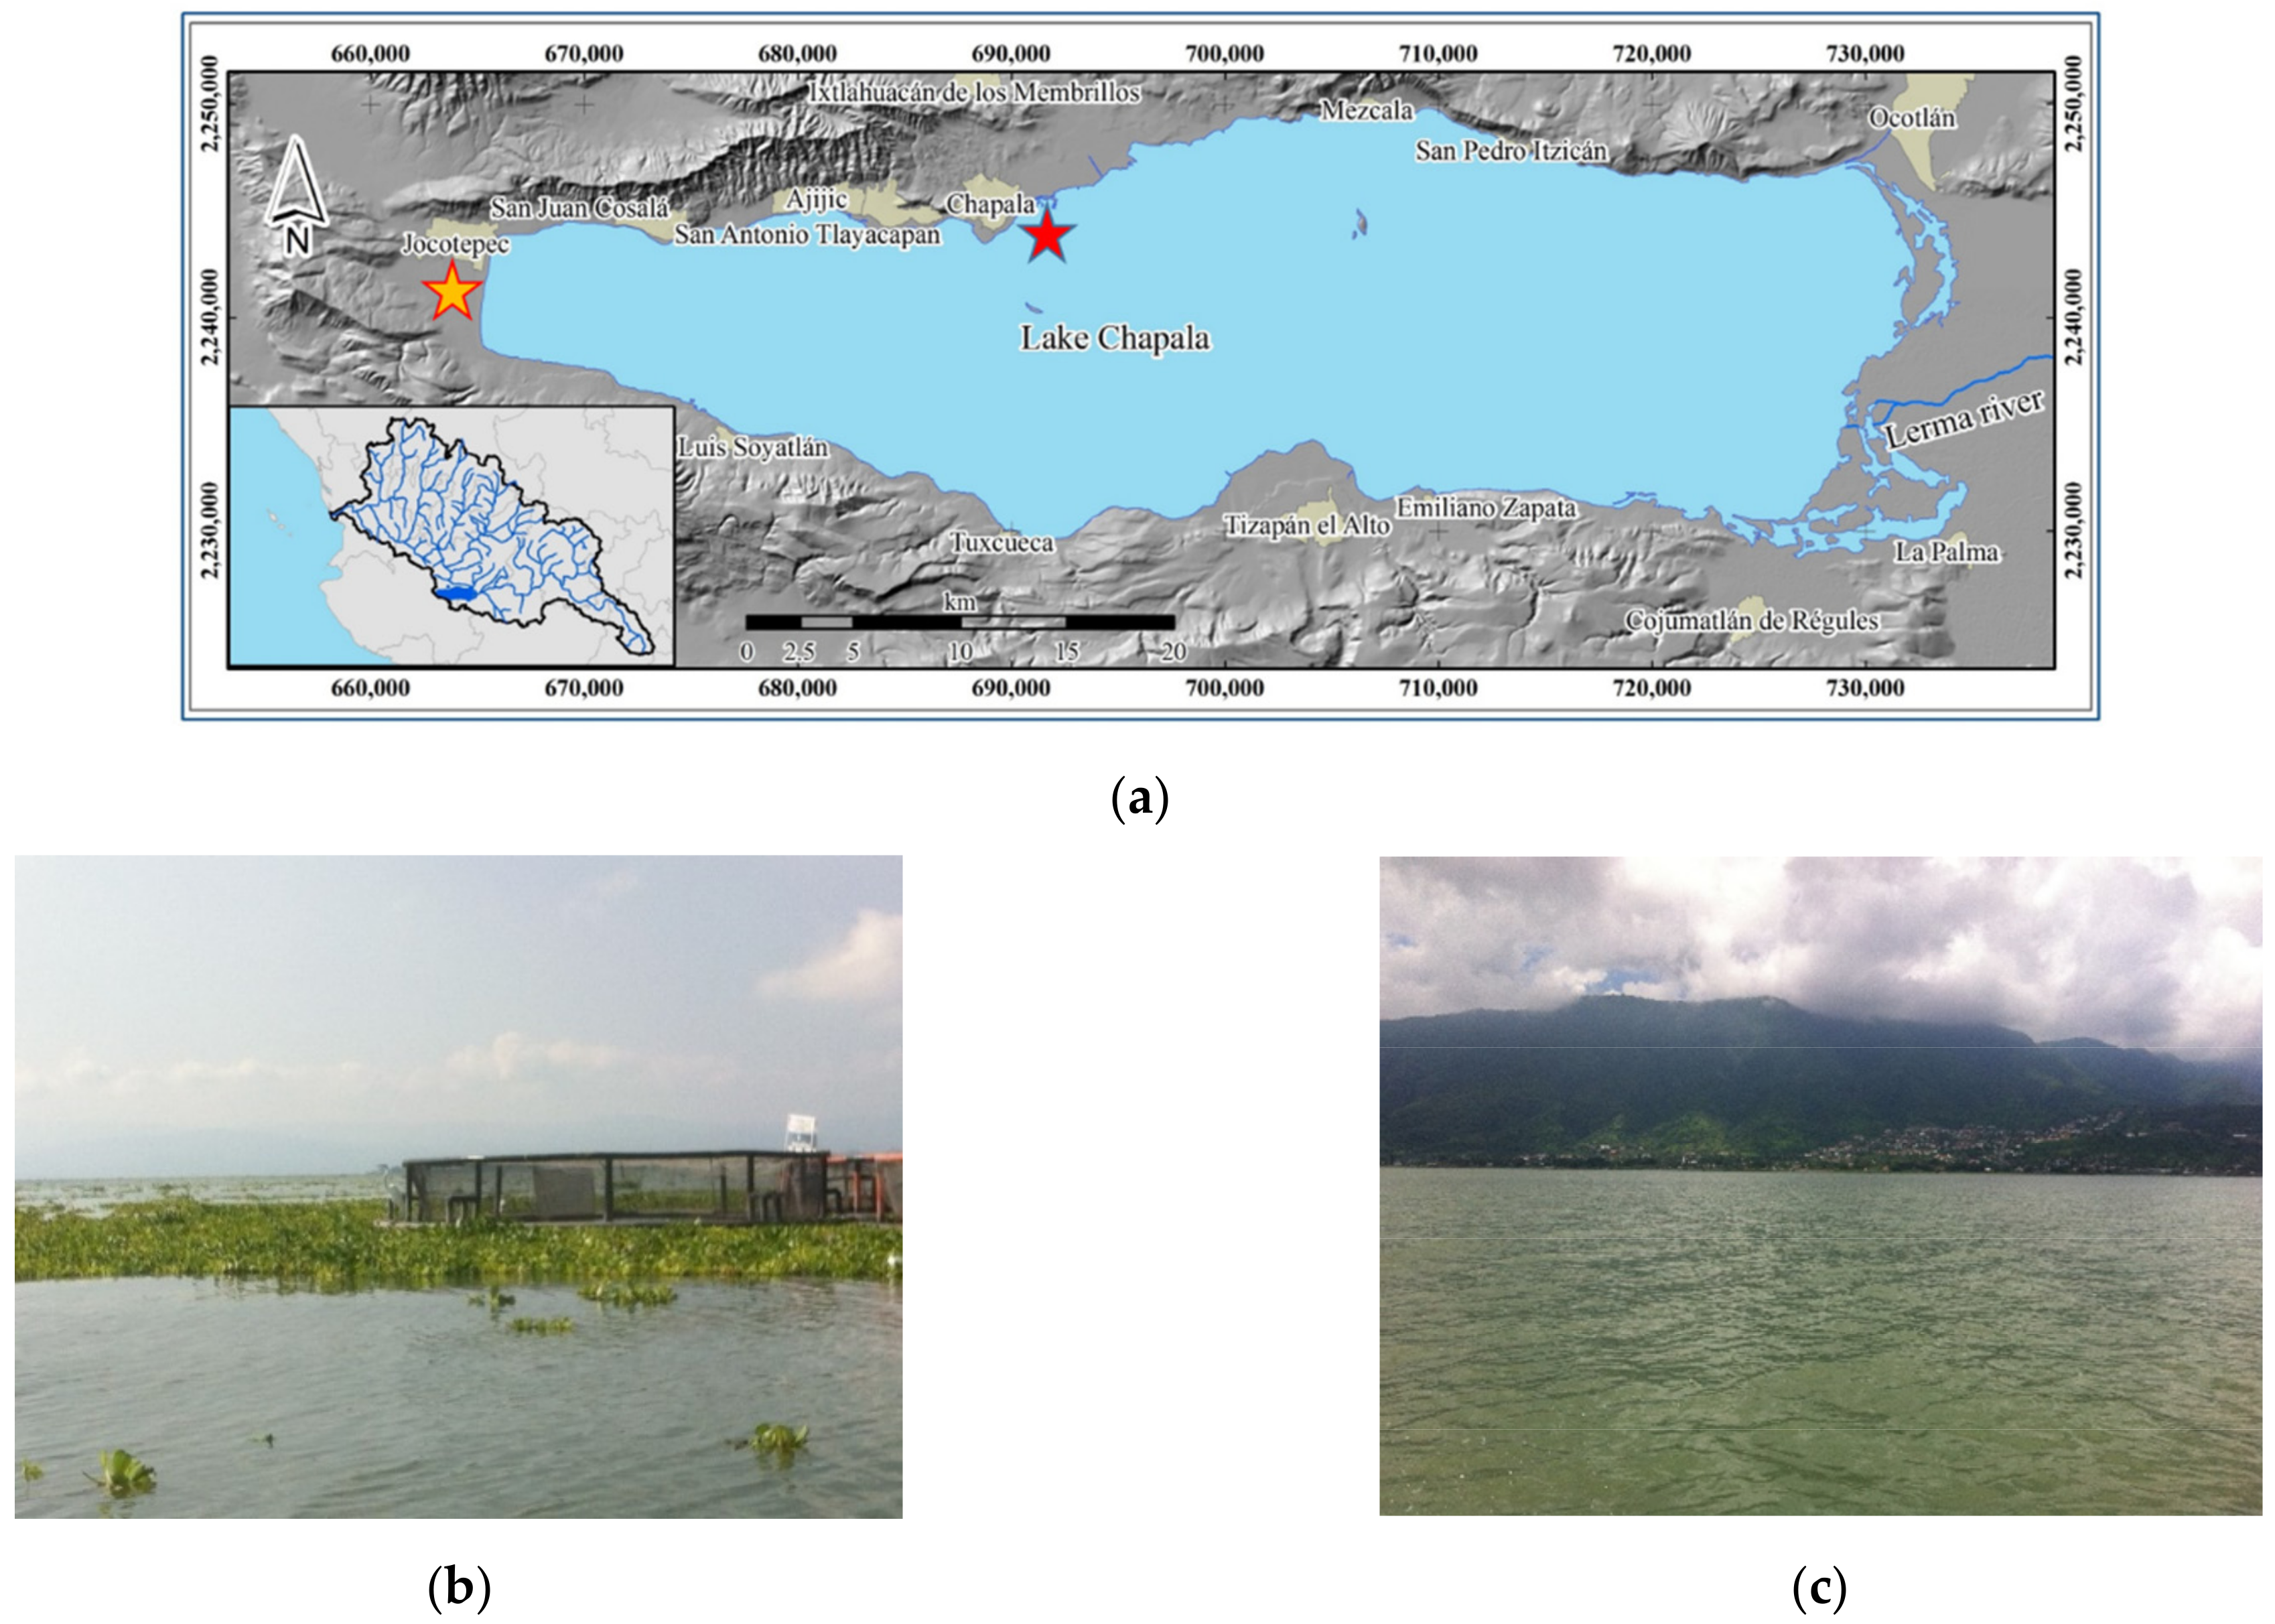
2.1. Study Design and Sampling
2.2. Analysis of Metals
2.3. Estimated Weekly Intake
2.4. Data Processing
2.5. Statistical Analyses
3. Results
3.1. Pattern of Metal Bioaccumulation
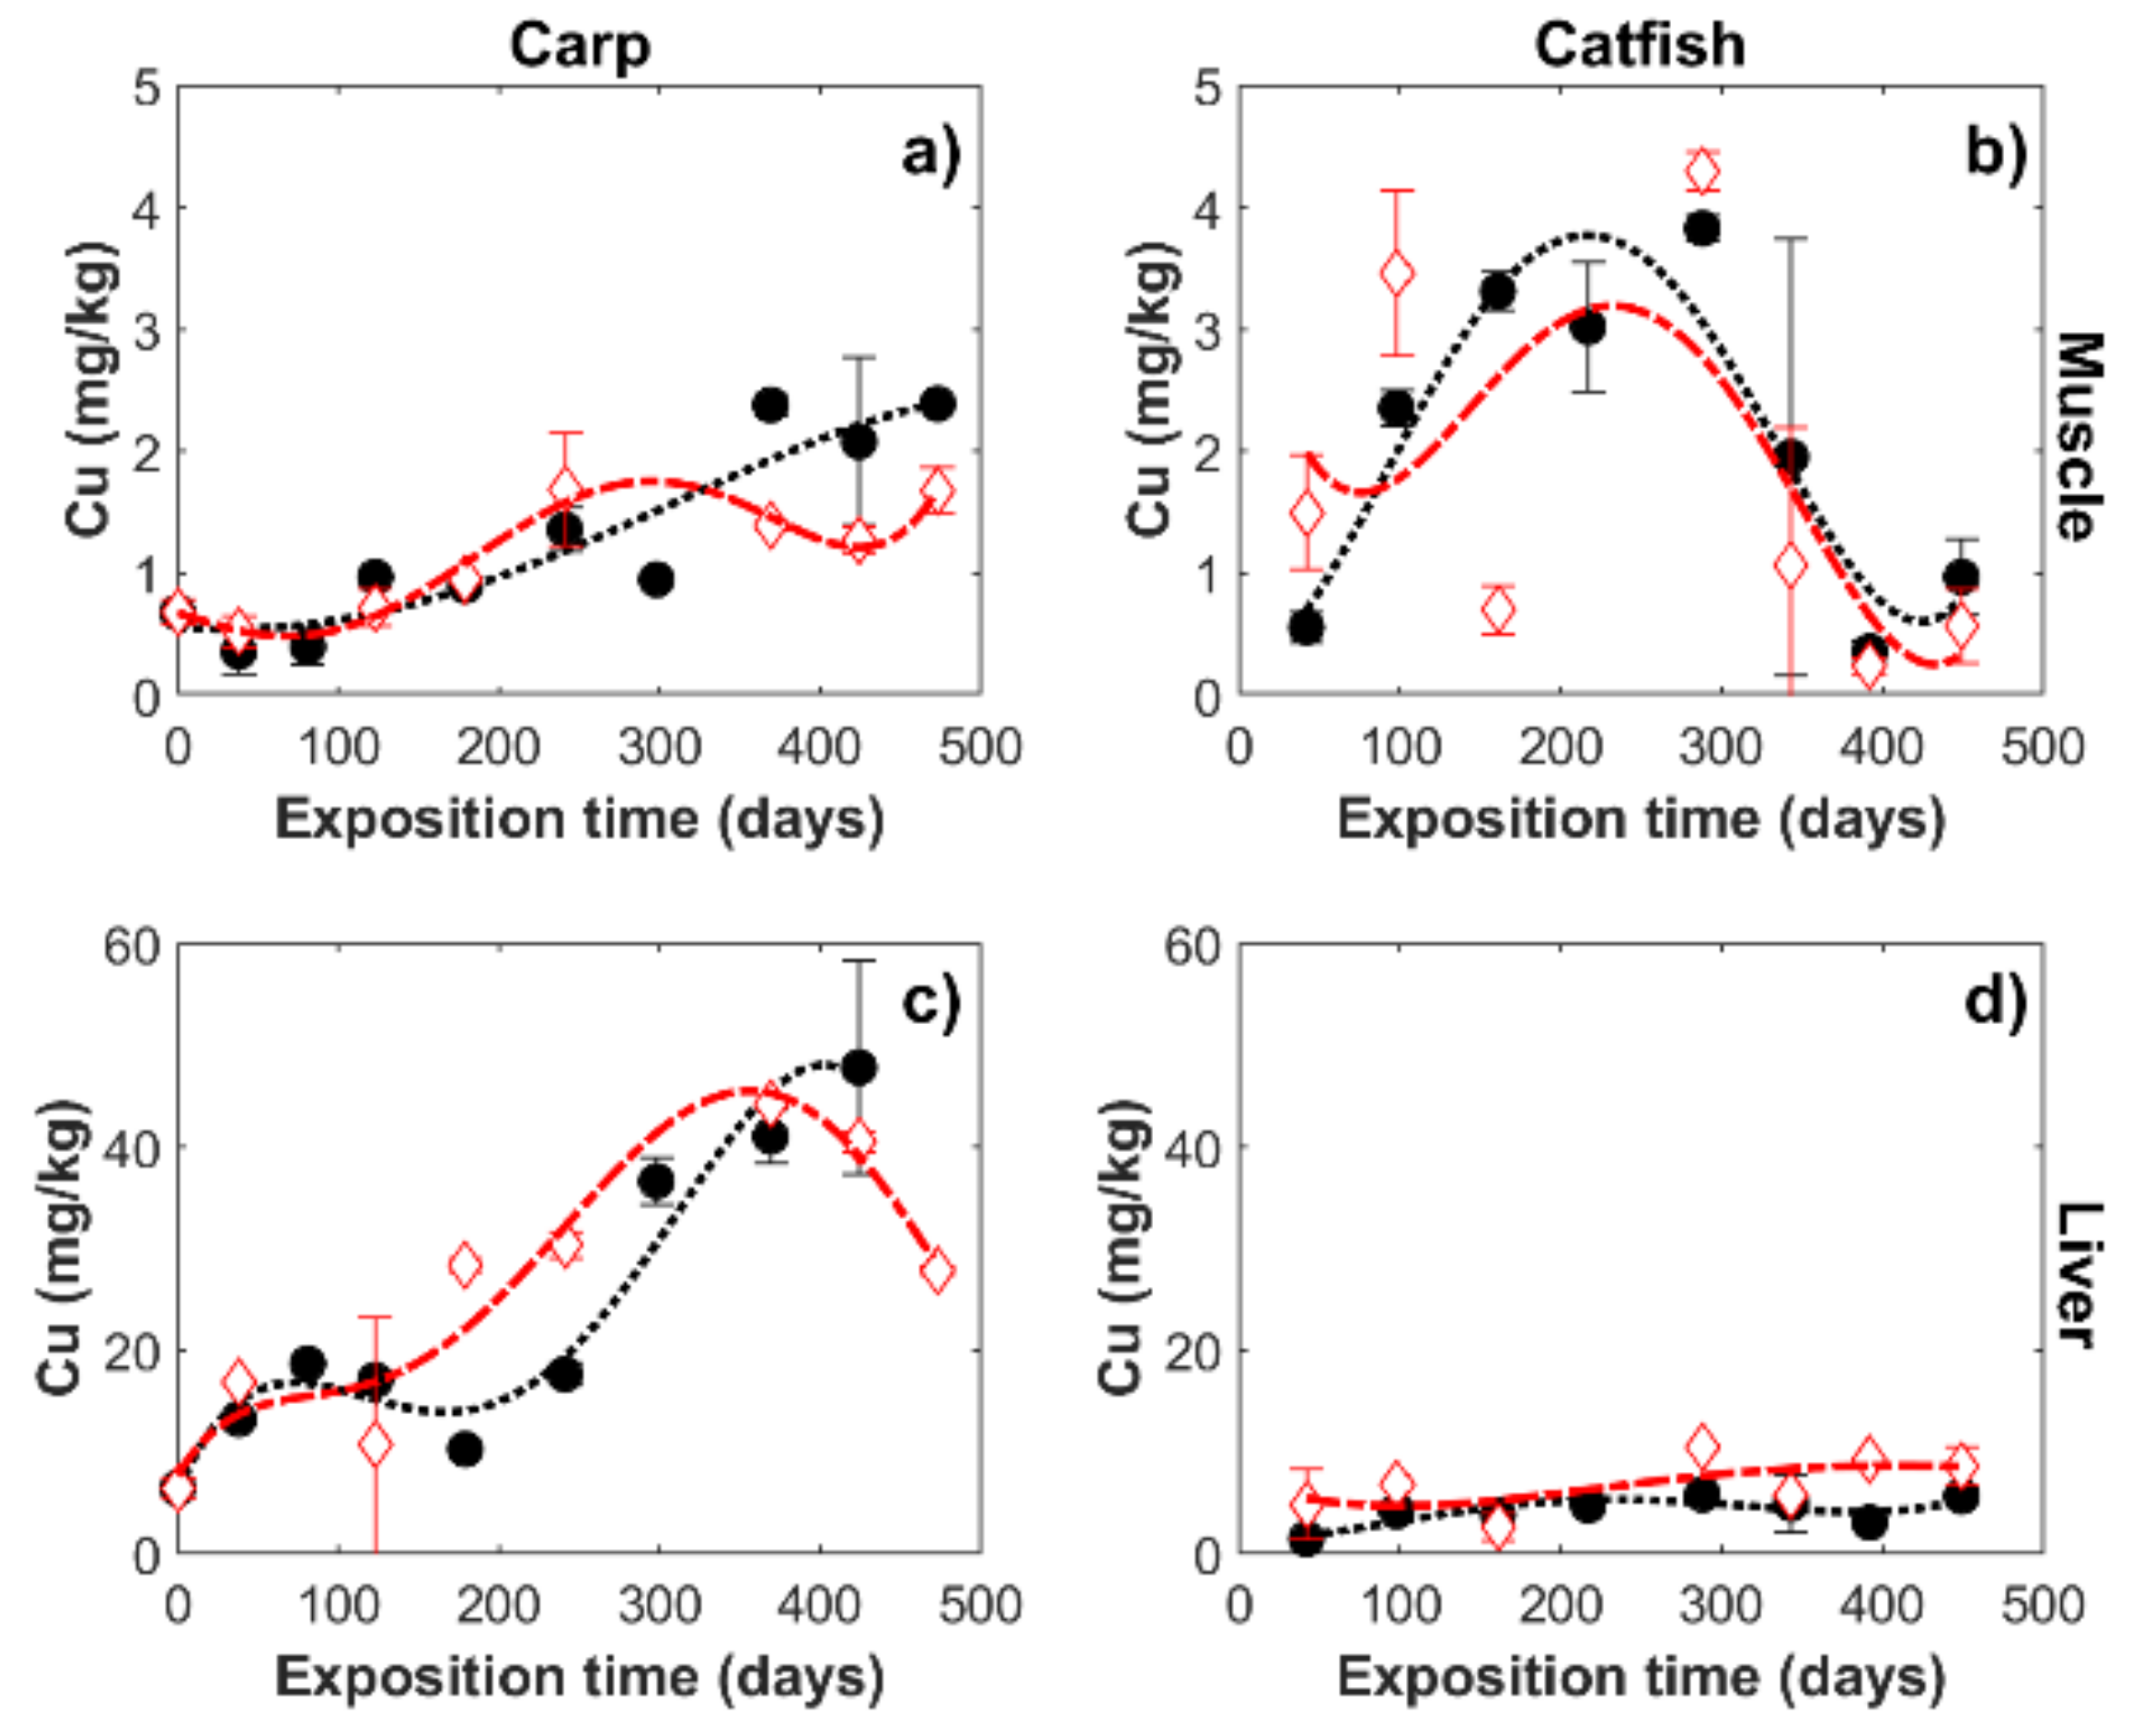
3.1.1. Essential Metals: Cu and Zn
- Copper
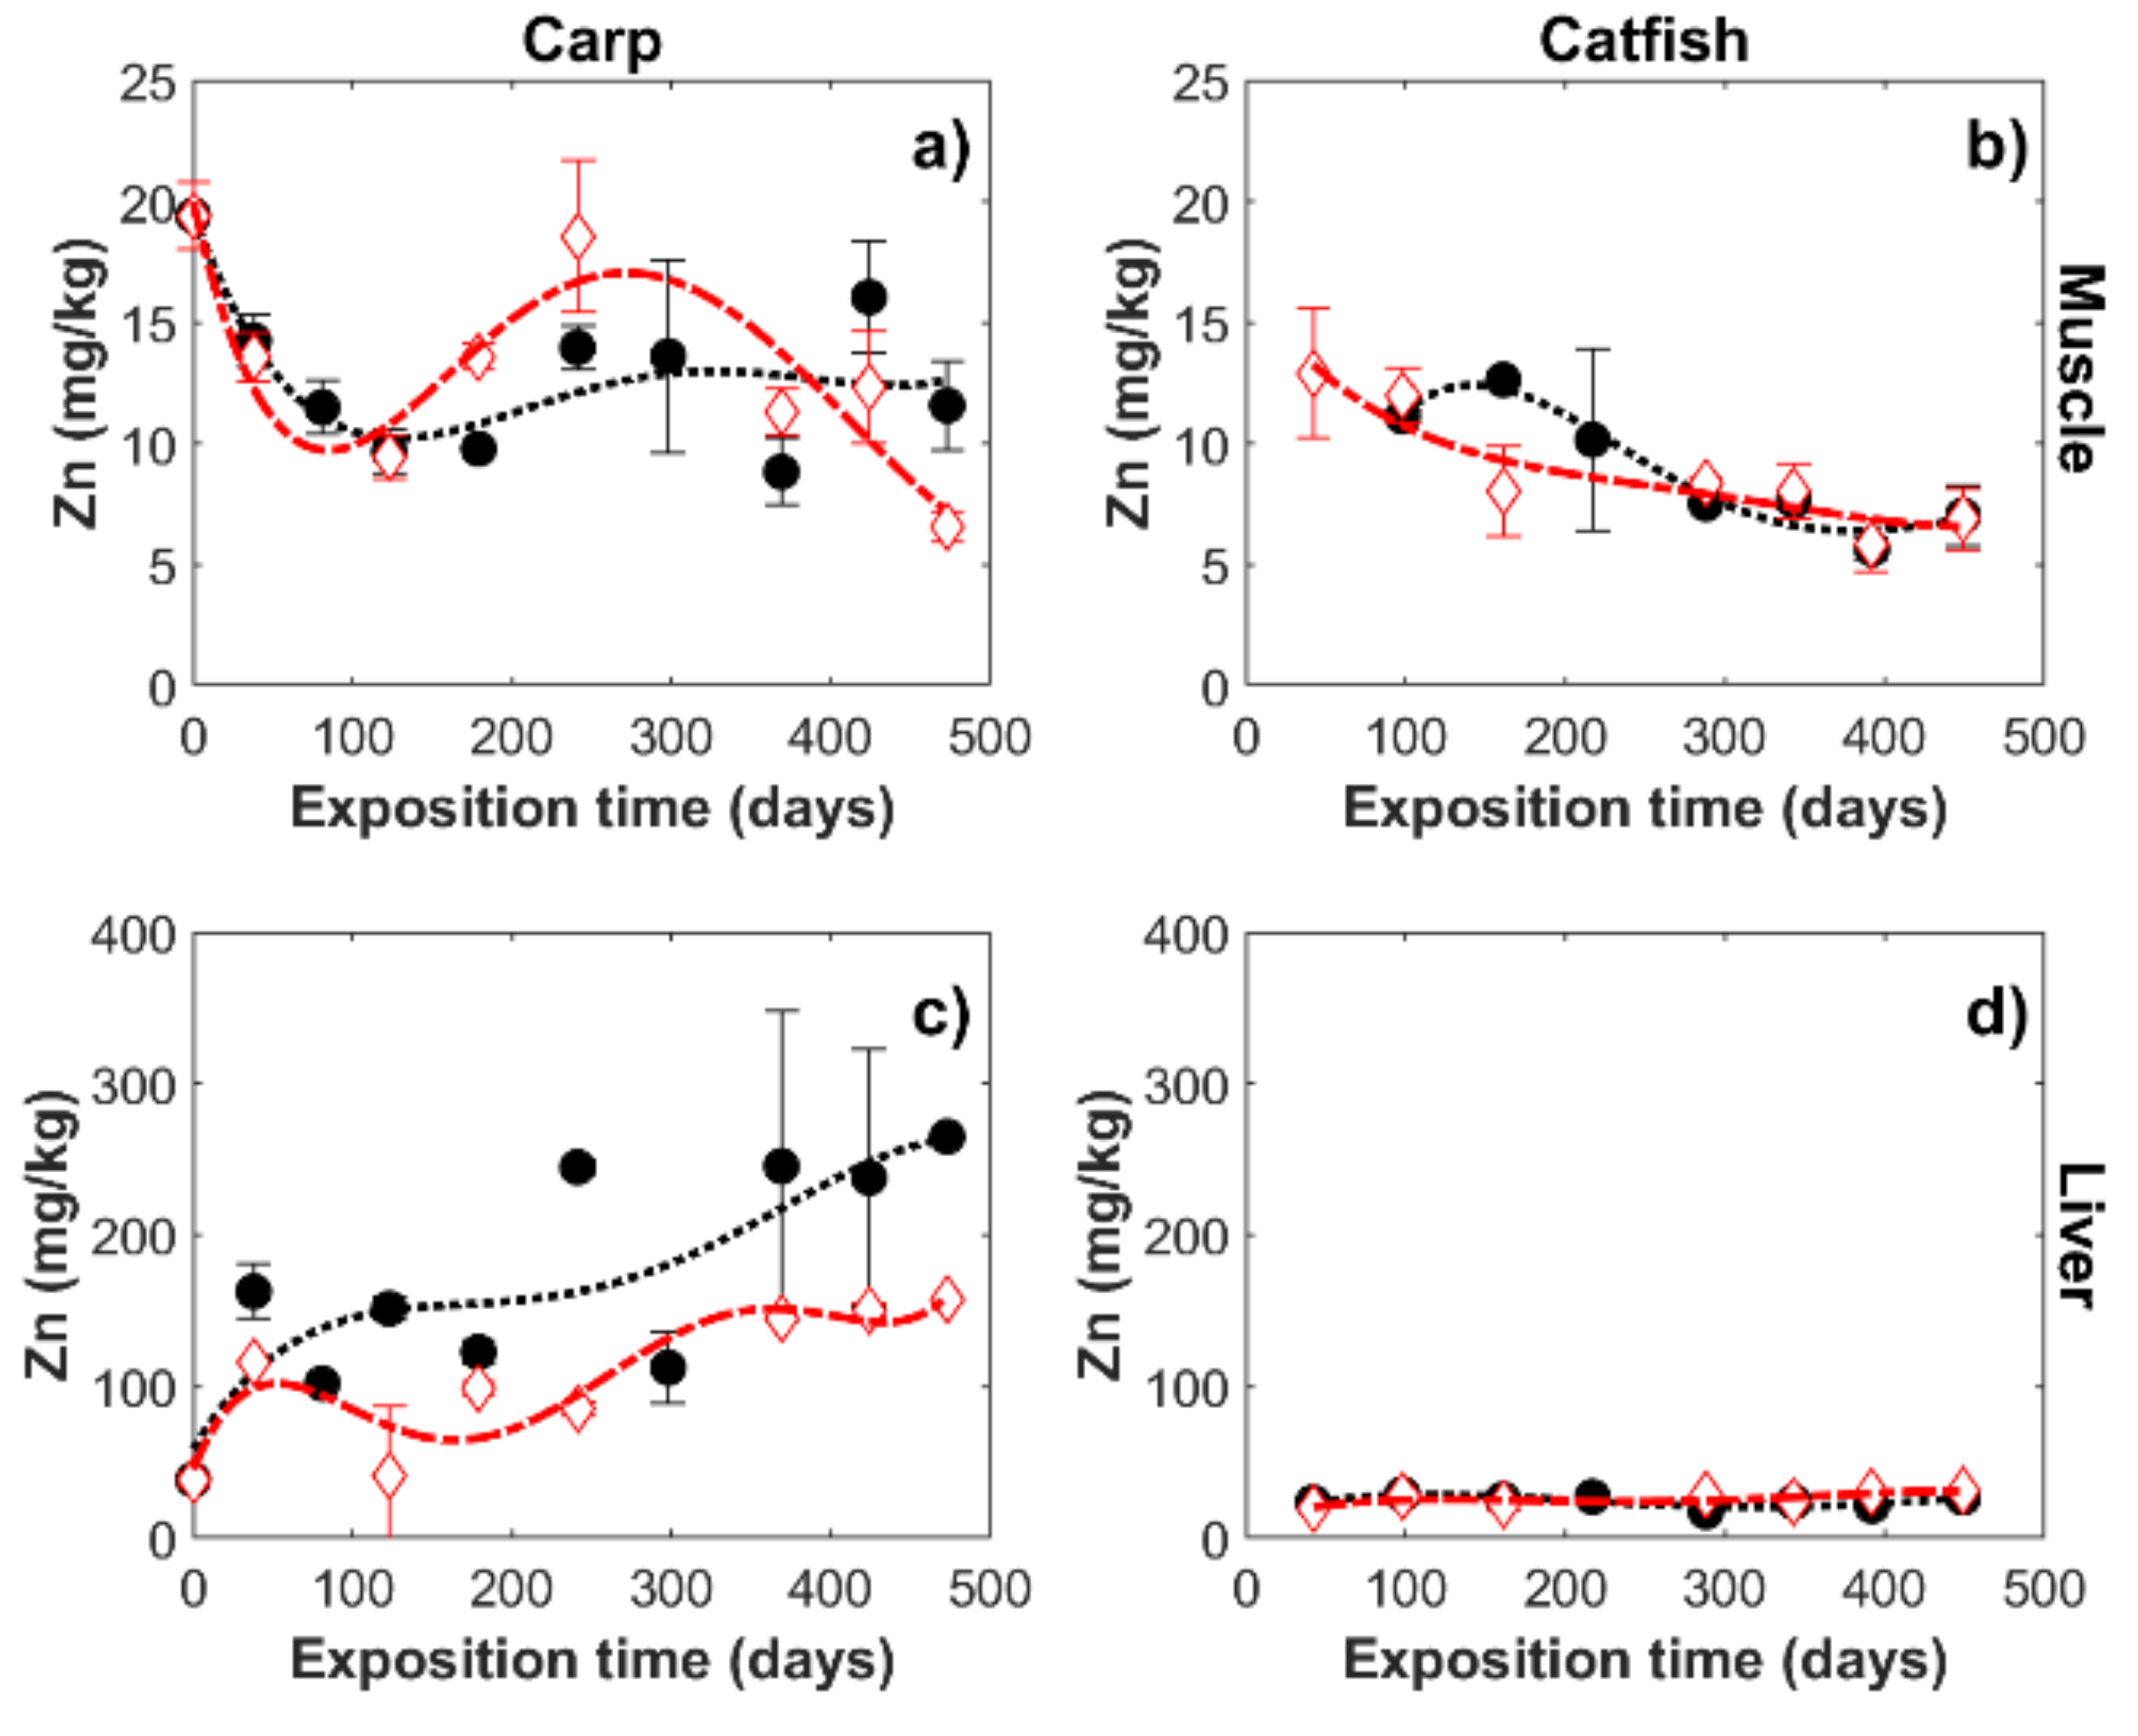
- Zinc
3.1.2. Non-Essential Metals: Cd, As, Pb, and Hg
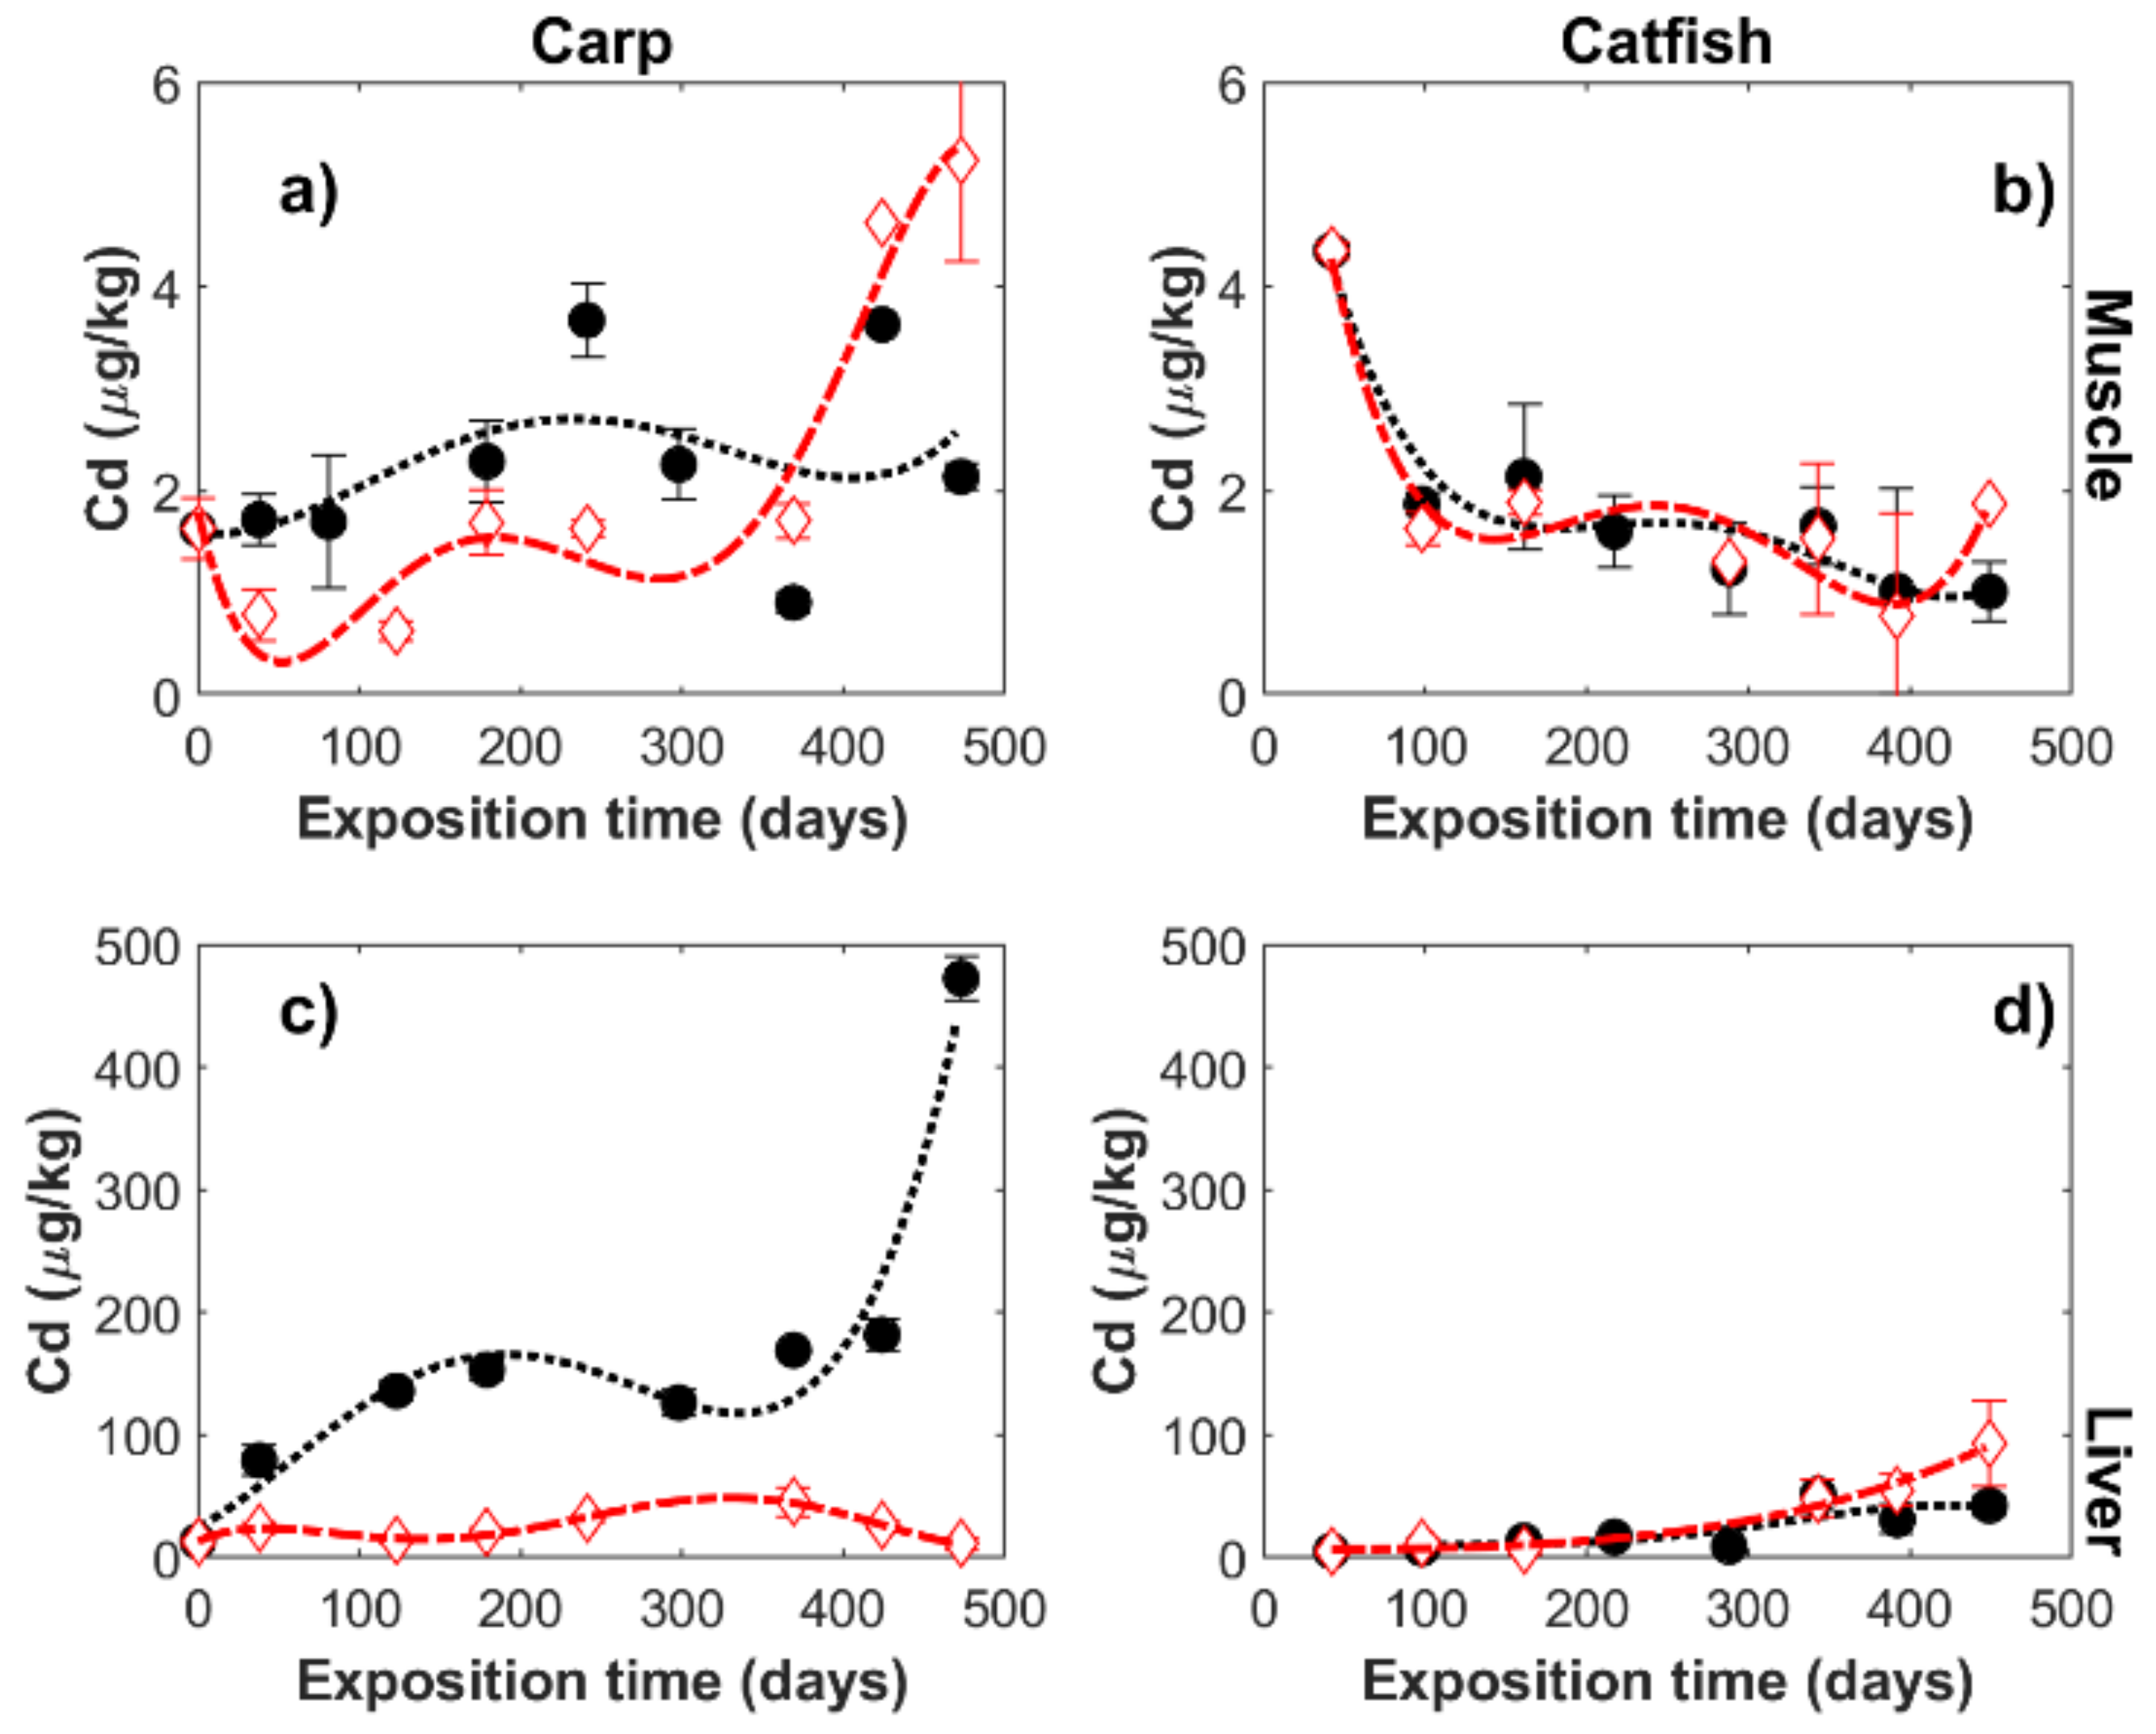
- Cadmium
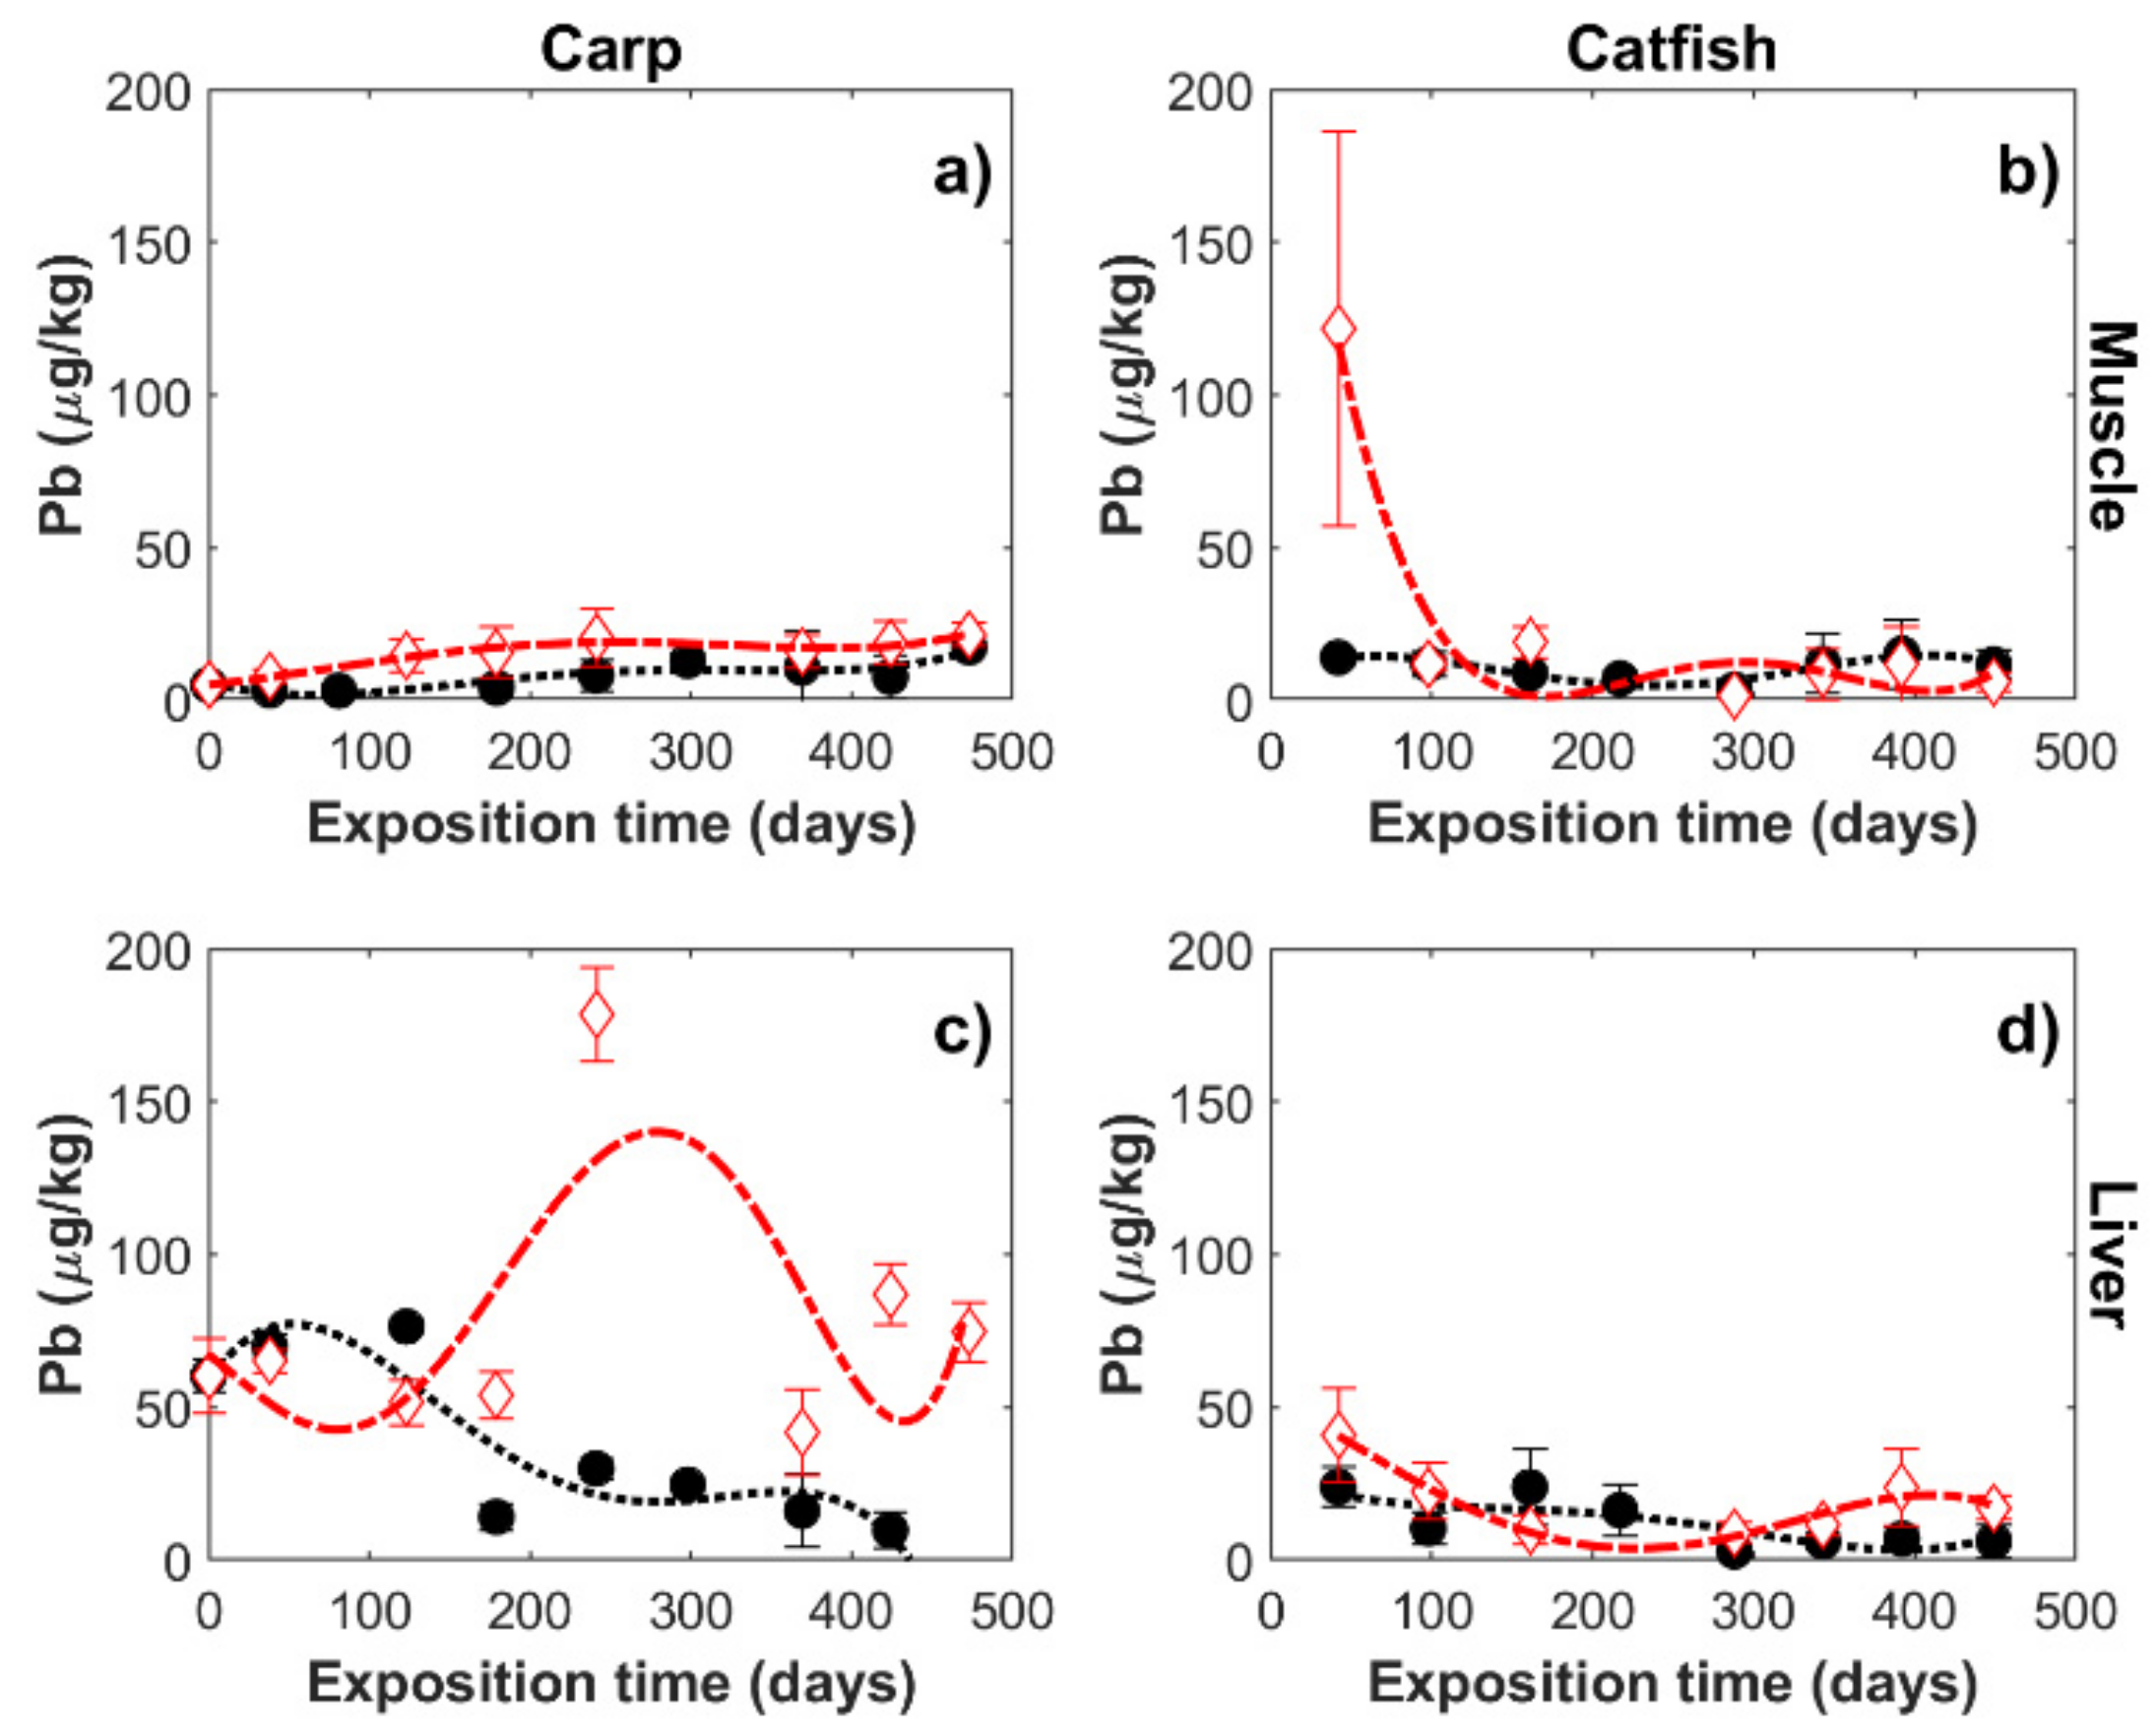
- Lead
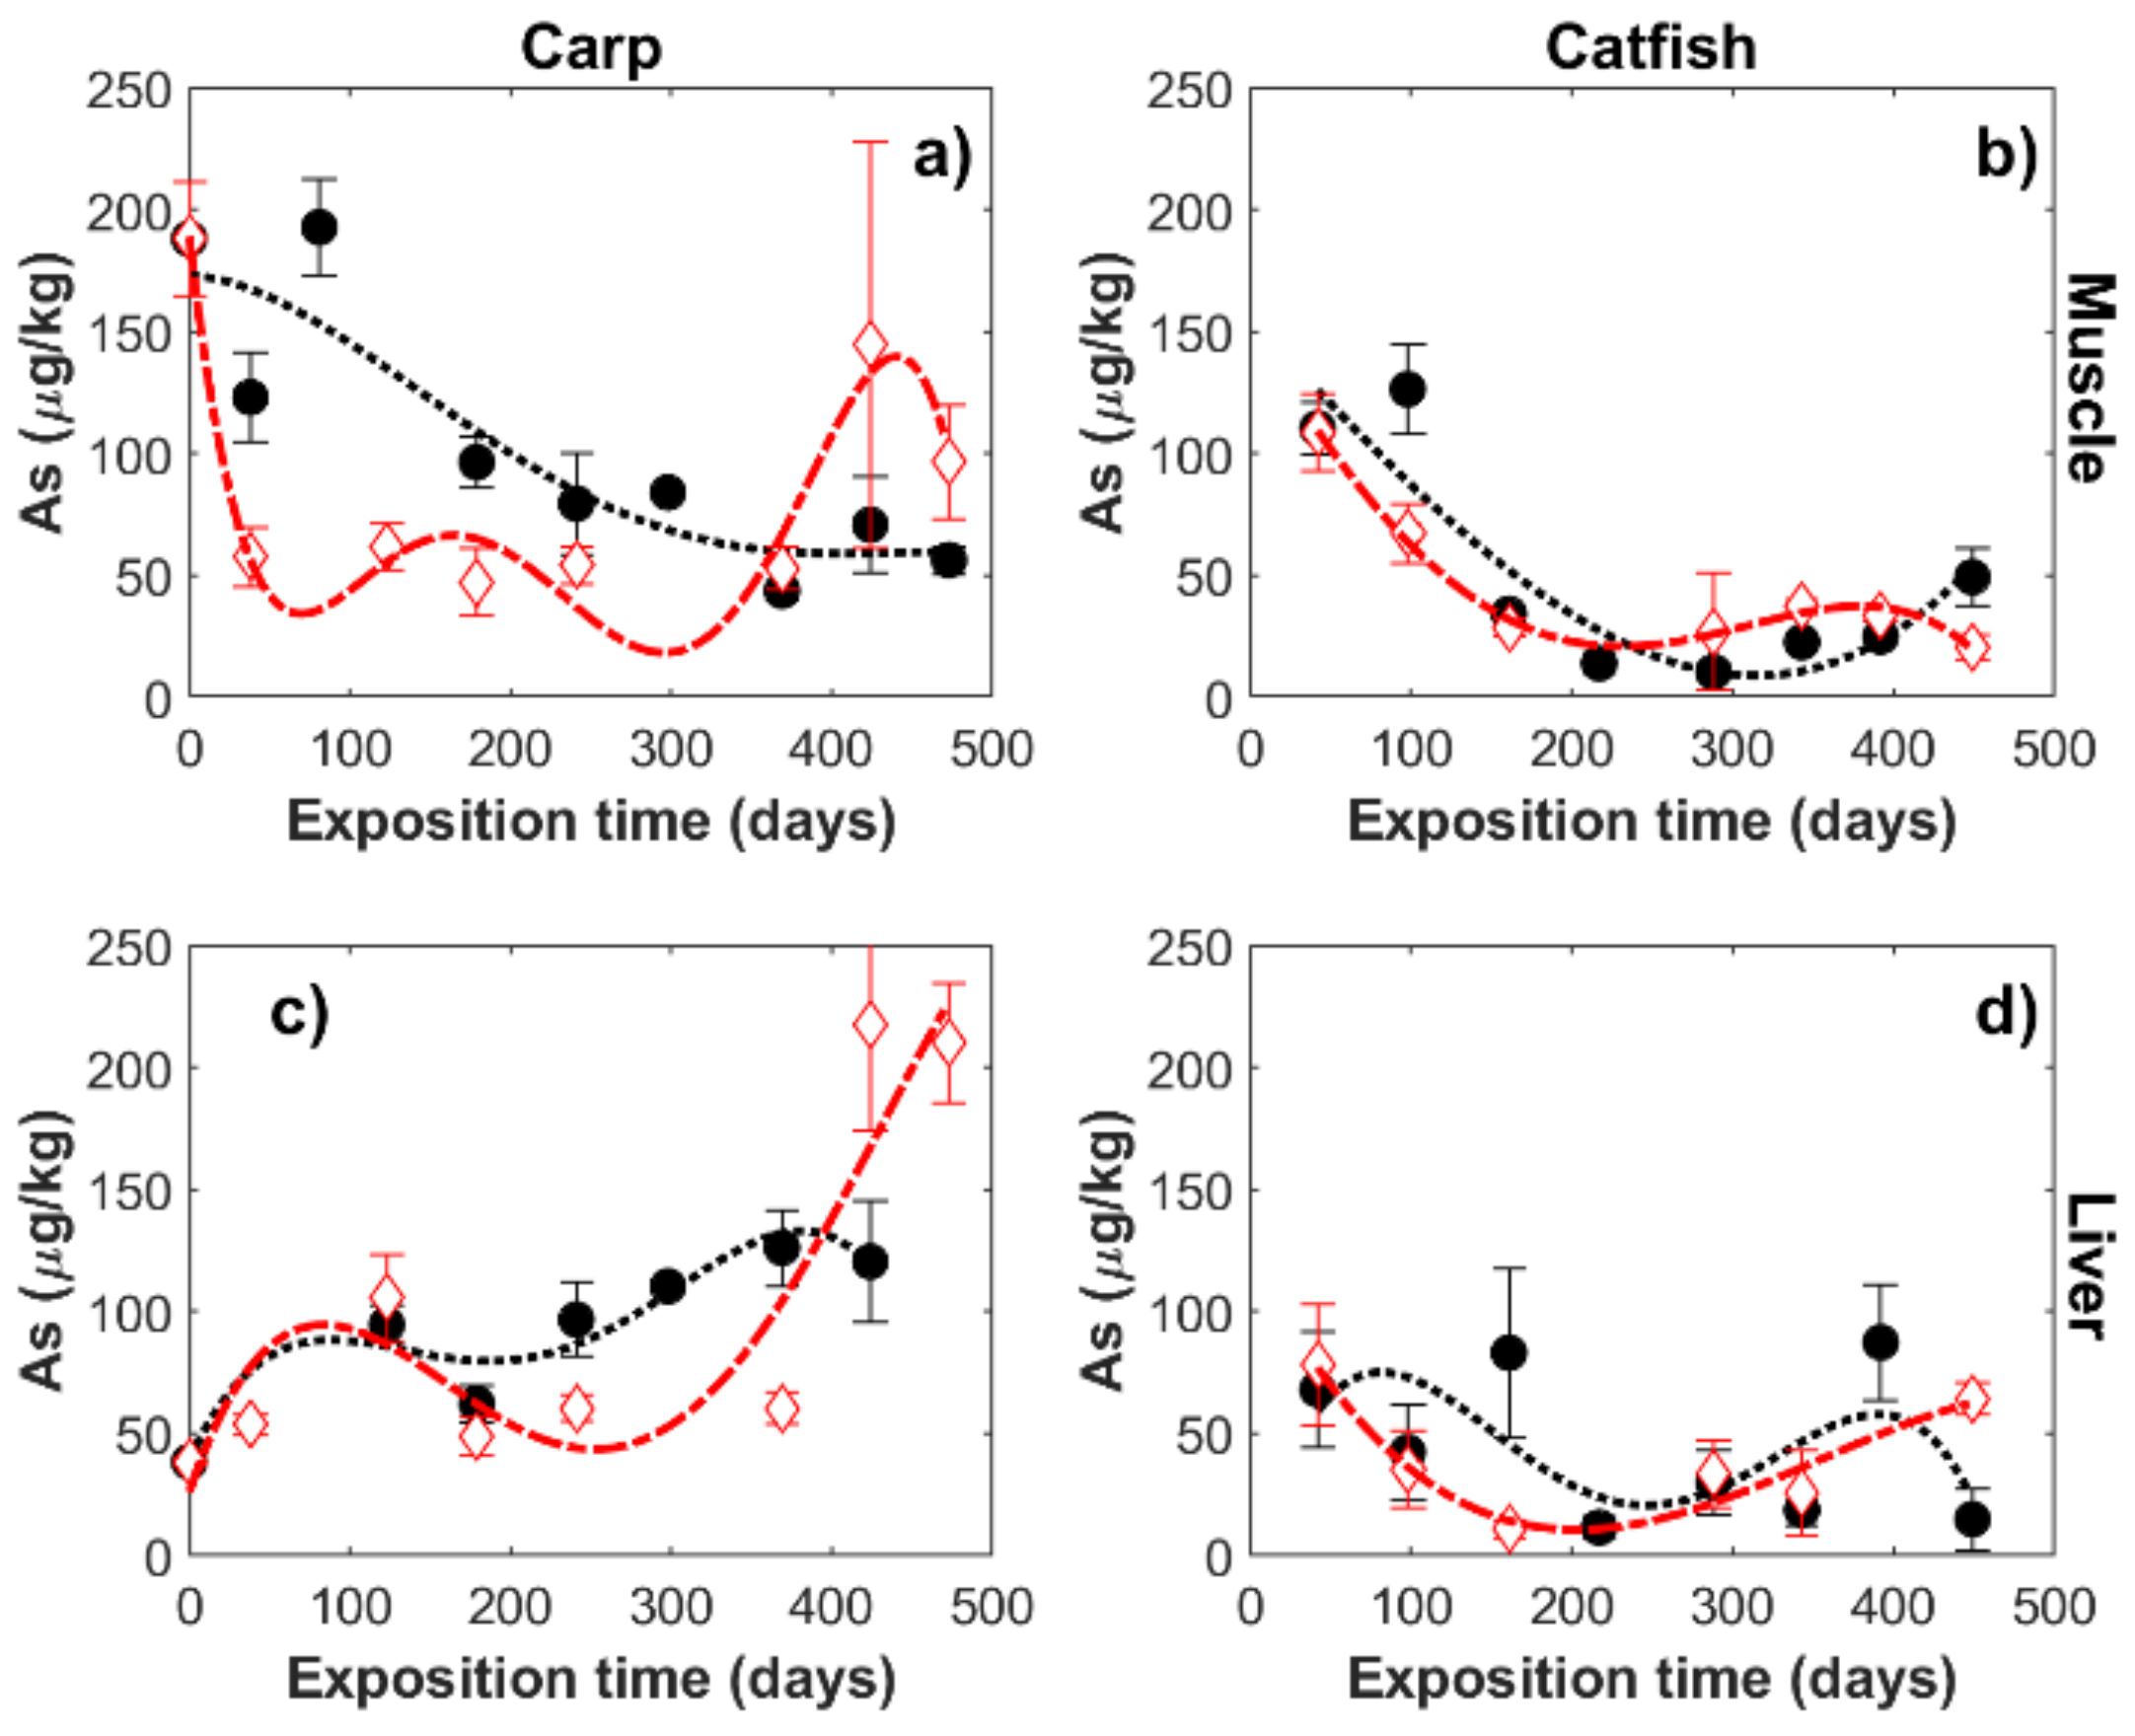
- Arsenic
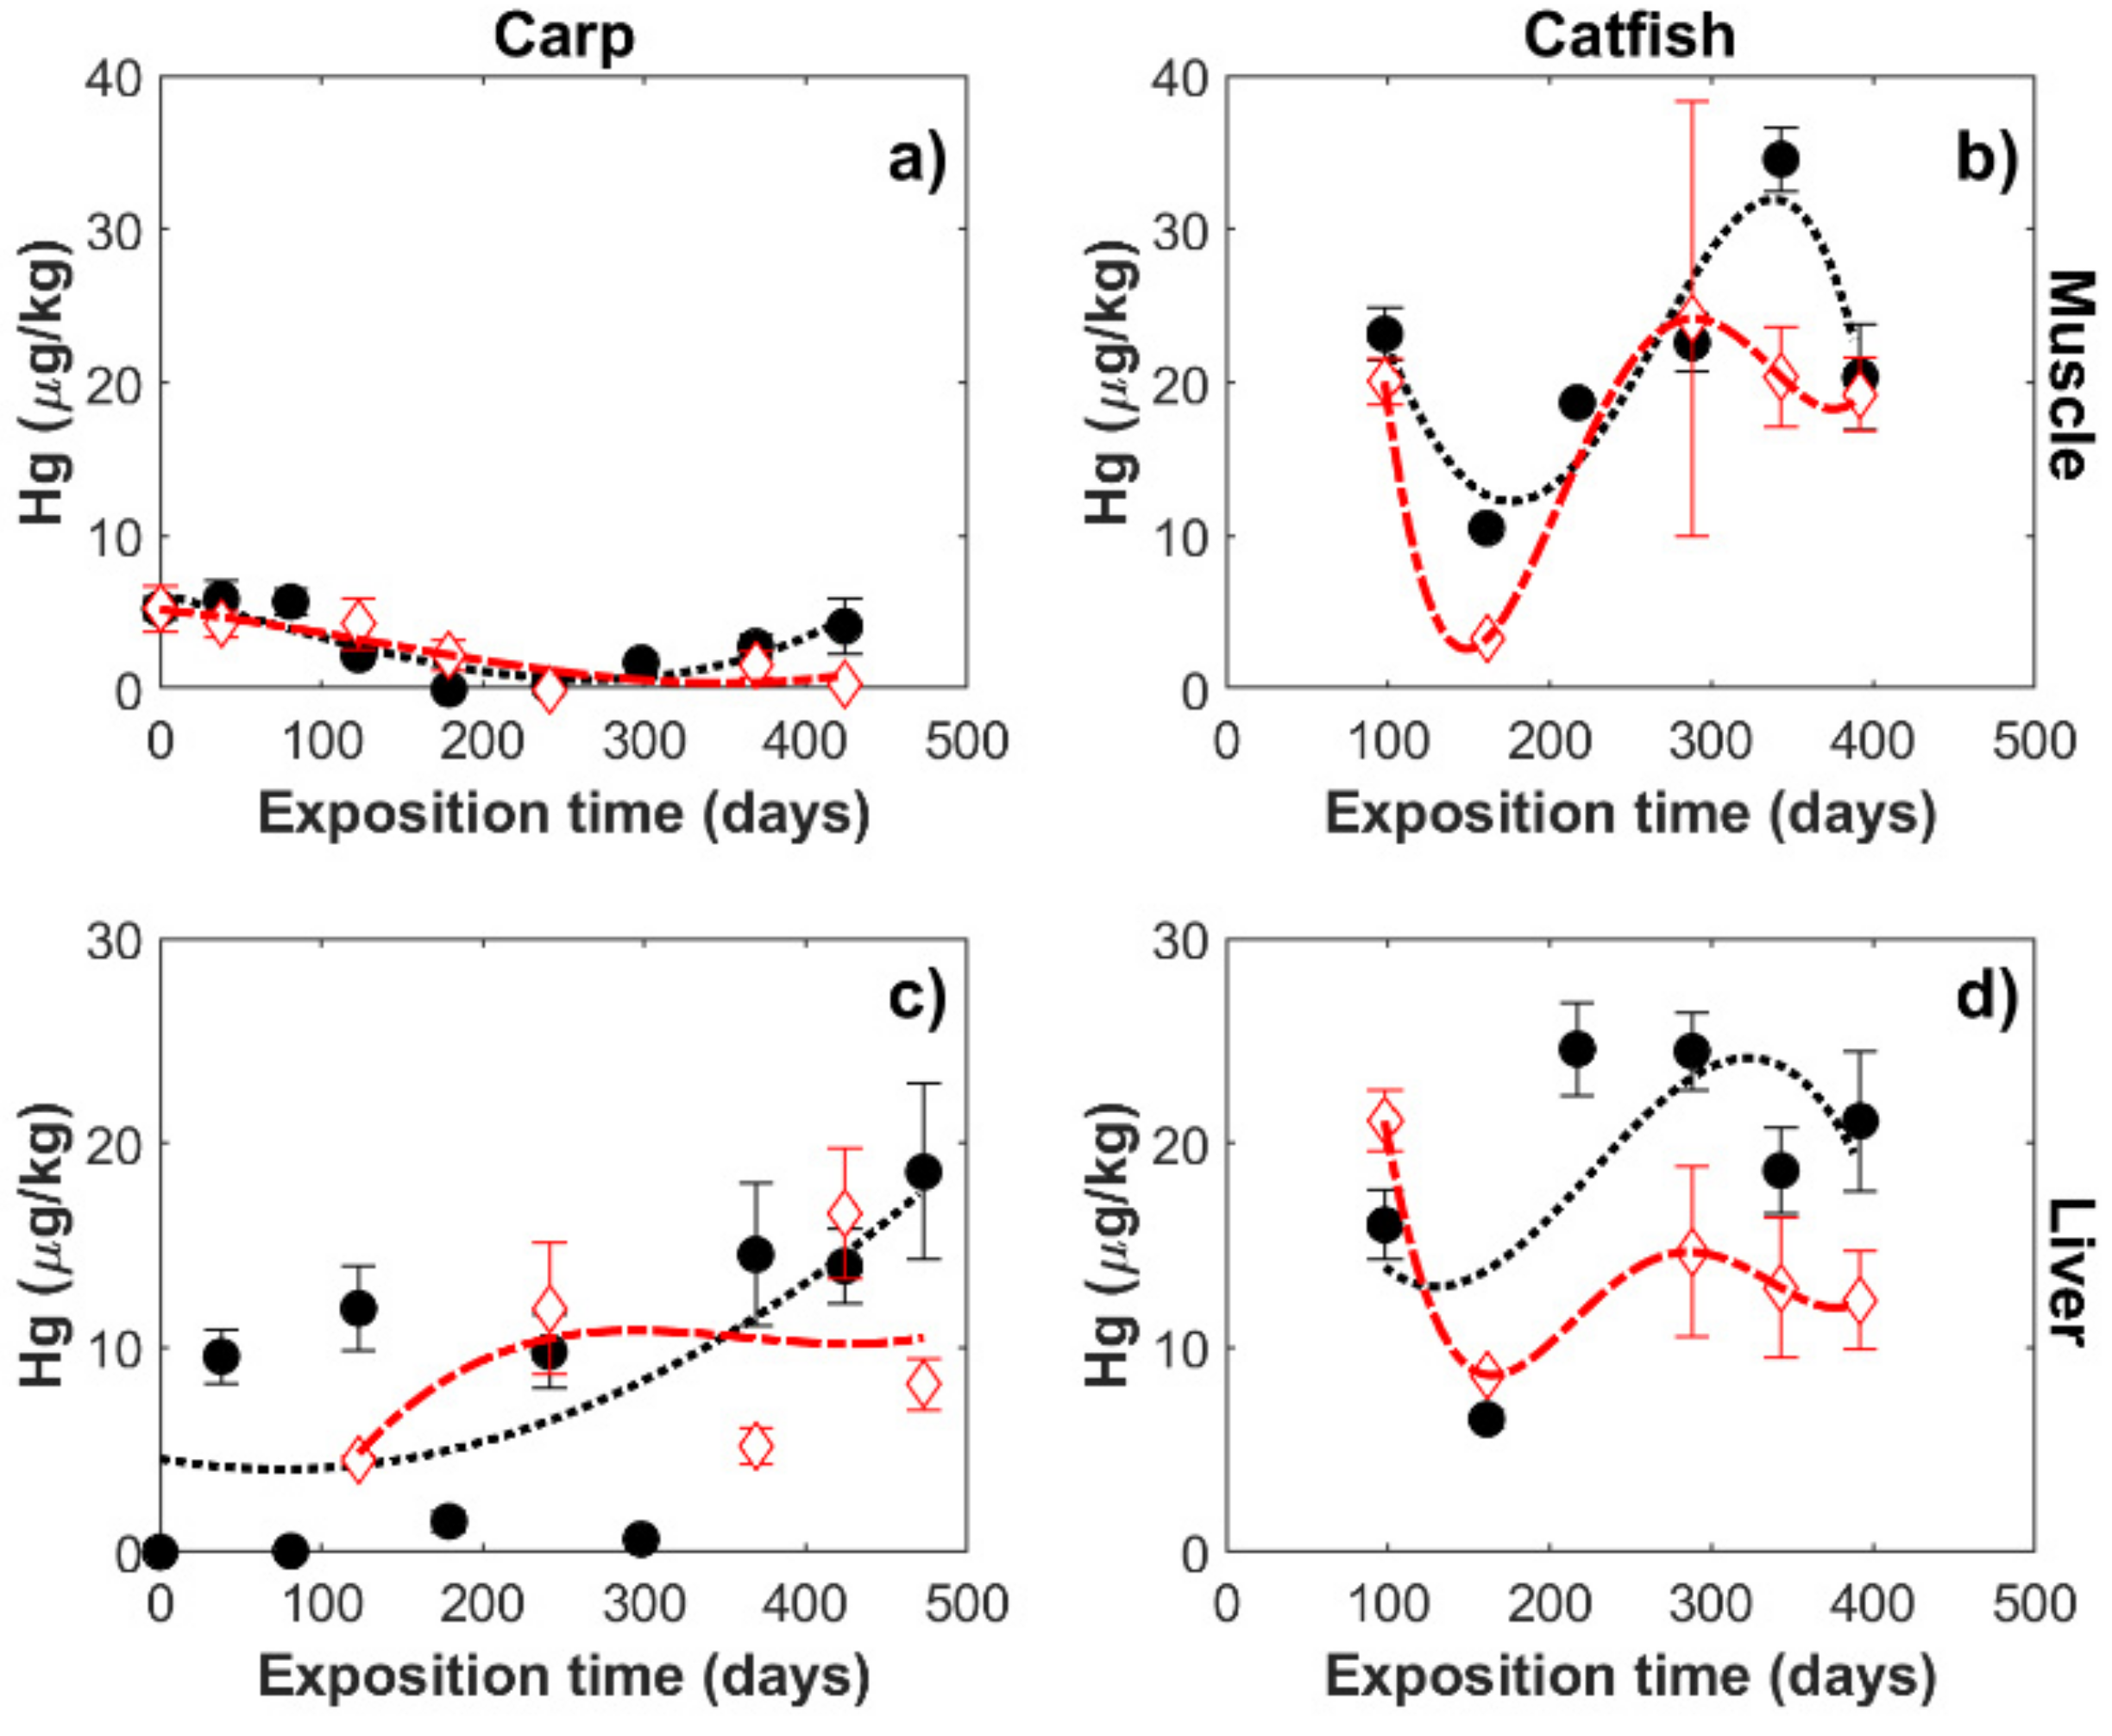
- Mercury
3.2. Estimated Weekly Intake
4. Discussion

| Metal | Fish | Origin | Country | Mean | EWI * | % PTWI | Reference |
|---|---|---|---|---|---|---|---|
| Cd | Carp | Lake Chapala | Mexico | 2.23 | 0.006 | 0.11 | Present Study |
| Catfish | 1.23 | 0.004 | 0.06 | ||||
| Catfish | El Rejon Dam | 148.00 | 0.395 | 6.58 | [12] | ||
| Cultured Carp | Lake Kasumigaura | Japan | 7.40 | 0.021 | 0.35 | [30] | |
| Wild Carp | 9.00 | 0.026 | 0.43 | ||||
| Crucian carp | Honghu Lake | China | 8.70 | 0.028 | 0.47 | [37] | |
| Yellow Catfish | 5.60 | 0.018 | 0.30 | ||||
| Silver Carp | Chah Nime Lake | Iran | 31.20† | 0.096 | 1.60 | [43] | |
| Carp | Gorgan Bay | 260.00 | 0.743 | 12.38 | [38] | ||
| Pb | Carp | Lake Chapala | Mexico | 11.97 | 0.034 | 0.14 | Present Study |
| Catfish | 13.03 | 0.037 | 0.15 | ||||
| Catfish | El Rejon Dam | 2740.00 | 7.307 | 29.23 | [12] | ||
| Crucian carp | Honghu Lake | China | 93.80 | 0.305 | 1.22 | [37] | |
| Yellow catfish | 124.20 | 0.403 | 1.61 | ||||
| Silver carp | Chah Nime Lake | Iran | 47.84† | 0.47 | 0.59 | [43] | |
| Carp | Gorgan Bay | 430.00 | 1.229 | 4.91 | [38] | ||
| As | Carp | Lake Chapala | Mexico | 57.01 | 0.163 | 1.09 | Present Study |
| Catfish | 32.39 | 0.093 | 0.62 | ||||
| Catfish | El Rejon Dam | 66.00† | 0.189 | 1.26 | [9] | ||
| Cultured Carp | Lake Kasumigaura | Japan | 178.90 | 0.511 | 3.41 | [30] | |
| Wild carp | 95.00 | 0.271 | 1.81 | ||||
| Yellow catfish | Honghu Lake | China | 4.00 | 0.013 | 0.09 | [37] | |
| Hg | Carp | Lake Chapala | Mexico | 3.44 | 0.010 | 0.61 | Present Study |
| Catfish | 27.46 | 0.078 | 4.90 | ||||
| Carp | 870.00 | 2.486 | 155.36 | [41] | |||
| Carp | 390.00 | 1.114 | 69.64 | [10] | |||
| Carp | 229.00 | 0.654 | 40.89 | [11] | |||
| Carp | San Antonio Dam | 72.50 | 0.207 | 12.95 | |||
| Catfish | El Rejon Dam | 46.50 | 0.124 | 7.75 | [12] | ||
| Roach | Olsztyn Lake | Poland | 140.00 | 0.467 | 29.17 | [42] |
5. Conclusions
Author Contributions
Funding
Institutional Review Board Statement
Data Availability Statement
Acknowledgments
Conflicts of Interest
References
- Comisión Estatal de Agua Jalisco. Available online: https://www.ceajalisco.gob.mx/contenido/chapala/ (accessed on 6 April 2021).
- Hansen, A.M.; Zavala, A.L.; Inclan, L.B. Fuentes de contaminación y enriquecimiento de metales en sedimentos de la cuenca Lerma-Chapala. Ing. Hidraul. Mex. 1995, 10, 55–69. [Google Scholar]
- De Anda, J.; Shear, H.; Maniak, U.; Zárate-del Valle, P.F. Solids distribution in Lake Chapala, Mexico. J. Am. Water Resour. Assoc. 2004, 40, 97–109. [Google Scholar] [CrossRef]
- Trujillo-Cárdenas, J.L.; Saucedo-Torres, N.P.; Del Valle, P.F.Z.; Ríos-Donato, N.; Mendizábal, E.; Gómez-Salazar, S. Speciation and sources of toxic metals in sediments of Lake Chapala, Mexico. J. Mex. Chem. 2010, 54, 79–87. [Google Scholar] [CrossRef]
- Hansen, A.M. Adsorption-desorption behaviors of Pb and Cd in Lake Chapala, Mexico. Environ. Int. 1997, 23, 553–564. [Google Scholar] [CrossRef]
- Alvarado, C.; Ramírez, J.M.; Herrera-López, E.J.; Cortez-Valladolid, D.; Ramírez, G. Bioaccumulation of Metals in Cultured Carp (Cyprinus carpio) from Lake Chapala, Mexico. Biol. Trace Elem. Res. 2020, 195, 226–238. [Google Scholar] [CrossRef]
- Mozaffarian, D.; Rimm, E.B. Fish Intake, Contaminants, and Human Health: Evaluating the Risks and the Benefits. JAMA 2006, 296, 1885–1899. [Google Scholar] [CrossRef] [Green Version]
- World Health Organization. Evaluations of the Joint FAO/WHO Expert Committee on Food Additives (JEFCA). Available online: https://apps.who.int/food-additives-contaminants-jecfa-database/search.aspx (accessed on 28 January 2021).
- Nevárez, M.; Moreno, M.V.; Sosa, M.; Bundschuh, J. Arsenic in freshwater fish in the Chihuahua County water reservoirs (Mexico). J. Environ. Sci. Health Part A 2011, 46, 1283–1287. [Google Scholar] [CrossRef]
- Stong, T.; Osuna, C.A.; Shear, H.; De Anda Sanchez, J.; Ramírez, G.; De Jesús Díaz Torres, J. Mercury concentrations in common carp (Cyprinus carpio) in Lake Chapala, Mexico: A lakewide survey. J. Environ. Sci. Health Part A 2013, 48, 1835–1841. [Google Scholar] [CrossRef]
- Torres, Z.; Mora, M.A.; Taylor, R.J.; Alvarez-Bernal, D.; Buelna, H.R.; Hyodo, A. Accumulation and hazard assessment of mercury to waterbirds at Lake Chapala, Mexico. Environ. Sci. Technol. 2014, 48, 6359–6365. [Google Scholar] [CrossRef]
- Nevárez, M.; Leal, L.O.; Moreno, M. Estimation of Seasonal Risk Caused by the Intake of Lead, Mercury, and Cadmium through Freshwater Fish Consumption from Urban Water Reservoirs in Arid Areas of Northern Mexico. Int. J. Environ. Res. 2015, 12, 1803–1816. [Google Scholar] [CrossRef] [Green Version]
- Directive 2002/32/EC of the European Parliament and of the Council of 7 May 2002 on undesirable substances in animal feed. Off. J. Eur. Commun. 2006, L140, 9–10.
- Food and Agriculture Organization of the United Nations. The State of World Fisheries and Aquaculture 2020: Sustainability in Action, 1st ed.; FAO: Rome, Italy, 2020; p. 70. [Google Scholar] [CrossRef]
- Uribe, C.; Jiménez, A.; Morales, M.; Salazar, C.; Shamah, L. Percepción del peso corporal y de la probabilidad de desarrollar obesidad en adultos mexicanos. Salud Publ. Mex. 2018, 60, 254–262. Available online: https://scielosp.org/pdf/spm/2018.v60n3/254-262/es (accessed on 12 March 2021). [CrossRef] [Green Version]
- De Conto Cinier, C.; Petit-ramel, M.; Garin, D.; Bouvet, Y. Kinetics of cadmium accumulation and elimination in carp Cyprinus carpio tissues. Comp. Biochem. Physiol. C Toxicol. Pharmacol. 1999, 122, 345–352. [Google Scholar] [CrossRef]
- De Smet, H.; De Wachter, B.; Lobinski, R.; Blust, R. Dynamics of (Cd, Zn) -metallothioneins in gills, liver, and kidney of common carp Cyprinus carpio during cadmium exposure. Aquat. Toxicol. 2020, 52, 269–281. [Google Scholar] [CrossRef]
- Kraemer, L.D.; Campbell, P.G.; Hare, L. Dynamics of Cd, Cu and Zn accumulation in organs and sub-cellular fractions in field transplanted juvenile yellow perch (Perca flavescens). Environ. Pollut. 2005, 138, 324–337. [Google Scholar] [CrossRef]
- Calta, M.; Canpolat, O. Calta & Canpolat. Cyprinid heavy metals. Water Environ. Res. 2006, 78, 548–551. [Google Scholar]
- Wagner, A.; Boman, J. Biomonitoring of trace elements in muscle and liver tissue of freshwater fish. Spectrochim. Acta B 2003, 58, 2215–2226. [Google Scholar] [CrossRef]
- Subathra, S.; Karuppasamy, R. Bioaccumulation and Depuration Pattern of Copper in Different Tissues of Mystus vittatus, Related to Various Size Groups. Arch. Environ. Contam. Toxicol. 2008, 54, 236–244. [Google Scholar] [CrossRef]
- Jovičić, K.; Nikolić, D.M.; Jeftic, Z.V.; Đikanović, V.; Skorić, S.; Stefanović, S.M.; Lenhardt, M.; Hegediš, A.; Krpo-Ćetković, J.; Jarić, I. Mapping differential elemental accumulation in fish tissues: Assessment of metal and trace element concentrations in wels catfish (Silurus glanis) from the Danube River by ICP-MS. Environ. Sci. Pollut. Res. 2015, 22, 3820–3827. [Google Scholar] [CrossRef]
- Arantes, F.P.; Savassi, L.A.; Santos, H.B.; Gomes, M.V.T.; Bazzoli, N. Bioaccumulation of mercury, cadmium, zinc, chromium, and lead in muscle, liver, and spleen tissues of a large commercially valuable catfish species from Brazil. An. Acad. Bras. Ciênc. 2016, 88, 137–147. [Google Scholar] [CrossRef] [Green Version]
- Has-Schön, E.; Bogut, I.; Vuković, R.; Galović, D.; Bogut, A.; Horvatić, J. Distribution and age-related bioaccumulation of lead (Pb), mercury (Hg), cadmium (Cd), and arsenic (As) in tissues of common carp (Cyprinus carpio) and European catfish (Sylurus glanis) from the Buško Blato reservoir (Bosnia and Herzegovina). Chemosphere 2015, 135, 289–296. [Google Scholar] [CrossRef]
- Jia, Y.; Wang, L.; Qu, Z.; Wang, C.; Yang, Z. Effects on heavy metal accumulation in freshwater fishes: Species, tissues, and sizes. Environ. Sci. Pollut. Res. 2017, 24, 9379–9386. [Google Scholar] [CrossRef]
- Watras, C.J.; Back, R.C.; Halvorsen, S.; Hudson, R.J.M.; Morrison, K.A.; Wente, S.P. Bioaccumulation of mercury in pelagic freshwater food webs. Sci. Total Environ. 1998, 219, 183–208. [Google Scholar] [CrossRef]
- Clearwater, S.J.; Farag, A.M.; Meyer, J.S. Bioavailability and toxicity of dietborne copper and zinc to fish. Comp. Biochem. Physiol. C Toxicol. Pharmacol. 2002, 132, 269–313. [Google Scholar] [CrossRef]
- Yi, Y.J.; Zhang, S.H. Heavy metal (Cd, Cr, Cu, Hg, Pb, Zn) concentrations in seven fish species in relation to fish size and location along the Yangtze River. Environ. Sci. Pollut. Res. 2002, 19, 3989–3996. [Google Scholar] [CrossRef]
- Cui, B.; Zhang, Q.; Zhang, K.; Liu, X.; Zhang, H. Analyzing trophic transfer of heavy metals for food webs in the newly-formed wetlands of the Yellow River Delta, China. Environ. Pollut. 2011, 159, 1297–1306. [Google Scholar] [CrossRef]
- Alam, M.G.M.; Tanaka, A.; Allinson, G.; Laurenson, L.J.B.; Stagnitti, F.; Snow, E.T. A comparison of trace element concentrations in cultured and wild carp (Cyprinus carpio) of Lake Kasumigaura, Japan. Ecotoxicol. Environ. Saf. 2002, 53, 348–354. [Google Scholar] [CrossRef]
- Sandor, Z.; Csengeri, I.; Oncsik, M.B.; Alexis, M.N.; Zubcova, E. Trace metal levels in freshwater fish, sediment and water. Environ. Sci. Pollut. Res. 2001, 8, 265–268. [Google Scholar] [CrossRef]
- DOF. NOM-127-SSA1-1994. Salud Ambiental. Agua Para Consume Humano. Límites Permisibles de Calidad y Tratamiento a Que Debe Someterse el Agua Para su Potabilización; Diario Oficial de la Federación: Ciudad de México, México, 2000.
- Bowles, K.C.; Apte, S.C.; Maher, W.A.; Kawei, M.; Smith, R. Bioaccumulation and biomagnification of mercury in Lake Murray, Papua New Guinea. Can. J. Fish. Aquat. Sci. 2001, 58, 888–897. [Google Scholar] [CrossRef]
- Ventura-Lima, J.; Fattorini, D.; Regoli, F.; Monserrat, J.M. Effects of different inorganic arsenic species in Cyprinus carpio (Cyprinidae) tissues after short-time exposure: Bioaccumulation, biotransformation and biological responses. Environ. Pollut. 2009, 157, 3479–3484. [Google Scholar] [CrossRef]
- Mason, R.P.; Laporte, J.; Andres, S. Environmental Contamination and Toxicology Factors Controlling the Bioaccumulation of Mercury, Methylmercury, Arsenic, Selenium, and Cadmium by Freshwater Invertebrates and Fish. Arch. Environ. Contam. Toxicol. 2000, 297, 283–297. [Google Scholar] [CrossRef] [PubMed]
- Swanson, H.K.; Johnston, T.A.; Leggett, W.C.; Bodaly, R.A.; Doucett, R.R.; Cunjak, R.A. Trophic positions and mercury bioaccumulation in rainbow smelt (Osmerus mordax) and native forage fishes in northwestern Ontario lakes. Ecosystems 2003, 6, 289–299. [Google Scholar] [CrossRef]
- Zhang, J.; Zhu, L.; Li, F.; Liu, C.; Yang, Z.; Qiu, Z.; Xiao, M. Heavy metals and metalloid distribution in different organs and health risk assessment for edible tissues of fish captured from Honghu Lake. Oncotarget 2017, 8, 101672–101685. [Google Scholar] [CrossRef] [PubMed] [Green Version]
- Alipour, H.; Banagar, G.R. Health risk assessment of selected heavy metals in some edible fishes from Gorgan Bay, Iran. Iran. J. Fish. Sci. 2018, 17, 21–34. [Google Scholar] [CrossRef]
- Alam, M.; Tanaka, A.; Stagnitti, F.; Allinson, G.; Maekawa, T. Observations on the effects of caged carp culture on water and sediment metal concentrations in Lake Kasumigaura, Japan. Ecotoxicol. Environ. Saf. 2001, 48, 107–115. [Google Scholar] [CrossRef] [PubMed]
- US Environmental Protection Agency (US EPA). Mercury Study Report to Congress Vol. IV: An Assessment to Exposure to Mercury in the United States; EPA 452/R-97-006; US Environmental Protection Agency: Washington, DC, USA, 1997; pp. 7.1–7.3.
- Trasande, L.; Cortes, J.E.; Landrigan, P.J.; Abercrombie, M.I.; Bopp, R.F.; Cifuentes, E. Methylmercury exposure in a subsistence fishing community in Lake Chapala, Mexico: An ecological approach. Environ. Health 2010, 9, 1. [Google Scholar] [CrossRef] [PubMed] [Green Version]
- Łuczyńska, J.; Paszczyk, B. Health risk assessment of heavy metals and lipid quality indexes in freshwater fish from lakes of Warmia and Mazury Region, Poland. Int. J. Environ. Res. Public Health 2019, 16, 3780. [Google Scholar] [CrossRef] [Green Version]
- Miri, M.; Akbari, E.; Amrane, A.; Jafari, S.J.; Eslami, H.; Hoseinzadeh, E.; Zarrabi, M.; Salimi, J.; Sayyad-Arbabi, M.; Taghavi, M. Health risk assessment of heavy metal intake due to fish consumption in the Sistan region, Iran. Environ. Monit. Assess. 2017, 189, 583. [Google Scholar] [CrossRef]


| Metal | Winfish-Ziegler 3506 (3.5 mm) | Winfish-Ziegler 2505 (5.5 mm) | Maximum Content [13] |
|---|---|---|---|
| Cu (mg/kg) | 21.77 ± 2.45 | 52.83 ± 1.58 | - |
| Zn (mg/kg) | 216.50 ± 10.89 | 94.86 ± 2.53 | - |
| Cd (µg/kg) | 0.36 ± 0.34 | 0.08 ± 0.01 | 1000 |
| As (µg/kg) | 0.90 ± 0.28 | 0.43 ± 0.02 | 6000 |
| Pb (µg/kg) | 1.24 ± 0.05 | 0.81 ± 0.08 | 5000 |
| Hg (µg/kg) | 17.89 ± 3.16 | 13.17 ± 0.52 | 500 |
| Element | Reference Material | Certified Conc. | Units | Measured Concentration | Detection Limit | Method |
|---|---|---|---|---|---|---|
| Hg | DORM-4 | 410 | µg/kg | 385 | 1.9 | ICP-MS |
| Hg | FAPAS T07213QC | 93.5 | µg/kg | 76.7 | 1.9 | ICP-MS |
| Cu | DORM-4 | 15.9 | mg/kg | 14.8 | 0.32 | ICP-OES |
| Zn | DORM-4 | 52.2 | mg/kg | 57.37 | 1.16 | ICP-OES |
| Pb | DORM-4 | 416 | µg/kg | 423 | 0.287 | ICP-MS |
| Pb | FAPAS T07213QC | 50.1 | µg/kg | 47.0 | 0.287 | ICP-MS |
| Cd | DORM-4 | 306 | µg/kg | 301 | 1.3 | ICP-MS |
| Cd | FAPAS T07213QC | 5.53 | µg/kg | 5.78 | 1.3 | ICP-MS |
| As | DORM-4 | 6800 | µg/kg | 7158 | 1.8 | ICP-MS |
| As | FAPAS T07213QC | 13.9 | µg/kg | 14.0 | 1.8 | ICP-MS |
| Metal | Carp (Cyprinus carpio) | Catfish (Ictalurus punctatus) | ||||
|---|---|---|---|---|---|---|
| Muscle | Liver | LCF | Muscle | Liver | LCF | |
| Cu (mg/kg) | 0.36–2.39 | 6.44–47.81 | 9–37 | 0.56–3.83 | 1.48–5.84 | 1–9 |
| Zn (mg/kg) | 8.84–16.05 | 38.44–265.00 | 2–28 | 5.66–12.64 | 17.39–28.79 | 2–4 |
| Cd (µg/kg) | <1.3–3.67 | 13.25–472.40 | 8–220 | <1.3–2.14 | 5.39–51.56 | 1–42 |
| Pb (µg/kg) | 3.25–17.44 | 9.70–76.38 | 0.6–23 | 3.51–15.23 | 2.87–23.90 | 0.5–3 |
| As (µg/kg) | 43.73–192.78 | 38.35–126.08 | 0.3–3 | 10.57–126.40 | 11.47–87.34 | 0.3–3 |
| Hg (µg/kg) | <1.9–5.88 | <1.9–18.59 | 0.3–5 | <1.9–34.56 | <1.9–24.60 | 0.5–1 |
| Metal | Fish | Muscle | Liver | ||
|---|---|---|---|---|---|
| F | p-Value | F | p-Value | ||
| Cu | Carp | 3.017 | 0.168 | 1.213 | 0.820 |
| Catfish | 0.747 | 0.732 | 0.317 | 0.188 | |
| Zn | Carp | 0.722 | 0.679 | 2.797 | 0.198 |
| Catfish | 1.661 | 0.591 | 0.711 | 0.689 | |
| Cd | Carp | 0.361 | 0.240 | 156.912 | 0.000 * |
| Catfish | 1.038 | 0.965 | 0.301 | 0.213 | |
| Pb | Carp | 0.582 | 0.528 | 0.368 | 0.249 |
| Catfish | 0.008 | 0.000 * | 0.605 | 0.557 | |
| As | Carp | 0.793 | 0.786 | 0.253 | 0.158 |
| Catfish | 2.130 | 0.380 | 1.193 | 0.851 | |
| Hg | Carp | 1.247 | 0.796 | 0.429 | 0.433 |
| Catfish | 1.112 | 0.921 | 2.240 | 0.454 | |
| Metal | Fish | Control Group | Experimental Group | Reference PTWI † | ||||
|---|---|---|---|---|---|---|---|---|
| Conc. | EWI * | % PTWI | Conc. | EWI * | % PTWI | |||
| Cu (mg/kg) | Carp | 1.45 ± 0.21 | 0.004 | 0.12 | 2.28 ± 0.18 | 0.007 | 0.19 | 0.5 |
| Catfish | 0.63 ± 0.42 | 0.002 | 0.05 | 1.09 ± 0.80 | 0.003 | 0.09 | ||
| Zn (mg/kg) | Carp | 10.08 ± 3.07 | 0.029 | 0.41 | 12.16 ± 3.64 | 0.035 | 0.50 | 1.0 |
| Catfish | 6.93 ± 1.11 | 0.020 | 0.28 | 6.78 ± 1.02 | 0.019 | 0.28 | ||
| Cd (µg/kg) | Carp | 3.86 ± 1.88 | 0.011 | 0.18 | 2.23 ± 1.36 | 0.006 | 0.11 | 6.0 |
| Catfish | 1.40 ± 0.56 | 0.004 | 0.07 | 1.23 ± 0.37 | 0.004 | 0.06 | ||
| Pb (µg/kg) | Carp | 18.85 ± 2.85 | 0.054 | 0.22 | 11.97 ± 4.98 | 0.034 | 0.14 | 25 |
| Catfish | 8.97 ± 3.02 | 0.026 | 0.10 | 13.03 ± 1.93 | 0.037 | 0.15 | ||
| As (µg/kg) | Carp | 98.05 ± 45.76 | 0.280 | 1.87 | 57.01 ± 13.55 | 0.163 | 1.09 | 15 |
| Catfish | 30.54 ± 8.74 | 0.087 | 0.58 | 32.39 ± 14.74 | 0.093 | 0.62 | ||
| Hg (µg/kg) | Carp | 0.98 ± 0.91 | 0.003 | 0.18 | 3.44 ± 0.93 | 0.010 | 0.61 | 1.6 |
| Catfish | 19.78 ± 0.82 | 0.057 | 3.53 | 27.46 ± 10.04 | 0.078 | 4.90 | ||
Publisher’s Note: MDPI stays neutral with regard to jurisdictional claims in published maps and institutional affiliations. |
© 2021 by the authors. Licensee MDPI, Basel, Switzerland. This article is an open access article distributed under the terms and conditions of the Creative Commons Attribution (CC BY) license (https://creativecommons.org/licenses/by/4.0/).
Share and Cite
Alvarado, C.; Cortez-Valladolid, D.M.; Herrera-López, E.J.; Godínez, X.; Ramírez, J.M. Metal Bioaccumulation by Carp and Catfish Cultured in Lake Chapala, and Weekly Intake Assessment. Appl. Sci. 2021, 11, 6087. https://0-doi-org.brum.beds.ac.uk/10.3390/app11136087
Alvarado C, Cortez-Valladolid DM, Herrera-López EJ, Godínez X, Ramírez JM. Metal Bioaccumulation by Carp and Catfish Cultured in Lake Chapala, and Weekly Intake Assessment. Applied Sciences. 2021; 11(13):6087. https://0-doi-org.brum.beds.ac.uk/10.3390/app11136087
Chicago/Turabian StyleAlvarado, Claudia, Diego M. Cortez-Valladolid, Enrique J. Herrera-López, Ximena Godínez, and José Martín Ramírez. 2021. "Metal Bioaccumulation by Carp and Catfish Cultured in Lake Chapala, and Weekly Intake Assessment" Applied Sciences 11, no. 13: 6087. https://0-doi-org.brum.beds.ac.uk/10.3390/app11136087