Article

Horizontal UHS Amplitudes for Regions with Deep Soil Atop Deep Geological Sediments—An Example of Osijek, Croatia

by
Borko Đ. Bulajić
1,
Marijana Hadzima-Nyarko
2,* and
Gordana Pavić
2
1
Faculty of Technical Sciences, University of Novi Sad, Trg Dositeja Obradovića 6, 21000 Novi Sad, Serbia
2
Faculty of Civil Engineering and Architecture Osijek, Josip Juraj Strossmayer University of Osijek, Vladimira Preloga 3, 31000 Osijek, Croatia
*
Author to whom correspondence should be addressed.
Submission received: 18 June 2021 / Revised: 1 July 2021 / Accepted: 6 July 2021 / Published: 7 July 2021
(This article belongs to the Special Issue Seismic Geotechnical Hazards Studies)

Abstract

:
In this paper, we demonstrate how UHS-based seismic microzonation can be applied in low-to-medium seismicity areas with deep local soil and deep geological deposits under the local soil. The case study area surrounds the city of Osijek, Croatia, which is in the south–central region of the Pannonian Basin. New frequency-dependent scaling equations are derived, and the empirical response spectra are compared to the spectra of real strong motions in the surrounding region. Empirical calculations for deep soil atop deep geological strata show a 37% reduction in short-period spectral amplitudes when compared to rock locations. This demonstrates that local soil amplification is mitigated by energy dissipation in deep soils. For vibration periods longer than 0.3 s, spectral amplitudes are being amplified. This amplification goes up to 2.37 times for vibration periods around 0.5 s. UHS spectra for Osijek are computed using regional seismicity estimates, data on local soil and deeper geological surroundings, and newly created regional empirical equations for scaling various spectral amplitudes. UHS amplitudes for Osijek are also compared to the Eurocode 8 spectra for ground type C. The results show that ratios of the maximum UHS amplitudes to PGA values are up to 46% larger than the corresponding 2.5 factor that is recommended by Eurocode 8 for horizontal spectra. The UHS results might be viewed as preliminary for Osijek and regions with similar seismicity and local soil and deep geology conditions. When the number of regional strong-motion records grows many times beyond what it is currently, it will be feasible to properly calibrate the scaling equations, resulting in more reliable and long-term UHS estimations for the area under consideration.

1. Introduction

The amplification of ground motion generated by sedimentary basins has been investigated by many researchers using analytical and computational methods (e.g., [1,2,3,4,5,6]). However, standard seismic hazard maps only consider shallow geology conditions (i.e., the local soil conditions for the first 30 m depth of the stratigraphic profile). This is because most empirical equations for scaling peak ground acceleration (hereinafter, PGA) values only include the effects of local soil on a tens-of-meters scale and disregard the impact of deeper geological site conditions [7]. This is still the case, although there are studies that show that site resonance has little to do with the average shear-wave velocity of the upper 20 or 30 m [8]. Moreover, a series of recent seismic microzonation studies in the north-western Balkans [9,10,11,12,13,14] revealed that deep geology conditions have a significant impact on the severity of both short- and long-period waves. Here, the term “deep geology” is used to describe the geological conditions that characterize sites on a scale of hundreds of meters or kilometers [15].
The 2004 version of Eurocode 8 [16] recognizes the potential importance of deeper geological site surroundings, stating in Clause 3.1.2(1) that the National Annex may establish the classification scheme that will account for deep geology. However, to date, no EU country, including Croatia, has included deep geology into the ground classification scheme.
This study relies on our prior research [17,18] on the severity of surface ground motion in the case study area of Osijek, Croatia, and is accompanied by a study of vertical spectra [19]. Osijek is once again used as the case study area for low-to-medium seismicity regions and with deep soils atop deep geological sediments. In our study of the horizontal PGA values [17], we have shown that deep soil atop deep geological sediments leads to the de-amplification of seismic waves and ~17% lower PGA values than the values obtained at the rock sites. The subject of this particular paper will be the horizontal pseudo-absolute acceleration spectra (hereinafter, PSA).
Table 1 shows the ground types defined by the shear-wave velocity for the top 30 m of the soil profile, VS,30, and corresponding maximum spectral accelerations, as defined by Eurocode 8 [16]. Official seismic hazard maps in Croatia are incorporated in the Croatian National Annex to Eurocode 8 [20]. The hazard is expressed by the PGA values for ground type A, ag (see Table 1), i.e., for the rock sites [16]. As can be seen in Table 1, the maximum spectral amplitudes are equal to the product of ag, 2.5 (a constant value for horizontal spectra), and the so-called soil factor [16], which is larger than 1 for all ground types. The fact that the soil factor is always larger than 1 indicates that there is an amplification of seismic waves regardless of the soil type. However, the empirical attenuation equations developed in the mid-1980s based on 1482 acceleration components from earthquakes in the western United States indicate that deep soil sites will lead to de-amplification of spectral amplitudes for vibration periods shorter than 0.4 s [21]. Cipta et al. [22] have recently studied the effects of site amplification and basin resonance in Jakarta, Indonesia. For short vibration periods (less than 1 s), they found that the levels of response spectral acceleration were significantly below those of the 2012 Indonesian building Codes’ design response spectra, but approach or even exceed Code levels for longer periods [22]. They also discovered that available ground-motion prediction equations (hereinafter, GMPE) are incapable of capturing the impacts of basin geometry on seismic waves in a very deep basin filled with soft sediment [22].
The primary goal of this study is to assess the amplification (or de-amplification) effects of deep soil atop deep geological sediments on various spectral amplitudes and the incorporation of these effects into regional GMPEs. Local soil is classified according to Seed et al. [23,24], taking into account depths of more than 30 m. Hence, the term “deep soil” will be used to describe sites where the thickness of the soil layer overlying the layer with VS,30 > 800 m/s is larger than 100 m.
Another goal of this research is to see if the spectral acceleration factor of 2.5 (i.e., the ratio between maximum spectral amplitudes and PGA values), as indicated by Eurocode 8, offers reasonable estimates for maximum spectral amplitudes.
This paper begins by outlining regional seismicity and site conditions in Osijek. It then goes on to present new regional empirical formulae for horizontal PSA prediction. Finally, uniform hazard spectra for a site in Osijek are created and compared to Eurocode 8 spectra. In addition, seismic hazard maps for several vibration periods and probabilities of exceedance are constructed.

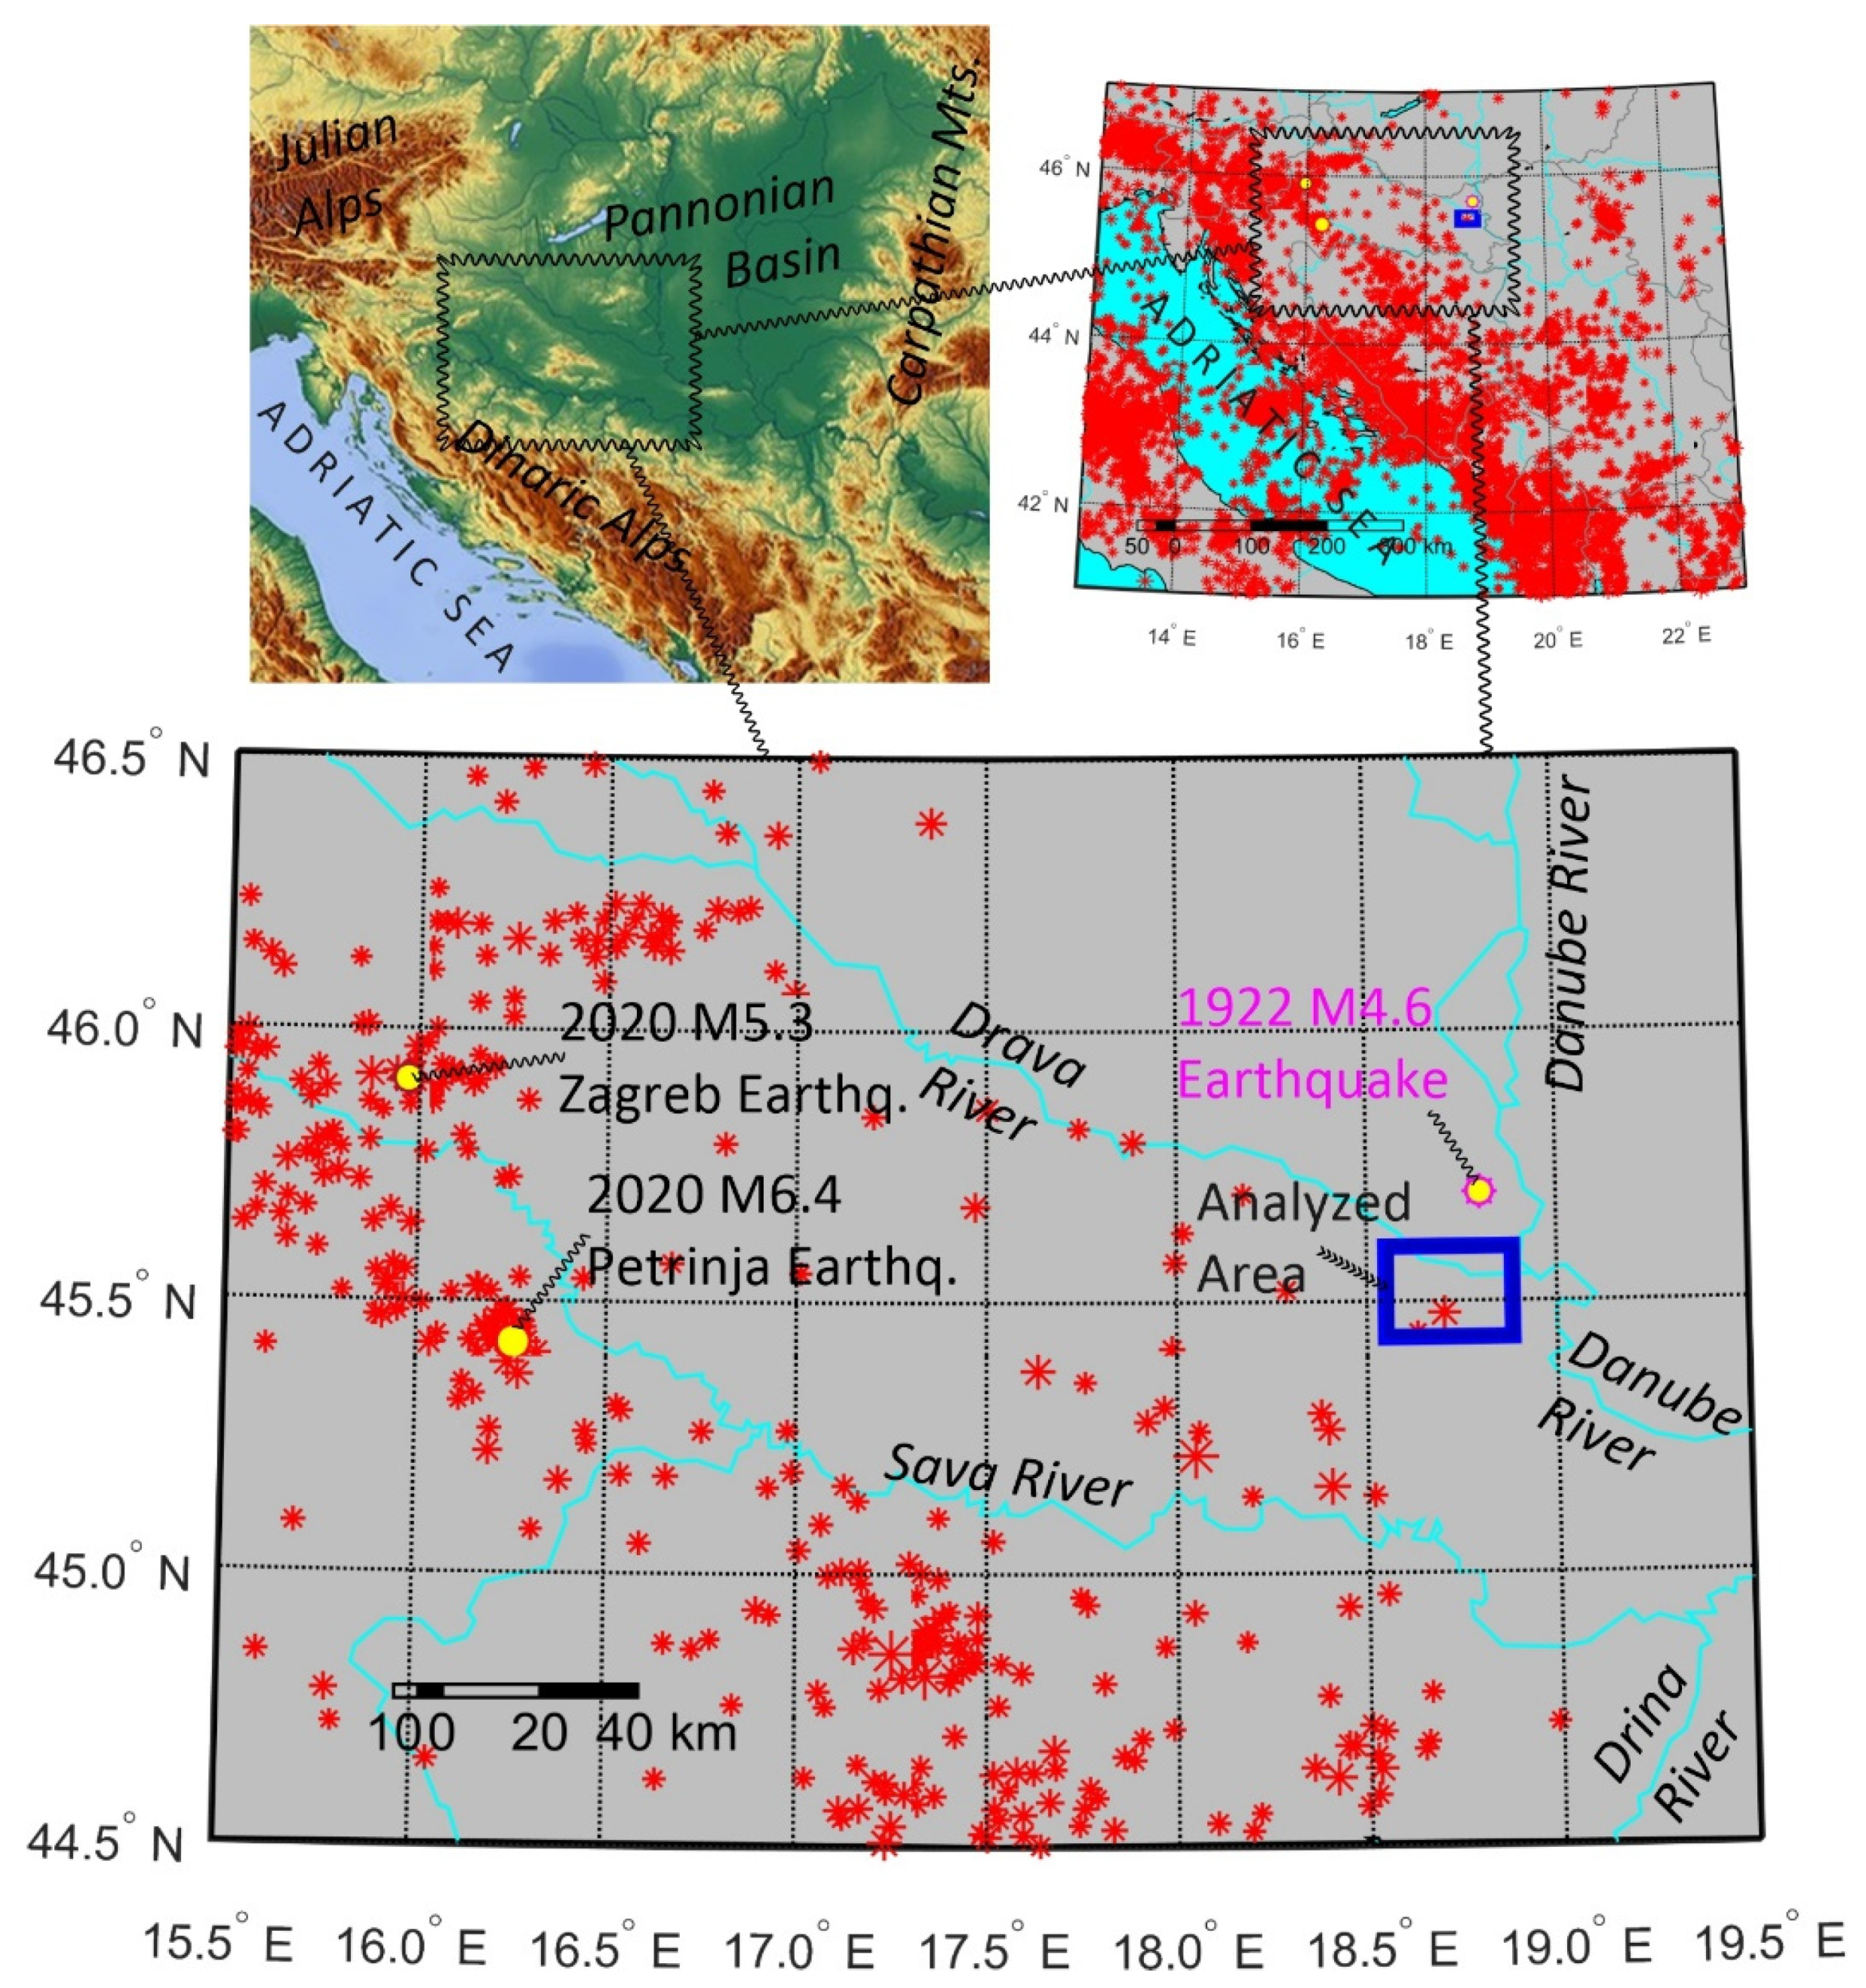
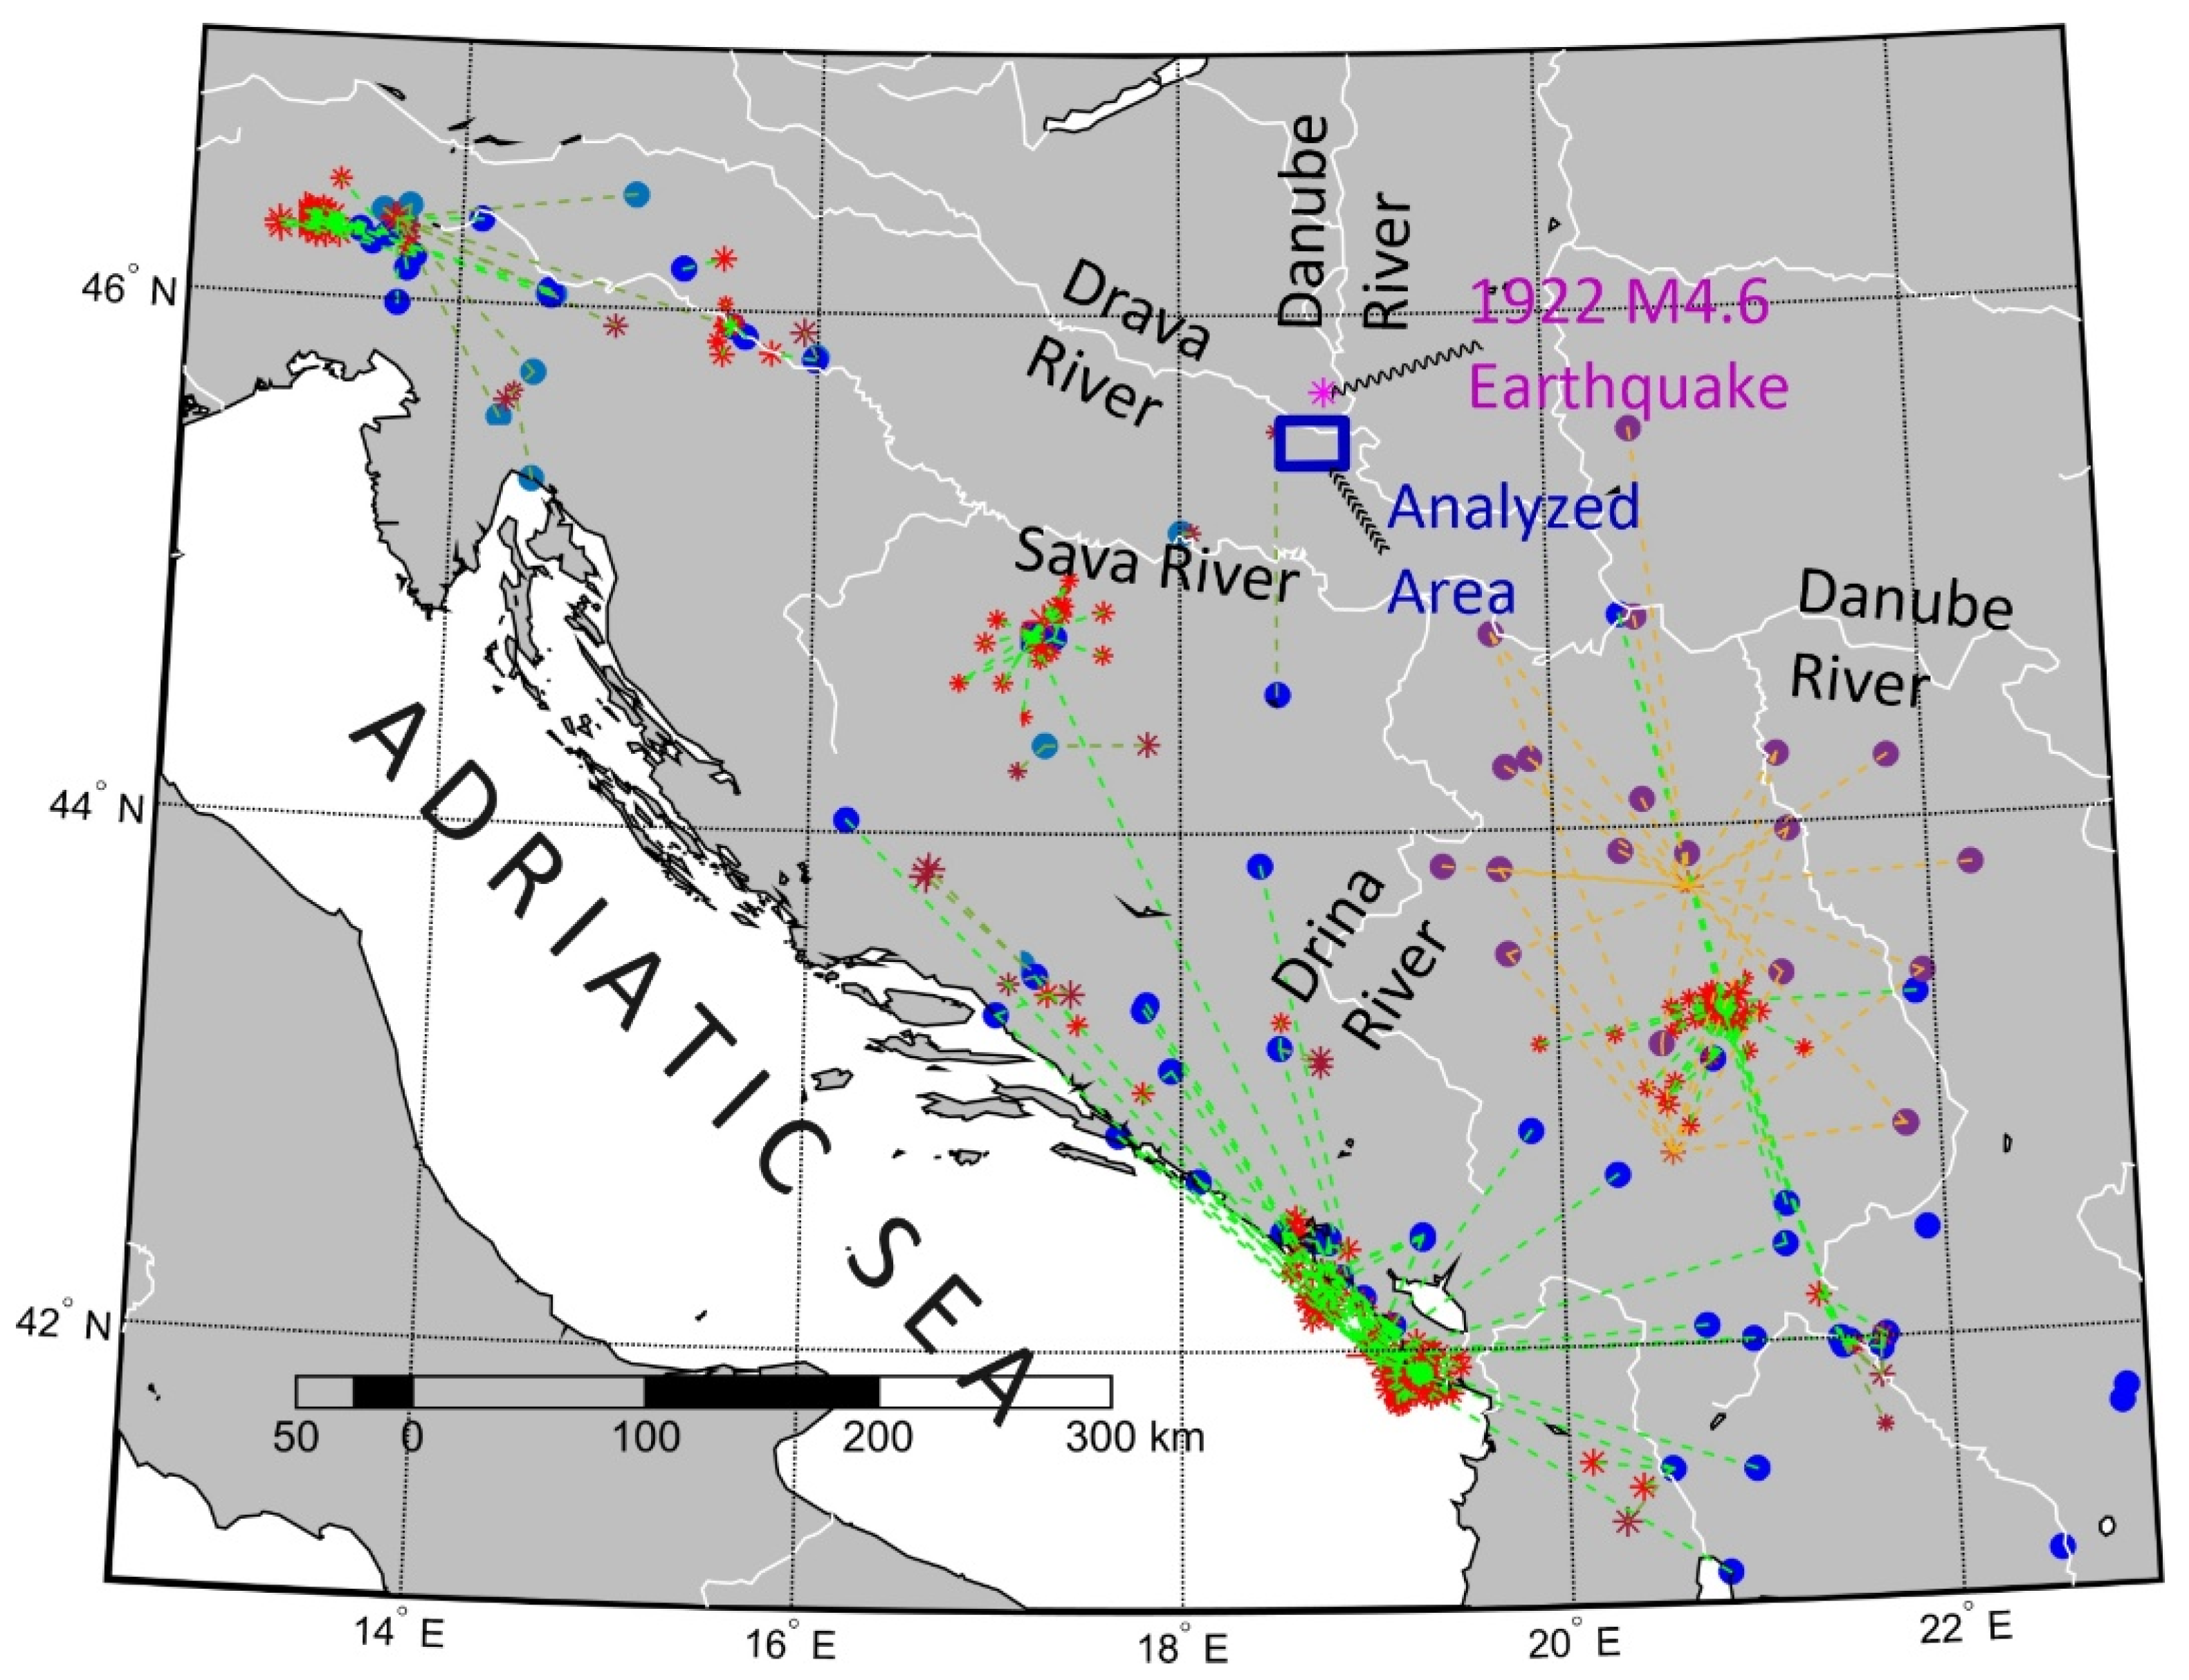
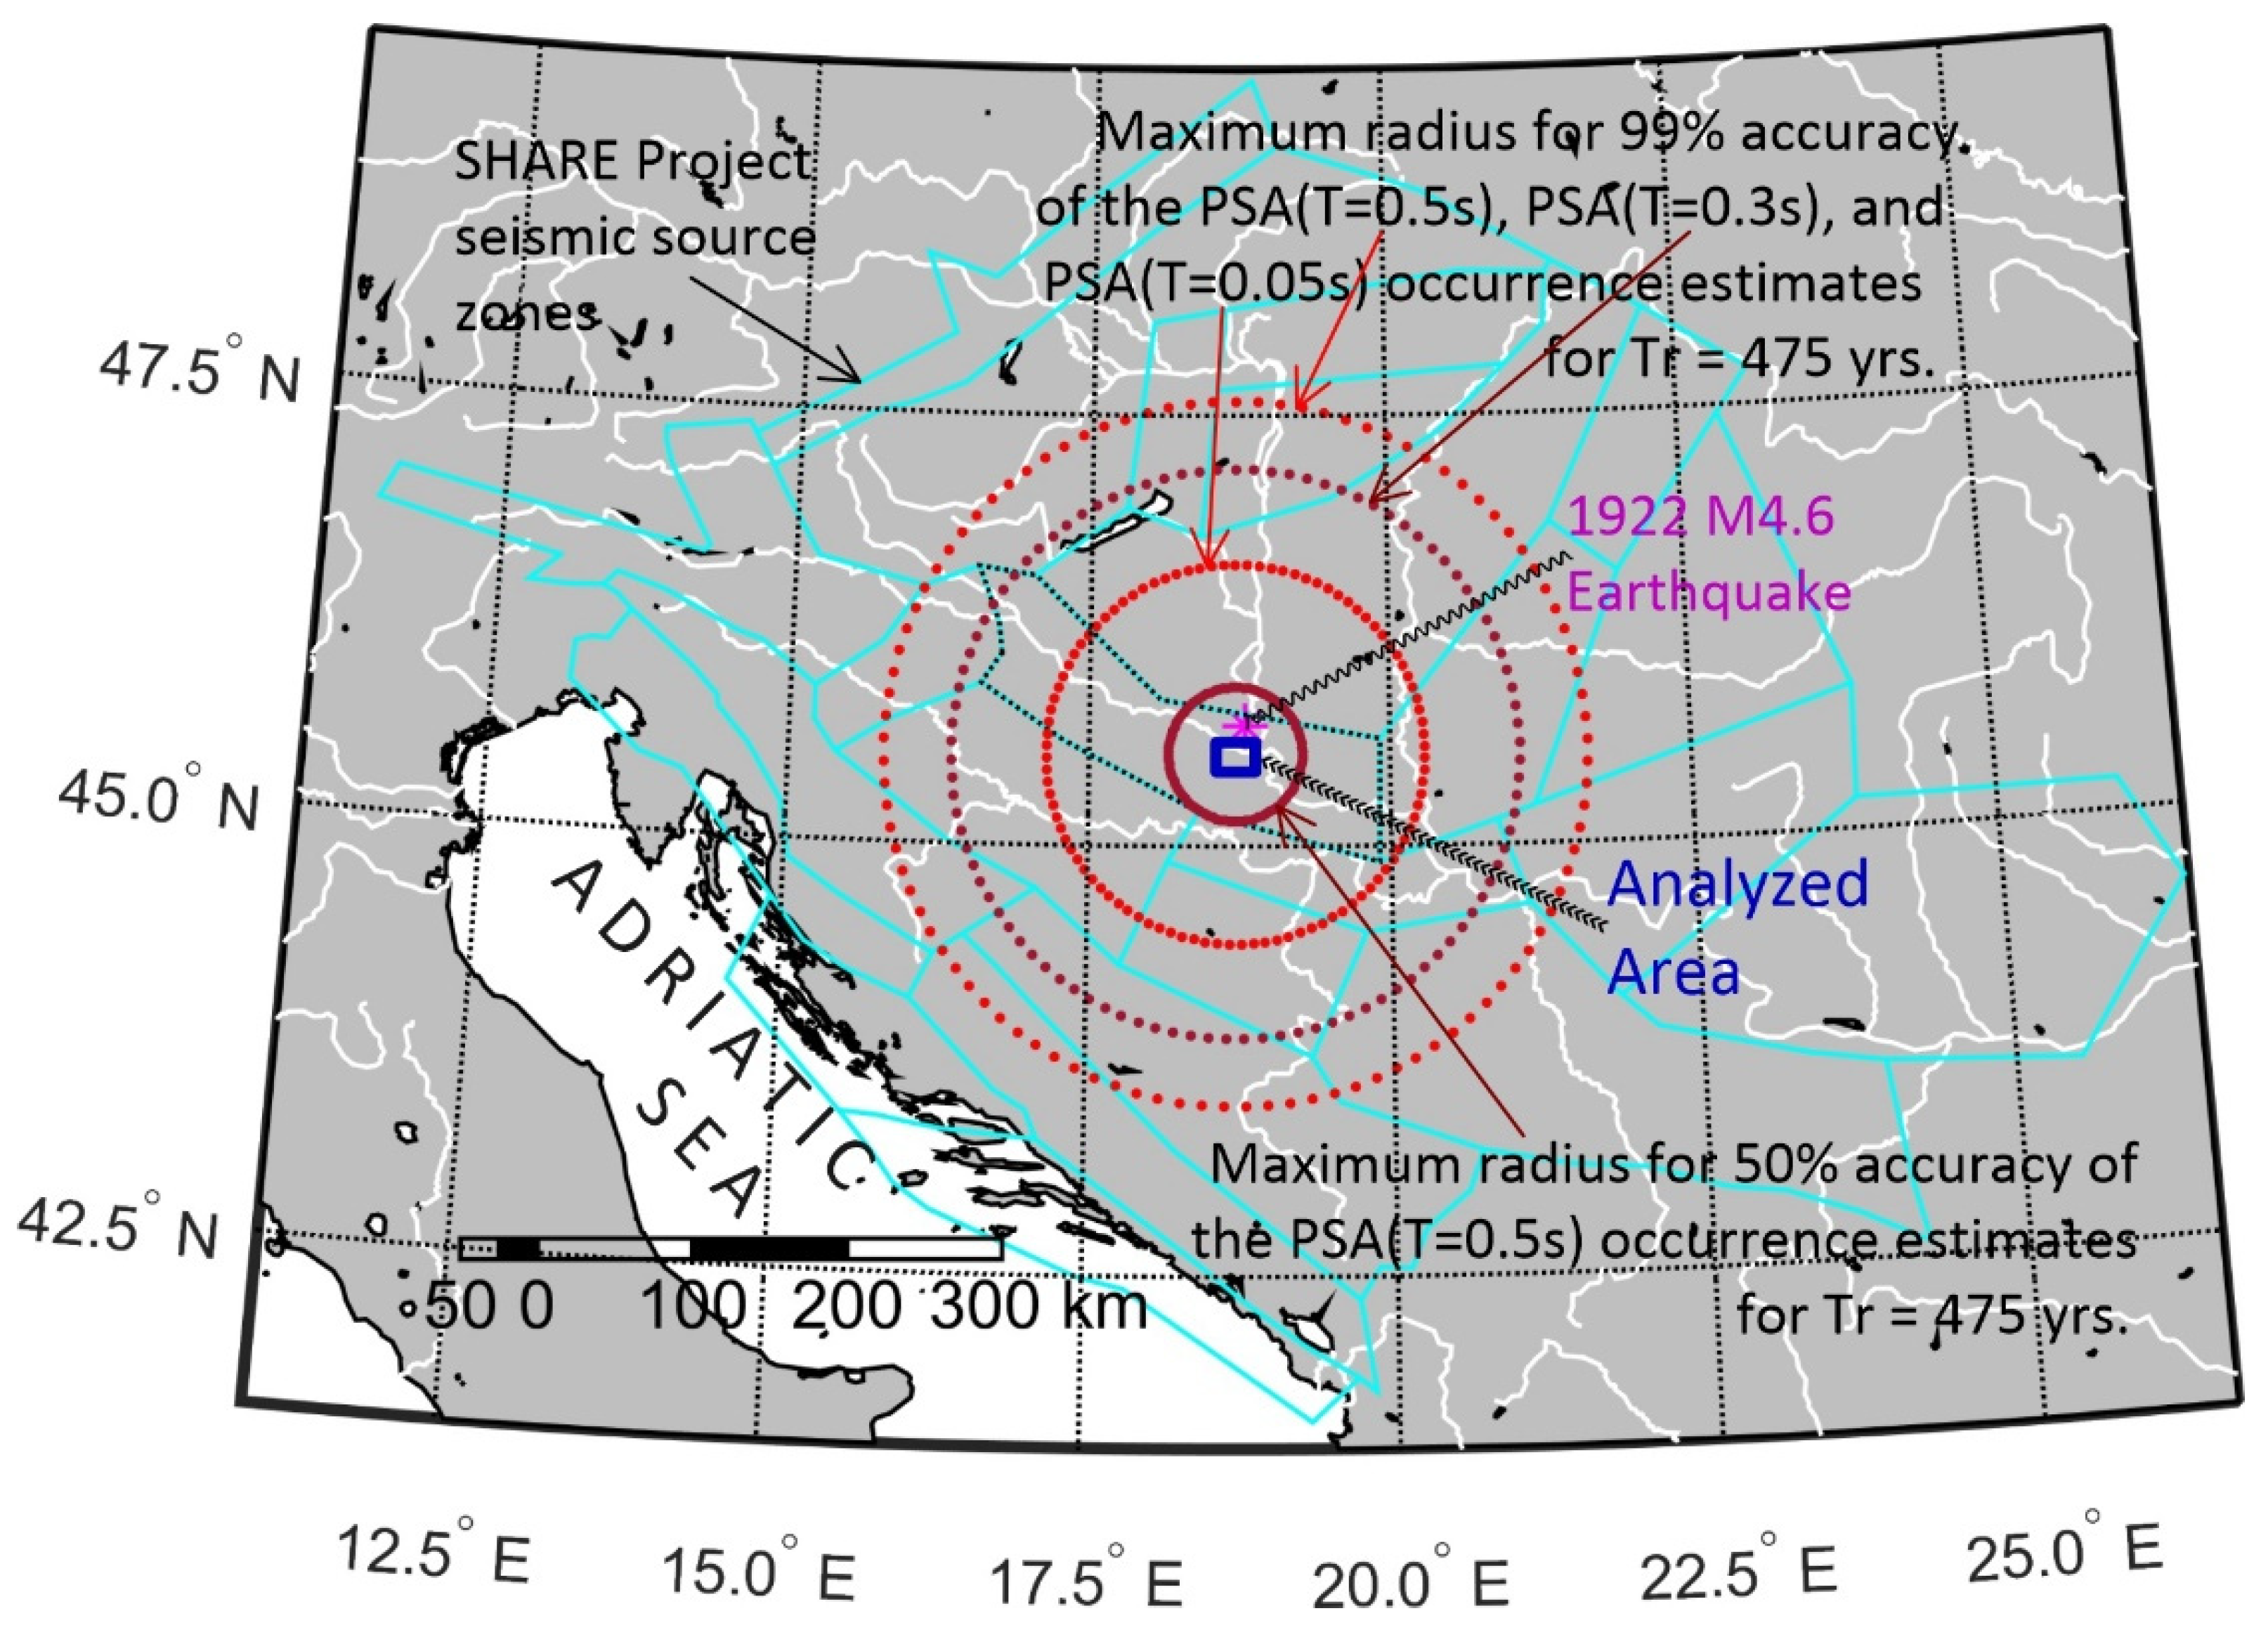
2. Regional Seismicity and Local Site Conditions

The largest historical earthquake near Osijek, according to the SHARE European Earthquake Catalogue [25], happened on November 24, 1922. It had a magnitude of Mw = 4.6, an epicenter 20 km north of Osijek (see Figure 1 and Figure 2), and a hypocentral depth of 18 km. The intensity in the epicentral region was VII–VIII (°MCS) and around VII (°MCS) in Osijek. Figure 1 depicts the epicenters of all Mw ≥ 3 earthquakes in the region from 1900 to April 2021 [26], as well as two recent devastating earthquakes in Croatia and the greatest historical earthquake near Osijek. The investigated area around Osijek is shown by the blue rectangle. As demonstrated in Figure 2, seismic activity in the studied area is less intense than in other parts of Croatia and the north-western Balkans.
The city of Osijek is situated at the Pannonian Basin’s southern end. Osijek is located on the right bank of the Drava River, and the local soil layers consist of muddy and sandy soil with elevated groundwater levels. According to Seed’s classification [23,24], the local soil is deep soil, with a total thickness of 150–180 m above layers with an s-wave velocity greater than 800 m/s [27]. According to Eurocode 8 [16], local soil is of ground type C, as shear-wave velocity is between 180 and 360 m/s in the top 30 m. The deep geological formations underneath Osijek have depths ranging from 1.2 to 2.7 km and represent a combination of marls, sandstones, conglomerates, and limestones [27], dating back to the Pannonian Sea. According to the deep geology categorization by Trifunac and Brady [15], these deposits can be classified as geological sediments.
Figure 2. Analyzed area and the regional strong-motion data. Blue circles and red asterisks represent the recording sites and earthquake epicenters for the accelerograms in the EQINFOS [28] and ISESD [29,30] databases, respectively. Green dashed lines connect the epicenters to the recording stations. Violet circles and orange asterisks indicate the locations of the recording sites and earthquake epicenters for the accelerograms provided by Seismological Survey of Serbia [31].
Applsci 11 06296 g002

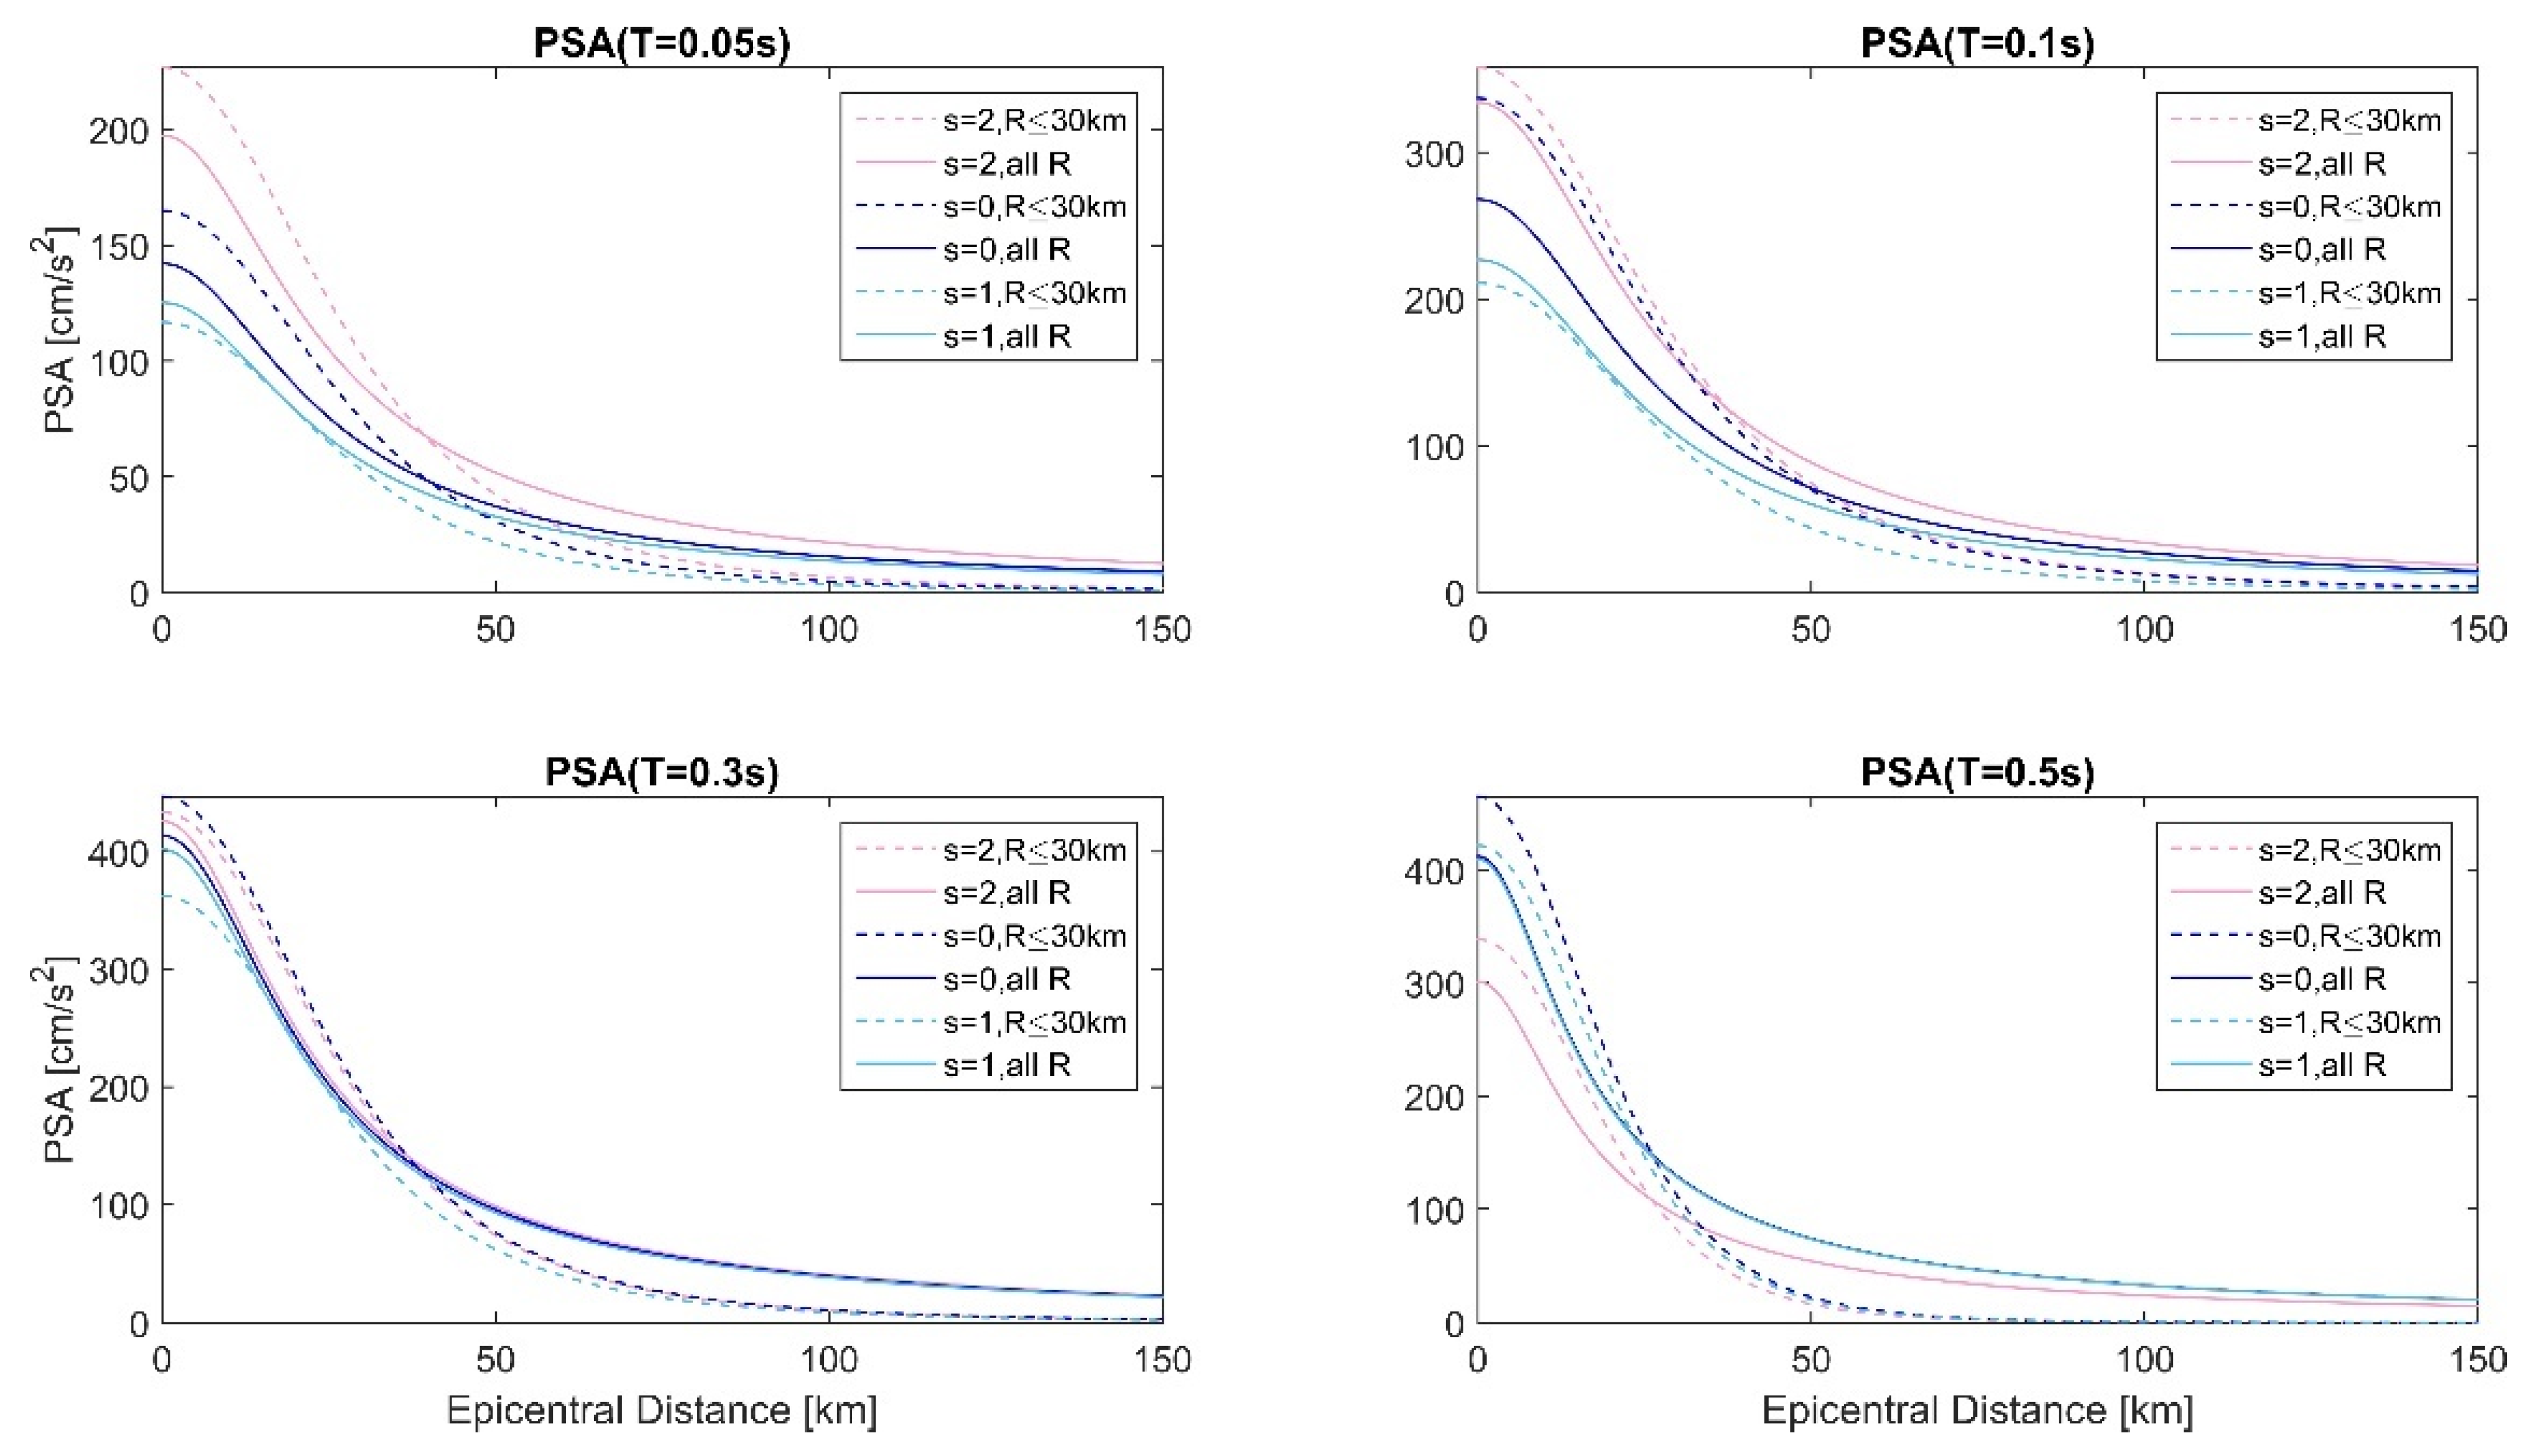
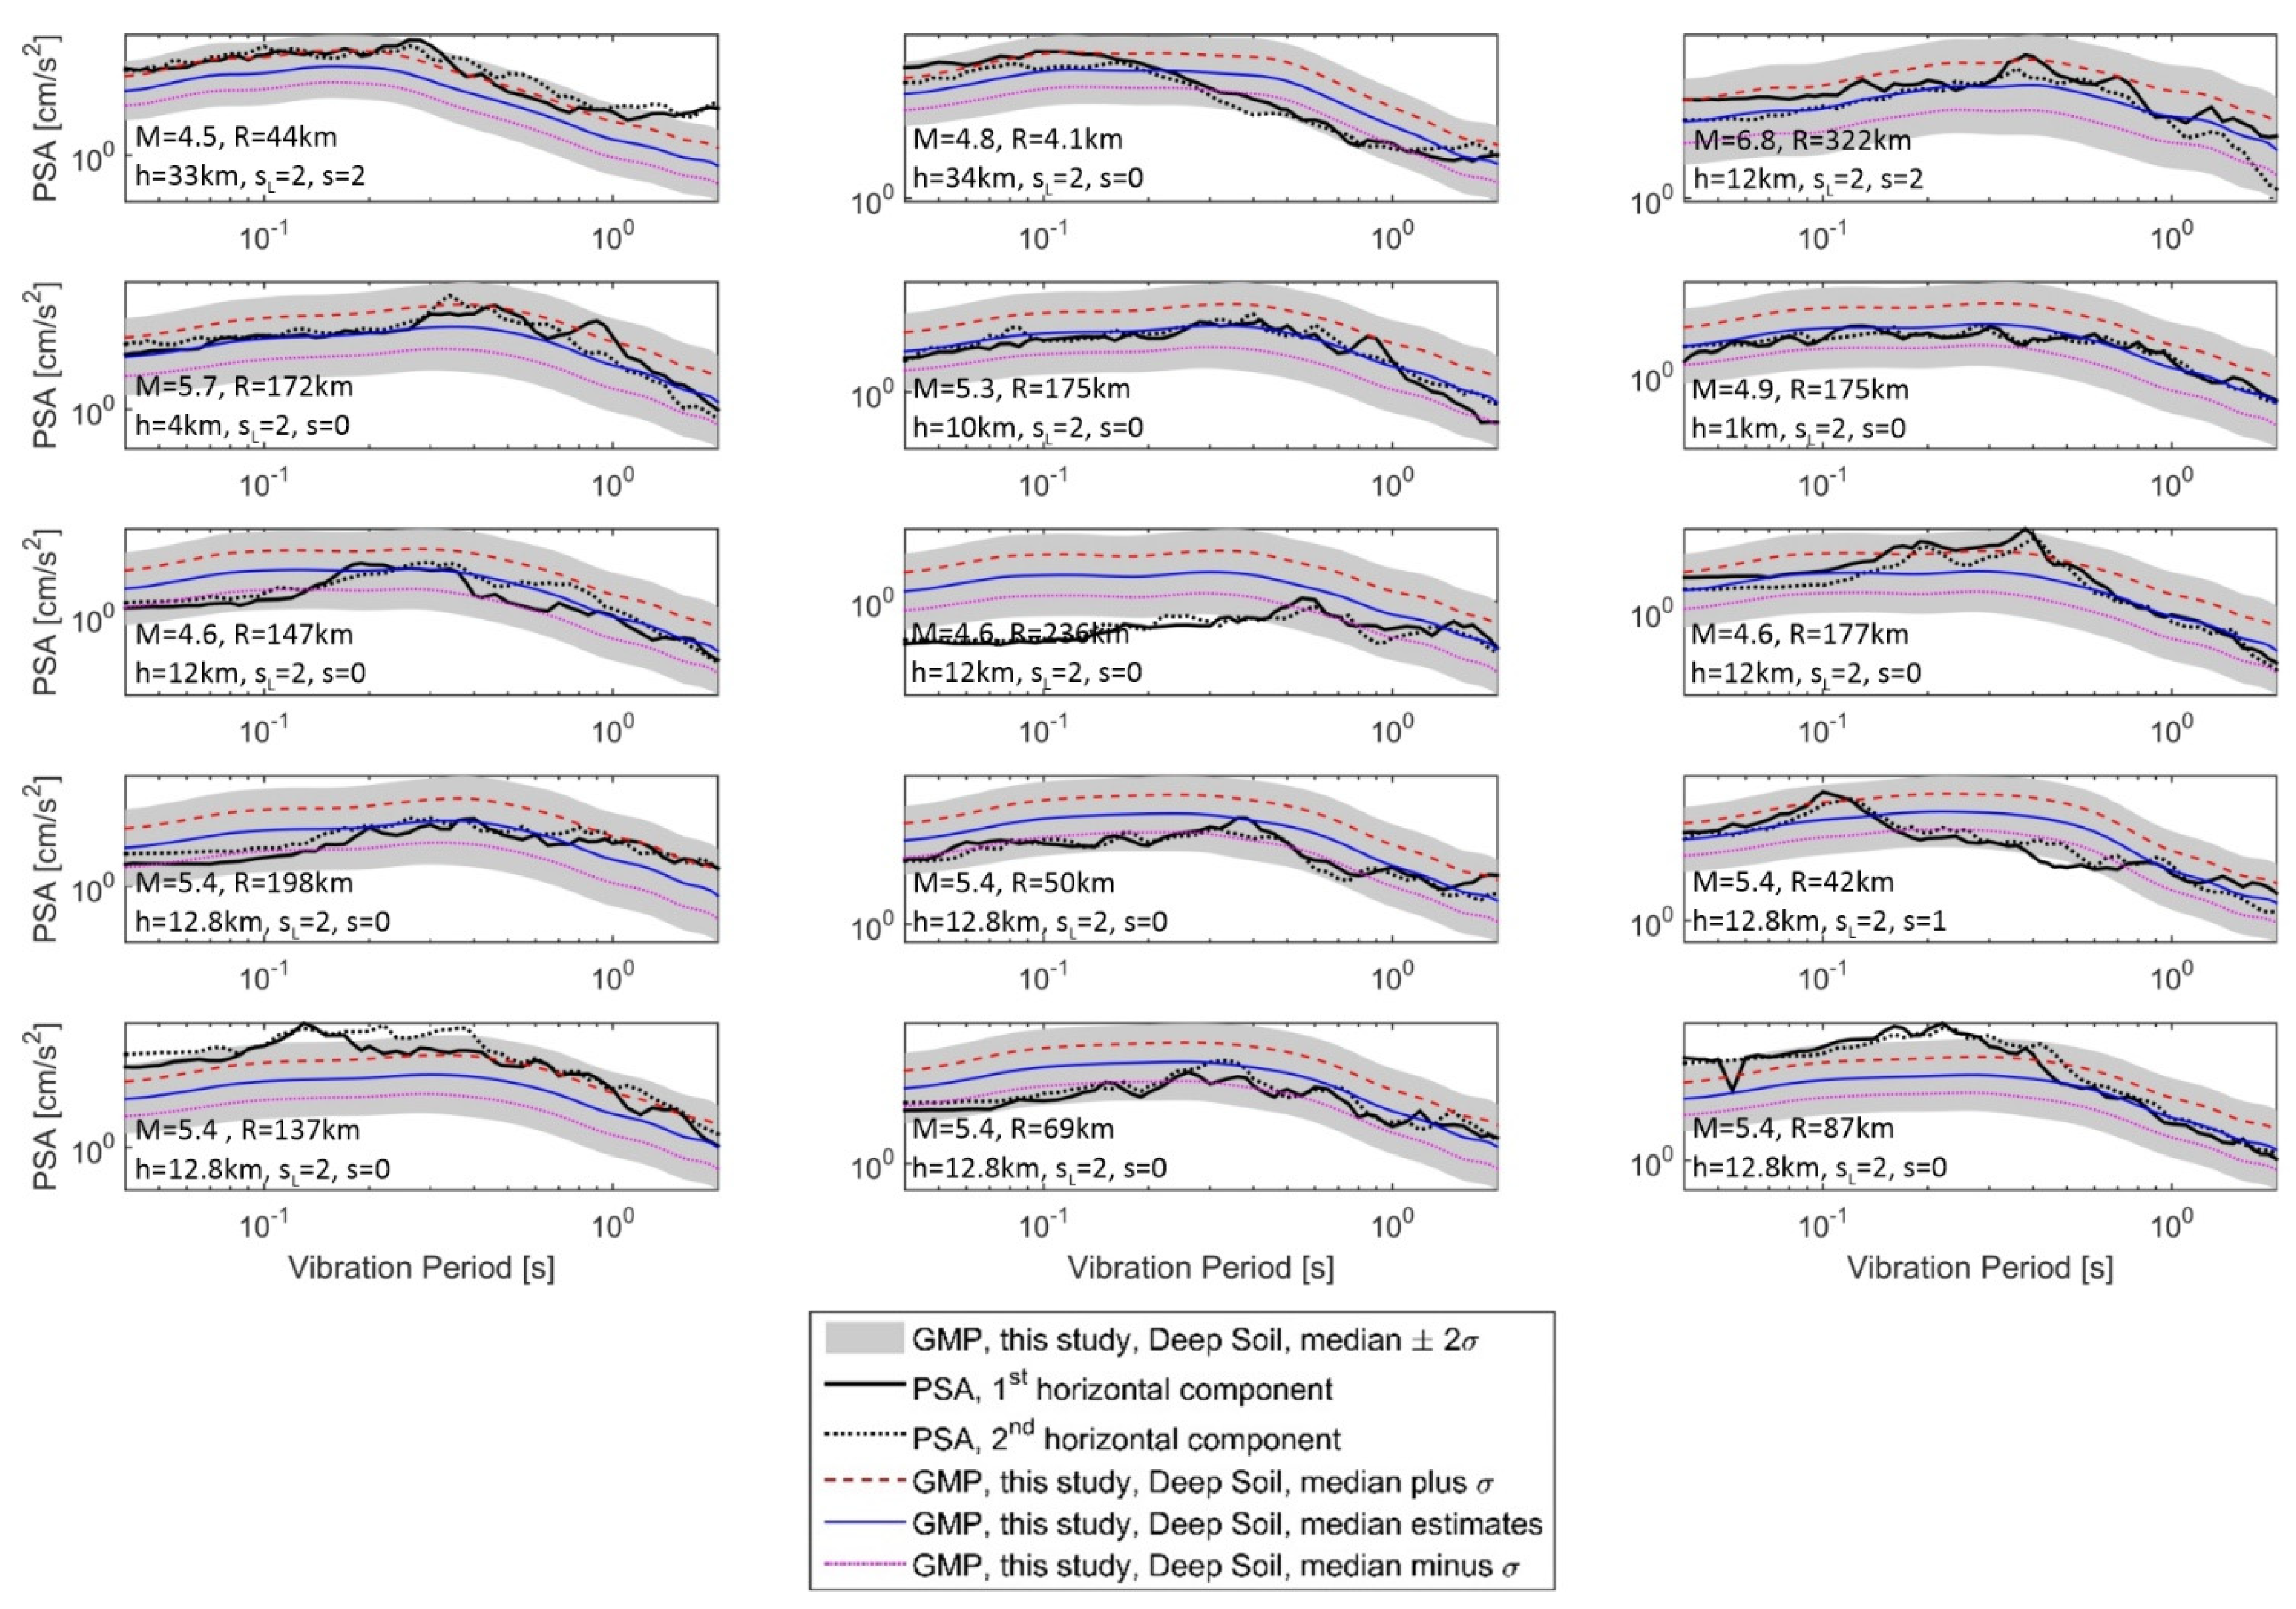
3. Empirical Scaling Equations vs. Real Records

In this study, we generate new empirical equations for predicting PSA values that can be applied to deep soil sites atop deep geological strata. We utilize the same approach as Bulajić et al. [17,18,19], and the GMPE for the horizontal direction is written in the following mathematical form:
l o g [ P S A T ] = c 1 T + c 2 T M + c 3 T l o g ( R 2 + R 0 T 2 ) + c 4 T S L 1 + c 5 T S L 2 + c 6 T S G 1 + c 7 T S G 2 + σ l o g T P
where PSA(T) stands for horizontal pseudo-absolute acceleration spectra (in [g]) for vibration periods T, M for earthquake magnitude, and R for either hypocentral or epicentral distance in kilometers (we develop equations for each type of distance). SL1 and SL2 are categorical variables for local soil (shallow geology) conditions, and SG1 and SG2 are categorical variables for deep geological conditions. Table 2 shows the values of these variables. According to [23,24], the local soil is divided into three types: “rock” soil sites, stiff soil sites, and deep soil sites. According to [15], deep geology is separated into three categories: geological rock, deep geological sediments, and intermediate (or complex) geological site surroundings. Furthermore, the data were assumed to have a log-normal distribution. In Equation (1), σlog is the standard deviation of the common logarithm of PSA, where ε is 0 is the median estimate and 1 for the median + 1 σlog estimate.
A map of the regional strong-motion data available to the authors is shown in Figure 2. The recording sites and earthquake epicenters for the accelerograms in the EQINFOS [28] and ISESD [29,30] databases are represented by blue circles and red asterisks, respectively. The locations of the recording sites and earthquake epicenters for the strong-motion accelerograms provided by Seismological Survey of Serbia [31] are indicated by violet circles and orange asterisks, respectively. It should be noted that the north-western Balkans is one of the few regions on the planet where data on deep geological site conditions are accessible for many recording stations. Moreover, ground motion predictions based on scaling equations that simultaneously consider local soil conditions (up to depths of 100 m and more) and deep geology have shown to be in excellent agreement with recorded ground motions and observed intensities in the region [32,33].
The strong-motion database used to create predictive equations contains 436 horizontal components of strong-motion accelerograms recorded in the north-western Balkans from 112 earthquakes with magnitudes between 3 and 6.8. The majority (418) occurred between 1976 and 1987, with the remainder (18) occurring in 2010. The majority of contributing earthquakes were shallow with focal depths of less than 10 km. The majority of accelerograms were recorded at epicentral distances of less than 100 km, while the fault distance data for many of the accelerograms were either unavailable or unreliable. As a result, we used either epicentral or hypocentral distance for empirical prediction equations. More information on this database can be found in Bulajić et al. [17].
In two phases, we ran multiple linear regression analyses. The relevant MATLAB® scripts for deriving the scaling coefficients were prepared in MATLAB® version 8.5, release 2015a. In the first phase, we fitted the Equation (1) model to a dataset containing only the 406 horizontal acceleration components from the EQINFOS database [28]. We fitted Equation (1) without the coefficient c5 because there were no deep soil locations among the 406 components. As a result, we only calculated coefficients c1, c2, c3, c4, c6, and c7. To maximize the R2 statistics of the PSA prediction, the R0 values were iteratively changed. Because most of the data were collected at shorter distances, we conducted a secondary analysis utilizing only data collected at epicentral distances of less than 30 km. We calibrated the generated prediction model in the second phase by restricting the coefficient c5 (again through linear regression) based on the extra 30 acceleration components recorded at 10 different deep soil sites in the analyzed region. Table A1 (see Appendix A) gives coefficients for Equation (1) with R as the epicentral distance based on the data collected at all distances. Table A2 shows the scaling coefficients for Equation (1) with R as the hypocentral distance.
Attenuation of PSA(T) with distance is shown in Figure 3 and Figure 4 for four distinct vibration periods, T = 0.05, 0.10, 0.30, and 0.50 s. Figure 3 presents empirical forecasts for three different deep geology types at deep soil sites (sL = 2). The solid lines represent median empirical estimates based on data recorded at all epicentral distances, whereas the dashed lines represent estimates based on distances under 30 km. Figure 4 presents empirical predictions for three different local soil types at deep geological deposits (s = 0). In Figure 4, we show the median, median ± 1 σlog, and median ± 2 σlog (shaded area) empirical estimates for the deep soil sites.
The coefficients corresponding to the categorical variables SL and SG can be used to calculate the exact differences between values estimated for different site conditions. For example, if the coefficients from Table A1 are used, the PSA (0.05 s) estimates (which can be considered as the upper bound for PGA estimates) are 1/10−0.143 = 1.39 times larger at the geological rock (s = 2) than at the deep geological sediments (s = 0), as seen in the top left-hand side plot in Figure 3. This is most likely because short-period waves travel more easily through more compact rocks (e.g., granites and basalts). Conversely, the PSA (0.50 s) estimates are 100.137 = 1.37 times larger at the sediments than at the geological rock, as seen in the bottom right-hand side plot in Figure 3.
Furthermore, by using coefficients from the same Table A1, the PSA (0.05 s) at deep soil sites is going to be equal to 10−0.058 = 0.88 times the PSA (0.05 s) for rock soil sites. In other words, the seismic waves will be de-amplified, as shown in the top left-hand side plot in Figure 4. This suggests that energy dissipation in deep soil overcomes local soil amplification, which is consistent with the findings of numerous other research studies of the non-linear behavior of soft sediments under significant ground motion. However, for larger vibration periods, there is no de-amplification. For example, as shown in the bottom right-hand side plot in Figure 4, the PSA (0.50s) at deep soil sites is going to be 100.238 = 1.73 times larger than the value for rock soil sites.
The coupled effect of deep soils and deep geological sediments can be assessed by considering both c5 and c7 from Table A1 and Table A2. For example, PSA (0.05 s) at deep soil atop deep geological sediments will be 10−0.058∙10−0.143 = 0.63 of the value for rock soil atop the geological rock when coefficients from Table A1 are considered. This indicates even larger de-amplification than when only deep soil effects (i.e., only c5) are analyzed. On the other hand, the amplification of PSA amplitudes will occur for vibration periods between ~0.3 s and ~1 s. For PSA (0.50s), the amplification for deep soil atop deep geological sediments will be equal to 100.238∙100.136 = 2.37.
The only GMPEs we can compare our results to (as they also simultaneously consider effects of deep soils and deep geological sediments) are the ones developed for California based on 1482 strong-motion records from earthquakes in the western United States [21]. Moreover, the author of these GMPEs used the same categorical variables as we did (see Table 2) [21], and the site amplification can also be assessed simply by analyzing corresponding scaling coefficients. For the vibration period of T = 0.04 s, for example, Californian GMPEs indicate 30% lower PSA amplitudes at the deep soil atop deep geological sediments than at the rock sites, which is very similar to what we obtained for T = 0.05 s. Furthermore, according to the Californian GMPEs [21], the amplification exists for the vibration periods longer than 0.3 s, and the maximum amplification is ~1.7, which is somewhat smaller than what we obtained.
The spectra of both orthogonal horizontal components of 15 accelerograms recorded at deep soil sites are compared in Figure 5 to the empirical predictions defined by Equation (1) and the scaling coefficients from Table A2. The actual and predicted spectra exhibit a great degree of agreement, as is shown.
Several recent regional microzonation investigations [9,10,11,12,13,14] have also demonstrated that empirical predictions based on scaling equations that take into consideration both the deep geology and local soil are in excellent agreement with recorded ground motions in the region. Therefore, despite the limitations of the used strong-motion data, we employ the scaling equation derived in this study for the probabilistic hazard analyses for Osijek, just as we did for vertical spectra [19]. It is easy to update the empirical scaling equations and redo the hazard estimations as the number of acceleration records grows.

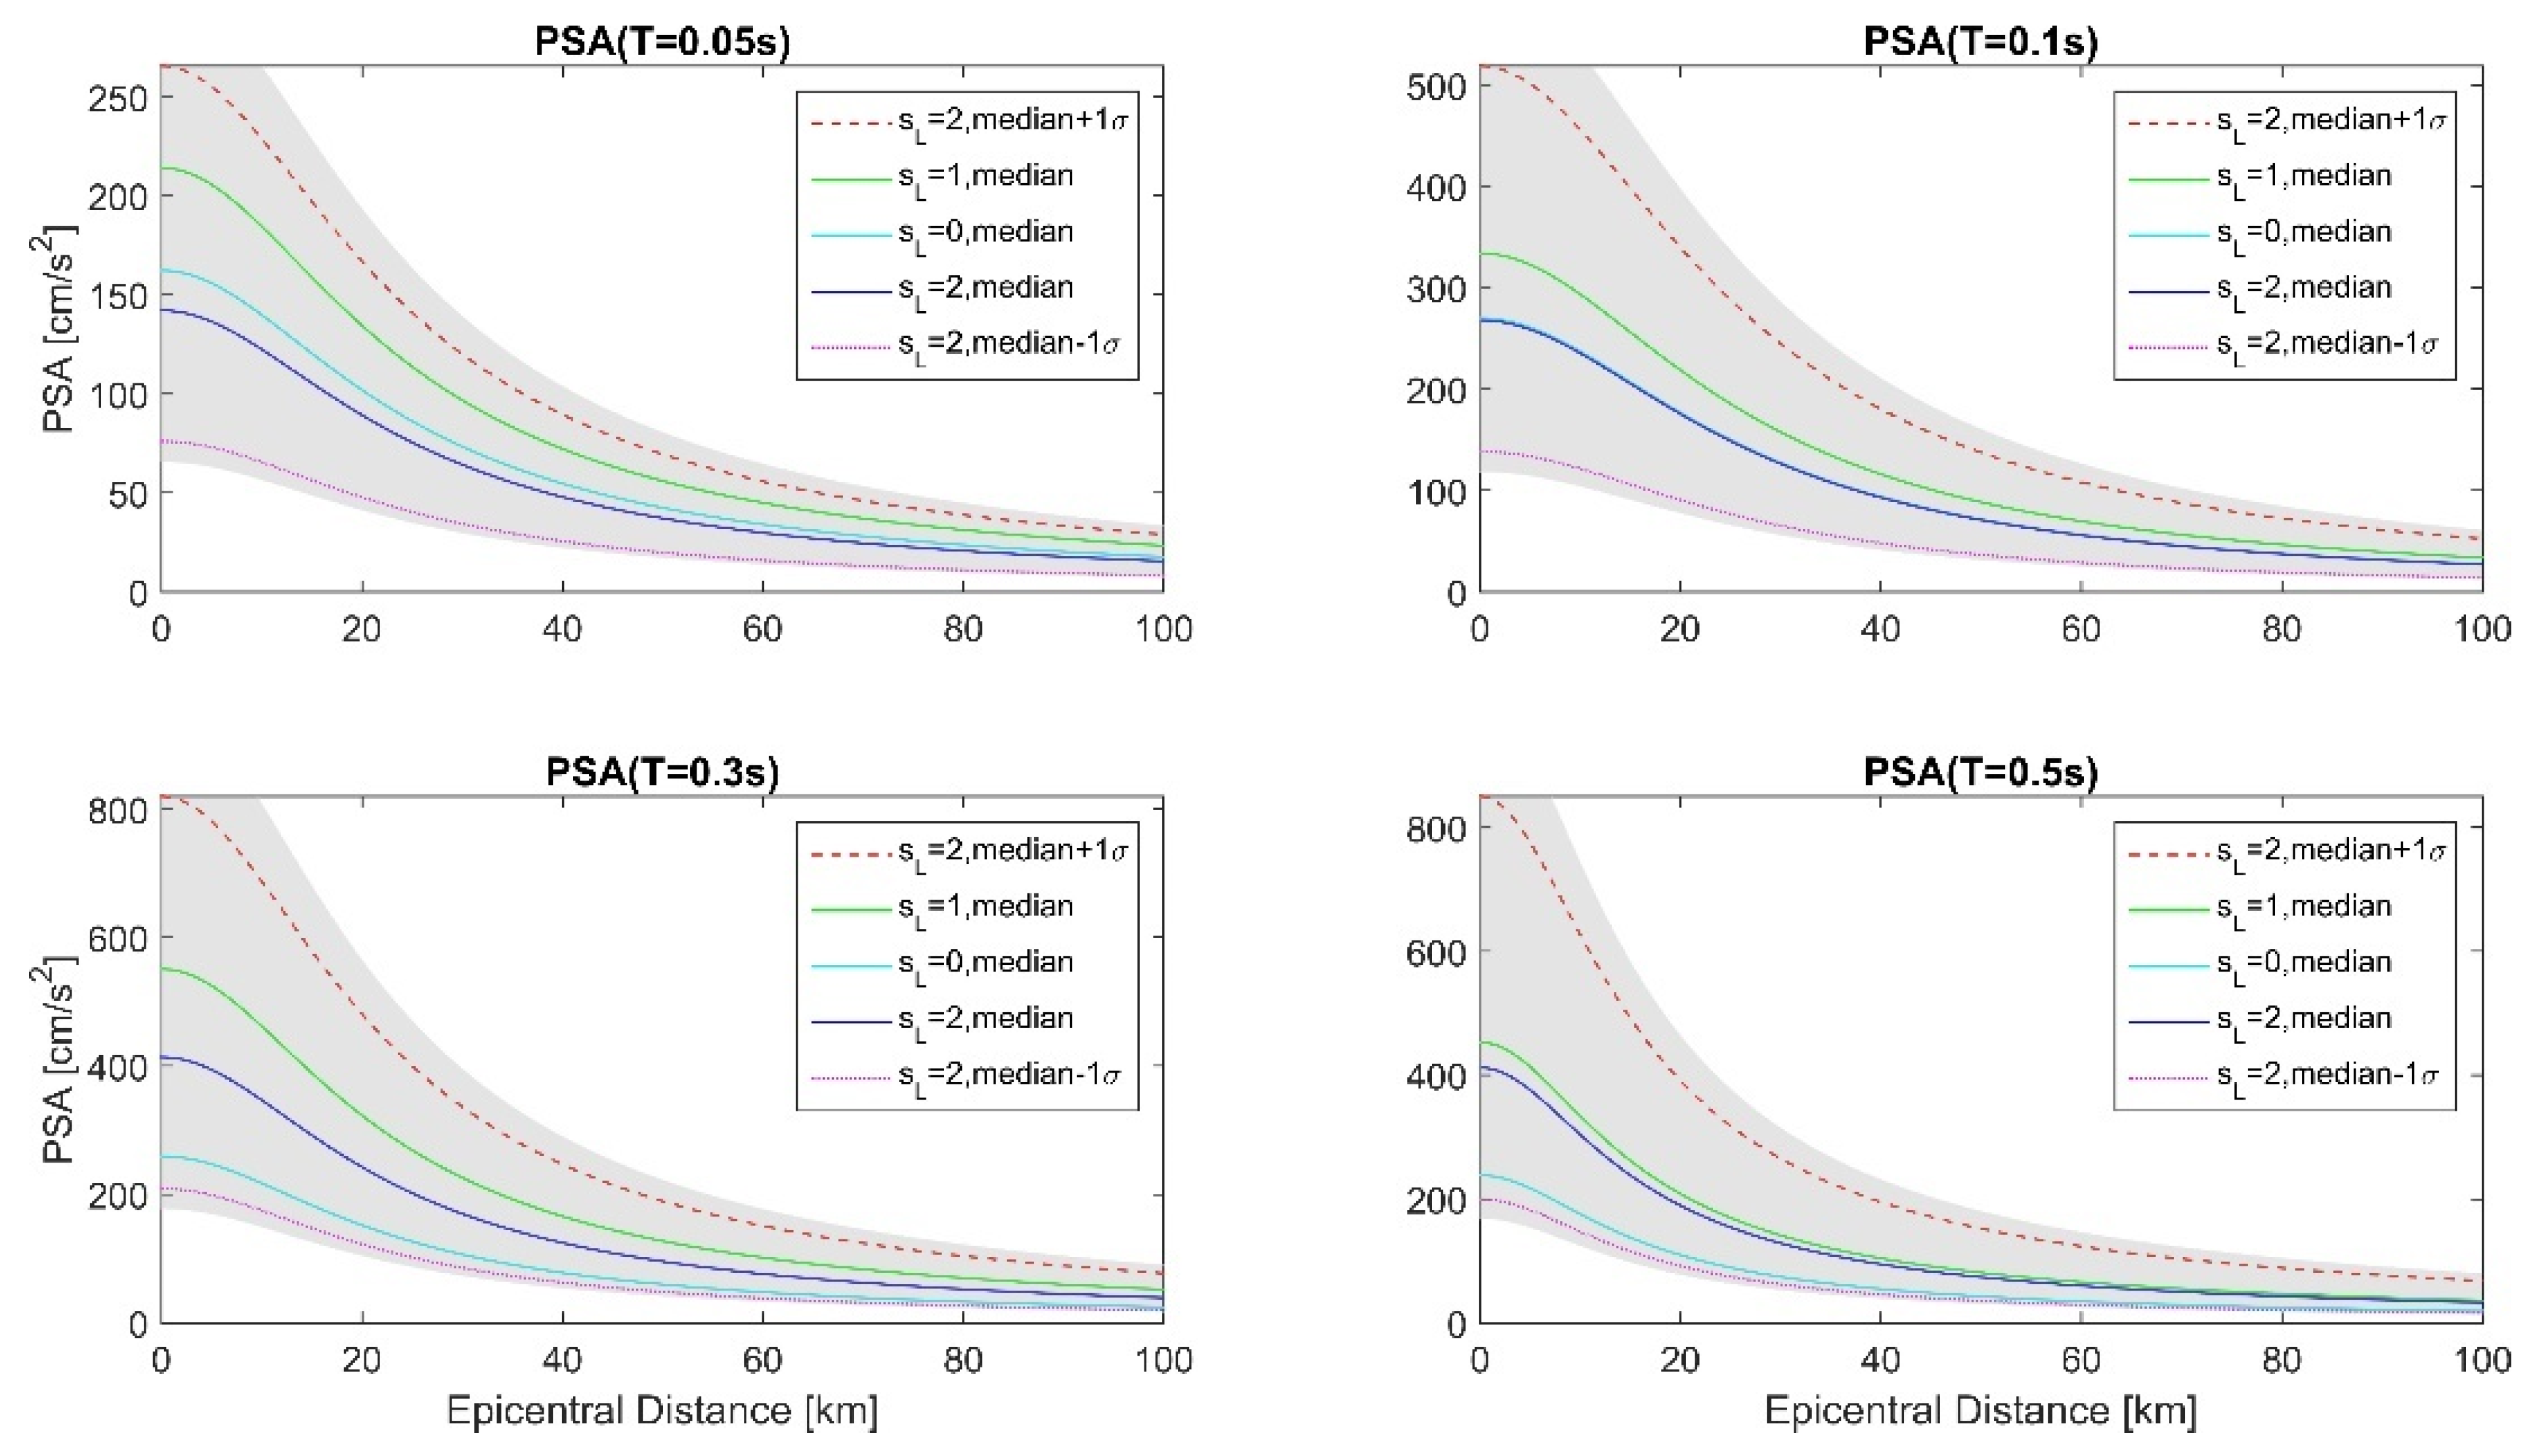
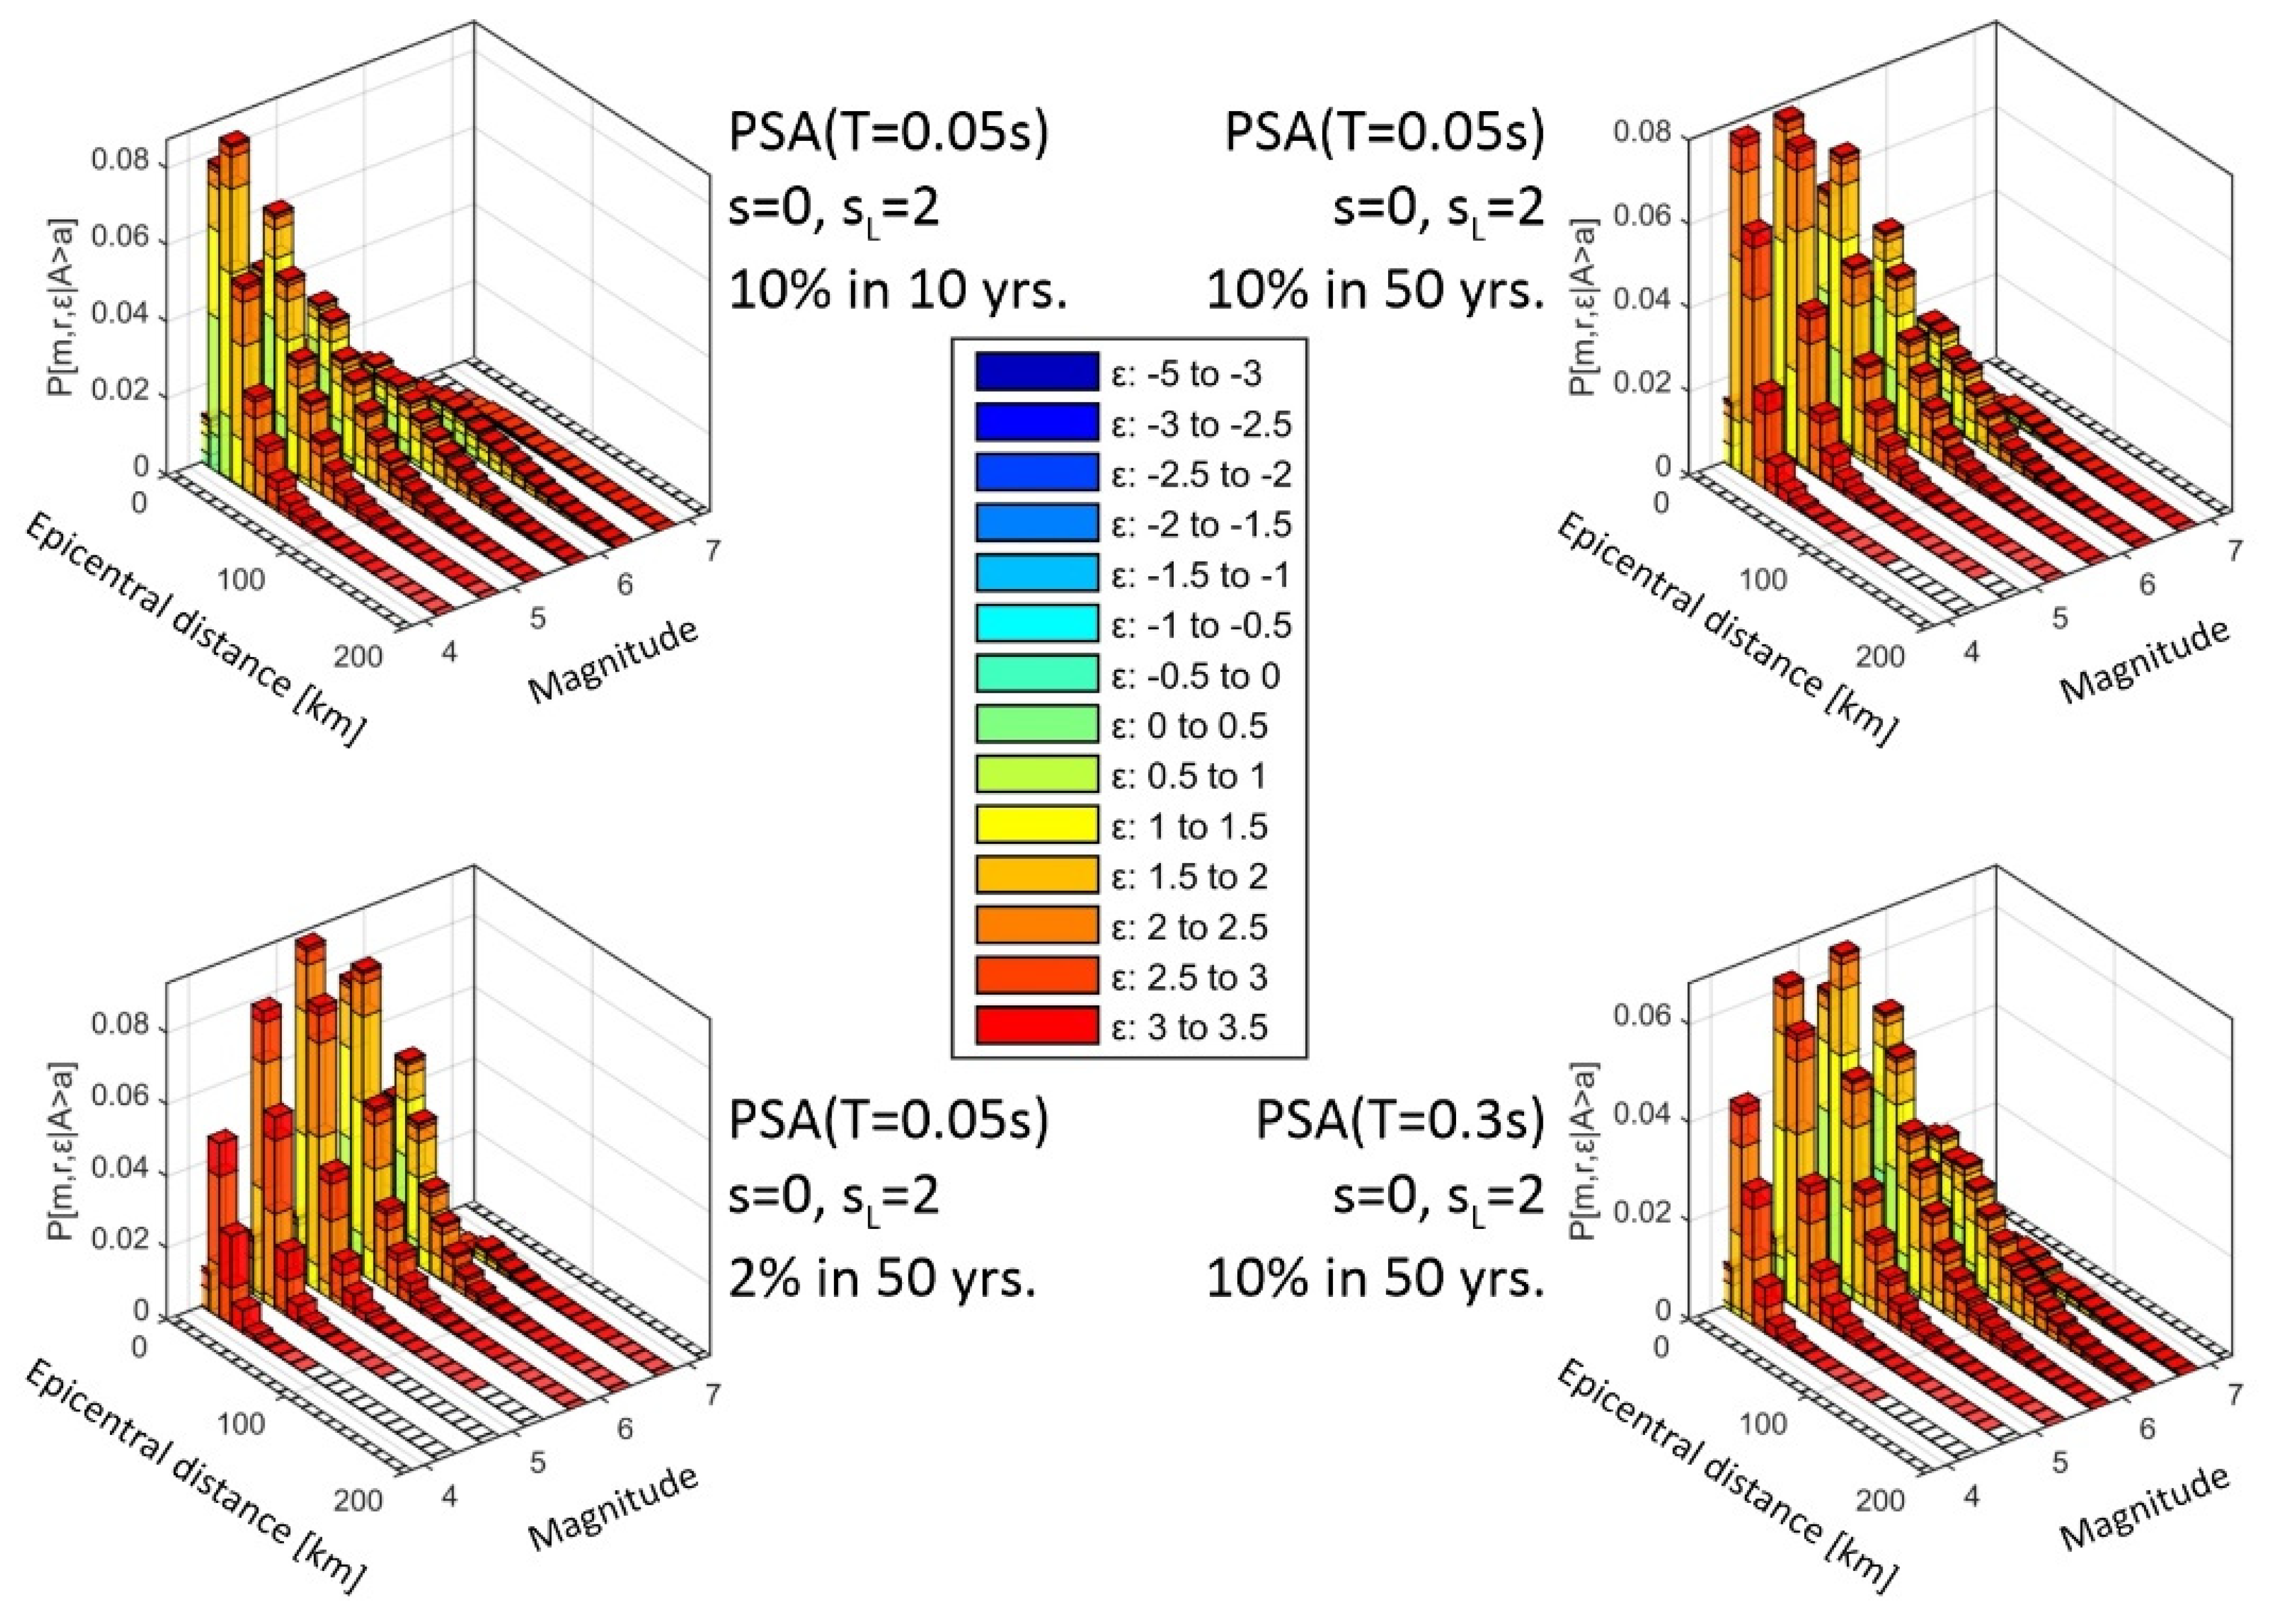
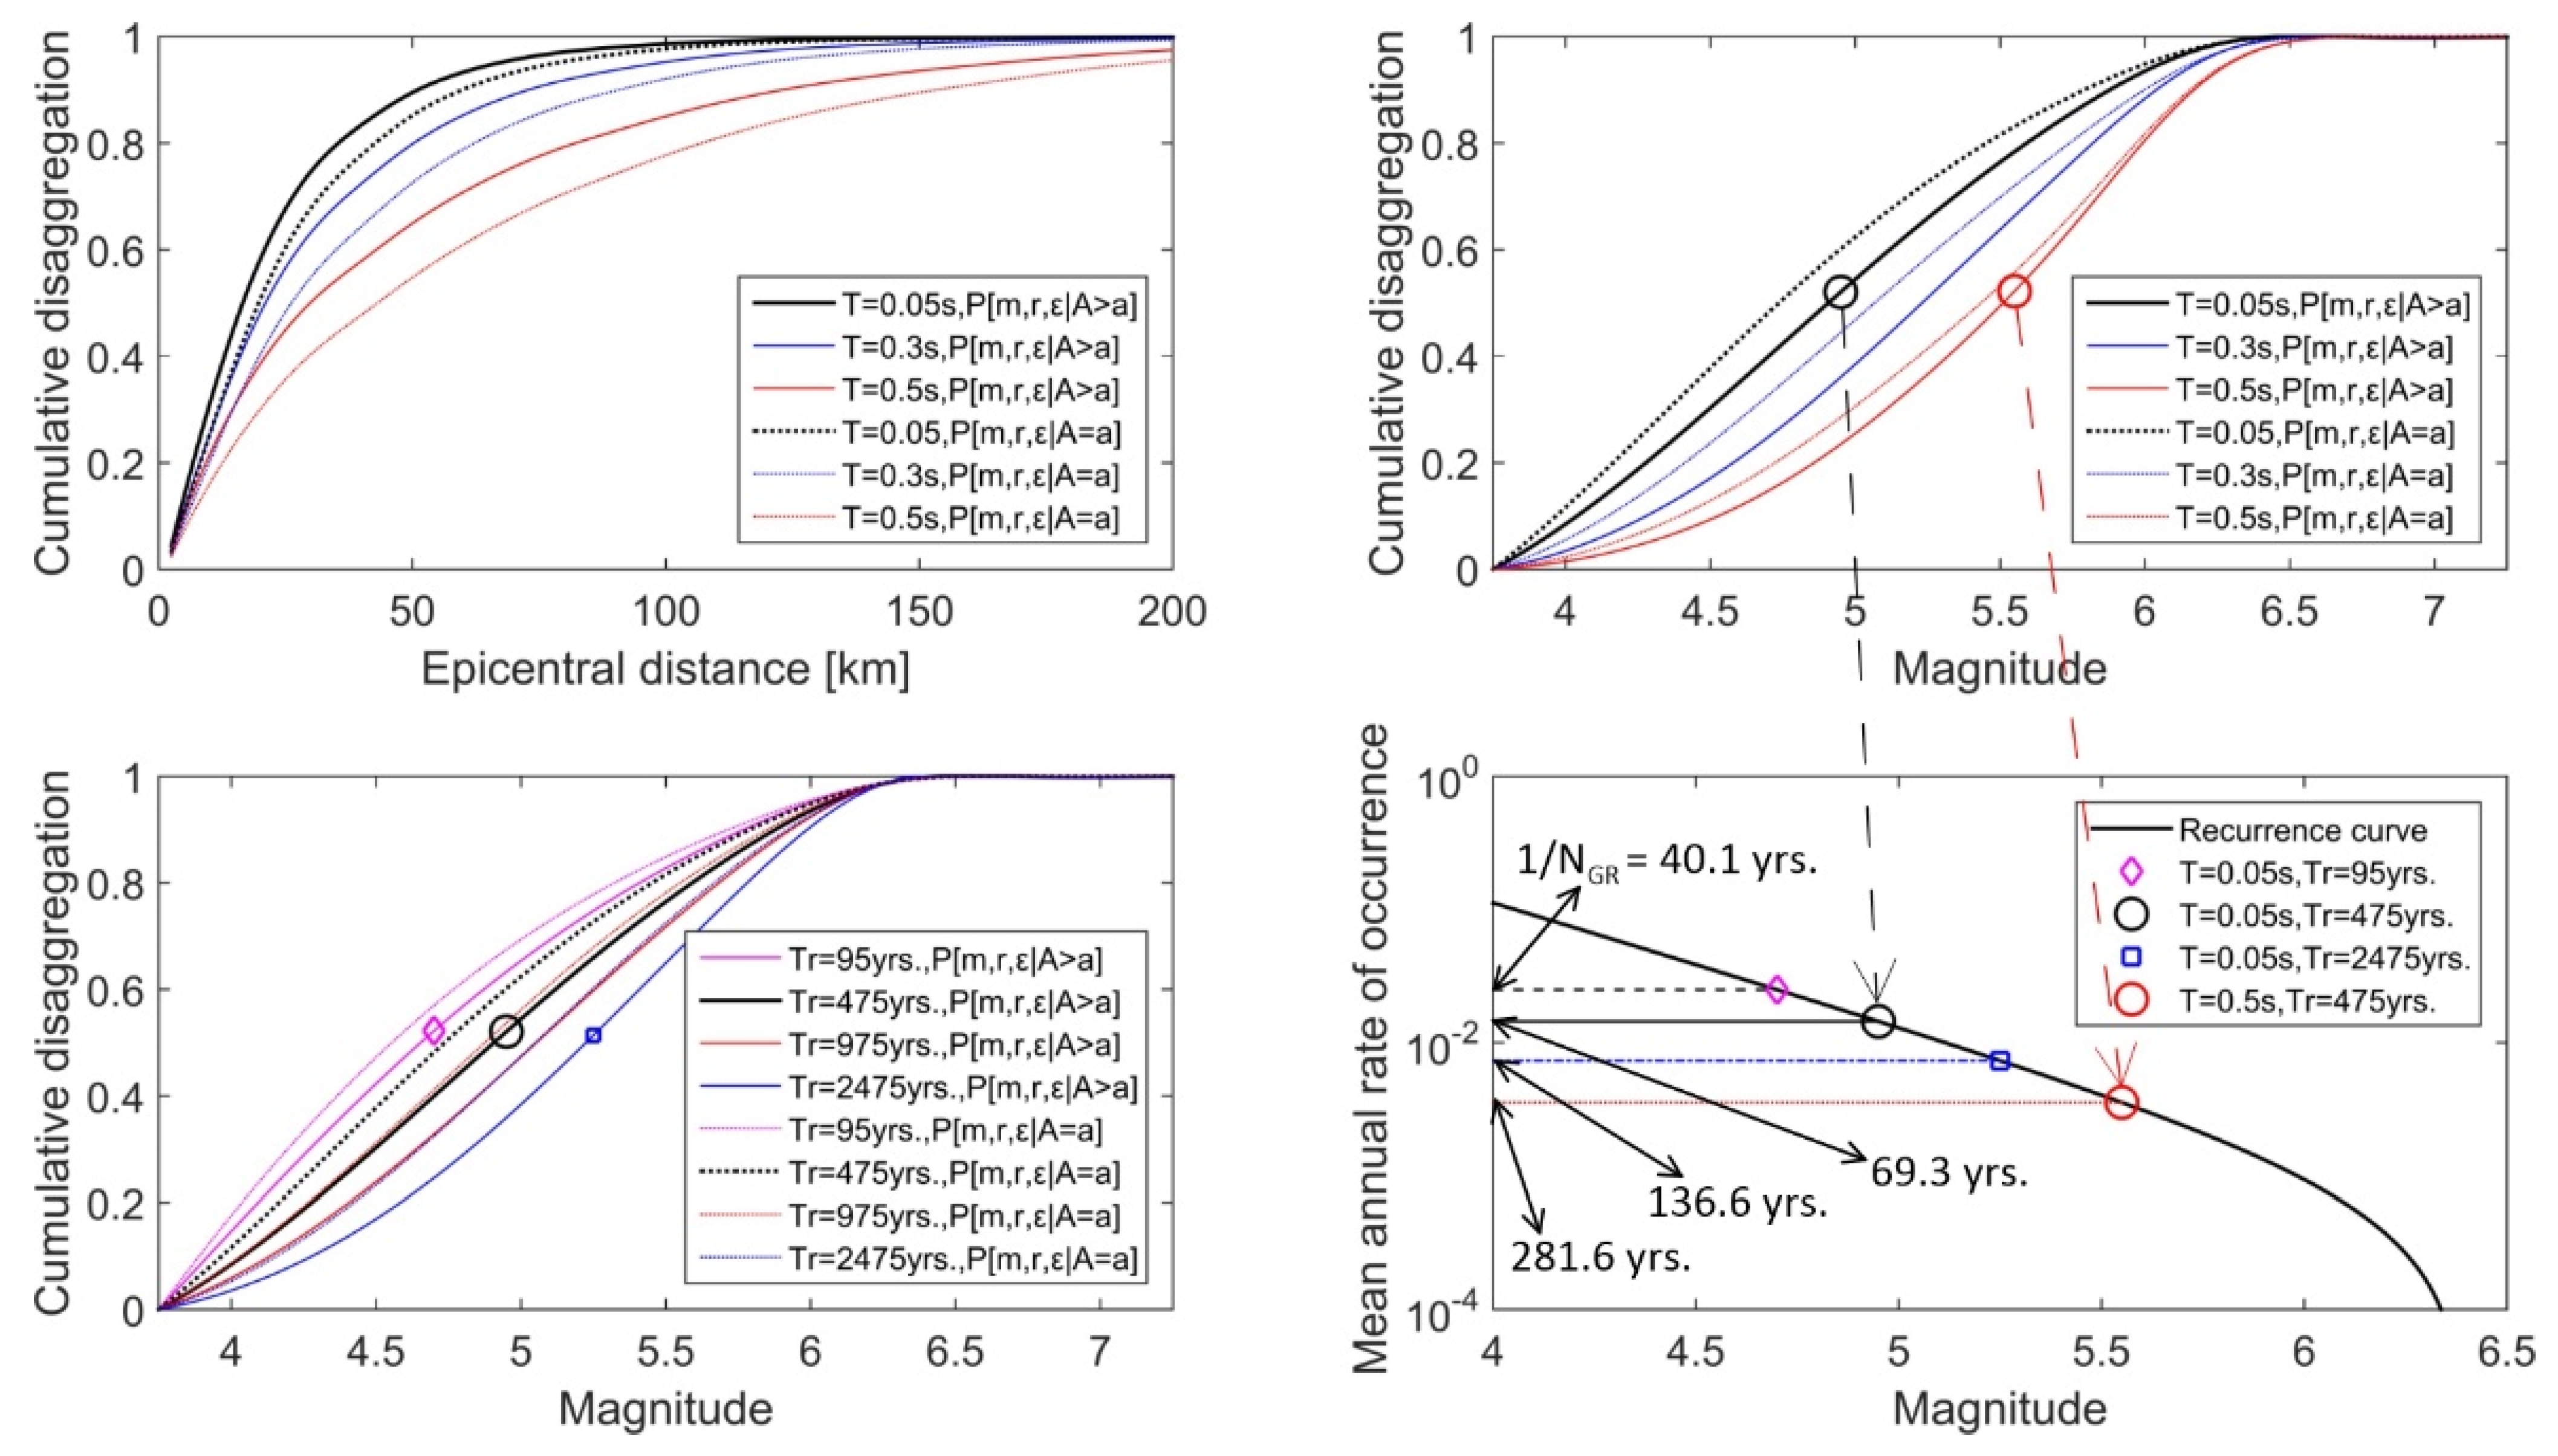
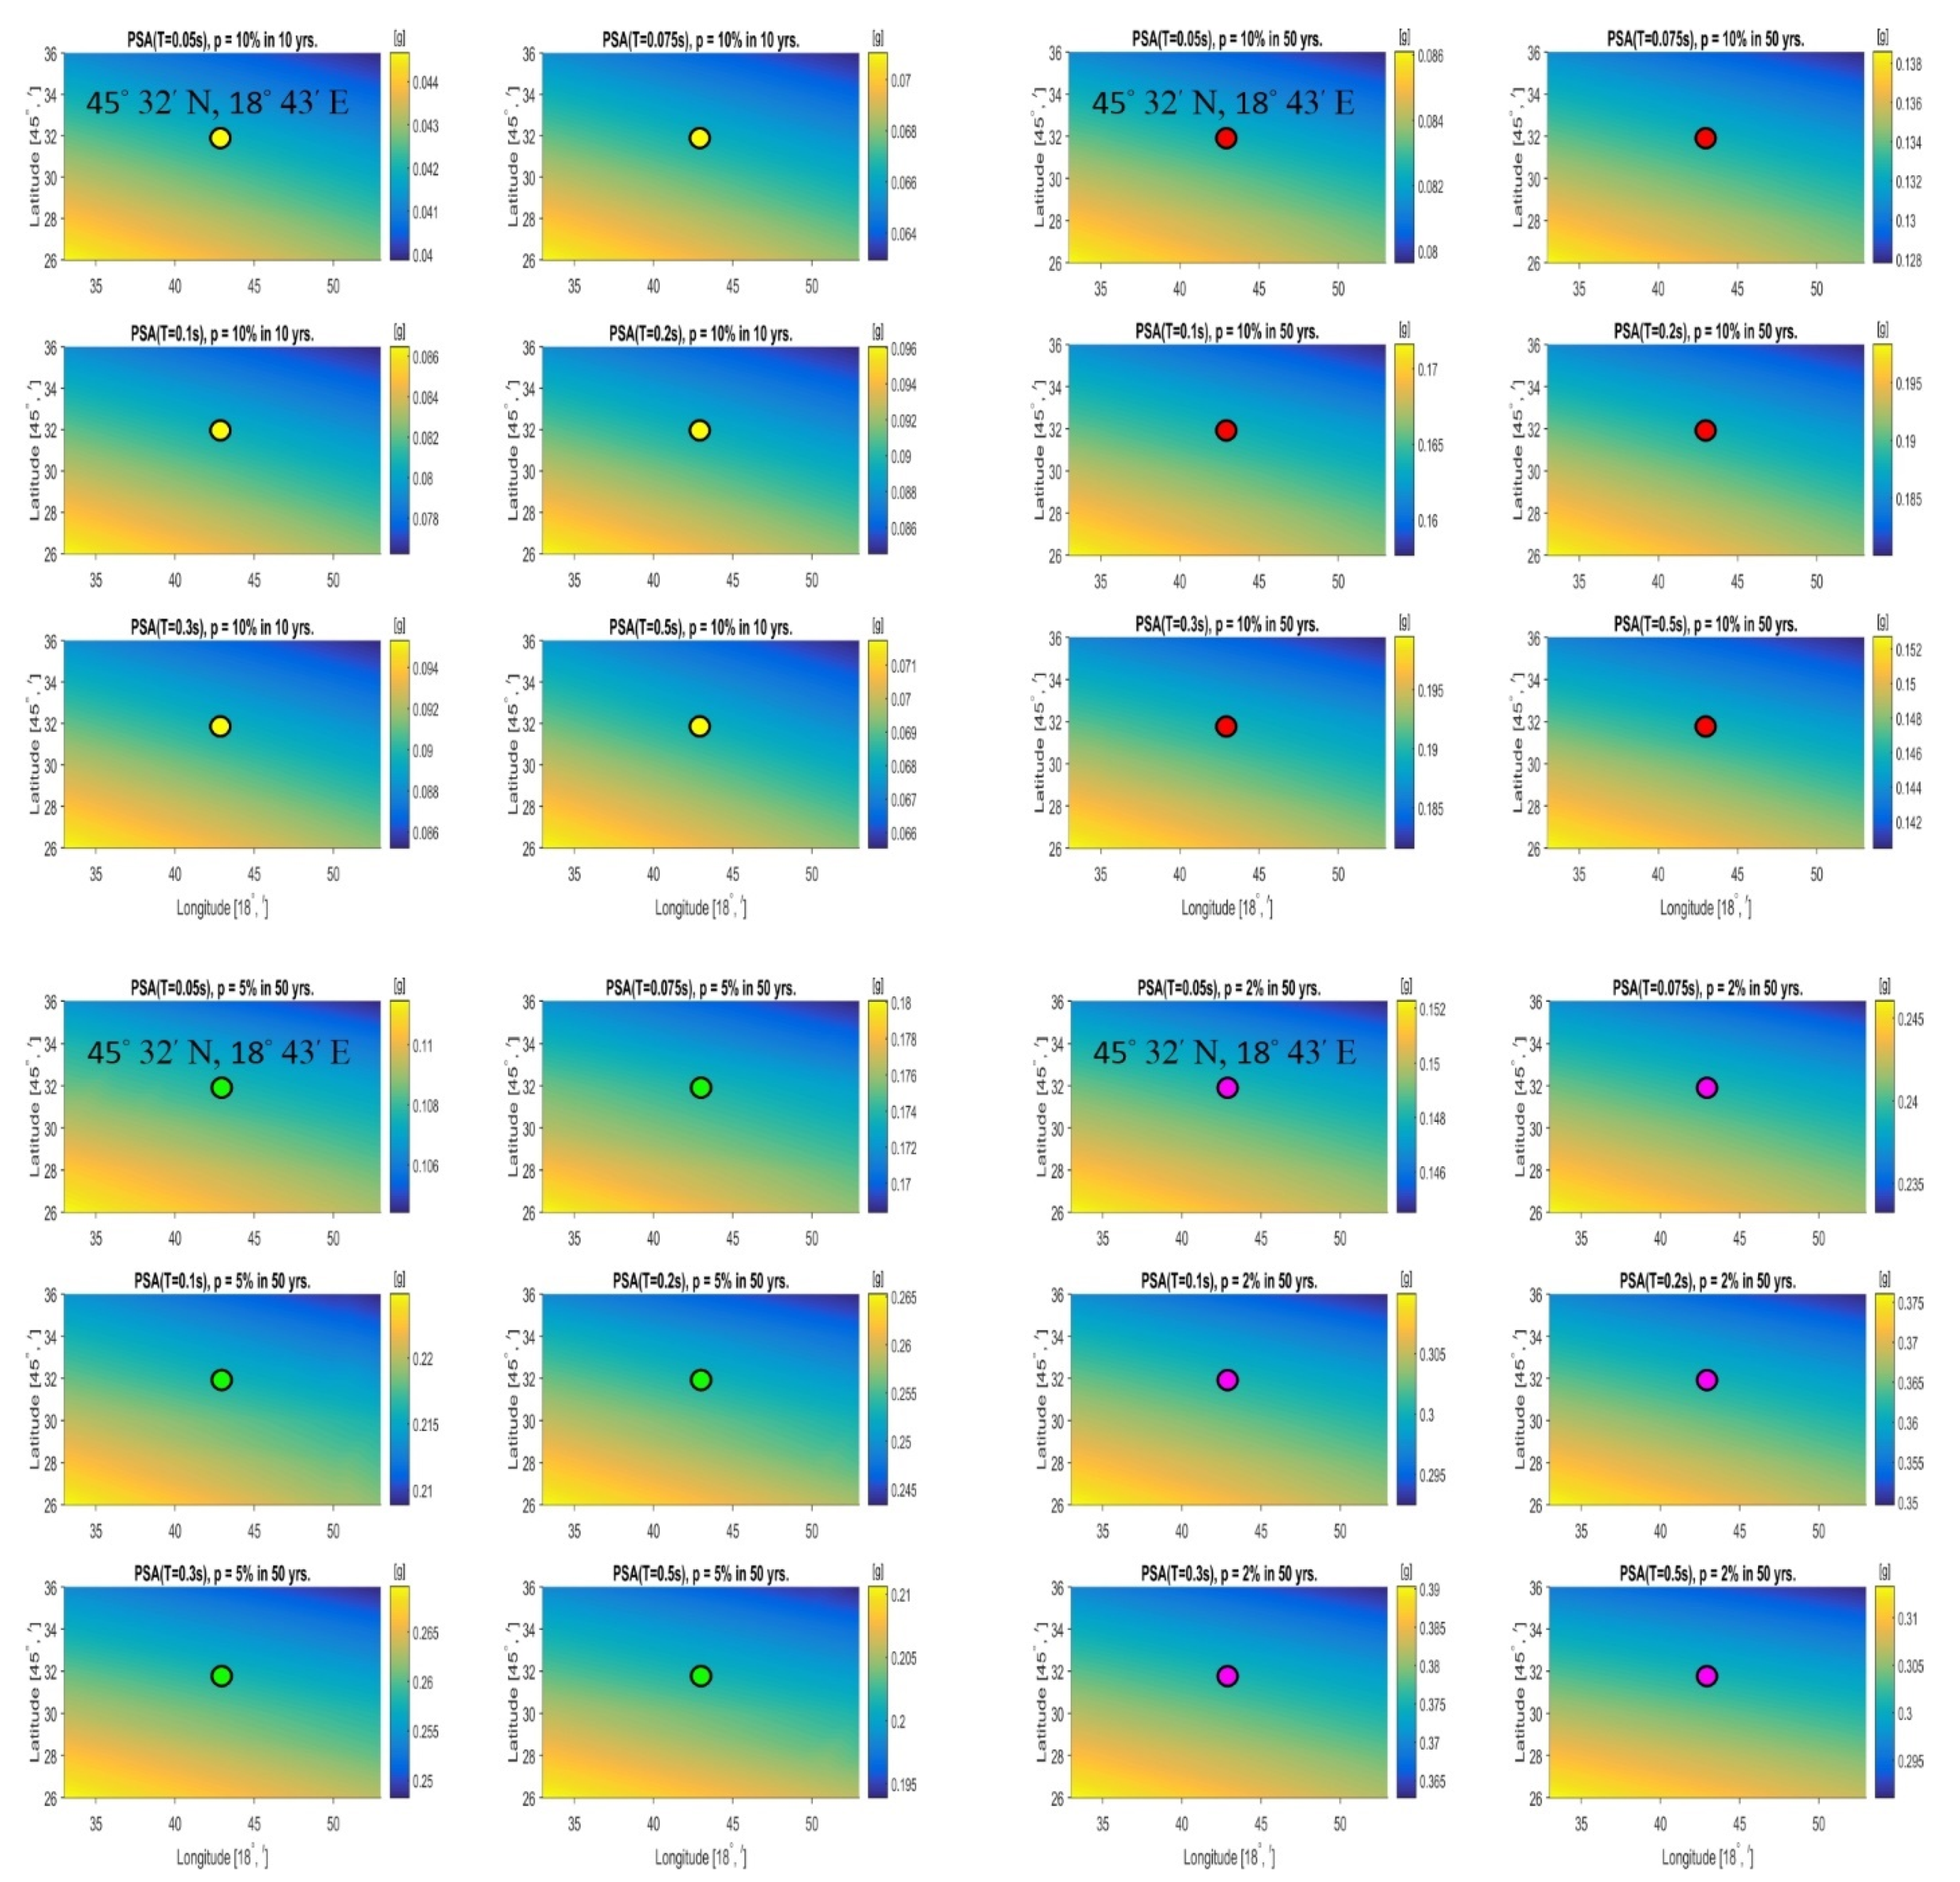
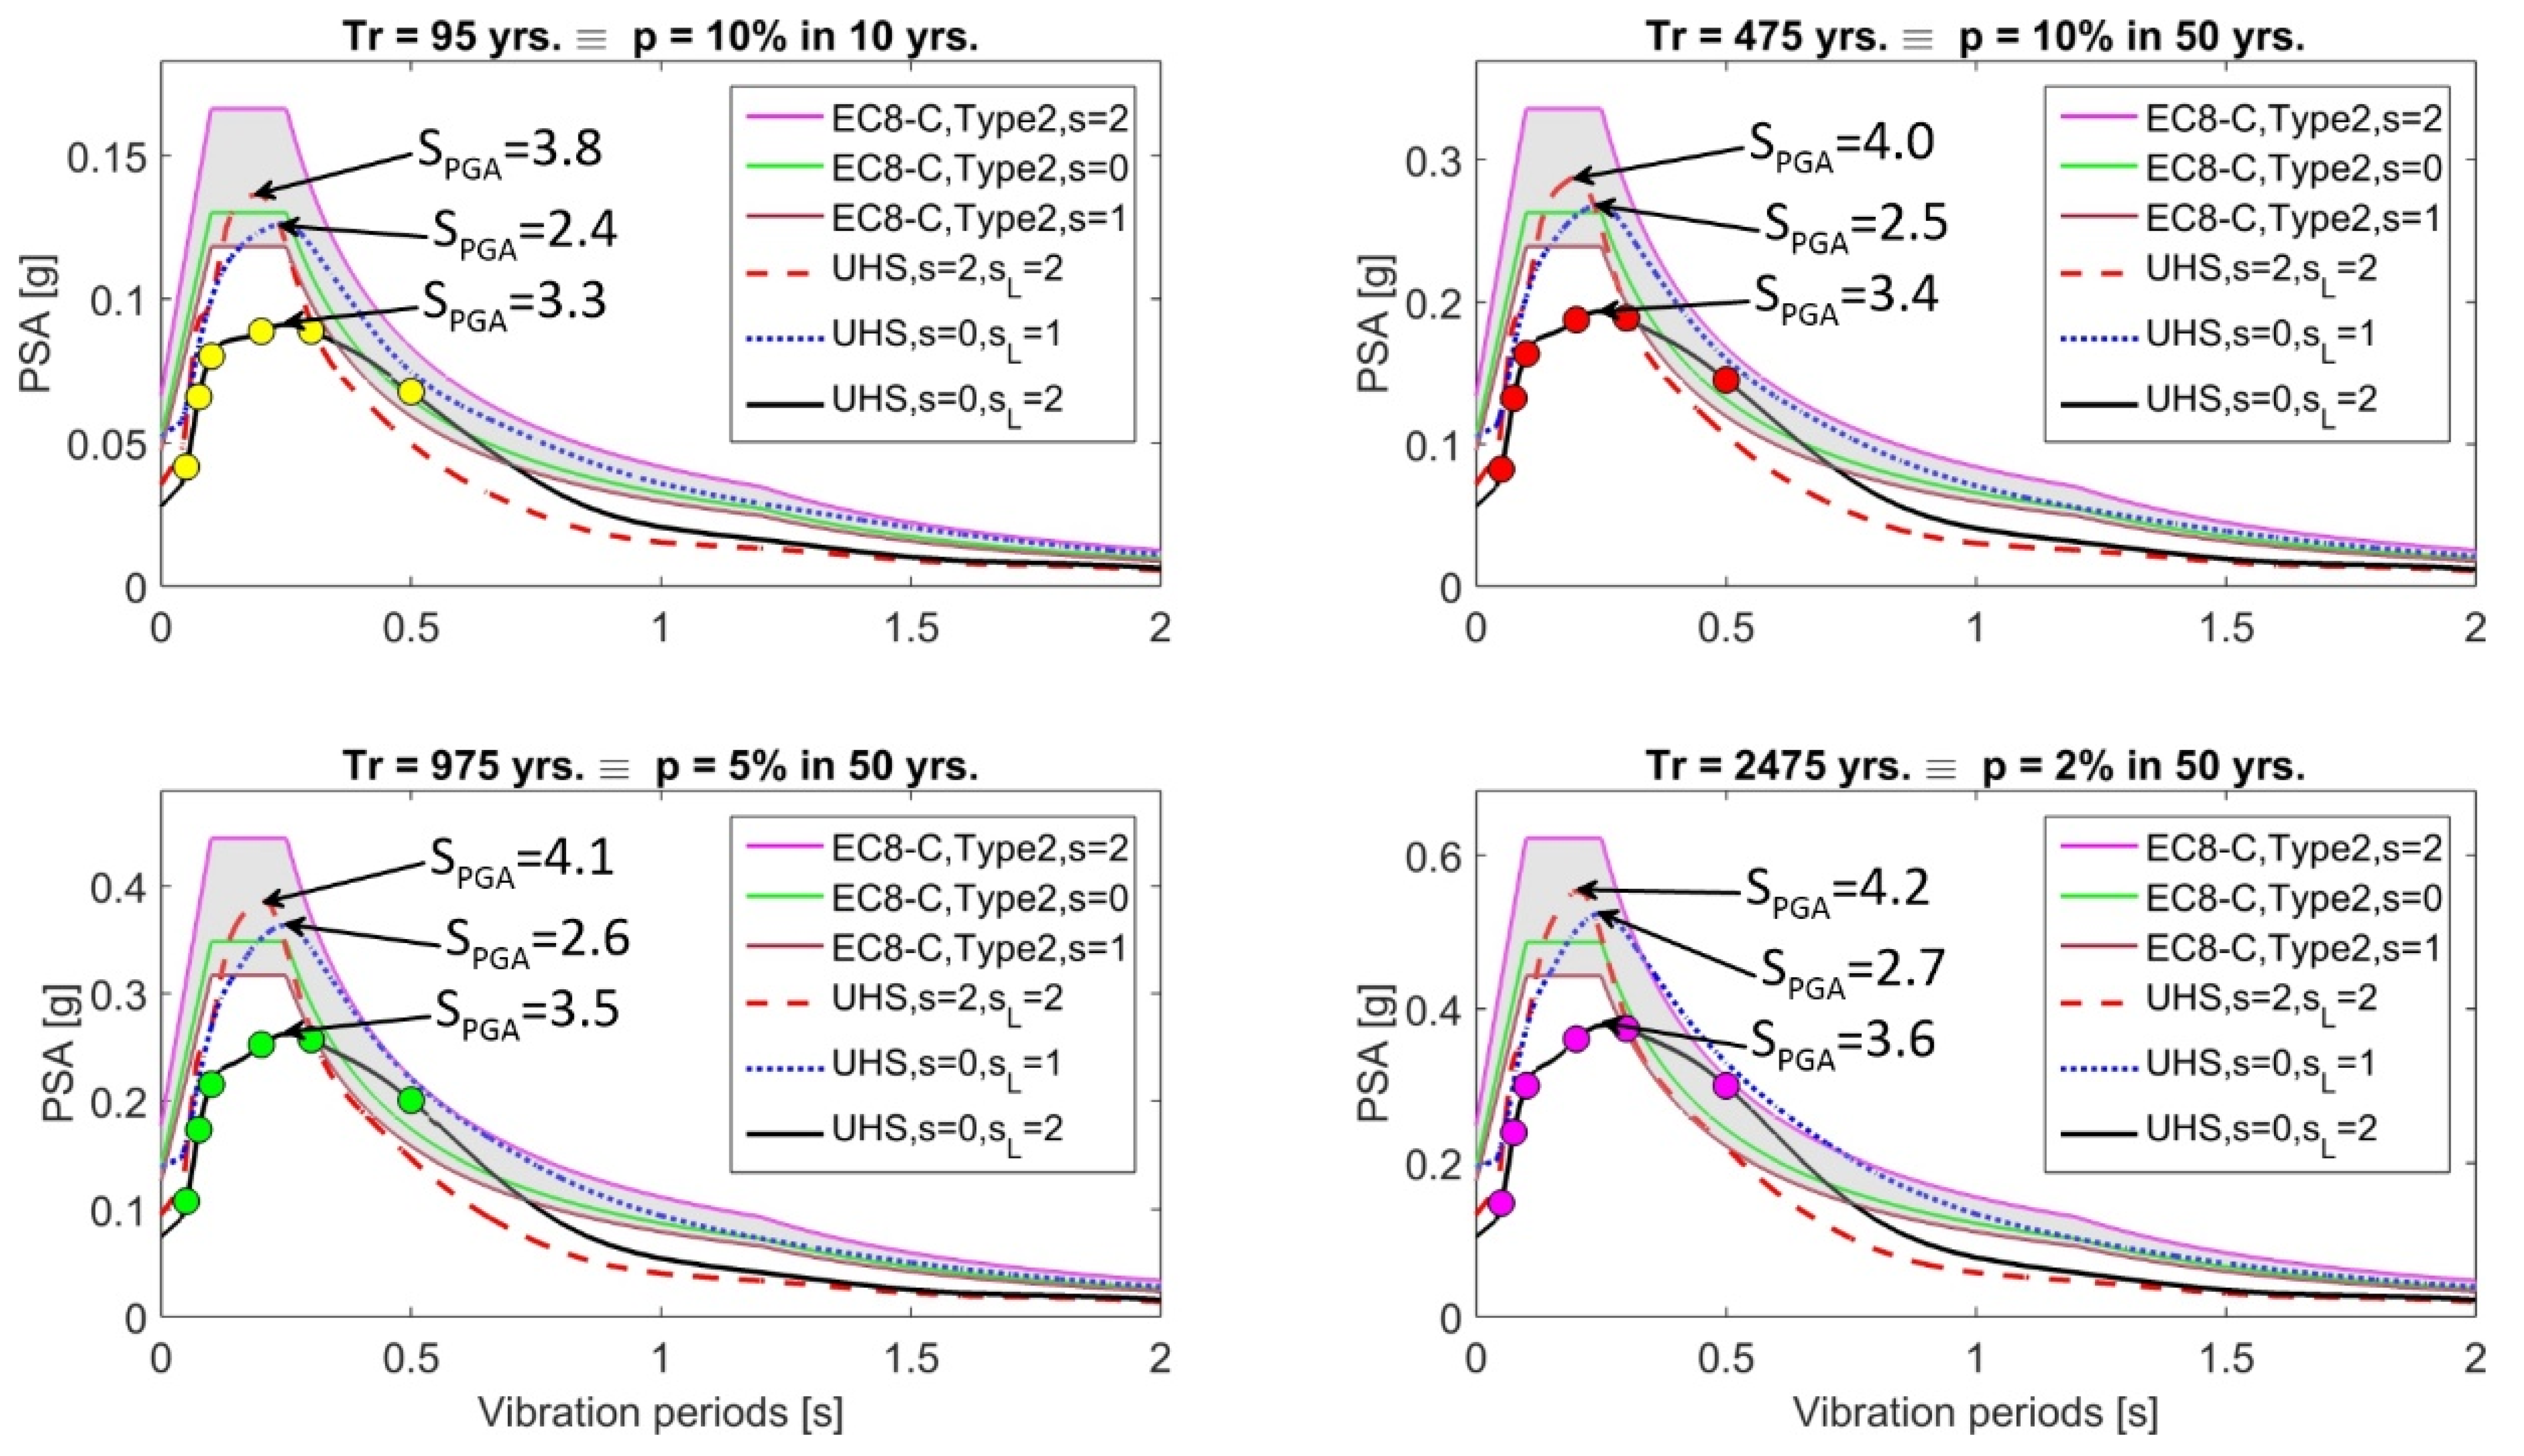
4. Uniform Hazard Spectra and Seismic Hazard Maps for Osijek

In this section, we perform a probabilistic seismic hazard assessment (hereinafter, PSHA) analysis utilizing Equation (1) as the GMPE and coefficients from Table A1, assuming the deep soil sites and deep geological layers throughout the analyzed area. We also employ the SHARE Project’s pan-European seismic source zone model [34,35,36]. The boundaries of the seismic source zones employed in this study’s hazard calculations are depicted in Figure 6. The same figure also shows the radii of 123, 184, and 228 km, which show the epicentral distances that must be incorporated in the PSHA calculations for the 475-year return period to obtain 1% accuracy for computed spectral amplitudes at 0.05, 0.3, and 0.5 s, respectively. These radii show that the short-period spectral amplitudes are less sensitive to the occurrence of distant strong earthquakes and are dominated by the local seismic activity. Furthermore, the circle with a radius of 43 km designates the distances that contribute to 50% accuracy of PSHA calculations for the 0.5 s spectral amplitude. The epicenter of the largest historical (M 4.6, 1922) earthquake near Osijek, which is also shown in Figure 6, falls almost within this radius around the analyzed area.
The PSHA estimations were generated with REASSES V2.0 software [37], which is based on Cornell [38] and McGuire’s [39] methodology. According to this methodology, to calculate the mean yearly rate of occurrence, N(a), of seismic events that will cause a ground motion PSA amplitude “A” to exceed expectation “a”, products of probabilities related to distance, magnitude recurrence, and GMPE predictions are integrated over all the considered magnitudes and distances and summed. If homogeneous Poisson distribution is assumed, the probability of at least one yearly exceedance of the expectation a can be calculated as follows [40]:
P a = 1 e N a .
If a binomial distribution is additionally considered, the chance that A will surpass a at least once throughout t years can be estimated as follows [40]:
p a = 1 [ 1 P a ] t
The so-called return period, Tr, is then equal to N(a)−1 and does not (in general) correlate to any single engineeringly significant earthquake. Magnitudes and distances of earthquakes contributing to N(a) can be determined using a technique known as “seismic hazard disaggregation” [41]. In the disaggregation, we can additionally define the values of the number of standard deviations that log(a) is distant from the median empirical estimate for each pair of magnitude and distance [42].
Figure 7 shows hazard disaggregation examples for the coordinates 45°32′ N, 18°23′ E. Top plots and the bottom-left plot in Figure 8 show cumulative disaggregation for distances and magnitudes. The magnitude recurrence curve for the most contributing seismic source zone surrounding Osijek is in the bottom-right plot. As can be observed, the real return periods of the most contributing earthquakes vary depending on the vibration period and are substantially shorter than the so-called return period Tr, defined as a reciprocal value of the mean yearly rate of occurrence, N(a). This is significant because Eurocode 8 [16] does not define Types 1 and 2 spectra in terms of maximum credible earthquake magnitudes but rather in terms of magnitudes that “contribute most to the seismic hazard defined for the site for the purpose of probabilistic hazard assessment” (see Eurocode 8 [16]: 3.2.2.1, (4), Note 2 and 3.2.2.2, (2)P, Note 1).
The seismic microzonation maps for the research area are depicted in Figure 9 for the return periods Tr of 95, 475, 975, and 2475 years. Finally, for the coordinates 45°32′ N, 18°23′ E, uniform hazard spectra were produced for four different probability levels and compared to the Eurocode 8 [16] Type 2 spectra for ground type C. Figure 10 compares the resulting uniform hazard spectra (hereinafter, UHS) for several deep geology and local soil types to the Eurocode 8 spectra for ground type C, scaled by the PGA values at deep soil sites (sL = 2) and for three different deep geology types. As can be seen, the maximum UHS amplitudes to PGA ratios, referred to as SPGA in Figure 10, deviate from the 2.5 factor indicated by Eurocode 8 [16] for horizontal spectra. The difference between SPGA and the 2.5 factor slightly increases with the so-called return period. For the 475-year return period, SPGA for deep soils atop deep geological sediments (s = 0, sL = 2) will be 37% larger than the factor suggested by Eurocode [16]. For the 2475 years, SPGA for the same site conditions will be 46% larger than 2.5. The differences are even larger if we consider UHS amplitudes for deep soils atop geological rocks (s = 0, sL = 2)—SPGA will be 60% larger for 475-year and 67% larger for 2475-year return periods. The only time when SPGA is similar to 2.5 is when UHS is calculated for deep geological sediments and stiff soils (s = 0, sL = 1). Here, “stiff soils” sites are those with a soil layer 15–75 m thick overlying the layer with VS,30 > 800 m/s [23,24].

5. Discussion and Conclusions

This research was motivated by recent seismic microzonation studies in the north-western Balkans region [9,10,11,12,13,14], which revealed that variations in deep geological site conditions can significantly increase seismic hazard estimates when compared to the hazard estimates based only on the effects of the local soil. At the same time, other recent studies indicated a high vulnerability of the city of Osijek’s building stock [43,44].
In this study, we analyzed horizontal UHS estimates for deep soil sites atop deep geological sediments in low-to-medium seismicity areas. For the case study, we chose the city of Osijek, Croatia, located in the southern part of the Pannonian Basin and on the right bank of the Drava River. Geological sediments underneath Osijek have depths ranging up to 2.7 km, while the total thickness above layers with an s-wave velocity greater than 800 m/s is 150–180 m.
New empirical regional formulae for PSA attenuation were first developed based solely on the regional strong-motion data. The strong-motion database used to create predictive equations includes 436 horizontal components of strong strong-motion accelerograms recorded in the north-western Balkans from 112 earthquakes with magnitudes ranging from 3 to 6.8. The provided equations take into account the effects of local soil and deep geological conditions at the same time. According to empirical estimations, the combination of deep soil and deep geological deposits results in short-period spectral amplitudes up to 37% lower than those obtained at rock soil locations. This suggests that energy dissipation in deep soil sites overcomes local soil amplification, which is consistent with other recent studies of soft sediment non-linear behavior (e.g., [45,46]). Vice versa, spectral amplitudes for vibration periods T > ~0.3 s are shown to be amplified. This is consistent with the findings of Bijelic et al. [47], who investigated the impact of deep basin effects on structure collapse and discovered that vibration periods longer than 1.2 s increased the chance of structural collapse by up to 20%. In this study, the maximum amplification of 2.37 times was obtained for T = 0.5 s.
The only GMPEs to which we can compare our findings (since they consider effects of deep soils and deep geological sediments at the same time) are those created for California based on 1482 strong-motion records from earthquakes in the western United States [21]. Californian GMPEs, for example, show 30% lower PSA amplitudes in the deep soil than in the rock sites for T = 0.04 s. According to Californian GMPEs [21], the amplification exists for vibration intervals longer than 0.3 s, and the highest amplification is 1.7, which is a little lower than what we obtained.
Based on the presented scaling equations, UHS amplitudes were calculated for the analyzed area and the microzonation maps created. The resulting uniform hazard spectra were compared to the Eurocode 8 [16] spectra for ground type C, scaled by the PGA values at deep soil sites, and for three different types of deep geology. As can be observed in Figure 10, the ratios of the maximum UHS amplitudes to PGA values, SPGA, diverge from the 2.5 factor recommended by Eurocode 8 for horizontal spectra. In the case of UHS amplitudes for deep soils atop deep geological sediments, SPGA is equal to 3.3 for 95-year, 3.4 for 475-year, 3.5 for 975-year, and 3.6 for 2475-year return periods. This is a 31–46% increase compared to the 2.5 factor suggested by Eurocode 8.
Although the data used for the definition of the GMPEs used for hazard calculations are limited, we believe that the presented hazard maps and uniform hazard spectra can be seen as the first step towards more reliable hazard estimates for the analyzed region. When more data become available, it will be easy to update the GMPEs and recalculate the hazard, leading to increased reliability of the risk estimates for the local building stock.

Author Contributions

Conceptualization, B.Đ.B., M.H.-N. and G.P.; methodology, B.Đ.B., M.H.-N. and G.P.; validation B.Đ.B., M.H.-N. and G.P.; formal analysis B.Đ.B., M.H.-N. and G.P.; investigation: B.Đ.B., M.H.-N. and G.P.; resources B.Đ.B., M.H.-N. and G.P.; writing—original draft preparation: B.Đ.B., M.H.-N. and G.P.; final writing—review and editing: B.Đ.B., M.H.-N. and G.P. All authors have read and agreed to the published version of the manuscript.

Funding

This research received no external funding.

Institutional Review Board Statement

Not applicable.

Informed Consent Statement

Not applicable.

Data Availability Statement

Not applicable.

Conflicts of Interest

The authors declare no conflict of interest.

Appendix A. The Coefficients Derived in This Study for Scaling Horizontal PSA

Table A1. Scaling coefficients and standard deviations of the empirical attenuation equations for horizontal PSA amplitudes, derived for the region of the north-western Balkans—Equation (1) with R as the epicentral distance.
Tc1c2c3R0c4c5c6c7σlog
0.050−0.9210.352−1.37120.30.120−0.058−0.198−0.1430.272
0.075−0.5110.337−1.46622.10.071−0.032−0.212−0.1470.286
0.100−0.4670.360−1.55223.50.092−0.003−0.168−0.0960.287
0.150−0.4060.396−1.63825.80.1880.056−0.232−0.1880.283
0.200−0.6990.433−1.61124.50.2560.113−0.203−0.1860.290
0.300−1.6430.480−1.39118.60.3270.203−0.025−0.0130.297
0.400−2.4990.540−1.22613.80.3180.2480.1000.0870.313
0.500−2.8830.579−1.20112.30.2790.2380.1340.1360.315
0.750−3.4100.596−1.04410.90.1980.0570.0660.1620.323
1.000−3.7920.604−0.9118.90.141−0.098−0.0210.1290.322
1.500−4.1100.590−0.7688.60.077−0.227−0.0850.0540.323
2.000−4.2950.599−0.8259.00.063−0.184−0.0770.0520.322
Table A2. Scaling coefficients and standard deviations of the empirical attenuation equations for horizontal PSA amplitudes, derived for the region of the north-western Balkans—Equation (1) with R as the hypocentral distance.
Tc1c2c3R0c4c5c6c7σlog
0.050−0.5030.333−1.51326.20.144−0.056−0.174−0.1440.279
0.075−0.0420.317−1.62628.80.094−0.021−0.189−0.1480.293
0.1000.0560.340−1.73330.70.1090.012−0.146−0.0950.294
0.1500.2450.375−1.87534.80.2040.075−0.208−0.1910.292
0.200−0.0590.413−1.84933.00.2720.130−0.179−0.1910.298
0.300−1.1160.459−1.58025.60.3550.2100.002−0.0220.307
0.400−2.1170.516−1.34118.10.3380.2440.1240.0810.325
0.500−2.5140.552−1.29616.10.2930.2270.1540.1320.330
0.750−3.0830.569−1.11514.50.2100.0340.0810.1580.337
1.000−3.5020.578−0.96311.70.142−0.109−0.0130.1270.335
1.500−3.9040.568−0.79510.40.083−0.255−0.0760.0540.332
2.000−4.0630.576−0.86211.30.073−0.226−0.0670.0510.332

References

  1. Faccioli, E.; Vanini, M. Complex seismic site effects in sediment-filled valleys and implications on design spectra. Earthq. Eng. Struct. Dyn. 2003, 5, 223–238. [Google Scholar] [CrossRef]
  2. Stamati, O.; Klimis, N.; Lazaridis, T. Evidence of complex site effects and soil nonlinearity numerically estimated by 2D vs1D seismic response analyses in the city of Xanthi. Soil. Dyn. Earthq. Eng. 2016, 87, 101–115. [Google Scholar] [CrossRef]
  3. Zhu, C.; Chávez-García, F.J.; Thambiratnam, D.; Gallage, C. Quantifying the edge-induced seismic aggravation in shallow basins relative to the 1D SH modelling. Soil. Dyn. Earthq. Eng. 2018, 115, 402–412. [Google Scholar] [CrossRef]
  4. Ermert, L.; Poggi, V.; Burjanek, J.; Fah, D. Fundamental and higher two-dimensional resonance modes of an Alpine valley. Geophys. J. Int. 2014, 198, 795–811. [Google Scholar] [CrossRef] [Green Version]
  5. Zhu, C.; Thambiratnam, D. Interaction of geometry and mechanical property of trapezoidal sedimentary basins with incident SH waves. B Earthq. Eng. 2016, 14, 2977–3002. [Google Scholar] [CrossRef] [Green Version]
  6. Zhu, C.; Thambiratnam, D.; Zhang, J. Response of sedimentary basin to obliquely incident SH waves. B Earthq. Eng. 2016, 14, 647–671. [Google Scholar] [CrossRef]
  7. Douglas, J. Earthquake ground motion estimation using strong motion records: A review of equations for the estimation of peak ground acceleration and response spectral ordinates. Earth Sci. Rev. 2003, 61, 43–104. [Google Scholar] [CrossRef] [Green Version]
  8. Peng, Y.; Wang, Z.; Woolery, E.W.; Lyu, Y.; Carpenter, N.S.; Fang, Y.; Huang, S. Ground-motion site effect in the Beijing metropolitan area. Eng. Geol. 2020, 266, 105395. [Google Scholar] [CrossRef]
  9. Lee, V.W.; Trifunac, M.D.; Bulajić, B.Đ.; Manić, M.I. A preliminary empirical model for frequency-dependent attenuation of Fourier amplitude spectra in Serbia from the Vrancea earthquakes. Soil Dyn. Earthq. Eng. 2016, 83, 167–179. [Google Scholar] [CrossRef]
  10. Lee, V.W.; Trifunac, M.D.; Bulajić, B.Đ.; Manić, M.I. Preliminary empirical scaling of pseudo relative velocity spectra in Serbia from the Vrancea earthquakes. Soil Dyn. Earthq. Eng. 2016, 86, 41–54. [Google Scholar] [CrossRef]
  11. Lee, V.W.; Trifunac, M.D.; Bulajić, B.Đ.; Manić, M.I.; Herak, D.; Herak, M.; Dimov, G. Seismic microzoning in Skopje, Macedonia. Soil Dyn. Earthq. Eng. 2017, 98, 166–182. [Google Scholar] [CrossRef] [Green Version]
  12. Lee, V.W.; Trifunac, M.D.; Bulajić, B.Đ.; Manić, M.I.; Herak, D.; Herak, M.; Dimov, G.; Gičev, V. Seismic microzoning of Štip in Macedonia. Soil Dyn. Earthq. Eng. 2017, 98, 54–66. [Google Scholar] [CrossRef] [Green Version]
  13. Lee, V.W.; Trifunac, M.D.; Bulajić, B.Đ.; Manić, M.I.; Herak, D.; Herak, M. Seismic microzoning of Belgrade. Soil Dyn. Earthq. Eng. 2017, 97, 395–412. [Google Scholar] [CrossRef]
  14. Bulajić, B.Đ.; Bajić, S.; Stojnić, N. The effects of geological surroundings on earthquake-induced snow avalanche prone areas in the Kopaonik region. Cold Reg. Sci. Technol. 2018, 149, 29–45. [Google Scholar] [CrossRef]
  15. Trifunac, M.D.; Brady, A.G. On the correlation of seismic intensity scales with the peaks of recording strong ground motion. Bull. Seismol. Soc. Am. 1975, 65, 139–162. [Google Scholar]
  16. Eurocode 8: Design of Structures for Earthquake Resistance—Part I: General Rules, Seismic Actions and Rules for Buildings; EC8, EN 1998-1:2004; CEN—European Committee for Standardization: Brussels, Belgium, 2004.
  17. Bulajić, B.; Pavić, G.; Hadzima-Nyarko, M. Estimates of PGA values in the horizontal direction for low to medium seismicity regions with deep soil atop deep geological sediments—An example of the city of Osijek, Croatia. Geomech. Eng. submitted for publication.
  18. Bulajić, B.; Pavić, G.; Hadzima-Nyarko, M. PGA vertical estimates for deep soils and deep geological sediments—A case study of Osijek (Croatia). Comput. Geosci. accepted.
  19. Bulajić, B.; Hadzima-Nyarko, M.; Pavić, G. Vertical to horizontal strong motion UHS estimates ratios for low to medium seismicity regions with deep soil atop deep geological sediments—An example of the city of Osijek, Croatia. Appl. Sci. submitted for publication.
  20. Hrvatski zavod za norme: HRN EN 1998-1:2011/NA:2011. Eurocode 8: Design of Structures for Earthquake Resistance—Part 1: General Rules, Seismic Actions and Rules for Buildings—National Annex; Hrvatski Zavod za Norme: Zagreb, Croatia, 2011. [Google Scholar]
  21. Lee, V.W. Influence of Local Soil and Geologic Site Conditions on Pseudo Relative Velocity Spectrum Amplitudes of Recorded Strong Motion Accelerations; University of Southern California: Los Angeles, CA, USA, 1987. [Google Scholar]
  22. Cipta, A.; Cummins, P.; Irsyam, M.; Hidayati, S. Basin Resonance and Seismic Hazard in Jakarta, Indonesia. Geosciences 2018, 8, 128. [Google Scholar] [CrossRef] [Green Version]
  23. Seed, H.B.; Ugas, C.; Lysmer, J. Site-dependent spectra for earthquake-resistant design. Bull. Seismol. Soc. Am. 1976, 66, 221–243. [Google Scholar]
  24. Seed, H.B.; Murarka, R.; Lysmer, J.; Idriss, I.M. Relationships of maximum acceleration, maximum velocity, distance from source, and local site conditions for moderately strong earthquakes. Bull. Seismol. Soc. Am. 1976, 66, 1323–1342. [Google Scholar]
  25. Stucchi, M.; Rovida, A.; Gomez Capera, A.A.; Alexandre, P.; Camelbeeck, T.; Demircioglu, M.B.; Gasperini, P.; Kouskouna, V.; Musson, R.M.W.; Radulian, M.; et al. The SHARE European Earthquake Catalogue (SHEEC) 1000–1899. J. Seismol. 2013, 17, 523–544. [Google Scholar] [CrossRef] [Green Version]
  26. Earthquake Catalogue for all Earthquakes with Mw ≥ 3 in the Period between 1900 and April 2021 for the Geographic Region between 41.0° N and 47.0° N, and 12.5° E and 23.0° E. United States Geological Survey (USGS), USA. 2021. Available online: https://earthquake.usgs.gov/earthquakes/search/ (accessed on 23 May 2021).
  27. Magaš, N.P.; Mamužić, D.; Matičec, B.; Prtoljan, I.; Galović, M.; Sarkotić Šlat, Ž.; Glovacki, J.; Jagačić, T. Basic Geological Map of SFRY—Osijek, L34-86; Socialist Federal Republic of Yugoslavia; Federal Geological Instititute: Belgrade, Serbia, 1987. [Google Scholar]
  28. Jordanovski, L.R.; Lee, V.W.; Manić, M.I.; Olumčeva, T.; Sinadnovski, C.; Todorovska, M.I.; Trifunac, M.D. Strong Earthquake Ground Motion Data in EQINFOS: Yugoslavia. Part I; Report No. 87-05; Department of Civil Engineering, University of Southern California: Los Angeles, CA, USA, 1987. [Google Scholar]
  29. Ambraseys, N.; Douglas, J.; Margaris, B.; Sigbjörnsson, R.; Smit, P.; Suhadolc, P. Internet site for European strong motion data. In Proceedings of the 12th European Conference on Earthquake Engineering, London, UK, 9–13 September 2002; p. 837. [Google Scholar]
  30. Ambraseys, N.; Douglas, J.; Margaris, B.; Sigbjörnsson, R.; Berge-Thierry, C.; Suhadolc, P.; Costa, G.; Smit, P. Dissemination of European strong-motion data. In Proceedings of the 13th World Conference on Earthquake Engineering, Vancouver, BC, Canada, 1–6 August 2004; Volume 2, p. 32. [Google Scholar]
  31. Accelerograms recorded during March 10, 2010 Peć and November 03, 2010 Kraljevo Earthquakes. Seismological Survey of Serbia, Republic of Serbia. 2021. Available online: http://www.seismo.gov.rs/O%20zavodu/Infol.htm (accessed on 21 May 2021).
  32. Bulajić, B.Đ.; Manić, M.I.; Lađinović, Đ. Effects of shallow and deep geology on seismic hazard estimates—A case study of pseudo-acceleration response spectra for the north-western Balkans. Nat. Hazards 2013, 69, 573–588. [Google Scholar] [CrossRef]
  33. Manić, M.I.; Bulajić, B.Đ.; Trifunac, M.D. A note on peak accelerations computed from sliding of objects during the 1969 Banja Luka earthquakes in former Yugoslavia. Soil Dyn. Earthq. Eng. 2015, 77, 164–176. [Google Scholar] [CrossRef]
  34. Giardini, D.; Woessner, J.; Danciu, L.; Crowley, H.; Cotton, F.; Grünthal, G.; Pinho, R.; Valensise, L. SHAREConsort. European Seismic Hazard Map for Peak Ground Acceleration, 10% Exceedance Probabilities in 50 Years; Swiss Seismological Service: Zurich, Switzerland, 2013; ISBN-13 978-92-79-25148-1. [Google Scholar]
  35. Wössner, J.; Laurentiu, D.; Giardini, D.; Crowley, H.; Cotton, F.; Grünthal, G.; Valensise, G.; Arvidsson, R.; Basili, R.; Demircioglu, M.B.; et al. SHARE Consort. The 2013 European Seismic Hazard Model: Key Components and Results. Bull. Earthq. Eng. 2015, 13, 3553–3596. [Google Scholar] [CrossRef] [Green Version]
  36. Pagani, M.; Garcia-Pelaez, J.; Gee, R.; Johnson, K.; Poggi, V.; Styron, R.; Weatherill, G.; Simionato, M.; Viganò, D.; Danciu, L.; et al. Global Earthquake Model (GEM) Seismic Hazard Map (Version 2018.1—December 2018); GEM Foundation: Pavia, Italy, 2018. [Google Scholar]
  37. Chioccarelli, E.; Cito, P.; Iervolino, I.; Giorgio, M. REASSESS V2.0: Software for single- and multi-site probabilistic seismic hazard analysis. Bull Earthq. Eng. 2019, 17, 1769–1793. [Google Scholar] [CrossRef]
  38. Cornell, C.A. Engineering seismic risk analysis. Bull. Seismol. Soc. Am. 1968, 58, 1583–1606. [Google Scholar]
  39. McGuire, R.K. Fortran Computer Program for Seismic Risk Analysis; US Geological Survey Open-File Report 76–77; US Geological Survey: Denver, CO, USA, 1976.
  40. Ang, A.H.; Tang, W.H. Probability Concepts in Engineering: Emphasis on Applications to Civil and Environmental Engineering; John Wiley Sons: New York, NY, USA, 2006. [Google Scholar]
  41. Bazzurro, P.; Cornell, C.A. Disaggregation of seismic hazard. Bull. Seismol. Soc. Am. 1999, 89, 501–520. [Google Scholar]
  42. McGuire, R.K. Probabilistic seismic hazard analysis and design earthquakes: Closing the loop. Bull. Seismol. Soc. Am. 1995, 85, 1275–1284. [Google Scholar]
  43. Pavić, G.; Hadzima-Nyarko, M.; Bulajić, B. A Contribution to a UHS-based Seismic Risk Assessment in Croatia—A Case Study for the City of Osijek. Sustainability 2020, 12, 1796. [Google Scholar] [CrossRef] [Green Version]
  44. Pavić, G.; Hadzima-Nyarko, M.; Bulajić, B.; Jurković, Ž. Development of Seismic Vulnerability and Exposure Models—A Case Study of Croatia. Sustainability 2020, 12, 973. [Google Scholar] [CrossRef] [Green Version]
  45. Ruan, B.; Zhao, K.; Wang, S.-Y.; Chen, G.-X.; Wang, H.-Y. Numerical modeling of seismic site effects in a shallow estuarine bay (Suai Bay, Shantou, China). Eng. Geol. 2019, 260, 105233. [Google Scholar] [CrossRef]
  46. Derras, B.; Bard, P.-Y.; Régnier, J.; Cadet, H. Non-linear modulation of site response: Sensitivity to various surface ground-motion intensity measures and site-condition proxies using a neural network approach. Eng. Geol. 2020, 269, 105500. [Google Scholar] [CrossRef]
  47. Bijelić, N.; Lin, T.; Deierlein, G. Quantification of the influence of deep basin effects on structural collapse using SCEC CyberShake earthquake ground motion simulations. Earthq. Spectra 2019, 35, 1845–1864. [Google Scholar] [CrossRef]
Figure 1. (Top left)—Pannonian Basin, (top right)—epicenters of regional earthquakes with Mw ≥ 3 [26], (bottom)—analyzed area and the epicenters of two recent destructive earthquakes and the largest historical earthquake closest to Osijek.
Applsci 11 06296 g001
Figure 3. Empirical GMPE for four different vibration periods, T = 0.05, 0.10, 0.30, and 0.50 s, calculated using Equation (1) and coefficients from Table A1, for deep soil sites (sL = 2) and for different deep geology parameters (s = 2 for geological rock sites, s = 1 for intermediate geological surroundings, and s = 0 for geological sediments). The solid lines represent median empirical predictions based on coefficients created for all source-to-site distances, whereas the dashed lines represent predictions based on coefficients developed for distances less than 30 km.
Applsci 11 06296 g003
Figure 4. Median, median ± 1 σlog, and median ± 2 σlog (shaded area) empirical PSA estimates for the deep soil sites (sL = 2), and median estimates for rock soil (sL = 0) and stiff soil (sL = 1) sites.
Applsci 11 06296 g004
Figure 5. Correlation between regional horizontal pseudo-acceleration spectra recorded at deep soil sites (sL = 2) and the empirical predictions of Equation (1) and the coefficients in Table A2.
Applsci 11 06296 g005
Figure 6. Boundaries of the seismic source zones used in the hazard calculations. Circles around the analyzed area show maximum radii for capturing 99% or 50% accuracy of the Tr = 475 years PSA estimations for vibration periods of 0.05, 0.3, and 0.5 s.
Applsci 11 06296 g006
Figure 7. Examples of seismic hazard disaggregation for the location with coordinates 45°32′ N, 18°23′ E (see the full circles in Figure 9).
Applsci 11 06296 g007
Figure 8. Cumulative disaggregation examples for distance and magnitude, and the magnitude recurrence curve for the most contributing seismic source zone around Osijek.
Applsci 11 06296 g008
Figure 9. Seismic hazard maps for 6 different PSA amplitudes and probabilities of exceedance of 10% in 10 years (6 top-left plots), 10% in 50 years (6 top-right plots), 5% in 10 years (6 bottom-left plots), and 2% in 50 years (6 bottom-right plots). The site chosen for UHS and disaggregation calculations is shown by full circles.
Applsci 11 06296 g009
Figure 10. The uniform hazard spectra calculated for the coordinates 45°32′ N, 18°23′ E for four different probability levels, and the Eurocode 8 [16] Type 2 spectra for ground type C.
Applsci 11 06296 g010
Table 1. Maximum amplitudes of horizontal pseudo-absolute acceleration spectra PSA and corresponding vibration periods, T, for different ground types according to Eurocode 8 [16]; ag represents the horizontal PGA value obtained from the accompanying seismic hazard map.
Eurocode 8 [16]
Ground Types
Type 1 Spectrum: “Most Contributing” Earthquakes with MS > 5.5Type 2 Spectrum: “Most Contributing” Earthquakes with MS ≤ 5.5
A,
VS,30 > 800 m/s
Rock, at the surface up to 5 m of weaker material.
ag × 2.5
0.15 s ≤ T ≤ 0.40 s
ag × 2.5
0.05 s ≤ T ≤ 0.25 s
Ground type B,
VS,30 = 360–800 m/s
At least several tens of meters thick deposits. Very dense sand, gravel, or very stiff clay.
ag × 1.2 × 2.5
0.15 s ≤ T ≤ 0.50 s
ag × 1.35 × 2.5
0.05 s ≤ T ≤ 0.25 s
Ground type C,
VS,30 = 180–360 m/s
Deep deposits, several tens of meters up to hundreds of meters thick. Dense or medium dense sand, gravel, or stiff clay.
ag × 1.15 × 2.5
0.20 s ≤ T ≤ 0.60 s
ag × 1.5 × 2.5
0.10 s ≤ T ≤ 0.25 s
Ground type D,
VS,30 < 180 m/s
Deposits. Loose-to-medium cohesionless soil or predominantly soft-to-firm cohesive soil.
ag × 1.35 × 2.5
0.20 s ≤ T ≤ 0.80 s
ag × 1.8 × 2.5
0.10 s ≤ T ≤ 0.30 s
Ground type E
Alluvium layer at the surface, between 5 and 20 m thick, above stiffer material. VS,30 < 360 m/s.
ag × 1.4 × 2.5
0.15 s ≤ T ≤ 0.50 s
ag × 1.6 × 2.5
0.05 s ≤ T ≤ 0.25 s
Table 2. The categorical variables employed in this study’s scaling equations for various types of shallow and deep geological site surroundings.
Shallow Geology
Categorical Variables
Shallow
Geology Type
Deep Geology Categorical VariablesDeep
Geology Type
SL1 = SL2 = 0“Rock” soil:
sL = 0
SG1 = SG2 = 0Basement (geological) rock: s = 2
SL1 = 1
and SL2 = 0
Stiff soil:
sL = 1
SG1 = 1
and SG2 = 0
Intermediate
sites: s = 1
SL1 = 0
and SL2 = 1
Deep soil:
sL = 2
SG1 = 0
and SG2 = 1
Deep geological sediments: s = 0
Publisher’s Note: MDPI stays neutral with regard to jurisdictional claims in published maps and institutional affiliations.

