Article

Vertical to Horizontal UHS Ratios for Low to Medium Seismicity Regions with Deep Soil atop Deep Geological Sediments—An Example of the City of Osijek, Croatia

by
Borko Đ. Bulajić
1,
Marijana Hadzima-Nyarko
2,* and
Gordana Pavić
2
1
Faculty of Technical Sciences, University of Novi Sad, Trg Dositeja Obradovića 6, 21000 Novi Sad, Serbia
2
Faculty of Civil Engineering and Architecture Osijek, Josip Juraj Strossmayer University of Osijek, Vladimira Preloga 3, 31000 Osijek, Croatia
*
Author to whom correspondence should be addressed.
Submission received: 18 June 2021 / Revised: 21 July 2021 / Accepted: 21 July 2021 / Published: 23 July 2021
(This article belongs to the Special Issue Seismic Geotechnical Hazards Studies)

Abstract

:
The severity of vertical seismic ground motions is often factored into design regulations as a component of their horizontal counterparts. Furthermore, most design codes, including Eurocode 8, ignore the impact of local soil on vertical spectra. This paper investigates vertical pseudo-absolute acceleration spectral estimates, as well as the ratios of spectral estimates for strong motion in vertical and horizontal directions, for low to medium seismicity regions with deep local soil and deep geological sediments beneath the local soil. The case study region encompasses the city of Osijek in Croatia. New regional frequency-dependent empirical scaling equations are derived for the vertical spectra. According to these equations, for a 0.3 s spectral amplitude at deep soils atop deep geological sediments compared to the rock sites, the maximum amplification is 1.48 times. The spectra of vertical components of various real strong motions recorded in the surrounding region are compared to the empirical vertical response spectra. The new empirical equations are used to construct a Uniform Hazard Spectra for Osijek. The ratios of vertical to horizontal Uniform Hazard Spectra are generated, examined, and compared to Eurocode 8 recommendations. All the results show that local soil and deep geology conditions have a significant impact on vertical ground motions. The results also show that for deep soils atop deep geological strata, Eurocode 8 can underestimate the vertical to horizontal spectral ratios by a factor of three for Type 2 spectra while overestimating them by a factor of two for Type 1 spectra.

1. Introduction

In Croatia, as in many other countries, vertical design ground motions are calculated based on the horizontal design ground motions and do not depend on the soil conditions. In Eurocode 8 [1], which is in use in Croatia [2], vertical design Peak Ground Acceleration (hereinafter, PGA) values are determined by multiplying the horizontal PGA values spectra defined for the “rock” ground type (type A) by a constant. This scaling constant changes according to the predominant magnitudes; it is equal to 0.9 for Eurocode 8 Type 1 spectra (magnitudes larger than 5.5) and 0.45 for Type 2 spectra (magnitudes equal to or smaller than 5.5). In both cases, vertical pseudo-absolute acceleration spectra (hereinafter, PSAvert) are the same for all ground types that are considered in Eurocode 8 [1]. In other words, the Eurocode 8 approach for vertical PGA assumes that seismic wave amplification happens only horizontally and not vertically. This concept underpins the so-called H/V methodology for calculating the natural period of soil vibrations based on microtremors, as suggested by Nogoshi and Igarashi [3] and later popularized by Nakamura [4,5,6]. However, many studies have demonstrated that this methodology does not always provide realistic results for local soil vibration periods [7,8,9,10,11]. The initial purpose of this research is to determine the amplification (or de-amplification) impacts of deep soil atop deep geological sediments on vertical PSA spectra. The term “deep soil” will refer to the geotechnical site description on the scale of several tens of meters, in this case to sites with more than 100 m of softer soil layers above the first layer with an average shear wave velocity of more than 800 m/s [12,13]. The term “deep geological sediments” will refer to geological settings on the scale of a few kilometers or at least hundreds of meters [14].
Vertical to horizontal PSA ratios obtained in this study will be compared to the ratios defined in two different sets of empirical Ground Motion Prediction Equations (hereinafter, GMPEs). The first set was created for California [15], and these were the only GMPEs we could find that consider the simultaneous impacts of deep geological sediments and deep local soil on the vertical spectra. The second set [16] was created for the former Yugoslavia and is used to compare the vertical and horizontal spectral ratios in deep geological sediments only, as these GMPEs do not consider the effects of deep soils.
In this paper, we first develop regional frequency-dependent empirical attenuation equations that consider deep soil sites, then we generate probabilistic seismic hazard PSAvert estimates and compare them to Eurocode 8 spectra, and finally compare the vertical and the horizontal PSA ratios to the ratios suggested by other authors and Eurocode 8 [1]. In addition, seismic hazard maps for the various vibration periods and exceedance probabilities are created. Figure 1 depicts a research framework diagram for this study.
This research builds on our previous work [17,18] on the severity of surface ground motion in low to medium seismicity regions with deep soils atop deeper geological strata. We chose the city of Osijek, Croatia for the case study region since it is in the low to medium seismicity region of the Pannonian basin (see Figure 2 in our accompanying paper on the horizontal spectra [18]). Osijek is also an example of an area where deep geological deposits are found beneath deep soil sites. In our study in [17], we found that vertical PGA is de-amplified by 10% at deep soil sites compared to rock soil sites and ~15% at deep geological sediments compared to geological rocks. This study will now focus on PSAvert.
Furthermore, in Eurocode 8 [1], the maximum spectral amplitudes are equal to the product of the vertical PGA and a constant value of 3.0. Another purpose of this study is to examine if this spectral acceleration factor provides realistic PSAvert estimates. We will also examine the ratios of the vertical to horizontal spectra. Table 1 presents the formulas for computing vertical to horizontal PSA ratios for Ground Type C using the spectra of Types 1 and 2 of Eurocode 8 [1]. As can be seen, the vertical to horizontal PSA ratio changes non-linearly with the vibration period, T, with a general tendency to become lower with T. For short periods, the so-called damping correction factor, η, also influences this ratio.
The GMPEs that will be generated in this study will account for the effects of deep soils and deep geological sediments on the vertical spectra, which is a unique feature of this research. Most other GMPEs for vertical spectra only address local soil conditions via the VS,30 parameter [19,20,21,22,23]. However, strong motion predictions based on scaling equations that account for local soil conditions (up to depths of 100 m and more) as well as deep geology, have been proven to be very accurate when compared to recorded ground motions and observed intensities in the north-western Balkans [24,25]. In addition, a series of recent regional seismic microzonation studies [26,27,28,29,30,31] found that changes in deep geological site conditions can considerably increase seismic hazard estimates when compared to hazard estimates based simply on local soil effects.

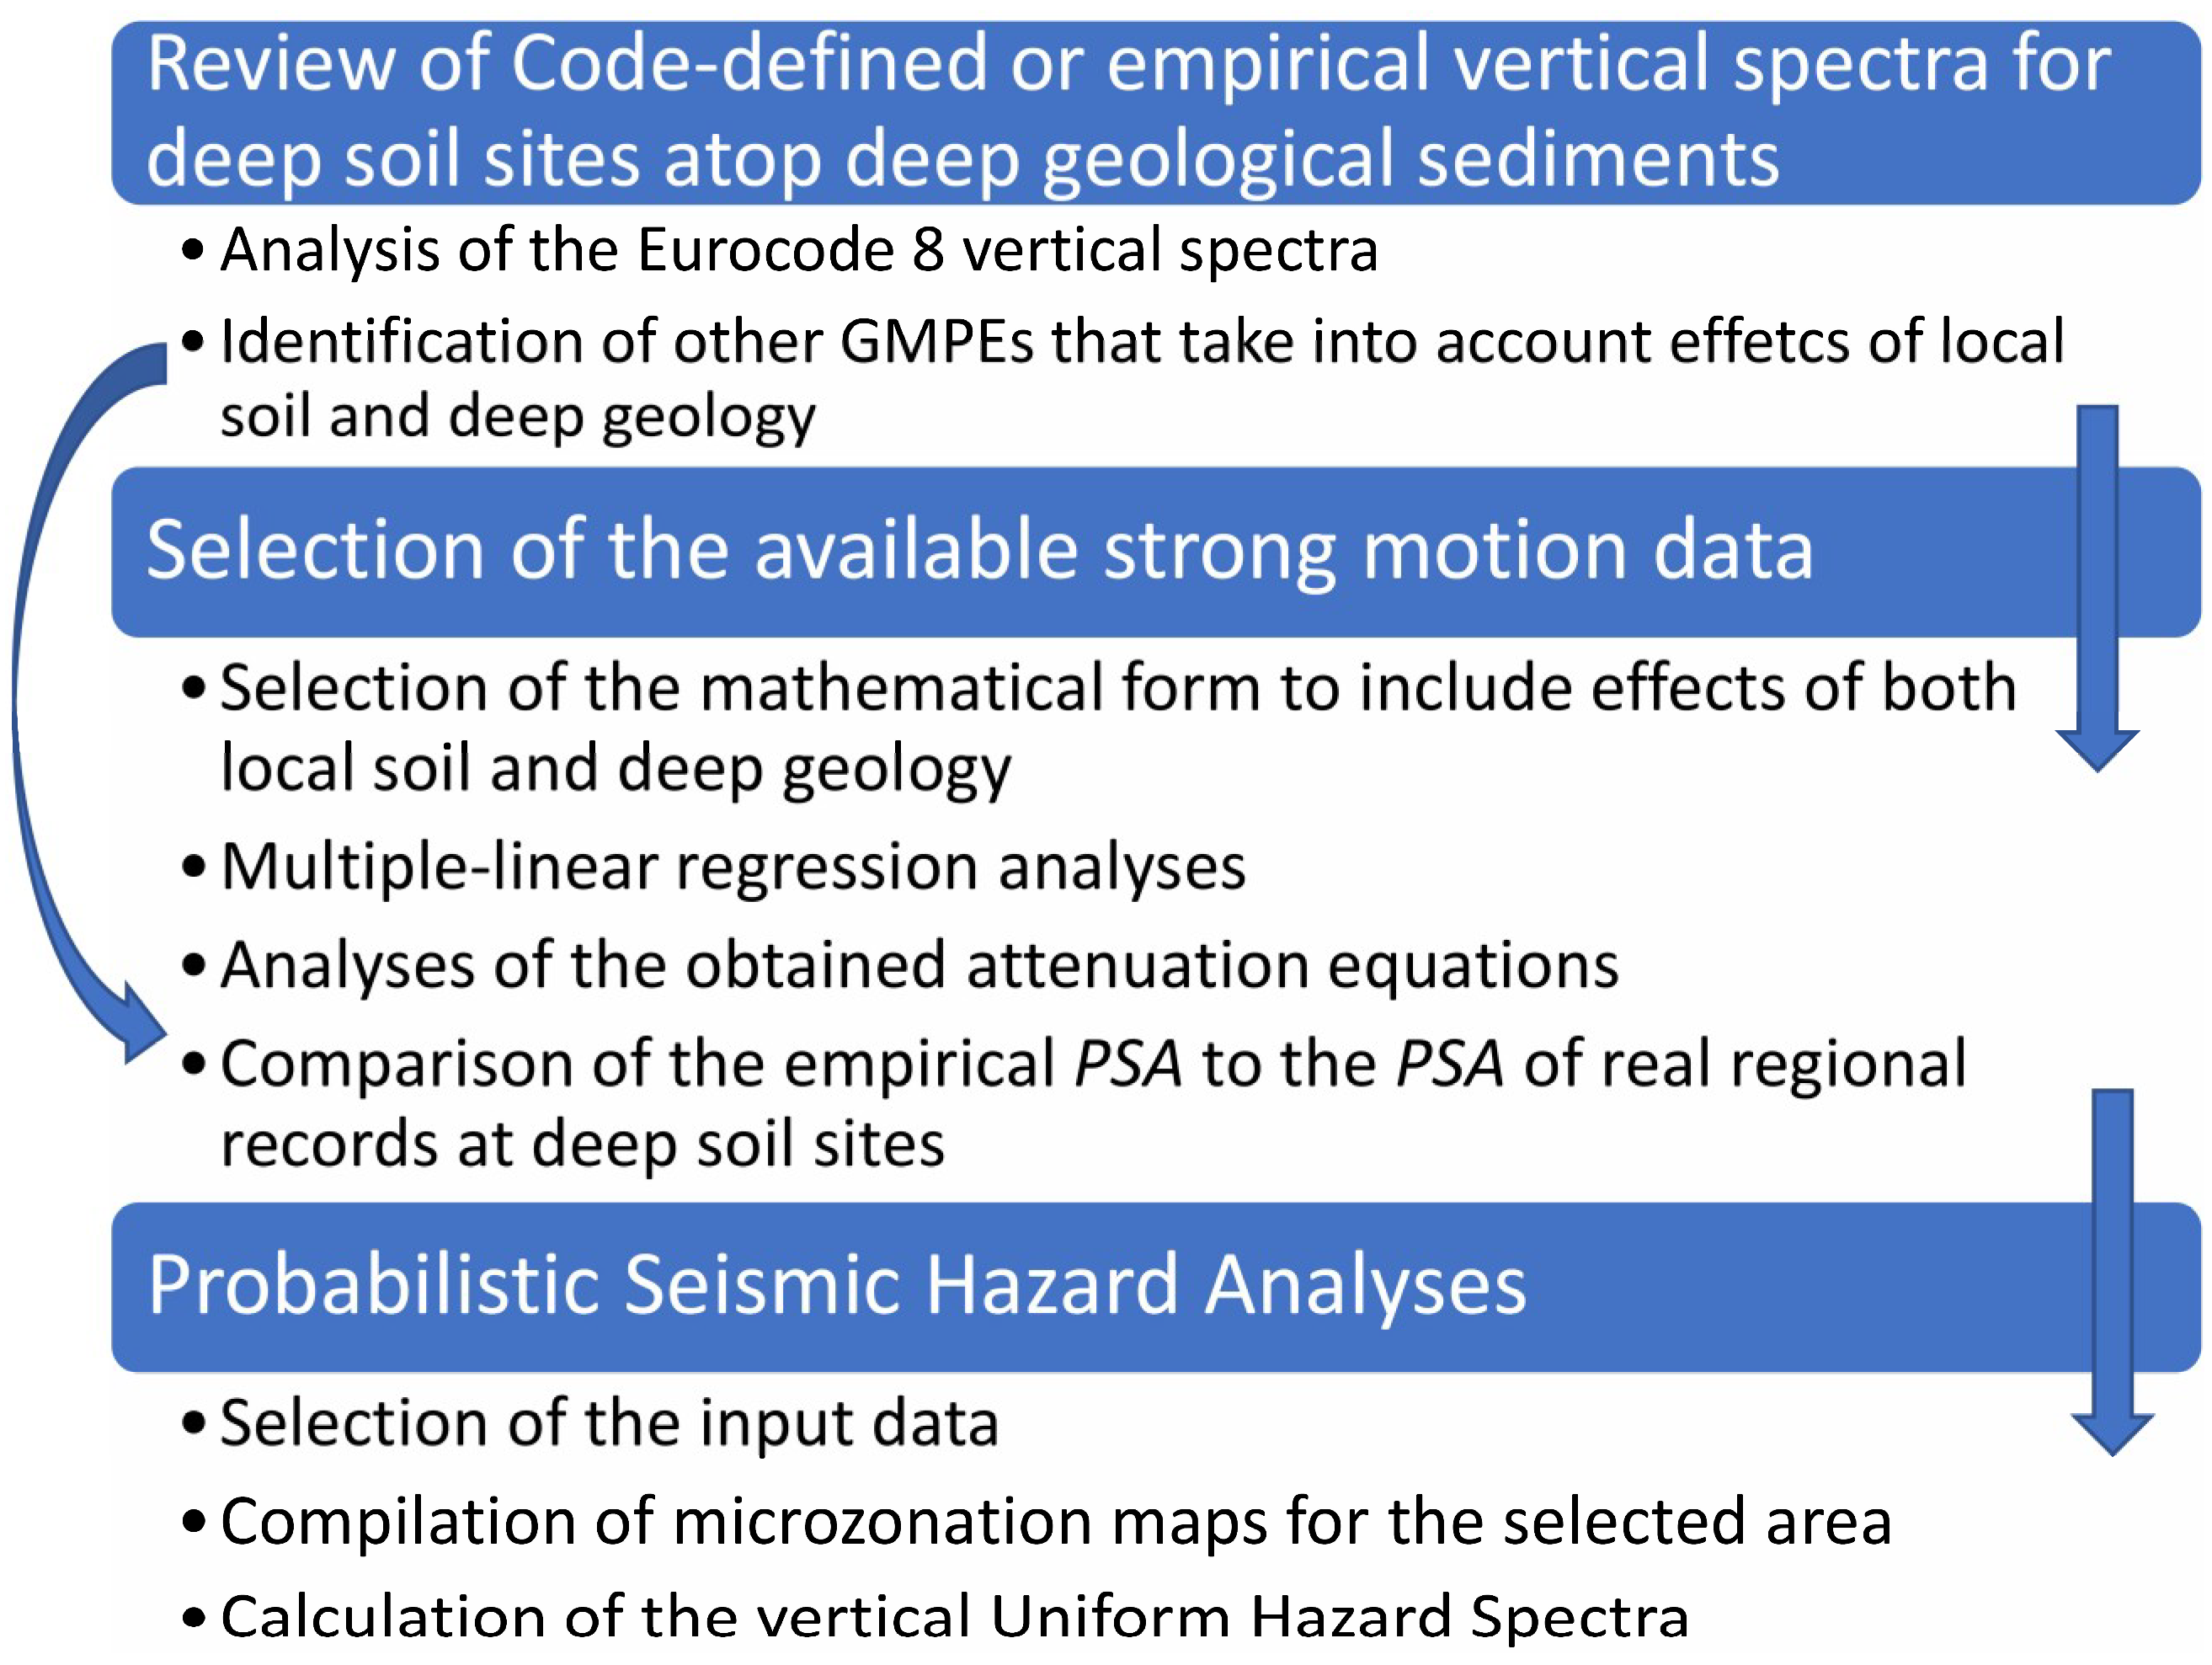
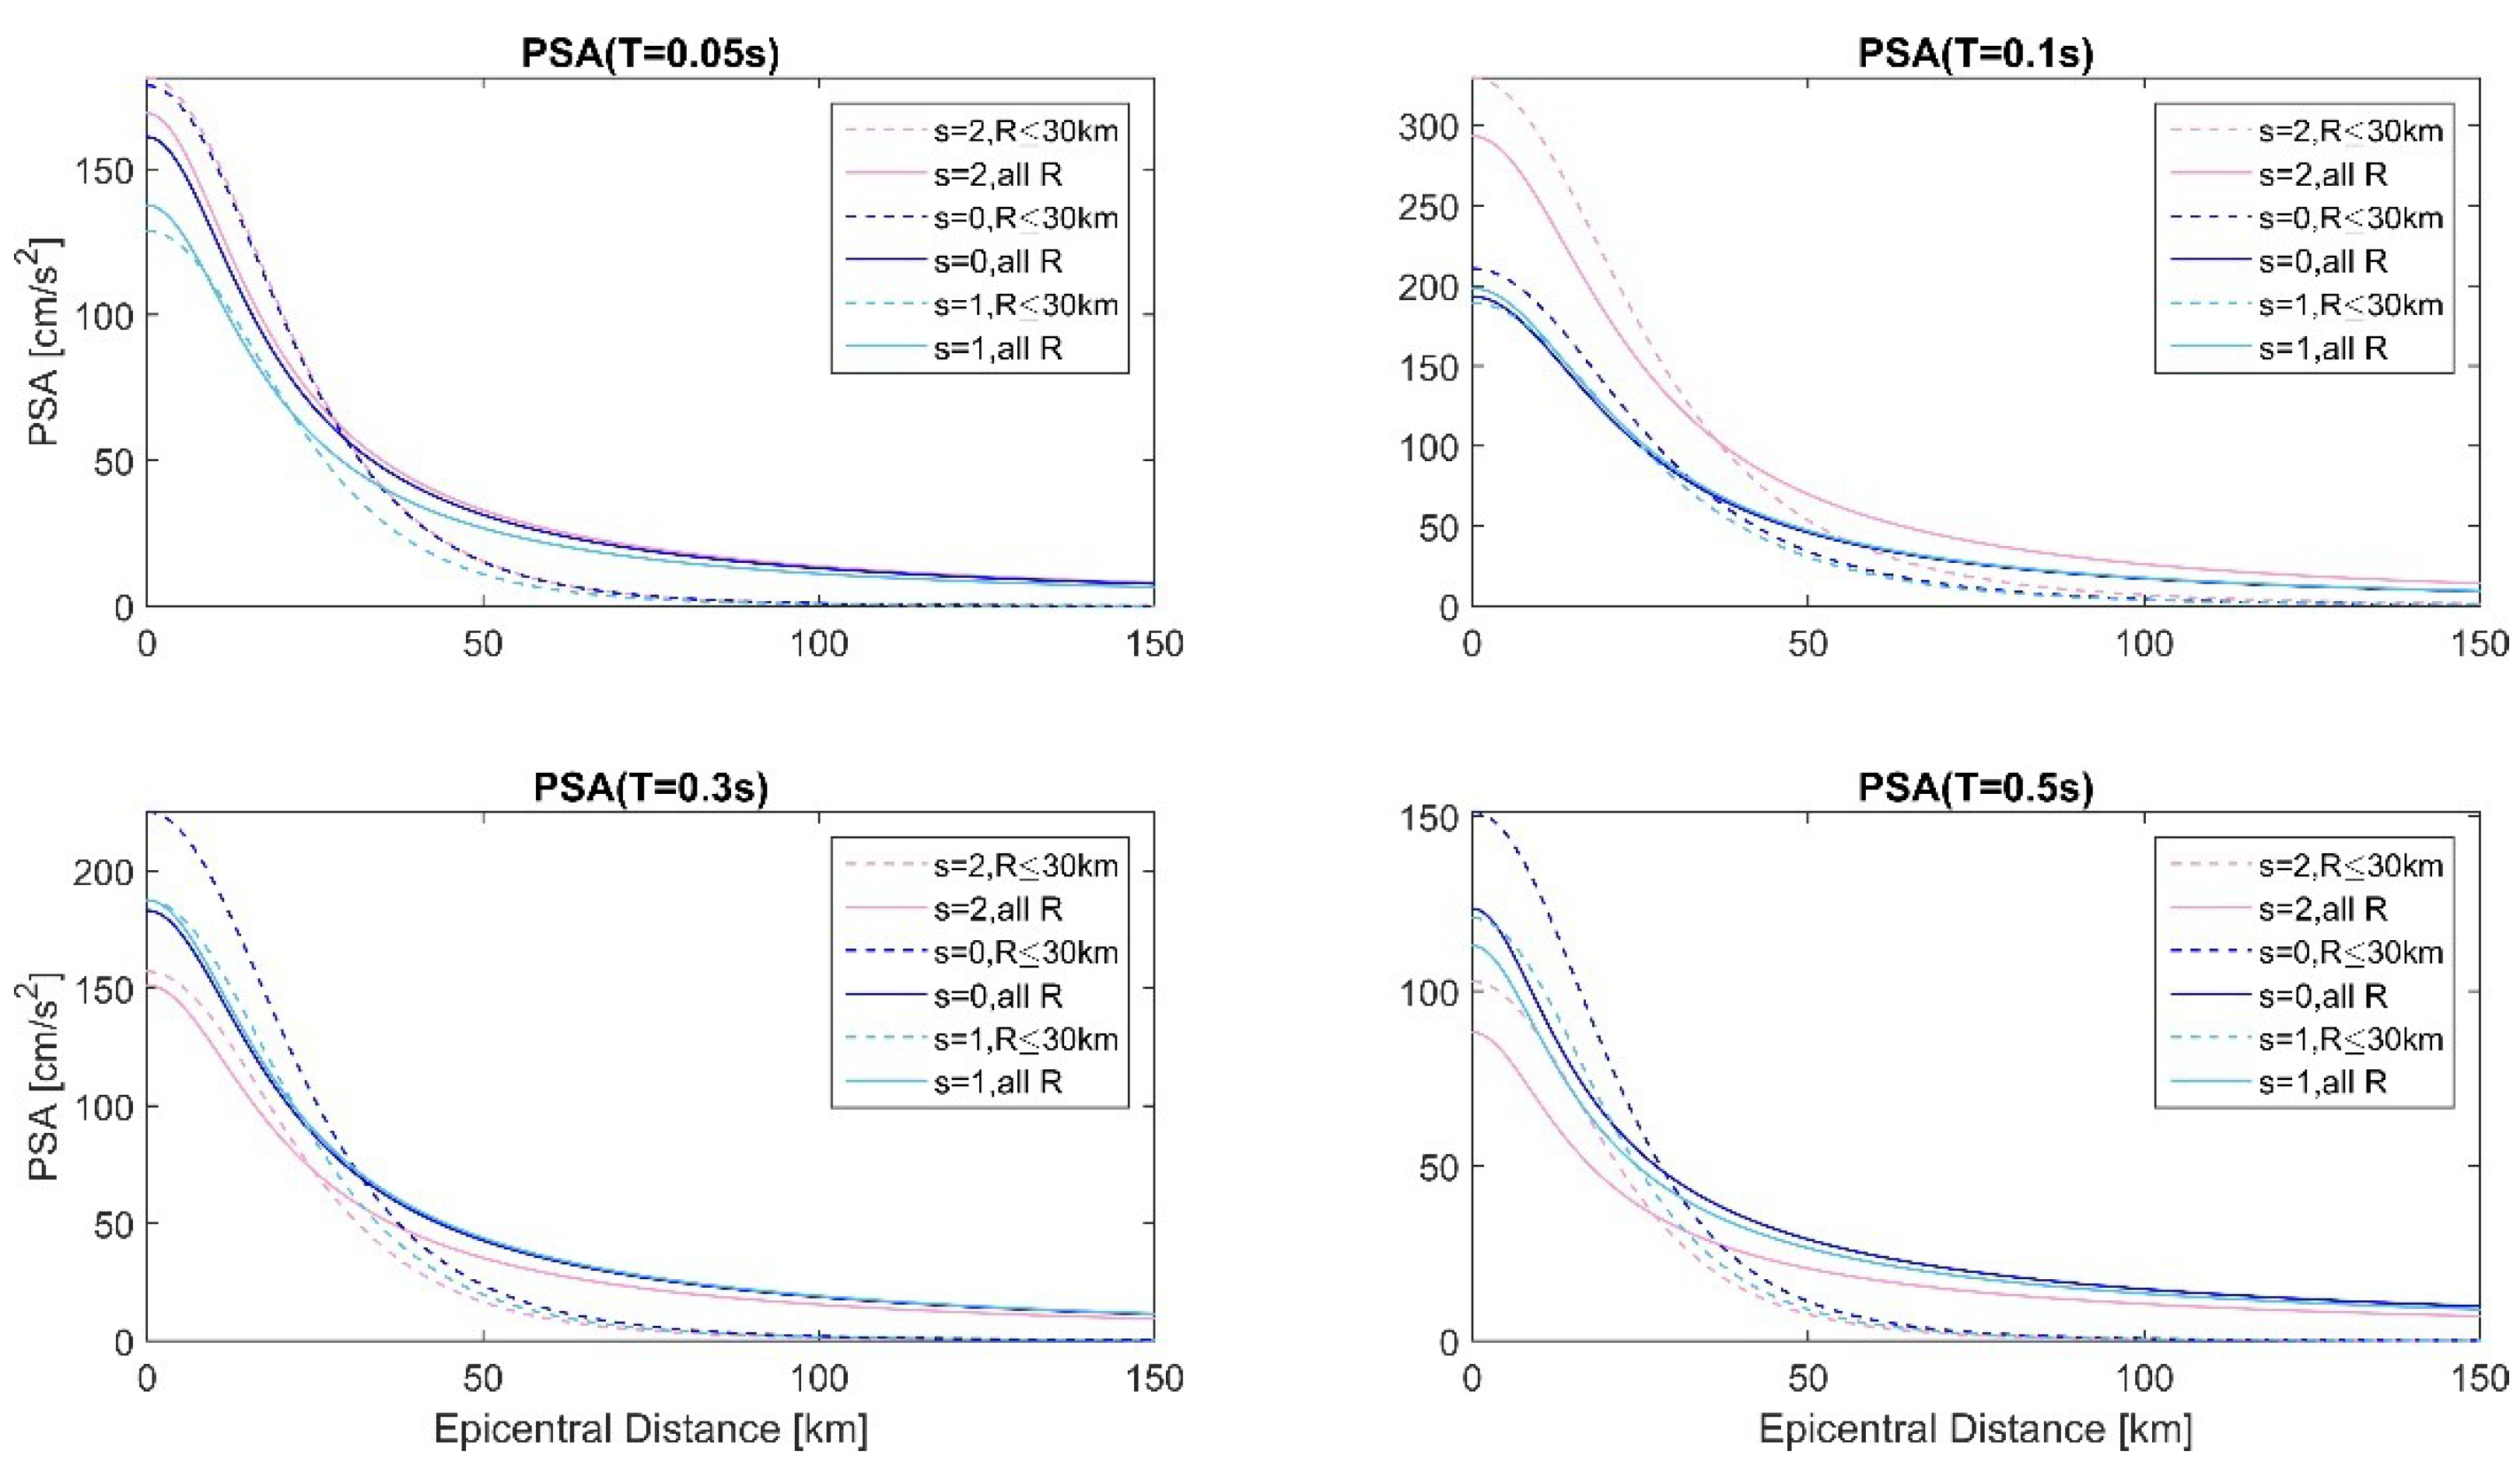
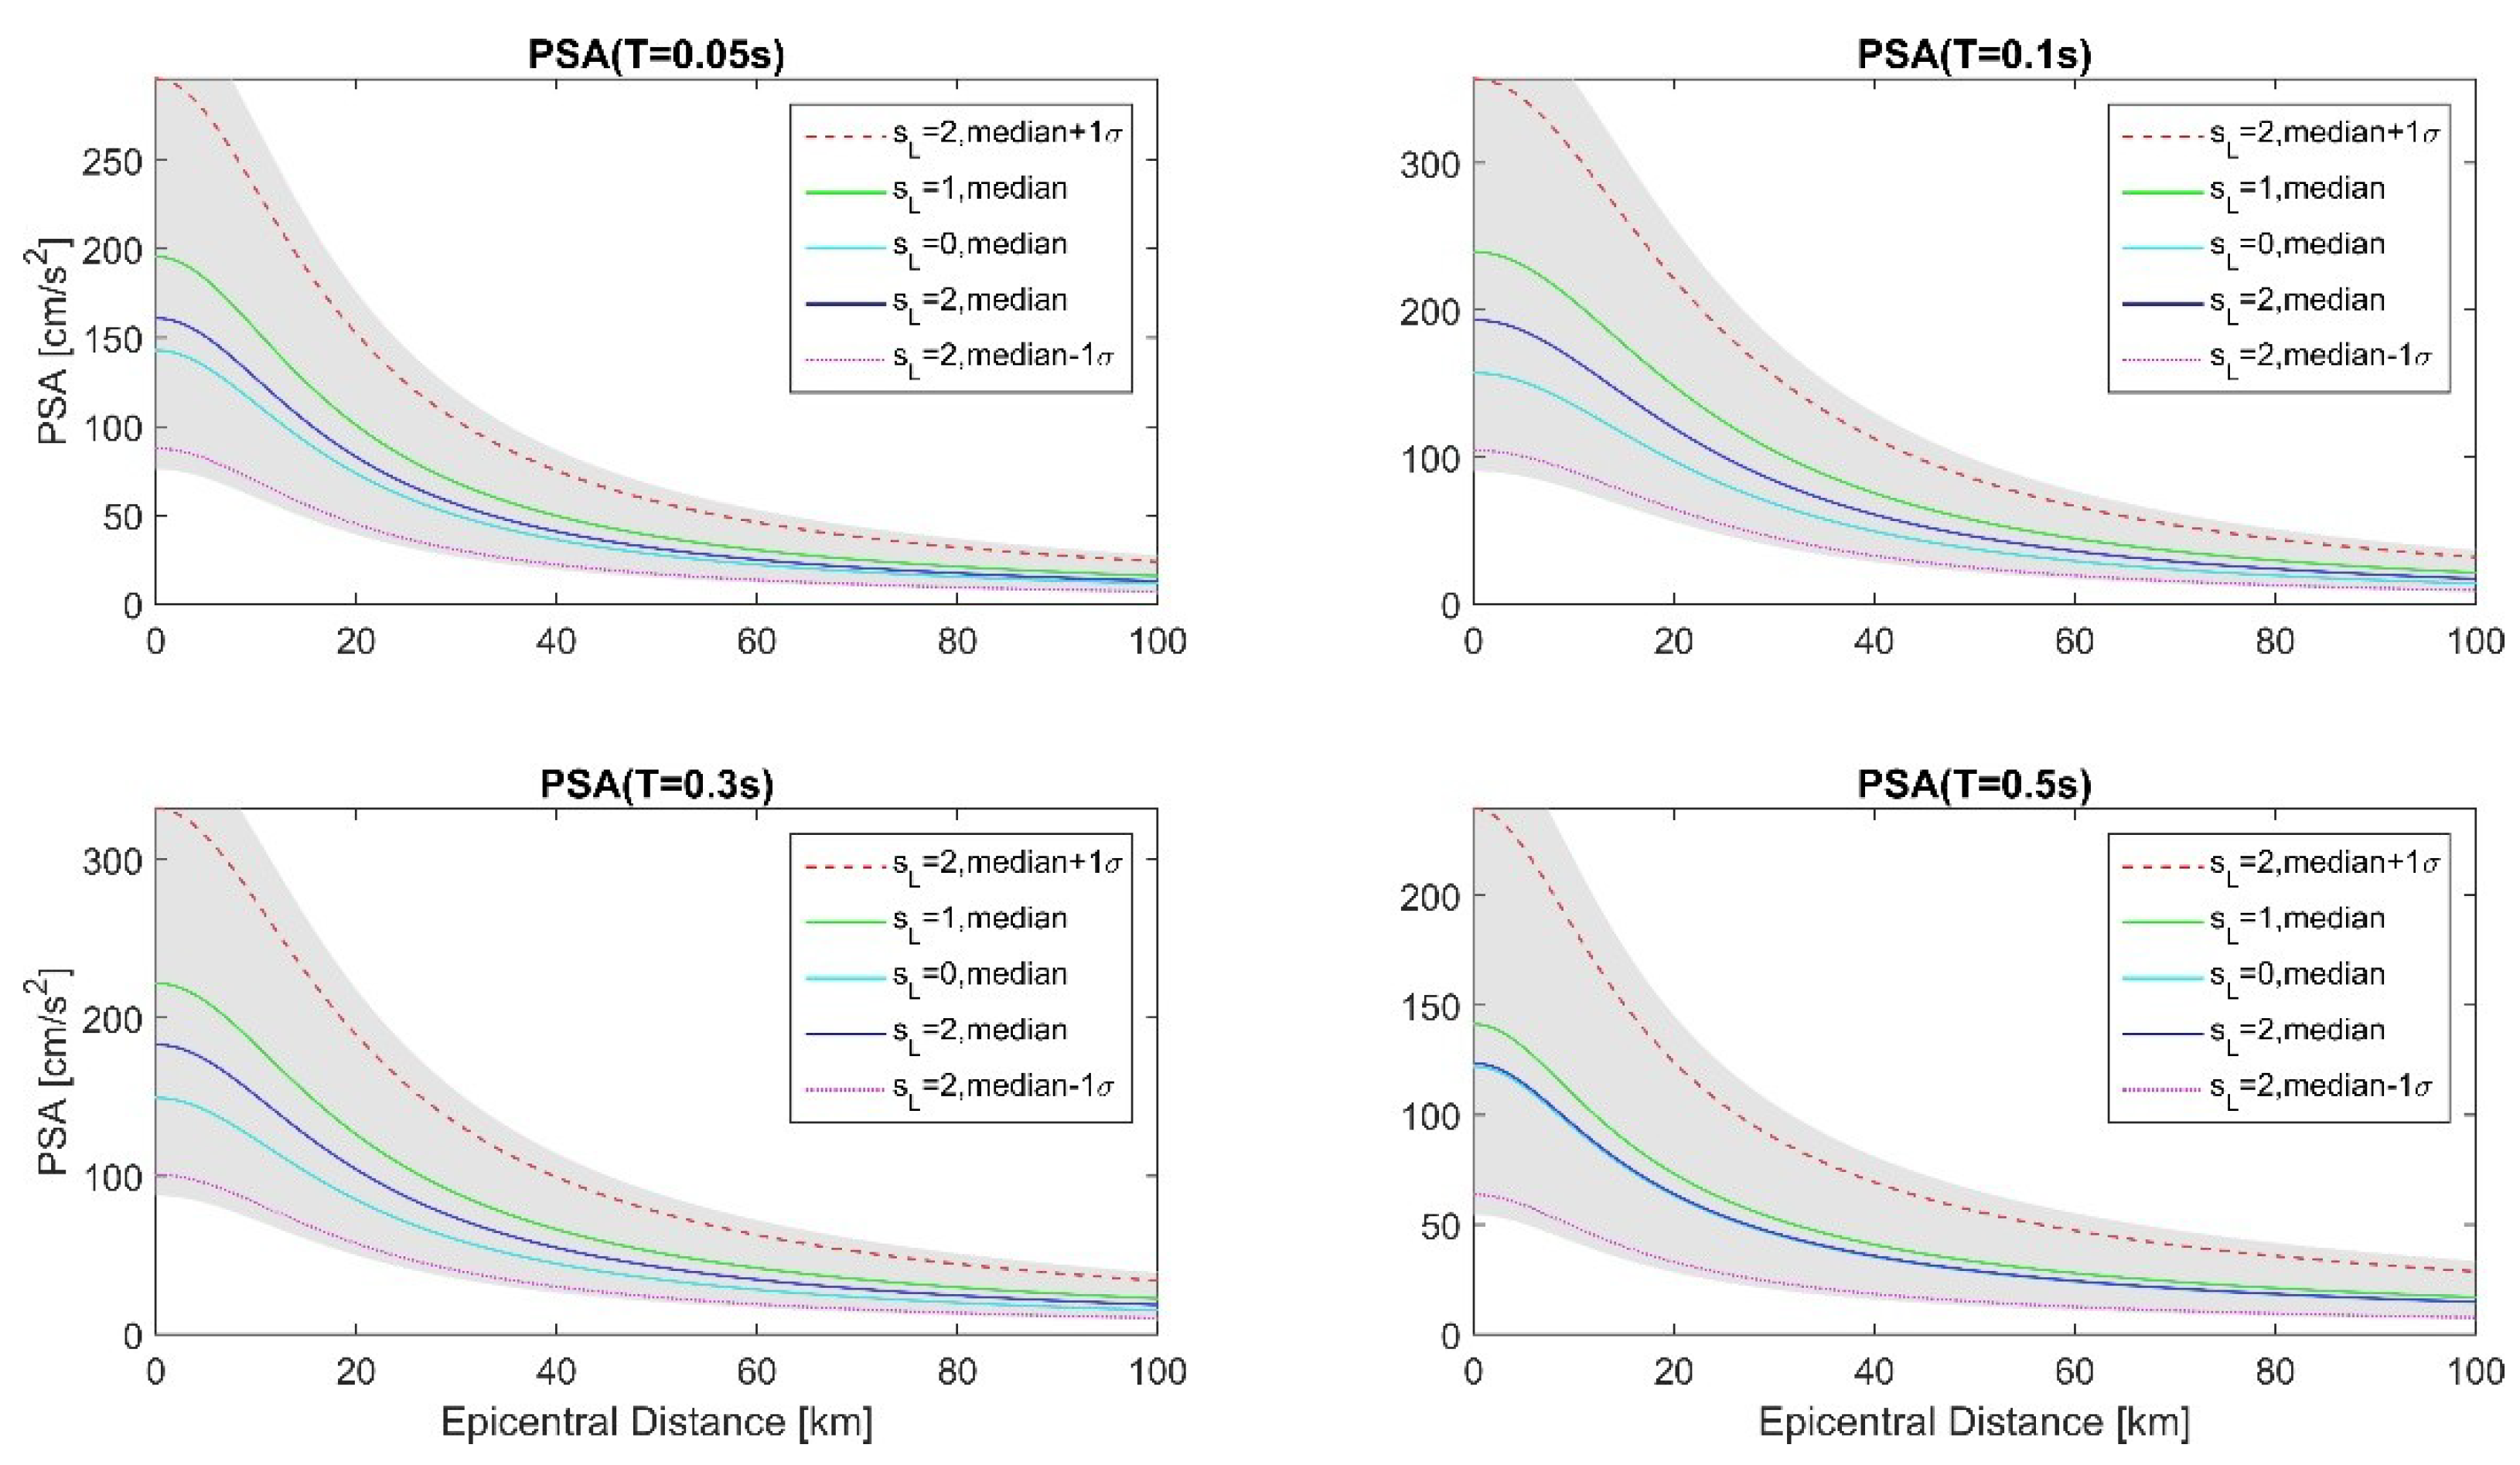
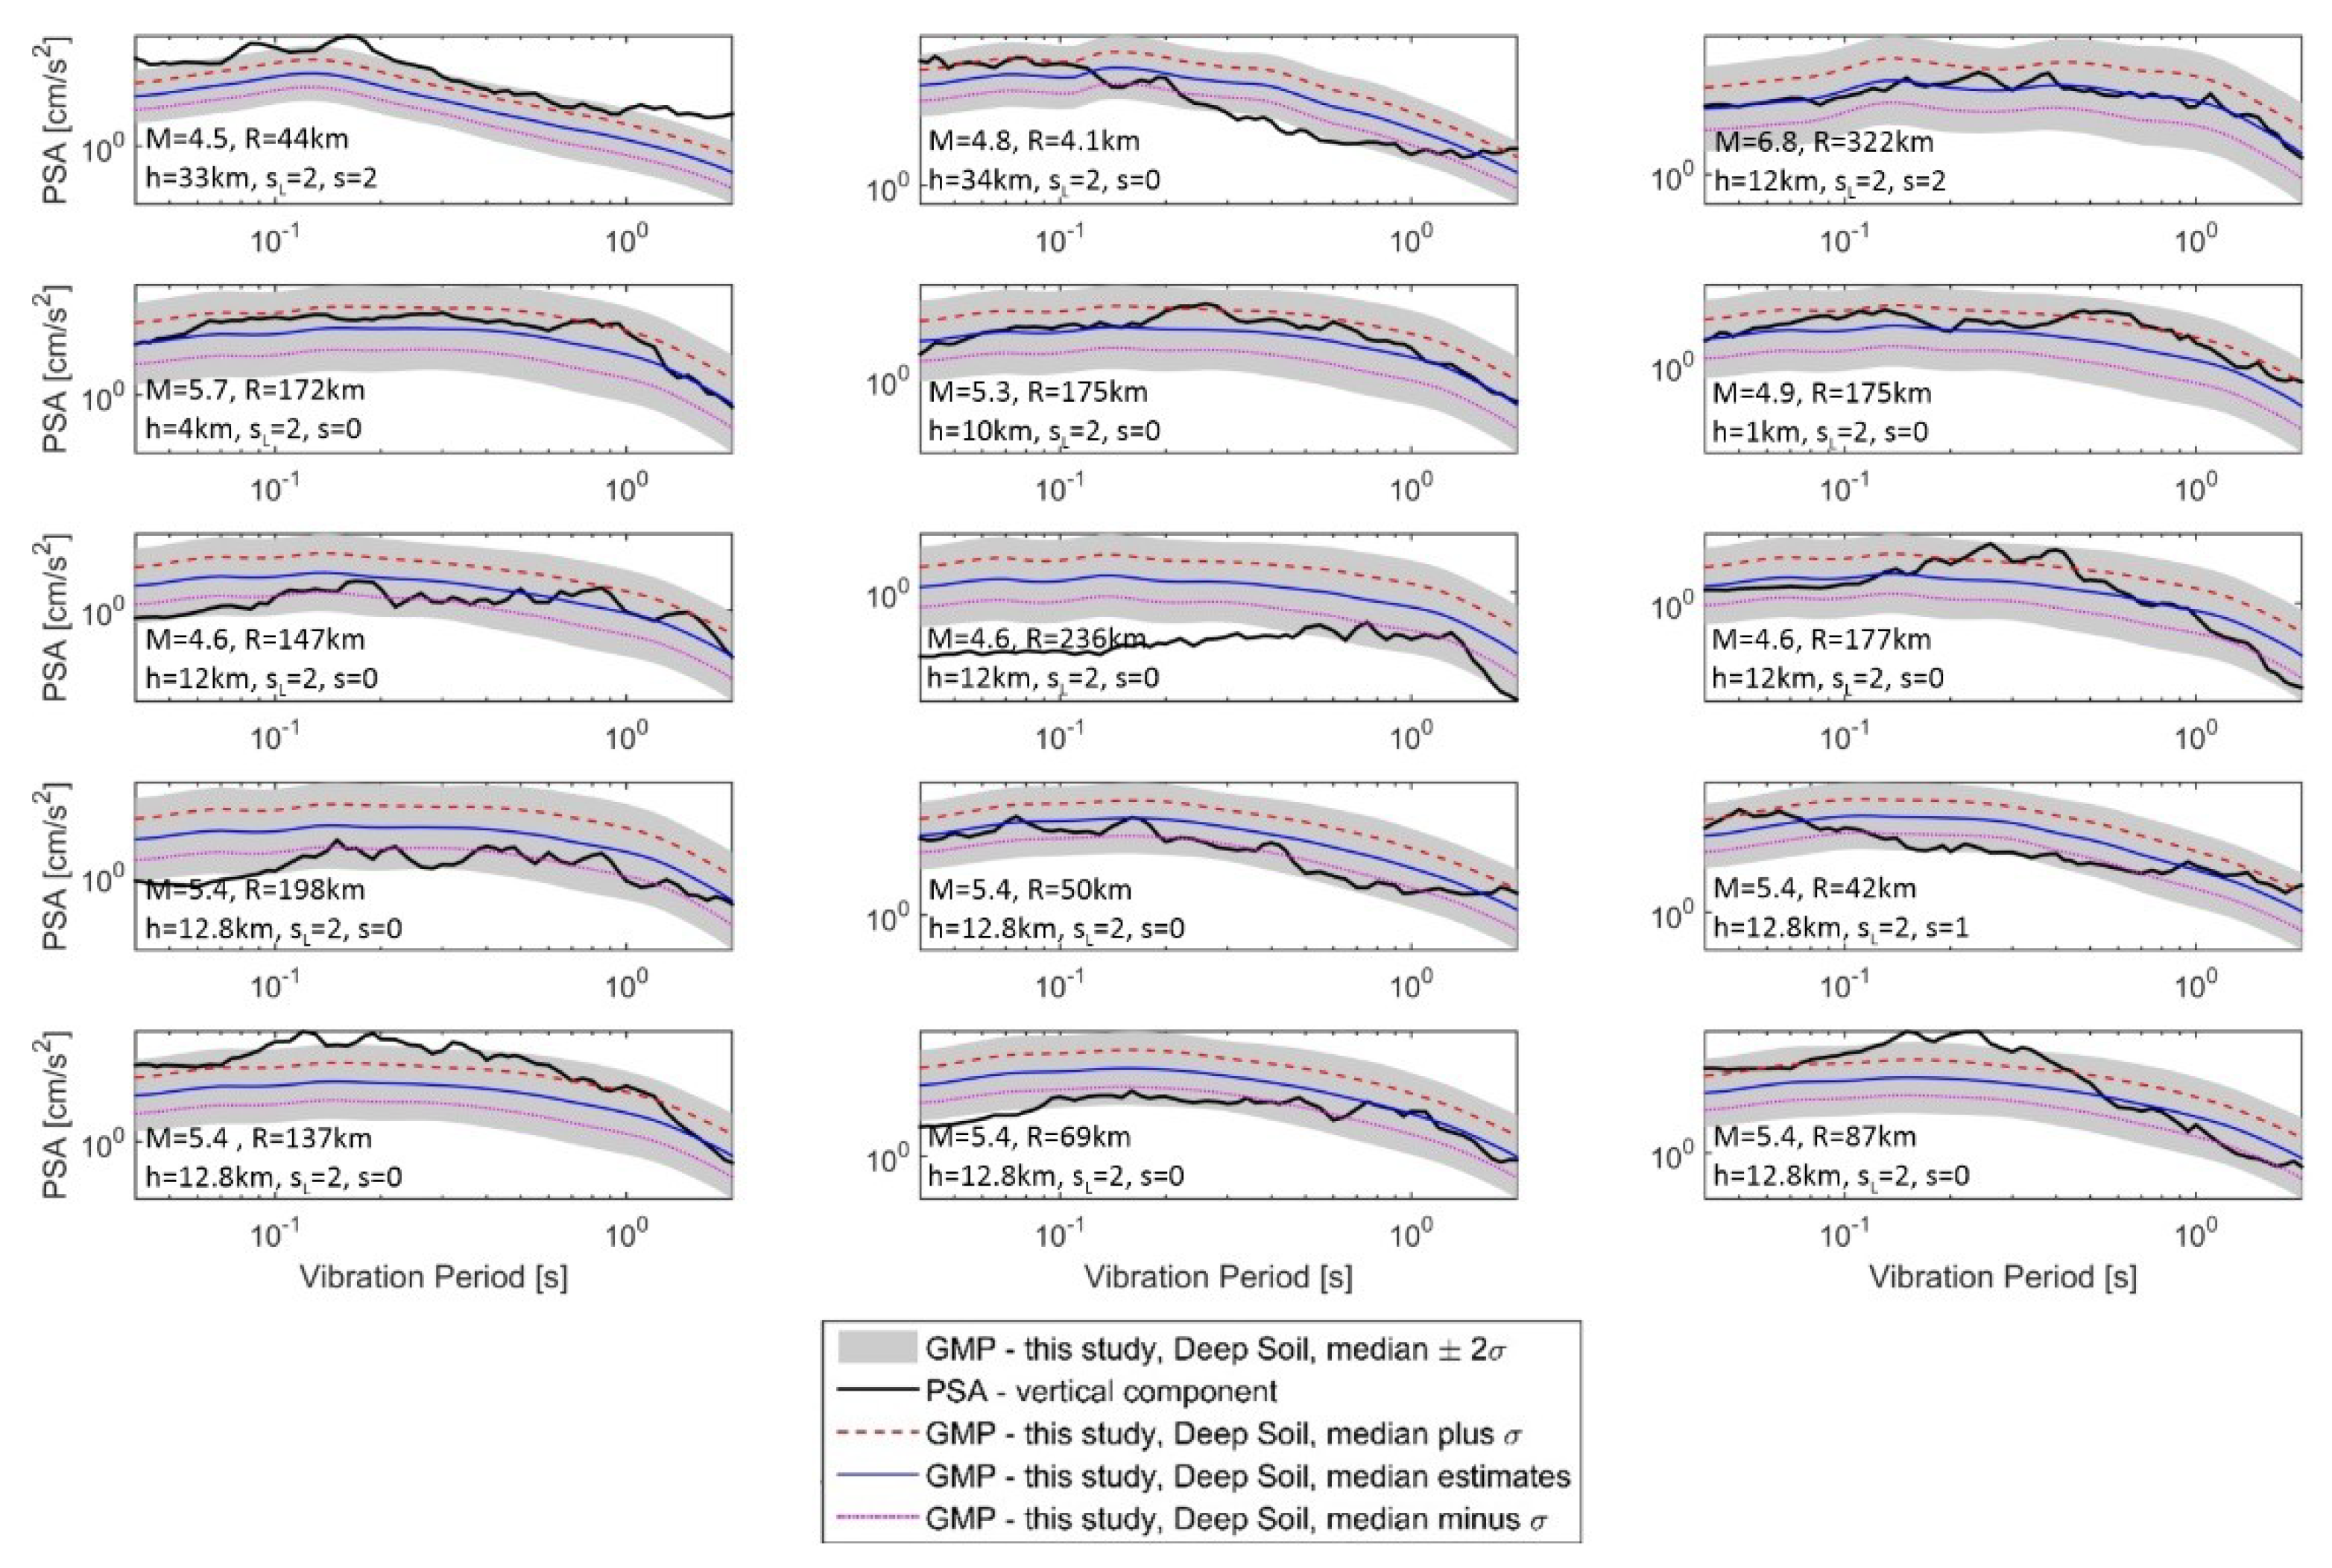
2. Empirical Frequency-Dependent Scaling Equations for Vertical Ground Motion

We start with the development of new empirical formulae for estimating vertical PSA values that can be used for deep soil sites atop deep geological deposits. The following mathematical form will be used to express the attenuation equations:
l o g [ P S A v e r t ( T ) ] = c 1 ( T ) + c 2 ( T ) M + c 3 ( T ) l o g ( R 2 + R 0 ( T ) 2 ) + c 4 ( T ) S L 1 + c 5 ( T ) S L 2 + c 6 ( T ) S G 1 + c 7 ( T ) S G 2 + σ l o g ( T ) P 1
where PSAvert(T) denotes the amplitudes of the vertical pseudo-absolute acceleration spectrum for a 5 percent viscous damping ratio, T is the vibration period of an undamped single-degree-of-freedom oscillator, M is the earthquake magnitude, and SL1 and SL2 (the local soil categorical variables) are 0 for the rock soil sites (further denoted as SL = 0), SL1 = 1 and SL2 = 0 for stiff soil (SL = 1), and SL1 = 0 and SL2 = 1 for deep soil (SL = 2). It should be noted that in this equation, local soil (i.e., shallow geology) is classified by Seed et al. [12,13], while deep geology is separated into three categories using Trifunac and Brady’s [14] classification: (i) geological rock (further denoted as S = 2) with the corresponding categorical variables SG1 and SG2 equal to 0; (ii) deep geological sediments (S = 0) with SG1 = 0 and SG2 = 1; and (iii) intermediate (or complex) geological site surroundings (S = 1) for which SG1 = 1 and SG2 = 0. The unknown parameters resulting from the regression analysis are the coefficients c1 through c6. Table 2 displays the coefficients c1 to c6 that can be used to predict the PSAvert values for various vibration periods. The regression analyses were conducted on the assumption that the studied data had a log-normal distribution. The standard deviation of the logarithm of PSAvert(T) is denoted by σ l o g ( T ) , where p = 0 for median estimations and p = 1 for median plus one standard deviation estimations. Finally, R stands for hypocentral or epicentral distance, and R0(T) was iteratively calculated for each PSA(T) to minimize the standard deviation in the related prediction equation.
The employed strong motion database comprises 218 vertical components of accelerograms obtained in the north-western Balkans from 112 earthquakes with magnitudes between 3 and 6.8. The majority (209) occurred between 1976 and 1987, with the remainder (9) occurring between 2010 and 2011. 203 are from the EQINFOS database [32] and 6 are from the ISESD database for the period 1976–1987 [33,34]. The Seismological Survey of Serbia used an accelerograph network to collect remaining 9 data in 2010 [35]. Because the majority of the accelerograms had a low signal-to-noise ratio for T > 2 s [16,36], most of the records were high-pass filtered with a relatively large corner frequency, and the results for T > 2 s are unreliable. Hence, we calculated scaling coefficients up to a 2 s vibration period. Bulajić et al. [17,24] provide more information on the used data.
The MATLAB® function “regress” was used to perform two-phase multiple linear regression analyses, the first of which consisted of fitting the Equation (1) model to a dataset that only included 203 vertical acceleration components from the EQINFOS database [32], for which Trifunac et al. [37] established the soil categorization of the recording locations. Because there were no deep soil sites among the 203 components, we fitted Equation (1) without the coefficient c5. To lower the root mean squared error, the R0 values were adjusted iteratively. We ran a secondary analysis using only data gathered at epicentral distances of less than 30 km because the major portion of the data was obtained across short distances. We calibrated the resultant prediction model in the second phase by calculating the coefficient c5 based on the additional 15 vertical acceleration components only observed at deep soil sites (again via linear regression).
Table 2 shows the calculated scaling coefficients for Equation (1) with R as the epicentral distance, based on the data recorded at all distances. Table 3 shows the calculated coefficients for Equation (1) with R as the hypocentral distance.
Figure 1 and Figure 3 show the attenuation with the distance of PSA(T) for four different vibration periods, T = 0.05 s, 0.10 s, 0.30 s, and 0.50 s. Figure 1 shows the empirical predictions at deep soil sites (SL = 2) for three different deep geology types. The solid lines reflect median empirical predictions based on the data recorded at all epicentral distances, whereas the dashed lines reflect predictions based on distances less than 30 km.
Figure 2 and Figure 3 show the attenuation with the distance of PSA(T) for four different vibration periods, T = 0.05 s, 0.10 s, 0.30 s, and 0.50 s. Figure 2 shows the empirical predictions at deep soil sites (SL = 2) for three different deep geology types. The solid lines reflect median empirical predictions based on the data recorded at all epicentral distances, whereas the dashed lines reflect predictions based on distances less than 30 km.
To calculate the exact differences between the attenuation curves for different site conditions, we can apply the coefficients corresponding to the categorical variables SL and SG. If the coefficients from Table 2 are utilized, the spectral amplitude for T = 0.05 s will be 1/10−0.021 = 1.05 times larger at deep geological rock (S = 2) than at deep geological sediments (S = 0), as seen in the top left-hand plot in Figure 2. This is most likely because short-period waves travel through more compact rocks more easily. The opposite occurs for larger periods; the spectral amplitude for T = 0.50 s will be 1/100.147 = 1.40 times larger at deep geological sediments than at rock, as seen in the bottom right-hand plot in the same figure.
The exact differences between the PSA attenuation curves for different site conditions can be also calculated by using the coefficients c4, c5, c6, or c7. For example, the spectral amplitude for T = 0.05 s will be 1/100.052 = 1.13 times larger at deep soil sites (SL = 2) than at rock soil sites (SL = 0), while the amplitude for T = 0.30 s will be 1/100.088 = 1.23 times larger. The coefficient c5 will have positive values for all vibration periods up to 0.5 s. This indicates that deep soil sites produce amplification of vertical seismic waves for all vibration periods smaller or equal to 0.5. This is somewhat surprising because our investigation of the horizontal spectra revealed that short-period waves at the deep soil sites are de-amplified [18]. Coefficients c5 and c7 from Table 2 and Table 3 can be used together to examine the combined influence of deep soils and deep geological sediments. When the coefficients from Table 2 are taken into account, the PSA (0.05 s) for deep soil above deep geological sediments will be 100.052∙10−0.021 = 1.07 of the value for rock soil atop the geological rock. The amplification for PSA (0.30 s) in deep soil above deep geological strata is 100.088∙100.083 = 1.48. On the other hand, coefficients c5 and c7 show that PSA amplitudes in deep soils atop deep geological sediments will be de-amplified up to 26% for vibration periods 0.1 s (100.090∙10−0.181 = 0.81), 0.15 s (100.107∙10−0.178 = 0.85), 1.5 s (10−0.175∙100.142 = 0.93), and 2.0 s (10−0.278∙100.147 = 0.74).
Figure 4 compares the spectra of 15 vertical accelerograms recorded at 10 different deep soil sites to the empirical predictions obtained by Equation (1) and the scaling coefficients shown in Table 3. As can be observed, the actual and anticipated spectra have a high degree of agreement.

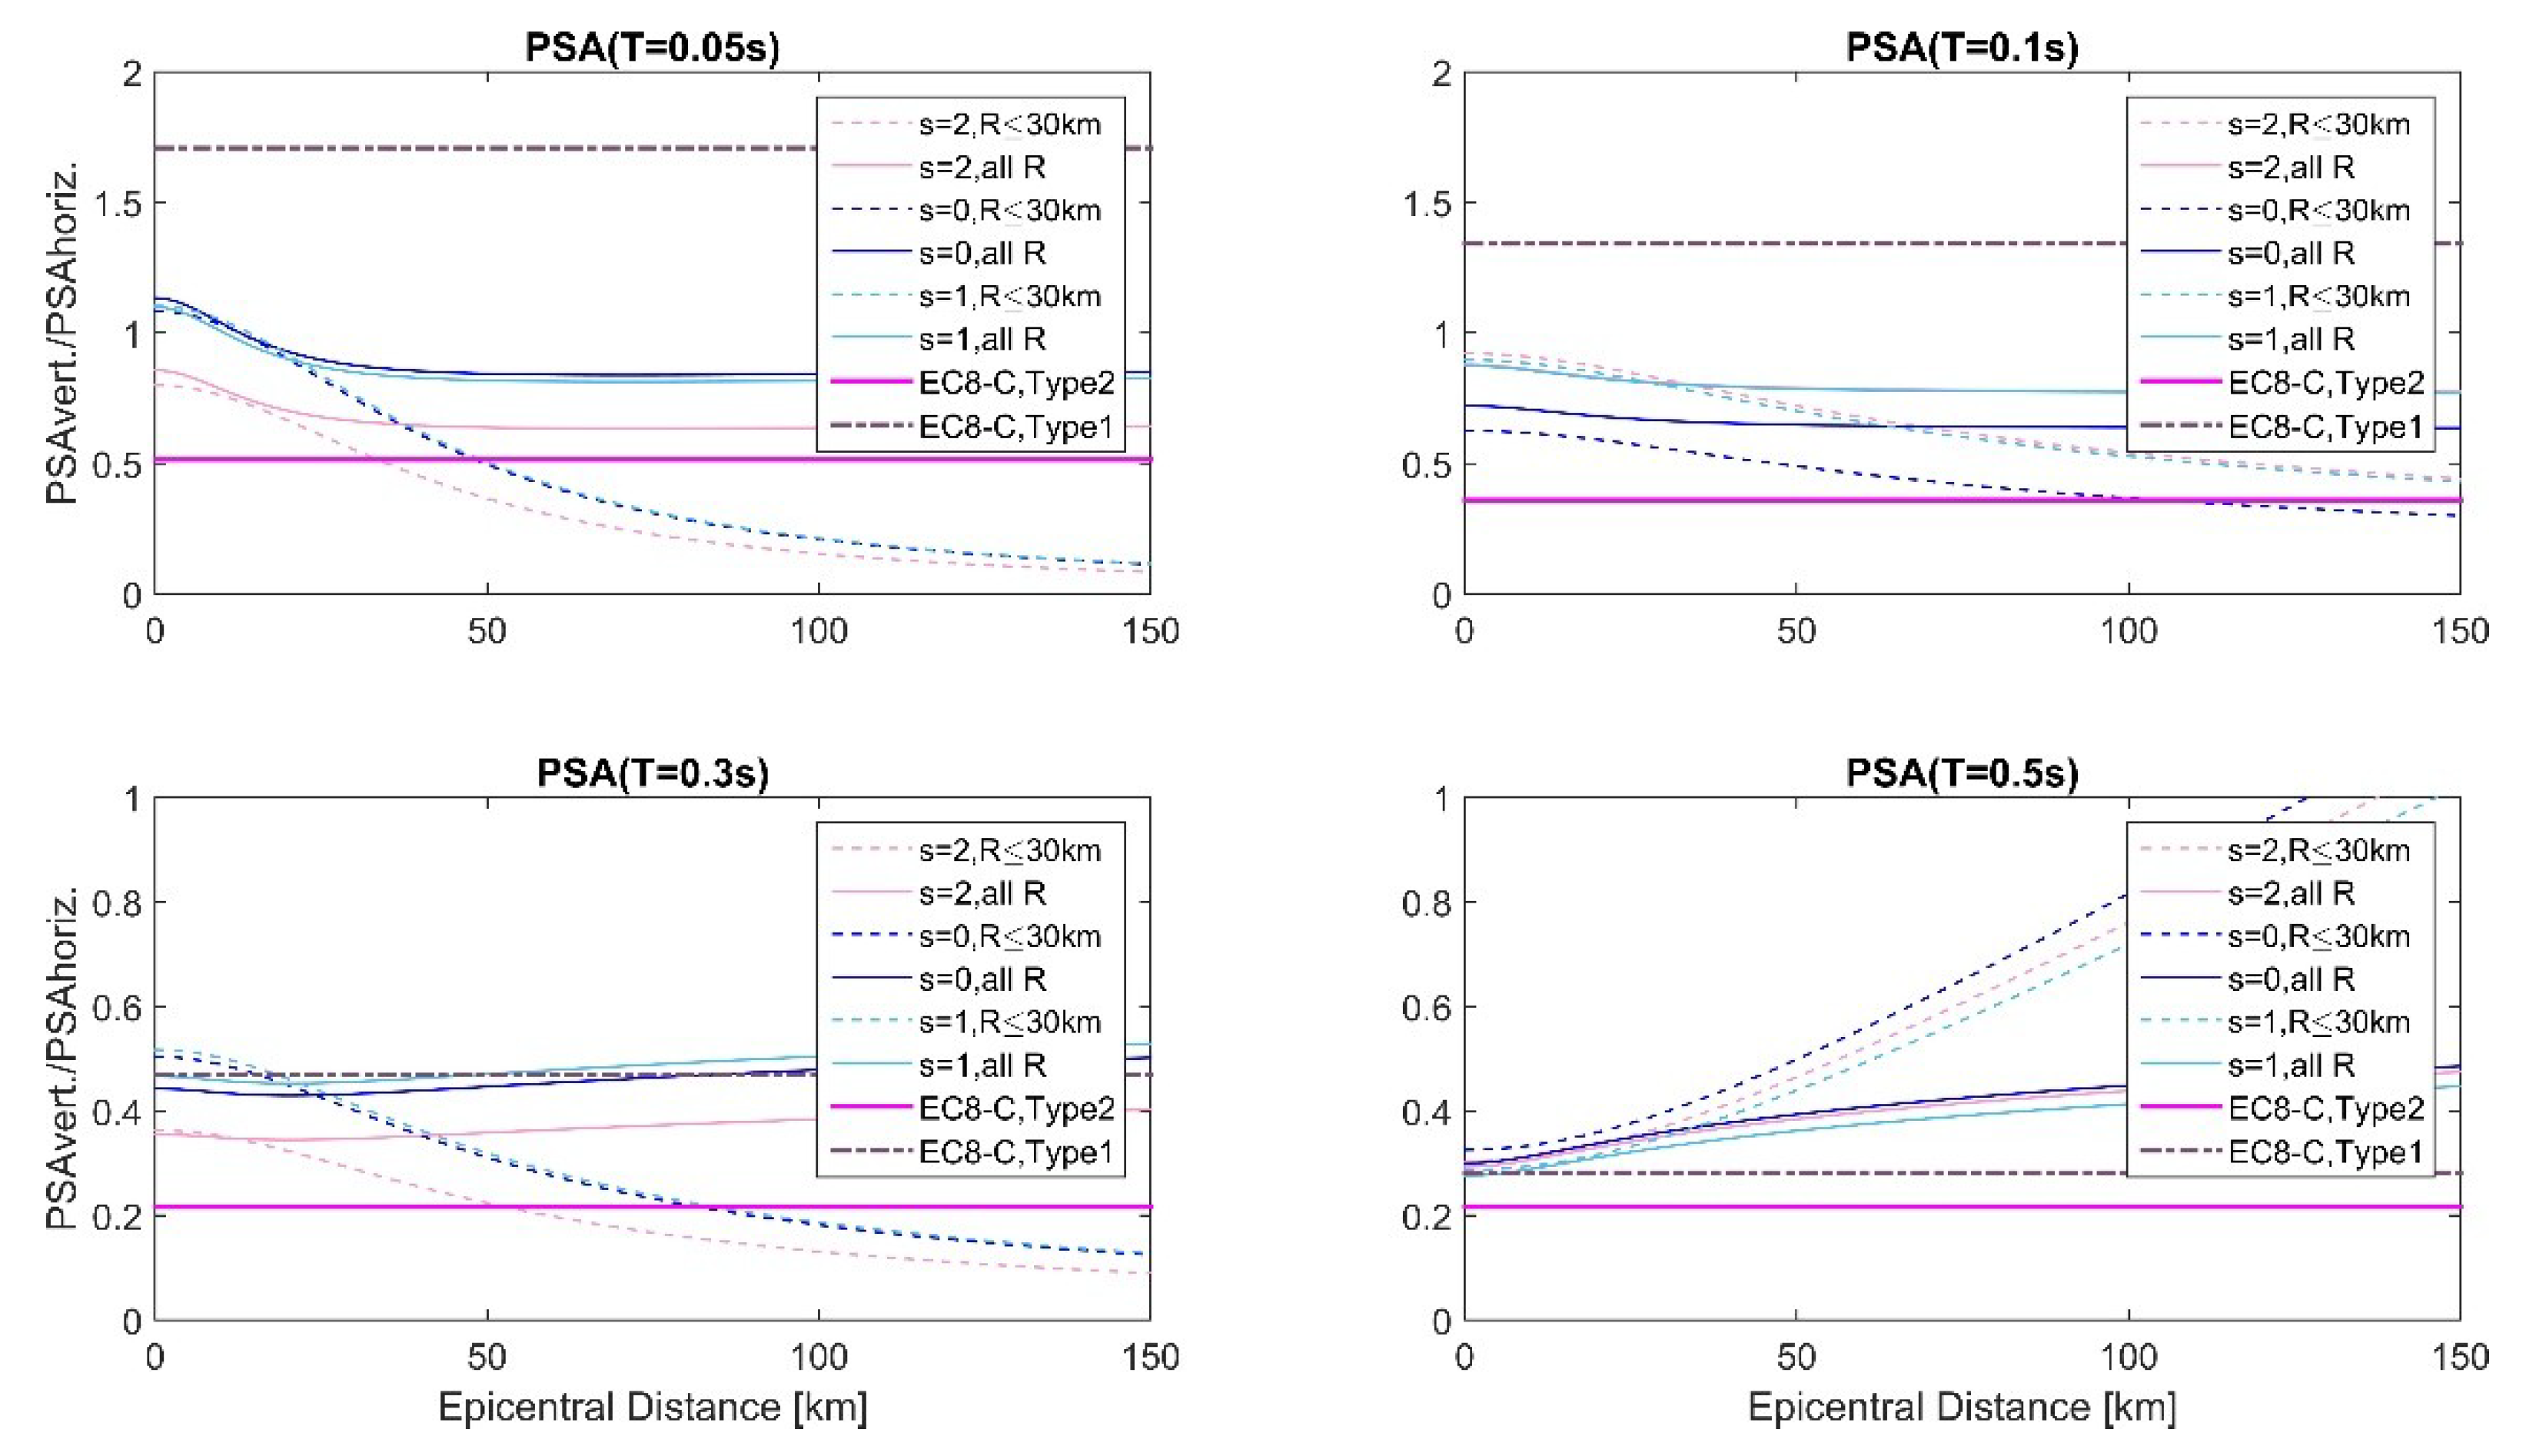
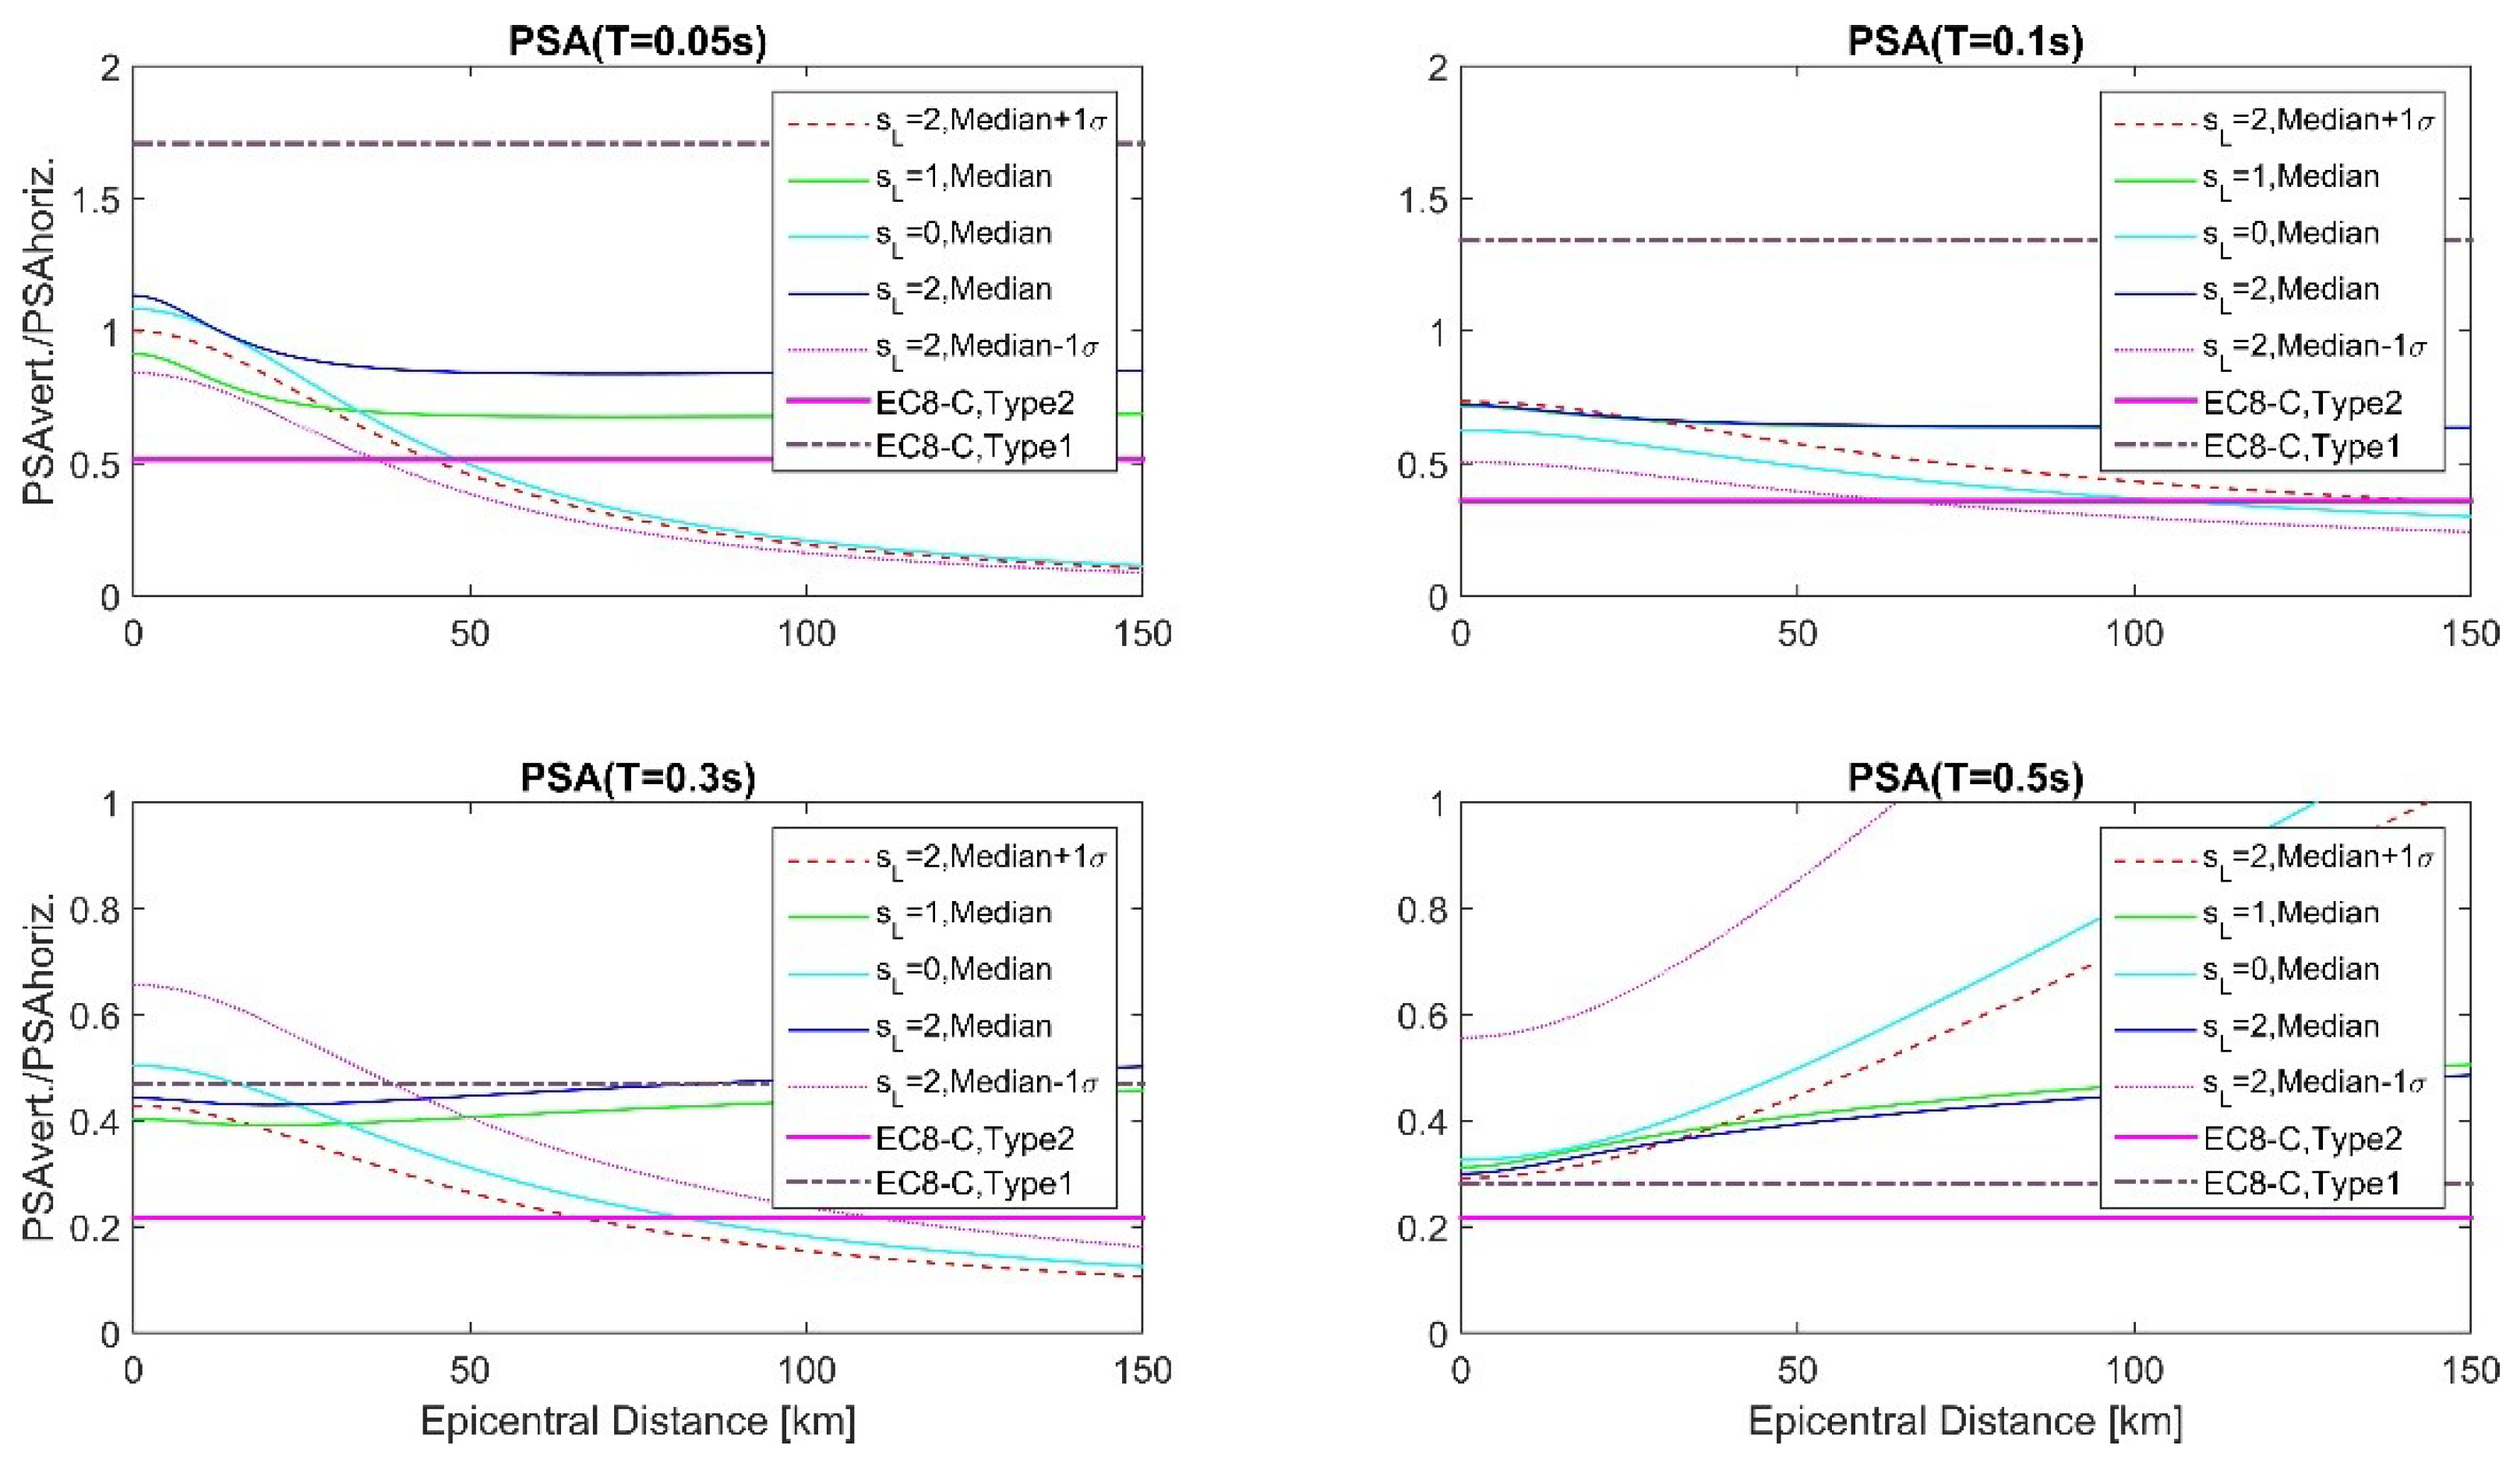
3. Vertical to Horizontal PSA Ratios

The ratios of vertical to horizontal PSA estimates for various distances and site characteristics are depicted in Figure 5 and Figure 6. These ratios were computed by dividing the vertical PSA amplitudes obtained from Equation (1) and the coefficients from Table 2 by the horizontal PSA amplitudes obtained by Equation (1) and the coefficients from Table A.1 in [18]. The plots also include the corresponding vertical to horizontal PSA estimates as suggested by Eurocode 8 [1] for Type 1 and Type 2 spectra. As can be observed, the probability of empirical estimates, source-to-site distance, vibration periods, as well as both local soil and deep geology conditions, influence the vertical to horizontal PSA ratios. The vertical to horizontal spectral ratios predicted by Type 1 or Type 2 Eurocode 8 spectra differ dramatically as well.
For the 0.05 s vibration period, the vertical to horizontal PSA ratios for deep soil sites atop deep geological sediments are in the range of 1.13–0.85 for the distances between 0 and 150 km. These ratios are 2.2–1.7 times higher than the Eurocode 8 ratio of 0.51, which is obtained for Type 2 spectra for Ground Type C and the same vibration period. For Type 1 Eurocode 8 spectra (used for magnitudes of most contributing earthquakes larger than 5.5), the ratios for T = 0.05 s are 1.5 to 2.0 times higher. The empirical ratios for the 0.30 s vibration period are in the range 0.44–0.50, which is 2.0–2.3 times higher than the corresponding ratios suggested by Eurocode 8 [1] for Type 2 spectra, and almost equal to the ratios for Eurocode 8 Type 1 spectra. For the 0.50 s vibration period, this study shows 0.30 to 0.48 ratios of vertical to horizontal PSA values, which is 1.4 to 2.2 times higher than the corresponding ratios for Eurocode 8 Type 2 spectra but 1.1 to 1.7 times lower for the Type 1 spectra.

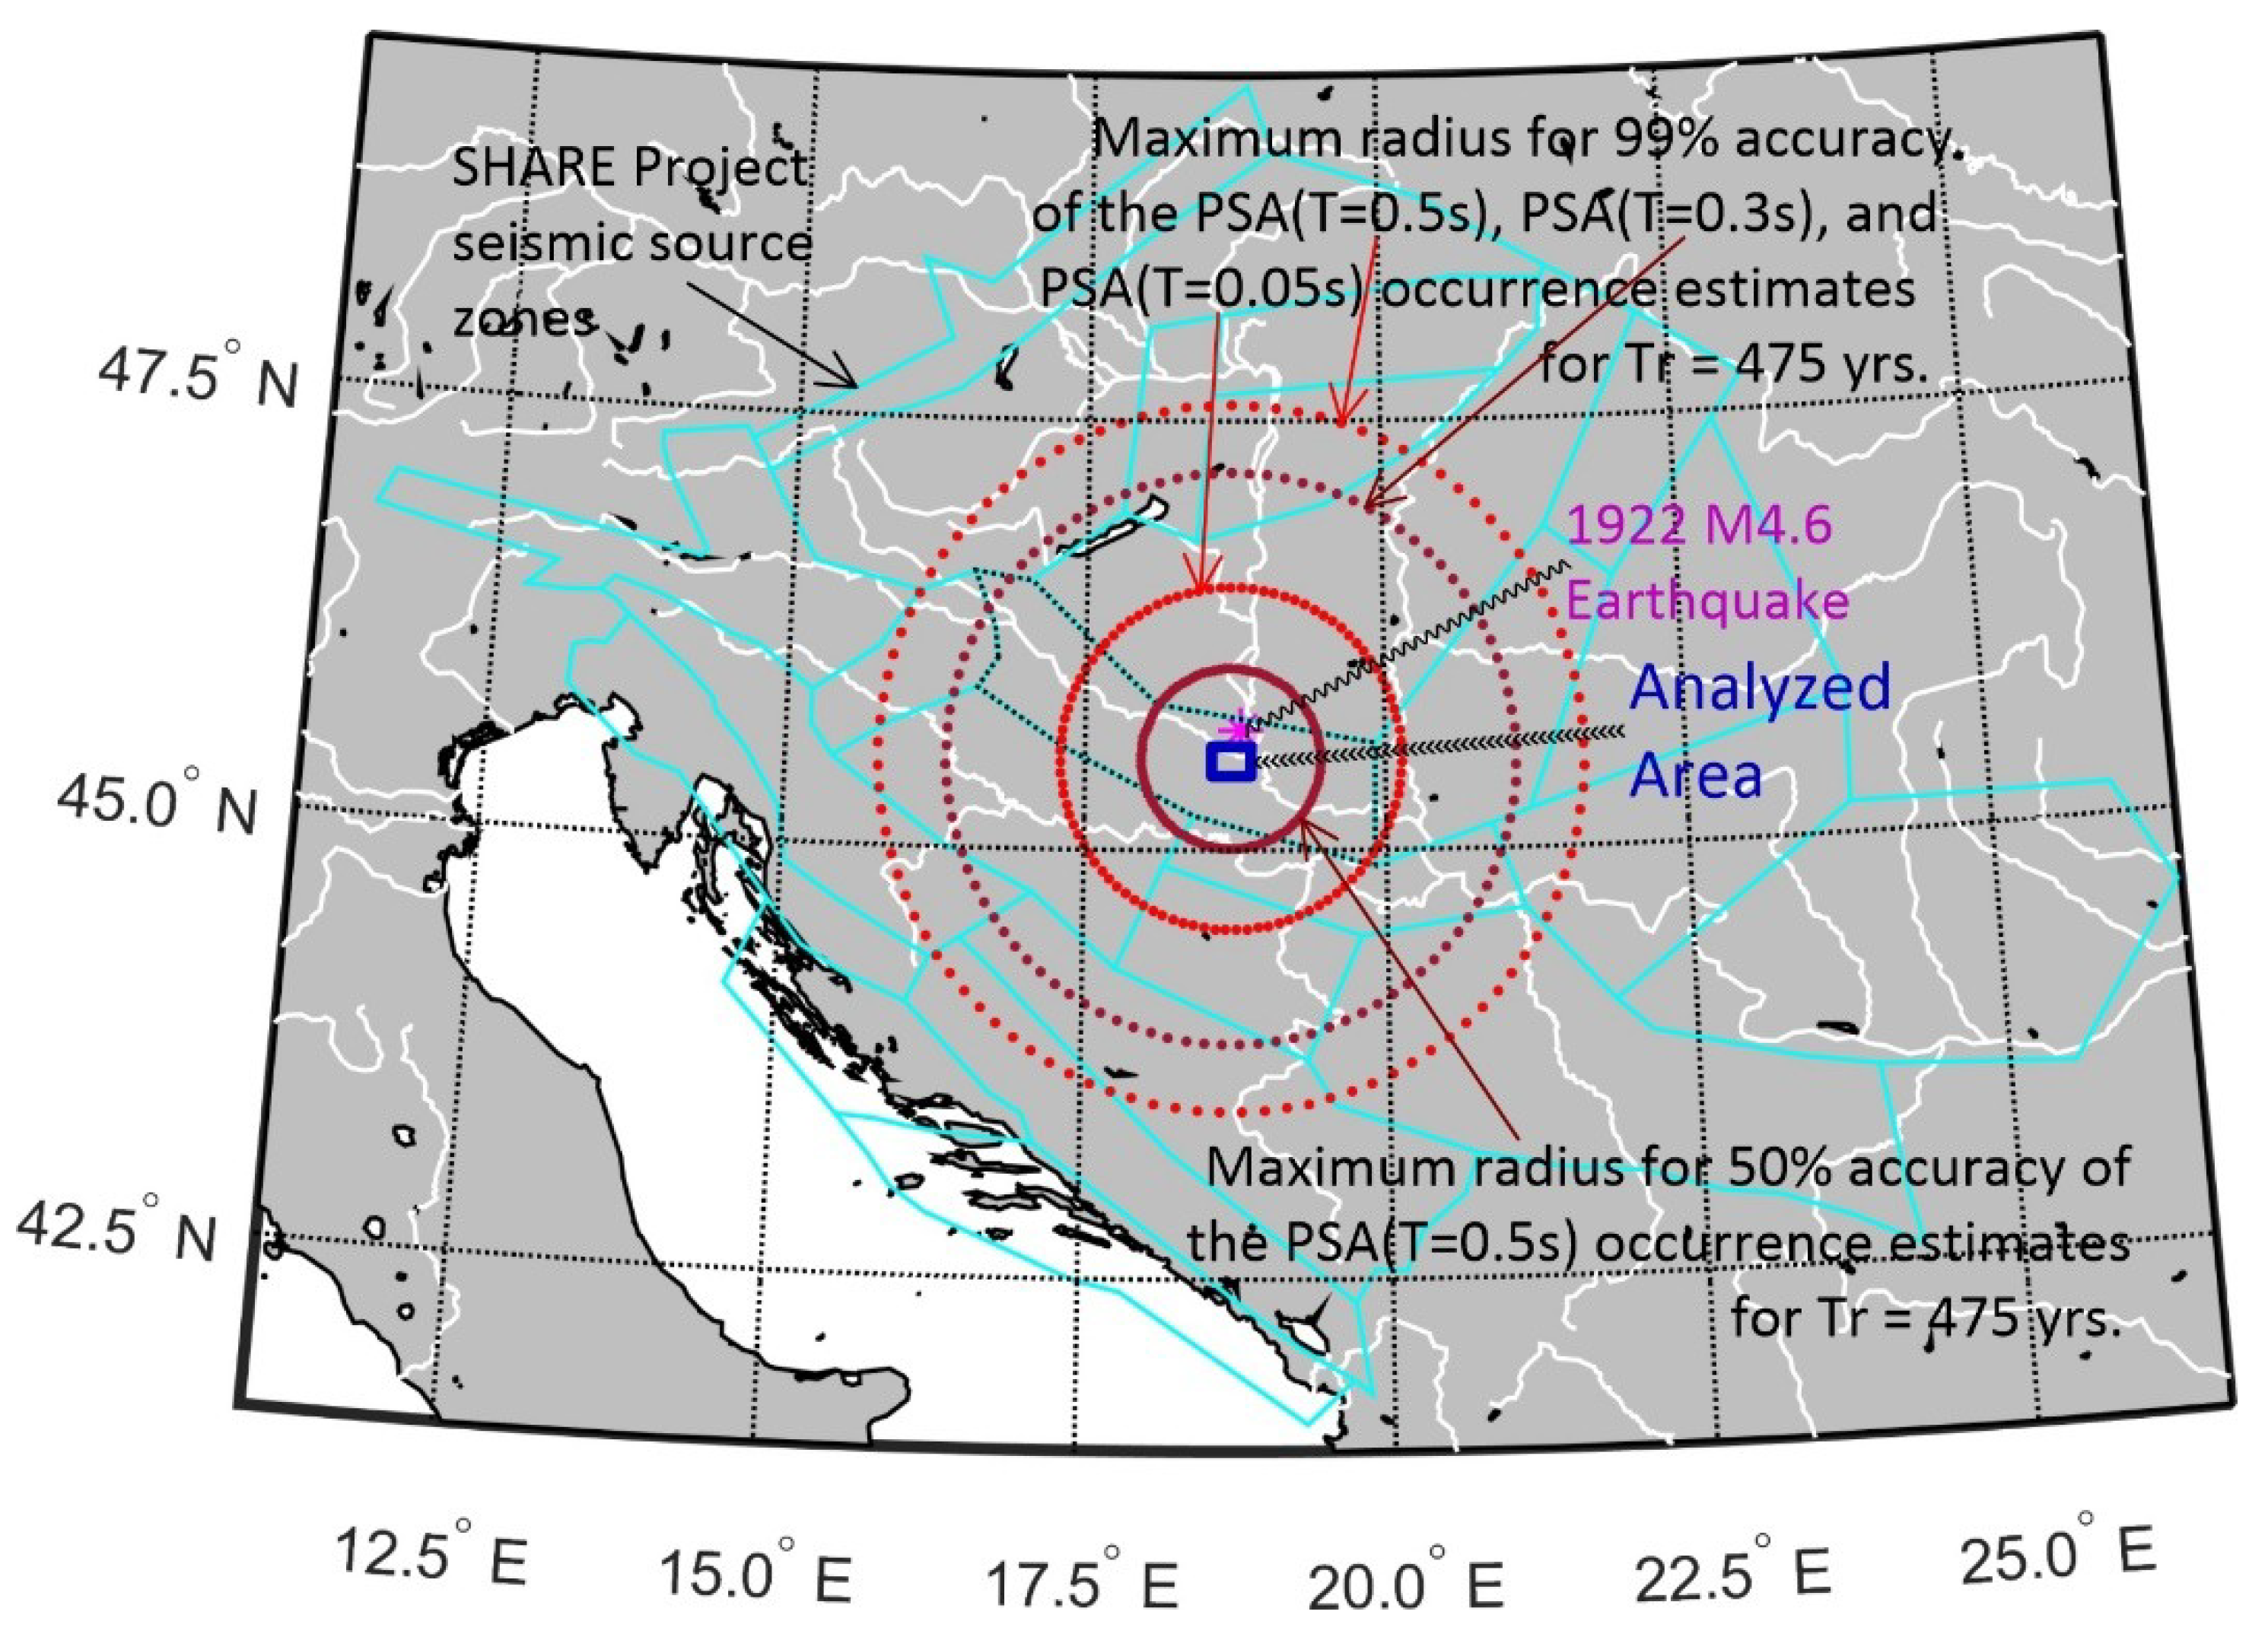
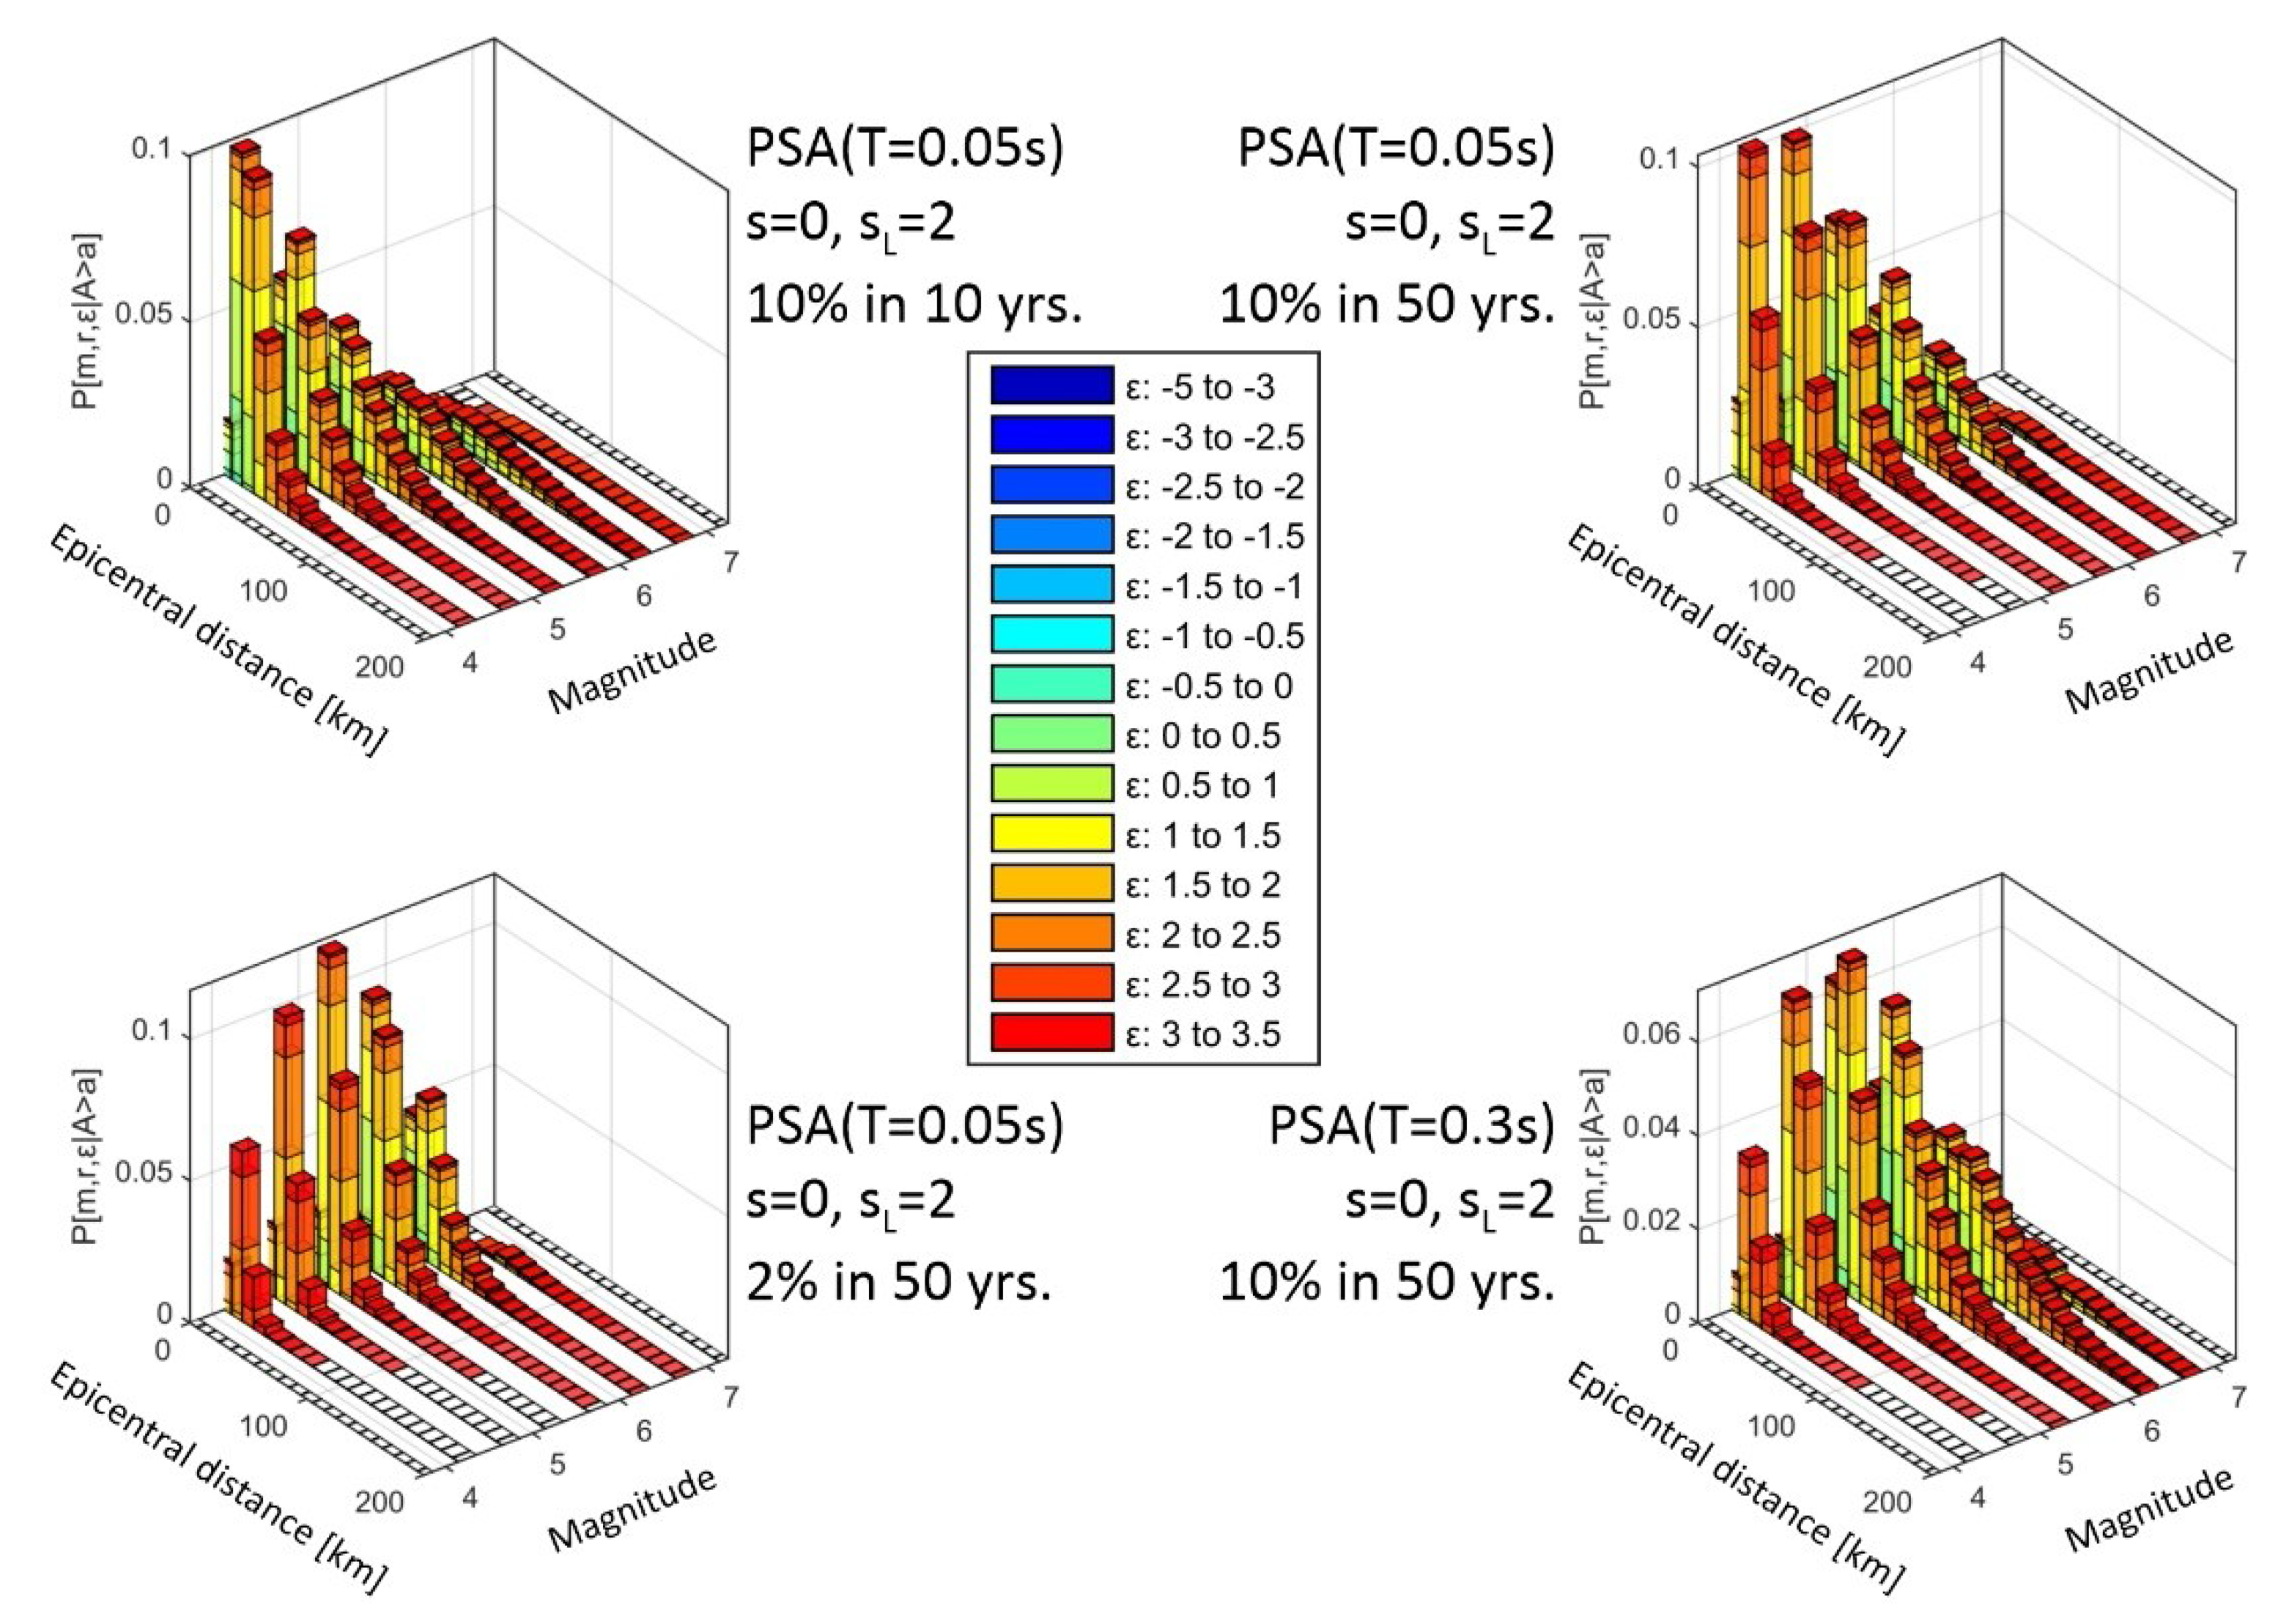
4. Uniform Hazard Spectra Calculations for Vertical Strong Ground Motion

We now conduct a probabilistic seismic hazard analysis (hereinafter, PSHA) for the seismic microzonation of the area within the blue rectangle shown in Figure 7. Several recent regional microzonation studies [26,27,28,29,30,31] have shown that empirical predictions based on scaling equations that consider both deep geology and local soil are in excellent agreement with recorded ground motions in the region. In this study, we define the GMPEs for the probabilistic hazard analyses for Osijek using Equation (1) and the coefficients from Table 2, as was completed for the horizontal spectra [18].
We assumed deep soil sites and deep geological deposits for the entire case study area. The REASSES V2.0 program was used to create the PSHA estimates [38]. Although the seismic source zone can be defined based on available seismological data [39,40,41], to compare the results to our other studies for the same region [17,18] we utilized the pan-European seismic source zone model, which was one of the outcomes of the “Seismic Hazard Harmonization in Europe” (SHARE) Project [42,43,44]. Figure 7 shows the boundaries of the seismic source zones used in this study’s hazard calculations. The circles in Figure 7 depict the source-to-site distances of 111 km, 185 km, and 229 km, estimated to contribute to 99 percent of the overall PSHA estimations for the 475-year return period for spectral amplitudes at 0.05 s, 0.3 s, and 0.5 s, respectively. As expected, distant severe earthquakes will have a larger effect on long-period vertical spectral amplitudes, while the short-period amplitudes will be dominated by local seismic activity. As also shown in Figure 7, the distances that will contribute to the 50% accuracy of the PSHA calculations for the 0.5 s spectral amplitude are designated by a circle with a radius of 58 km.
Figure 8 shows examples of hazard disaggregation [45] for the coordinates 45°32′ N, 18°23′ E. Figure 9 shows cumulative disaggregation examples for distance and magnitude. It also shows (in the bottom-right plot) the magnitude recurrence curve for the most contributing seismic source zone around Osijek. As can be seen, the real return periods of the most contributing earthquakes differ for different vibration periods and are much smaller than the so-called return period Tr, which is equal to the reciprocal value of the mean yearly rate of occurrence, N(PSA), of seismic events that will cause a PSA amplitude that will exceed the expected value–see the related discussions in [17,18]. This should be noted because Eurocode 8 [1] does not define Types 1 and 2 spectra in terms of conservative upper limits for magnitudes, but rather in terms of the magnitudes that “contribute most to the seismic hazard defined for the site for the purpose of probabilistic hazard assessment” (see Eurocode 8 [1]: 3.2.2.1, (4), Note 2 and 3.2.2.2, (2)P, Note 1).
Figure 10 shows the seismic microzonation maps for the study area for the return periods Tr of 95, 475, 975, and 2475 years. Finally, uniform hazard spectra (hereinafter, UHS) for four distinct probability levels were created for the coordinates 45°32′ N, 18°23′ E, and compared to the Eurocode 8 [1] Type 2 spectra for Ground Type C, as shown in Figure 11. The UHS can be easily constructed for any point within the examined area by reading and linking the values for the provided coordinates in the hazard maps of Figure 11 with the same probability of exceedance.
The resulting UHS spectra for various deep geology and local soil types were compared to the Eurocode 8 spectra for Ground Type C, scaled by the PGA values at deep soil locations (SL = 2) and for three different deep geology types (Figure 11). As can be observed, the ratios of maximum spectral amplitudes to PGA values, designated in Figure 11 as SPGA, diverge from the 3.0 factor recommended by Eurocode 8 [1] for vertical spectra. The difference between the SPGA and the 3.0 factor is the smallest (up to 7%) for deep soil atop deep geological sediments (S = 0, SL = 2), and exists only for the 95-year and 475-year return periods. For the so-called stiff soils (those with a 15–75 m thick soil layer above the layer with VS,30 > 800 m/s [12,13]) atop deep geological sediments (S = 0, SL = 1), the SPGA is up to 23% smaller the 3.0 factor. On the other hand, for the deep soils atop geological rocks (S = 2, SL = 1), SPGA is up to 33% larger.
Based on the calculated UHS amplitudes, vertical to horizontal spectral ratios were calculated for four distinct probability levels, as shown in Figure 12. These ratios were also compared to the corresponding ratios of Eurocode 8 [1] for Type 2 spectra and Ground Type C and two sets of empirical GMPEs that consider the simultaneous impacts of deep geology and local soil [15,16]. The first set, labeled USC-CA in Figure 12, was created for California [15], whereas the second set, labeled USC-ExYU, was created for the former Yugoslavia [16]. While both empirical attenuation equations ignore the effect of local soil on the vertical ground motion, the Californian equation, which was based on 1482 acceleration components, indicated that deep geology affects seismic waves in the vertical direction [15]. The ratio shown in Figure 12 for the Californian GMPE corresponds to the vertical ground motion predictions at deep geological sediments. In USC-CA [15] and USC-ExYU [16] GMPEs, the product of the categorical variable and the frequency-dependent scaling coefficients is added to be able to predict either vertical or horizontal spectra. As a result, the exact vertical to horizontal PSA ratios can be determined in the same way as was completed previously for the amplification factors for various soil and deep geology types. For example, according to USC-CA [15], the vertical to horizontal PSA ratio is equal to 10−0.168 = 0.68 for a 0.04 s vibration period and 10−0.212 = 0.61 for 0.50 s. According to USC-ExYU [16], the vertical to horizontal spectral ratio would be equal to 10−0.141 = 0.72 for T = 0.04 s and 10−0.266 = 0.54 for T = 0.60 s. As can be seen in Figure 12, these ratios are in fair agreement with our empirical predictions.
Employing the Eurocode 8 ratios for Type 2 spectra and Ground Type C results however in a severe underestimation of the vertical spectra. This underestimation exists for all the analyzed vibration periods and slightly decreased with the return period. For the vibration period of 0.5 s, the Eurocode 8 ratios are 1.6 to 1.9 times lower than the empirically determined ratios for deep soils atop deep geological sediments (S = 0, SL = 2). The maximum difference can be observed for T = 2.0 s, for which the empirical ratios are 2.6 to 3.0 times higher than the ratios predicted by Eurocode 8. We did not display Eurocode 8 ratios for Type 1 spectra in Figure 12 because they would be substantially higher than any of the empirical ratios. For a 0.05 s vibration period, for example, the empirical ratios would be 1.9 to 2.0 times lower than the ones suggested by Eurocode 8 Type 1 spectra.

5. Discussion and Conclusions

The motive for this research was the fact that most design codes, including Eurocode 8 [1], neglect the influence of the local soil on the vertical spectra. Moreover, while Eurocode 8 recognizes the potential importance of deeper geological site surroundings, stating in Clause 3.1.2(1) that the National Annex may establish a classification scheme that accounts for deep geology [1], Croatia has not included deep geology in its ground classification scheme to date.
In this study, we analyzed vertical spectra for the deep soil sites atop deep geological sediments, in low to medium seismicity regions. The city of Osijek, located on the right bank of the Drava River and in the southern part of the Pannonian Basin, was chosen as the case study region, as it was in our accompanying paper on the horizontal spectra [18]. Underneath Osijek, geological sediments reach depths of up to 2.7 km, with a total thickness of 150–180 m above layers with an s-wave velocity greater than 800 m/s [18]. Recent research studies have suggested that the city of Osijek’s building stock is particularly vulnerable [46,47], necessitating the need for more reliable seismic action estimates for Osijek, especially after the devastating 29 December 2020, Mw 6.4 earthquake in central Croatia [48]. This is also the case with many other cities with similar building typologies and similar seismic activity [49,50,51,52,53,54].
New empirical regional PSA attenuation equations were constructed using only regional strong motion data. A total of 218 vertical components of strong strong motion accelerograms recorded in the north-western Balkans from 112 earthquakes with magnitudes ranging from 3 to 6.8 were included in the strong motion database used to build the predictive equations. In these equations, both the effects of local soil and deep geological conditions were taken into account. For a 0.3 s vibration period, the maximum amplification of 1.48 times was found at deep soil atop deep geological sediments compared to the rock sites. Vertical PSA amplitudes for vibration periods of 0.10 s to 0.15 s, as well as periods longer than 1.50 s, were shown to be de-amplified by up to 26%.
As was also shown, using Eurocode 8 ratios of vertical to horizontal spectra results in a significant underestimation of vertical spectra. Vertical to horizontal PSA ratios that are suggested by Eurocode 8 [1] for Type 2 spectra and Ground Type C were 2.0 to 2.3 times lower than the empirically determined ratios for PSAvert at deep soil atop deep geological sediments and with a vibration period of 0.3 s. The vertical to horizontal PSA ratios for a single soil type were shown to be influenced by the source-to-site distance, the probability of empirical estimates, as well as deep geology conditions. Hence, they cannot be captured by a constant that depends only on earthquake magnitude, as suggested by Eurocode 8 [1].
Seismic microzonation maps were constructed for the examined area using the proposed scaling equations. Vertical UHS amplitudes were also calculated and compared to the Eurocode 8 [1] spectra for Ground Type C, scaled by PGA values at deep soil sites, and for three different types of deep geology. The results show that the maximum spectral amplitudes to PGA ratios, referred to as SPGA in Figure 11, do not deviate too much from the 3.0 factor indicated by Eurocode 8 [1] for vertical spectra at deep soils above deep geological deposits. However, for deep soils atop deep geological rocks, the SPGA was equal to 3.9 for 95-year and 4.0 for 475-year, 975-year, and 2475-year return periods. In comparison to the 3.0 factor indicated by Eurocode 8, this is a 30–33% increase.
Vertical-to-horizontal UHS ratios were also calculated and compared to Eurocode 8 recommendations and two sets of empirical GMPEs that were developed by other authors for California [15] and former Yugoslavia [16]. These two sets of GMPEs were the only ones we could find that considered the effects of both local soil and deep geology on vertical spectral amplitudes. While our results are in good accordance with those of two other GMPEs, it was shown that the vertical to horizontal PSA ratios for all the vibration periods are underestimated by Eurocode 8 Type 2 spectra. The biggest divergence may be seen at T = 2.0 s, where the empirical ratios were 2.6 to 3.0 times higher than what Eurocode 8 predicted. The usage of Eurocode 8 Type 1 spectra, on the other hand, would result in an overestimation of vertical spectra. This overestimation would be twice the empirical ratios for T = 0.05 s.
All the results of this study indicate that the vertical design spectra should be defined directly as uniform hazard spectra calculated by using the empirical GMPEs for vertical ground motion. Even though the number of ground motion accelerograms recorded at deep soil sites in the north-western Balkans is not large, the results that are presented in this paper can be considered a first step toward defining more accurate PSAvert estimates for the case study area of Osijek. As more strong motion data for the vertical direction becomes available, it will be simple to update the GMPEs and recalculate the seismic hazard.

Author Contributions

Conceptualization, B.Đ.B., M.H.-N. and G.P.; methodology, B.Đ.B., M.H.-N. and G.P.; validation B.Đ.B., M.H.-N. and G.P.; formal analysis B.Đ.B., M.H.-N. and G.P.; investigation: B.Đ.B., M.H.-N. and G.P.; resources B.Đ.B., M.H.-N. and G.P.; writing—original draft preparation: B.Đ.B., M.H.-N. and G.P.; final writing—review and editing: B.Đ.B., M.H.-N. and G.P. All authors have read and agreed to the published version of the manuscript.

Funding

This research received no external funding.

Institutional Review Board Statement

Not applicable.

Informed Consent Statement

Not applicable.

Data Availability Statement

Not applicable.

Conflicts of Interest

The authors declare no conflict of interest.

References

  1. Eurocode 8: Design of Structures for Earthquake Resistance—Part I: General Rules, Seismic Actions and Rules for Buildings; EC8, EN 1998-1:2004; CEN—European Committee for Standardization: Brussels, Belgium, 2004.
  2. Hrvatski Zavod za Norme: HRN EN 1998-1:2011/NA:2011. Eurocode 8: Design of Structures for Earthquake Resistance—Part 1: General Rules, Seismic Actions and Rules for Buildings—National Annex; Hrvatski Zavod za Norme: Zagreb, Croatia, 2011. [Google Scholar]
  3. Nogoshi, M.; Igarashi, T. On the amplitude characteristics of microtremor. Seismol. Soc. Jpn. 1971, 24, 26–40. [Google Scholar]
  4. Nakamura, Y. A Method for Dynamic Characteristics Estimation of Subsurface Using Microtremor on the Ground Surface; Quaterly Report of the Railway Technical Research Institue: Tokyo, Japan, 1971; Volume 30, pp. 25–30. [Google Scholar]
  5. Nakamura, Y. Real-time information systems for hazards mitigation. In Proceedings of the 11th World Conference on Earthquake Engineering, Acapulco, Mexico, 23–28 June 1996. [Google Scholar]
  6. Nakamura, Y. Clear identification of fundamental idea of Nakamura’s technique and its applications. In Proceedings of the 12th World Conference on Earthquake Engineering, Auckland, New Zealand, 30 January–4 February 2000. [Google Scholar]
  7. Bonnefoy-Claudet, S.; Köhler, A.; Cornou, C.; Wathelet, M.; Bard, P.-Y. Effects of Love Waves on Microtremor H/V Ratio. Bull. Seismol. Soc. Am. 2008, 98, 288–300. [Google Scholar] [CrossRef]
  8. Rong, M.; Fu, L.-Y.; Wang, Z.; LI, X.; Carpenter, N.S.; Woolery, N.S.; Lyu, Y. On the Amplitude Discrepancy of HVSR and Site Amplification from Strong-Motion Observations. Bull. Seismol. Soc. Am. 2017, 170, 2873–2884. [Google Scholar] [CrossRef]
  9. Imposa, S.; Lombardo, G.; Panzera, F.; Grassi, S. Ambient Vibrations Measurements and 1D Site Response Modelling as a Tool for Soil and Building Properties Investigation. Geosciences 2018, 8, 87. [Google Scholar] [CrossRef] [Green Version]
  10. Mucciarelli, M. Reliability and applicability of Nakamura’s technique using microtremors: An experimental approach. J. Earthq. Eng. 1998, 2, 625–638. [Google Scholar] [CrossRef]
  11. Del Gaudio, V.; Wasowski, J.; Muscillo, S. New developments in ambient noise analysis to characterise the seismic response of landslide-prone slopes. Nat. Hazards Earth Syst. Sci. 2013, 13, 2075–2087. [Google Scholar] [CrossRef] [Green Version]
  12. Seed, H.B.; Ugas, C.; Lysmer, J. Site-dependent spectra for earthquake-resistant design. Bull. Seismol. Soc. Am. 1976, 66, 221–243. [Google Scholar]
  13. Seed, H.B.; Murarka, R.; Lysmer, J.; Idriss, I.M. Relationships of maximum acceleration, maximum velocity, distance from source, and local site conditions for moderately strong earthquakes. Bull. Seismol. Soc. Am. 1976, 66, 1323–1342. [Google Scholar]
  14. Trifunac, M.D.; Brady, A.G. On the correlation of seismic intensity scales with the peaks of recording strong ground motion. Bull. Seismol. Soc. Am. 1975, 65, 139–162. [Google Scholar]
  15. Lee, V.W. Influence of Local Soil and Geologic Site Conditions on Pseudo Relative Velocity Spectrum Amplitudes of Recorded Strong Motion Accelerations; Report No. 87-06; Department of Civil Engineering, University of Southern California: Los Angeles, CA, USA, 1987. [Google Scholar]
  16. Lee, V.W.; Manić, M.I. Empirical scaling of response spectra in former Yugoslavia. In Proceedings of the 10th European Conference on Earthquake Engineering, Vienna, Austria, 28 August–2 September 1994; pp. 2567–2572. [Google Scholar]
  17. Bulajić, B.; Pavić, G.; Hadzima-Nyarko, M. PGA vertical estimates for deep soils and deep geological sediments—A case study of Osijek (Croatia). Comput. Geosci. accepted.
  18. Bulajić, B.; Hadzima-Nyarko, M.; Pavić, G. Horizontal strong motion UHS amplitudes for low to medium seismicity regions with deep soil atop deep geological sediments—An example of the city of Osijek, Croatia. Appl. Sci. 2021, 11, 6296. [Google Scholar] [CrossRef]
  19. Gulerce, Z.; Kamai, R.; Abrahamson, N.A.; Silva, W.J. Ground motion prediction equations for the vertical ground motion component based on the NGA-W2 database. Earthq. Spectra 2017, 33, 499–528. [Google Scholar] [CrossRef]
  20. Kalkan, E.; Gulkan, H.P. Empirical attenuation equations for vertical ground motion in Turkey. Earthq. Spectra 2004, 20, 853–882. [Google Scholar] [CrossRef]
  21. Kamai, R.; Abrahamson, N.A.; Silva, W.J. VS30 in the NGA GMPEs; regional differences and suggested practice. Earthq. Spectra 2016, 32, 2083–2108. [Google Scholar] [CrossRef]
  22. Bozorgnia, Y.; Campbell, K.W. Vertical ground motion model for PGA, PGV, and linear response spectra using the NGA-West2 database. Earthq. Spectra 2016, 32, 979–1004. [Google Scholar] [CrossRef]
  23. Campbell, K.W. Empirical near-source attenuation relationships for horizontal and vertical components of peak ground acceleration, peak ground velocity, and pseudo-absolute acceleration response spectra. Seismol. Res. Lett. 1997, 68, 154–179. [Google Scholar] [CrossRef]
  24. Bulajić, B.Đ.; Manić, M.I.; Lađinović, Đ. Effects of shallow and deep geology on seismic hazard estimates—a case study of pseudo-acceleration response spectra for the north-western Balkans. Nat. Hazards 2013, 69, 573–588. [Google Scholar] [CrossRef]
  25. Manić, M.I.; Bulajić, B.Đ.; Trifunac, M.D. A note on peak accelerations computed from sliding of objects during the 1969 Banja Luka earthquakes in former Yugoslavia. Soil Dyn. Earthq. Eng. 2015, 77, 164–176. [Google Scholar] [CrossRef]
  26. Bulajić, B.Đ.; Bajić, S.; Stojnić, N. The effects of geological surroundings on earthquake-induced snow avalanche prone areas in the Kopaonik region. Cold. Reg. Sci. Technol. 2018, 149, 29–45. [Google Scholar] [CrossRef]
  27. Lee, V.W.; Trifunac, M.D.; Bulajić, B.Đ.; Manić, M.I. A preliminary empirical model for frequency-dependent attenuation of Fourier amplitude spectra in Serbia from the Vrancea earthquakes. Soil Dyn. Earthq. Eng. 2016, 83, 167–179. [Google Scholar] [CrossRef]
  28. Lee, V.W.; Trifunac, M.D.; Bulajić, B.Đ.; Manić, M.I. Preliminary empirical scaling of pseudo relative velocity spectra in Serbia from the Vrancea earthquakes. Soil Dyn. Earthq. Eng. 2016, 86, 41–54. [Google Scholar] [CrossRef]
  29. Lee, V.W.; Trifunac, M.D.; Bulajić, B.Đ.; Manić, M.I.; Herak, D.; Herak, M.; Dimov, G. Seismic microzoning in Skopje, Macedonia. Soil Dyn. Earthq. Eng. 2017, 98, 166–182. [Google Scholar] [CrossRef] [Green Version]
  30. Lee, V.W.; Trifunac, M.D.; Bulajić, B.Đ.; Manić, M.I.; Herak, D.; Herak, M.; Dimov, G.; Gičev, V. Seismic microzoning of Štip in Macedonia. Soil Dyn. Earthq. Eng. 2017, 98, 54–66. [Google Scholar] [CrossRef] [Green Version]
  31. Lee, V.W.; Trifunac, M.D.; Bulajić, B.Đ.; Manić, M.I.; Herak, D.; Herak, M. Seismic microzoning of Belgrade. Soil Dyn. Earthq. Eng. 2017, 97, 395–412. [Google Scholar] [CrossRef]
  32. Jordanovski, L.R.; Lee, V.W.; Manić, M.I.; Olumčeva, T.; Sinadnovski, C.; Todorovska, M.I.; Trifunac, M.D. Strong Earthquake Ground Motion Data in EQINFOS: Yugoslavia. Part I; Report No. 87-05; Department of Civil Engineering, University of Southern California: Los Angeles, CA, USA, 1987. [Google Scholar]
  33. Ambraseys, N.; Douglas, J.; Margaris, B.; Sigbjörnsson, R.; Smit, P.; Suhadolc, P. Internet site for European strong motion data. In Proceedings of the 12th European Conference on Earthquake Engineering, London, UK, 9–13 September 2002; p. 837. [Google Scholar]
  34. Ambraseys, N.; Douglas, J.; Margaris, B.; Sigbjörnsson, R.; Berge-Thierry, C.; Suhadolc, P.; Costa, G.; Smit, P. Dissemination of European strong-motion data. In Proceedings of the 13th World Conference on Earthquake Engineering, Vancouver, BC, Canada, 1–6 August 2004; Volume 2, p. 32. [Google Scholar]
  35. Accelerograms Recorded during 10 March 2010 Peć and 3 November 2010 Kraljevo Earthquakes. Seismological Survey of Serbia, Republic of Serbia. 2021. Available online: http://www.seismo.gov.rs/O%20zavodu/Infol.htm (accessed on 21 May 2021).
  36. Lee, V.W.; Trifunac, M.D. Empirical scaling of Fourier amplitude spectra in former Yugoslavia. Eur. Earthq. Eng. 1993, 7, 47–61. [Google Scholar]
  37. Trifunac, M.D.; Lee, V.W.; Živčić, M.; Manić, M.I. On the correlation of Mercalli-Cancani-Sieberg intensity scale in Yugoslavia with the peaks of recorded strong earthquake ground motion. Eur. Earthq. Eng 1991, 5/1, 27–33. [Google Scholar]
  38. Chioccarelli, E.; Cito, P.; Iervolino, I.; Giorgio, M. REASSESS V2.0: Software for single- and multi-site probabilistic seismic hazard analysis. Bull Earthq. Eng. 2019, 17, 1769–1793. [Google Scholar] [CrossRef]
  39. Amaro-Mellado, J.L.; Melgar-García, L.; Rubio-Escudero, C.; Gutiérrez-Avilés, D. Generating a seismogenic source zone model for the Pyrenees: A GIS-assisted triclustering approach. Comput. Geosci. 2021, 150, 104736. [Google Scholar] [CrossRef]
  40. Amaro-Mellado, J.L.; Morales-Esteban, A.; Asencio-Cortés, G.; Martínez-Álvarez, F. Comparing seismic parameters for different source zone models in the Iberian Peninsula. Tectonophysics 2017, 717, 449–472. [Google Scholar] [CrossRef]
  41. Amaro-Mellado, J.L.; Tien Bui, D. GIS-Based Mapping of Seismic Parameters for the Pyrenees. ISPRS Int. J. Geo-Inf. 2020, 9, 452. [Google Scholar] [CrossRef]
  42. Giardini, D.; Woessner, J.; Danciu, L.; Crowley, H.; Cotton, F.; Grünthal, G.; Pinho, R.; Valensise, L.; SHARE Consort. European Seismic Hazard Map for Peak Ground Acceleration, 10% Exceedance Probabilities in 50 Years; Swiss Seismological Service: Zurich, Switzerland, 2013; ISBN 13 978-92-79-25148-1. [Google Scholar] [CrossRef]
  43. Wössner, J.; Laurentiu, D.; Giardini, D.; Crowley, H.; Cotton, F.; Grünthal, G.; Valensise, G.; Arvidsson, R.; Basili, R.; Demircioglu, M.B.; et al. The 2013 European Seismic Hazard Model: Key components and results. Bull. Earthq. Eng. 2015, 13, 3553–3596. [Google Scholar] [CrossRef] [Green Version]
  44. Pagani, M.; Garcia-Pelaez, J.; Gee, R.; Johnson, K.; Poggi, V.; Styron, R.; Weatherill, G.; Simionato, M.; Viganò, D.; Danciu, L.; et al. Global Earthquake Model (GEM) Seismic Hazard Map (Version 2018.1—December 2018); GEM Foundation: Pavia, Italy, 2018. [Google Scholar] [CrossRef]
  45. Bazzurro, P.; Cornell, C.A. Disaggregation of seismic hazard. Bull. Seismol. Soc. Am. 1999, 89, 501–520. [Google Scholar]
  46. Pavić, G.; Hadzima-Nyarko, M.; Bulajić, B. A Contribution to a UHS-based Seismic Risk Assessment in Croatia—A Case Study for the City of Osijek. Sustainability 2020, 12, 1796. [Google Scholar] [CrossRef] [Green Version]
  47. Pavić, G.; Hadzima-Nyarko, M.; Bulajić, B.; Jurković, Ž. Development of Seismic Vulnerability and Exposure Models—A Case Study of Croatia. Sustainability 2020, 12, 973. [Google Scholar] [CrossRef] [Green Version]
  48. Miranda, E.; Brzev, S.; Bijelić, N.; Arbanas, Ž.; Bartolac, M.; Jagodnik, V.; Lazarević, D.; Mihalić Arbanas, S.; Zlatović, S.; Acosta, A.; et al. PRJ-2959/StEER-EERI: Petrinja, Croatia December 29, 2020, Mw 6.4 Earthquake; Kijewski-Correa, T., Ed.; Field Research, Joint Reconnaissance Report; DesignSafe: Oakland, CA, USA, 2021; p. 206. Available online: https://www.designsafe-ci.org/data/browser/public/designsafe.storage.published/PRJ-2959/#details-4541797621822058005-242ac118-0001-012 (accessed on 9 June 2021).
  49. Kaplan, H.; Bilgin, H.; Yilmaz, S.; Binici, H.; Öztas, A. Structural damages of L’Aquila (Italy) earthquake. Nat. Hazards Earth Syst. Sci. 2010, 10, 499–507. [Google Scholar] [CrossRef]
  50. Inel, M.; Ozmen, H.B.; Bilgin, H. Re-evaluation of building damage during recent earthquakes in Turkey. Eng. Struct. 2008, 30, 412–427. [Google Scholar] [CrossRef]
  51. Bilgin, H.; Huta, E. Earthquake performance assessment of low and mid-rise buildings: Emphasis on URM buildings in Albania. Eng. Struct. 2018, 14, 412–427. [Google Scholar]
  52. Işık, E.; Kutanis, M.; Bal, İ.E. Displacement of the Buildings According to Site-Specific Earthquake Spectra. Period. Polytech. Civ. Eng. 2016, 60, 37–43. [Google Scholar] [CrossRef] [Green Version]
  53. Bilgin, H.; Korini, O. Seismic capacity evaluation of unreinforced masonry residential buildings in Albania. Nat. Hazards Earth Syst. Sci. 2012, 12, 3753–3764. [Google Scholar] [CrossRef]
  54. Işık, E.; Büyüksaraç, A.; Ekinci, Y.L.; Aydın, M.C.; Harirchian, E. The Effect of Site-Specific Design Spectrum on Earthquake-Building Parameters: A Case Study from the Marmara Region (NW Turkey). Appl. Sci. 2020, 10, 7247. [Google Scholar] [CrossRef]
Figure 1. Framework diagram for this research study.
Applsci 11 06782 g001
Figure 2. Empirical regional vertical PSA attenuation curves for four different vibration periods, T = 0.05 s, 0.10 s, 0.30 s, and 0.50 s, calculated using Equation (1), for deep soil sites (SL = = 2) and for different deep geology parameters (S = 2 for geological rock sites, S = 1 for intermediate geological surroundings, and S = 0 for deep sediments). Solid lines show median empirical predictions obtained by using coefficients developed for all epicentral distances, while dashed lines show the predictions obtained by using coefficients developed for distances smaller than 30 km.
Applsci 11 06782 g002
Figure 3. Median empirical estimates of vertical PSA at deep soil (SL = 2), rock soil (SL = 0), and stiff soil (SL = 1) sites, as well as median ± 1 σlog and median ± 2 σlog (shaded area) estimates for the deep soil sites.
Applsci 11 06782 g003
Figure 4. Relationship between regional vertical pseudo-acceleration spectra at deep soil sites (SL = 2) and the empirical predictions defined by Equation (1) and coefficients from Table 3.
Applsci 11 06782 g004
Figure 5. Empirical predictions of vertical to horizontal PSA amplitudes for four vibration periods, T = 0.05 s, 0.10 s, 0.30 s, and 0.50 s, calculated using Equation (1) and coefficients from Table 2, for deep soil sites (SL = 2) and the three different deep geology parameters. Solid lines show empirical predictions developed for all epicentral distances, while dashed lines show the predictions developed for distances smaller than 30 km.
Applsci 11 06782 g005
Figure 6. Empirical predictions of vertical to horizontal PSA amplitudes for four vibration periods, T = 0.05 s, 0.10 s, 0.30 s, and 0.50 s, for deep geological sediments (S = 2) and the three different shallow geology parameters, including the median ± 1 σlog predictions for deep soil sites (SL = 2).
Applsci 11 06782 g006
Figure 7. Map of areal seismic source zones used for PSHA calculations in this study. Maximum radii for capturing 99 percent or 50 percent accuracy of the Tr = 475 years PSA estimations for vibration periods of 0.05 s, 0.3 s, and 0.5 s are shown as circles around the investigated area.
Applsci 11 06782 g007
Figure 8. Disaggregation examples for different hazard probabilities and PSA amplitudes for the location in Osijek with coordinates 45°32′ N, 18°23′ E.
Applsci 11 06782 g008
Figure 9. The magnitude recurrence curve for the most contributing seismic source zone surrounding Osijek (see Figure 8) and cumulative disaggregation for distances and magnitudes for the coordinates 45°32′ N, 18°23′ E.
Applsci 11 06782 g009
Figure 10. Seismic hazard maps for the vertical spectral accelerations in the analyzed area, for four different probability levels and six vibration periods. Full circles denote the site chosen for UHS and disaggregation calculations.
Applsci 11 06782 g010
Figure 11. Uniform hazard vertical spectra for four distinct probability levels, as well as corresponding Eurocode 8 [1] Type 2 spectra for Ground Type C, calculated for the coordinates 45°32′ N, 18°23′ E.
Applsci 11 06782 g011
Figure 12. Vertical to horizontal spectral ratios for four distinct probability levels, calculated based on UHS and Eurocode 8 amplitudes from Figure 11. Empirical estimates of vertical to horizontal spectral ratios in California [15] and former Yugoslavia [16] are labeled USC-CA and USC-ExYU, respectively.
Applsci 11 06782 g012
Table 1. Vertical to horizontal PSA estimates for Types 1 and 2 of Eurocode 8 [1] spectra for Ground Type C.
Type 1 Spectrum: “Most Contributing” Earthquakes with MS > 5.5
Vibration periods, T [s]Vertical to Horizontal PSA Ratios
0.00–0.050.782 × [1 + (η × 3.0−1) × T/0.05]/[1 + (η × 2.5 − 1) × T/0.2]
0.05–0.152.348 × η/[1 + (η × 2.5 − 1) × T/0.2]
0.15–0.200.352 × η/[1 + (η × 2.5 − 1) × T/0.2]/T
0.20–0.600.141/T
0.60–1.000.235
1.00–2.000.235/T
2.00–4.000.117
Type 2 Spectrum: “Most Contributing ” Earthquakes with MS ≤ 5.5
Vibration periods, T [s]Vertical to Horizontal PSA Ratios
0.00–0.050.3 × [1 + (η × 3.0 − 1) × T/0.05]/[1 + (η × 2.5 − 1) × T/0.1]
0.05–0.100.9 × η/[1 + (η × 2.5 − 1) × T/0.1]
0.10–0.150.36
0.15–0.250.054/T
0.25–1.000.216
1.00–1.200.216/T
1.20–4.000.18
Table 2. Scaling coefficients and standard deviations of Equation (1) with R as the epicentral distance.
Tc1c2c3R0c4c5c6c7σlog
0.050−1.3990.364−1.32615.20.1360.052−0.090−0.0210.264
0.075−1.0060.371−1.48418.40.1430.074−0.104−0.0550.272
0.100−0.7740.377−1.55121.60.1830.090−0.170−0.1810.267
0.150−0.9740.396−1.48620.20.2010.107−0.219−0.1780.271
0.200−1.4080.449−1.49319.90.1880.111−0.080−0.0410.272
0.300−2.2140.482−1.26516.70.1720.0880.0930.0830.259
0.400−2.9020.533−1.09312.50.1090.0460.0940.1230.277
0.500−3.2200.548−1.00412.10.0640.0050.1080.1470.288
0.750−3.6790.554−0.85210.80.034−0.0640.0680.1610.303
1.000−4.0580.550−0.7029.30.008−0.0950.0500.1400.301
1.500−4.3220.531−0.6379.6−0.017−0.1750.0520.1420.298
2.000−4.5040.534−0.6629.8−0.044−0.2780.0370.1470.308
Table 3. Scaling coefficients and standard deviations of Equation (1) with R as the hypocentral distance.
Tc1c2c3R0c4c5c6c7σlog
0.050−1.0230.342−1.44019.70.1670.068−0.065−0.0250.276
0.075−0.4710.346−1.66025.40.1740.091−0.079−0.0610.285
0.100−0.1370.353−1.77630.50.2120.107−0.144−0.1880.278
0.150−0.3820.372−1.69028.10.2160.124−0.198−0.1820.282
0.200−0.8680.425−1.67426.90.2020.126−0.059−0.0430.283
0.300−1.7860.458−1.39222.50.1830.0960.1120.0810.272
0.400−2.6150.508−1.14915.20.1050.0460.1070.1270.288
0.500−2.9850.527−1.04513.90.060−0.0010.1200.1520.296
0.750−3.4820.533−0.87412.00.025−0.0700.0770.1680.310
1.000−3.9030.531−0.7089.3−0.007−0.0880.0560.1480.306
1.500−4.2360.516−0.6297.9−0.019−0.1700.0640.1490.300
2.000−4.4160.519−0.6568.5−0.041−0.2820.0490.1540.311
Publisher’s Note: MDPI stays neutral with regard to jurisdictional claims in published maps and institutional affiliations.

