
Improved Surprise Adequacy Tools for Corner Case Data Description and Detection
by
 ,
,
Tinghui Ouyang
1,2,* ,
,
Vicent Sanz Marco
2,
Yoshinao Isobe
3,
Hideki Asoh
1,
Yutaka Oiwa
2 and
Yoshiki Seo
2 1
Artificial Intelligence Research Center (AIRC), National Institute of Advanced Industrial Science and Technology (AIST), Tokyo 305-8567, Japan
2
Digital Architecture Research Center (DigiARC), National Institute of Advanced Industrial Science and Technology (AIST), Tokyo 305-8567, Japan
3
Cyber Physical Security Research Center (CPSEC), National Institute of Advanced Industrial Science and Technology (AIST), Osaka 563-0026, Japan
*
Author to whom correspondence should be addressed.
Appl. Sci. 2021, 11(15), 6826; https://0-doi-org.brum.beds.ac.uk/10.3390/app11156826
Submission received: 23 June 2021
/
Revised: 16 July 2021
/
Accepted: 19 July 2021
/
Published: 25 July 2021
(This article belongs to the Special Issue AI Engineering: Software Engineering for Artificial Intelligence—Development of Complex Machine Learning Systems)
Abstract
:Facing the increasing quantity of AI models applications, especially in life- and property-related fields, it is crucial for designers to construct safety- and security-critical systems. As a major factor affecting the safety of AI models, corner case data and its related description/detection techniques are important in the AI design phase and quality assurance. In this paper, inspired by surprise adequacy (SA), a tool having advantages on capture data behaviors, we developed three modified versions of distance-based-SA (DSA) for detecting corner cases in classification problems. Through the experiment analysis on MNIST, CIFAR, and industrial example data, the feasibility and usefulness of the proposed tools on corner case data detection are verified. Moreover, Qualitative and quantitative experiments validated that the developed DSA tools can achieve improved performance in describing corner cases’ behaviors.
1. Introduction
As the fast development of machine learning technologies in the last decade, especially Deep Learning (DL) based techniques, it makes Artificial Intelligent (AI) a widely-known term in both industries and our daily life. However, its fast development also makes us concerning AI applications’ quality, e.g., the safety of DL-based systems [1]. As more complex architectures of deep neural networks are applied to obtain high accuracy in applications, the safety becomes more critical than ever before, especially in life- and property-related fields, like medical diagnosis [2], malware detection [3], autonomous driving [4] and so on. For instance, autonomous driving is being developed in many big companies, like Tesla, Ford, Waymo/Google, but several serious accidents have happened in the real world due to DLs’ safety issues [5,6]. These accidents imminently grab scholars’ attention around the world on studies about finding factors affecting the safety in DL systems testing and taking measurements to eliminate them.
In both traditional software and DL-based systems, incorrect or unexpected corner case behaviors are always regarded to play an important part in affecting systems’ safety [7]. For example, in autonomous driving, many reported real-world collision cases are related to those rare or previously unseen corner cases. In [8], a collision between a Tesla car and a trailer was reported since the Tesla’s DL system failed to deal with the corner cases of “white color against a brightly lit sky” and the “high ride height”. Another collision was reported on a Google self-driving car crashed to a bus since its DL system made wrong decision on rare conditions (corner cases) [9]. Besides the given two examples, many other wrong decisions made by AI systems are more or less related to different corner cases. For instances, in cerebral small vessel disease, due to the heterogeneous parenchymal damage in morphology and size [10], corner cases happen to cause DL models to make wrong decisions. The other corner case study in wind engineering is ramp study, which brings harm to the electricity industry’s safety [11]. Therefore, to detect and fix those potential flaws or undesired corner case behaviors, namely corner case detection, is surely crucial for system designers to construct safety- and security-critical DL systems, and it should also be a necessary part of systematical AI testing.
Currently, many scholars are studying corner cases and related AI testing techniques [12,13]. Firstly, from the perspective of concepts, corner cases are namely those erroneous behaviors in the DL-based software, which are analogous to bugs in traditional software [14]. Different to traditional software, corner cases of DL systems pay more attention to data distribution instead of system architectures. Hence, traditional software usually aims at patch fixing after bug detection, DL-based systems need to consider these detected erroneous corner case data in the AI model retraining process for improving its robustness on structure and parameters. Secondly, research on corner cases mainly includes the following two parts. One kind of study is to test a given DL model’s robustness and stability when facing corner case data. For example, some adversarial attack strategies, such as in [15,16], are applied to the original testing data to generate adversarial samples which can reflect the feature of corner cases to some extent, then the DL model’s accuracy and robustness are tested. The DeepFool proposed in [17] can also realize the generation of adversarial corner cases and robustness testing. The DeepMutation proposed in [18] aimed at mutating DL models’ structure and parameters directly, and testing the modified model’s performance on the original testing data. Moreover, through mutation and testing, some undetected corner cases can be further detected. For example, if a data point is found erroneous after a small model mutation, it is possible to be regarded as a potential corner case data due to its high risk of causing wrong decisions. However, considering current industrial DL systems always having thousands of neurons and millions of parameters, it is extremely challenging to detect the corner cases via introducing small mutations or perturbations on models. The other kind of study is to generate corner case data for retraining and improving DL systems’ performance. For instance, the DeepMutation technique also proposed some mutation operators on the data and generated some corner cases for DL model testing. In [19], biased corner cases were also generated from MNIST dataset based on the metamorphic testing technique. Moreover, the DeepTest method proposed in [7] aimed at the autonomous driving scenario, and generated lots of corner cases by leveraging image transformation techniques to change the driving conditions, like rain, fog, and lightning. Furthermore, the DeepXplore method [20] proposed an idea of neuron coverage and made use of it to iteratively learn erroneous corner cases. There were thousands of incorrect corner case behaviors generated in DeepXplore. However, even though companies like Tesla and Google have developed many effective techniques in corner case studies, it is still hardly possible to generate and consider all kinds of corner cases in the training process. The only feasible way would be studying a way for detecting corner cases as possible in AI testing.
Concerning the mentioned techniques and problems on corner case studies, this research proposes to develop a novel corner case data detection method by using modified distance-based surprise adequacy (DSA). The idea of surprise adequacy (SA) was initially proposed by Kim et al. [21], which can be used as a test adequacy tool for DL system testing. SA’s initial property is to describe the surprise of testing data with respect to the training data, namely to describe the difference/similarity between testing and training data. In [21], two kinds of SA are developed, one based on the probability density distribution, the other based on distance similarity, and they were furthermore verified useful in industrial applications [22,23]. While, through the review of SA-related literature, two useful points can be obtained. One is that DSA is specifically effective for classification applications. The other is that SA was verified useful to capture data’s behaviors in DL testing, namely models’ neuron activation behaviors instead of plain data distribution, for example, in [22] SA was validated to correlate with the correctness answers in the NLP study. In [24], DSA was considered as an uncertainty metric to identify misclassified inputs. With consideration of these two points, this research is inspired to leverage DSA for corner case detection in classification problems, since SA’s capability on data description can be used not only on normal data but also on incorrect/erroneous data (corner case data). Moreover, to enhance DSA’s ability on capturing behaviors of corner case data, this research also proposes three kinds of modifications to the DSA definition. Furthermore, based on the proposed DSA and the corner case detection method, experiments based on benchmark classification data, such as MNIST [25] and CIFAR10 [26], and industrial application data are implemented and studied in this research. Consequently, the novelty and contributions of this research can be summarized as follows:
- SA is applied for data description, especially for corner case data description. Instead of describing data via the general plain data distribution directly, SA adapts neurons activation behaviors with respect to a DL model to describe data’s characteristics, which can capture profound data behaviors responding to DL models in quality testing;
- Three kinds of modifications on DSA definitions are developed. First, the capability of DSA on data behaviors description is inherited. Then, according to the idea that erroneous corner cases are tightly related to the classifier boundary, so modifications on the DSA definition are proposed;
- Based on DSA, a novel corner case data detection method is proposed. Different from most corner case studies, the proposed method can be utilized as a tool in recognition of corner case data. In this way, it is possible to detect any corner case data with no need to generate/learn all possible corner case data;
- Experiments on MNIST, CIFAR10, and industrial data validate the feasibility of using DSA to describe corner case data behaviors, and that it is useful to use DSA on corner case data detection. Moreover, the proposed DSA3 achieves a relatively better performance than others based on experiment results analysis.
The rest of the paper is organized as follows. Section 2 briefly describes the idea of surprise adequacy and its related calculation process. Section 3 gives out three kinds of modification based on corner case definition and their characteristics. Section 4 implements experiments on the benchmark data (MNIST and CIFAR10) and industrial classification data, and analyzes the performance of using DSA on corner case data detection. Finally, Section 5 concludes the contributions of this paper, and thinks about the future work.
2. Surprise Adequacy
To evaluate the quality of testing data in AI assurance, a good way is to study neurons behavior in terms of a given deep learning (DL) model. Generally, the more the diversity of neuron behaviors, the better the quality of testing data. There are various methods to describe neuron behaviors in DL models. For example, neuron coverage was proposed in [20], and its activation status was taken as the behavior of a testing data point responding to the DL model. Similarly, values and signs of neuron outputs can both be used to describe neurons’ activation behaviors in [27].
While, compared with those metrics reflecting independent behaviors of testing and training sets, in [21] an interesting idea was proposed to describe the difference between the testing set’s behaviors and that of the whole training set. To realize this idea, the activation status of neurons in DL models is first denoted. Assuming a set of inputs and a trained DL model M consisted of a set of neurons . For a given testing data and an ordered (sub)set of neurons , the activation behavior (namely activation trace) of x on N is expressed by the vector of activation values and it is denoted as
where each element corresponds to the activation value of x with respect to an individual neuron n in N. Hence, the set of activation traces for X is denoted as .
Then, is calculated based on the training dataset , which records neurons’ activation behaviors on all samples in . Subsequently, the activation behavior of testing data is also obtained as . Finally, combining and , surprise adequacy (SA) was defined to describe the relative novelty of testing inputs with respect to the training data. It is actually denoted as the quantitative similarity measure between and in the following form.
In [21], there are two kinds of similarity measurement proposed to formalize SA. One is the likelihood-based SA (LSA), and the other one is distance-based SA (DSA). These two SAs are validated feasible to capture the relative surprise of testing data in DL systems and describes testing data’s behaviors, which implies SAs are useful to evaluate the quality of testing data.
3. Corner Cases Detection Based on SA
3.1. Denotation of Corner Cases
As well as the execution of traditional software [28], a dangerous condition in AI system testing is processing data of corner cases which generally cause incorrect and unexpected behaviors. For example, when a DL-based autonomous driving system processes corner cases of rainy weather or strong reflection, an incorrect decision may be made leading to a crash and thus causing the loss of life or property. Therefore, detecting corner-case samples is important in AI testing. According to the above description of a corner case, we can define the corner case set as the following form
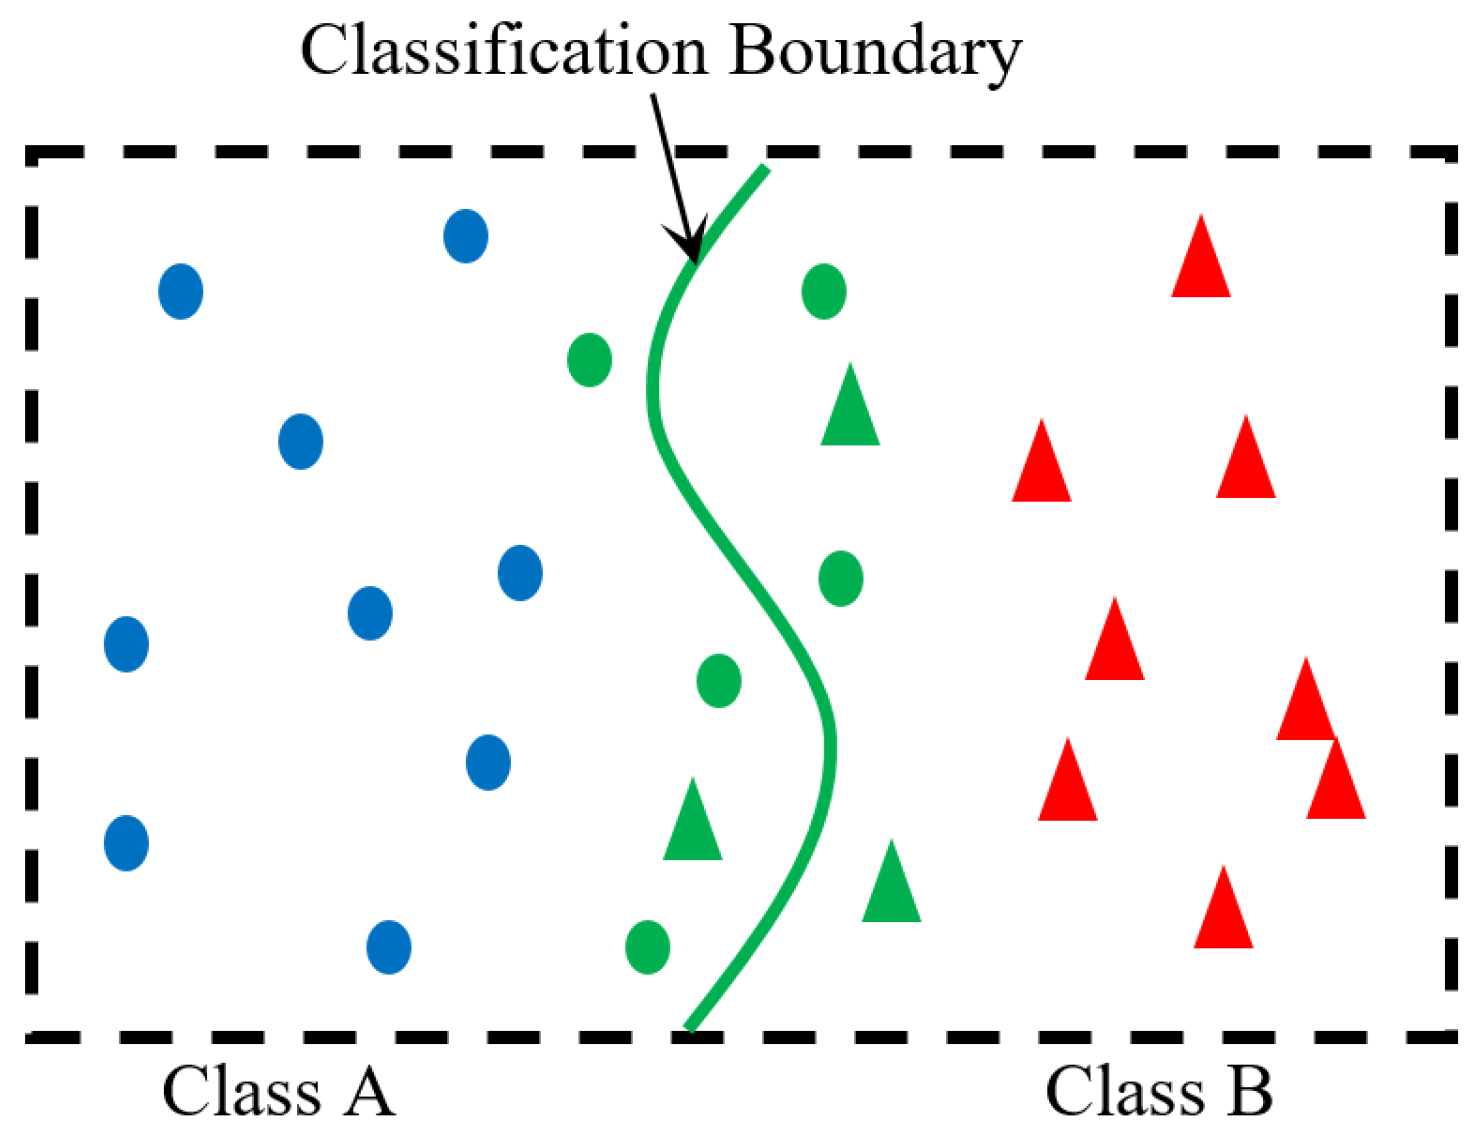
where, x is denoted as a sample in corner case; its true label is denoted as ; is the output class based on a given DL model. Through this definition, we see when a small perturbation is added into a corner-case data x, where is a small value such that for a constant , the class is recognized by the DL system will be different from its true label. In this way, a corner case set can include data samples with both incorrect and unexpected behaviors, e.g., boundary adversarial data and incorrectly classified data (outliers), as shown in Figure 1.
3.2. Distance-Based SA and Its Modification
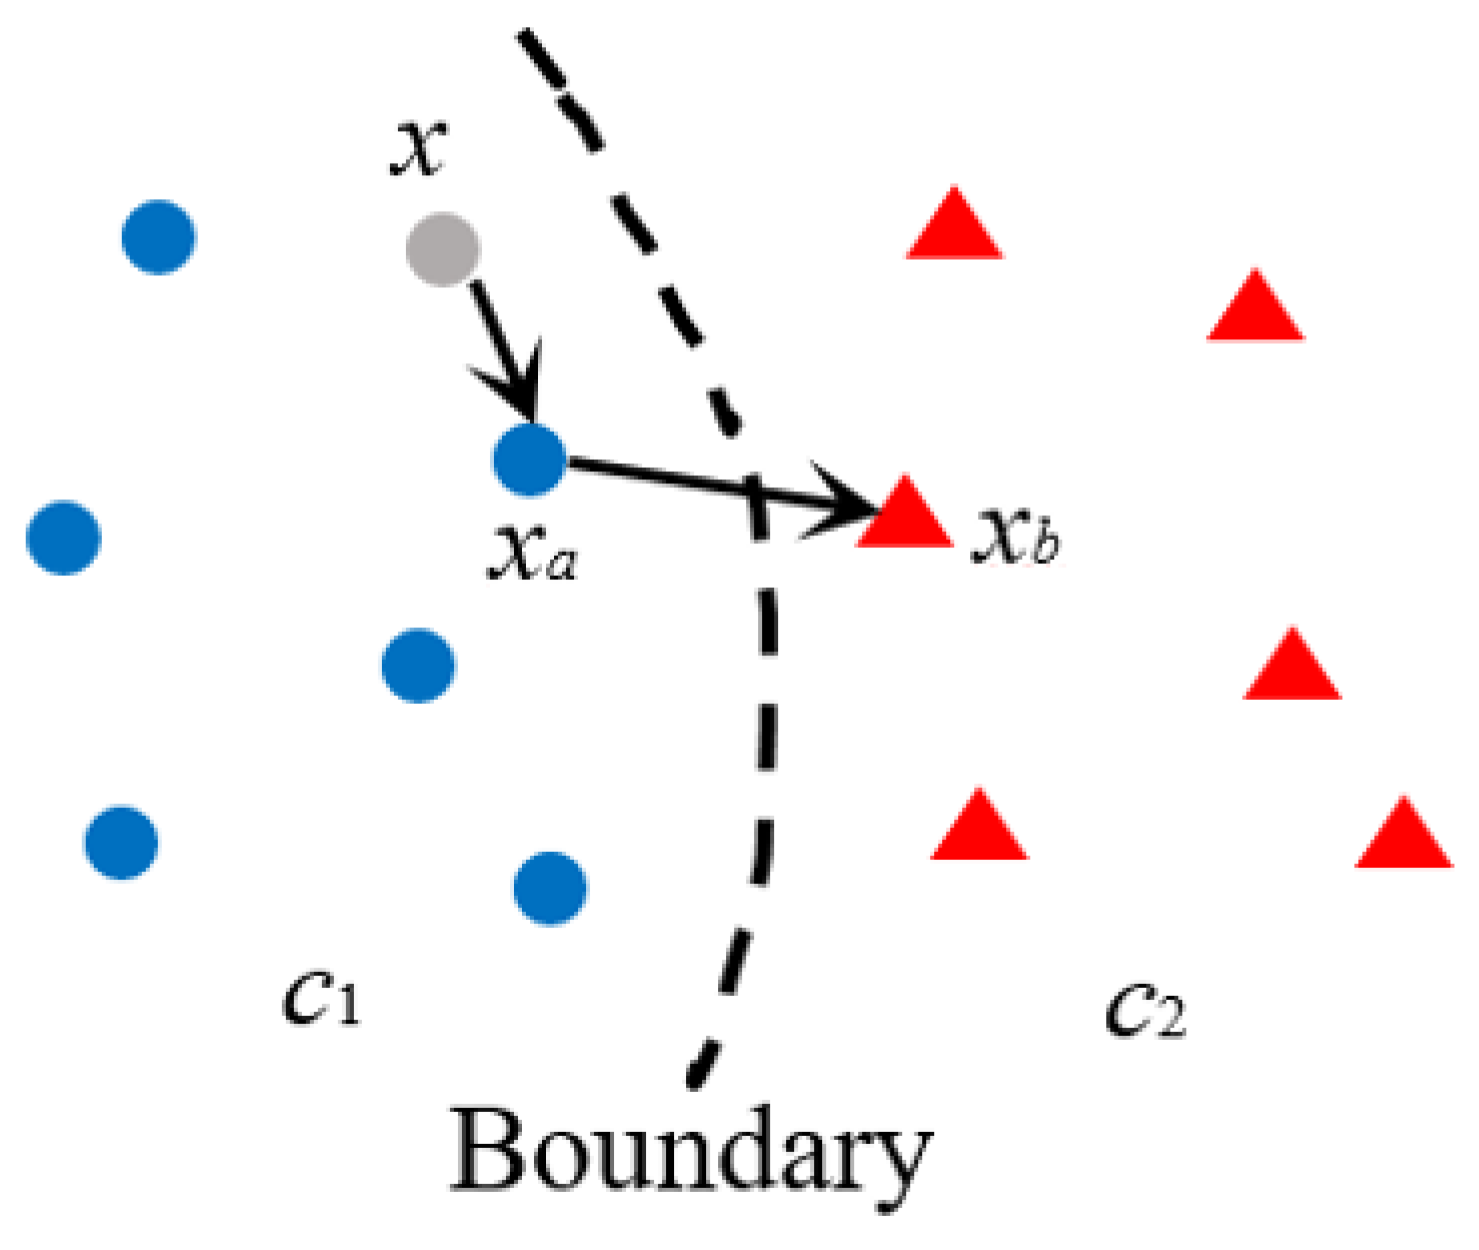
Considering SA can capture the behavior of testing data, therefore we may think about the possibility of using SA to describe behaviors of data in a corner case. Here, we mainly consider the distance-based SA (DSA), as it describes the relation of testing data with respect to the classification boundary. According to the DSA definition in [21], firstly assuming a DL model M consisting of a set of neurons N, it is learned based on a training dataset with C classes. According to the denotation of SA, the activation traces of Tr can be calculated as based on the trained M. Then, for a new testing input x in the class , its nearest neighbor in is denoted as . Finally, the surprise of x with respect to class can be calculated as the distance between their activation trace , as the following form
where, is the Euclidean distance. Subsequently, taking as the reference point and finding its nearest neighbor in a class different from , then the surprise between and is also calculated
Combining the above definitions, the SA of testing data x to the training data is consequently defined as the ratio between and , as below
According to this definition, it is seen if the numerator is larger and the denominator is smaller, the value of DSA will be larger, implying that the testing data x is a surprise to the data of class in the training set, as shown in Figure 2. Therefore, we can see that DSA shows a way of describing data’s surprise to training data by distance, and it is also useful to describe data’s activation behaviors with respect to the given DL model. While the above definition of DSA is simple, it has some drawbacks to deal with independent data points in extreme cases. Moreover, to evaluate its capability in detecting the data of corner cases, several additional modifications are also proposed in this paper to formalize DSA for corner case detection.
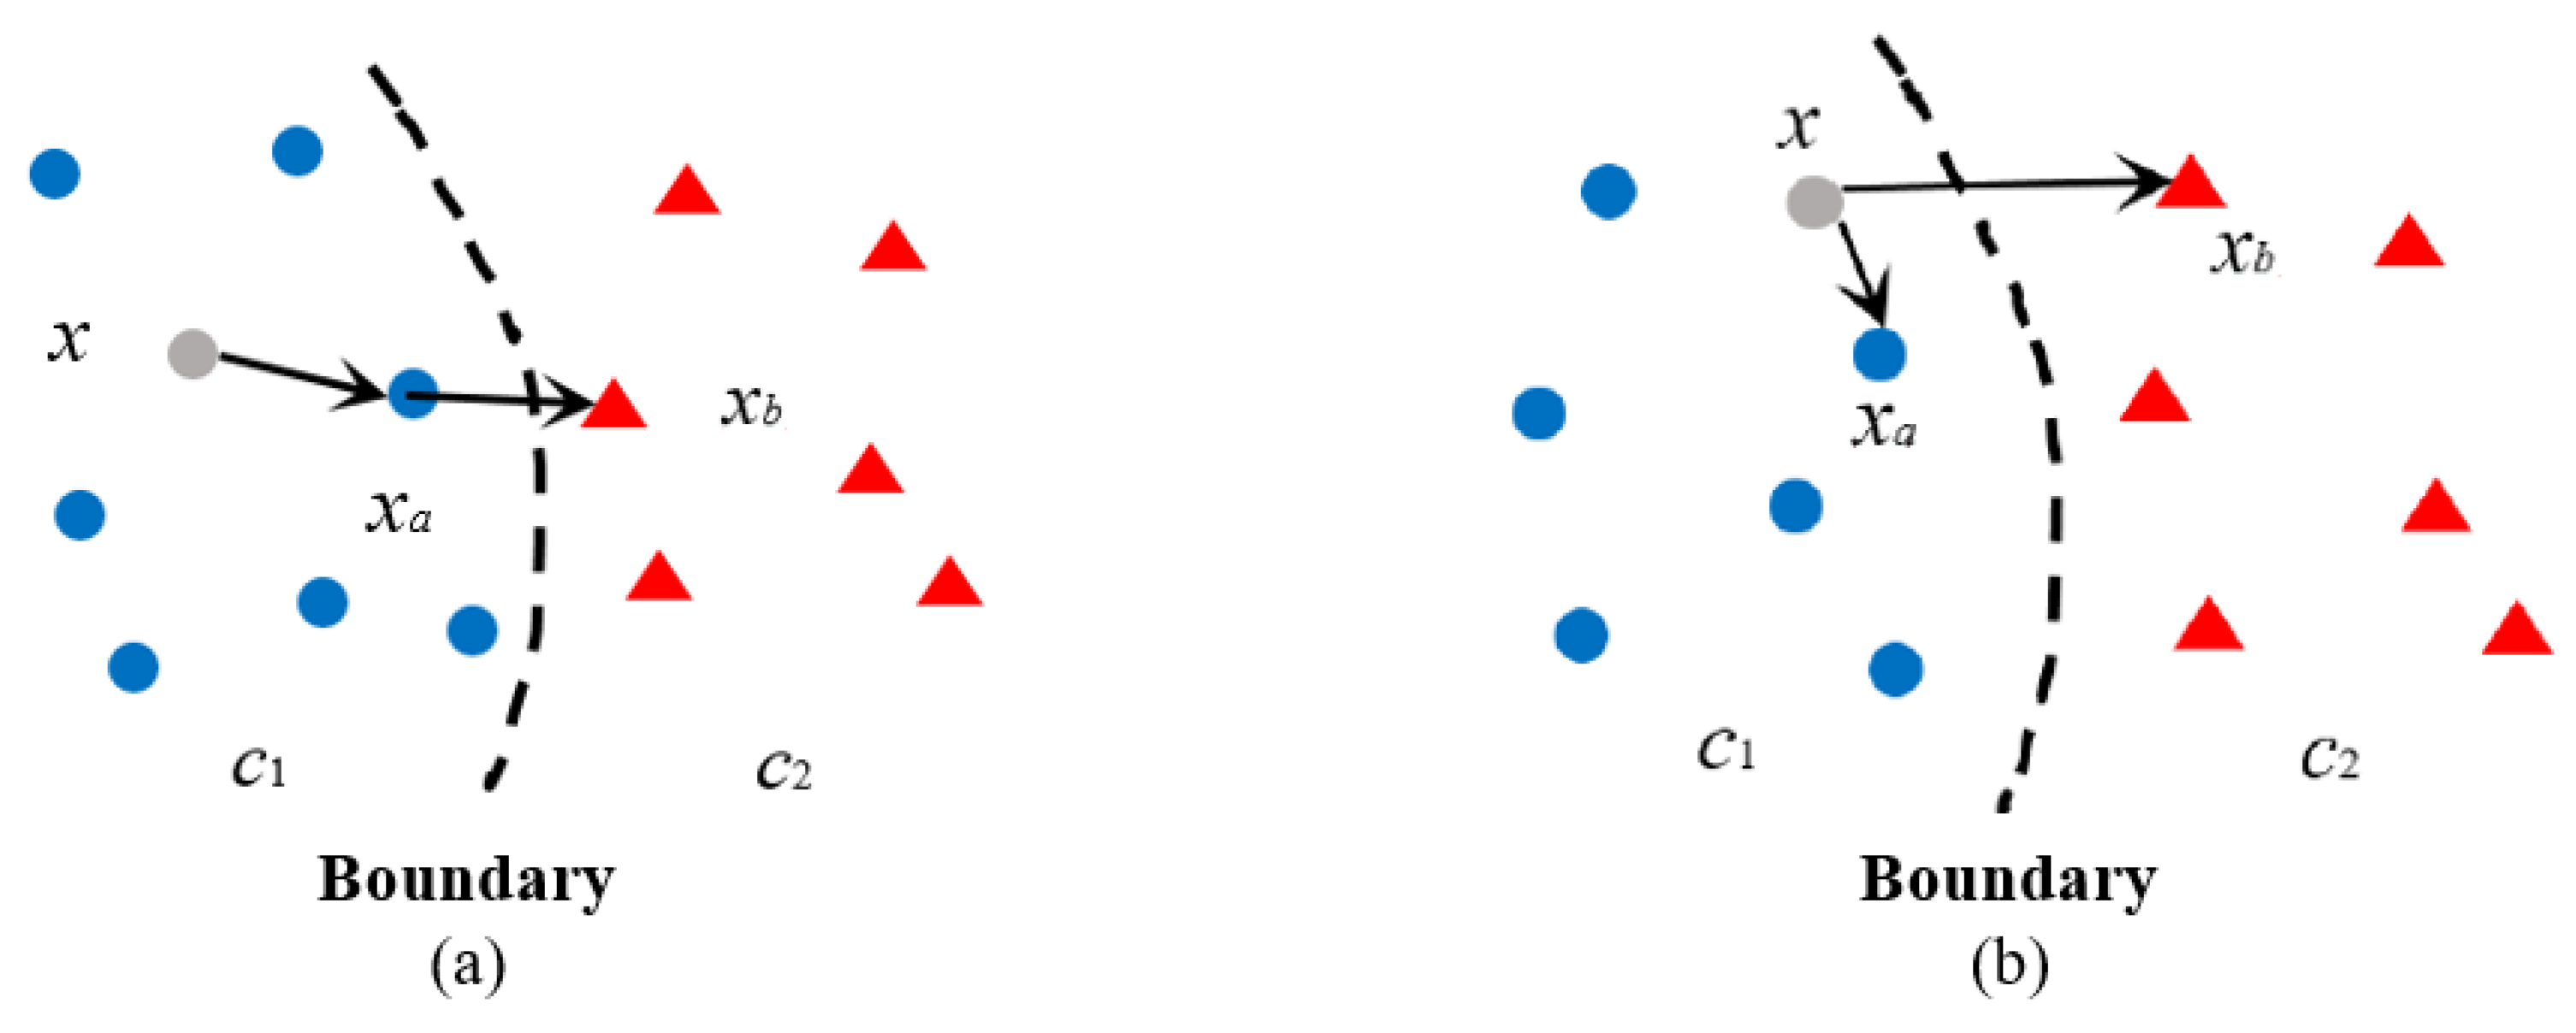
(1) Modification 1: novelty calculation via testing data itself
In the original DSA definition, we see that the denominator is actually to calculate the surprise of (the nearest neighbor of the testing data x in the same class) respect to data of other different classes. Therefore, DSA can be regarded as the comparison between x’s novelty in its belonging class and its class novelty to other classes. This definition may be useful to describe the surprise of comparing the testing data with the whole training data. However, to evaluate if a data sample belongs to corner case, its own novelty with respect to all classes seems more important. Hence, we modify the original DSA by just adjusting the definition of as the following form
The calculation of DSA keeps unchanged. This modification makes DSA consider surprises of testing data x to all classes independently, which may be helpful to reflect the behaviors of data in corner cases, as shown in Figure 3b.
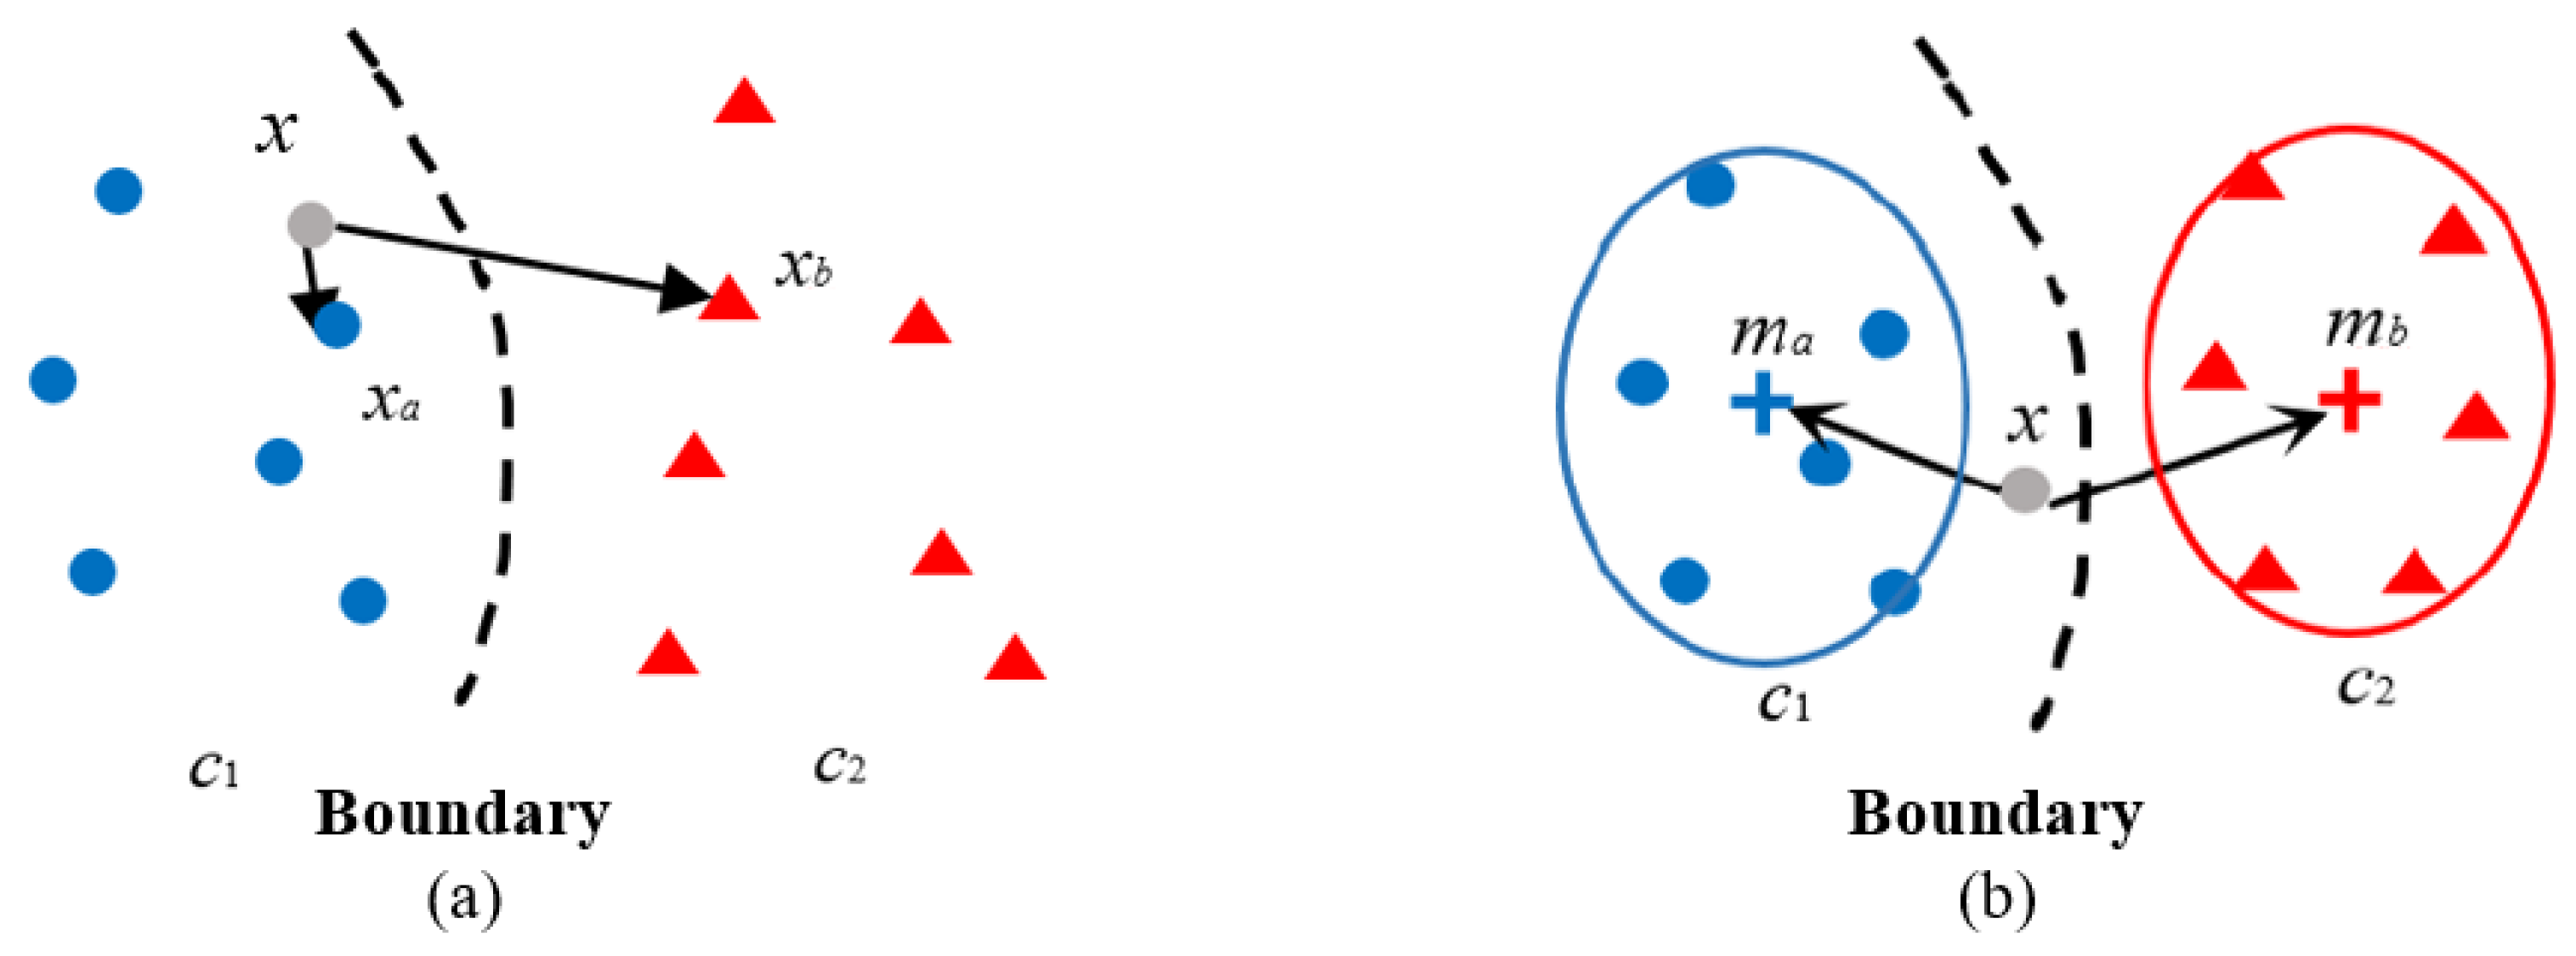
(2) Modification 2: novelty calculation via global data descriptors
Compared with the original DSA, the first modification considers surprise of testing data x to data of all classes. While, these two DSA definitions may have a common shortage on processing pair-wise rare data points, especially on describing behaviors of corner case. For example, assuming the testing data x is the corner-case data, there happens to exist a neighbor very close to x, namely , since the above DSA are calculated based on the distance of point-to-point, this may lead DSA to be a low value due to , as shown in Figure 4a. In this case, the novelty of x with respect to training data is regarded as small based on SA definition. However, this result causes novel inconsistent behavior in the data for the corner case. Furthermore, this result will be meaningless for corner case study as well. Therefore, a possible modification based on the first modification is to select a more general class descriptor for surprise calculation. In [29], the class centers were commonly used as feasible global descriptors. Hence, we can replace the nearest neighbor with the class center in surprise calculation, and the new equations can be written as below
where is the center of the class which x belongs to; is the center of a different class which the closest point to x belongs to. For each , the center point is calculated by
Then, the newly modified DSA can be calculated as . Its diagram is shown in Figure 4b.
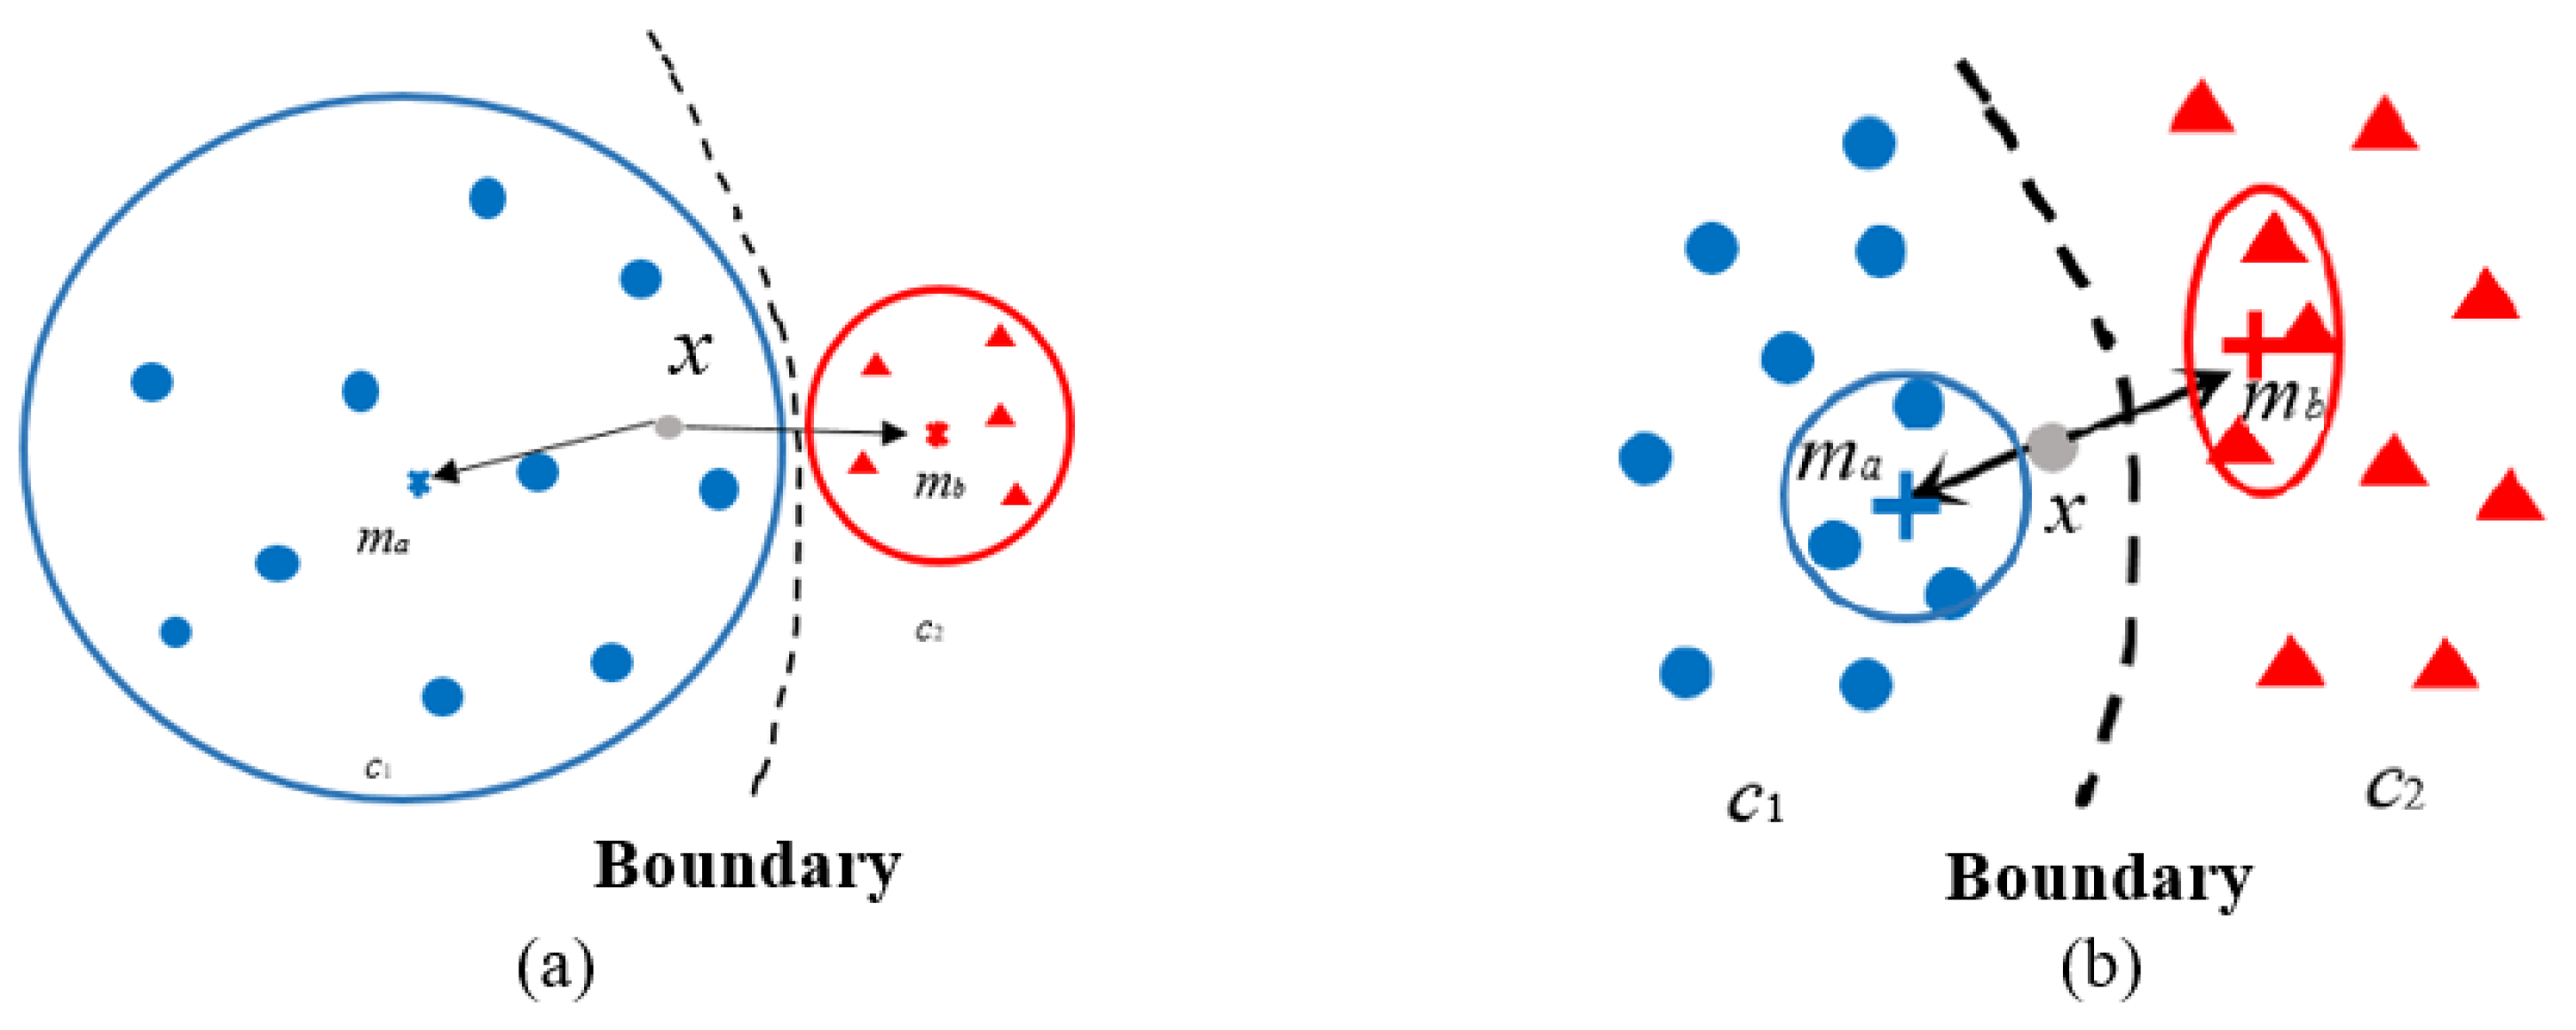
(3) Modification 3: novelty calculation via local data descriptors
In the above modification of DSA, the characteristic of a class is simply described by the class center. However, corner-case data usually have some obvious characteristics of closing to boundary or outlier location. Class centers are good global descriptors of classes, but not effective to capture local characteristics, e.g., in reflecting the characteristics of corner case data in imbalanced data (as shown in Figure 5a). In this paper, to modify DSA for corner case data detection, we propose to replace the global descriptors with local descriptors, e.g., the center of the nearest neighborhood shown in Figure 5b. The DSA of testing data x can be still calculated via (11), (12) and (8), while the calculation of the center for each should be modified as
where () represents the neighborhood set of inputs included in the hyper-sphere whose center is and radius is , namely several nearest neighbors of . Here, two methods of determining the neighborhood set are provided. One kind of neighborhood is denoted by a given size of Euclidean round (i.e., the same radius for all inputs is used), as follows
where, () and () are inputs explained in the previous Modification 2 and is the set defined in (13). An alternative definition of the nearest neighborhood is determined by k-nearest points [30]. In this case, the radius is given for each such that includes only k nearest neighbors of (i.e., ) and therefore
where, is the nearest point to .
3.3. Corner Case Data Coverage
Based on the above definitions of DSA, including the original one and modifications, corner case data can be detected from the original dataset. Afterward, many potential studies related to corner cases can be considered, e.g., corner case’s influence on modeling accuracy, data quality assurance, AI testing quality study, robustness and safety analysis with consideration of corner cases, and so on. Moreover, to study the DSA’s behaviors in responding to corner case data, a quantitative evaluation on the capability of DSA in corner case data detection is required. Therefore we propose a metric as corner-case data coverage in the following form
where, is a given threshold; represents the dataset of corner case data; is the cardinality; represents the set consisting of all detected corner case data which have DSA values larger than the given threshold. Considering not all of the data in corner cases are detectable, here we only take the detectable corner-case data into account, namely those data wrongly recognized by DL. In this way, the proposed corner case data coverage is actually to evaluate the percentage of erroneous behaviors of DL systems.
4. Experiments and Evaluation
4.1. Benchmark Dataset Analysis
(1) Data source and DL system description
To study behaviors of the proposed DSA on corner case data detection, in this paper we take the MNIST data [25] as a reference in experiment and analysis. MNIST is a widely-used dataset in machine learning research, which contains ten classes of images, and is divided into 60,000/10,000 training/testing samples. To recognize different numbers in MNIST, we adopt a commonly-used five-layer Convolutional Neural Network (CNN), including the convolutional, max-pooling, dropout, and full-connection layers. On the other hand, experiments in this paper are implemented on a machine equipped with Intel i7-9750 CPU, 32GB RAM, NVIDIA GeForce RTX 2060, running in Windows 10 Pro 64-bit OS. Code of this paper is released [31], which is developed from SADL [32] on Keras and contains the proposed three kinds of modification of DSA.
(2) Qualitative analysis on corner case data detection
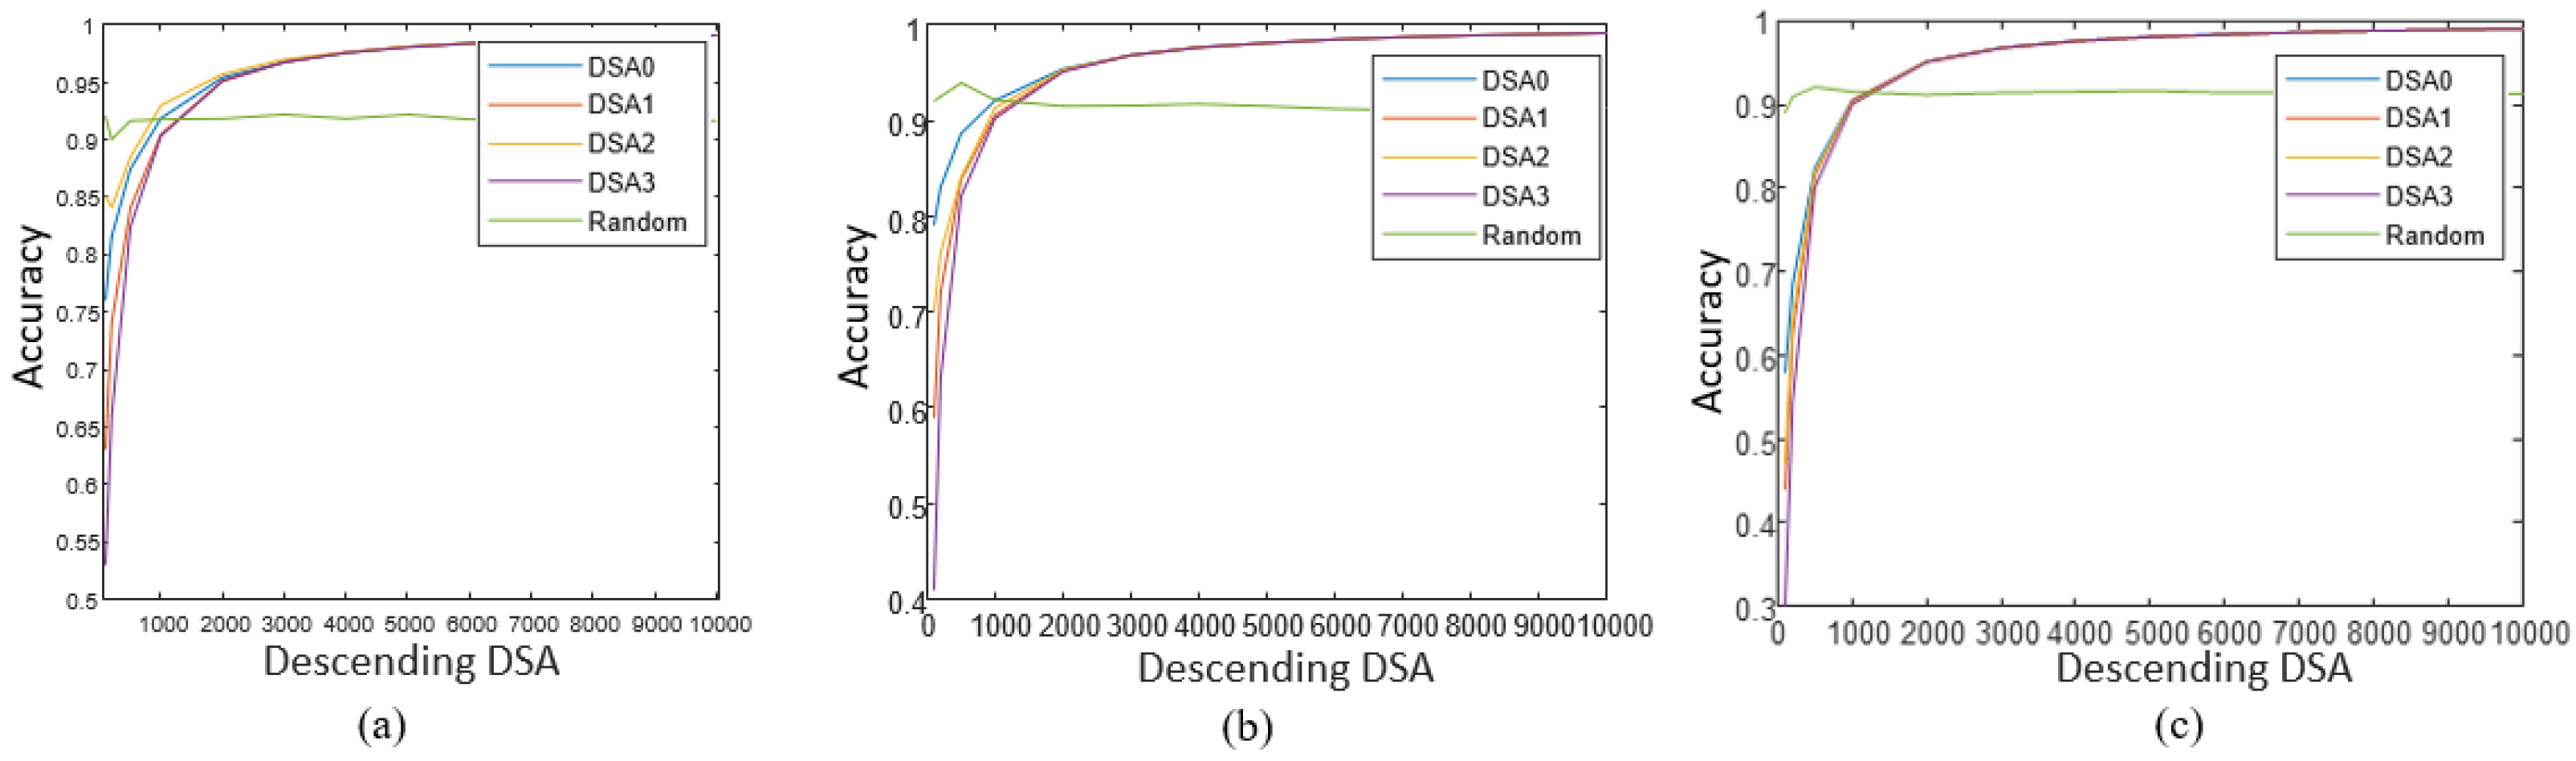
Firstly, through training the given CNN architecture above on MNIST data, we can achieve 99.17% accuracy on the original testing set. Then, based on the proposed DSA definition and the trained DL model, we can calculate the values of DSA on each testing sample, and subsequently, study DSA’s behaviors in responding to corner case data detection. By sorting all testing samples as the DSA descending trend, we can first study the influence of DSA variation on the DL model’s performance. To implement comparative analysis, four kinds of DSA are calculated on outputs of three selected layers, such as the convolutional layer 1 (Layer1), convolutional layer 2 (Layer2), and the final full-connection layer (Layer3) of the given CNN. Results are shown in Figure 6.
Figure 6 shows the curves of accuracy vs. DSA variation, Firstly, by taking a subset containing the first samples of the sorted dataset as testing, then its testing accuracy is calculated. DSA value and accuracy are compared in the graph in Figure 3. Here, the beginning point is , and we can see the accuracy is very low. That implies there is a certain percentage of erroneous data (corner case data) in the first testing subset causing CNN with wrong decisions. This phenomenon can be found in all curves during the beginning period where testing samples all have large DSA values, especially when compared with the testing accuracy of random sampling. On the other hand, at the ending point where = 10,000 and DSA threshold is set as the least value, the whole testing dataset is considered, so the testing accuracy reaches the highest value equal to 99.17%. From these results, we can conclude that data having large DSA values is more possible to lead to misclassification than data with low DSA values. Moreover, since corner case data also could cause misclassification, it also implies that data with high DSA values can capture corner case behaviors to some extent. To vividly analyze this foundation, we can further draw out images of these samples with the high DSA values, as shown in Figure 7.
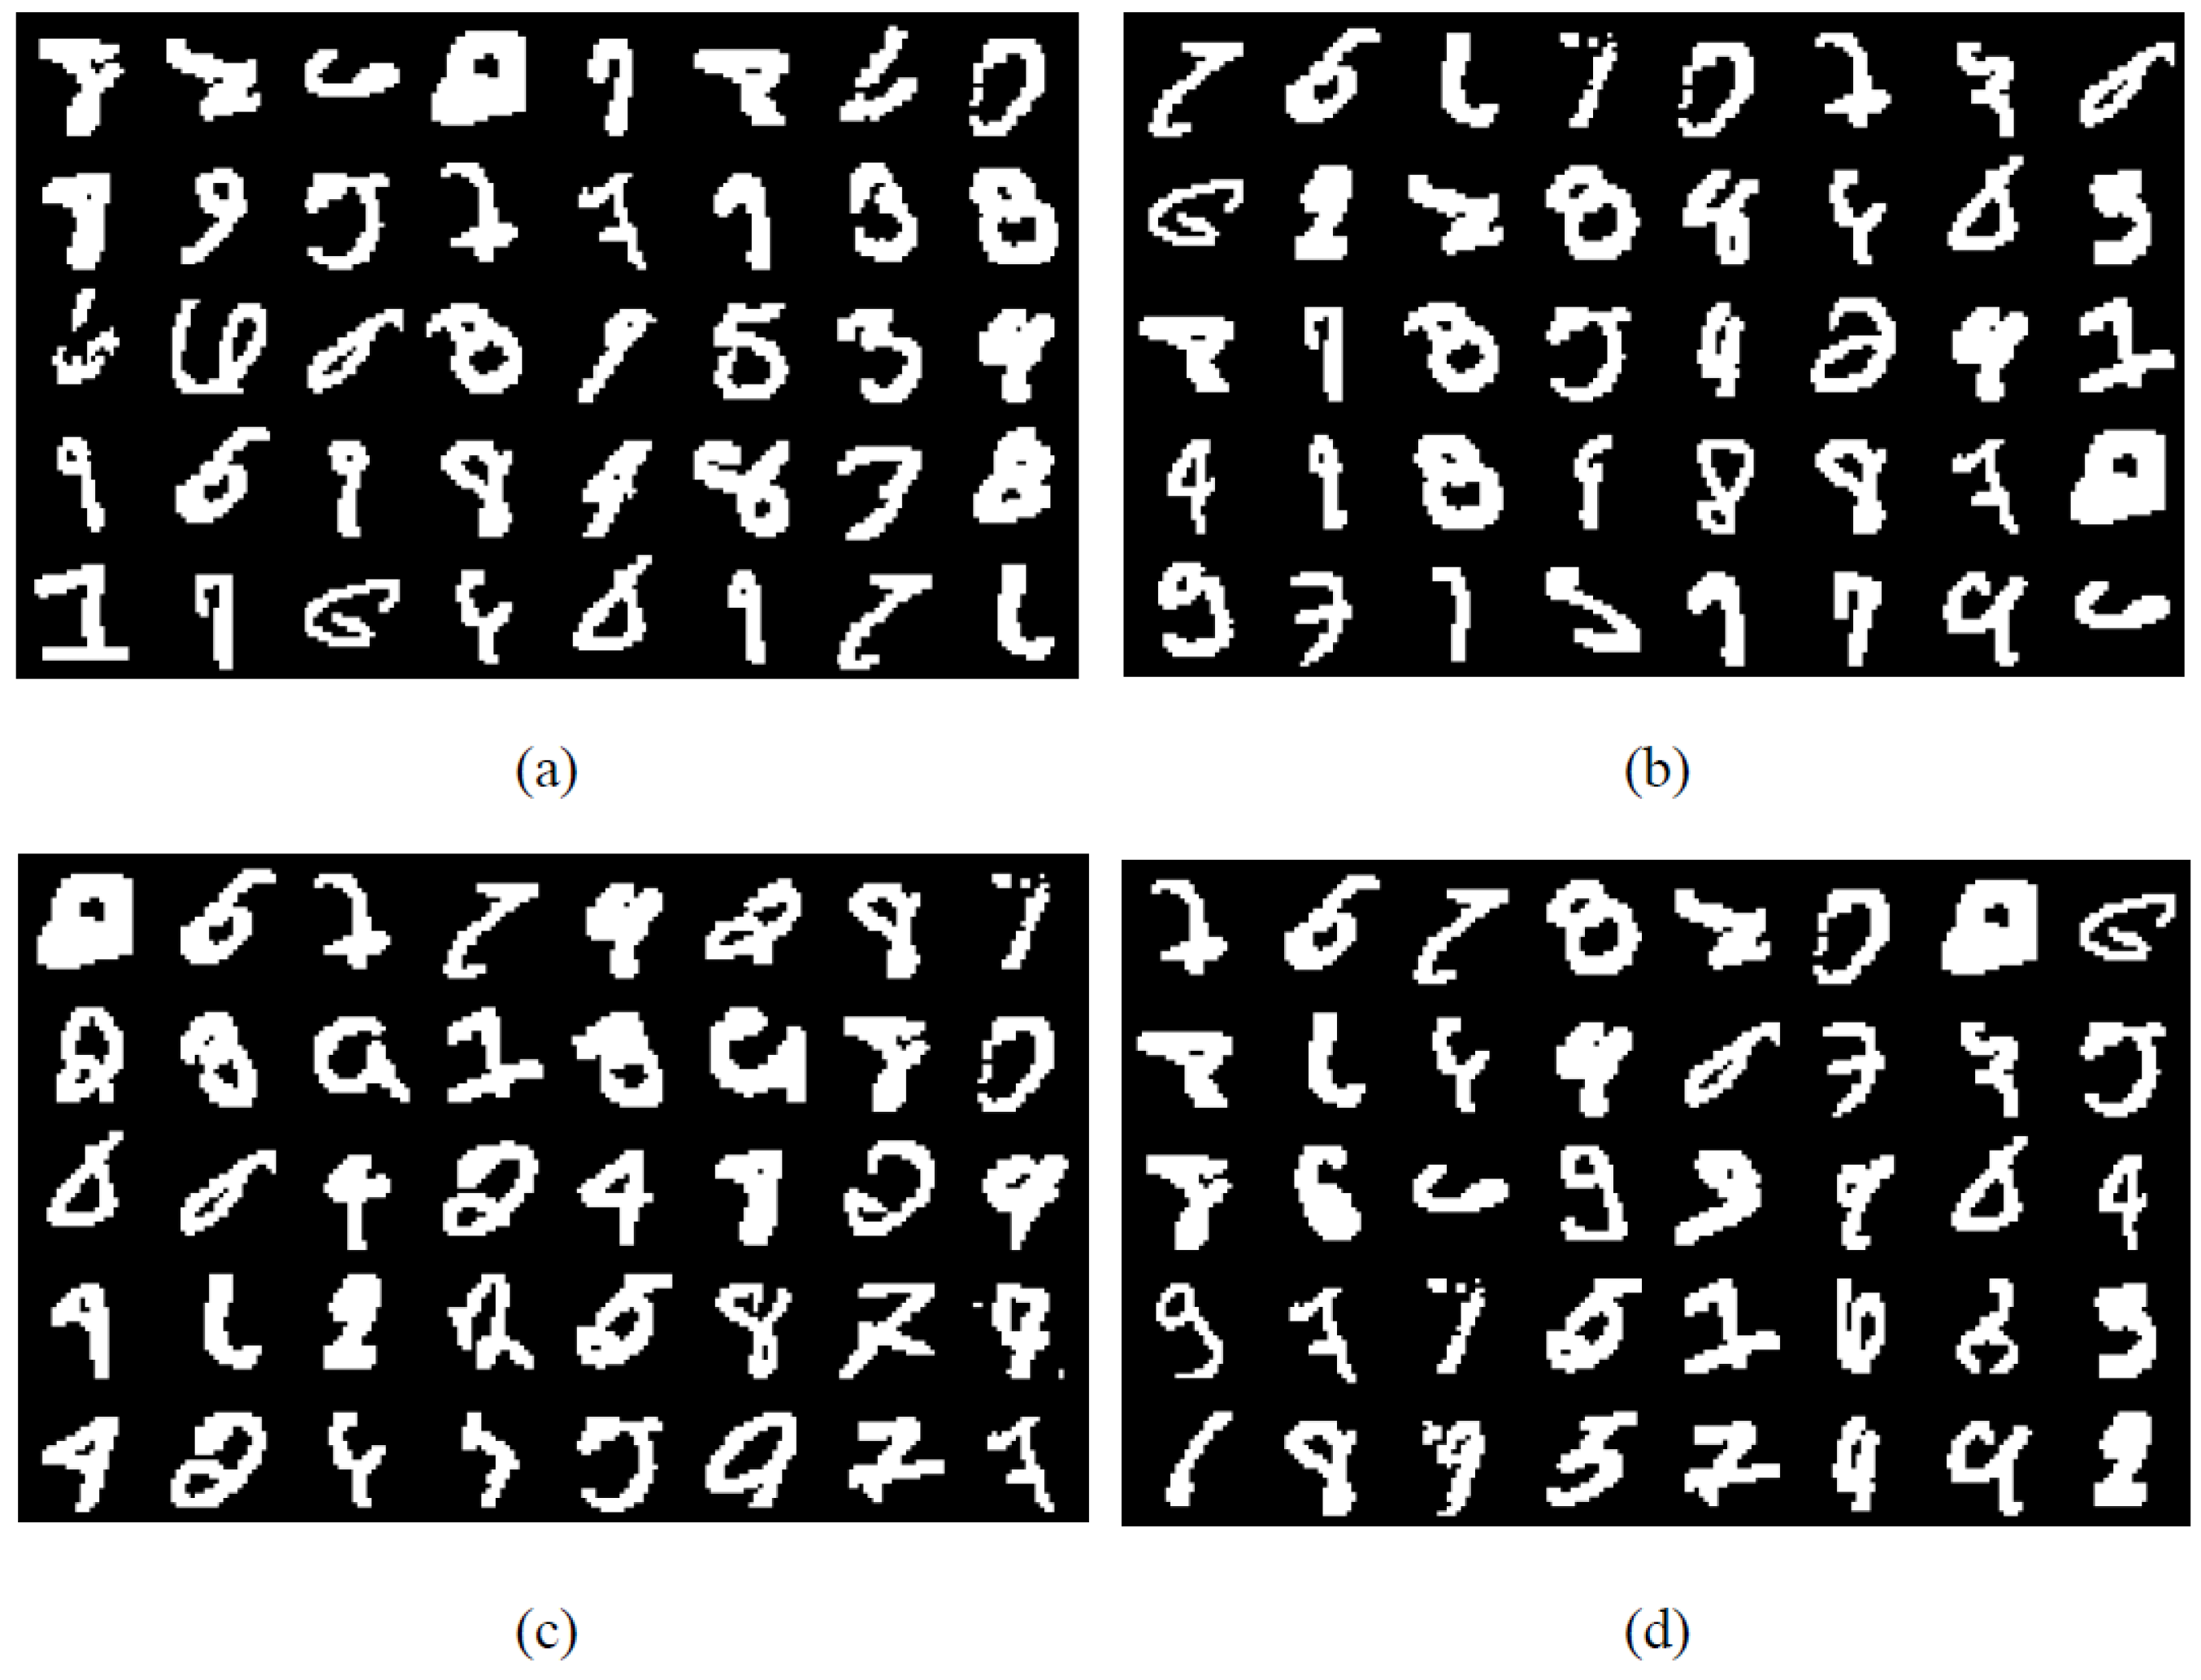
In Figure 7, images with the highest DSA values are drawn separately based on four DSA definitions, such as DSA0- DSA3 representing the original DSA and other three modifications, respectively. Here, DSA3 adopts the second definition in (16) which is more convenient in computation (e.g., k = 20). From these images, we can indeed find that these images with high DSA values have unrecognizable characteristics, such as unusual writing, thick chirography, large slant, and structure disequilibrium. It shows these data may have a high-risk to cause wrong decisions for both human beings and AIs, and be categorized as corner cases. Therefore, it qualitatively illustrates that high DSA is useful to reflect corner cases’ behaviors further.
(3) Quantitative analysis of DSA behaviors
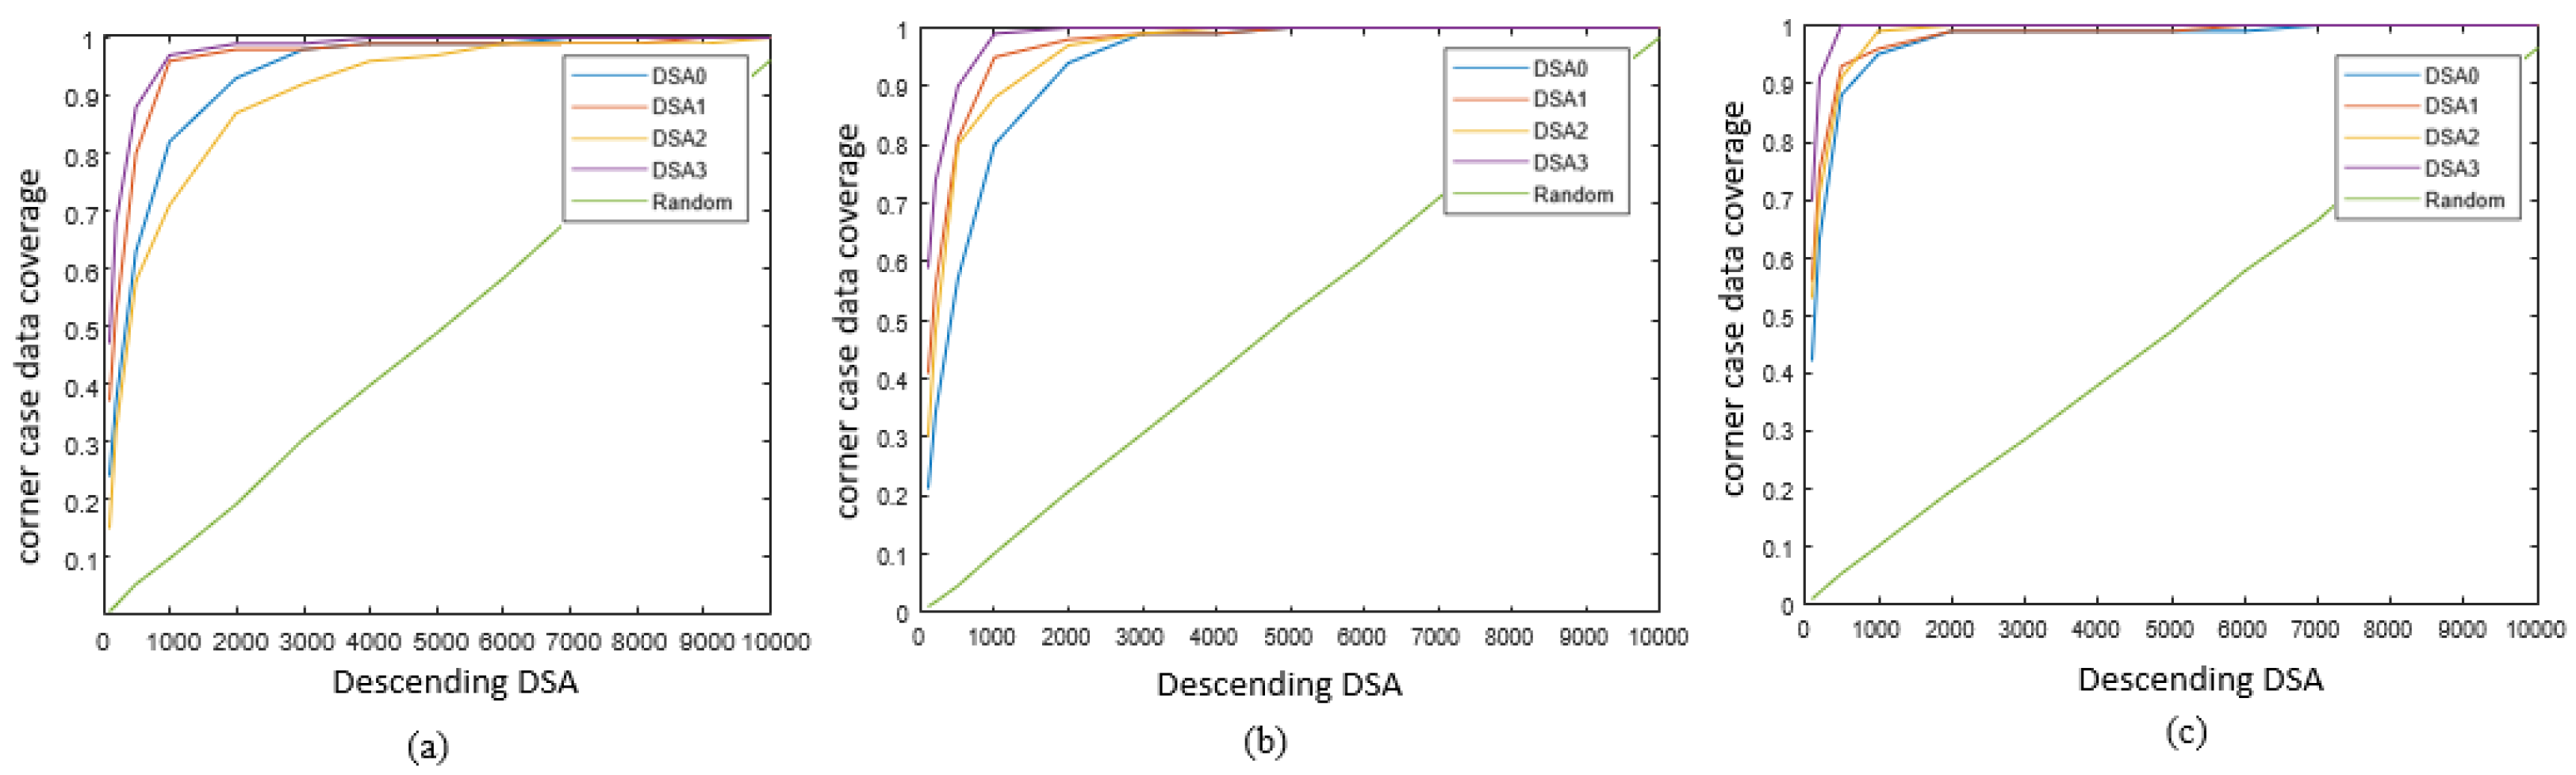
While, besides the conclusion that DSA can capture activation behaviors of data from Figure 6, we can discover other interesting phenomenon, namely DSA3 has a relatively lower accuracy in all these three layers, especially at the beginning period of curves. That means, under the same condition, high DSA3 values can capture more high-risk images than other DSAs to lower the testing accuracy, which can imply DSA3 has a better capability on corner case data detection. To verify this conjecture and to further quantitatively study different DSAs’ performance on corner case data detection, the proposed corner-case data coverage in (18) is calculated. Results of corner-case data coverage based on four DSAs are shown in Figure 8.
In Figure 8, the random sampling testing data is firstly studied. It is seen that as the amount of random testing data increases, the value of corner-case data coverage increases uniformly. To calculate the values of corner-case data coverage based on DSA, the testing data is also sorted as the descending direction of DSA values firstly, then a subset consisting of data with highest DSA values is considered for coverage study, similar with the process of accuracy study in Figure 6. According to (18), the number of wrongly classified data in the subset is counted for the calculation of corner-case data coverage. From the results of Figure 8, it’s seen that experiments using DSAs achieve larger corner-case data coverage than random testing. Considering this coverage is the reflection of the percentage of identified misclassified data, so these results illustrate that, with the consideration of large DSA values, more data is identified as corner cases compared with random testing, namely verifying DSAs’ feasibility on corner case detection. Moreover, by comparing curves of different DSA definitions, we can find the conclusion again, that DSA3 has the largest coverage values on the analysis of all three given layers, implying its better performance on corner case identification.
On the other hand, we can further utilize the measurement of AUC-ROC [33] on corner case data detection to evaluate different DSAs’ performance. By assuming the utilization of DSA values directly to distinguish normal data and corner case data, the AUC value of this binary classification process can be calculated. AUC-ROC values of four DSAs in three given layers are presented in Table 1.
Based on the result in Table 1, three conclusions can be obtained. First, for the constructed CNN model on MNIST, it indeed achieves good performances by using DSA to guide corner case data detection as all AUC values are larger than 0.9. Second, it is found that the deeper the layer is, the better DSA performs on corner case data detection, seeing AUC(Layer3) > AUC(Layer2) > AUC(Layer1), which is consistent with the ability of DL models on feature learning. Third, DSA3 can have a relatively better performance when compared to the other DSA definitions, due to its additive improvement. Therefore, based on these results, we can consider choosing the proposed DSA3 for corner case data detection in the following studies.
(4) Adversarial testing analysis
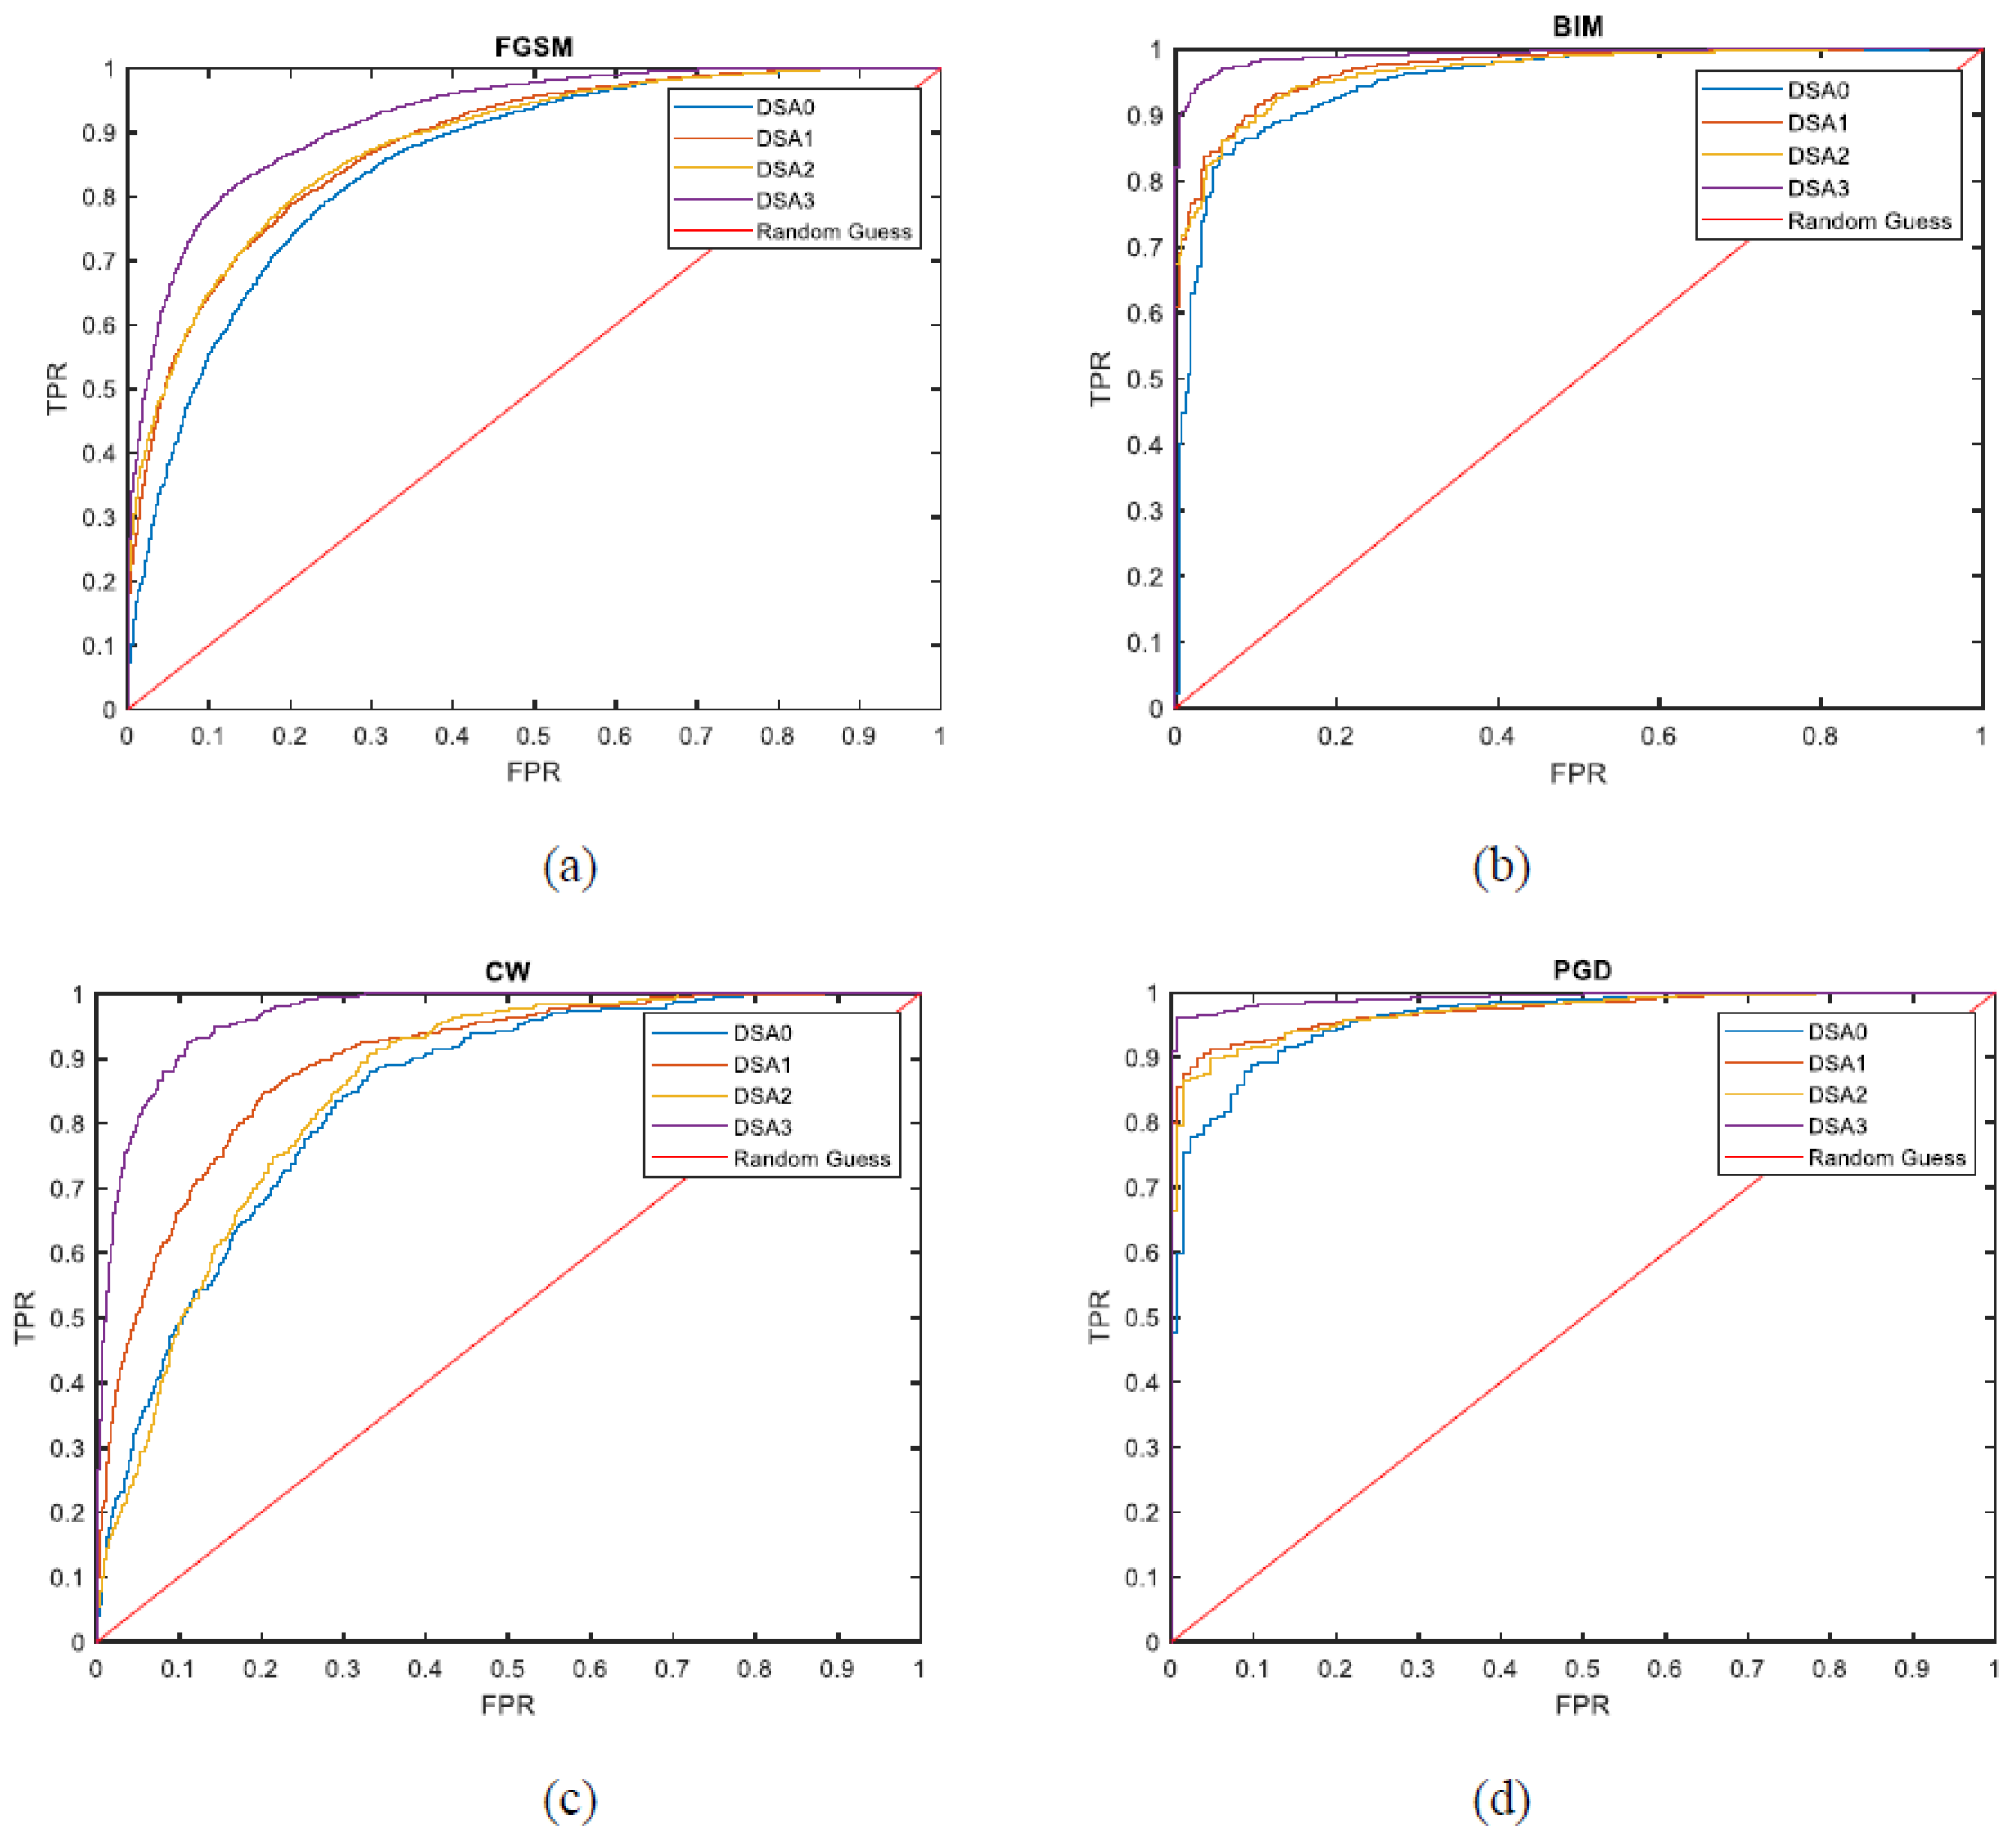
To further analyze the performance of DSA, adversarial testing, as an important AI testing technique, can also be applied here. Generally, based on the original testing data, small perturbations imperceptible to humans are added to generate adversarial samples which will lead the DL model to make wrong behaviors (outputs). There are many different attack strategies applied to generate adversarial testing set in literature. In this paper, we take four widely-studied adversarial attacks to generate new testing set on MNIST, such as Fast Gradient Sign Method (FGSM) [16], Basic Iterative Method (BIM) [34], Carlini & Wagner (C&W) [35], and Projected Gradient Descent (PGD) [36]. Then, based on these four adversarial testing datasets, the proposed DSAs are applied to detect the corner case data, namely misclassified data. Similar to the above analysis, we do not care about the exact selection of the DSA threshold, and just utilize the AUC-ROC to evaluate the performance of using DSA on corner case data detection. The results of ROC curves of four DSAs on different adversarial testing sets are depicted in Figure 9.
Figure 9 shows the ROC curves on corner case data detection, where the x-axis represents the value of FPR, and the y-axis represents the value of TPR respectively. In details [37], TPR means true positive rate, also called sensitivity or recall, which can be used to reflect the test’s ability to correctly detecting corner case data here; FPR means false positive ratio, also known as false alarm ratio, which is the probability of falsely rejecting the null hypothesis for a particular test. Their calculation are presented as below
where, TP (True Positive), FP (False Positive), FN (False Negative), TN (True Negative) are four events in the confusion matrix of corner case data detection. Moreover, based on these ROC curves, we can quantitatively calculate the values of AUC as a KPI metric, shown in Table 2.
According to the results of Table 2, the same foundation is obtained that DSA3 performs relatively better than the other DSA definitions on all these four adversarial testing sets. Moreover, their high values also verify that using DSA values as a reference on corner case detection can reach good performance. Therefore, we can make use of DSA, especially DSA3, in the following study related to corner case data and AI quality assurance.
(5) Discussion
While, besides the positive results from the above studies on using DSA and its modifications for corner case identification, there are also some negative points that should be noticed. The first one is the application limitation of DSA only for classification problems. When dealing with other machine learning applications, e.g., regression, how to copy with the corner cases would be a challenge for the research in this paper. The second one is the limitation in DSA’s modification. Even though three modifications of DSA are proposed in this paper, and achieve relatively good performance on corner case detection, DSAs’ abilities on discovering more novelty behaviors are limited since these modifications are additive to the original DSA definition. Therefore, more exploration on SA definitions can be studied, e.g., a novelty variant using silhouette coefficient was proposed in [24]. The third point is the time overhead in DSA computation. Extra time consumption is unavoidable in the corner case study. In the DSA computation process, the distances of testing points to the whole training set on activation trace should be computed, so its computation time is proportional to the training set size [38]. For the mentioned four DSAs in this paper, DSA0/1/3 have the same time complexity as the above description, except DSA2 whose computation time is proportional to the number of categories. Then, corner case detection in the whole testing set would be quadratic with the testing set and training set size. However, compared with other methods adopting mutation and multiple testing [39,40] for corner case identification, DSAs’ computation time is relatively acceptable in corner case detection.
4.2. More Datasets Analysis
(1) CIFAR10 dataset
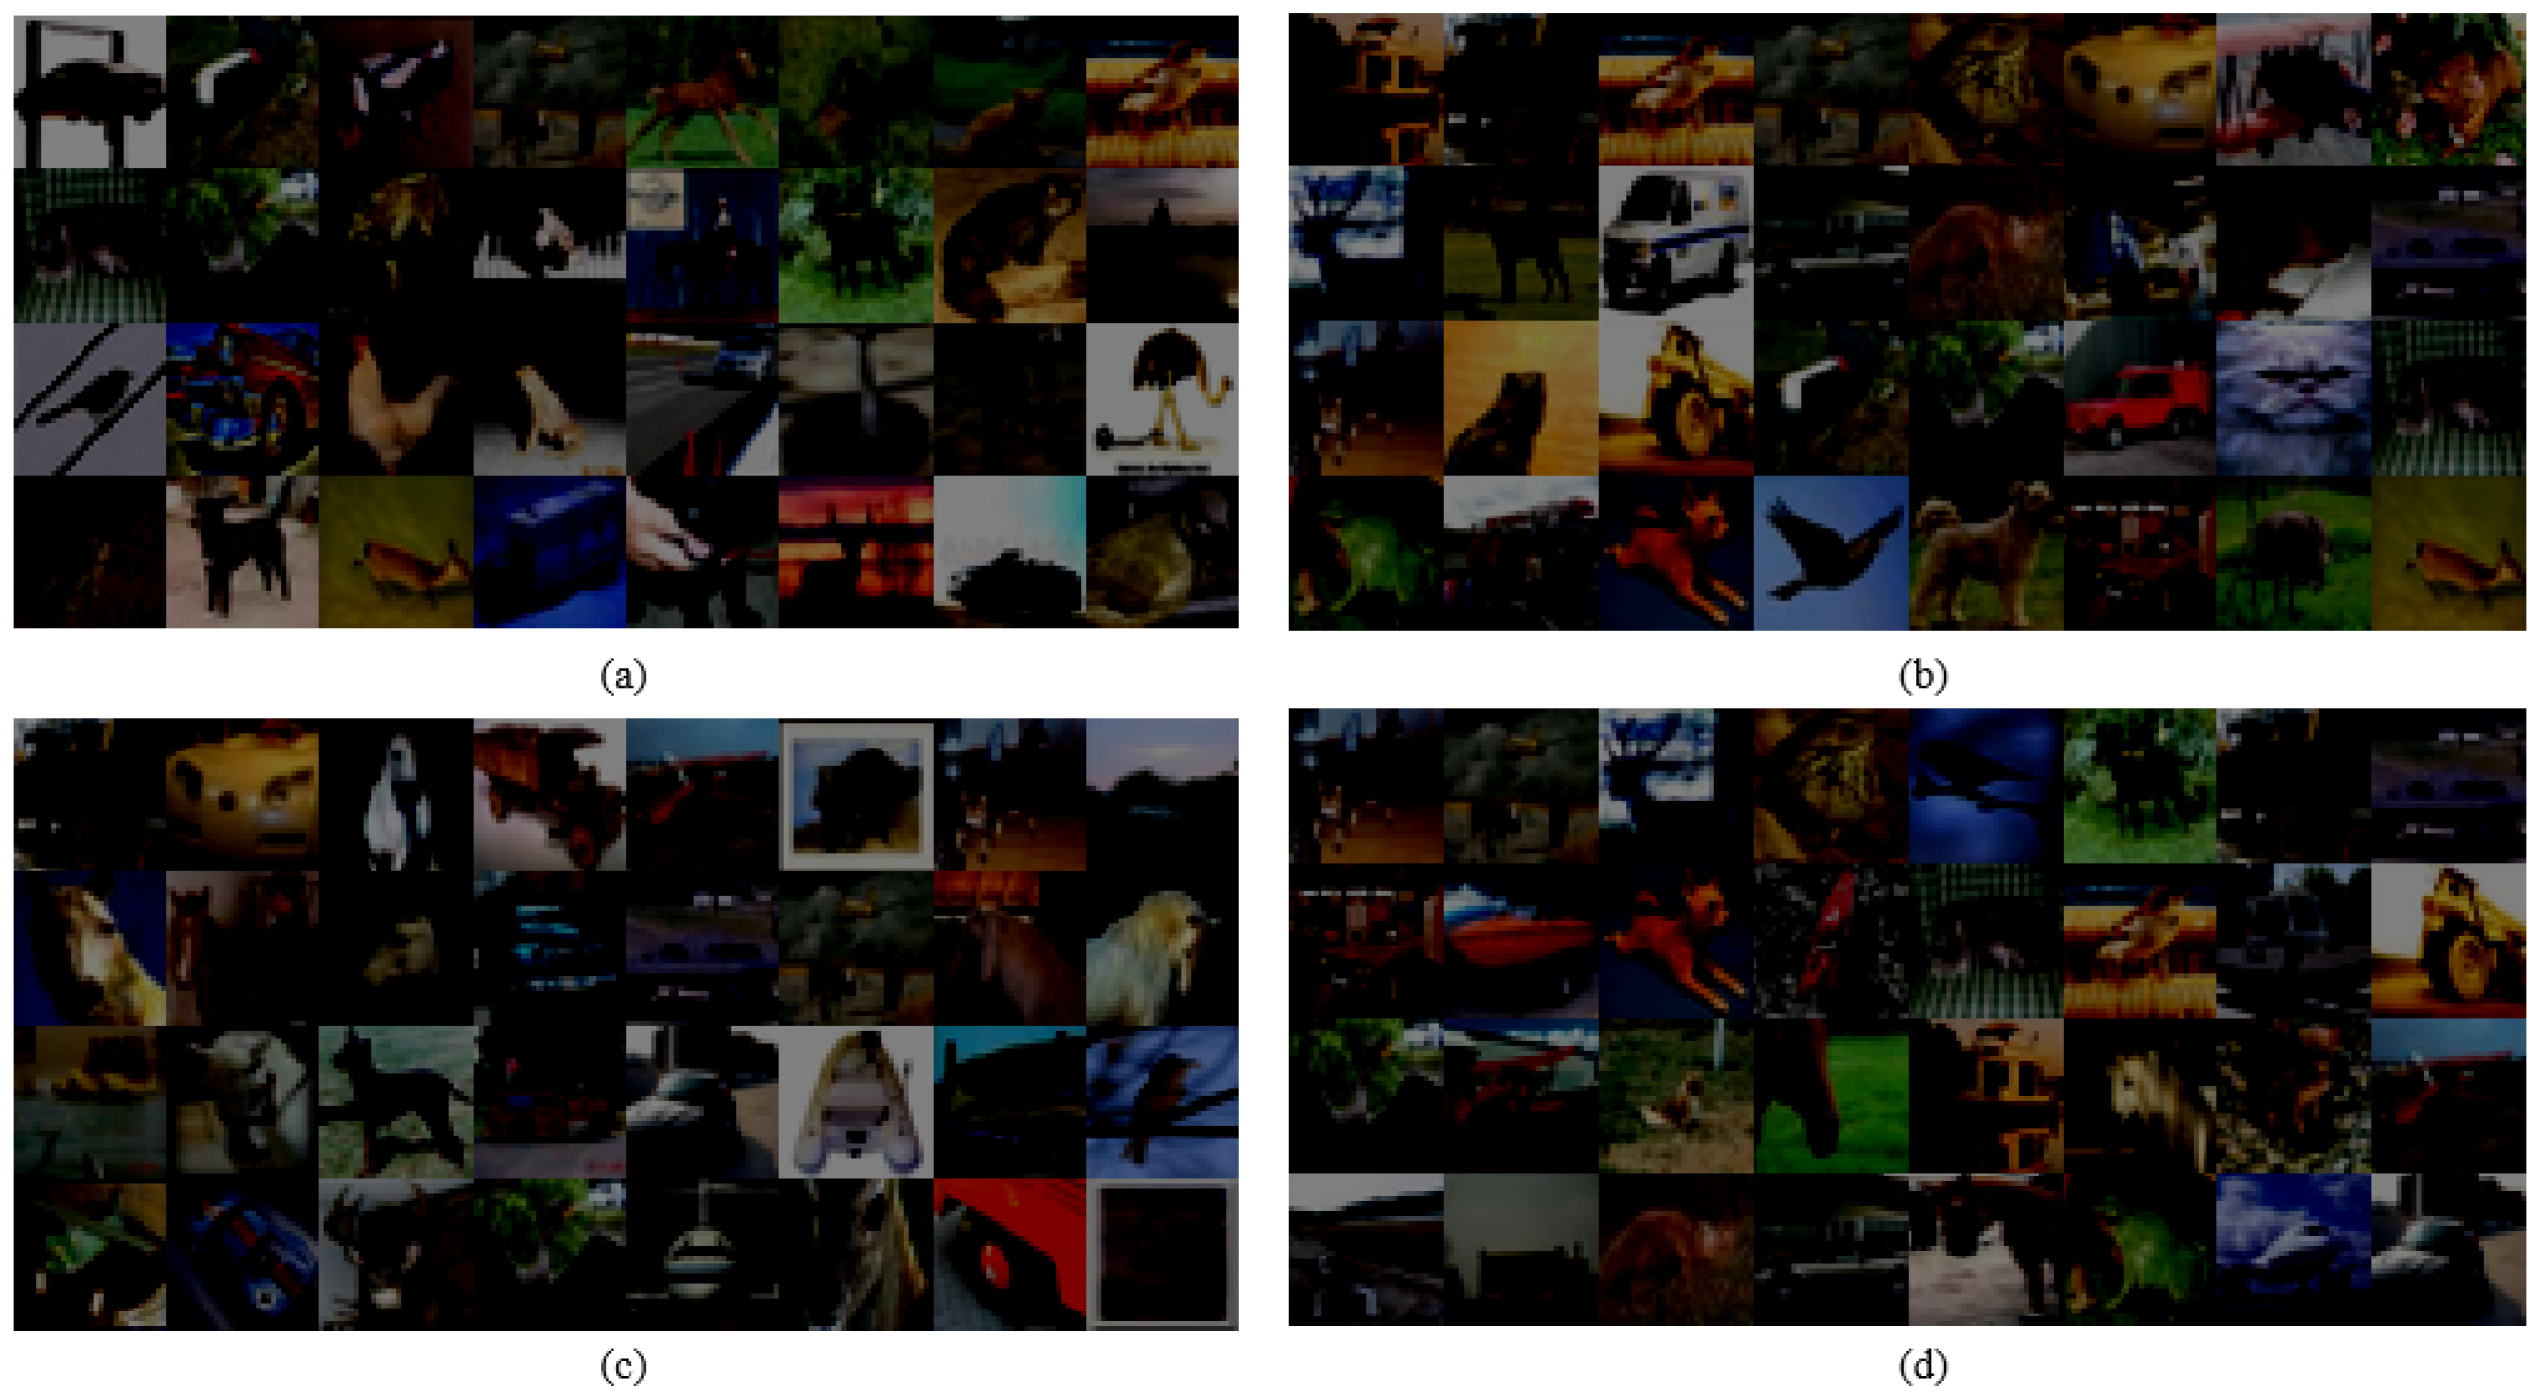
CIFAR 10 is another commonly-used benchmark dataset for image recognition. It contains 60,000 color images in 10 classes [26]. Similarly, a CNN model with 6 convolution layers is trained for CIFAR image classification. Then, as the proposed method above, we can calculate values of four kinds of DSA definitions based on the last layer of the trained DL models. Images with large DSA values are drawn in Figure 10.
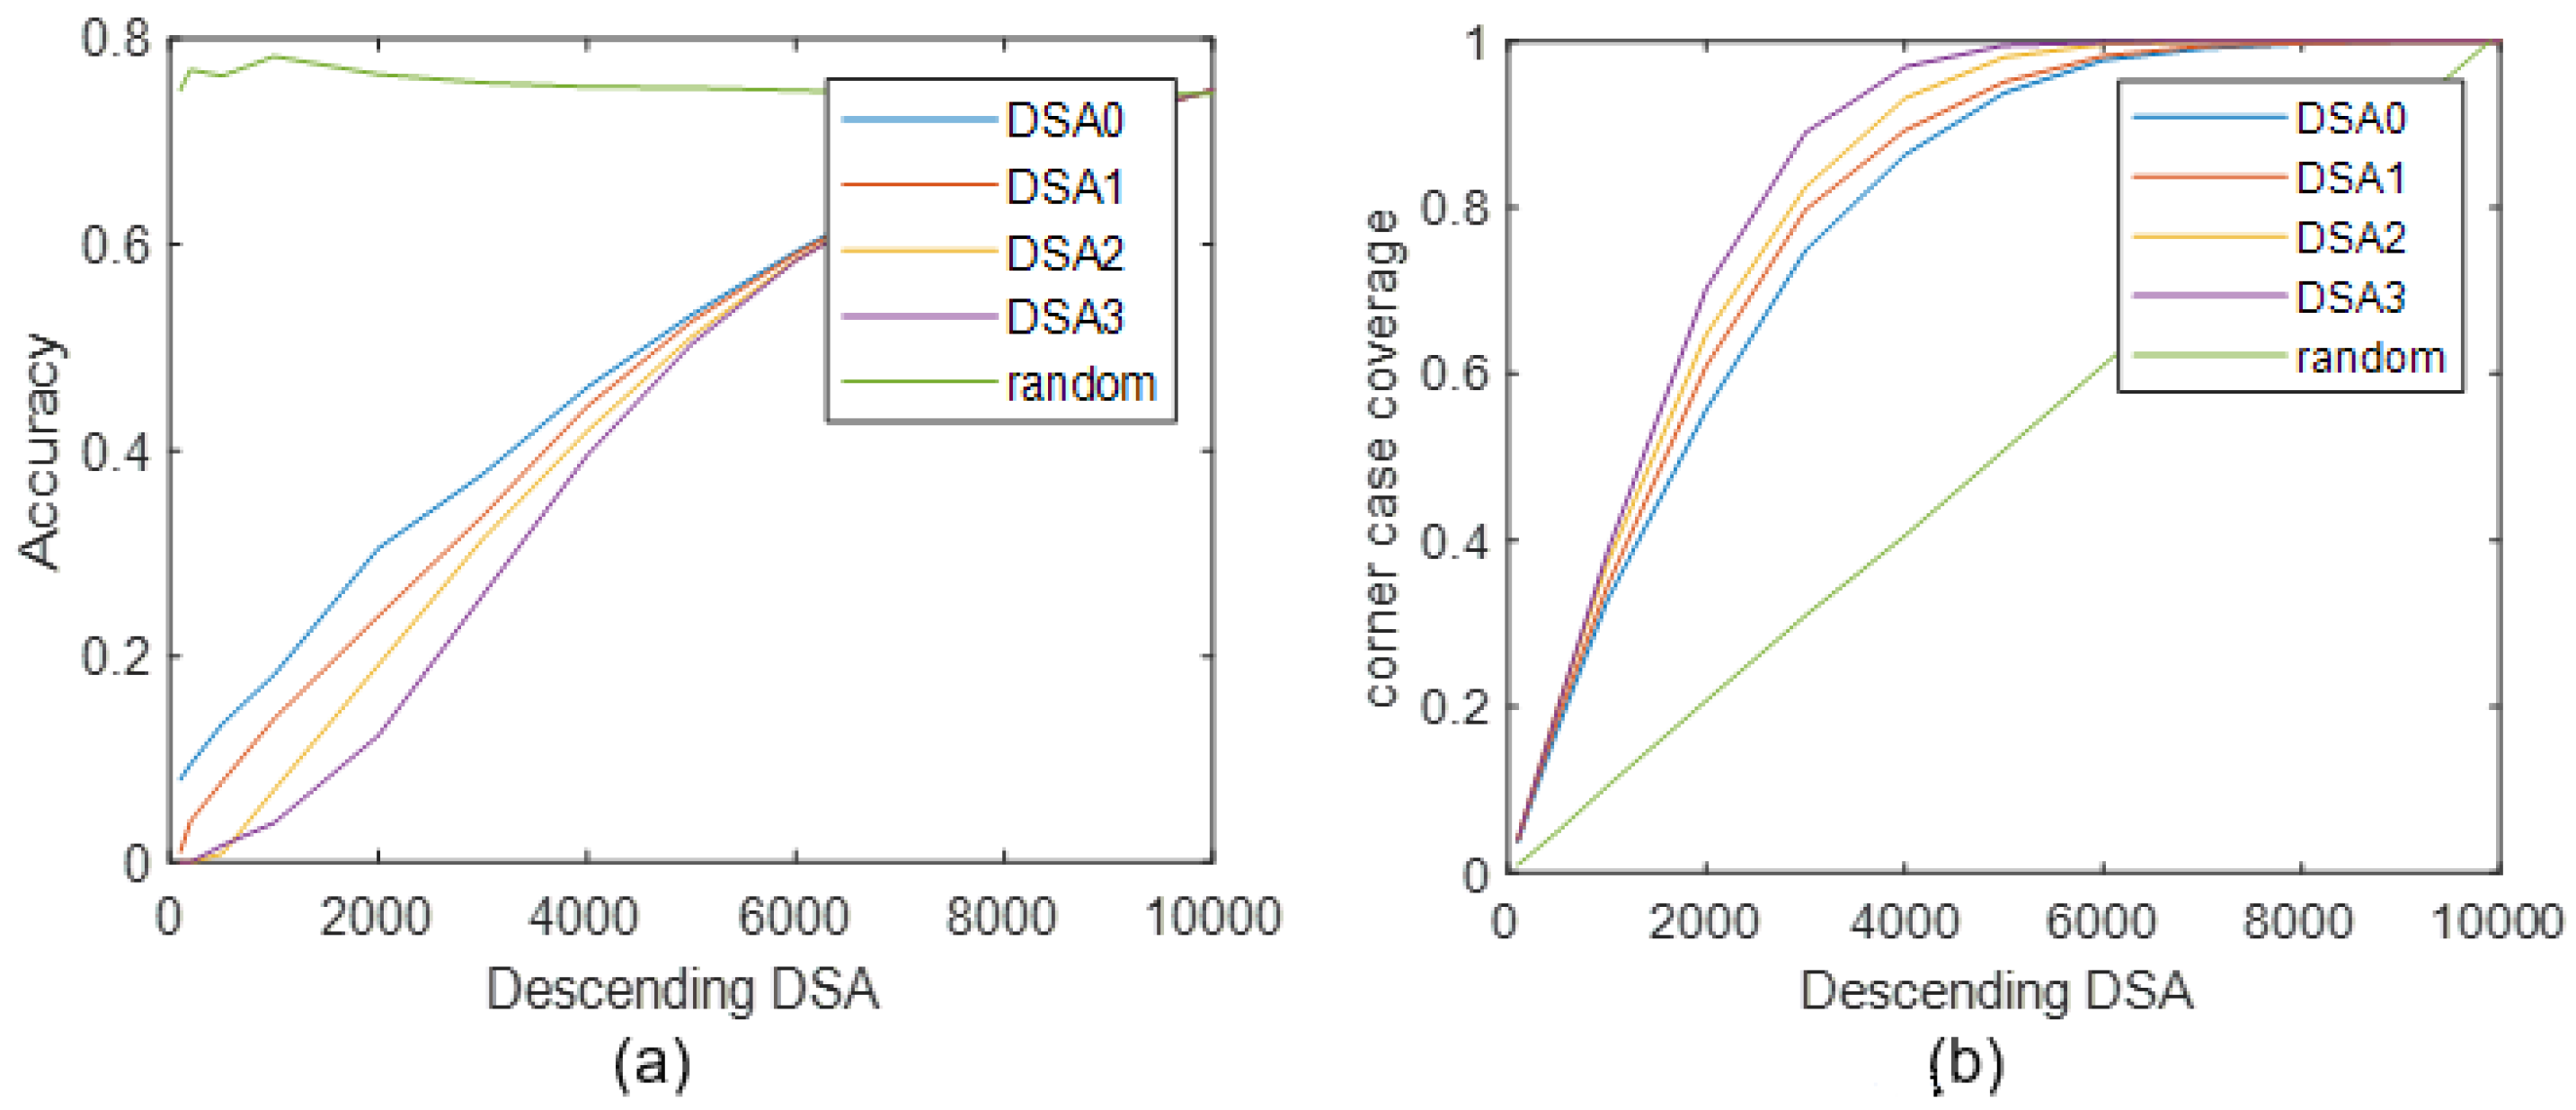
From the results of Figure 10, we can see images with large DSA values have low brightness which may cause misclassification, which means that they have a high risk to be corner cases. To evaluate if these images are real corner cases, we also plot accuracy and corner case coverage performance vs. DSA values, as Figure 11.
Based on the results of Figure 11, it is also seen that, when taking large DSA values as a threshold, there are a large percentage of misclassified points leading accuracy to be low (as Figure 11a), inversely the coverage of corner cases (misclassified points) to be high (as Figure 11b). Therefore, it implies that DSA can capture corner cases in testing data. Moreover, through the comparison of the 4 kinds of DSA, this phenomenon is more obvious on DSA3, which illustrates that DSA3 has a better performance on corner case detection compared with the other three.
(2) Real-world engineering dataset
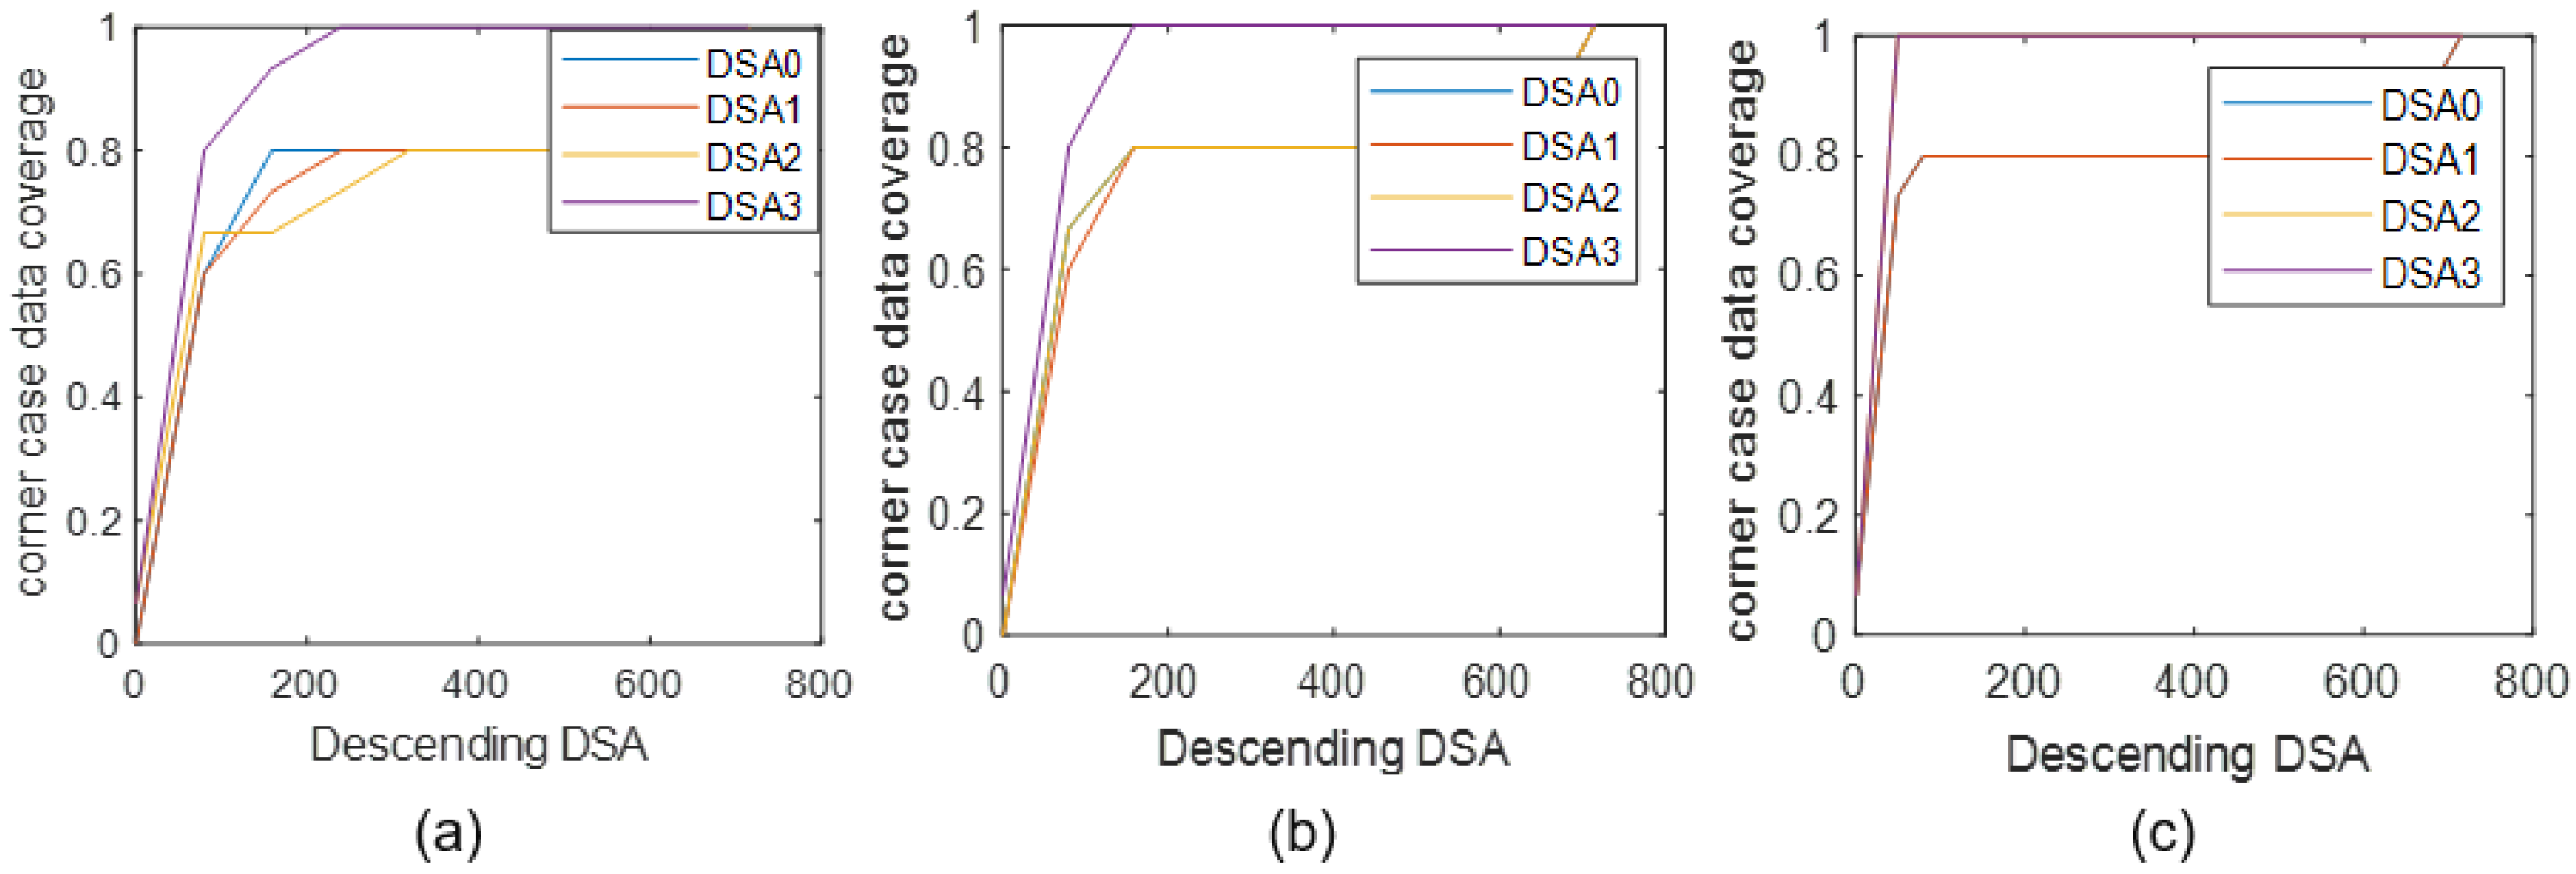
To further study the feasibility and generalization ability of the proposed method, we also propose to apply the proposed DSA method to detect corner case data in a real-world application. Here, the metal casting product image data is taken for case study, which is applied for industrial quality inspection in the real world [41]. It has a total of 6633 training data images, and 715 testing images. The objective based on this data is an identical binary classification problem which mainly aims at automatically recognizing defective metal casting products and normal ones. Therefore, a general CNN model consisting of 2 convolutional layers and 2 full-connection layers are constructed for this issue. After modeling and training, the final testing accuracy can reach 97.90% on this casting data. Then, according to the proposed method on DSA calculation and corner case data detection, we can also implement related experiments, such as calculating four kinds of DSA values on given model layers, e.g., two convolutional layers and the output layer are considered here and also named as Layer1, Layer2, Layer3, corner case data coverage analysis, and performance analysis about using DSA on corner case data detection. Results of related experiments are presented in Figure 12.
In Figure 12, the corner case data coverage is calculated and plotted as the descending values of four given DSA. We can see the proposed DSA3 has relatively larger corner case data coverage, namely implying better capability on corner case capture.
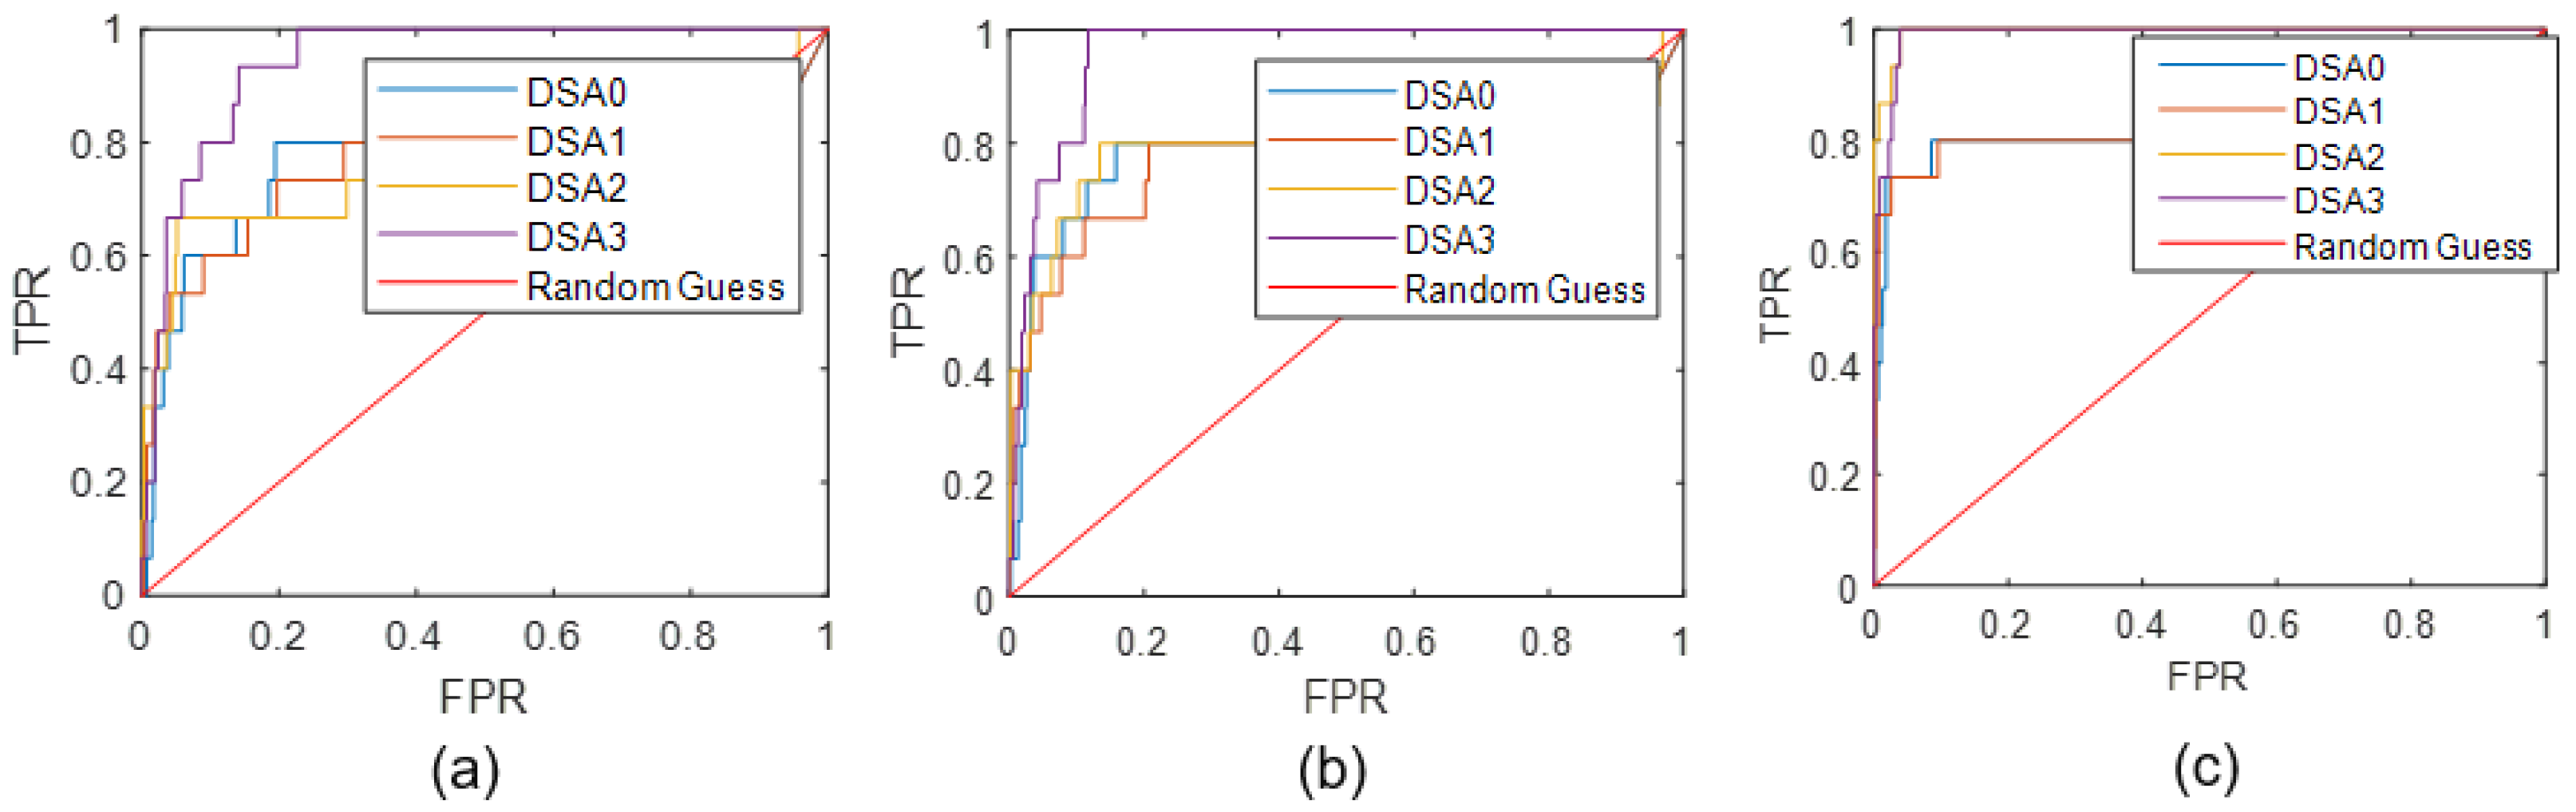
Figure 13 shows the ROC curves of using DSA on corner case data detection. It is also found that DSA3 has larger values of TPR under the same value of FPR than other DSAs, the similar phenomenon is shown in all three given layers analysis. For the further quantitative analysis, based on the results of ROC curves, we also calculate the values of AUC-ROC, as presented in Table 3.
From the results of Table 3, we find a similar conclusion as that obtained on MNIST data that the proposed DSA modifications can improve the capability of the original DSA on describing corner case data’s behaviors, meanwhile, the DSA3 performs relatively better than others. Moreover, as the layer becomes deeper, the calculated DSA has better performance on corner case data detection, seeing that AUC(Layer3) > AUC(Layer2) > AUC(Layer1).
5. Conclusions
In this paper, a novel method based on DSA has been proposed for corner case data detection which would be useful in AI quality assurance, such as safety analysis. To improve the capability of the original DSA on capturing behaviors of corner case data, three DSA modifications have been also developed with the consideration of boundary features, and validated useful in corner case data detection. Then, based on the experiments on MNIST which has been regarded as the benchmark classification application, it is seen that large values of DSA indeed capture many images with abnormal characteristics with respect to standard numbers, implying the DSA’s capability on capturing corner cases. Subsequently, through the quantitative analysis on erroneous corner case data detection, the modified DSAs have been found to have relatively better performance than the original one. Meanwhile, the proposed DSA3 performs the best on MNIST to some extent. Moreover, four adversarial testing datasets of MNIST have been also generated to further verify the feasibility of using DSA on corner case data detection. On the other hand, the industrial data based on casting defect application has also been studied in experiments, and its results further verify the general feasibility of using the proposed idea on classification problems.
While, besides the obtained conclusions above, more issues would be still meaningfully developed in future work. First, exploring other possible metrics for corner case data detection, e.g., uncertainty consideration, since the proposed DSAs in this paper cannot always perform perfectly. Second, studying the usage of detected corner case data, some possible studies like AI robustness analysis, stability, and dependability in AI quality assurance, may be able to make use of these corner case data.
Author Contributions
Conceptualization, T.O. and Y.S.; methodology, T.O.; software, T.O.; writing—original draft preparation, T.O.; writing—review and editing, V.S.M., Y.I., H.A.; supervision, Y.O. and Y.S.; project administration, Y.O. and Y.S.; funding acquisition, Y.O. and Y.S. All authors have read and agreed to the published version of the manuscript.
Funding
This research is based on results obtained from a project ‘JPNP20006’, commissioned by the New Energy and Industrial Technology Development Organization (NEDO).
Institutional Review Board Statement
Not applicable.
Informed Consent Statement
Not applicable.
Conflicts of Interest
The authors declare no conflict of interest.
References
- Hou, L.; Chen, H.; Zhang, G.K.; Wang, X. Deep Learning-Based Applications for Safety Management in the AEC Industry: A Review. Appl. Sci. 2021, 11, 821. [Google Scholar] [CrossRef]
- Ellahham, S.; Ellahham, N.; Simsekler, M.C.E. Application of artificial intelligence in the health care safety context: Opportunities and challenges. Am. J. Med. Qual. 2020, 35, 341–348. [Google Scholar] [CrossRef]
- Shieh, C.S.; Lin, W.W.; Nguyen, T.T.; Chen, C.H.; Horng, M.F.; Miu, D. Detection of Unknown DDoS Attacks with Deep Learning and Gaussian Mixture Model. Appl. Sci. 2021, 11, 5213. [Google Scholar] [CrossRef]
- Ahmed, S.; Huda, M.N.; Rajbhandari, S.; Saha, C.; Elshaw, M.; Kanarachos, S. Pedestrian and cyclist detection and intent estimation for autonomous vehicles: A survey. Appl. Sci. 2019, 9, 2335. [Google Scholar] [CrossRef] [Green Version]
- Rice, D. The Driverless Car and the Legal System: Hopes and Fears as the Courts, Regulatory Agencies, Waymo, Tesla, and Uber Deal with this Exciting and Terrifying New Technology. J. Strateg. Innov. Sustain. 2019, 14, 134–146. [Google Scholar]
- Grigorescu, S.; Trasnea, B.; Cocias, T.; Macesanu, G. A survey of deep learning techniques for autonomous driving. J. Field Robot. 2020, 37, 362–386. [Google Scholar] [CrossRef]
- Tian, Y.; Pei, K.; Jana, S.; Ray, B. Deeptest: Automated testing of deep-neural-network-driven autonomous cars. In Proceedings of the 40th International Conference on Software Engineering, Gothenburg, Sweden, 27 May–3 June 2018; pp. 303–314. [Google Scholar]
- Tesla-Accident 2016. Understanding the Fatal Tesla Accident on Autopilot and the NHTSA Probe. Available online: https://electrek.co/2016/07/01/ (accessed on 1 July 2016).
- Google-Accident 2016. A Google Self-Driving Car Caused a Crash for the First Time. Available online: http://www.theverge.com/2016/2/29/11134344/google-selfdriving-car-crash-report (accessed on 29 February 2016).
- van Hespen, K.M.; Zwanenburg, J.J.; Dankbaar, J.W.; Geerlings, M.I.; Hendrikse, J.; Kuijf, H.J. An anomaly detection approach to identify chronic brain infarcts on MRI. Sci. Rep. 2021, 11, 7714. [Google Scholar] [CrossRef]
- Xiong, Y.; Zha, X.; Qin, L.; Ouyang, T.; Xia, T. Research on wind power ramp events prediction based on strongly convective weather classification. IET Renew. Power Gener. 2017, 11, 1278–1285. [Google Scholar] [CrossRef]
- Wu, W.; Xu, H.; Zhong, S.; Lyu, M.R.; King, I. Deep validation: Toward detecting real-world corner cases for deep neural networks. In Proceedings of the 2019 49th Annual IEEE/IFIP International Conference on Dependable Systems and Networks (DSN), Portland, OR, USA, 24–27 June 2019; pp. 125–137. [Google Scholar]
- Bolte, J.A.; Bar, A.; Lipinski, D.; Fingscheidt, T. Towards corner case detection for autonomous driving. In Proceedings of the 2019 IEEE Intelligent Vehicles Symposium (IV), Dearborn, MI, USA, 9–12 June 2019; pp. 438–445. [Google Scholar]
- Guo, S.; Chen, S.; Wang, S.; Zhang, D.; Liu, Y.; Guo, C.; Li, T. A Multi-Factor Approach for Selection of Developers to Fix Bugs in a Program. Appl. Sci. 2019, 9, 3327. [Google Scholar] [CrossRef] [Green Version]
- Qiu, S.; Liu, Q.; Zhou, S.; Wu, C. Review of artificial intelligence adversarial attack and defense technologies. Appl. Sci. 2019, 9, 909. [Google Scholar] [CrossRef] [Green Version]
- Li, Y.; Wang, Y. Defense against adversarial attacks in deep learning. Appl. Sci. 2019, 9, 76. [Google Scholar] [CrossRef] [Green Version]
- Moosavi-Dezfooli, S.M.; Fawzi, A.; Frossard, P. Deepfool: A simple and accurate method to fool deep neural networks. In Proceedings of the IEEE Conference on Computer Vision and Pattern Recognition, Las Vegas, NV, USA, 27–30 June 2016; pp. 2574–2582. [Google Scholar]
- Ma, L.; Zhang, F.; Sun, J.; Xue, M.; Li, B.; Felix, J.-X.; Wang, Y. Deepmutation: Mutation testing of deep learning systems. In Proceedings of the 2018 IEEE 29th International Symposium on Software Reliability Engineering (ISSRE), Memphis, TN, USA, 15–18 October 2018; pp. 100–111. [Google Scholar]
- Nakajima, S.; Chen, T.Y. Generating biased dataset for metamorphic testing of machine learning programs. In Proceedings of the IFIP International Conference on Testing Software and Systems, Paris, France, 15–17 October 2019; Springer: Cham, Switzerland, 2019; pp. 56–64. [Google Scholar]
- Pei, K.; Cao, Y.; Yang, J.; Jana, S. Deepxplore: Automated whitebox testing of deep learning systems. In Proceedings of the 26th Symposium on Operating Systems Principles, Shanghai, China, 28–31 October 2017; pp. 1–18. [Google Scholar]
- Kim, J.; Feldt, R.; Yoo, S. Guiding deep learning system testing using surprise adequacy. In Proceedings of the 2019 IEEE/ACM 41st International Conference on Software Engineering (ICSE), Montreal, QC, Canada, 25–31 May 2019; pp. 1039–1049. [Google Scholar]
- Kim, S.; Yoo, S. Evaluating Surprise Adequacy for Question Answering. In Proceedings of the IEEE/ACM 42nd International Conference on Software Engineering Workshops, Seoul, Korea, 27 June 2020; pp. 197–202. [Google Scholar]
- Kim, J.; Ju, J.; Feldt, R.; Yoo, S. Reducing DNN Labelling Cost using Surprise Adequacy: An Industrial Case Study for Autonomous Driving. arXiv 2020, arXiv:2006.00894. [Google Scholar]
- Ma, W.; Papadakis, M.; Tsakmalis, A.; Cordy, M.; Traon, Y.L. Test selection for deep learning systems. ACM Trans. Softw. Eng. Methodol. 2021, 30, 1–22. [Google Scholar]
- LeCun, Y.; Bottou, L.; Bengio, Y.; Haffner, P. Gradient-based learning applied to document recognition. Proc. IEEE 1998, 86, 2278–2324. [Google Scholar] [CrossRef] [Green Version]
- Krizhevsky, A.; Hinton, G. Learning Multiple Layers of Features from Tiny Images; Technical Report; University of Toronto: Toronto, ON, Canada, 2009. [Google Scholar]
- Sun, Y.; Huang, X.; Kroening, D.; Sharp, J.; Hill, M.; Ashmore, R. Testing deep neural networks. arXiv 2018, arXiv:1803.04792. [Google Scholar]
- Banabic, R. Techniques for Identifying Elusive Corner-Case Bugs in Systems Software; (No. THESIS); EPFL: Lausanne, Switzerland, 2015. [Google Scholar]
- Ouyang, T.; Pedrycz, W.; Reyes-Galaviz, O.F.; Pizzi, N.J. Granular description of data structures: A two-phase design. IEEE Trans. Cybern. 2019. [Google Scholar] [CrossRef] [PubMed]
- He, Y.; Kusiak, A.; Ouyang, T.; Teng, W. Data-driven modeling of truck engine exhaust valve failures: A case study. J. Mech. Sci. Technol. 2017, 31, 2747–2757. [Google Scholar] [CrossRef]
- Corner Case Description and Detection. Available online: https://github.com/thouyang/ccd-dsa (accessed on 14 May 2021).
- Semantic Application Design Language (SADL). Available online: https://github.com/SemanticApplicationDesignLanguage/sadl (accessed on 25 December 2020).
- Lin, Z.; Ye, H.; Zhan, B.; Huang, X. An Efficient Network for Surface Defect Detection. Appl. Sci. 2020, 10, 6085. [Google Scholar] [CrossRef]
- Kurakin, A.; Goodfellow, I.; Bengio, S. Adversarial examples in the physical world. arXiv 2016, arXiv:1607.02533. [Google Scholar]
- Luo, Z.; Li, Q.; Zheng, J. A Study of Adversarial Attacks and Detection on Deep Learning-Based Plant Disease Identification. Appl. Sci. 2021, 11, 1878. [Google Scholar] [CrossRef]
- Madry, A.; Makelov, A.; Schmidt, L.; Tsipras, D.; Vladu, A. Towards deep learning models resistant to adversarial attacks. arXiv 2017, arXiv:1706.06083. [Google Scholar]
- Ouyang, T.; Zha, X.; Qin, L.; Kusiak, A. Optimisation of time window size for wind power ramps prediction. IET Renew. Power Gener. 2017, 11, 1270–1277. [Google Scholar] [CrossRef] [Green Version]
- Weiss, M.; Chakraborty, R.; Tonella, P. A Review and Refinement of Surprise Adequacy. arXiv 2021, arXiv:2103.05939. [Google Scholar]
- Xu, W.; Evans, D.; Qi, Y. Feature squeezing: Detecting adversarial examples in deep neural networks. arXiv 2017, arXiv:1704.01155. [Google Scholar]
- Feinman, R.; Curtin, R.R.; Shintre, S.; Gardner, A.B. Detecting adversarial samples from artifacts. arXiv 2017, arXiv:1703.00410. [Google Scholar]
- Riaz, F.; Kamal, K.; Zafar, T.; Qayyum, R. An inspection approach for casting defects detection using image segmentation. In Proceedings of the 2017 International Conference on Mechanical, System and Control Engineering (ICMSC), St. Petersburg, Russia, 19–21 May 2017; pp. 101–105. [Google Scholar]
Figure 1.
Diagram of a corner case. The two classes of data are colored as blue and red. Data of corner case is colored as green, which includes incorrectly classified data as well as data close to classification boundary which is sensitive to cause unexpected recognition.
Figure 1.
Diagram of a corner case. The two classes of data are colored as blue and red. Data of corner case is colored as green, which includes incorrectly classified data as well as data close to classification boundary which is sensitive to cause unexpected recognition.

Figure 2.
Diagram of the original DSA definition.

Figure 3.
The first modification of DSA. (a) specific case. (b) modification.

Figure 4.
The second modification of DSA. (a) specific case. (b) modification.

Figure 5.
The third modification of DSA. (a) specific case. (b) modification.

Figure 6.
Testing accuracy variation as the descending DSA. (a) Layer1. (b) Layer2. (c) Layer3.

Figure 7.
Images with the largest DSA values. (a) DSA0. (b) DSA1. (c) DSA2. (d) DSA3.

Figure 8.
Corner case data coverage of testing data sorted as the descending DSA. (a) Layer1. (b) Layer2. (c) Layer3.
Figure 8.
Corner case data coverage of testing data sorted as the descending DSA. (a) Layer1. (b) Layer2. (c) Layer3.

Figure 9.
ROC of using DSAs on corner case data detection on four adversarial testing data. (a) FGSM. (b) BIM. (c) CW. (d) PGD.
Figure 9.
ROC of using DSAs on corner case data detection on four adversarial testing data. (a) FGSM. (b) BIM. (c) CW. (d) PGD.

Figure 10.
(a–d) Images in CIFAR10 with large DSA values.

Figure 11.
Performance of corner case detection in CIFAR10. (a) Accuracy (b) Corner case coverage.

Figure 12.
Corner case data coverage variance as the descending DSA. (a) Layer1. (b) Layer2. (c) Layer3.
Figure 12.
Corner case data coverage variance as the descending DSA. (a) Layer1. (b) Layer2. (c) Layer3.

Figure 13.
ROC curves of using DSAs on corner case data detection. (a) Layer1. (b) Layer2. (c) Layer3.
Figure 13.
ROC curves of using DSAs on corner case data detection. (a) Layer1. (b) Layer2. (c) Layer3.


Table 1.
AUC-ROC of corner case data detection based on DSA.
| Layer1 | Layer2 | Layer3 | |
|---|---|---|---|
| DSA0 | 0.9422 | 0.9418 | 0.9759 |
| DSA1 | 0.9657 | 0.9722 | 0.9833 |
| DSA2 | 0.9114 | 0.9662 | 0.9875 |
| DSA3 | 0.9814 | 0.9884 | 0.9966 |
Table 2.
AUC-ROC of DSA-based corner case data detection on adversarial data testing.
| FGSM | BIM | CW | PGD | |
|---|---|---|---|---|
| DSA0 | 0.8520 | 0.9510 | 0.8390 | 0.9593 |
| DSA1 | 0.8801 | 0.9702 | 0.8931 | 0.9722 |
| DSA2 | 0.8812 | 0.9659 | 0.8510 | 0.9696 |
| DSA3 | 0.9226 | 0.9915 | 0.9666 | 0.9921 |
Table 3.
AUC-ROC of DSA-based corner case data detection on casting defect data.
| Layer1 | Layer2 | Layer3 | |
|---|---|---|---|
| DSA0 | 0.7565 | 0.7717 | 0.7990 |
| DSA1 | 0.7520 | 0.7612 | 0.8002 |
| DSA2 | 0.7584 | 0.7815 | 0.9952 |
| DSA3 | 0.9437 | 0.9587 | 0.9908 |
Publisher’s Note: MDPI stays neutral with regard to jurisdictional claims in published maps and institutional affiliations. |
© 2021 by the authors. Licensee MDPI, Basel, Switzerland. This article is an open access article distributed under the terms and conditions of the Creative Commons Attribution (CC BY) license (https://creativecommons.org/licenses/by/4.0/).
Share and Cite
MDPI and ACS Style
Ouyang, T.; Marco, V.S.; Isobe, Y.; Asoh, H.; Oiwa, Y.; Seo, Y. Improved Surprise Adequacy Tools for Corner Case Data Description and Detection. Appl. Sci. 2021, 11, 6826. https://0-doi-org.brum.beds.ac.uk/10.3390/app11156826
AMA Style
Ouyang T, Marco VS, Isobe Y, Asoh H, Oiwa Y, Seo Y. Improved Surprise Adequacy Tools for Corner Case Data Description and Detection. Applied Sciences. 2021; 11(15):6826. https://0-doi-org.brum.beds.ac.uk/10.3390/app11156826
Chicago/Turabian StyleOuyang, Tinghui, Vicent Sanz Marco, Yoshinao Isobe, Hideki Asoh, Yutaka Oiwa, and Yoshiki Seo. 2021. "Improved Surprise Adequacy Tools for Corner Case Data Description and Detection" Applied Sciences 11, no. 15: 6826. https://0-doi-org.brum.beds.ac.uk/10.3390/app11156826
Note that from the first issue of 2016, this journal uses article numbers instead of page numbers. See further details here.