
RT-SPeeDet: Real-Time IP–CNN-Based Small Pit Defect Detection for Automatic Film Manufacturing Inspection


Department of Artificial Intelligence, Daegu University, Gyeongsan 38453, Korea
*
Author to whom correspondence should be addressed.
Appl. Sci. 2021, 11(20), 9632; https://0-doi-org.brum.beds.ac.uk/10.3390/app11209632
Submission received: 20 September 2021
/
Revised: 8 October 2021
/
Accepted: 11 October 2021
/
Published: 15 October 2021
(This article belongs to the Special Issue AI Engineering: Software Engineering for Artificial Intelligence—Development of Complex Machine Learning Systems)
Abstract
:Pits are defects that occur during the film manufacturing process; they appear in the micrometer scale, which makes distinguishing them with the human eye difficult. Existing defect detectors have poor recognition rates for small objects or require a considerable amount of time. To resolve these problems, we propose a real-time small pit defect detector (RT-SPeeDet), a two-stage detection model based on an image processing and convolutional neural network (IP–CNN) approach. The proposed method predicts boundary boxes using a lightweight image-processing algorithm optimized for pit defects, and applies binary classification to the predicted regions; thus, simultaneously simplifying the problem and achieving real-time processing speed, unlike existing detection methods that rely on CNN-based detectors for both boundary box prediction and classification. RT-SPeeDet uses lightweight image processing operations to extract pit defect candidate region image patches from high-resolution images. These patches are then passed through a CNN-based binary classifier to detect small pit defects at a real-time processing speed of less than 0.5 s. In addition, we propose a multiple feature map synthesis method that enhances the features of pit defects, enabling efficient detection of faint pit defects, which are particularly difficult to detect.
1. Introduction
In the manufacturing industry, anomaly detection technologies that classify defects occurring during the manufacturing processes are being actively researched to automate the quality assurance process [1,2,3,4,5]. Traditional image processing-based defect detection methods show high performance because they can design feature extractors that are suitable for limited and clear feature information. However, they are unsuitable for systems that irregularly generate defects of various forms. Conversely, deep learning-based defect detection methods are capable of accurately and rapidly detecting various forms of defects owing to their excellent data mining performance.
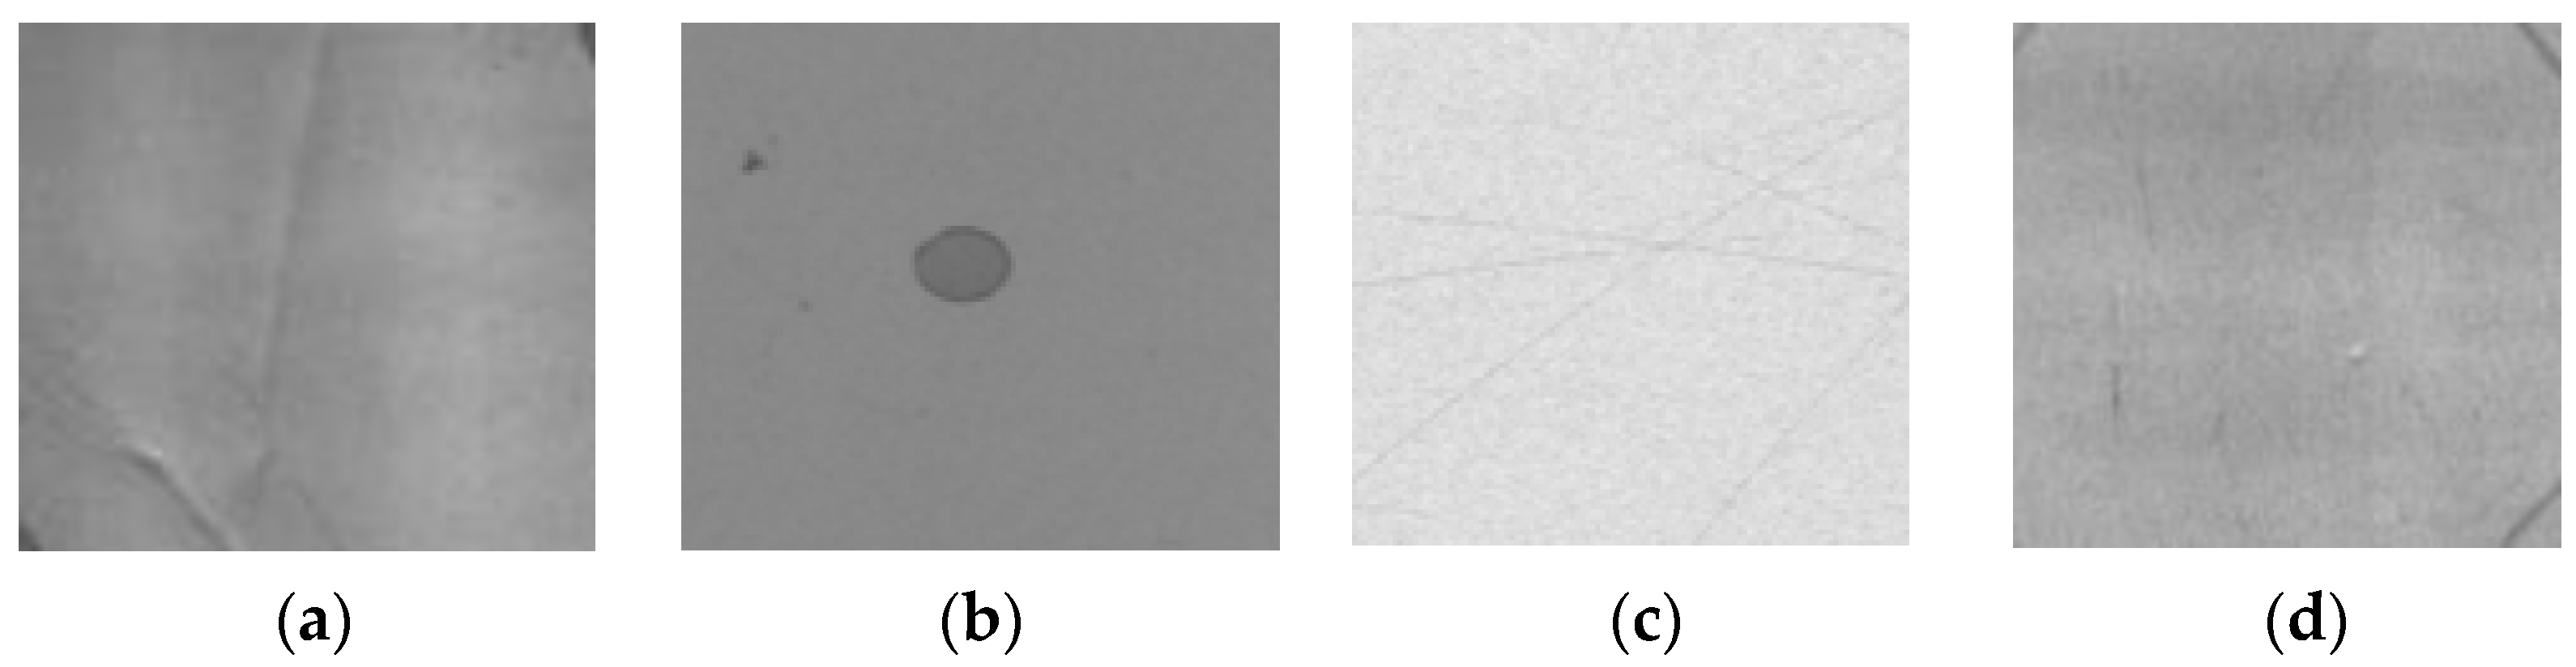
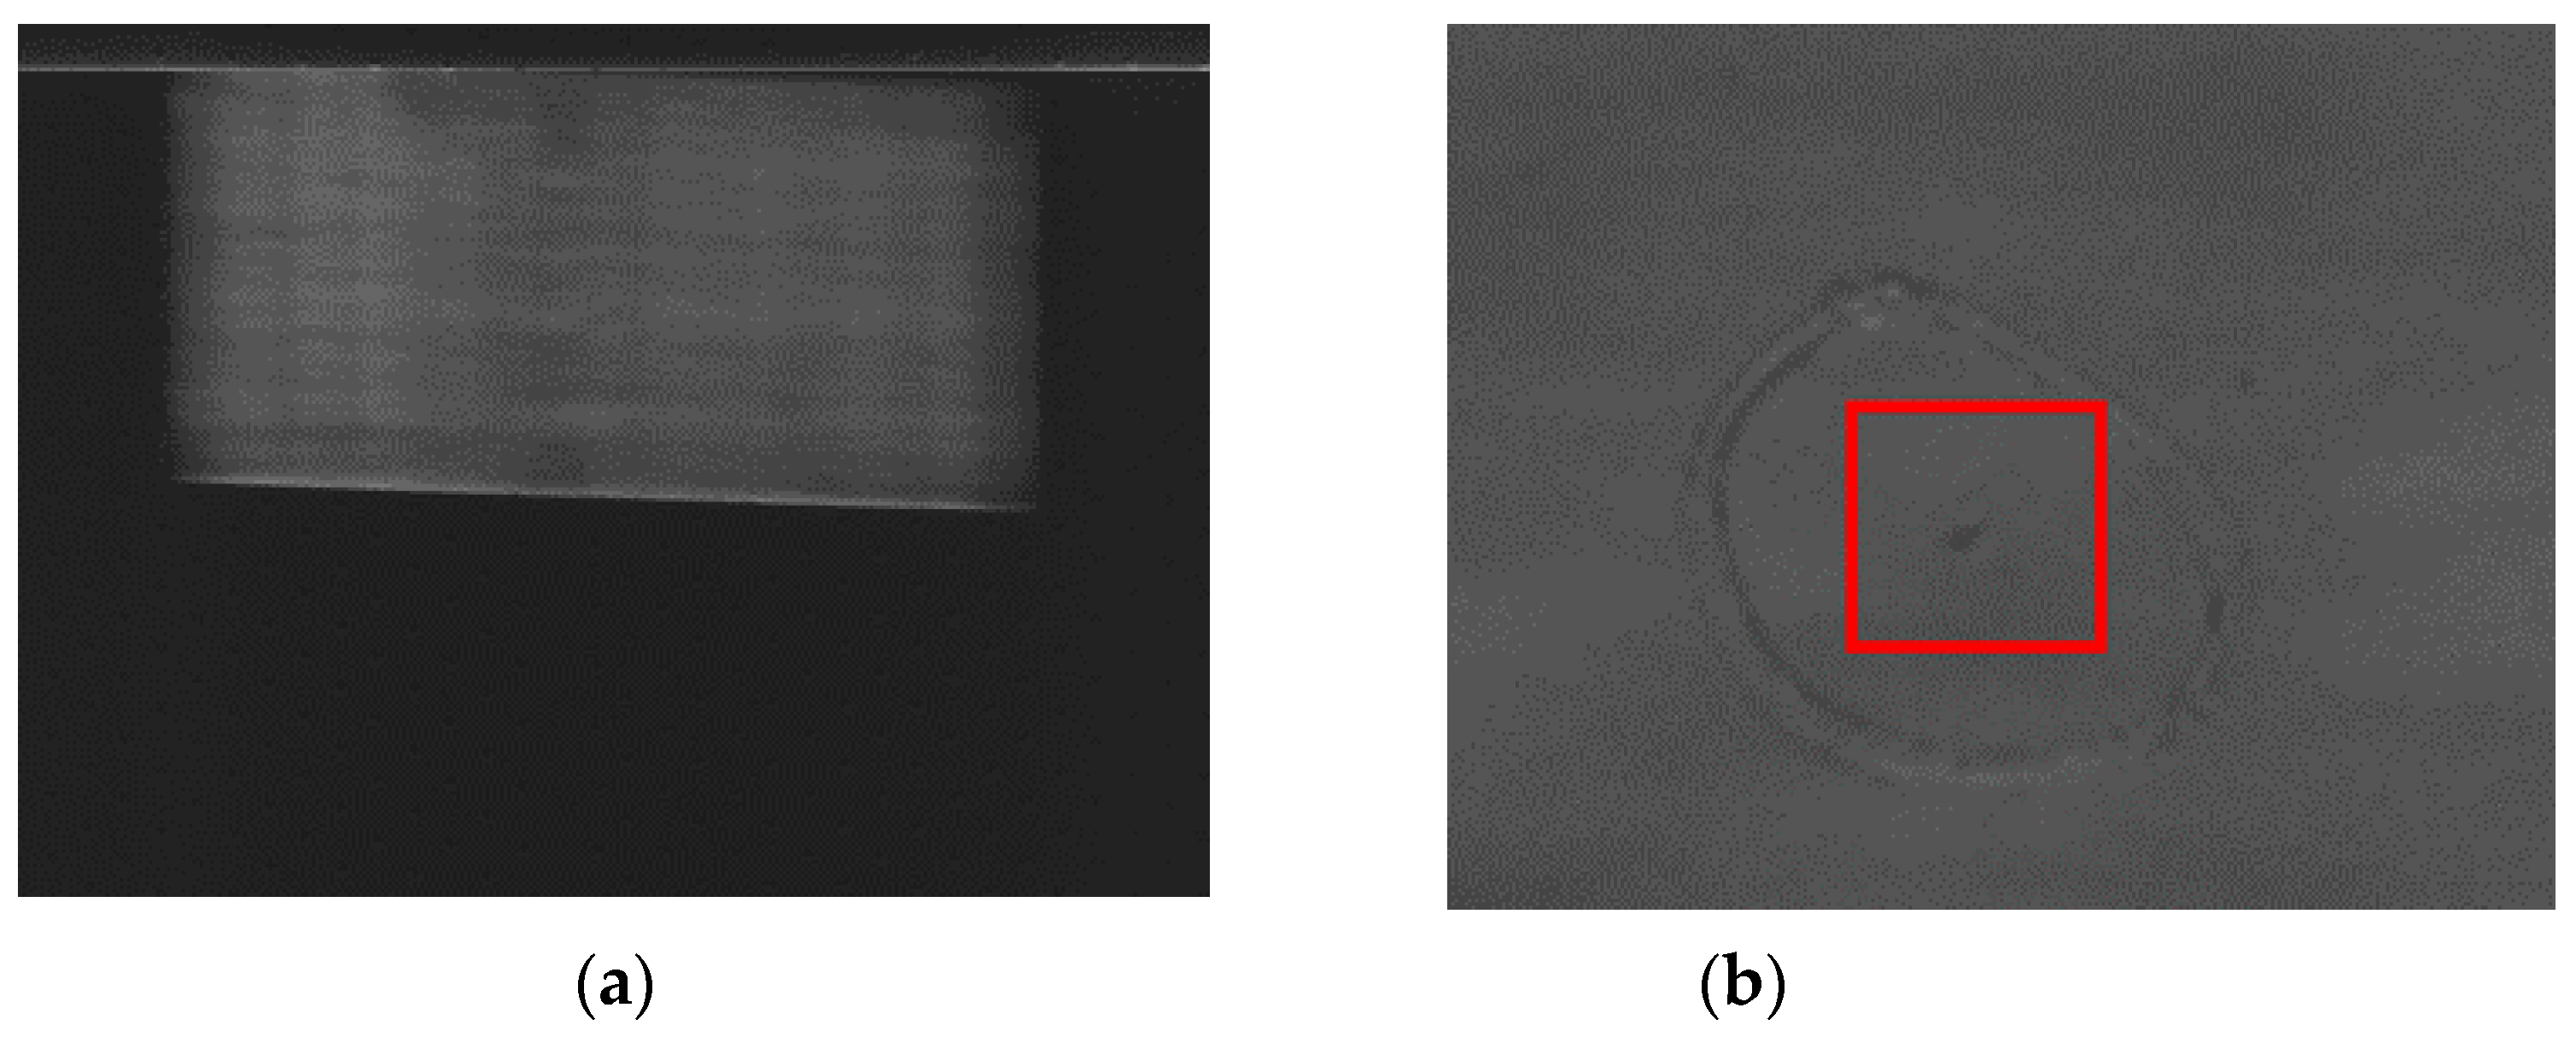
The purpose of this paper is to design a machine vision method for automatically detecting small pit defects among various film surface defects described in Figure 1. Pits are mainly caused by a grain of dust or sand during the rolling process in manufacturing films used in displays of smartphones or LCD TVs. These micro-fine stabbed defects are a major factor in determining the quality of displays. However, different from other defects, the micro-meter-sized (μm) small pit defects cannot be easily observed even with the human eye in the entire film image in Figure 2a unless being magnified as shown in Figure 2b. Furthermore, the manufacturing factory usually requires a real-time processing less than 1 s for detecting defective films. The current manufacturing technique has a problem, where the pits are detected using a lightweight image processing method for real-time, but they suffer from a low detection rate of approximately 50%, which actually motivates this study.
Deep learning-based object detection models, such as fast R-CNN [6] and YOLO [7], present significantly reduced detection rates for small pit defect detection. This performance degradation is caused by the nature of the end-to-end model, in which object features are lost during continuous downsampling to process the input image rapidly. By contrast, when the downsampling process is reduced, the processing speed is markedly lowered owing to the enormous number of computations required. Moreover, anchor box-based detection methods also encounter problems because it is difficult to set a suitable size of the anchor boxes for small objects [8,9,10]. In such cases, insufficient training data owing to the rare occurrence of defectives also become major factors making defect detection difficult. To solve these problems, we propose a real-time small pit defect detection network (RT-SPeeDet), which is a two-stage detection model that combines image processing technology with a convolutional neural network (CNN)-based binary classification model.
The proposed model was inspired by region proposal methods based on the risk priority number (RPN) [11]. First, we design an image processing-based feature extractor suitable for small pit defects to localize candidate areas. Next, to conduct the classification, the image patches of a pit candidate region are entered as input to the CNN. This task simplification improves the processing speed and detection performance by reducing the overhead of the object detection model, which must simultaneously perform localization and classification during the training and inference processes. In addition, the proposed multiple feature map synthesis-based candidate region detection method resolves the problem of low detection rates for small objects by suppressing the noise of the background region and improving the pit defect region. Finally, the recall rate is improved using a data augmentation technique suitable for the characteristics of pit defects.
The rest of this paper is organized as follows. Section 2 describes the limitations of existing object detection models. Section 3 describes the proposed RT-SPeeDet method in detail. Section 4 presents the results of a performance evaluation on the proposed model. Section 5 describes an ablation study on various design elements and discusses some limitations. Finally, in Section 6, we present our conclusion and future research direction.
2. Limitations of Existing Object Detection Models
Although deep learning-based object detection models have made remarkable advances, their low detection rate for small objects remains a problem to be solved. The simplest solution for this problem is to reduce the loss rate for small objects by increasing the resolution of the input image [12]. Another solution is to combine low- and high-level feature maps to create multi-scale representations that enhance the features. Another approach is to perform prediction at different layers; this results in feature maps of various scales [13]. Nonetheless, the difficulty in detecting small objects remains a problem. The following studies were conducted to resolve this problem [14,15].
Hu et al. used a Gaussian filtering technique, which is an image processing technology, and the Otsu algorithm, which is an adaptive binarization technique, to detect pit defects in steel shells [16,17]. They proposed an algorithm that can detect positive regions, where steel shells are present and applied Gaussian filtering and binarization to the interior of the ellipse to detect the existence of pits. To detect five types of defects that occur in the process of manufacturing, Zhao et al. proposed the TICNET model, which improves the existing cascade R-CNN approach [18]. The feature extraction capacity of the model was improved by applying deformable convolution layers instead of convolution layers; this can learn both weights and kernel offsets [19,20]. In addition, to concentrate the model’s learning on objects that are difficult to classify among the defect samples, they enhanced the features of cascade-RCNN and improved the learning performance for complex defect patterns. Jiang et al. attempted to apply parameter optimization on fast R-CNN to detect four types of defects, including pits, present on the surface of a shaft [21]. Because it is difficult to find small defects with a minimum size of 0.3 mm in images with a size of 16,384 × 4096 pixels obtained through line scanning, the images were manually split into images of size 500 × 500 pixels. It was observed that for a single IoU value, the performance decreased when the ratio of negative samples was increased; therefore, they proposed a method of setting multiple IoU values to increase the ratio of positive samples. Ren et al. proposed a neural network that sets anchor boxes optimized for small object sizes; it uses a multi-scale representation learning method that combines high- and low-level feature maps to create feature maps that contain more feature information regarding small objects [22]. In addition, they added contextual information about the areas around small objects and used this information in feature maps to resolve the imbalance problem of insufficient small object training data. Studies have also been conducted on methods for improving the detection performance using data augmentation techniques that have properties suitable for small object detection [23,24].
Table 1 shows the input image resolutions and resulting detection times of previous defect detection studies. When the detection targets are small objects such as pit defects, the deep learning and machine learning methods all take more than 2 s on average. By contrast, in the case of larger ordinary objects, these methods are capable of processing even high-resolution images within approximately 120 ms because such objects can be adequately found using a lightweight architecture. Therefore, finding small objects during tasks requiring real-time processing is a problem of considerable difficulty. In previous studies, deep-learning-based methods have the disadvantage of having to manually divide the input image to avoid a loss of the small object area during the forward propagation. Besides, previous image-processing-based methods require complex feature extracting operations to detect small defects accurately, which results in a problem of decreasing processing speed. The target images in this paper are film images with a size of 8192 × 6000 pixels. When they are divided for stable small object detection, more than 160 image patches with a size of 512 × 512 pixels are created. Detection task using the faster R-CNN model, or the YOLO-v3 model, which is optimized for real-time processing, on more than 160 image patches to examine all regions in a single film image will take 22 s and 4.8 s, respectively, given that the processing speeds of these models are 0.14 and 0.03 s, respectively. This is a fatal problem in quality assurance (QA) processes that require real-time processing of less than 1 s.
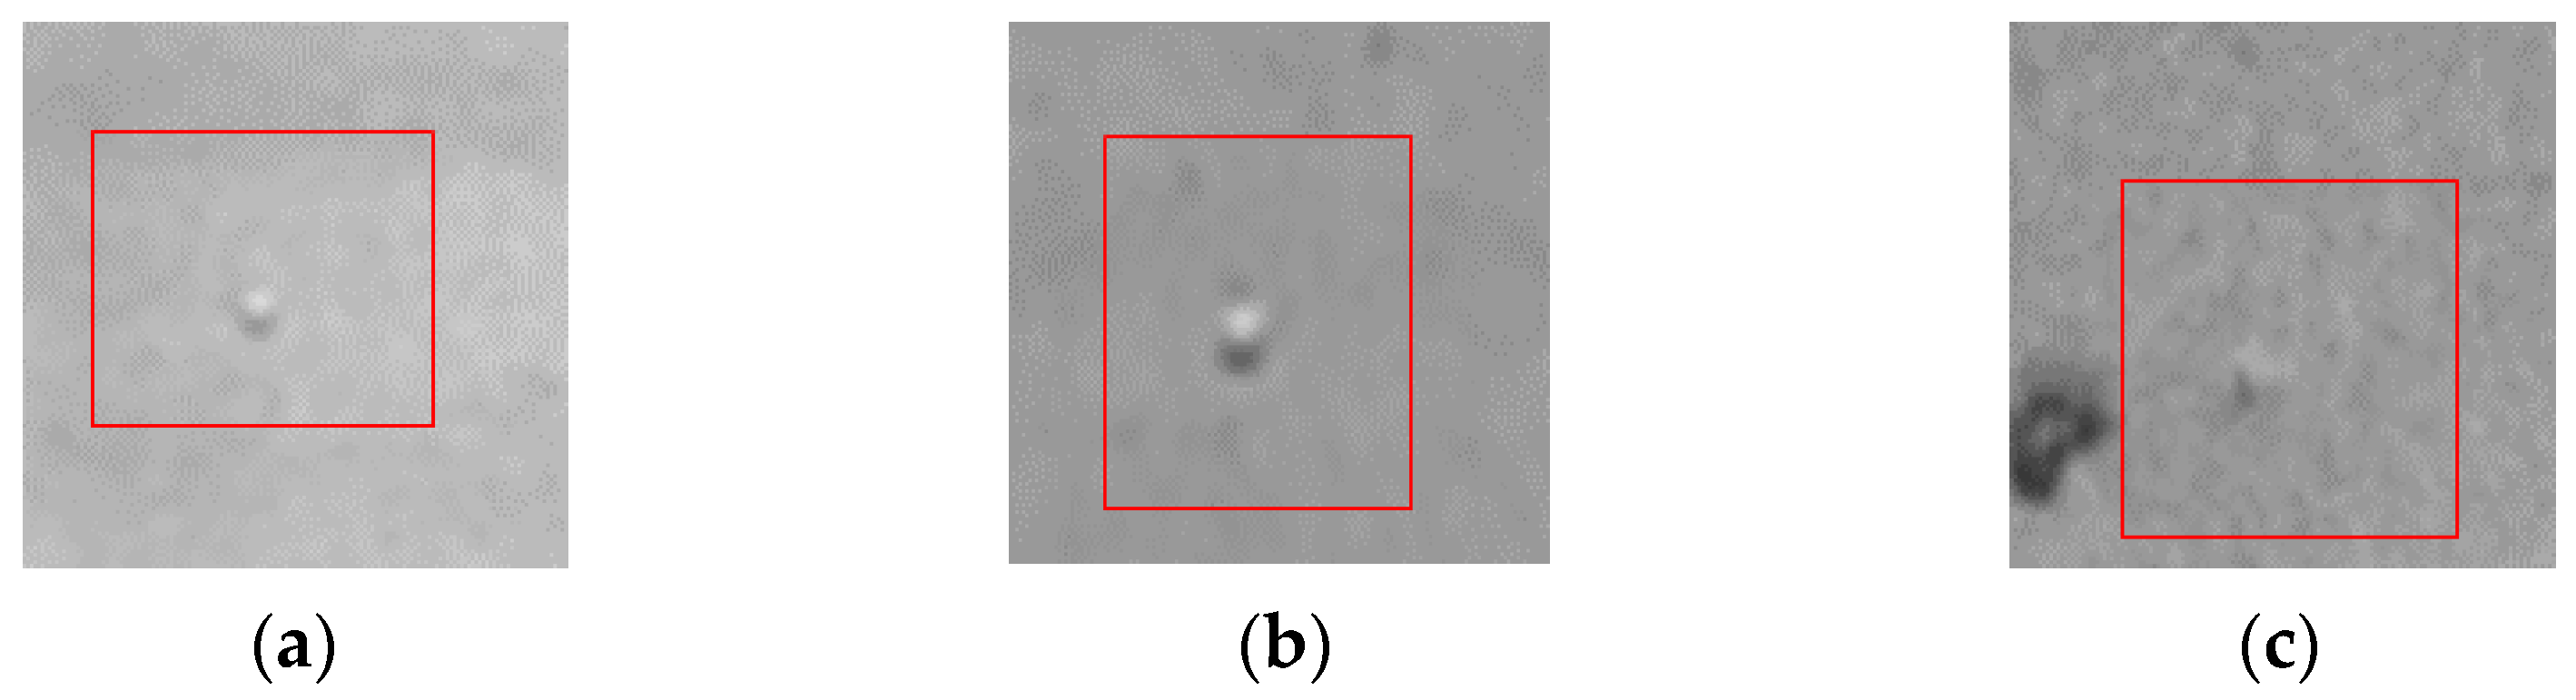
Because the pit defects that this approach attempts to detect have an extremely small size, approximately 1/480,000th of the film images, there is a high probability that the features will be lost as they pass through each layer of a deep neural network. Figure 3 shows the strength levels of the pit defects that exist in the film images. The strong and medium-level pits in Figure 3a,b can be seen with the human eye when the image is magnified. However, unlike normal defects, they have no clear features and are easily confused with noises in the image background. The weak-level pits shown in Figure 3c are a major cause of missed detection because they are difficult to distinguish with the human eye. In particular, pit defects have a low frequency of occurrence, and it is difficult to obtain an adequate amount of training data for deep learning-based object detection studies.
In order to solve the problems of the existing deep learning-based defect detection methods described above, this paper presents an IP–CNN-based two-stage pit defect detection structure that is divided into image-processing and CNN-based classification, instead of an end-to-end structure.
3. Real-Time Small Pit Defect Detection Network
3.1. System Overview
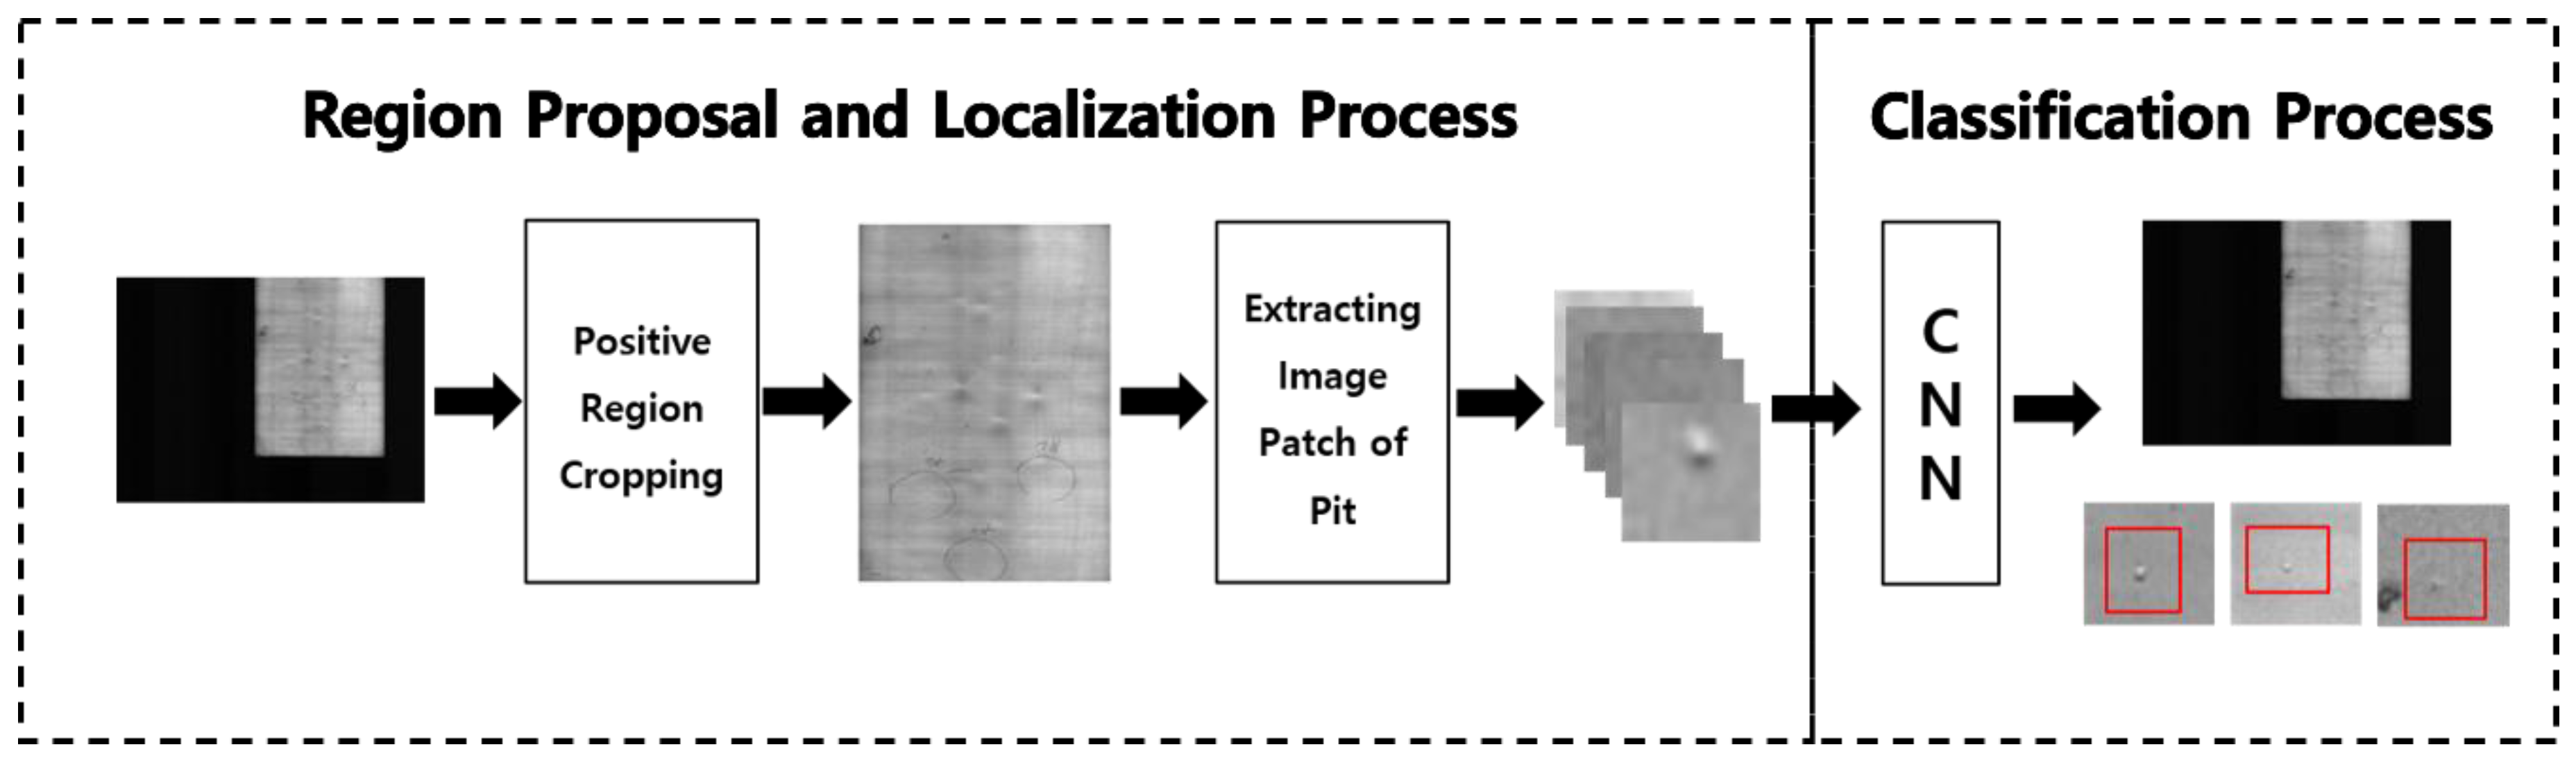
The proposed real-time small pit defect detection (RT-SPeeDet) model involves a candidate region extraction stage that uses image-processing technology and a CNN-based classification stage, as shown in Figure 4. To separate the function of an end-to-end detection model into two stages, RT-SPeeDet conducts localization in the defect candidate region extraction stage and then applies CNN binary classification to the extracted candidate regions.
3.2. Extracting Candidate Image Patches for Pit Detection
3.2.1. Cropping of Positive Region
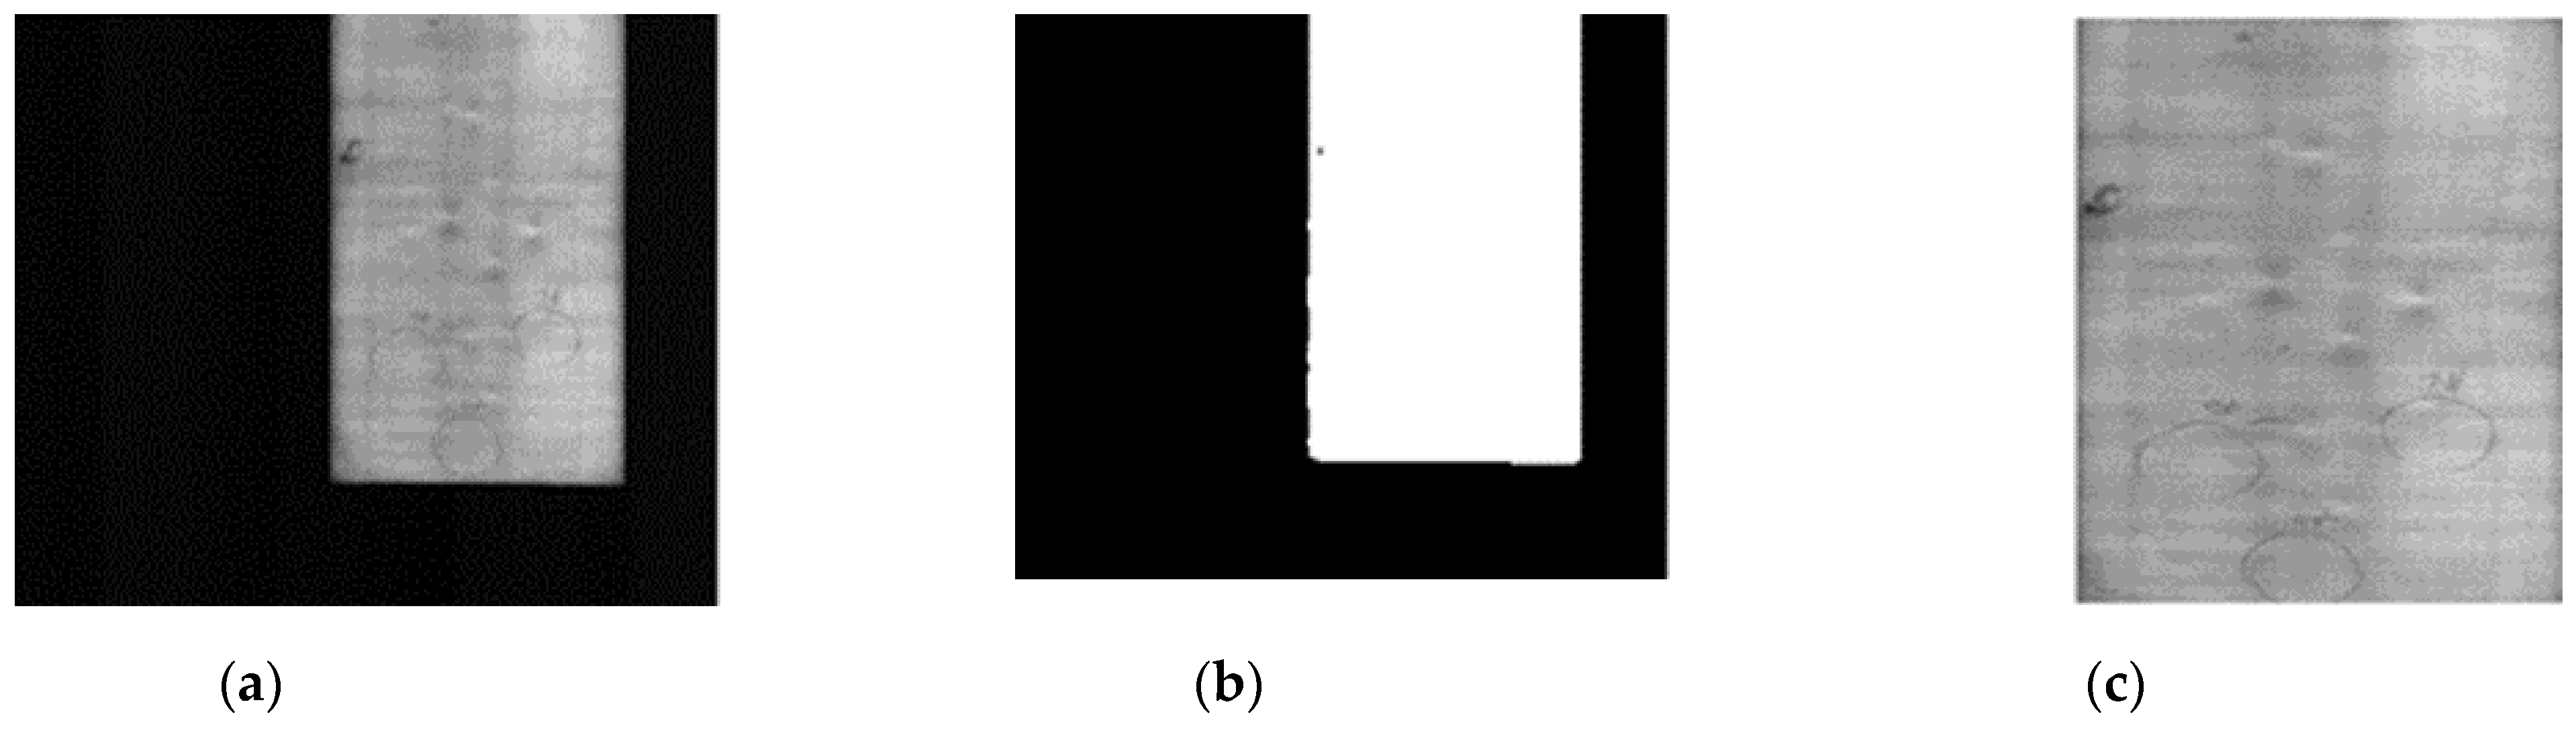
The image processing-based candidate region extraction stage is divided into a process for cropping the positive region in the overall film image and a process for conducting the localization of the pit candidate areas in the cropped region and simultaneously extracting the image patches. Because the detection speed decreases when processing entire 8192 × 6000 high-resolution images, the positive regions of the film, excluding the background regions, are extracted from the film images. Figure 5 shows the positive region extraction process. First, to improve the processing speed, the original image in Figure 5a is reduced to 1/nth size using Equation (1), and the color image is converted into a black and white image.
Here, is the input image; and are the width and height of the input image, respectively. In addition, n is a selectable integer used to reduce the number of computations by resizing the input image. As n increases, the processing speed improves; however, when n is set too large, pit defect information is lost. Because n is a factor that affects pit defect detection rates, this analysis is covered in the ablation study discussed in Section 5. As the pit defects have no specific color information, the three-channel RGB image can be converted into a grayscale image to reduce computations. Next, binarization is applied based on a threshold value to extract the positive regions. We analyzed film images with various lighting conditions and observed that there is a large contrast between the film’s positive region and the background. Accordingly, the threshold was set at 20% of the image’s maximum brightness value, which can adequately distinguish positive regions in all environments. After binarization is applied, as shown in Figure 5b, a four-connectivity labeling operation, in which connected pixels are divided into individual groups, is conducted such that the black and light regions are divided by region. Finally, the positive region is cropped as shown in Figure 5c.
3.2.2. Cropping of Positive Region
The goal of the pit candidate region extraction stage is to minimize the background region noise in the positive region and to detect the pit defects. As the number of candidate area image patches input into the CNN increases, the detection speed decreases; therefore, the number of candidate areas should be minimized, including all possible pit defects.
To minimize the processing time during the candidate region extraction stage, this approach adopts morphology operations that have been used in real-time small object detection studies [25,26]. Morphology operations can be used to suppress noise and enhance the features of object regions to detect small objects that appear as tiny dots in infrared images captured at a distance. Furthermore, these can be used to extract desired data using the information of a target object with a known geometric shape. The applied method is a simple approach in which a structure element, which is a kernel suitable for the shape and size of the target, is moved to all regions of the image and the operations are conducted. The advantage of morphology operations is that the computation overhead is extremely small; therefore, it is suitable for real-time pit defect detection that is targeted in this paper. Equations (2)–(5) show the dilation, erosion, opening, and closing operations, respectively.
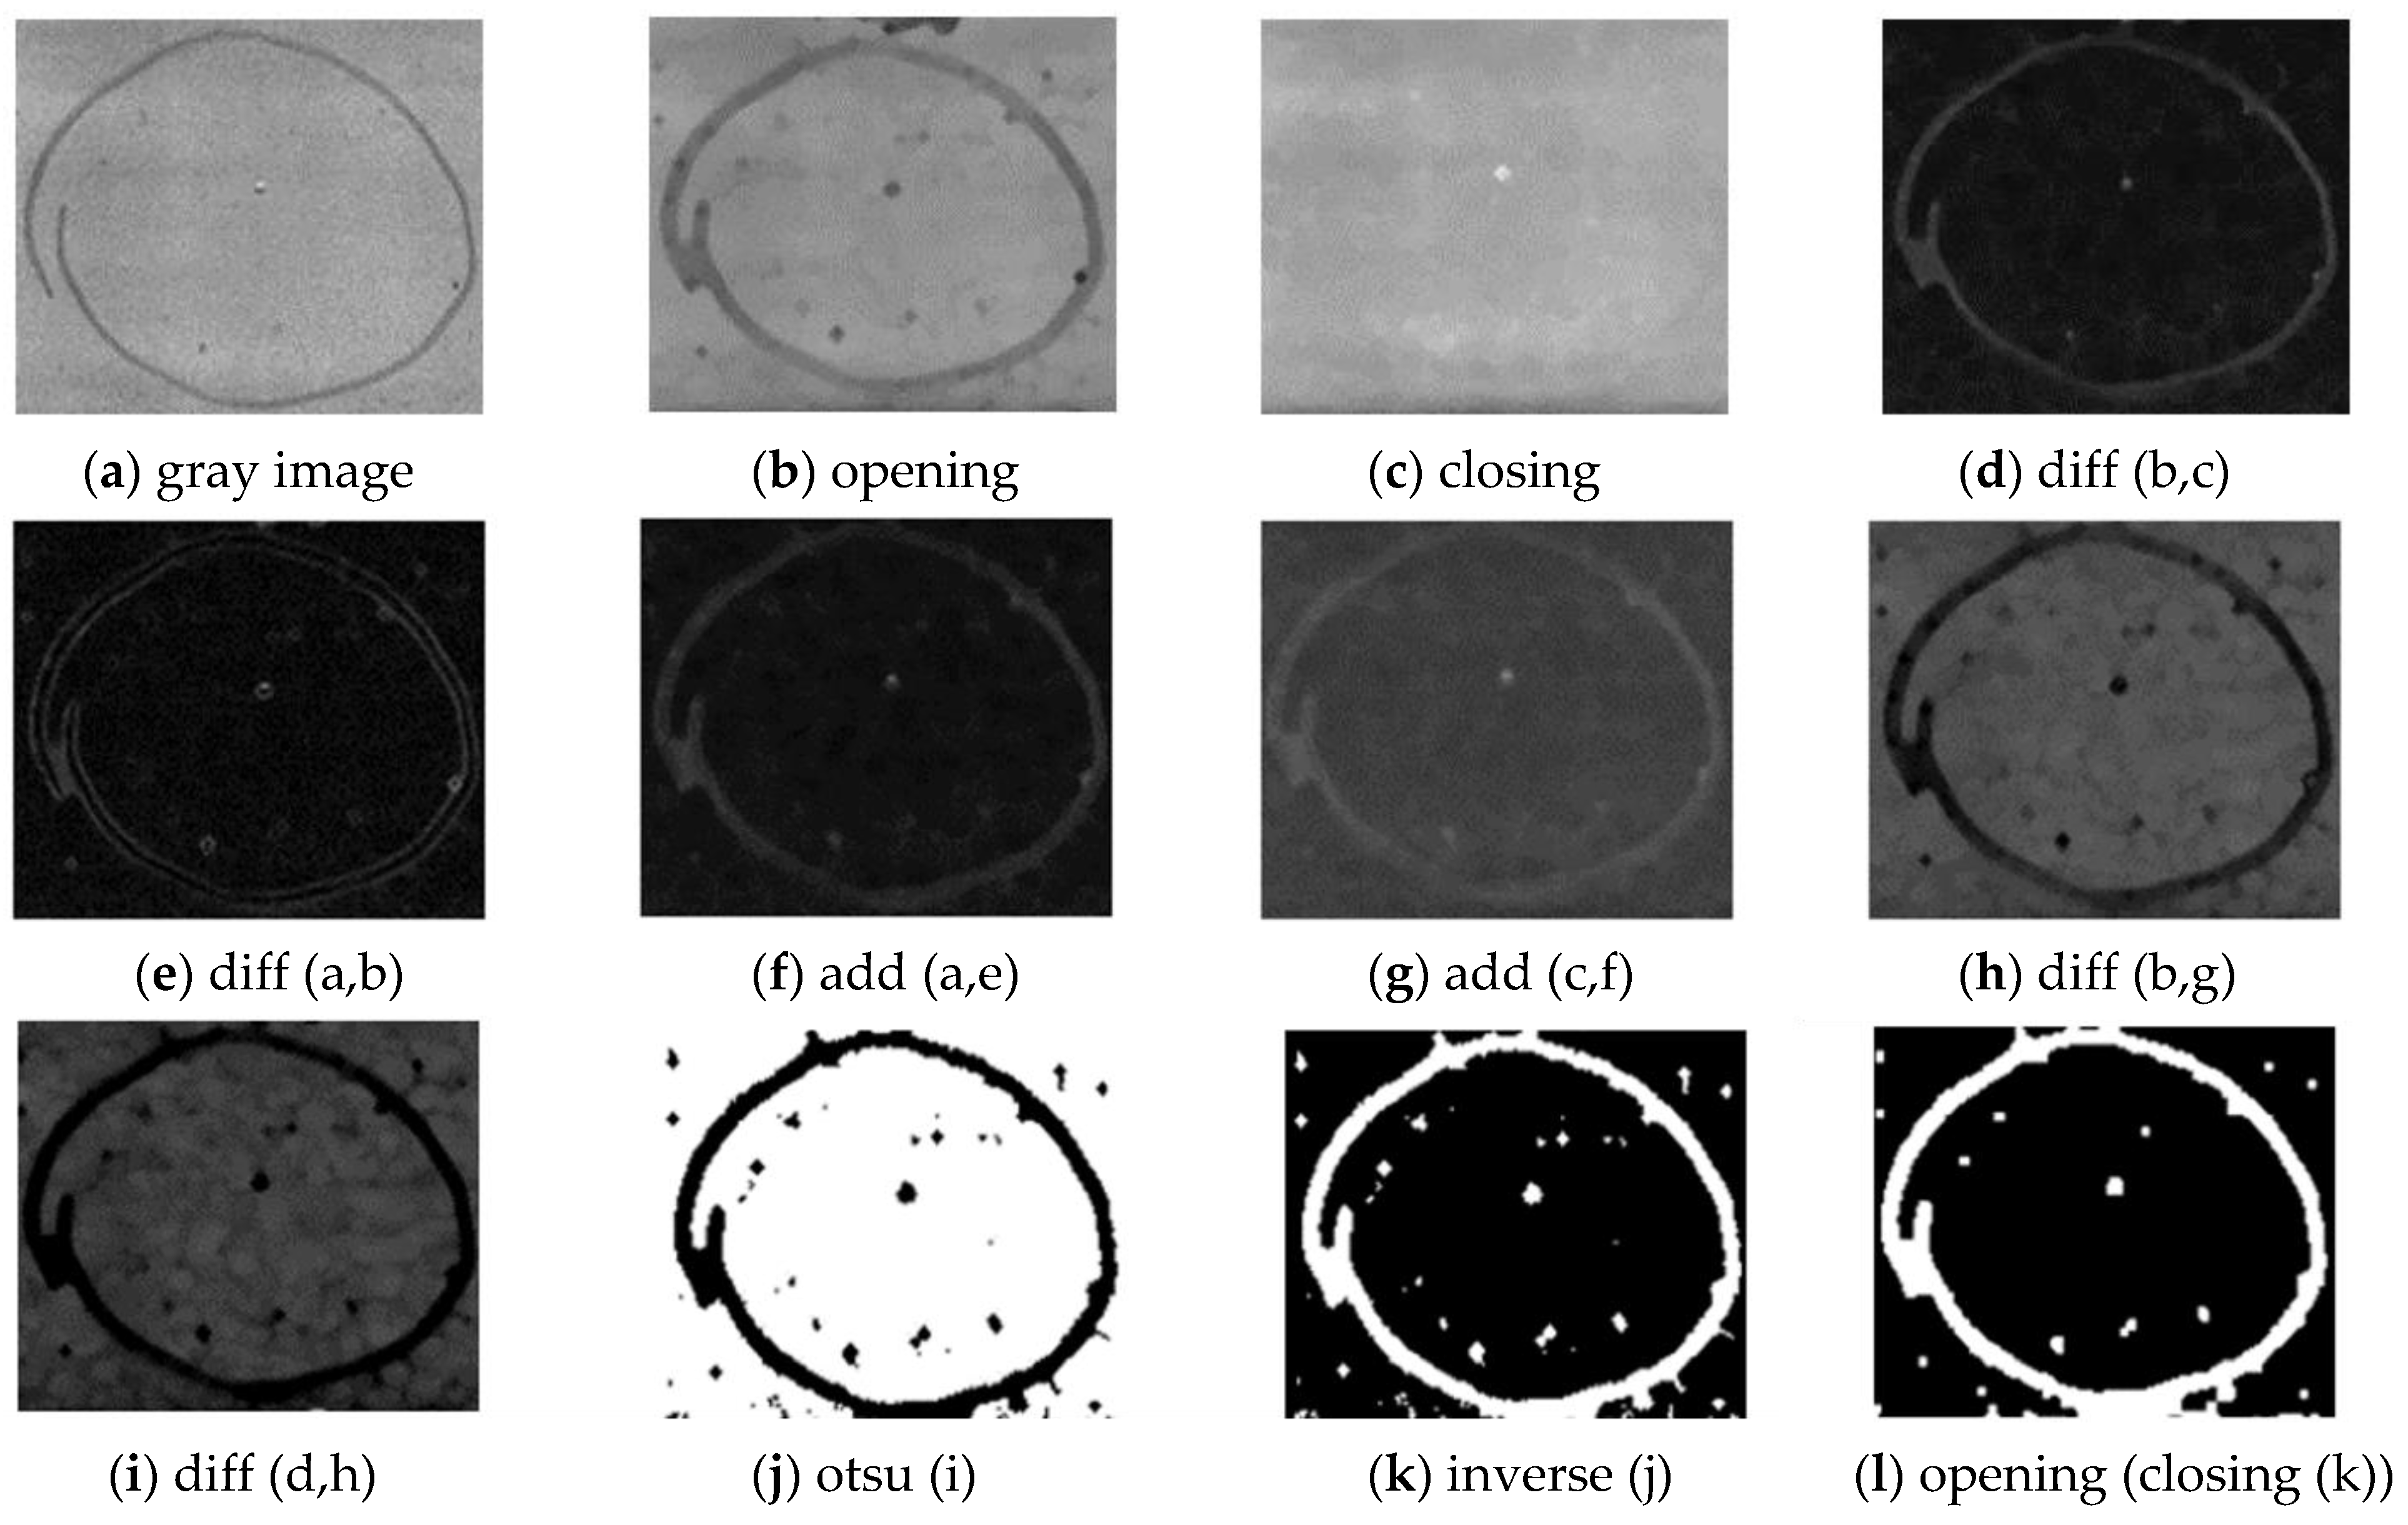
Here, is the original image, are the original image coordinates, and are the coordinates of the structure element. In addition, because pit defects have a round shape, an ellipse structure element was used. Figure 6 shows the results of multiple feature map extraction for morphology operation-based pit defect candidate region detection. Figure 6b shows the results of the opening morphology operation for the grayscale image in Figure 6a. The opening operation has the effect of removing small-sized light pixels during the dilation process after an erosion operation. By contrast, Figure 6c shows the results of the closing operation, which has the effect of removing dark regions through erosion after a dilation operation. Here, in the case of strong-level pits, the pit regions are shown clearly using only the closing operation, whereas the weak-level pits are not shown clearly at this stage. In addition, because of the light pixels in the background regions in the results of the closing operation, a significant amount of noises may be included in the binarization results, or it may be difficult to find the binarization threshold value. To resolve this problem, this study adopted an approach to extract multiple feature maps that suppress the background region noise and more clearly enhance weak-level pits. Multiple feature maps are extracted through addition and difference operations conducted on each feature map based on the morphology operation results.
First, Figure 6d is an image obtained through a difference operation applied to the results of the opening and closing operations. The difference operation is used to block the background noises in the image and obtain a localized bright region. As can be seen in the resulting image, the background region is darkened while the pit defect region is brightened, making it clearly visible. Figure 6e shows the results of a difference operation conducted on a grayscale image with the resulting image of the opening operation in Figure 6b. Consequentially, the edge areas are emphasized. A weighted sum of the feature maps of which the inner and edge regions of the pits have become more visible is performed to make the weak-level pits more distinct. During this process, although the background noise may also become clear, it can prevent non-detection of weak-level pits. Figure 6f,g show the results of clearly enhancing the pit regions by applying a weighted sum of the feature maps obtained through the aforementioned difference operation and one more weighted sum on the closing operation results with the brightest pit regions. A comparison of the resulting image in Figure 6g with the image in Figure 6c shows that the contrast between the pit regions and background is clearer. When a difference operation applies the image in Figure 6g, which has enhanced pit regions and the image in Figure 6b, an image having clearly distinguished pit regions is obtained, as shown in Figure 6h. By improving the contrast in this way, it becomes easier to find the threshold value when conducting adaptive binarization to extract candidate regions, and the quality of the binarization is therefore improved. In order to prevent the intermittent loss of information, Figure 6i is obtained by the difference operations between Figure 6h,d where the internal regions are clearly emphasized. Finally, Figure 6k can be obtained using Otsu binarization, which is an adaptive method, and then inverting the result.
The Otsu algorithm sets the threshold k so that it maximizes the variance among classes in a histogram of the image [13].
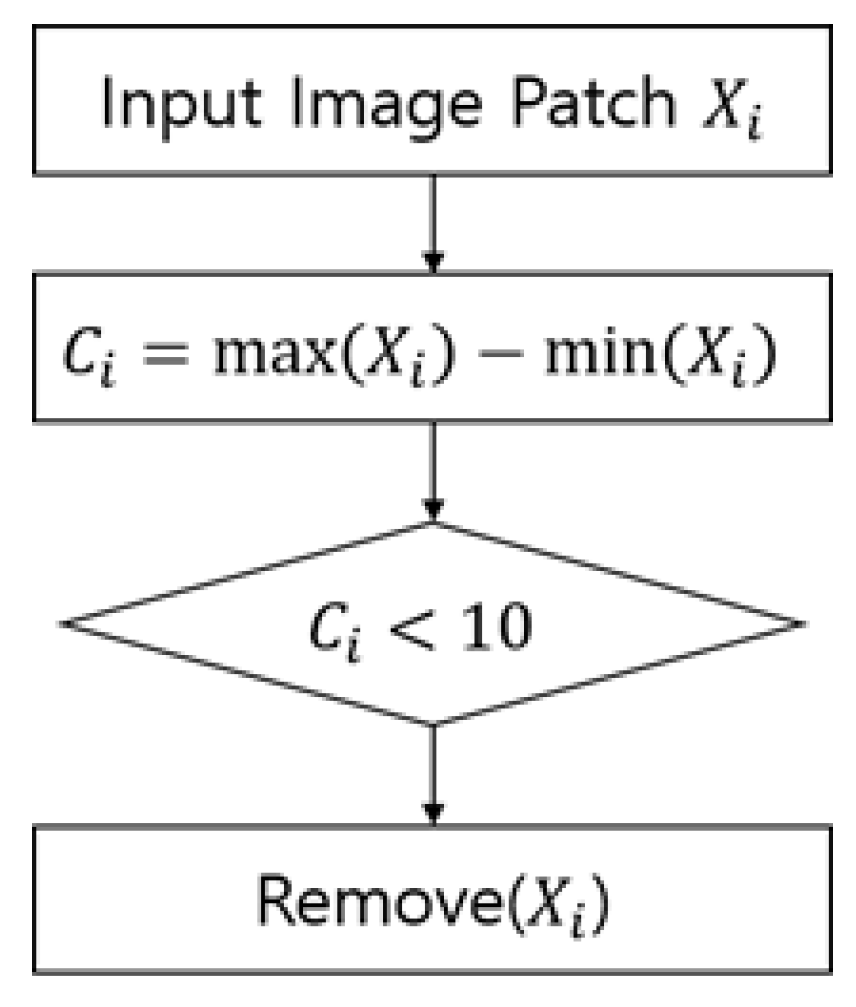
In Equation (6), is the average brightness of the entire image and is the probability of the occurrence of a set consisting of the components of a histogram from brightness label 0 to k. Furthermore, is the average brightness of the accumulated value up to label k. Pit defects and the background regions can be clearly distinguished by calculating the parameters and , according to the k value, and finding a threshold value for dividing the image that maximizes the variance among classes. During the multiple feature map synthesis process, the noise of the background regions may also become distinct, which may increase in the number of candidate region image patches. To resolve this problem, morphology operations that are mainly used for noise removal are applied in sequence to obtain a resulting image with the fine noise of the background regions removed, as shown in Figure 6l. The final resulting image is divided into regional units through four-connectivity labeling. Finally, based on the observation that the maximum size of the pit defects is approximately 10 × 10 pixels owing to the characteristics of the defects, all regions larger than the maximum size of pits are removed. However, if the condition of the image is poor, a much higher amount of noises will be included in comparison to the number of pit defects. This problem occurs when the background noise with a faint edge or dot-like shapes is also enhanced during the multiple feature map synthesis process. Although most of the candidate regions’ image patches can be adequately classified during the classification process, the following contrast-based filtering was applied to reduce the overhead of the classification process.
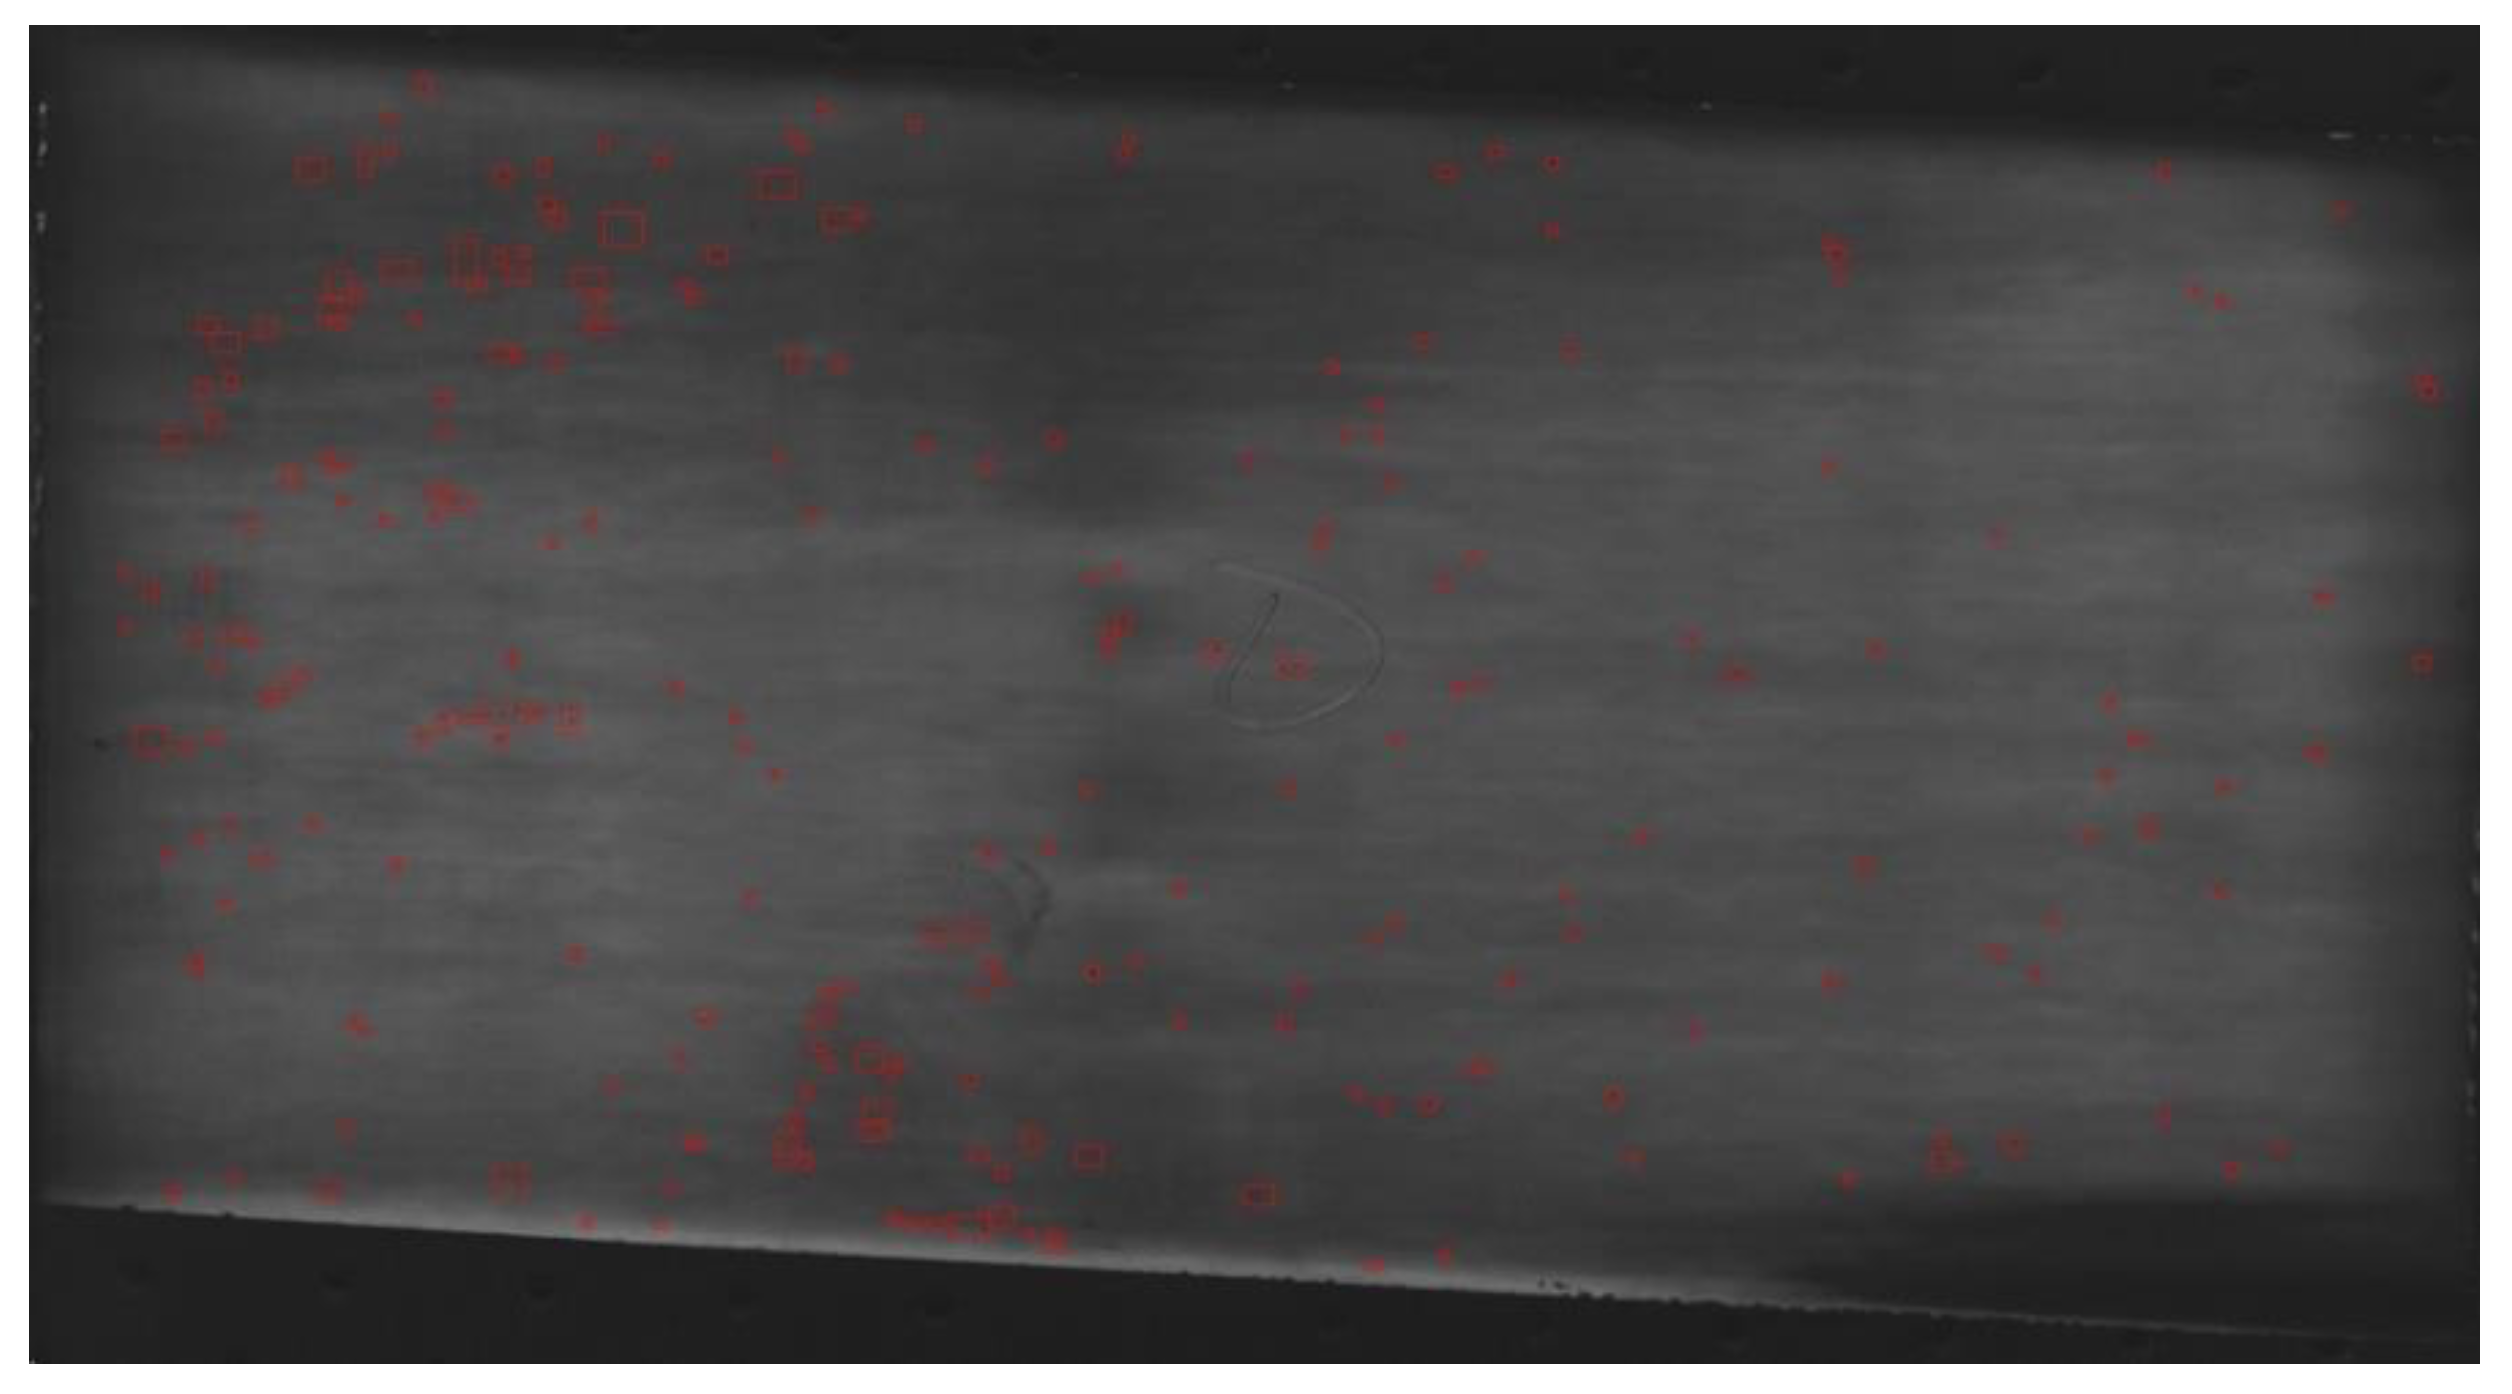
Figure 7 shows the contrast-ratio-based filtering process for the image patch out of N total candidate regions. Among the methods used to find the contrast ratio of an image, a histogram-based method is more sophisticated. However, considering the overhead, we used a method that finds the difference between the maximum and minimum values of the image patch. In this case, where there is no minimum contrast ratio in the candidate region, background regions can be quickly found. The contrast ratio threshold was set as the minimum value at which weak-level pits were not filtered during the experiments. By creating boundary boxes in the candidate regions after applying contrast-based filtering, it is possible to obtain fully localized candidate region extraction results, as shown in Figure 8. If the condition of the captured film images is poor, an extremely large amount of noises may be included; however, contrast-based filtering can be used to remove 20% to 30% of the noise regions.
3.2.3. Pit Classification
The extracted pit candidate regions are entered as an input into a CNN-based binary classifier. This study used typical CNN models such as ResNet [27], MobileNet [28], and SqueezeNet [29] for binary classification. ResNet uses a skip-connection, which adds the output value of previous layer to the output value of a certain layer . This resolves the learning problems of deep-layer models. ResNet is a typical CNN-based model with markedly improved performance. MobileNet is a typical lightweight CNN model employing depth-wise convolutions and using a small number of parameters to achieve an excellent image classification performance. SqueezeNet is another typical lightweight CNN model. By introducing the Fire Module, this model achieves the same performance as existing CNN-based models with a greatly reduced model size. In this study, experiments were conducted using these three CNN models as binary classifiers, which have their own unique features, and their performances were compared.
4. Experiments and Results
4.1. Implementation Details
To evaluate the small pit defect detection performance of the proposed RT-SPeeDet method, the following experiment environment was applied. All experiments were conducted using the deep learning framework PyTorch on an Intel i7-6850K CPU and NVIDIA GTX Titan XP GPU. The main library versions used in the experiments were Python 3.8.5, PyTorch 1.9, TorchVision 0.10.0, and OpenCV 4.5.2.
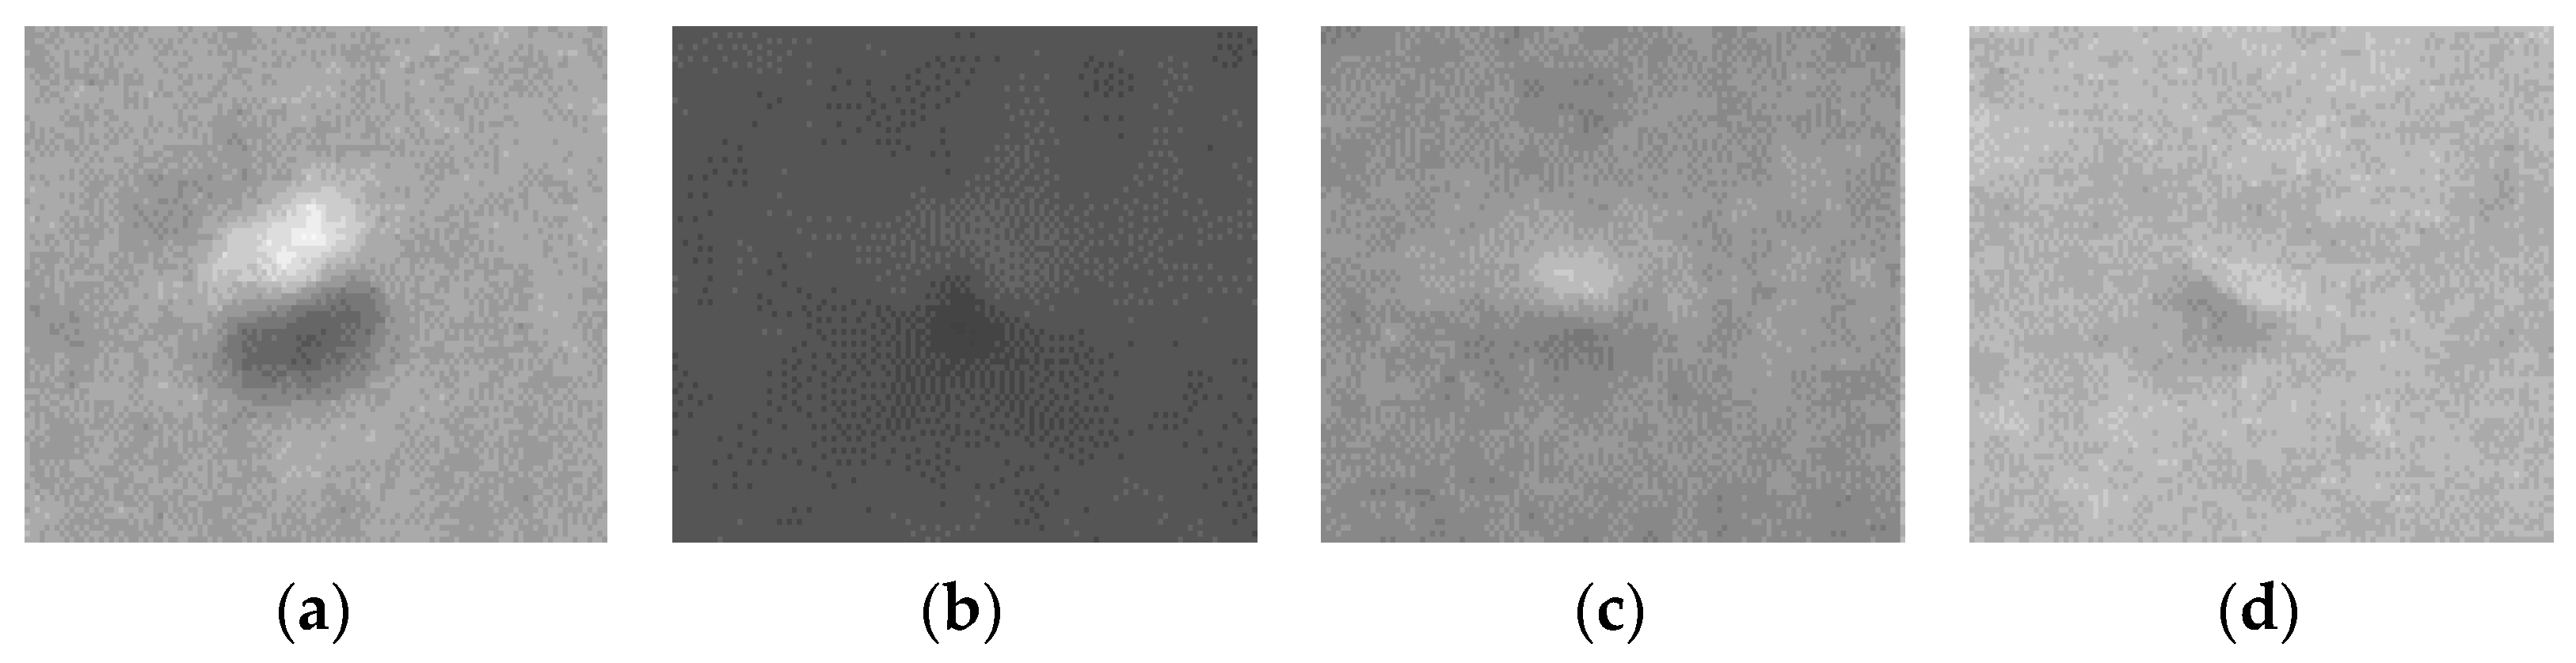
To train the CNN model, we used 792 pit defect image patches with a size of 28 × 28 pixels, which were extracted from 300 film images, as shown in Figure 9a–d. In order to train non-pit regions, 58,149 image patches with a size of 28 × 28 pixels that may include either noise or background were used. The overall dataset was randomly divided into 90% for training and 10% for testing. Training was conducted for 80 epochs on all models with a batch size of 128 and a learning rate of 0.005. The loss function was a cross entropy, and the stochastic gradient descent (SGD) optimizer was applied. For the final performance evaluation, tests were conducted using 30 film images with a resolution of 8192 × 6000 pixels in which 68 pit defects were present. During the experiments, the image resize parameter was n = 4, and the resolution of the test input images was adjusted to 2048 × 1500 pixels. According to the results of the ablation study described in Section 5, these values were the most stable for detecting pit defects.
In the detection performance evaluations, the degree to which the predicted boundary box overlapped with the correct answer ground truth was calculated, and the prediction was found to be correct if the threshold value was 50% or more and the class prediction value matched the correct answer value. The evaluation indexes that were used in the performance evaluations consisted of true positives (TPs), in which the correct answer was accurately predicted, true negatives (TNs) in which something other than the correct answer was predicted to be an incorrect answer, false positives (FPs) in which an incorrect answer was predicted to be correct, and false negatives (FNs), in which a correct answer could not be predicted. These four indexes were used to calculate the precision and recall, as shown in Equations (7) and (8). In addition, the experiments also used the accuracy index given in Equation (9) to evaluate the candidate region image patch classification performance.
Additional performance evaluation indexes include the PR-curve and average precision (AP) indexes, which classify the confidence of the model regarding the detection results, according to the threshold value, and show changes in the precision and recall. However, in the case of RT-SPeeDet, binary classification is conducted on each candidate region, and most of the confidence values were measured at 90% or more. For this reason, changes in the threshold value were insignificant; therefore, the AP index was not used in the performance evaluation of RT-SPeeDet.
4.2. Candidate Region Extraction Performance of RT-SPeeDet
First, Table 2 shows the performance of the proposed multiple feature map-based candidate region extractor. The candidate region extractor extracted 4339 candidate regions from all film images in the test set, and approximately 96% of all pit defects were included. Recall is a performance index that finds defective samples, and is used as an important index to reduce the number of defective products during the manufacturing processes. In terms of recall, it can be seen that the proposed candidate region extraction algorithm RT-SPeeDet achieves an excellent performance. For the processing speed of each module, it took 60 ms to extract positive regions and 30 ms to extract candidate regions from positive regions. As a result, candidate region image patches can be extracted from high-resolution input images at a processing speed of 0.1 s or less.
4.3. Comparison with Faster R-CNN and YOLO-v3
Table 3 shows the small pit defect detection test results for the RT-SPeeDet, Faster R-CNN, and YOLO-v3 models. Here, SqueezeNet was used as the CNN architecture of RT-SPeeDet, and the bold text shows the best performance for each of the evaluation indexes, including those of Faster R-CNN and YOLO-v3. First, it can be seen that the two models other than RT-SPeeDet were unable to detect any of the defects, and YOLO-v3 in particular was unable to make even a single prediction. As related studies have found, the major causes of the poor detection performance were the loss of object information owing to a convolution in the forward propagation process of the model, as well as the size of the anchor boxes, which were larger than the small pit defects. Although Faster R-CNN predicted boundary boxes containing pit defects, the IoU value was extremely low owing to the large anchor boxes, and all boundary boxes were classified as a misdetection. Based on these results, it can be seen that the two models are unable to properly learn the pit defects in high-resolution images without a separate optimization process.
To evaluate the pit detection performance of each model in more detail, the positive regions of the film images were divided into 96 images with a pixel resolution of 512 × 512 pixels, and training and evaluation were conducted, as in a related study described in Section 2. The results of these experiments are shown in the Faster R-CNN_Cropped and YOLO-v3_Cropped rows of Table 4. Even though the resolution of the input images was reduced, the YOLO-v3 model was unable to find more than 7 of the pits with a recall rate of 10%. Furthermore, because 96 image patches were created for each film image, it took approximately 4 s to search a single image. Faster R-CNN found 42 pits, although it took approximately 14 s to search each image.
By contrast, RT-SPeeDet detected pits with 98% precision and approximately 80% recall. Although it achieved a processing time of 1.5 s, the fact that it could process high-resolution images with a size of 8192 × 600 pixels without dividing the images shows that it has an excellent processing speed and detection accuracy. Notably, the proposed candidate region image patches were classified into pit defects and background regions with 99.7% accuracy, indicating an excellent pit defect classification performance. However, detection in manufacturing processes, which is the target of this paper, require a processing speed of less than 1 s; therefore, further speed improvements are still needed. To this end, an additional ablation study was conducted to compare the performance based on the use of lightweight architectures. The results of the ablation study are described in the next section.
5. Ablation Study
In this study, the RT-SPeeDet CNN binarization classifier was replaced with three different architectures, and a detailed analysis was conducted on two factors. In Table 4 and Table 5, the abbreviations R, M, and S refer to ResNet, MobileNet, and SqueezeNet, respectively. First, this study compared changes in the processing performance according to the image resolution, which was adjusted according to the value of the hyperparameter n. This study then examined changes in performance according to the use of data augmentation techniques.
5.1. Effect of Input Image Resolution
Table 4 shows the experiment results for each model according to the input image resolution. The detection times for each resolution had a maximum of 4 s with extremely large differences, which is due to changes in the number of candidate regions based on the resolution. As the resolution increased, the noise in the background region also increased, and the candidate regions increased by a factor of greater than 2, which increased the processing time and misdetection rate. By contrast, when the resolution was too low, some of the pit defect regions were lost, and the number of non-detections increased. In the case of MobileNet, when n was 4, there was only a 1% difference in precision compared to SqueezeNet, whereas it achieved more than 3 times faster speed at 0.47 s. Since the proposed two-stage detector RT-SPeeDet is compatible structure, converting classifier to lightweight architecture makes it possible to achieve processing speeds of less than 1 s. This shows the proposed model is efficient in terms of structure.
5.2. Effects of Data Augmentation Techniques
For data augmentation, this study used techniques such as brightness change, random rotation, and automatic contrast adjustment. Table 5 shows the results of training and testing using 792 additional augmented images for each of these three augmentation techniques.
The baseline shows the results for the original dataset without any data augmentation techniques applied. For the two techniques other than Auto Contrast, the precision decreased significantly. When Adjust Bright was used, the contrast between the pit and background regions decreased in some of the created data, and the number of misdetections greatly increased. In the case of Random Rotation, the misdetection rate increased because RT-SPeeDet, which performs localization through image processing without model training, is vulnerable to changes in location. However, when Auto Contrast was used, the recall performance increased by up to 3% compared to the existing method. In the case of RT-SPeeDet-M in particular, the precision slightly decreased, whereas the recall improved by more than 29%, and the model showed the same recall as the RT-SPeeDet-S model. Given that we aim at a pit defect detection speed of less than 1 s, the RT-SPeeDet-M model achieved an excellent detection rate with half the processing speed by applying the data augmentation techniques.
5.3. Limitations
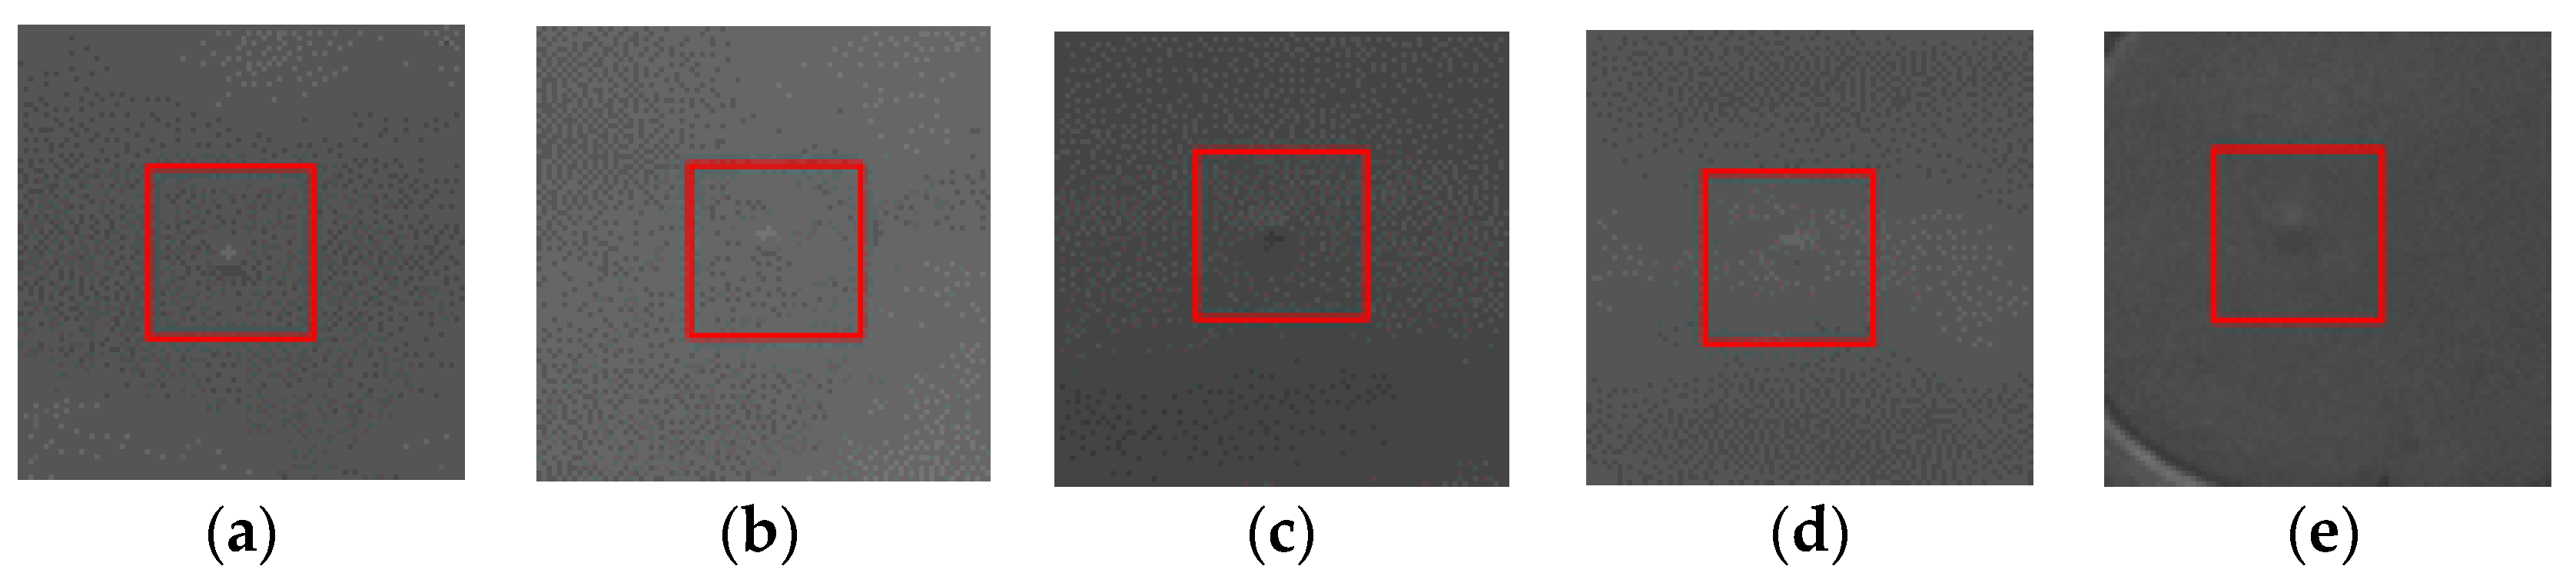
The detection rate for weak-level pits which makes pit detection difficult can be improved by synthesizing multiple feature maps; however, the proposed RT-SPeeDet still has a difficulty of detecting weak-level pits that are too small or have almost no contrast with the background regions, resulting in the undetected pits described in Figure 10a–e. The reason of detection failure is due to the simple image resizing for lightweight image processing, which is used inevitably to process high-resolution images in real time. Moreover, most of the processing time of RT-SPeeDet is spent on the classification task. Among the processing times in Table 4, the image processing-based candidate region extraction time is only 0.1 s, and the rest of the time is spent on the classification process. Considering that the image classification speed of RT-SPeeDet-M is 3 ms, a more fine-grained image processing technique is required to reduce the number of input candidate regions to improve the processing time.
6. Conclusions and Future Work
This paper proposed a real-time IP–CNN-based pits detection method for automatic inspection of small pit defects during the film manufacturing process employed in popular electronic devices of digital display. Previous deep-learning-based general-purpose object detection solutions that rely on end-to-end DNN models have some constraints of accuracy and processing speed to detect the micro-fine defects, such as pits, due to repeated convolution and down-sampling operations in the feature extraction process. On the contrary, experimental results presented in this paper show that the proposed RT-SPeeDet could achieve both target processing speed and detection accuracy of small pits by exploiting a two-stage structure based on IP–CNN. Furthermore, the presented method can be applied to detect more diverse type of defects in the other manufacturing industry, beyond small film pits targeted in this paper, by expanding it to multi-class defects detection or similar anomaly detection problems with insufficient training data and weak features. Proposing a more precise candidate region extracting algorithm to increase accuracy, as well as further reducing the overall processing time, are possible applicants of future research directions.
Author Contributions
Conceptualization and methodology G.B. and J.Y.; software, G.B.; validation, G.B.; investigation, G.B.; data curation, G.B.; writing—original draft preparation, G.B.; writing—review and editing, G.B. and J.Y.; supervision, J.Y.; project administration, J.Y.; funding acquisition, J.Y. All authors have read and agreed to the published version of the manuscript.
Funding
This research was supported by the Daegu University Research Grant 2019.
Institutional Review Board Statement
Not applicable.
Informed Consent Statement
Not applicable.
Data Availability Statement
Data sharing is not applicable for the security issue.
Acknowledgments
This research was supported by the Daegu University Research Grant 2019.
Conflicts of Interest
The authors declare no conflict of interest.
References
- Dong, X.; Taylor, C.J.; Cootes, T.F. Small Defect Detection Using Convolutional Neural Network Features and Random Forests. In Proceedings of the European Conference on Computer Vision (ECCV) Workshops, Munich, Germany, 8–14 September 2018. [Google Scholar]
- Zhao, W.; Chen, F.; Huang, H.; Li, D.; Cheng, W. A New Steel Defect Detection Algorithm Based on Deep Learning. Comput. Intell. Neurosci. 2021, 2021, 1–13. [Google Scholar]
- Liu, J.; Xu, G.; Ren, L.; Qian, Z.; Ren, L. Defect intelligent identification in resistance spot welding ultrasonic detection based on wavelet packet and neural network. Int. J. Adv. Manuf. Technol. 2017, 90, 2581–2588. [Google Scholar] [CrossRef]
- Sun, X.; Gu, J.; Huang, R.; Zou, R.; Palomares, B.G. Surface Defects Recognition of Wheel Hub Based on Improved Faster R-CNN. Electronics 2019, 8, 481. [Google Scholar] [CrossRef] [Green Version]
- Li, C.; Zhang, X.; Huang, Y.; Tang, C.; Fatikow, S. A novel algorithm for defect extraction and classification of mobile phone screen based on machine vision. Comput. Ind. Eng. 2020, 146, 106530. [Google Scholar] [CrossRef]
- Ren, S.; He, K.; Girshick, R.; Sun, J. Faster R-CNN: Towards Real-Time Object Detection with Region Proposal Networks. In Proceedings of the International Conference on Neural Information Processing Systems, Montreal, QC, Canada, 7–12 December 2015; pp. 91–99. [Google Scholar]
- Redmon, J.; Divvala, S.; Girshick, R.; Farhadi, A. You only look once: Unified, real-time object detection. In Proceedings of the IEEE Conference on Computer Vision and Pattern Recognition, Las Vegas, NV, USA, 27–30 June 2016; pp. 779–788. [Google Scholar]
- Redmon, J.; Farhadi, A. YOLO9000: Better, faster, stronger. In Proceedings of the IEEE Conference on Computer Vision and Pattern Recognition, Honolulu, HI, USA, 21–26 July 2017; pp. 6517–6525. [Google Scholar]
- Redmon, J.; Farhadi, A. Yolov3: An incremental improvement. arXiv 2018, arXiv:1804.02767. [Google Scholar]
- Lin, T.Y.; Goyal, P.; Girshick, R.; He, K.; Dollar, P. Focal loss for dense object detection. In Proceedings of the IEEE International Conference on Computer Vision, Venice, Italy, 22–29 October 2017; pp. 2980–2988. [Google Scholar]
- Girshick, R. Fast r-cnn. In Proceedings of the IEEE International Conference on Computer Vision, Santiago, Chile, 11–18 December 2015; pp. 1440–1448. [Google Scholar]
- Liu, W.; Anguelov, D.; Erhan, D.; Szegedy, C.; Reed, S.; Fu, C.Y.; Berg, A.C. SSD: Single Shot MultiBox Detector. In Proceedings of the European Conference on Computer Vision, Amsterdam, The Netherlands, 11–14 October 2016; pp. 21–37. [Google Scholar]
- Chen, G.; Wang, H.; Chen, K.; Li, Z.; Song, Z.; Liu, Y.; Knoll, A. A survey of the four pillars for small object detection: Multiscale representation, contextual information, super-resolution, and region proposal. IEEE Trans. Syst. 2020, 1–18. [Google Scholar] [CrossRef]
- Tabernik, D.; Šela, S.; Skvarč, J.; Skočaj, D. Segmentation-based deep-learning approach for surface-defect detection. J. Intell. Manuf. 2020, 31, 759–776. [Google Scholar] [CrossRef] [Green Version]
- Westphal, E.; Seitz, H. A machine learning method for defect detection and visualization in selective laser sintering based on convolutional neural networks. Addit. Manuf. 2021, 41, 101965. [Google Scholar]
- Hu, H.; Xu, D.; Zheng, X.; Zhang, B. Pit defect detection on steel shell end face based on machine vision. In Proceedings of the 2020 IEEE 4th Information Technology, Networking, Electronic and Automation Control Conference (ITNEC), Chongqing, China, 12–14 June 2020; pp. 898–902. [Google Scholar]
- Otsu, N. A threshold selection method from gray-level histogram. IEEE Trans. Syst. Man Cybern. 1979, 9, 62–66. [Google Scholar] [CrossRef] [Green Version]
- Zhao, W.; Huang, H.; Li, D.; Chen, F.; Cheng, W. Pointer defect detection based on transfer learning and improved cascade-RCNN. Sensors 2020, 20, 4933. [Google Scholar] [CrossRef] [PubMed]
- Xu, Z.; Xu, X.; Wang, L.; Yang, R.; Pu, F. Deformable ConvNet with aspect ratio constrained NMS for object detection in remote sensing imagery. Remote Sens. 2017, 9, 1312. [Google Scholar] [CrossRef] [Green Version]
- Zhu, X.; Hu, H.; Lin, S.; Dai, J. Deformable ConvNets v2: More deformable, better results. In Proceedings of the IEEE/CVF Conference on Computer Vision and Pattern Recognition, Long Beach, CA, USA, 16–20 June 2019; pp. 9308–9316. [Google Scholar]
- Jiang, Q.; Tan, D.; Li, Y.; Ji, S.; Cai, C.; Zheng, Q. Object Detection and Classification of Metal Polishing Shaft Surface Defects Based on Convolutional Neural Network Deep Learning. Appl. Sci. 2019, 10, 87. [Google Scholar] [CrossRef] [Green Version]
- Ren, Y.; Zhu, C.; Xiao, S. Small object detection in optical remote sensing images via modified faster R-CNN. Appl. Sci. 2018, 8, 813. [Google Scholar] [CrossRef] [Green Version]
- Cao, C.; Wang, B.; Zhang, W.; Zeng, X.; Yan, X.; Feng, Z.; Wu, Z. An improved faster R-CNN for small object detection. IEEE Access 2019, 7, 106838–106846. [Google Scholar] [CrossRef]
- Kisantal, M.; Wojna, Z.; Murawski, J.; Naruniec, J.; Cho, K. Augmentation for small object detection. arXiv 2019, arXiv:1902.07296. [Google Scholar]
- Kim, J.H.; Park, J.J.; Ahn, S.H.; Lee, D.G.; Moon, D.S.; Kim, S.K. Small target detection using morphology and modified Gaussian distance function. Secur. Commun. Networks 2016, 9, 555–560. [Google Scholar] [CrossRef]
- Ban, J.H.; Yoo, J.H. Real-Time Small Target Detection Using Local Contrast Difference Measure at Predictive Candidate Region. J. Korea Ind. Inf. Syst. Res. 2017, 22, 1–13. [Google Scholar]
- He, K.; Zhang, X.; Ren, S.; Sun, J. Deep Residual Learning for Image Recognition. In Proceedings of the IEEE Conference on Computer Vision and Pattern Recognition, Las Vegas, NV, USA, 27–30 June 2016; pp. 770–778. [Google Scholar]
- Howard, A.G.; Zhu, M.; Chen, B.; Kalenichenko, D.; Wang, W.; Weyand, T.; Andreetto, M.; Adam, H. MobileNets: Efficient Convolutional Neural Networks for Mobile Vision Applications. arXiv 2017, arXiv:1704.04861. [Google Scholar]
- Iandola, F.; Han, S.; Moskewics, M.W.; Ashraf, K.; Dally, W.J.; Keutzer, K. SqueezeNet: AlexNet-level accuracy with 50× fewer parameters and <0.5 MB model size. arXiv 2016, arXiv:1602.07360. [Google Scholar]
Figure 1.
Different type of film surface defects; (a) wrinkle, (b) bubble, (c) scratch, (d) pit.

Figure 2.
Film images; (a) original film image with small pit defects, (b) enlarged pit area.

Figure 3.
Pit defects according to the difficulty of observability; (a) strong level, (b) medium level, (c) weak level.
Figure 3.
Pit defects according to the difficulty of observability; (a) strong level, (b) medium level, (c) weak level.

Figure 4.
Diagram of IP–CNN-based RT-SPeeDet system.

Figure 5.
Positive region extraction process; (a) input image, (b) binarization result, (c) extracted positive region.
Figure 5.
Positive region extraction process; (a) input image, (b) binarization result, (c) extracted positive region.

Figure 6.
Morphology operation results executed to extract and synthesize multiple feature maps; (a)–(l).
Figure 6.
Morphology operation results executed to extract and synthesize multiple feature maps; (a)–(l).

Figure 7.
Flow chart of contrast ratio-based filtering.

Figure 8.
Candidates of pit defects through extracting features and localizing bounding boxes.

Figure 9.
Various pit defects used to train the detection model; (a–d) training sample images.

Figure 10.
Examples of describing a difficulty of detecting weak-level pits; (a–e) undetected pits.


Table 1.
Performance comparison of existing defect detection models.
| Method | Input Image | Speed [s] | Deep Learning | Small Defects |
|---|---|---|---|---|
| Hu [16] | 1928 × 1448 | 3.41 | × | ○ |
| Zhao [18] | 2800 × 300 | 1.57 | ○ | ○ |
| Tabernik [14] | 1408 × 512 | 0.11 | ○ | × |
| Westphal [15] | 180 × 180 | 0.13 | ○ | × |
| Jiang [19] | 512 × 512 | 2.29 | ○ | ○ |
Table 2.
Candidate region extraction performance of RT-SPeeDet.
| Cropping Positive Region Speed | Extracting Candidate Region Speed | TP | TN | FP | FN | Precision | Recall |
|---|---|---|---|---|---|---|---|
| 0.06 s | 0.03 s | 65 | 0 | 4274 | 3 | 1.5% | 95.6% |
Table 3.
Performance comparison of various object detectors with small pit defects dataset.
| Model | TP | TN | FP | FN | Precision (%) | Recall (%) | Acc (%) | Time (s) |
|---|---|---|---|---|---|---|---|---|
| RT-SPeeDet | 54 | 4284 | 1 | 14 | 98.2 | 79.4 | 99.7 | 1.48 |
| Faster R-CNN [6] | 0 | 0 | 68 | 68 | 0 | 0 | 0 | 0.15 |
| YOLO-v3 [9] | 0 | 0 | 0 | 68 | 0 | 0 | 0 | 0.043 |
| Faster R-CNN_Cropped | 42 | 0 | 13 | 26 | 76.3 | 61.8 | 51.9 | 14.59 |
| YOLO-v3_Cropped | 7 | 0 | 4 | 59 | 63.6 | 10.3 | 10 | 4.128 |
Table 4.
Small pit defect detection test results according to input image resolution.
| Model | Resolution | Precision (%) | Recall (%) | Acc (%) | Time (s) |
|---|---|---|---|---|---|
| RT-SPeeDet-R | 1638 × 1200 (n = 5) | 70.4 | 73.5 | 98.1 | 2.6 |
| RT-SPeeDet-M | 97.6 | 60.3 | 99.0 | 0.55 | |
| RT-SPeeDet-S | 98.0 | 73.5 | 99.7 | 1.73 | |
| RT-SPeeDet-R | 2048 × 1500 (n = 4) | 71.1 | 79.4 | 99.2 | 2.28 |
| RT-SPeeDet-M | 97.2 | 51.5 | 99.2 | 0.47 | |
| RT-SPeeDet-S | 98.2 | 79.4 | 99.7 | 1.48 | |
| RT-SPeeDet-R | 2730 × 2000 (n = 3) | 47.1 | 83.8 | 99.3 | 6.22 |
| RT-SPeeDet-M | 80.0 | 35.3 | 99.5 | 1.07 | |
| RT-SPeeDet-S | 96.5 | 80.9 | 99.3 | 3.99 |
Table 5.
Pit defect detection results according to the data augmentation techniques applied.
| Augmentation | Baseline | Auto Contrast | Adjust Bright | Random Rotation | Time (s) | |||||
|---|---|---|---|---|---|---|---|---|---|---|
| Model | Precision (%) | Recall (%) | Precision (%) | Recall (%) | Precision (%) | Recall (%) | Precision (%) | Recall (%) | ||
| RT-SPeeDet-R | 71.1 | 79.4 | 61.5 (−9.6) | 82.4 (+3) | 29.5 (−41.6) | 82.4 (+3) | 45.5 (−25.6) | 82.4 (+3) | 2.28 | |
| RT-SPeeDet-M | 97.2 | 51.5 | 88.7 (−8.5) | 80.9 (+29.4) | 49.6 (−47.6) | 82.4 (+30.9) | 53.5 (−43.7) | 55.9 (+4) | 0.47 | |
| RT-SPeeDet-S | 98.2 | 79.4 | 84.6 (−13.6) | 80.9 (+1.5) | 31.2 (−67) | 80.9 (+1.5) | 98.2 (0) | 82.4 (+3) | 1.48 | |
Publisher’s Note: MDPI stays neutral with regard to jurisdictional claims in published maps and institutional affiliations. |
© 2021 by the authors. Licensee MDPI, Basel, Switzerland. This article is an open access article distributed under the terms and conditions of the Creative Commons Attribution (CC BY) license (https://creativecommons.org/licenses/by/4.0/).
Share and Cite
MDPI and ACS Style
Ban, G.; Yoo, J. RT-SPeeDet: Real-Time IP–CNN-Based Small Pit Defect Detection for Automatic Film Manufacturing Inspection. Appl. Sci. 2021, 11, 9632. https://0-doi-org.brum.beds.ac.uk/10.3390/app11209632
AMA Style
Ban G, Yoo J. RT-SPeeDet: Real-Time IP–CNN-Based Small Pit Defect Detection for Automatic Film Manufacturing Inspection. Applied Sciences. 2021; 11(20):9632. https://0-doi-org.brum.beds.ac.uk/10.3390/app11209632
Chicago/Turabian StyleBan, Geunwoo, and Joonhyuk Yoo. 2021. "RT-SPeeDet: Real-Time IP–CNN-Based Small Pit Defect Detection for Automatic Film Manufacturing Inspection" Applied Sciences 11, no. 20: 9632. https://0-doi-org.brum.beds.ac.uk/10.3390/app11209632
Note that from the first issue of 2016, this journal uses article numbers instead of page numbers. See further details here.