Article

Use of Covariance Analysis in Electroencephalogram Reveals Abnormalities in Parkinson’s Disease

by
Gabriela González-González
1,
Víctor M. Velasco-Herrera
2 and
Alicia Ortega-Aguilar
1,*
1
Departamento de Bioquímica, Facultad de Medicina, Universidad Nacional Autónoma de México, Mexico City 04510, Mexico
2
Instituto de Geofísica, Universidad Nacional Autónoma de México, Mexico City 04510, Mexico
*
Author to whom correspondence should be addressed.
Submission received: 7 September 2021 / Revised: 4 October 2021 / Accepted: 7 October 2021 / Published: 15 October 2021

Abstract

:
Covariance analysis from wavelet data in electroencephalographic records (EEG) was, for the first time, applied in this study to unravel information contained in the standard EEG, which was previously not taken into consideration due to the mathematical models used. The methodology discussed here could be applied to any neurological condition, including the important early stages of neurodegenerative diseases. In this study, we analyzed EEG from control (CL) participants and participants with diagnosed Parkinson’s disease (PD), who were age-matched women in an eyes-closed resting state, to test the model. PD is predicted to rise over the next decades as the population ages. Furthermore, women are more likely to undergo PD-related complications and worse disability than men. Two groups based on age were considered: under and over 60 years (PD patients <60 and >60; CL <60 and >60). Continuous Wavelet Transform and Cross Wavelet Transform were applied to determine patterns of global wavelet curves, main frequencies, and power analyses. Our results indicate that both CL age groups and PD patients <60 share a main α brainwave and PD patients >60 showed a main δ brainwave. Interestingly, power anomalies analyses show a decreasing anteroposterior gradient in CL, whereas it is increasing in PD patients, which was not previously observed. The brainwave power in PD patients <60 was higher in θ, α and β waves and in >60 group, the δ, θ and β brainwaves were predominant. This methodology offers a tool to reveal abnormal electrical brain activity unseen by a regular EEG analysis. The advent of new models that process EEG, such as the model proposed in this study, promotes renewed interest in electrophysiology of the brain to study the early stages of PD and improve understanding of the origin and progress of the disease.

1. Introduction

The diagnosis of PD is mainly clinically based on the presence of cardinal motor symptoms. There are no tests to provide an early-stage diagnosis of the disease. Currently, an accurate diagnosis can only be achieved conducting post-mortem pathological examinations [1]. Several techniques, such as positron emission tomography (PET) and magnetic resonance imaging (MRI), are helpful in confirming PD and rule out possible brain injury [2,3]. Nevertheless, these medical examinations are not extensively available for several reasons: they can be costly, invasive, keep patients for prolonged periods in positions that are uncomfortable or stressful and cannot be prescribed to all patients. Therefore, it is necessary to generate new medical tools to confirm the clinical diagnosis of PD and research new biomarkers that help in the early identification of premotor expressions of the disease. These new tools must be low cost, accessible, less stressful, and even remotely possible.
Parkinson’s disease (PD) is a progressive neurodegenerative disorder that involves motor and non-motor symptoms. Major motor symptoms generally occur unilaterally and can include tremor, rigidity, and bradykinesia [1]. It has been observed that motor symptoms emerge later in women but with a faster progression and higher propensity to postural instability than men [4]. Non-motor symptoms typically appear before motor disorders and are the first symptoms of the disease. They include depression, anxiety, sleep disturbances and cognitive impairment [5,6,7]. In agreement with the Non-Motor Symptoms Scale, women are the population with more compromise on the sleep/fatigue and mood/cognition functions [8].
Currently, PD is the second most common neurodegenerative disorder in the world, affecting between 4 and 5 million people over 50 years of age worldwide [1]. Aging is the main risk factor of PD [9,10] with a reported male to female incidence rate of 3:2 worldwide [11]. However, female incidence could increase in the coming years due to the longer life expectancy of women worldwide, as revealed by epidemiological studies [12].
Although there are several pieces of evidence relating PD to specific protein mutations, mainly the A53T mutation in the alpha-Synuclein protein [1,13,14], which occurs in less than 10% of the PD diagnosed. Most PD cases have a sporadic origin, and yet, their etiology and anatomical initiation remain to be uncovered.
Pathophysiology of PD emphasizes that the motor and non-motor symptoms are related to abnormal neuronal firing rates or segregation/synchronization of neurons from specific circuits and loops between basal ganglia, thalamus, limbic areas, and specific cortical lobes [15], which may be analyzed through electroencephalography. Electroencephalography monitors neural activity of the cerebral cortex in real time with high temporal resolution [16] providing dynamic information on the electrical brain activity and connectivity. Quantitative electroencephalography has been used to detect abnormalities in brain activity and identify cognitive impairment in early stages of PD [17,18]. In agreement with the above-mentioned information, differences in the power of brainwaves, δ (0–4 Hz), θ (4–8 Hz), α (8–13 Hz) and β (13–30 Hz), from PD patients have been described; for instance, increases in δ and θ brainwaves and decreases in α and β brainwaves [19]. On the other hand, imbalances in β and γ brainwaves have also been identified and associated with the motor symptoms of the disease [20]. Therefore, EEG analyses have been considered a reliable biomarker for PD with greater sensitivity and pattern specificity [21,22].
Since EEG contains non-linear features, it is necessary to use new analytical methodologies to reveal more information related to brain abnormalities, which could still be hidden. Wavelet analyses are spectral tools used in medicine and biology for diagnosis and tracing. In neuroscience, they are considered a powerful analytic tool to study dynamics of neuronal systems and to discriminate between healthy and pathological states within neural dynamics [23]. Wavelets are specific to analyze non-lineal, spatially non-homogeneous and non-stationary power time series, such as EEG, and to transform a timescale signal in the time-frequency spaces by means of a multi-resolution analysis. In addition, a cross wavelet product, needed to generate a covariance analysis from Wavelet data, can remark intrinsic properties of a time series and identify common features when more than two sets of data are analyzed together [24,25,26].
Accordingly, the aim of this study was to apply the covariance wavelet analysis to EEG from women diagnosed with PD. The search for information in the time-frequency space, not previously reported by the classical models used, and which could identify new electroencephalographic abnormalities in the brain activity of PD patients, can be achieved through this methodology. The application of wavelet analyses in this study has advantages in examining finite-length time series, limiting the edge effects by means of expanding with sufficient zeros to bring the total length up to the next higher power of two. In this research, we also apply a wavelet-based filter because it can isolate single events that have a broad power spectrum or events that have varying frequency, which is useful in processing heterogeneous signals such as EEG. Patterns obtained by means of this methodology show major differences between EEG from control and PD patient groups. This approach could be applied under several physiological and pathological conditions, growing the potential of brainwave analysis obtained by standard EEG.

2. Materials

2.1. Electroencephalographic Records

The EEG were provided from the National Institute of Neurology and Neurosurgery of Mexico. The data correspond to seven voluntary women diagnosed with idiopathic PD (PD patients) and nine voluntary healthy women (CL) between 48 and 75 years old. PD patients and CL groups were subdivided into two groups based on age: under and over 60 years (PD patients <60 and >60; CL <60 and >60).
All the women were right-handed and of urban residence. PD patients motor initial laterality was mainly on the left side and their main motor symptom was tremor. Exclusion criteria for patients included secondary PD or Parkinsonism that was associated with other pathologies or drug induced. Information about motor and neuropsychological evaluations was also acquired with the electroencephalographic database (data not shown). Motor evaluation consisted of the duration of PD and MDS-UPDRS [27] and H&Y Scale [28] scores. Neuropsychological evaluation consisted of the BDI-II and BAI scores to determine the severity of depression and anxiety, respectively [29,30]. Besides the CASI [31], MMSE [32] and MoCA [33] scores were used to monitor the progression of dementia and the cognitive impairment in PD patients. According to the neuropsychological evaluation, PD patients and CL groups did not show cognitive impairment, but the PD patients groups showed mild-to-moderate depression and moderate anxiety. The presence of dreamlike alterations and hallucinations were also indicated.
PD patients were under pharmacological treatment as ruled by ethical guidelines during EEG, with substantial difference between the groups mainly due to the time of progression of the disease. Pharmacological therapy consisted mainly of Levodopa (dopamine precursor) and Carbidopa or Benserazide (inhibitors of the DOPA-decarboxylase) [34], Pramipexol (dopaminergic agonist) [35], Rasagiline (monoamine Oxidase B inhibitor) [36] and Amantadine (a non-competitive NMDA receptor) [37] alone or in combination (data not shown).

2.2. Electroencephalographic Technique

The EEG were obtained with a high-density electroencephalographic device of 64 channels, a Neuroscan SynAmps RT 64-channel Amplifier (RRID:SCR_015818) and a CURRY software (RRID:SCR_009546). Data were recorded in an eyes-closed resting state for 2 min. For this study, we used the information from 21 channels (Fp1, Fpz, Fp2, F7, F3, Fz, F4, F8, T7, C3, Cz, C4, T8, P7, P3, Pz, P4, P8, O1, Oz and O2) according to the international 10–20 system, using channel A1 as the reference. The impedance was kept below 5 kΩ and the signals were recorded at a sampling rate of 1000 Hz with a bandwidth from 0.1 to 100 Hz.

3. Mathematical Background for Cross Wavelet Analysis

3.1. Wavelet Transform

Wavelet transform uses basal functions that come from basic wavelet functions (mother functions) characterized in time (t) and frequency (ω), which rebuild the original signal by means of inverse wavelet transform. One of the most common mother functions used in neuroscience is the complex Morlet wavelet function, which offers a good balance between temporal localization and frequency and has a high-resolution power [26]. The Morlet wavelet function ( ψ ) used in this research is defined as
ψ η = π 1 / 4 e i ω 0 η e 1 / 2 η 2
where η is a non-dimensional time parameter and ω0 is a non-dimensional frequency [26]. Because the data analyzed are a finite-length time series, errors will occur at the beginning and end of the wavelet power spectrum. To limit these edge effects in this research, we padded the end of the time series with sufficient zeroes before doing the wavelet transform, to bring the total length up to the next higher power of two. The wavelet power spectrum presents a Cone of Influence (COI), which delimits the time-frequency regions within which the edge effects can be ignored (for more details see [26,38]). The confidence level in Wavelets is related to the red noise power level at the 95% confidence interval [39].

3.2. Continuous Wavelet Transform

Continuous Wavelet Transform (CWT) is defined as the convolution between the time series and the mother function, which can be modified in time and frequency, translated with a flexible resolution and normalized to have a power unit [26,40]. The normalized CWT can be expressed as
W n s = n = 0 N 1 x n ψ * n n   δ t s
where x n is the time series,   ψ   is the Morlet mother function, (*) indicates the complex conjugate, n is the number of points, s is the wavelet scale and n is the localized time index [26]. The power to the CWT is defined as
| W n s | 2

3.3. Wavelet Filtering

Because the original electroencephalographic data showed muscle activity artifacts in the signal, mainly from the ocular and jaw muscles, the inverse Continuous Wavelet Transform (iCWT) was applied as a filter to remove artifacts. For this process, CWT were initially applied to the original data of each subject to separate the time series in the time-frequency spaces. The signals were reconstructed with the iCWT from 2 to 50 Hz. Artifacts are reduced by iCWT because this technique has an advantage over traditional filtering in that it removes noise at all frequencies and can be used to isolate single events that have a broad power spectrum or multiple events that have varying frequency [26,38]. Thus, signals are reconstructed within a specified frequency range without losing intrinsic information of each EEG. Figure 1A shows the 21 original time series from the CL subject identified as 01 (CL01) <60. Figure 1B shows the continuous wavelet spectra from channels Fp1 and O2 of the same subject. After the filtering process, we eliminated the first and the last seconds of each time series to avoid the edge effects and then 21 periods of 90 s free of artifacts were intercepted for each CL and PD patient. Figure 1C shows the 21 reconstructed time series from the CL01 subject. The brainwave frequency ranges used in this research were as follows (in Hz): δ (2–3.9); θ (4–7.9); α (8–12.9); β (13–29.9); γ (30–50).
All EEG were processed with the MATLAB software (version 9.7.0.1471314, R2019b; RRID:SCR_001622).

3.4. Individual Continuous Wavelet Profiles

The CWT was applied to each reconstructed time series to obtain their intrinsic features in time, frequency and power. With this information, individual continuous wavelet profiles were built and the brainwaves with the highest power and main frequency value were identified (profiles not shown). These continuous wavelet profiles were used to homogenize each group and characterize the final profiles.
Figure 1D shows the examples of the continuous wavelet spectra from channels Fp1 and O2 of the reconstructed time series from the CL01 subject.
Figure 2 shows one example of the continuous wavelet spectrum from Fp1 channel of the CL subject identified as 03 (CL03) <60. On the spectrum, the original time series is shown at the upper panel. The central panel shows the power wavelet spectrum (PWS) and the color bar on the right side represents the normalized continuous wavelet power. On the PWS, the COI is represented by the black curved line. The left panel shows the global wavelet spectrum (GWS), where the continuous line (global wavelet curve) represents the normalized power in each period value and the dotted line denotes the significance level at 95%.

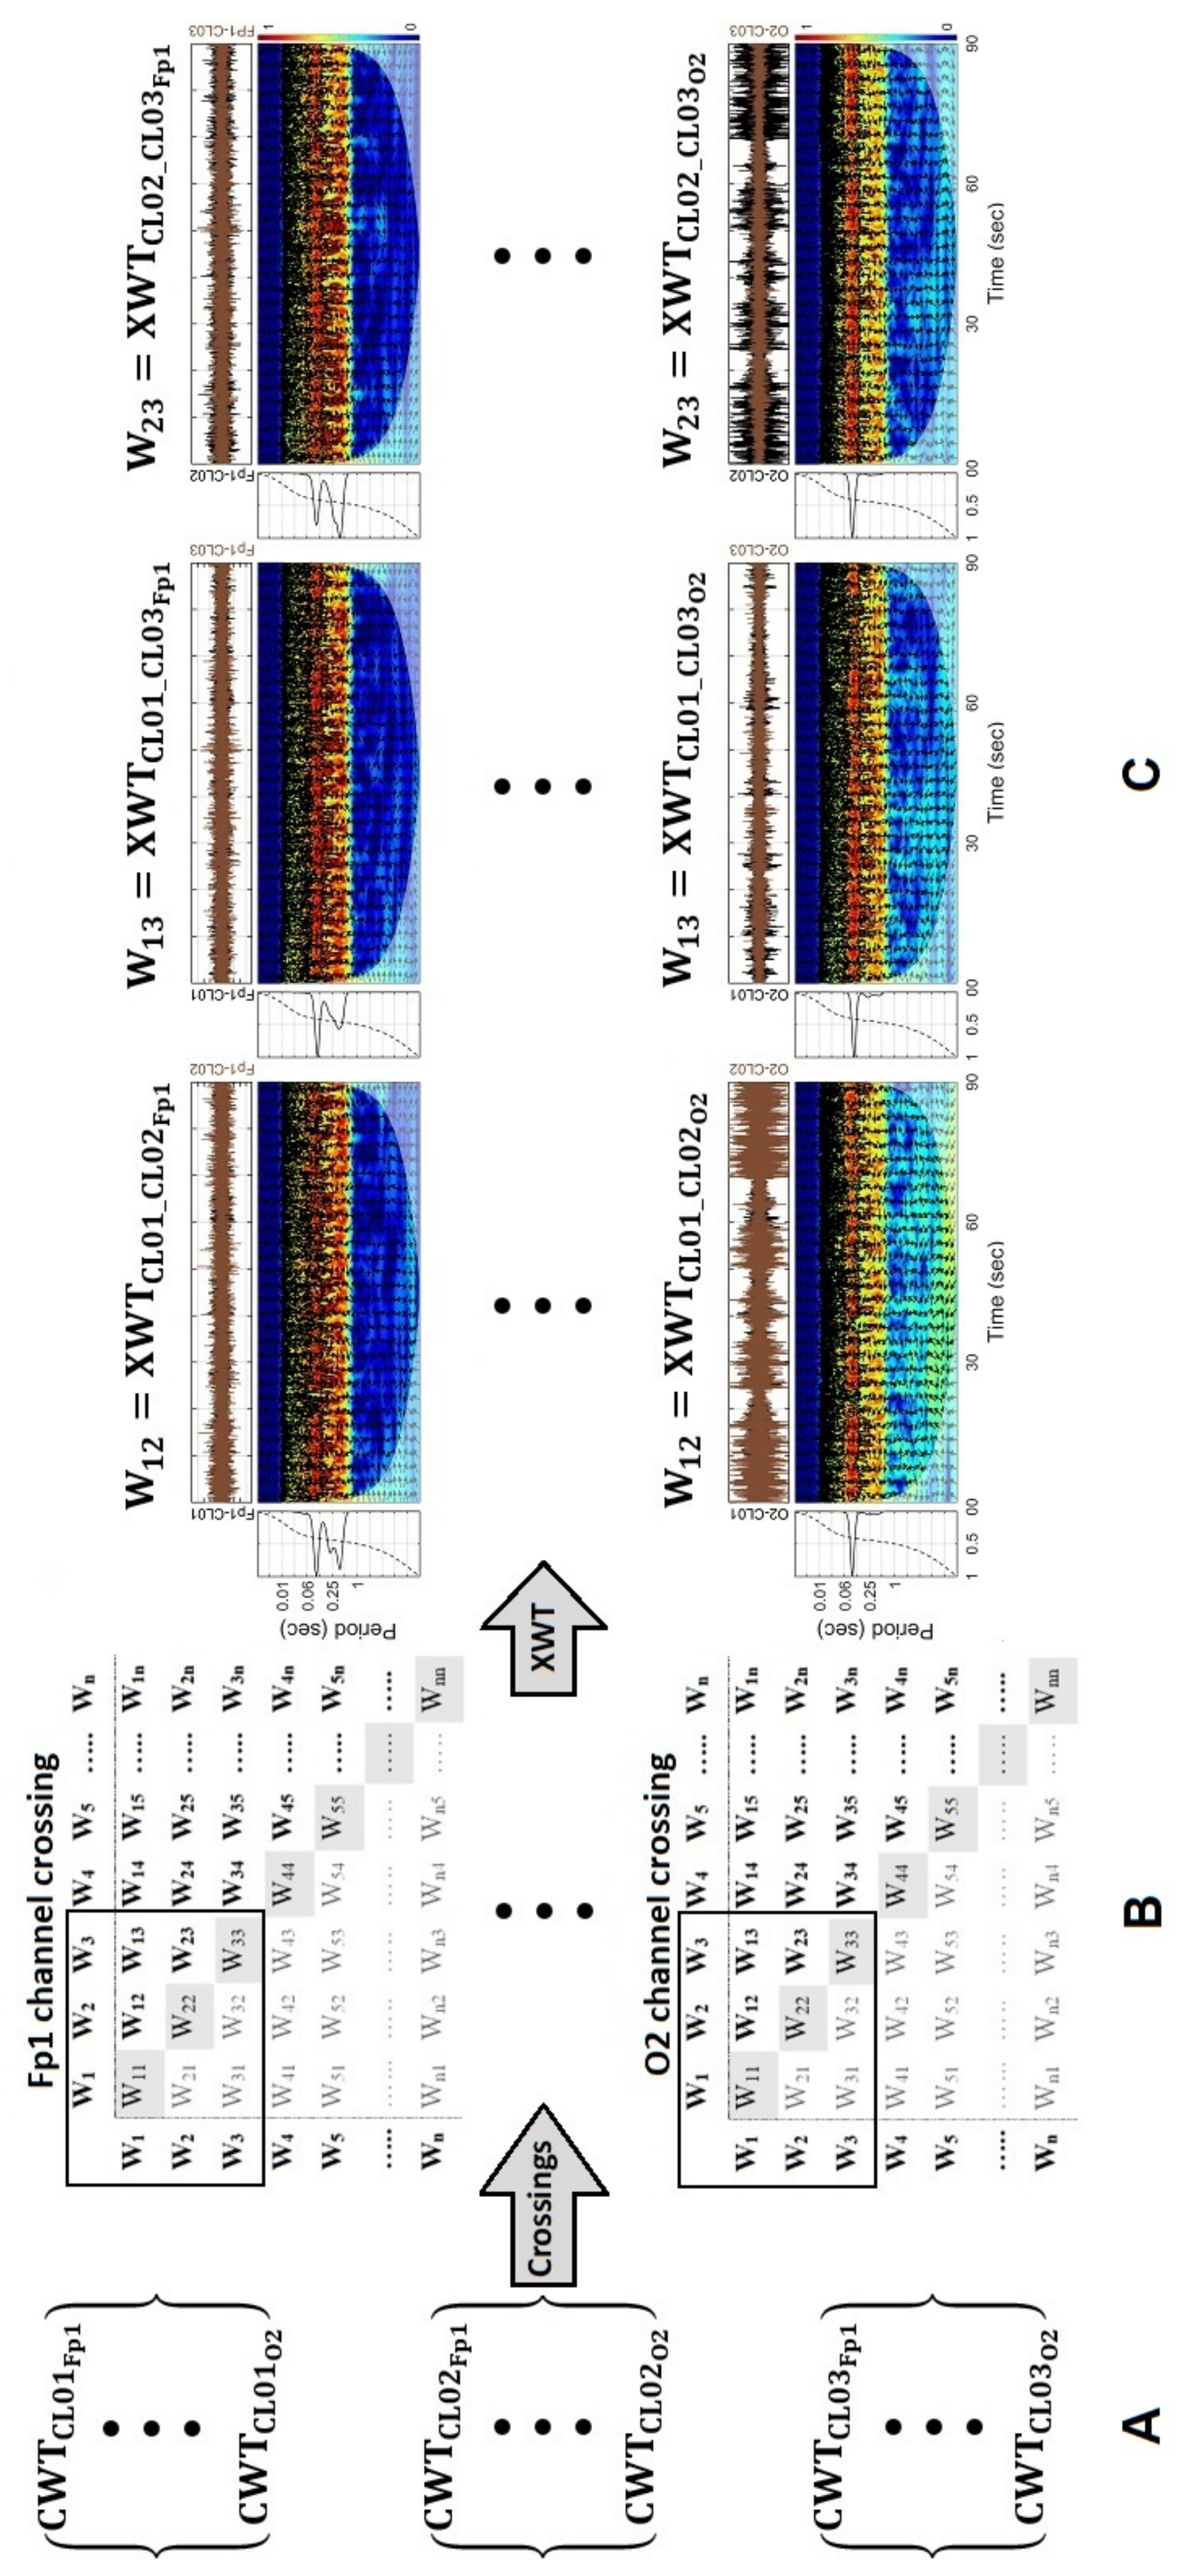
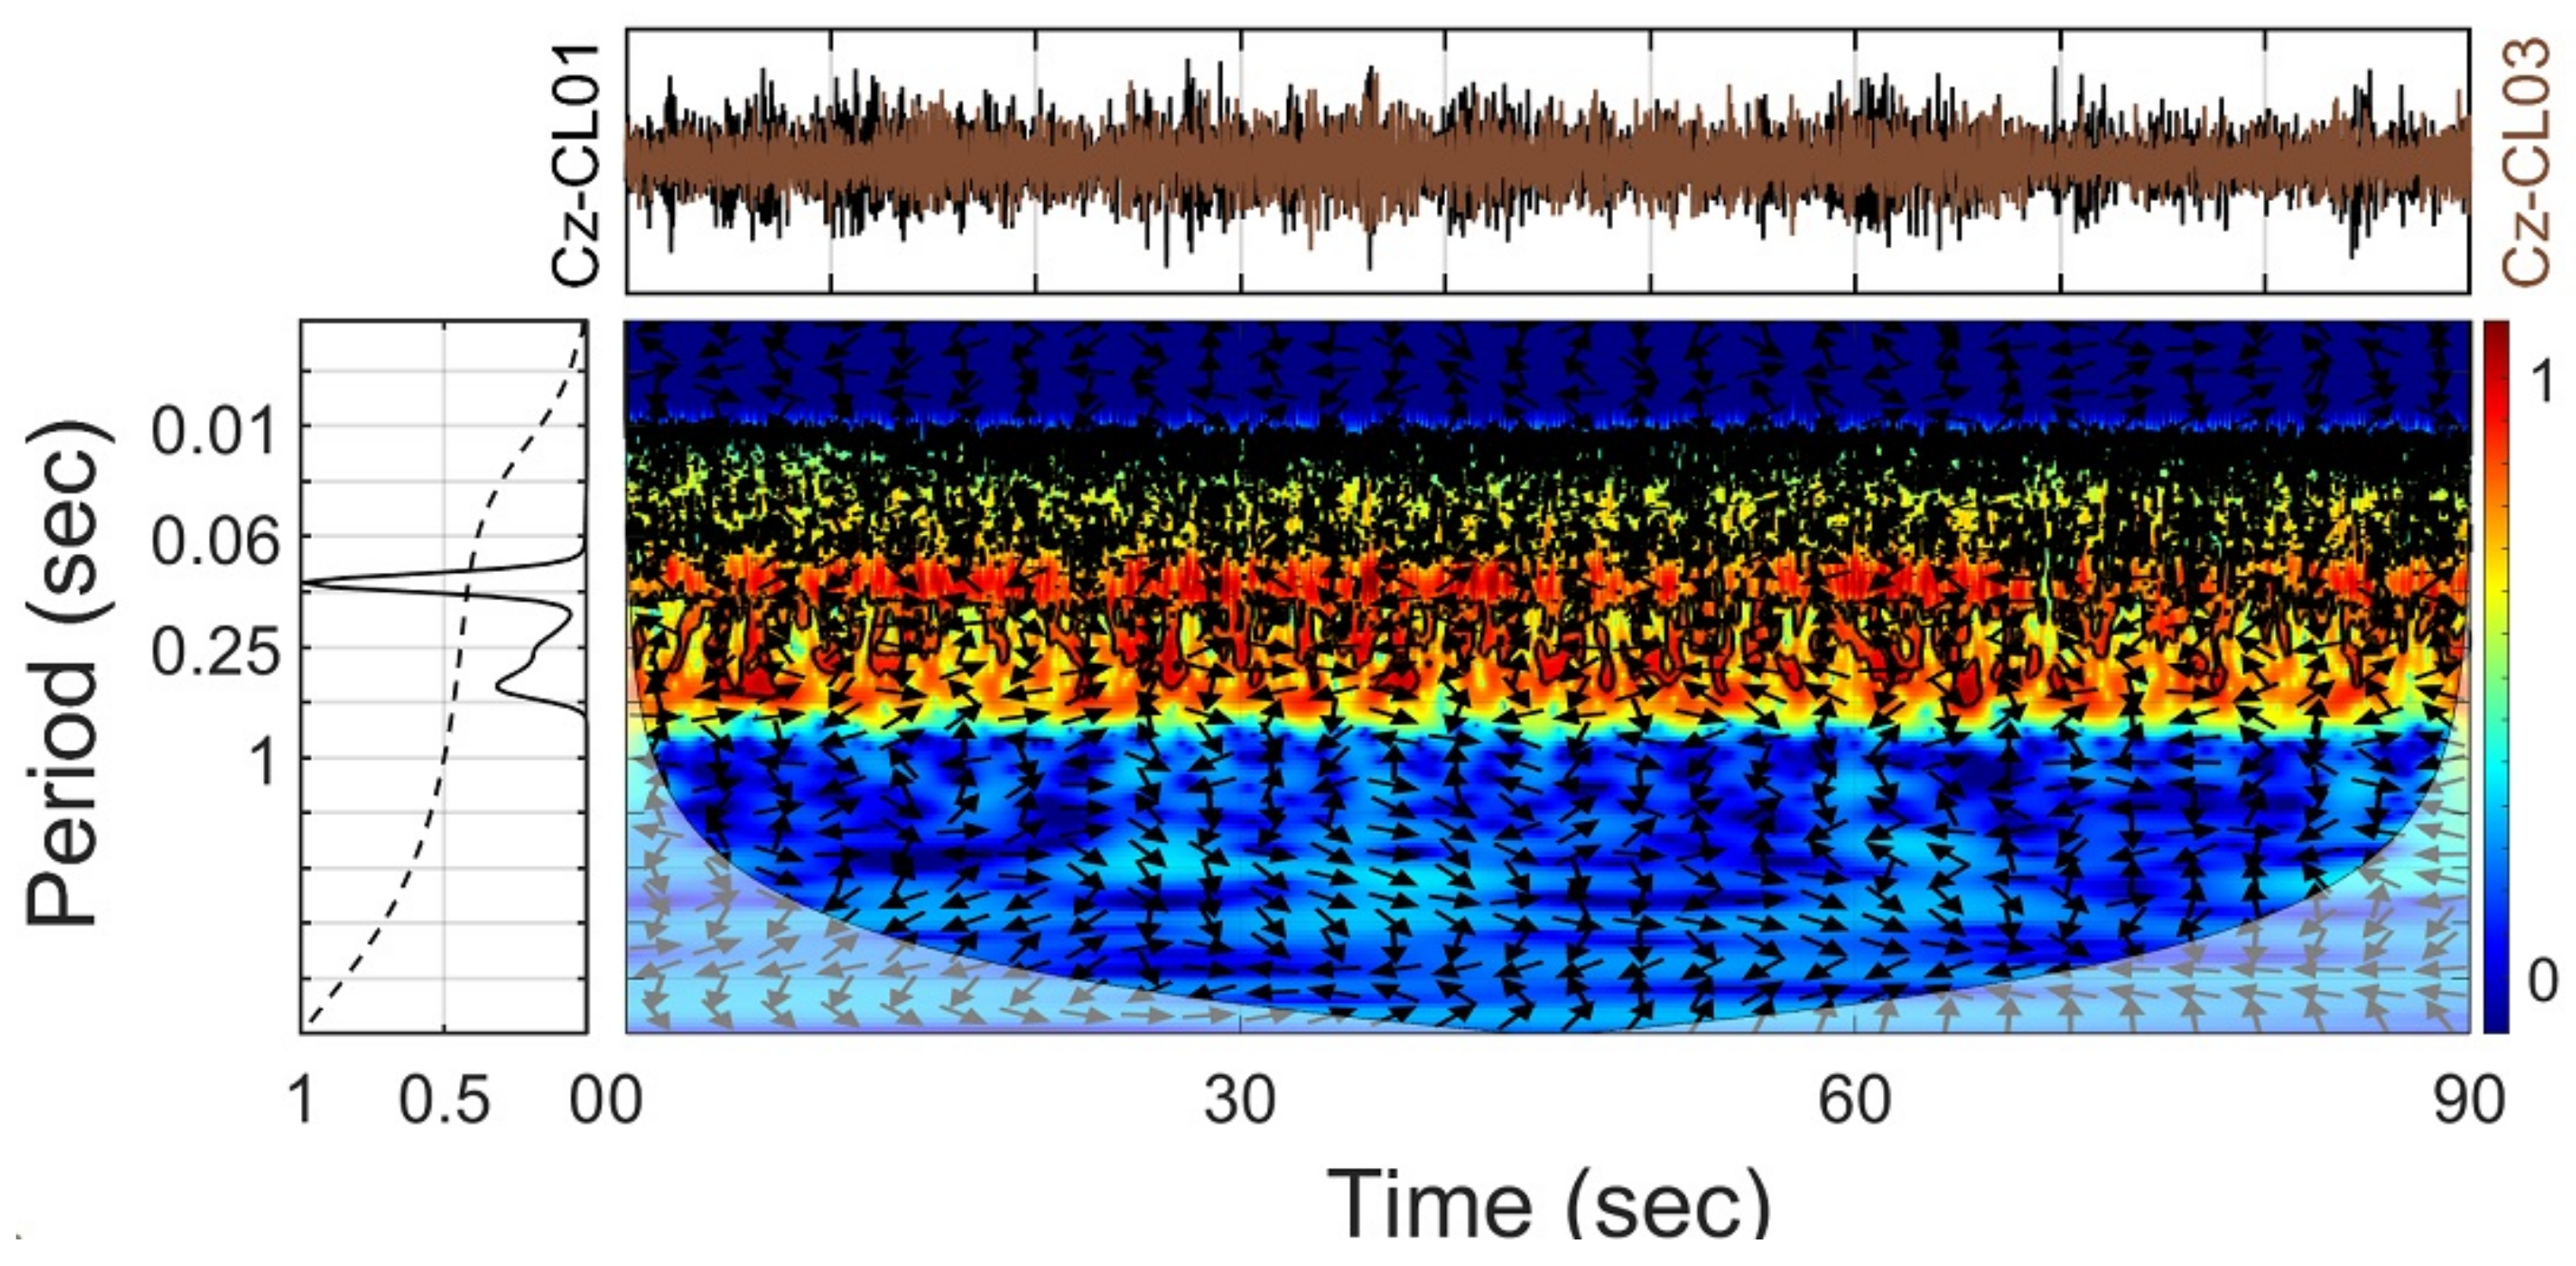
3.5. Cross Wavelet Transform

Cross Wavelet Transform (XWT) was used to analyze the covariance of two time series. It measures and exposes time-frequency areas with high common powers [26,41,42,43]. Given two time series, X and Y, with their respective CWT, W n X (s) and   W n Y (s), the XWT can be expressed as
W n X Y s = W n X s W n Y * s
where W n Y * s is the conjugate complex of W n Y s [26]. In the XWT, power is defined as
W n X Y s 2
The phase angle for the XWT describes the phase relationship between X and Y in the time-frequency space [26]. The phase in the XWT is determined by
Φ   t , s = t a n 1 I m W n X Y t , s R e W n X Y t , s
where Im and Re represent the imaginary and real segments of the cross-wavelet spectrum, respectively. Confidence levels for the XWT are derived from the square root of the product of two chi-square distributions [44].
Using the spectral information obtained previously with the CWT, multiple XWT were applied to pairs of members within each group (PD patients <60 and >60; CL <60 and >60) to eliminate individual features. The pairs for each XWT were performed taking into consideration a symmetric square matrix per group, where all the possible combinations between the members could be identified. Only the member combinations above the main diagonal were analyzed since the combinations under the diagonal are mirror images and the results obtained are the same. For each combination of members identified, 21 XWT were applied, corresponding to each electroencephalographic channel. Figure 3A shows the CWT arrays from the members of the CL <60 group. Figure 3B shows examples of the square matrices for the crossings from the Fp1 and O2 channels for the same group. Figure 3C shows the cross-wavelet spectra from channels Fp1 and O2 for the crossings of the CL <60 group.
Figure 4 shows one example of the cross-wavelet spectrum from the Cz channel of the crossing between CL01 and CL03 <60. On the spectrum, the crossed original time series (one in black, one in brown) are shown at the top of the figure. The central panel shows the PWS, where the black arrows represent the wavelet phase over time and frequency. The left panel shows the GWS.
Interestingly, CL subjects identified as 04 (CL04) <60 (48 years old) and as 07 (CL07) >60 (71 years old) showed notably different intrinsic features in their individual continuous wavelet profiles compared to the other members of their respective CL group. They were omitted from the XWT analysis and analyzed independently at the end of this study.
According to the above-mentioned data, the final number of members of each group was CL <60 (n = 3), CL >60 (n = 4), PD <60 (n = 2) and PD >60 (n = 5). Thus, due to the possible combinations for each group showed by their square matrices, 3 possible crossings per channel were performed for CL <60, 6 crossings for CL >60, 1 crossing for PD patients <60, and 10 for PD patients >60.

3.6. Extraction of the Global Wavelet Spectra Information and Cross Wavelets Profiles

After performing multiple XWT within the groups, 63 cross wavelet spectra were obtained (21 for each combination, corresponding to each electroencephalographic channel) for the CL <60 group, 126 for the CL >60 group, 21 for the PD patients <60 group and 210 for the PD patients >60. From each cross-wavelet spectrum, only the information from the GWS was extracted. To obtain the global wavelet information per channel within each group, the arithmetic average of the global wavelet curves of each crossing corresponding to the same channel were obtained. Thus, one array for each group with 21 time series, corresponding to 21 electroencephalographic channels, was obtained.
From the last arrays, four general wavelet profiles were constructed for each group: (1) The global wavelet curves profile was made by plotting the 21 mean global wavelet curves per channel (grey lines) of each group as well as the total mean curve of these curves (black line). This profile shows information about the main brainwave per channel, as well as the most relevant brainwave for the group. Vertical dotted lines on this profile limit the frequency range of each brainwave. (2) The main frequencies profile was made using the frequency value with the highest power observed in the mean global wavelet curves per channel. These profiles showed the most common brainwave on the brain and the frequency values of each channel, as well as their distribution. (3) The power anomalies profile was constructed from the 21 mean global wavelet curves per group and presented by bar graphs per channel to observe the power profile with respect to the total mean curve of each group. Positive anomalies (black bars) indicated an increased power with respect to the total mean curve, and negative anomalies (grey bars) corresponded to decreased power. A linear regression was performed on the power anomalies values to quantify the anteroposterior power gradient of each group. (4) The brainwave power profile was obtained from the total mean curves of each group with respect to the brainwave frequency range used in the research. The brainwave power values were normalized with respect to the highest power for each group.

4. Results

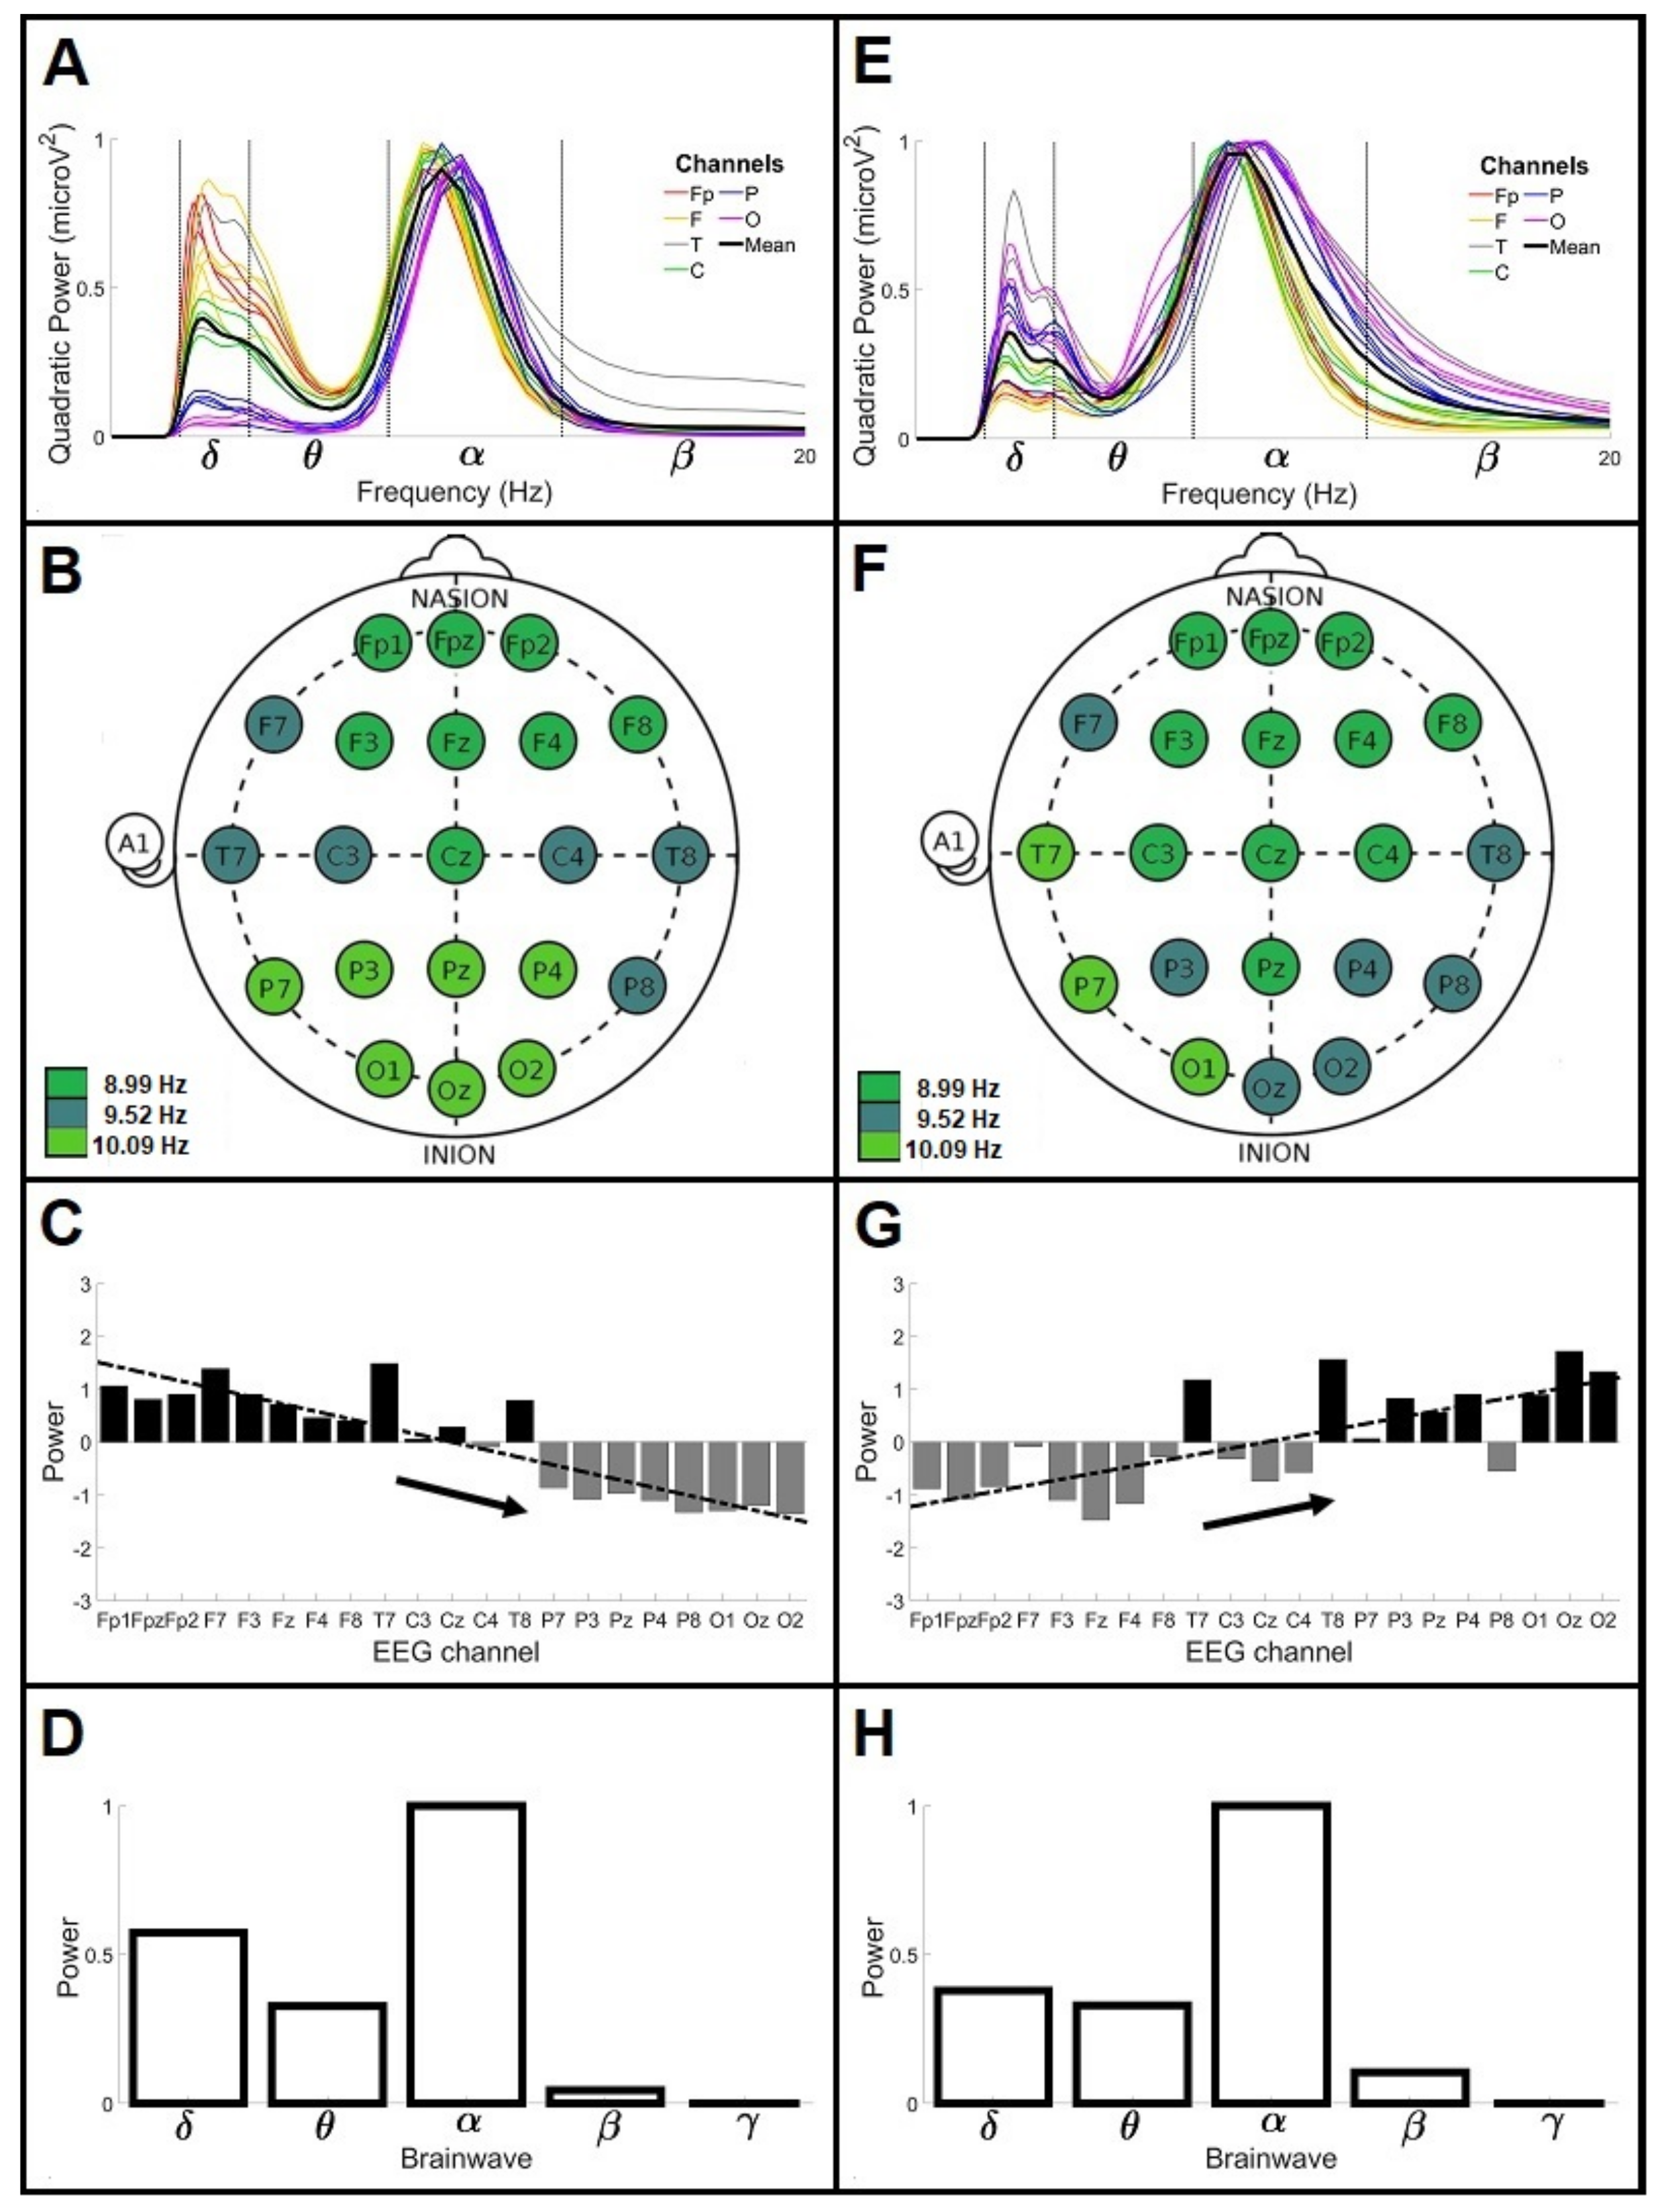
4.1. General Wavelet Profiles of Control and Parkinson’s Disease Patients under 60 Years Old (<60)

Figure 5 shows the general wavelet profiles of CL and PD patient groups <60. Figure 5A shows the global wavelet curves profile for CL <60 (n = 3 crossings per channel). In this group, a main α brainwave was observed with a frequency value of 9.52 ± 1.81 Hz and a power of 0.89 microV2. A secondary δ brainwave also was identified with a frequency value of 2.67 ± 0.55 Hz and a power of 0.39 microV2. Figure 5B shows the main frequencies profile for CL <60, where the main brainwave was α with frequency values of 8.99, 9.52 and 10.09 Hz. The 8.99 Hz frequency was mainly observed in the Fp channels, the 9.52 Hz frequency was localized in the T channels and the 10.09 Hz frequency was found in the O channels. Figure 5C shows the power anomalies profile for CL <60; Fp, F and T channels had positive anomalies with mean power values of 0.9, 0.7 and 1.1, respectively. P and O channels had negative anomalies with mean power values of −1.0 and −1.2, respectively. The C channels remained with power mean values near to zero. The anteroposterior gradient was observed from high to low power with a slope of −0.14. The Fp, F and T channels had power 2.5 times higher than the P and O channels. Figure 5D shows the brainwave power for CL <60; the highest power was in α brainwave. For this group, δ power was the half of the α power and θ power corresponded to one-third of the α power; the power values were 0.57 and 0.32, respectively.
Figure 5E shows the global wavelet curves profile for PD patients <60 (n = 1 crossing per channel). A main α brainwave was observed with a frequency of 9.52 ± 1.96 Hz and power of 0.95 microV2. A secondary δ brainwave was also identified with a frequency of 2.67 ± 0.49 Hz and power of 0.35 microV2. Figure 5F shows the main frequencies profile for PD patients <60; the α brainwave was the representative with values of 8.99, 9.52 and 10.09 Hz. The 8.99 Hz frequency was observed in the Fp and C channels. The 9.52 Hz frequency was mainly identified in the O-right channels, while the 10.09 H frequency was found in the O-left channels. Figure 5G shows the power anomalies profile for PD patients <60; Fp, F and C channels had negative anomalies with mean power values of −0.9, −0.8 and −0.5, respectively. T, P and O channels had positive anomalies with mean power values of 1.3 for the T and O channels and 0.3 for P channels. The anteroposterior gradient was observed from low to high power with slope of 0.12. The O channels had a power 1.7 times higher than the Fp and F channels and P channels had one 1.4 times higher. The C channels in this group showed negative values that were larger than in control group. Figure 5H shows the brainwave power for PD patients <60; the highest power was in α brainwave. For this group, δ and θ brainwaves had one-third of the α power; the power values were 0.37 and 0.32, respectively.

4.2. General Wavelet Profiles of Control and Parkinson’s Disease Patients over 60 Years Old (>60)

Figure 6 shows the general wavelet profiles of the groups >60. Figure 6A shows the global wavelet curves profile for CL >60 (n = 6 crossings per channel). A main α brainwave was identified with a frequency value of 8.99 ± 1.36 Hz and a power of 0.93 microV2. A secondary δ brainwave was also observed with a frequency of 2.52 ± 0.46 Hz and a power of 0.33 microV2. Figure 6B shows the main frequencies profile for CL >60; the representative brainwave was α, with frequency values of 8.48 and 8.99 Hz. The 8.48 Hz frequency was found in the Fp and F channels, while the 8.99 Hz frequency was found in the C, T and O channels. Figure 6C shows the power anomalies profile for CL >60; the Fp, T and O channels showed mainly positive anomalies with a mean power of 0.8, 1.2 and 0.6, respectively. Notably, in the T7 channel there is a significant positive anomaly, when compared to the Fp and O channels. The F, C and P channels had mainly negative anomalies with mean power values of −0.1, −0.8 and −0.7, respectively. The F3, F8 and T8 channels had reduced power anomalies near to zero. The anteroposterior gradient was observed from high to low power with slope of −0.03. The Fp, T and O channels were between 1.2 and 1.7 times higher than the F, C and P channels. Figure 6D shows the brainwave power for CL >60; the highest power was in the α brainwave, the δ brainwave had almost a half of this wave and the θ brainwave had one-third the power; the power values were 0.46 and 0.29 microV2, respectively.
Figure 6E shows the global wavelet curves profile for PD patients >60 (n = 10 crossings per channel). A main δ brainwave was observed with a frequency value of 2.67 ± 0.61 Hz and a power of 0.90 microV2. A secondary α brainwave was identified with a frequency of 8.99 ± 2.41 Hz and a power of 0.49 microV2. Figure 6F shows the main frequencies profile for PD patients >60; the representative brainwave was δ, with frequency values of 2.38, 2.52 and 2.67Hz. Particularly, the P8 channel remained in the α brainwave with a frequency value of 8.99 Hz. The 2.38 Hz frequency was mainly found in the Fp channels, the 2.52 Hz frequency in the left-frontal channels and the 2.67 Hz frequency was widely distributed in the C and O channels. Figure 6G shows the power anomalies profile for PD patients >60; negative anomalies were only found in the Fp channels with a mean value of −1.8, while positive anomalies were observed in the T, P and O channels with mean power values of 0.2, 0.1 and 1.3, respectively. The F and C channels showed values near to zero. The anteroposterior gradient was observed from low to high power with a slope of 0.12. Figure 6H shows the brainwave power for PD patients >60; the highest power was in the δ brainwave. For this group, the α brainwave had half the power of δ and the θ brainwave had less than half; the power values were 0.5 and 0.4 microV2, respectively.
Comparison between the groups presented PD patients >60 with main frequencies in the δ brainwave, the other three groups had main frequencies in the α brainwave. The 8.99, 9.52 and 10.09 Hz frequencies were common for CL <60 and PD patients <60, but with a different channel distribution. The 8.99 Hz frequency was common for CL >60 and PD patients >60. CL >60 also presented the 8.48 Hz α frequency and PD patients >60 showed instead frequencies in the δ brainwave (for summary see Table 1).
The CL <60 and PD patients <60 shared in average the 9.52 Hz α frequency and the 2.67 Hz δ frequency; however, the α power of PD patients <60 was 0.06 microV2 higher than CL <60, and the δ power was 0.04 microV2 lower. The 2.67 Hz δ frequency was also shared by PD patients >60, although the power in this group was 2.3 times higher than CL <60 and 2.5 times higher than PD patients <60. The 8.99 Hz α frequency was shared in average by CL >60 and PD patients >60, but the power of CL >60 was 1.8 times higher than in PD patients >60. The 2.52 Hz δ frequency was only observed in CL >60 group and presented the lower power in comparison with the other groups. The anteroposterior power gradient for the CL groups was decreasing, with the <60 group having a greater slope than the CL >60 group. In PD patients the anteroposterior power gradient is increasing and the slope in both age groups was the same (for summary see Table 1).

4.3. Outlier Controls of Average Profile: Are They Potential Subjects of Risk?

In this section, we show two cases that were notably different in comparison with other members of their groups: CL04 <60 and CL07 >60. These EEGs were obtained from subjects considered clinically healthy with no symptoms related to PD; however, as per our analysis, these two could be potentially in a prodromal state of neurological illness or in a condition other than the resting state at the time of data acquisition. Figure 7 shows the general wavelet profiles of both outliers.
Figure 7A shows the global wavelet curves profile for CL04 <60. A main δ brainwave was observed with a frequency value of 2.52 ± 1.48 Hz and a power of 0.94 microV2. A secondary α brainwave was also identified with a frequency of 11.33 ± 2.85 Hz and a power of 0.66 microV2. Figure 7B shows the main frequencies profile for CL04 <60; the representative brainwave was δ, with frequency values of 2.12, 2.24, 2.38, 2.52, 2.67, 2.83 and 3.00 Hz, instead of the α brainwave, which was the predominant in the members of the group. In this participant, the α frequencies were also higher than the others, at 11.33 and 12.00 Hz. Figure 7C shows the power anomalies profile for CL04 <60. Negative anomalies were observed in the Fp and P channels with mean values of −1.8 and −0.1, respectively. Positive anomalies were identified in the F, T, C and O channels with mean values of 0.3, 1.3, 0.2 and 0.4, respectively. In comparison with our general wavelet profile of CL <60, we found opposite anomalies in the Fp and O channels. The anteroposterior gradient was observed from low to high power with a slope of 0.05. Figure 7D represents the brainwave power profile for CL04 <60; the δ brainwave presented the highest power instead of the α brainwave as it was observed in the CL <60 group. For this participant, the α brainwave had the half of the δ power, the θ brainwave had less than half and the β brainwave had one-eighth the δ power; the power values were 0.55, 0.49 and 0.12, respectively.
In respect with the above mentioned, the results found in this participant showed more similarities with the general wavelet profile of PD patient >60 than with its own group. However, δ frequency values obtained from this EEG were between 2.12 and 3.00 Hz instead of 2.38 Hz and 2.67 Hz, and the α frequencies were between 11.33 and 12.00 Hz instead of 8.99 Hz.
Figure 7E shows the global wavelet curves profile for CL07 >60. The main brainwave was α with a frequency of 8.01 ± 2.35 Hz and a power of 0.98 microV2. The secondary brainwave was δ with a frequency of 2.67 ± 0.67 Hz and a power of 0.84 microV2. In this participant, the α peak was observed at the limit of the θ brainwave. Figure 7F shows the main frequencies profile of the outlier CL07 >60; the α, δ and θ brainwaves were observed, instead of solely the α brainwave as in the general wavelet profile of CL >60. Some α frequency values in this participant were lower than those observed in the profile. The frequency values of the δ brainwave were 2.52 and 2.67 Hz and the θ frequency value was 7.56 Hz. Figure 7G shows the power anomalies profile for CL07 >60; positive anomalies in the Fp and C channels were observed, with mean values of 1.2 and 0.2, respectively. Negative anomalies were identified in the T, P and O channels, with mean values of −0.1, −0.2 and −0.8, respectively. Some F channels kept near to zero. This result showed inverse values in the T, C and O channels compared with the profile of CL >60. The F channels showed an increase in power. The anteroposterior gradient was observed from high to low power with a slope of −0.06. Figure 7H shows the brainwave power profile for CL07 >60; the highest power was in the α brainwave. The δ brainwave had 18% less power than α, the θ brainwave was 26% less and the β brainwave had one-quarter of the δ power. According to the above, the results of this participant did not correspond with the profiles observed and it could not be identified inside the CL group.

5. Discussion

Wavelet analysis enables the characterization of specific brain activity profiles in a defined group. The main findings of this study include the following: (1) The main α brainwave obtained in the global wavelet curves profile for the CL and PD patients <60 groups. (2) The main δ brainwave identified for the PD patients >60 group. (3) The anteroposterior power gradient observed from the channel power anomalies proceeds from high to low power in the CL groups, and it was opposite in PD patients at any age studied. (4) Characterization of general wavelet profiles is an accurate methodological strategy for comparative analysis between groups.

5.1. Global Wavelet Curves Profile of CL and PD Patients under 60 Years of Age (<60)

The α brainwave showed predominance in the CL EEG, as it has been previously identified in the eyes-closed resting state [45]. In the present study, we reported the dominance of the α brainwave in PD patients <60 as well as in the CL <60. Hence, electroencephalographic changes in PD patients at initial states of the disease cannot be differentiated from those of CL group by means of this profile. We propose a more detailed examination of the EEG, based on the analysis of power anomalies per channel, to find the differences between the groups. In PD patients <60, the α brainwave was observed with more dispersion in power and frequencies between channels compared to those of the CL groups; this might be attributed to the loss of synchronization of the cortical neurons due to alterations of the gap junctions between the cells as it has been previously suggested [46]. The drug profile of the PD patients also can alter the dispersion of frequencies. Levodopa has been proven to enhance α power in specific channels [47], while the opposite effects has been stated to Pramipexole and Rasagiline [48,49]. In summary, the EEG of PD patients <60 analyzed by the methodology presented in this study can be identified at an earlier stage of the disease than was previously possible.

5.2. Global Wavelet Curves Profile of PD Patients over 60 Years of Age (>60)

In PD patients >60, the δ brainwave was predominant as compared with the CL group >60 and both the <60 groups of CL and PD patients. Predominance of the δ brainwave in PD patients >60 has been previously described and attributed to several phenomena, such as disturbance of the afferent impulses, mainly cholinergic from the basal forebrain to the cortex, disruptions in the pyramidal neurons, white matter lesion or thalamic lesion [50], the overall synchronization of glial cell activity [51] and the use of prescribed drugs like Rasagiline [48]. Furthermore, in this group, a high dispersion in both power and frequency was observed in the main δ brainwave and in the secondary α brainwave, possibly related to the neurodegeneration plus the effects caused by the mix of drugs routinely used in PD patients.

5.3. Differential Anteroposterior Power Gradient between CL and PD Patient Groups

In CL groups, the dominance of the α brainwave due to the normal cortical activity is characteristic of the eyes-closed resting state in frontal channels, together with the low cortical activity of the posterior channels, caused by the absence of visual stimuli [16,45]. We showed for the first time with our power anomalies analyses a decreasing anteroposterior power gradient characteristic of CL groups, from the high powers of the Fp, F and T channels to the low powers of the P and O channels.
The decrease in the slope of the anteroposterior power gradient in CL >60 was mainly due to the decreased dispersion in power of the δ brainwave. This is consistent with the decrease in δ brainwave activity found as a function of age [52] and physiologically associated with a loss of connectivity between the frontal subcortical and cortical areas caused by changes in grey matter (neuronal death) and white matter (leukoaraiosis) [53], to frontal vascular alterations [54] and a loss of dopamine neurotransmission characteristic of normal aging [55].
In both PD patient groups, the anteroposterior power gradient was inverted. Despite PD patients <60 presenting similar features to CL <60 in terms on the global wavelet curves, main frequencies and brainwave power profiles, the power anomalies analysis shows an inverted anteroposterior power gradient due to reduced dispersion of the δ brainwave frequency and power in the Fp and F channels and increased power in the in P and O channels. The inversion could be attributed to the instability of the frontal δ brainwave caused by the malfunction of the inhibitory thalamic–cortical pathways identified in PD [56]. In the case of PD patients >60, the inverted gradient was related to a synchronized δ brainwave in all channels. We suggest this due to an attempt to re-establish the thalamic–cortical inhibitory circuits by means of the use of anti-parkinsonian drugs regularly used in advance PD patients, which have extensive effects throughout the brain. This is in addition to the notable dispersion in power and frequency of the α brainwave, indicating a significant loss of normal cortical neuronal synchronization [46].
In the global wavelet curves profiles of PD patients, an increase in the β brainwave was also observed. It was not found in the CL groups. This has been previously observed and associated with an abnormal functioning of the basal ganglia [15] and with the use of Levodopa [47]. The notable increase in the θ brainwave observed in the PD patient >60 might also be related to alterations in the limbic circuit [57].

5.4. Identification of Outliers

In this research, the EEG of two subjects considered clinically healthy, one <60 and another >60 years of age, showed different features in comparison with their corresponding CL groups. This finding was considered relevant in the present study since it indicates unidentified alterations in these subjects that could be considered potential indicators of an initial state of some neurological pathology not yet clinically detected.

6. Conclusions

In this study, we reported a new methodology based on covariance analysis that allows differentiating a healthy group from a group with anomalies in brain activity due to PD. In PD patients, it was possible to detect specific anteroposterior brainwave power gradients from the frontal-occipital region as well as other brainwave anomalies in both brainwave frequency and power, coherent with the neurodegenerative process. With this methodology, it was also possible to detect differences between age groups within CL and PD patients. The accessibility of the electroencephalographic technique opens the possibility to apply it to other areas of clinical research with medical purposes. Through the covariance analyses described in the present study, EEG studies can be considered a widely useful tool in neurology to scan neurodegenerative processes over time, with the potential to uncover electroencephalographic patterns in the early asymptomatic stages of neurodegenerative diseases in a vulnerable population. Furthermore, this methodology can be applied to other brain activity anomalies in any other pathophysiological condition.

Author Contributions

G.G.-G.: conceptualization, methodology, formal analysis, data curation, writing original draft. V.M.V.-H.: conceptualization, methodology, formal analysis, validation. A.O.-A.: conceptualization, writing—review and editing, supervision, project administration. All authors have read and agreed to the published version of the manuscript.

Funding

This study was partially supported by grants DGAPA-IN219119 (AO) and DGAPA-IT102410 (V.M.V.-H.) (Dirección General del Personal Académico, Universidad Nacional Autónoma de México (UNAM)), the Thematic Network on Proteins, Prions and Neurodegenerative Diseases (PRyEND-CONACyT-280087) network member (A.O.-A.) and CONACyT-180148 (V.M.V.-H.). G.G.-G. was supported during her PhD program (Programa de Doctorado en Ciencias Biomédicas, UNAM) by scholarships from the CONACyT, México (CVU 771755).

Institutional Review Board Statement

EEG were not recorded for the purposes of this mathematical analysis.

Informed Consent Statement

Not applicable.

Data Availability Statement

Restrictions apply to the availability of EEG data. Mathematical-data details are available upon request to the authors.

Acknowledgments

We thank Rodolfo Solis to provide the EEG obtained from the Department of neuropsychology of the Instituto Nacional de Neurología y Neurocirugía, Mexico (INNN). We thank Alina Santillán from the Faculty of Electronics, UPAEP, Mexico for her contribution with EEG to further validate patterns from control individuals. We thank Neurologist Dan López Vazquez for productive discussions and to Ibrahim A. Ramirez-Soto for proofreading the manuscript.

Conflicts of Interest

The authors declare no conflict of interest.

Abbreviations

PDParkinson’s disease
EEGelectroencephalographic records
MDS-UPDRSMovement Disorder Society—Unified Parkinson’s Disease Rating Scale
H&YHoehn & Yahr Scale
BDI-IIBeck Depression Inventory
BAIBeck Anxiety Inventory
CASICognitive Abilities Screening Instrument
MMSEMini Mental State Examination
MoCAMontreal Cognitive Assessment
FpFrontopolar
FFrontal
TTemporal
CCentral
PParietal
OOccipital
CWTContinuous Wavelet Transform
XWTCross Wavelet Transform
COICone of Influence
PWSPower Wavelet Spectrum
GWSGlobal Wavelet Spectrum

References

  1. Kalia, L.V.; Lang, A.E. Parkinson’s disease. Lancet 2015, 386, 896–912. [Google Scholar] [CrossRef]
  2. Brooks, D.J.; Pavese, N. Imaging biomarkers in Parkinson’s disease. Prog. Neurobiol. 2011, 95, 614–628. [Google Scholar] [CrossRef] [PubMed]
  3. Lehéricy, S.; Bardinet, E.; Poupon, C.; Vidailhet, M.; François, C. 7 Tesla magnetic resonance imaging: A closer look at substantia nigra anatomy in Parkinson’s disease. Mov. Disord. 2014, 29, 1574–1581. [Google Scholar] [CrossRef] [PubMed]
  4. Colombo, D.; Abbruzzese, G.; Antonini, A.; Barone, P.; Bellia, G.; Franconi, F.; Simoni, L.; Attar, M.; Zagni, E.; Haggiag, S.; et al. The “gender factor” in wearing-off among patients with Parkinson’s disease: A post hoc analysis of DEEP study. Sci. World J. 2015, 2015, 787451. [Google Scholar] [CrossRef] [Green Version]
  5. Gallagher, D.A.; Lees, A.J.; Schrag, A. What are the most important nonmotor symptoms in patients with Parkinson’s disease and are we missing them? Mov. Disord. 2010, 25, 2493–2500. [Google Scholar] [CrossRef] [PubMed]
  6. Shulman, L.M.; Taback, R.L.; Bean, J.; Weiner, W.J. Comorbidity of the nonmotor symptoms of Parkinson’s disease. Mov. Disord. 2001, 16, 507–510. [Google Scholar] [CrossRef] [PubMed]
  7. Postuma, R.B.; Aarsland, D.; Barone, P.; Burn, D.J.; Hawkes, C.H.; Oertel, W.; Ziemssen, T. Identifying prodromal Parkinson’s disease: Pre-motor disorders in Parkinson’s disease. Mov. Disord. 2012, 27, 617–626. [Google Scholar] [CrossRef] [PubMed]
  8. Martinez-Martin, P.; Rodriguez-Blazquez, C.; Abe, K.; Bhattacharyya, K.B.; Bloem, B.R.; Carod-Artal, F.J.; Prakash, R.; Esselink, R.A.; Falup-Pecurariu, C.; Gallardo, M.; et al. International study on the psychometric attributes of the non-motor symptoms scale in Parkinson disease. Neurology 2009, 73, 1584–1591. [Google Scholar] [CrossRef] [PubMed]
  9. Phillipson, O.T. Management of the aging risk factor for Parkinson’s disease. Neurobiol. Aging 2014, 35, 847–857. [Google Scholar] [CrossRef] [Green Version]
  10. Reeve, A.; Simcox, E.; Turnbull, D. Ageing and Parkinson’s disease: Why is advancing age the biggest risk factor? Ageing Res. Rev. 2014, 14, 19–30. [Google Scholar] [CrossRef] [PubMed]
  11. De Lau, L.M.; Breteler, M.M. Epidemiology of Parkinson’s disease. Lancet Neurol. 2006, 5, 525–535. [Google Scholar] [CrossRef]
  12. Ortiz-Ospina, E.; Beltekian, D. Why do Women Live Longer Than Men? Our World in Data. Available online: https://ourworldindata.org/why-do-women-live-longer-than-men (accessed on 22 June 2021).
  13. Peelaerts, W.; Bousset, L.; Van der Perren, A.; Moskalyuk, A.; Pulizzi, R.; Giugliano, M.; Van den Haute, C.; Melki, R.; Baekelandt, V. α-Synuclein strains cause distinct synucleinopathies after local and systemic administration. Nature 2015, 522, 340–344. [Google Scholar] [CrossRef] [PubMed]
  14. Teravskis, P.J.; Covelo, A.; Miller, E.C.; Singh, B.; Martell-Martínez, H.A.; Benneyworth, M.A.; Gallardo, C.; Oxnard, B.R.; Araque, A.; Lee, M.K.; et al. A53T mutant alpha-synuclein induces Tau-dependent postsynaptic impairment independently of neurodegenerative changes. J. Neurosci. 2018, 38, 9754–9767. [Google Scholar] [CrossRef] [PubMed] [Green Version]
  15. DeLong, M.R.; Wichmann, T. Circuits and circuit disorders of the basal ganglia. Arch. Neurol. 2007, 64, 20–24. [Google Scholar] [CrossRef] [PubMed]
  16. Mantri, S.; Dukare, V.; Yeole, S.; Patil, D.; Wadhai, V.M. A survey: Fundamental of EEG. Int. J. Adv. Res. Comput. Sci. Manag. Stud. 2013, 1, 83–89. [Google Scholar]
  17. Cozac, V.V.; Gschwandtner, U.; Hatz, F.; Hardmeier, M.; Rüegg, S.; Fuhr, P. Quantitative EEG and cognitive decline in Parkinson’s disease. Parkinson’s Dis. 2016, 2016, 9060649. [Google Scholar] [CrossRef] [PubMed] [Green Version]
  18. Shirahige, L.; Berenguer-Rocha, M.; Mendonça, S.; Rocha, S.; Rodrigues, M.C.; Monte-Silva, K. Quantitative electroencephalography characteristics for Parkinson’s disease: A systematic review. J. Parkinsons Dis. 2020, 10, 455–470. [Google Scholar] [CrossRef] [PubMed] [Green Version]
  19. Han, C.X.; Wang, J.; Yi, G.S.; Che, Y.Q. Investigation of EEG abnormalities in the early stage of Parkinson’s disease. Cogn. Neurodyn. 2013, 7, 351–359. [Google Scholar] [CrossRef] [PubMed]
  20. Weinberger, M.; Hutchison, W.D.; Lozano, A.M.; Hodaie, M.; Dostrovsky, J.O. Increased gamma oscillatory activity in the subthalamic nucleus during tremor in Parkinson’s disease patients. J. Neurophysiol. 2009, 101, 789–802. [Google Scholar] [CrossRef] [PubMed] [Green Version]
  21. Johnsen, K.; Snædal, J.; Jóhannesson, G.H.; Guðmundsson, Þ.; Blin, N.; Emilsdóttir, Á.; Einarsson, B.; Johannsson, M. O3-13-06: EEG as a biological marker in Parkinson’s disease dementia and dementia of lewy bodies (PDD/DLB). Alzheimer’s Dement. 2014, 10, P236. [Google Scholar] [CrossRef]
  22. Klassen, B.T.; Hentz, J.G.; Shill, H.A.; Driver-Dunckley, E.; Evidente, V.G.; Sabbagh, M.N.; Adler, C.H.; Caviness, J.N. Quantitative EEG as a predictive biomarker for Parkinson disease dementia. Neurology 2011, 77, 118–124. [Google Scholar] [CrossRef] [PubMed] [Green Version]
  23. Hramov, A.E.; Koronovskii, A.A.; Makarov, V.A.; Pavlov, A.N.; Sitnikova, E. Wavelets in Neuroscience; Springer: Berlin/Heidelberg, Germany, 2015. [Google Scholar] [CrossRef]
  24. Holschneider, M. Wavelets: An Analysis Tool; Oxford University Press: Oxford, UK, 1995; ISBN 0-19-853481-7. [Google Scholar]
  25. Sheng, Y. Wavelet transform. In The Transforms and Applications Handbook; Poularikas, A.D., Ed.; CRC Press: Boca Raton, FL, USA, 1996; pp. 747–827. ISBN 978-0849383427. [Google Scholar]
  26. Torrence, C.; Compo, G.P. A practical guide to wavelet analysis. Bull. Am. Meteorol Soc. 1998, 79, 61–78. [Google Scholar] [CrossRef] [Green Version]
  27. Goetz, C. MDS-UPDRS; Rush University Medical Center: Chicago, IL, USA, 2008. [Google Scholar]
  28. Hoehn, M.M.; Yahr, M.D. Parkinsonism: Onset, progression, and mortality. Neurology 1967, 17, 427–442. [Google Scholar] [CrossRef] [PubMed] [Green Version]
  29. Jurado, S.; Villegas, M.E.; Méndez, L.; Rodríguez, F.; Loperena, V.; Varela, R. La estandarización del inventario de depresión de Beck para los residentes de Ciudad de México. Salud. Ment. 1998, 21, 26–32. [Google Scholar]
  30. Robles, R.; Varela, R.; Jurado, S.; Páez, F. Versión mexicana del inventario de ansiedad de Beck: Propiedades psicométricas. Rev. Mex. Psicol. 2001, 18, 211–217. [Google Scholar]
  31. Teng, E.L.; Hasegawa, K.; Homma, A.; Imai, Y.; Larson, E.; Graves, A.; Sugimoto, K.; Yamaguchi, T.; Sasaki, H.; Chiu, D.; et al. The Cognitive Abilities Screening Instrument (CASI): A practical test for cross-cultural epidemiological studies of dementia. Int. Psychogeriatr. 1994, 6, 45–58. [Google Scholar] [CrossRef] [PubMed]
  32. Ostrosky, F.; López, G.; Ardila, A. Influencias de la edad y de la escolaridad en el examen breve del estado mental (Mini-Mental State Examination) en una población hispano-hablante. Salud. Ment. 1999, 22, 20–26. [Google Scholar]
  33. Palacios, A. Validez y Confiabilidad del Montreal Cognitive Assesssment (MoCA) en su Versión Traducida al Español para el Cribaje del Deterioro Cognitivo Leve en Adultos Mayores. Ph.D. Dissertation, School of Medicine, UNAM, Mexico City, Mexico, 2015. [Google Scholar]
  34. Iwaki, H.; Nishikawa, N.; Nagai, M.; Tsujii, T.; Yabe, H.; Kubo, M.; Ieiri, I.; Nomoto, M. Pharmacokinetics of levodopa/benserazide versus levodopa/carbidopa in healthy subjects and patients with Parkinson’s disease. Neurol. Clin. Neurosci. 2015, 3, 68–73. [Google Scholar] [CrossRef] [Green Version]
  35. Stathis, P.; Konitsiotis, S.; Antonini, A. Dopamine agonists early monotherapy for the delay of development of levodopa-induced dyskinesias. Expert Rev. Neurother. 2015, 15, 207–213. [Google Scholar] [CrossRef] [PubMed]
  36. Rascol, O.; Fitzer-Attas, C.J.; Hauser, R.; Jankovic, J.; Lang, A.; Langston, J.W.; Melamed, E.; Poewe, W.; Stocchi, F.; Tolosa, E.; et al. A double-blind, delayed-start trial of rasagiline in Parkinson’s disease (the ADAGIO study): Prespecified and post-hoc analyses of the need for additional therapies, changes in UPDRS scores, and non-motor outcomes. Lancet Neurol. 2011, 10, 415–423. [Google Scholar] [CrossRef]
  37. Crosby, N.J.; Deane, K.H.; Clarke, C.E. Amantadine for dyskinesia in Parkinson’s disease. Cochrane Database Syst. Rev. 2003, 2, CD003467. [Google Scholar] [CrossRef]
  38. Grinsted, A.; Moore, J.C.; Jevrejeva, S. Application of the cross wavelet transform and wavelet coherence to geophysical time series. Nonlinear Process. Geophys. 2004, 11, 561–566. [Google Scholar] [CrossRef]
  39. Gilman, D.L.; Fuglister, F.J.; Mitchell, J.M. On the power spectrum of “Red Noise”. J. Atmos. Sci. 1963, 20, 182–184. [Google Scholar] [CrossRef] [Green Version]
  40. Jevrejeva, S.; Moore, J.C.; Grinsted, A. Influence of the arctic oscillation and El Nino-Southern Oscillation (ENSO) on ice conditions in the Baltic Sea: The wavelet approach. J. Geophys. Res. Space Phys. 2003, 108, 4677. [Google Scholar] [CrossRef] [Green Version]
  41. Hudgins, L.; Friehe, C.A.; Mayer, M.E. Wavelet transform and atmospheric turbulence. Phys. Rev. Lett. 1993, 71, 3279–3282. [Google Scholar] [CrossRef] [PubMed]
  42. Soon, W.; Velasco, V.M.; Selvaraj, K.; Traversi, R.; Usoskin, I.; Chen, C.T.A.; Lou, J.Y.; Kao, S.J.; Carter, R.M.; Pipin, V.; et al. A review of Holocene solar-linked climatic variation on centennial to millennial timescales: Physical processes, interpretative frameworks and a new multiple cross-wavelet transform algorithm. Earth Sci. Rev. 2014, 134, 1–15. [Google Scholar] [CrossRef]
  43. Velasco, V.M.; Soon, W.; Velasco, G.; Traversi, R.; Horiuchi, K. Generalization of the cross-wavelet function. New Astron. 2017, 56, 86–93. [Google Scholar] [CrossRef]
  44. Jenkins, G.M.; Watts, D.G. Spectral Analysis and Its Applications; Holden-Day: San Francisco, CA, USA, 1968; p. 525. ISBN 0816244642. [Google Scholar]
  45. Kan, D.P.X.; Croarkin, P.E.; Phang, C.K.; Lee, P.F. EEG differences between eyes-closed and eyes-open conditions at the resting stage for euthymic participants. Neurophysiology 2017, 49, 432–440. [Google Scholar] [CrossRef]
  46. Hughes, S.W.; Crunelli, V. Thalamic mechanisms of EEG alpha rhythms and their pathological implications. Neuroscientist 2005, 11, 357–372. [Google Scholar] [CrossRef]
  47. Melgari, J.M.; Curcio, G.; Mastrolilli, F.; Salomone, G.; Trotta, L.; Tombini, M.; di Biase, L.; Scrascia, F.; Fini, R.; Fabrizio, E.; et al. Alpha and beta EEG power reflects L-dopa acute administration in parkinsonian patients. Front. Aging Neurosci. 2014, 6, 302. [Google Scholar] [CrossRef] [PubMed]
  48. Dimpfel, W.; Oehlwein, C.; Hoffmann, J.A.; Müller, T. Quantitative EEG changes in patients with Parkinson’s disease during therapy with Rasagiline. Adv. Parkinsons Dis. 2014, 3, 22–34. [Google Scholar] [CrossRef] [Green Version]
  49. Choi, J.W.; Jeong, M.H.; Her, S.J.; Lee, B.U.; Cha, K.S.; Jung, K.Y.; Kim, K.H. Abnormal sleep delta rhythm and interregional phase synchrony in patients with restless legs syndrome and their reversal by dopamine agonist treatment. J. Clin. Neurol. 2017, 13, 340–350. [Google Scholar] [CrossRef] [PubMed] [Green Version]
  50. Steriade, M.; Gloor, P.; Llinás, R.R.; Lopes da Silva, F.H.; Mesulam, M.M. Basic mechanisms of cerebral rhythmic activities. Electroencephalogr. Clin. Neurophysiol. 1990, 76, 481–508. [Google Scholar] [CrossRef]
  51. Amzica, F.; Massimini, M. Glial and neuronal interactions during slow wave and paroxysmal activities in the neocortex. Cereb. Cortex 2002, 12, 1101–1113. [Google Scholar] [CrossRef] [PubMed] [Green Version]
  52. Duffy, F.H.; Albert, M.S.; McAnulty, G.; Garvey, A.J. Age-related differences in brain electrical activity of healthy subjects. Ann. Neurol. 1984, 16, 430–438. [Google Scholar] [CrossRef]
  53. Peters, R. Ageing and the brain. Postgrad. Med. J. 2006, 82, 84–88. [Google Scholar] [CrossRef] [PubMed]
  54. Raz, N.; Rodrigue, K.M.; Acker, J.D. Hypertension and the Brain: Vulnerability of the prefrontal regions and executive functions. Behav. Neurosci. 2003, 117, 1169–1180. [Google Scholar] [CrossRef] [PubMed]
  55. Wang, Y.; Chan, G.L.Y.; Holden, J.E.; Dobko, T.; Mak, E.; Schulzer, M.; Huser, J.M.; Snow, B.J.; Ruth, T.J.; Calne, D.B.; et al. Age-dependent decline of dopamine D1 receptors in human brain: A PET study. Synapse 1998, 30, 56–61. [Google Scholar] [CrossRef]
  56. Braak, H.; Braak, E.; Yilmazer, D.; Schultz, C.; de Vos, R.A.; Jansen, E.N. Nigral and extranigral pathology in Parkinson’s disease. J. Neural Transm. Suppl. 1995, 46, 15–31. [Google Scholar]
  57. Juárez, J.; Corsi, M. Sex differences in interhemispheric correlation and spectral power of EEG activity. Brain Res. Bull. 1995, 38, 149–151. [Google Scholar] [CrossRef]
Figure 1. Schematic representation of the filtering process and the first CWT analysis with the reconstructed data. (A) Original time series from the 21 electroencephalographic channels of CL subject identified as 01. Two minutes of information per channel. (B) Continuous Wavelet Spectra from the original time series, Fp1 and O2 channels. (C) Twenty-one reconstructed time series after the filtering process with the iCWT. Ninety seconds of information per channel. (D) Continuous Wavelet Spectra from the reconstructed time series, Fp1 and O2 channels.
Applsci 11 09633 g001
Figure 2. Continuous wavelet spectrum from Fp1 channel of CL03 <60.
Applsci 11 09633 g002
Figure 3. Schematic representation from the crossing process for the XWT analyses. Example for the CL <60 group. (A) CWT arrays for each member of the group: CL01, CL02 and CL03. (B) Symmetric square matrix with the possible crossings for this group inside the black square. One matrix for each electroencephalographic channel. (C) Cross wavelet spectra from the crossings above the main diagonal from the Fp1 and O2 channels.
Applsci 11 09633 g003
Figure 4. Cross wavelet spectrum from the Cz channel of the crossing between CL01 and CL03 <60.
Applsci 11 09633 g004
Figure 5. The general wavelet profiles of CL and PD patients <60. (A) The global wavelet curves profile for CL <60. (B) The main frequencies profile for CL <60. (C) The power anomalies profile for CL <60. (D) The brainwave power profile for CL <60. (E) The global wavelet curves profile for PD patient <60. (F) The main frequencies profile for PD patient <60. (G) The power anomalies profile for PD patient <60. (H) The brainwave power profile for PD patients <60.
Applsci 11 09633 g005
Figure 6. General wavelet profiles of CL and PD patients >60. (A) The global wavelet curves profile for CL >60. (B) The main frequencies profile for CL >60. (C) The power anomalies profile for CL >60. (D) The brainwave power profile for CL >60. (E) The global wavelet curves profile for PD patient >60. (F) The main frequencies profile for PD patient >60. (G) The power anomalies profile for PD patient >60. (H) The brainwave power profile for PD patients >60.
Applsci 11 09633 g006
Figure 7. Outliers’ profiles. (A) The global wavelet curves profile for CL04 <60. (B) The main frequencies profile for CL04 <60. (C) The power anomalies profile for CL04 <60. (D) The brainwave power profile for CL04 <60. (E) The global wavelet curves profile for CL07 >60. (F) The main frequencies profile for CL07 >60. (G) The power anomalies profile for CL07 >60. (H) The brainwave power profile for CL07 >60.
Applsci 11 09633 g007
Table 1. Summary of the general covariance-wavelet profiles.
GroupMain Frequencies
(Hz)÷
Global Wavelet CurvesPower Anomalies
(Brain Regions)
Linear Regression
(Slope/y-Intercept)
Normalized Brainwave Power
α and δ Mean Frequencies (Hz; Mean ± SD)α and δ Power
(microV2)
+~0δθαβ
CL <608.99
9.52
10.09
9.52 ± 1.81
2.67 ± 0.55
0.89
0.39
Fp
F
T
P
O
C−0.14/1.60.570.3210.04
CL >608.48
8.99
8.99 ± 1.36
2.52 ± 0.46
0.93
0.33
Fp
T
O
F
C
P
-−0.03/0.420.460.2910.04
PD-Patients <608.99
9.52
10.09
9.52 ± 1.96
2.67 ± 0.49
0.95
0.35
T
P
O
Fp
F
C
-0.12/−1.30.370.3210.10
PD-Patients >602.38
2.52
2.67
8.99
8.99 ± 2.41
2.67 ± 0.61
0.49
0.90
T
P
O
FpF
C
0.12/−1.410.420.520.07
CL: Controls. PD: Parkinson’s disease. (+): positive power anomalies. (−): negative anomalies. (~0): power anomalies values close to zero. Brain regions (Fp: Frontopolar, F: Frontal, C: Central, T: Temporal, P: Parietal, O: Occipital).
Publisher’s Note: MDPI stays neutral with regard to jurisdictional claims in published maps and institutional affiliations.

