Article

Understanding the Adsorption Capacity for CO2 in Reduced Graphene Oxide (rGO) and Modified Ones with Different Heteroatoms in Relation to Surface and Textural Characteristics

by
Nikolaos Politakos
1,*,
Tomás Cordero-Lanzac
2 and
Radmila Tomovska
1,3
1
POLYMAT, Facultad de Ciencias Químicas, University of the Basque Country UPV/EHU, Joxe Mari Korta Zentroa, Tolosa Etorbidea 72, 20018 Donostia-San Sebastián, Spain
2
Department of Chemical Engineering, University of the Basque Country (UPV/EHU), P.O. Box 644, 48084 Bilbao, Spain
3
Ikerbasque, The Basque Foundation for Science, Maria Diaz de Haro 3, 48013 Bilbao, Spain
*
Author to whom correspondence should be addressed.
Submission received: 16 September 2021 / Revised: 6 October 2021 / Accepted: 12 October 2021 / Published: 15 October 2021

Abstract

:
Reduced graphene oxide is a material that has a variety of applications, especially in CO2 adsorption. The study of this research is the preparation of reduced graphene oxide with different heteroatoms and how the adsorption capacity is changed. The functionalization with other compounds bearing Si, S, N, and O was before reducing graphene oxide. Different monoliths were prepared by changing the ascorbic acid analogy and the temperature of reduction. The different porosity values, percentages of heteroatoms, and synthetic parameters show that the adsorption capacity is a complex procedure that can be affected by multiple parameters. Microporosity, different functionalities from heteroatoms, and high surface/volume of pores are the significant parameters that affect adsorption. All parameters should establish a balance among all parameters to achieve high adsorption of CO2.

1. Introduction

The emissions of greenhouse gases, especially carbon dioxide (CO2), are the main greenhouse effect sources. The greenhouse effect is now only showing its short-term effects, while soon, we will face even worse impacts of global climate change. Human activities are responsible for almost all CO2 emissions. The main human activities responsible for these emissions are: (as can be seen in the USA) (i) transportation 28%, (ii) electricity 27%, (iii) industry 22%, (iv) commercial and residential use 12%, and (v) agriculture 10% [1,2]. Reducing greenhouse gas emissions is a priority; since 2010, the five warmest years have occurred. Even though renewable resources are showing increasing trends, humans continue to depend on coal and oil. In 2000–2016, primary energy consumption and CO2 emissions from both fossil and fuel use globally increased to ∼40%. In the same years, ∼80% of the increased primary energy supply is attributable to new oil, coal, and natural gas production [3]. The constant high concentrations of greenhouse gasses mean that global mean temperatures and sea-level rise will be a non-reversible change. It is believed that CO2 emissions from long-lived energy and transportation infrastructure, now operating, can be expected to contribute to substantial emissions over the next 50 years. Geographically, committed emissions are concentrated in highly developed countries and populous emerging markets in the developing world, particularly China [4].
Recently in 2018, a rate of 2% of the growth in total global greenhouse gas emissions (excluding those from land-use change) was recorded, reaching 51.8 gigatons of CO2 [5]. The increase due to gasses participating in these emissions was mainly due to a 2% increase in global fossil carbon dioxide (CO2) emissions from fossil-fuel combustion and industrial non-combustion processes, including cement production. CO2 has the most significant share in these emissions with a 72%, followed by CH4 (19%), N2O (6%), and F-gases (3%). The five largest emitters of these gasses are responsible for 62% of the emissions globally. From these emitters, China has the largest share (26%), followed by the United States (13%), the European Union (more than 8%), India (7%), and the Russian Federation (5%) [5]. In 2018, an actual increase in greenhouse gasses emissions was shown in four of these countries: China (+1.9%), India (+5.5%), the United States (+2.7%), and the Russian Federation (+5.1%), whereas emissions somewhat decreased in the European Union (−1.5%) [5].
CO2 must be reduced, and currently, technologies and materials for capture CO2 effectively should be improved. For the capture of CO2, nowadays, there are several technologies available, such as solvent absorption, physical adsorption, membrane separation, cryogenic fractionation, and chemical looping. However, the lack of state-of-the-art materials with high performance and low costs of production prevents their full exploitation for CO2 capture. The solid adsorbents are a unique category that can be used in adsorption-based technologies. A different class of porous solid sorbents is investigated. Some of them are already in practical application, as is the case with silica, zeolites, MOFs, mesoporous material, metal decorated phosphorene, nanostructured copolymer, and ionic liquids [6,7]. Due to some limitations (not to be discussed in this manuscript), the abovementioned have not shown the best results, and research should focus on new ones with the idea of easiness in scale-up [8]. In the family of solid adsorbents, carbon-based materials (graphene, nanotubes, activated carbon, activated carbon fibers, and carbon spheres) are considered appropriate for CO2 capture due to their high stability in cycle operation [8,9]. Due to excellent characteristics (thermal and mechanical stability and the most important high surface area). Moreover, graphene can be prepared in a monolithic appearance that can help the adsorption due to a significant increase in the amount of active material per projected area and easiness of manipulation. The preparation of modified monolithic materials based on graphene oxide could improve their properties, including the adsorption capacity, selectivity, and stability in cycle operation. [8,9].
Generally, graphene oxide can be functionalized covalently (carbon skeleton, hydroxyl, and carboxyl functionalization), non-covalently (p-p bond interaction, hydrogen bond interaction, ion interaction, and electrostatic interaction), and element doping [10]. Surface modifications have been performed using 12-molybdophosphoric acid [11], polymer brushes [12], amine (-NH2) functionality (aliphatic and aromatic amines, amino acids, amine-terminated biomolecules, ionic liquids, small molecular weight polymers, and silane compounds) [13], diethylenetriamine [14], lysine [15], catecholamine reagent [16], and citric acid [17].
Reduced graphene oxide (rGO) 3D materials have been modified either with functional groups or elements. The majority of the modification reactions are based on the introduction of the N in the structure. Some of these examples are based on ethylenediamine, diethylenetriamine, triethylenetetramine (showing CO2 adsorption of 2.0 mmol/g at 1 bar and 298 K [18], with urea (CO2 adsorption at atmospheric pressure, and 25 °C of 2.40 mmol/g) [19], with hydrazine during reduction (for supercapacitors) [20] and ethylenediamine (1.1 mmol/g of CO2 adsorption) [21]. Some other works involve doping with S, P, and N grown with Co9S8 nanoparticles (as a bifunctional catalyst) [22] or silylation by employing three distinct silica precursors (CO2 adsorption of 3.5 mmol/g at 5 bar and 0 °C [23] or thiolene click reaction [24]. Finally, other works can be found by using MgO, rGO, and amorphous carbon to prepare sandwich-like structures (CO2 adsorption up to 31.5 wt % at 27 °C, 1 bar CO2 22.5 wt % under the simulated flue gas) [25]. In most of these works it was concluded that the functionalization of 3D rGO materials by introducing various heteroatoms functional groups is a useful tool to improve the textural properties (porosity and SA) [18,19,23,25], CO2 capture capacity [18,19,21,23,25] and/or selectivity over N2 [19,21].
In our previous works, we prepared 3D rGO monolithic structures for CO2 capture, functionalized either by a partial reduction of GO [9] or by functionalized polymer particles [8], achieving CO2 capture up to 2.1 mmol/g and 3.97 mmol/g at 25 °C and 1 atm, respectively. The main disadvantage of these materials is their low fraction of micropores, which likely is the main disadvantage of achieving higher CO2 capture. To increase the micropore fraction within the monolithic rGO materials, we functionalized the GO platelets with different silane coupling agents. Two aims were targeted, on the one hand, to introduce heteroatoms (S, O, N) as they have already been shown that their presence makes the structures more CO2-fillic, and on the other to form dense structures that will increase the formation of micropores during the creation of the monolithic structures. For that aim the following silane coupling agents were used: (i) (3-Mercaptopropyl)trimethoxysilane (TMOS) (functionalize with Si and S atoms), (ii) 1-[3-(trimethoxysilyl)propyl]urea (TMON) (functionalize with Si and N atoms), and (iii) Cyanomethyl [3-(trimethoxysilyl)propyl] trithiocarbonate (TMOSN) (functionalization with Si, N and S atoms). In Scheme 1, the chemical structures are presented. The monolithic structures were performed by chemical reduction of GO and modified GO with ascorbic acid (AsA) at two different analogies with the initial GO (0.5 and 2), produced at two different temperatures (60 °C and 90 °C). The different parameters (physicochemical, elemental, and porosity) that govern the adsorption capacity were deeply studied.

2. Materials and Methods

2.1. Materials

Graphene oxide (GO) in an aqueous dispersion of 4 mg/mL, with a monolayer content >95%, was purchased from Graphenea (Spain). The elemental analysis of GO showed C: 49−56%, H: 0−1%, N: 0−1%, S: 2−4%, and O: 41−50%. To reduce GO, L-ascorbic acid (AsA) or vitamin C (≥99.0%, Sigma-Aldrich, St. Louis, MI, USA) was used. The functionalization agents were also purchased from Aldrich with purities of 95% for (3-Mercaptopropyl)trimethoxysilane, 97% for 1-[3-(Trimethoxysilyl)propyl]urea, and 95% for Cyanomethyl [3-(trimethoxysilyl)propyl] trithiocarbonate.

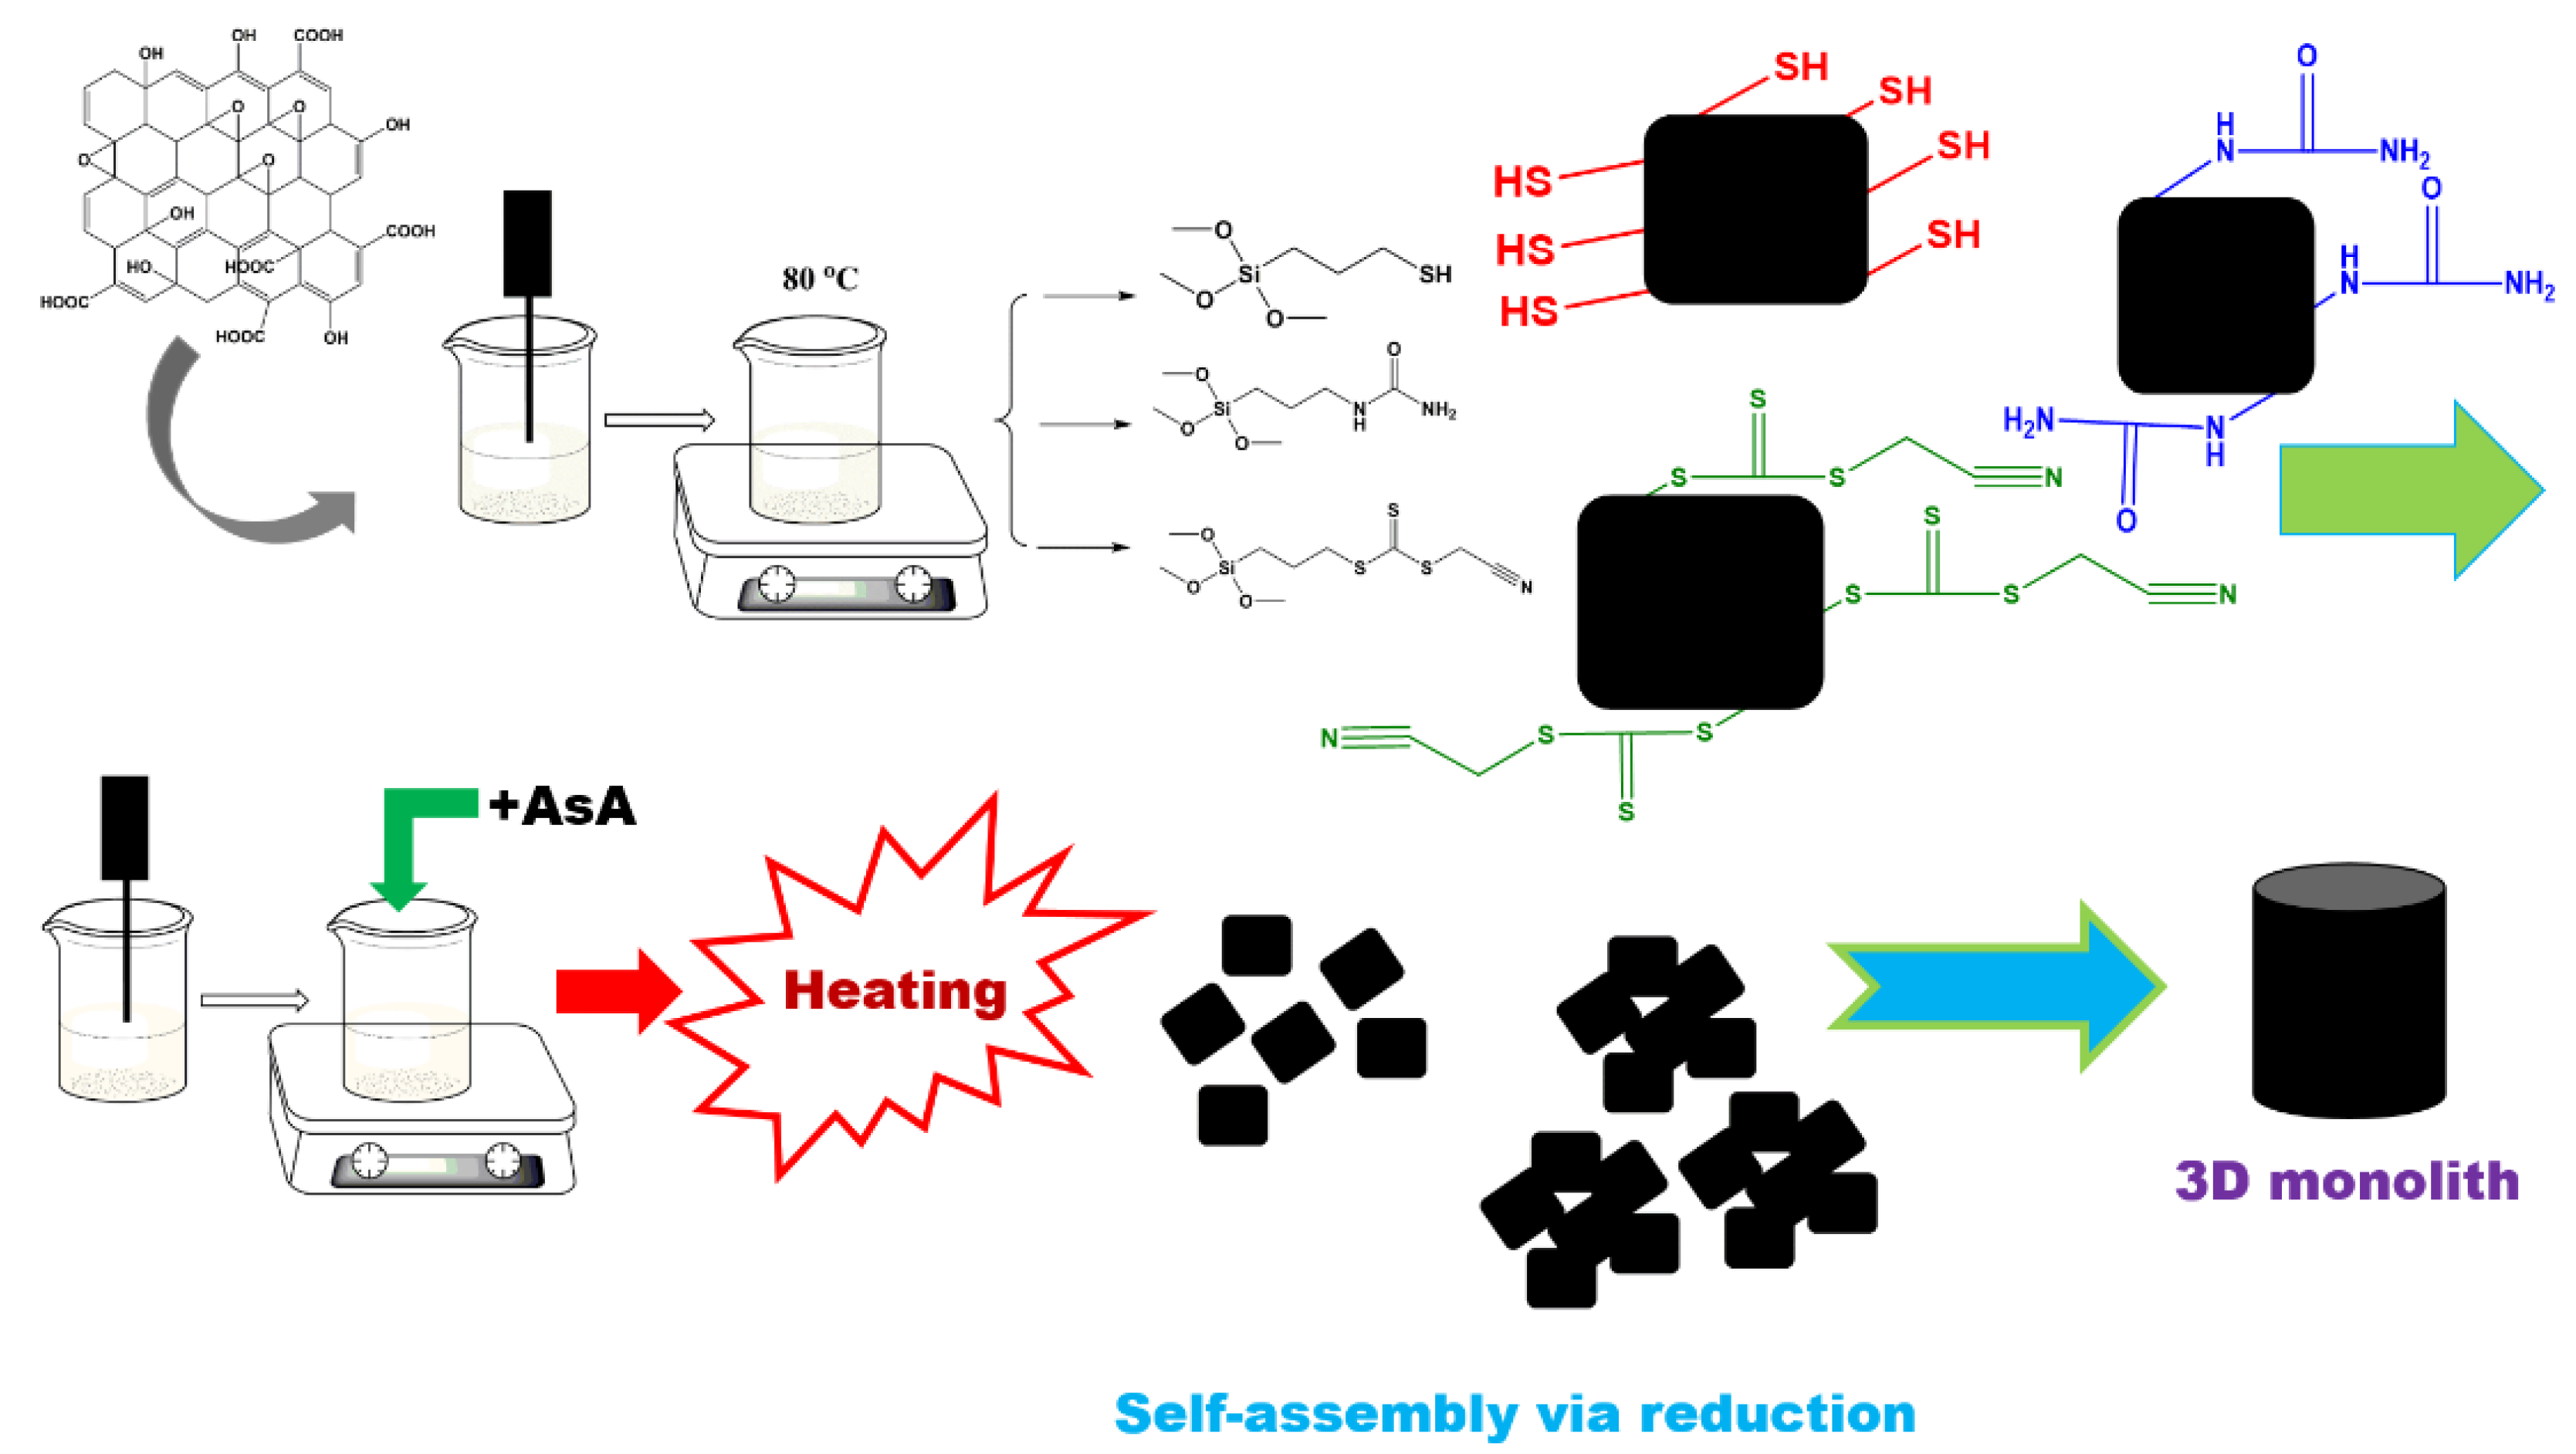
2.2. Synthesis of the Monoliths

The preparation of the monoliths is divided into two parts, firstly the functionalization with the reagents and subsequently the reduction and self-assembly of the monolith. Initially, the appropriate amount of GO dispersion (200 mL–800 mg) was sonicated for 1 h. Then, it was left stirring for 2 h at 80 °C, and the solution was divided into four equal parts (50 mL–200 mg). Three parts were used to functionalize each reagent (analogy GO: modification reagent 2:1 in mg) shown in Scheme 1 and the last one to prepare the blanks. All solutions with the functionalization agents were kept at 80 °C overnight.
The next step is based on the formation of the monolith. Each GO solution was sonicated for 30 min. Then, each solution was divided appropriately into two parts (25 mL–100 mg). In the first solution, a double quantity of AsA (200 mg) was added. In the second solution half of the AsA quantity (50 mg), a similar approach was followed to prepare the blanks. All solutions were left stirring at RT for 30 min. Then, each solution was divided into two equal parts and placed in the oven at 60 °C or 90 °C for two hours until reduction was completed. The composite monoliths were cleaned with the dialysis process and freeze-dried by the freeze-drying process. Table 1 summarizes the sample names of the obtained materials together with the reaction conditions. Figure 1 presents the preparation route of the monolithic materials.

2.3. Characterization

The surface morphology of the monolithic composites was examined using a scanning electron microscopy (SEM): a Hitachi TM3030 tabletop model (Krefeld, Germany) at an accelerating voltage of 15 kV after the samples were coated with a thin layer of gold. FTIR measurements were conducted with a Thermo Scientific™ Nicolet™ iS20 FTIR Spectrometer at RT with a spectra resolution better than 0.25 cm−1 and 32 scans from 500 cm−1 to 4000 cm−1. Characterization for solid 13C-NMR conducted by a Bruker 400 AVANCE III WB spectrometer (9.40 T) for 64 h at a resonance frequency of 100.6 MHz using the standard Bruker double-resonance magic-angle spinning (MAS) sample probe. The samples were packed into a cylindrical zirconia rotor (4 mm external diameter) and then spun at a MAS frequency of 10 kHz. The spectra of the solid samples were recorded using the high-power decoupled 13C pulse sequence, a time-domain of 2 s, a spectral width of 55 kHz, and an interpulse delay of 5 s.
The porous texture of the monoliths was characterized by employing N2 adsorption-desorption at –196 °C in a Micromeritics ASAP2010 apparatus (Madrid, Spain). Before the analysis, materials were degassed at 150 ºC under vacuum for 8 h. From N2 adsorption-desorption isotherms, the specific surface area (SBET) was calculated with the Brunauer–Emmett–Teller (BET) equation. Moreover, used the t-plot method for estimating the micropore volume (Vmicr) and the external surface (Sext). The mesopore volume (Vmes) was computed by differences between the total pore volume (VT) and micropore volume. Finally, the pore size distribution (PSD) and average pore diameter (dp) were calculated using the method proposed by Barrett–Joyner–Halenda (BJH method).
To determine the adsorption capacity of the monolithic composites to absorb CO2, a TGA/DSC 3+ (Perkin Elmer, Waltham, MA, USA) was used. The mass resolution of the equipment was 0.001 mg with a precision of 0.0025% with an accuracy of 0.005%. The temperature resolution was 0.001 K with a precision of ±0.2 K and accuracy of ±0.3 K. Before the measurements, the materials were placed in an N2 atmosphere at 100 °C for 30 min. Afterward, CO2 adsorption measurements were performed at 25 and 60 °C at atmospheric pressure and a 50 mL/min gasses flow rate.

3. Results

3.1. FTIR–Solid 13C-NMR
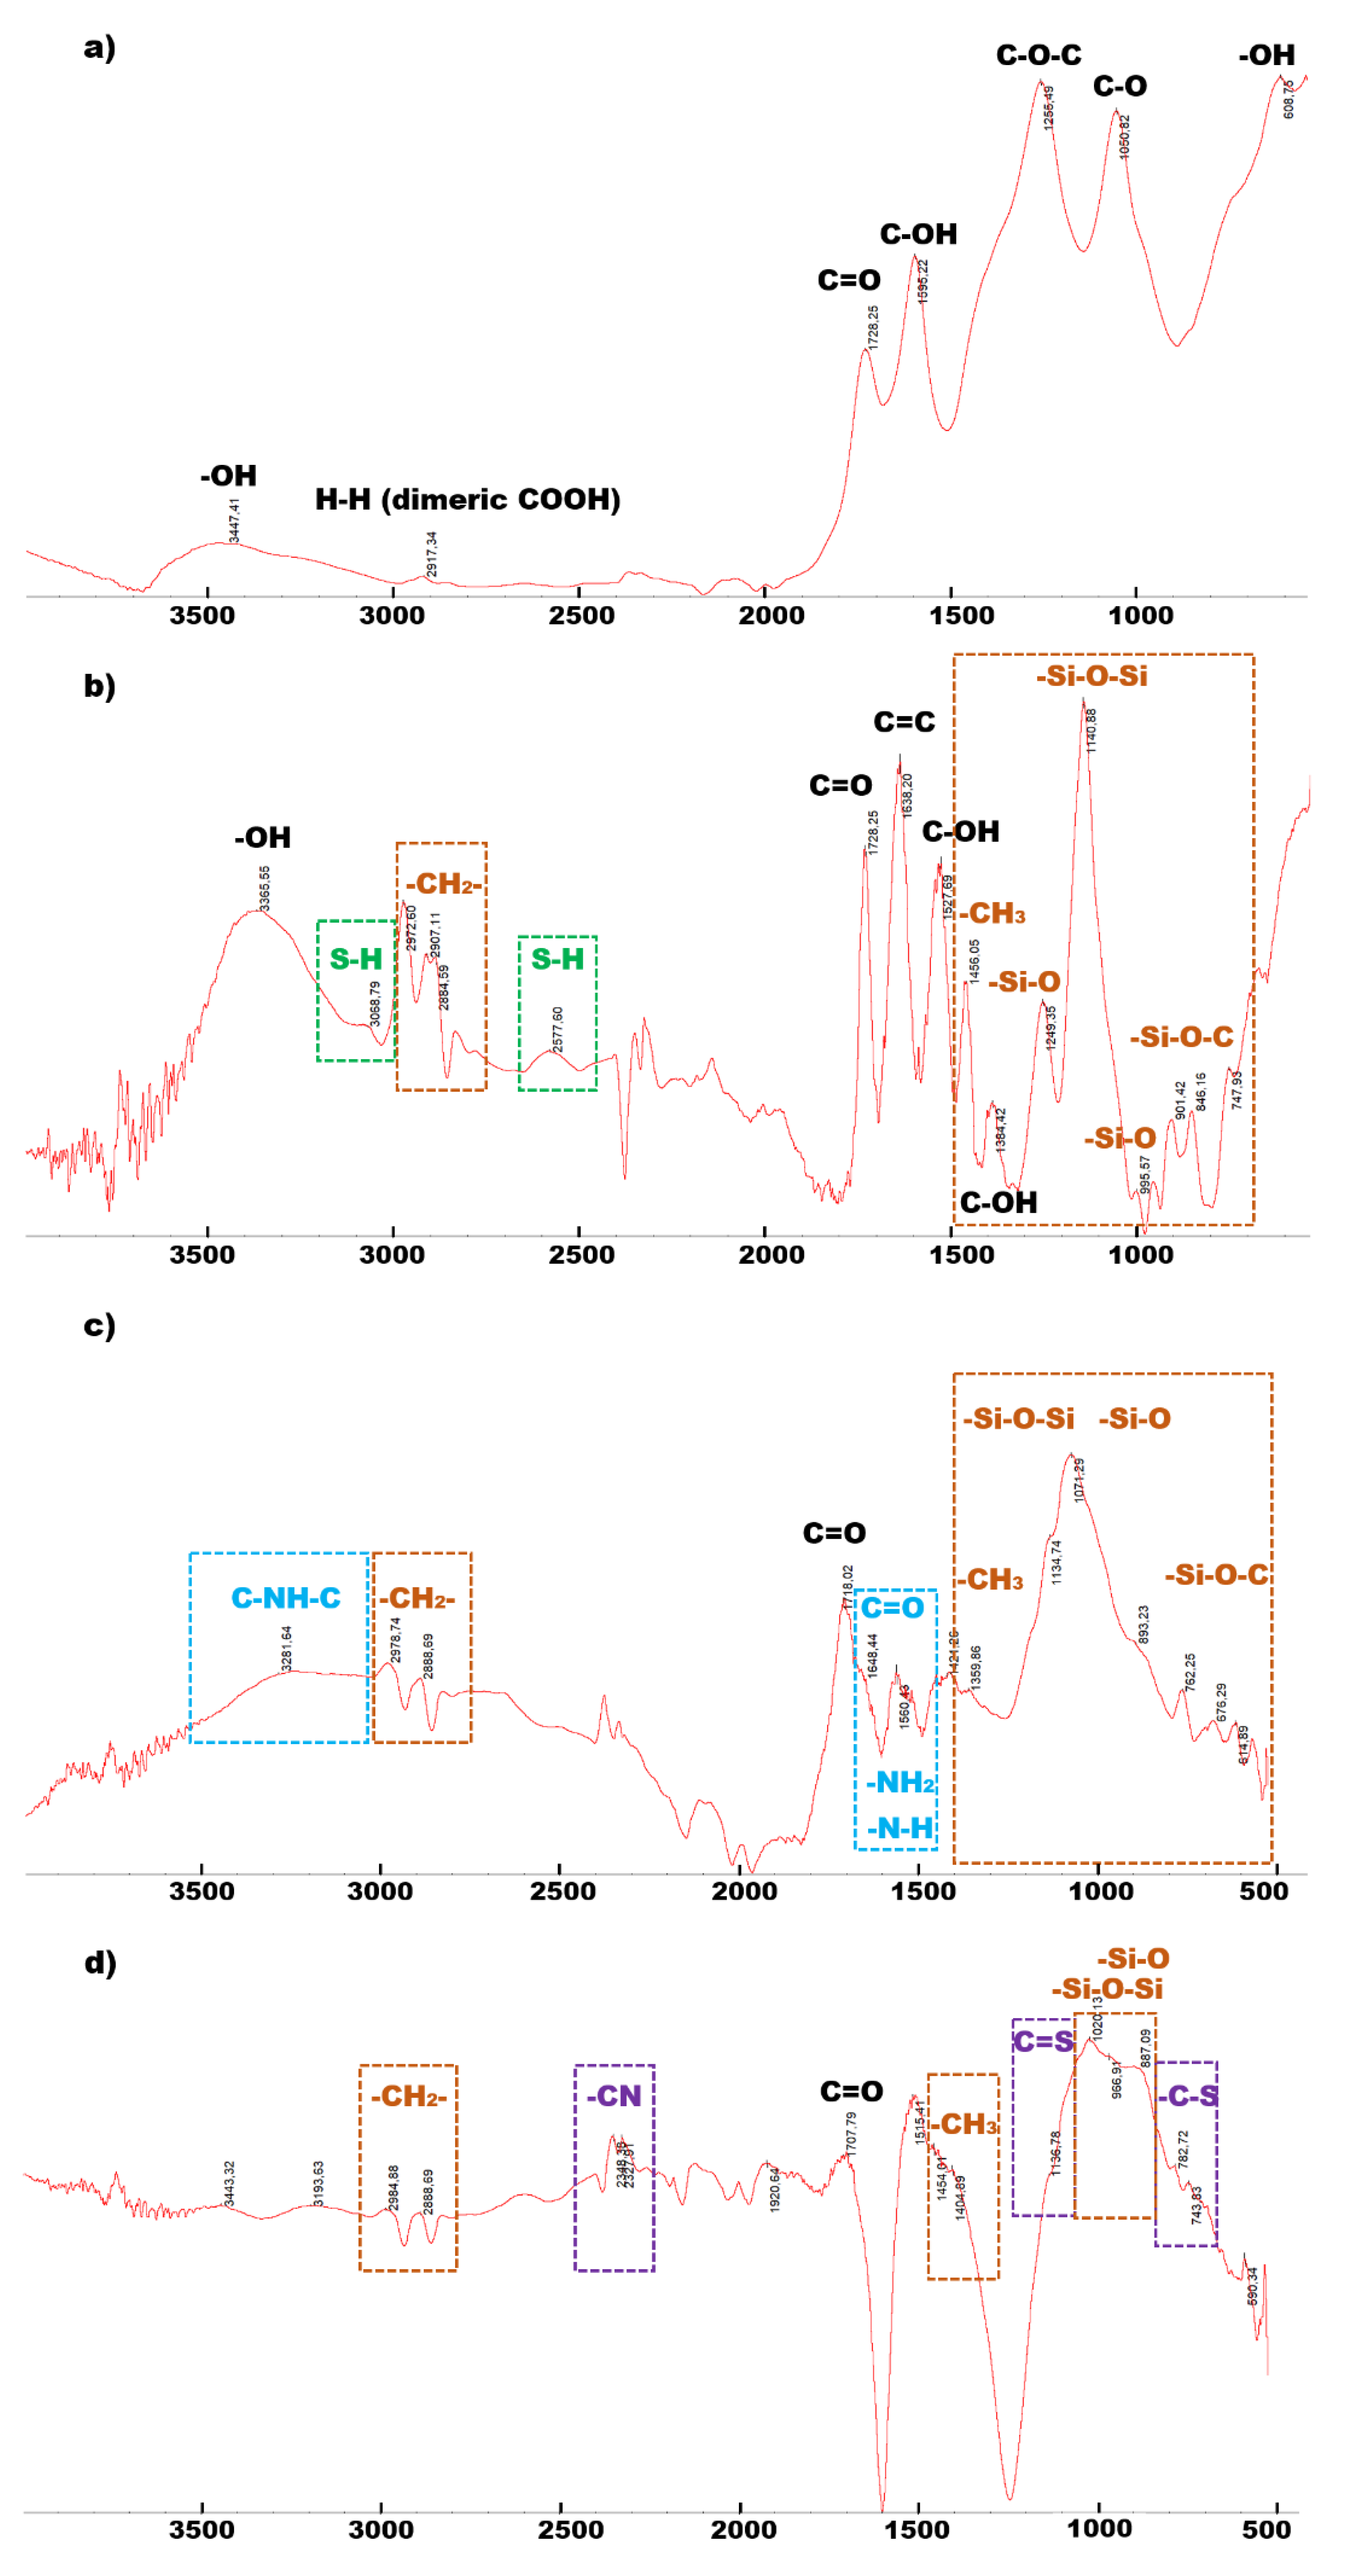
3.1.1. FTIR

In Figure 2, the FTIR of the blank sample as long as the modified ones can be seen. In this way, the anchoring of the silane can be monitored.
FTIR results verify that after modification, new peaks of specific groups are generated. Initially, rGO FTIR displays specific groups derived from the non-full reduction of GO. Specific groups of GO can be seen [26] before a reduction in specific areas (Figure 2a): 3500 cm−1 (OH stretching), 1720 cm−1 (C=O, stretching), 1587 or 1615 cm−1 (C-OH or bending of water adsorbed), 1356 cm−1 (C-OH), 1288–1225 cm−1 (C-O-C bending), and 1056–1066 cm−1 (C-O). Moreover, some other bands can be found at 3060 cm−1 (C-H), 2927/2868 cm−1 (H-H of OH in dimeric COOH and intra-molecular bonded OH or asymmetric-symmetric CH2 stretching), 1640–1605 cm−1 (C=C, unoxidized graphite, or recovery of sp2 lattice), 1433 cm−1 (C-H), and 600 cm−1 (OH). Specific groups of GO, shown in FTIR, reveal that the reduction step did not eliminate all groups. What is also important is the Figure S1 of the same monolith, but with four times more AsA (sample rGO60_0.5 vs. rGO60_2), where these groups have less intensity or are even disappeared.
Moving to the modified monoliths, new bands appeared related to the specific chemical groups. First, the common ones are displayed for all modified samples: 2930/2860 cm−1 (-CH2-), 1456 cm−1 (-CH3), 1241/1084/1003/799 cm−1 (-Si-O), 1110 cm−1 (-Si-O-Si-), and 1020/690 cm−1 (Si-O-C) (Figure 2b–d, marked with brown color) [27,28,29,30,31,32]. Among those bands, probably the most important one is the -Si-O-Si-, which shows that CH3 groups have been eliminated during the reaction with the GO and that the modifying component has made bridges with neighboring compounds. Regarding the TMOS, the new expected band is at 3090 and 2570 (S-H) (Figure 2b, marked with green color) [27,30,31]. In the case of TMON, more bands can be seen, such as 3338 cm−1 (C-NH-C), 1742 or 1621 cm−1 (C=O), 1599 cm−1 (NH2), 1588 cm−1 (C(O)-NH), and 1571 cm−1 (N-H) (Figure 2c, marked with blue color) [31,32,33]. Finally, for the case of TMOSN, the most important expected bands are 2327 cm−1 (-CN), 1060 or 1255 cm−1 (C=S), and 840–870 cm−1 (C-S) (Figure 2d, marked with purple color) [34,35,36,37]. Based on the FTIR expected bands, many of them have been recognized in spectra shown in Figure 2.
The FTIR spectra can also offer the possibility of making calculations for the extend of anchoring these silanes. The ratios were calculated from bands of the silane (-C-Si-O- and -CH2-) divided with specific bands from the rGO (C=C and C=O). The higher the ratio, the higher the extent of modification. From the ratios calculated, the highest degree of modification was for the sample modified with TMOS, S90_2 (3.79), then for the system with TMON, N60_0.5 (1.87), and TMOSN, SN90_0.5 (2.36). In general, TMOSN seems to be a component that was better anchored to the rGO after the monolith formation since three out of four samples are in the highest five values. Similarly, TMOS has two in the highest values. The medium value for monoliths with TMON is the lowest with 1.13, and then comes TMOSN with a medium of 1.85, and the highest medium is for TMOS with 2.17. In terms of the parameters in preparation of the monoliths, the values go with 90_2 > 90_0.5 > 60_0.5 > 60_2 (2.25, 1.77, 1.51, and 1.35). It seems that the preparation of monolith at 90 °C and with the analogy of 2 for AsA showed the highest modifications. In general, the modification was conducted in the same mass analogy and same temperature (before the preparation of the monolith) and for the same time. It seems that for samples with TMOS, the results are better (in terms of the degree of functionalization); this has probably had to do with a smaller molecule that is TMOS and creates less steric hindrance. Moreover, converting the same mass to moles, TMOS has more moles for the same amount of g since it has a lower molecular weight. For the other two components, the differences are probably based on polarity reasons during the functionalization. Steric hindrance is also essential in the other two compounds since both molecules are more complicated than TMOS. Concerning the functionalization degree for the parameters used in the monolith synthesis, it seems that higher temperatures and higher analogy of AsA show better functionalization than expected. This has to be better studied since the compounds are already anchored to the GO sheet before the monolith preparation. The results obtained are based on the FTIR bands of both rGO and silane. The monolith preparation at higher AsA and temperatures leads to more increased elimination of functional groups for GO, leading to more negligible absorbance in the FTIR and higher ratios for functionalization.

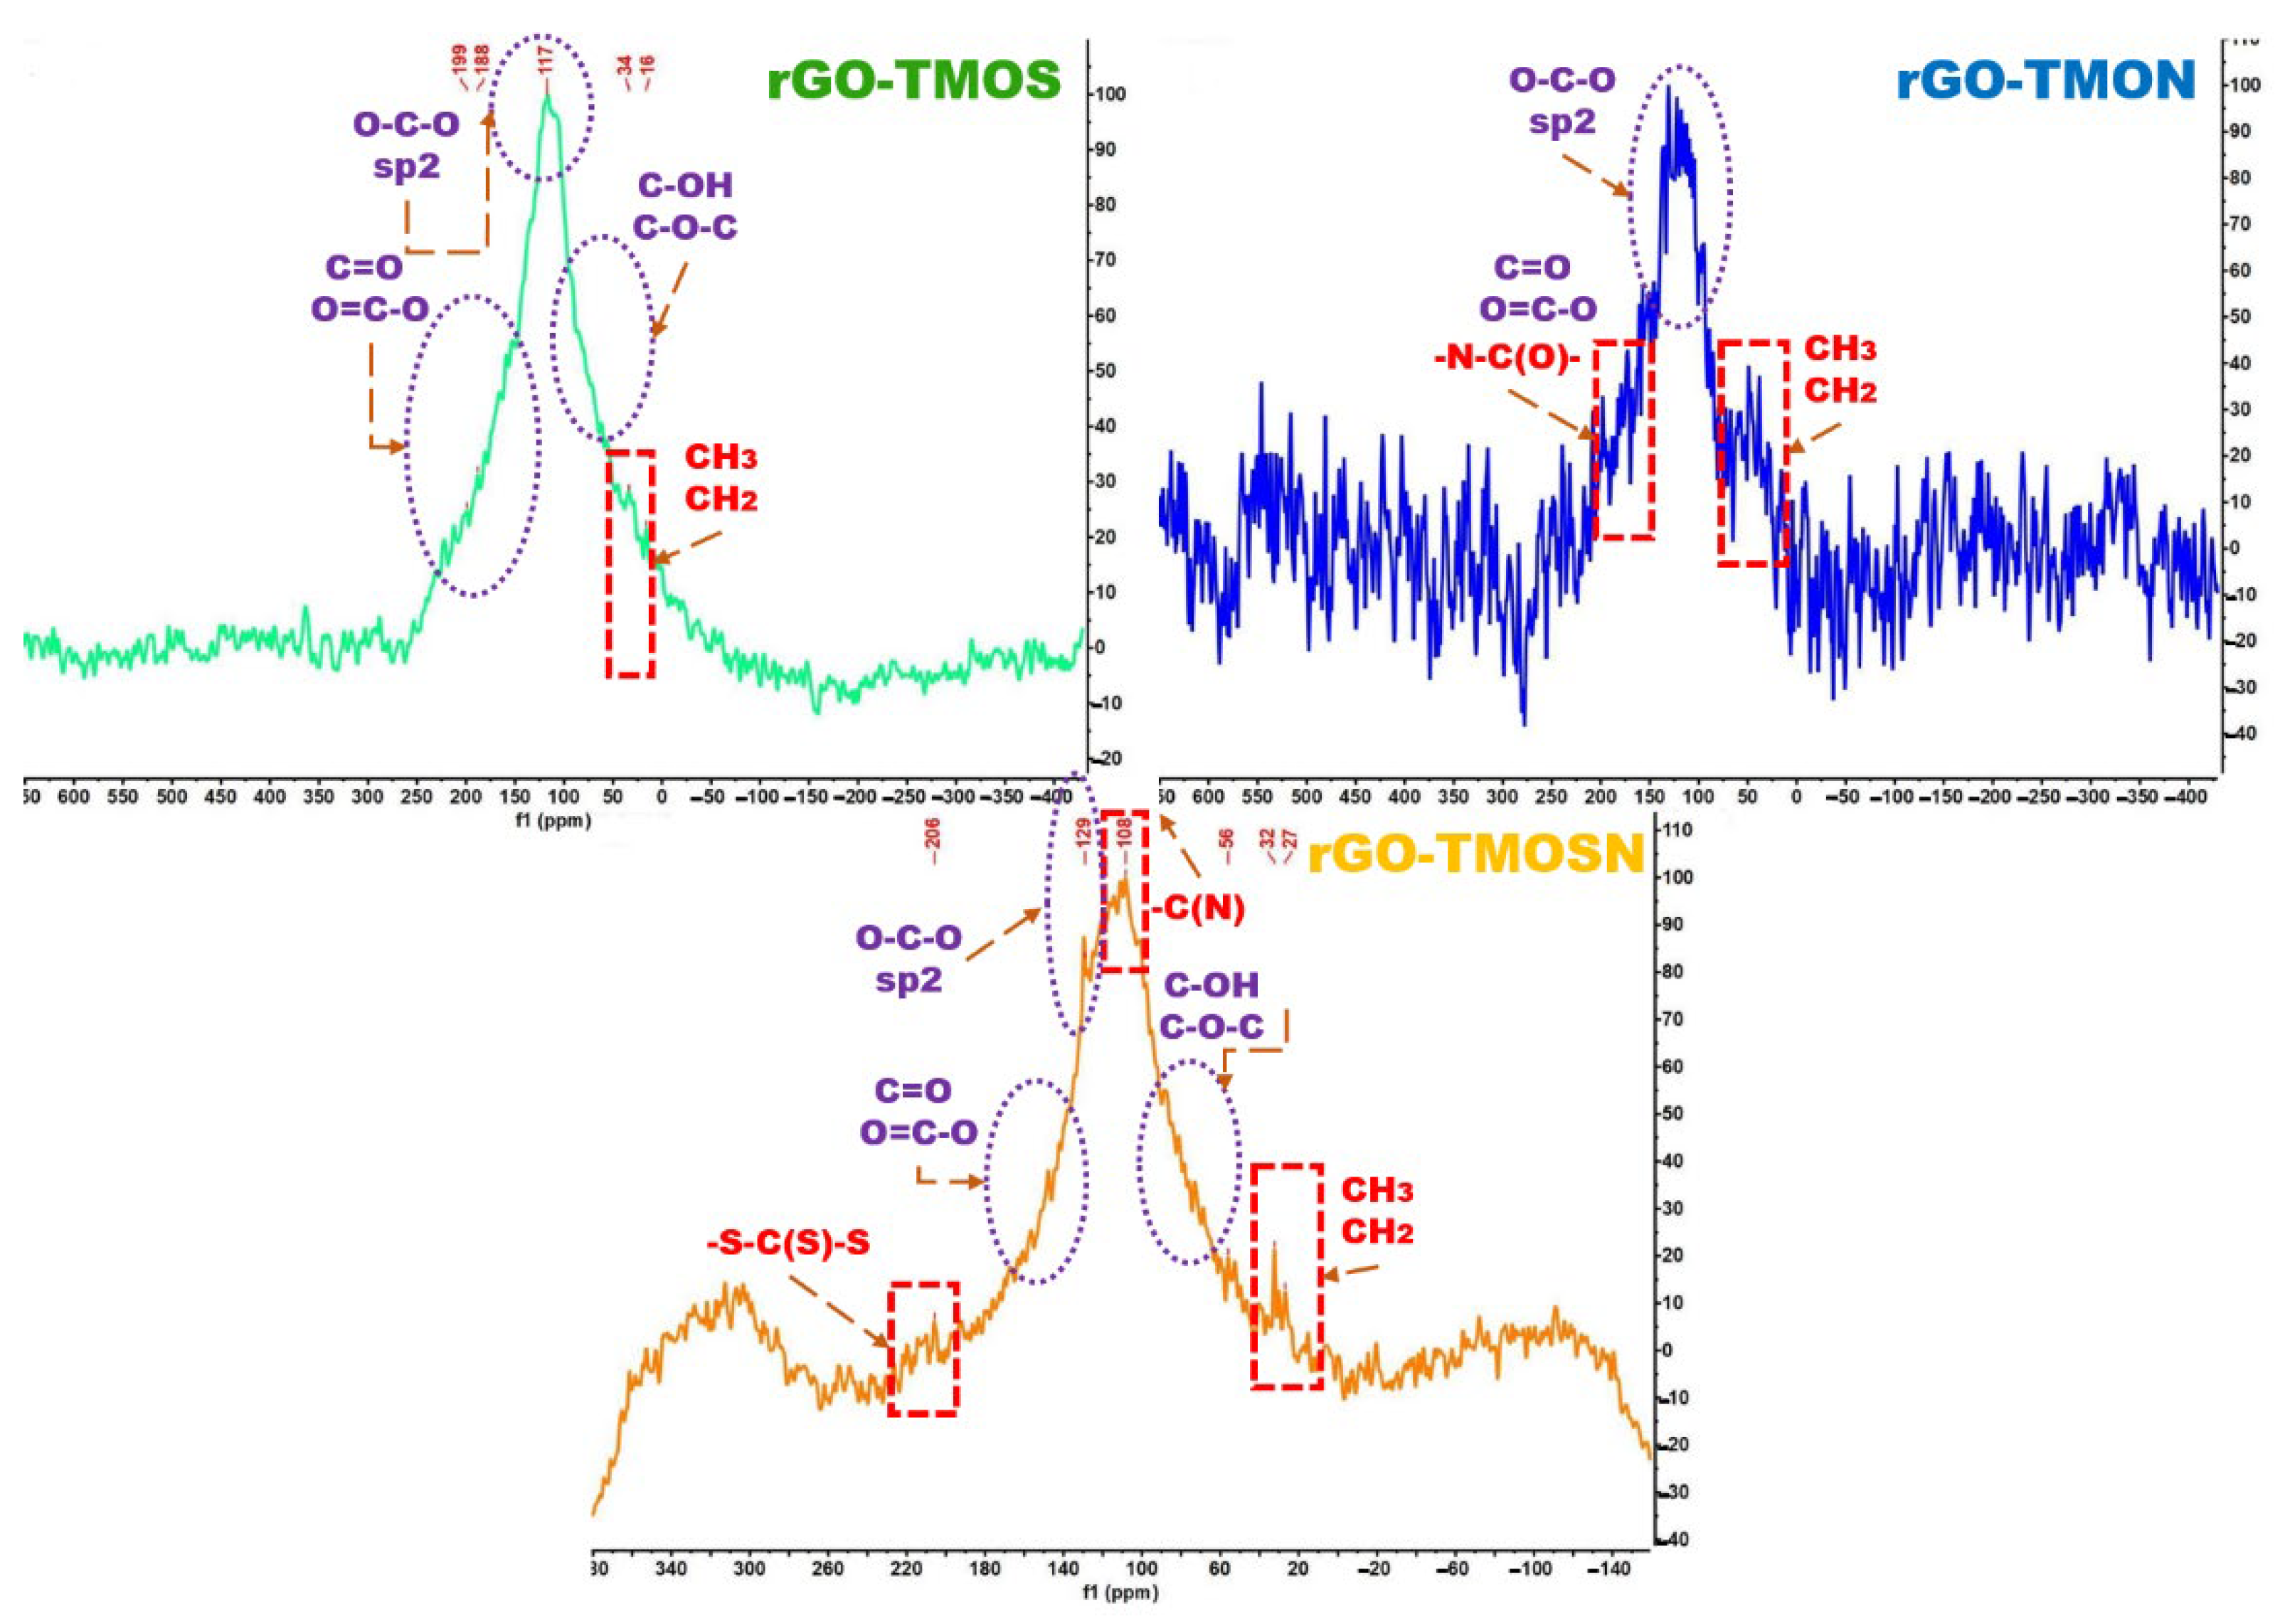
3.1.2. Solid 13C-NMR
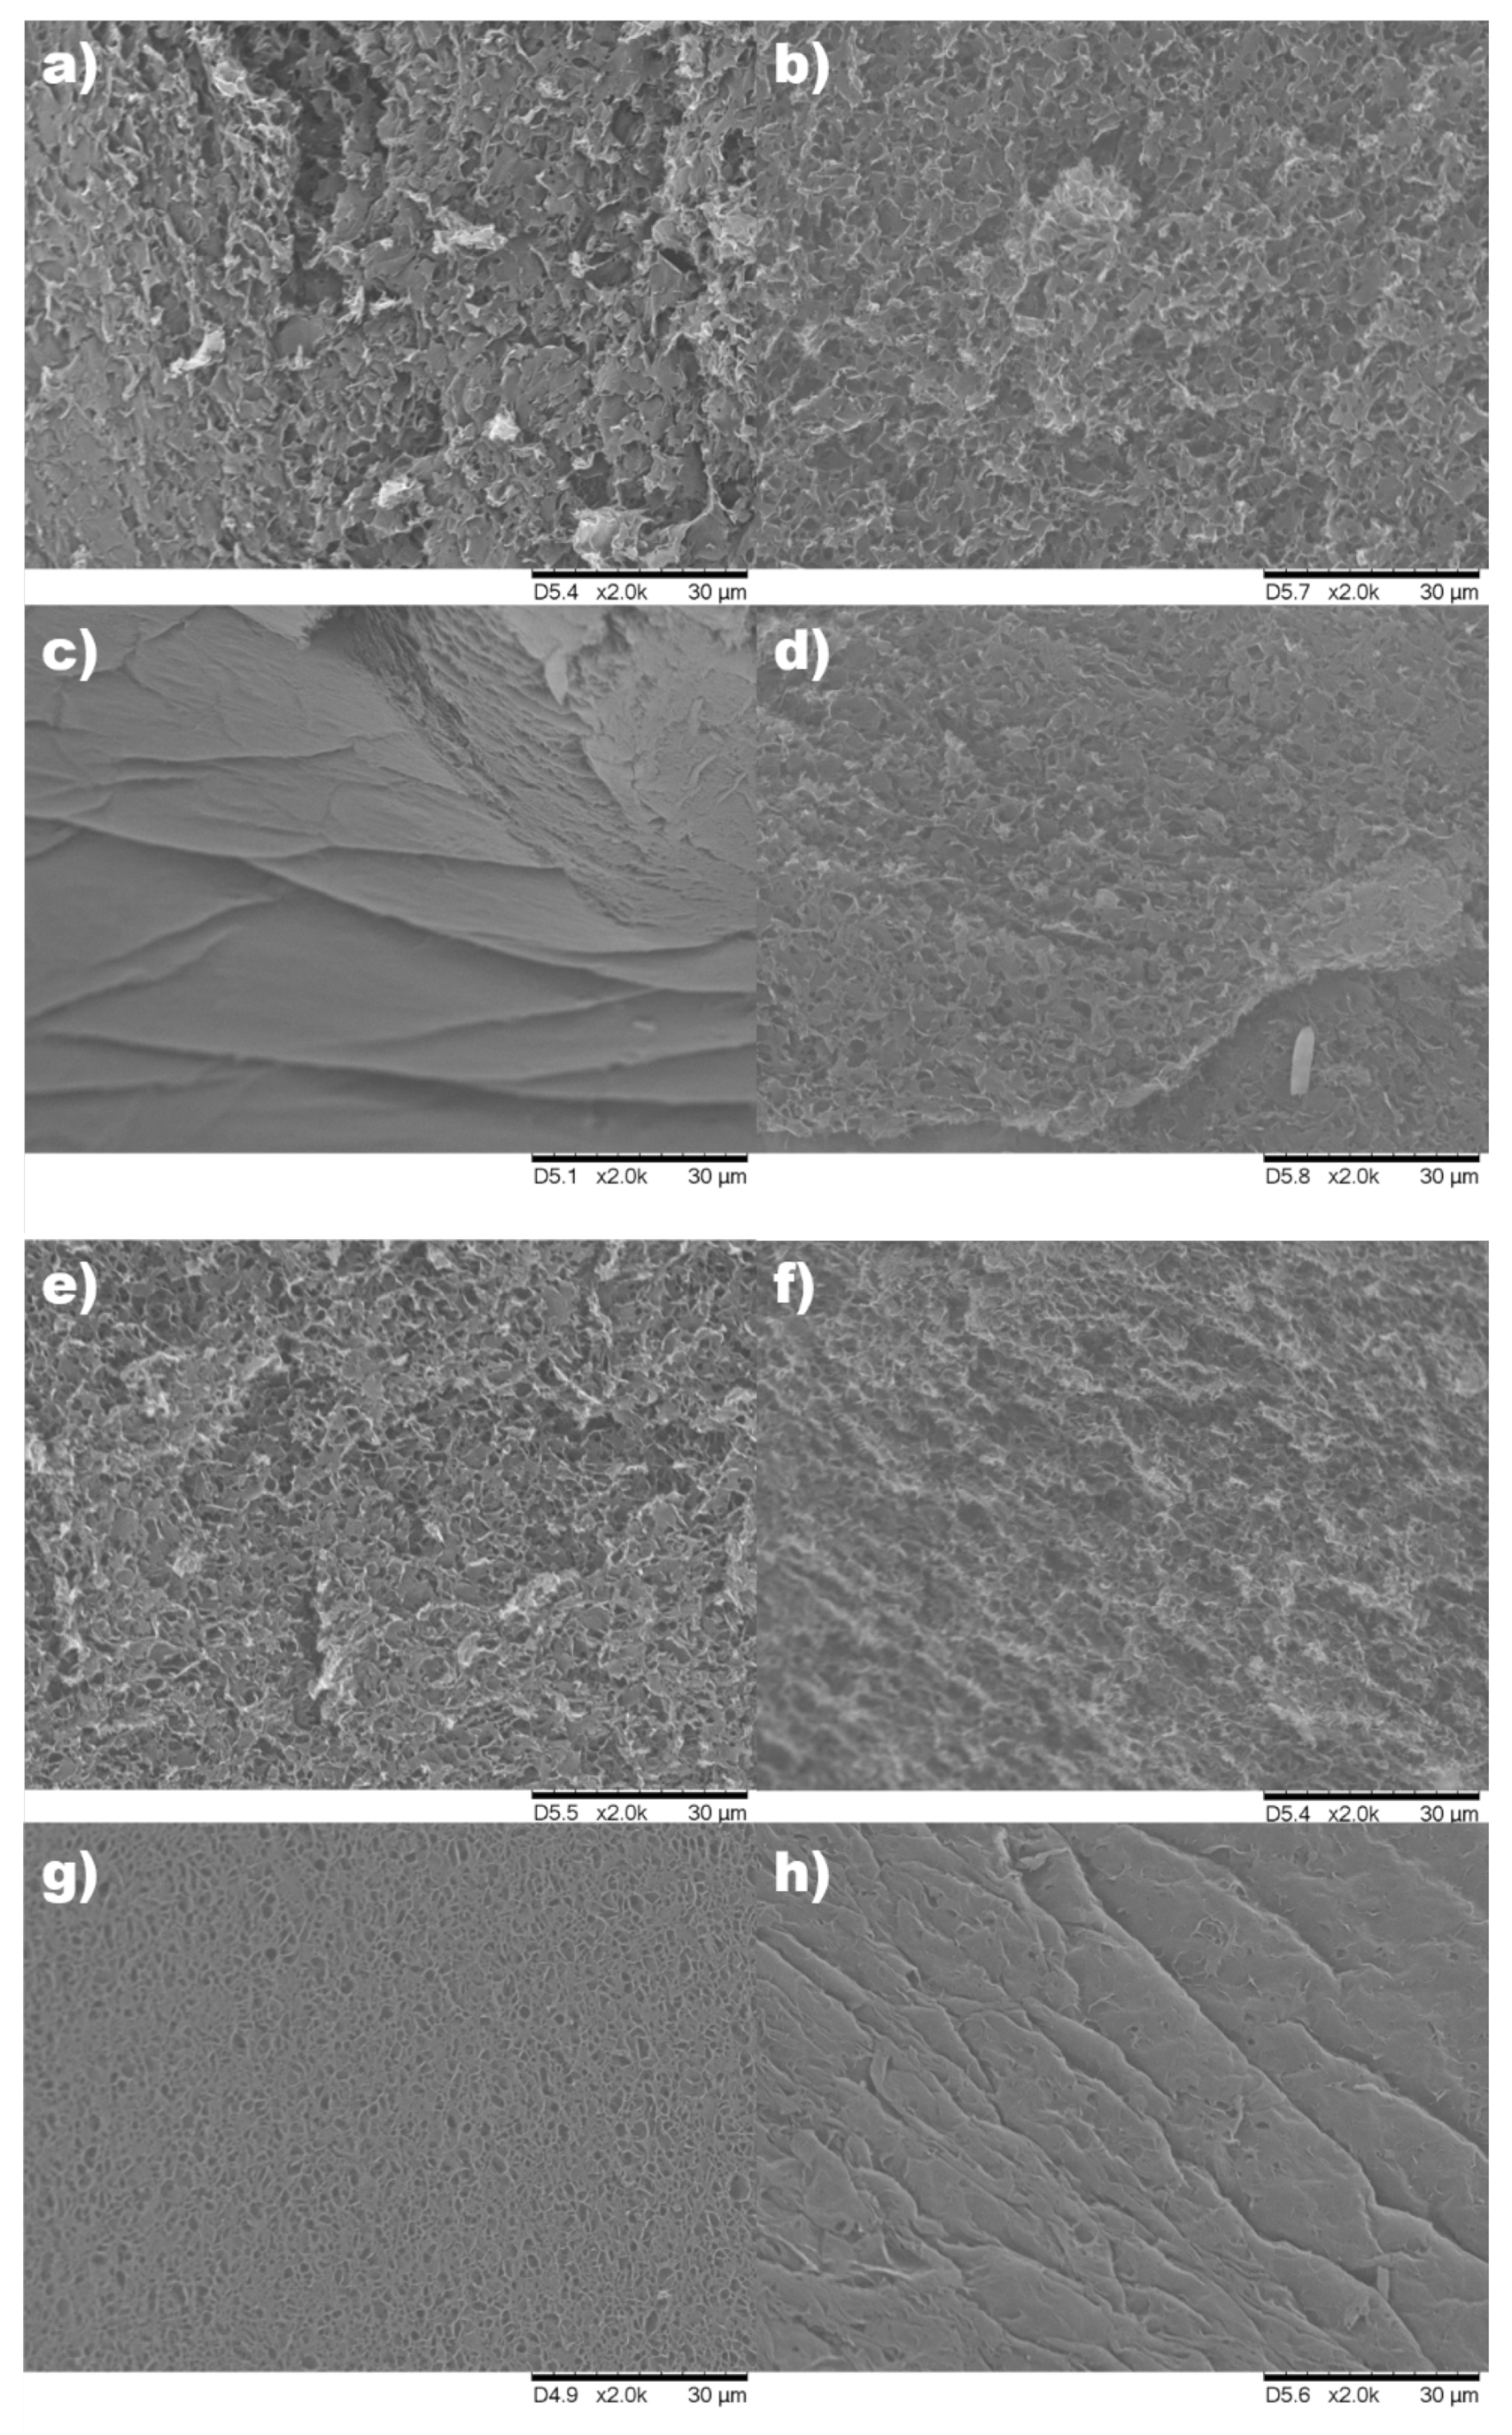
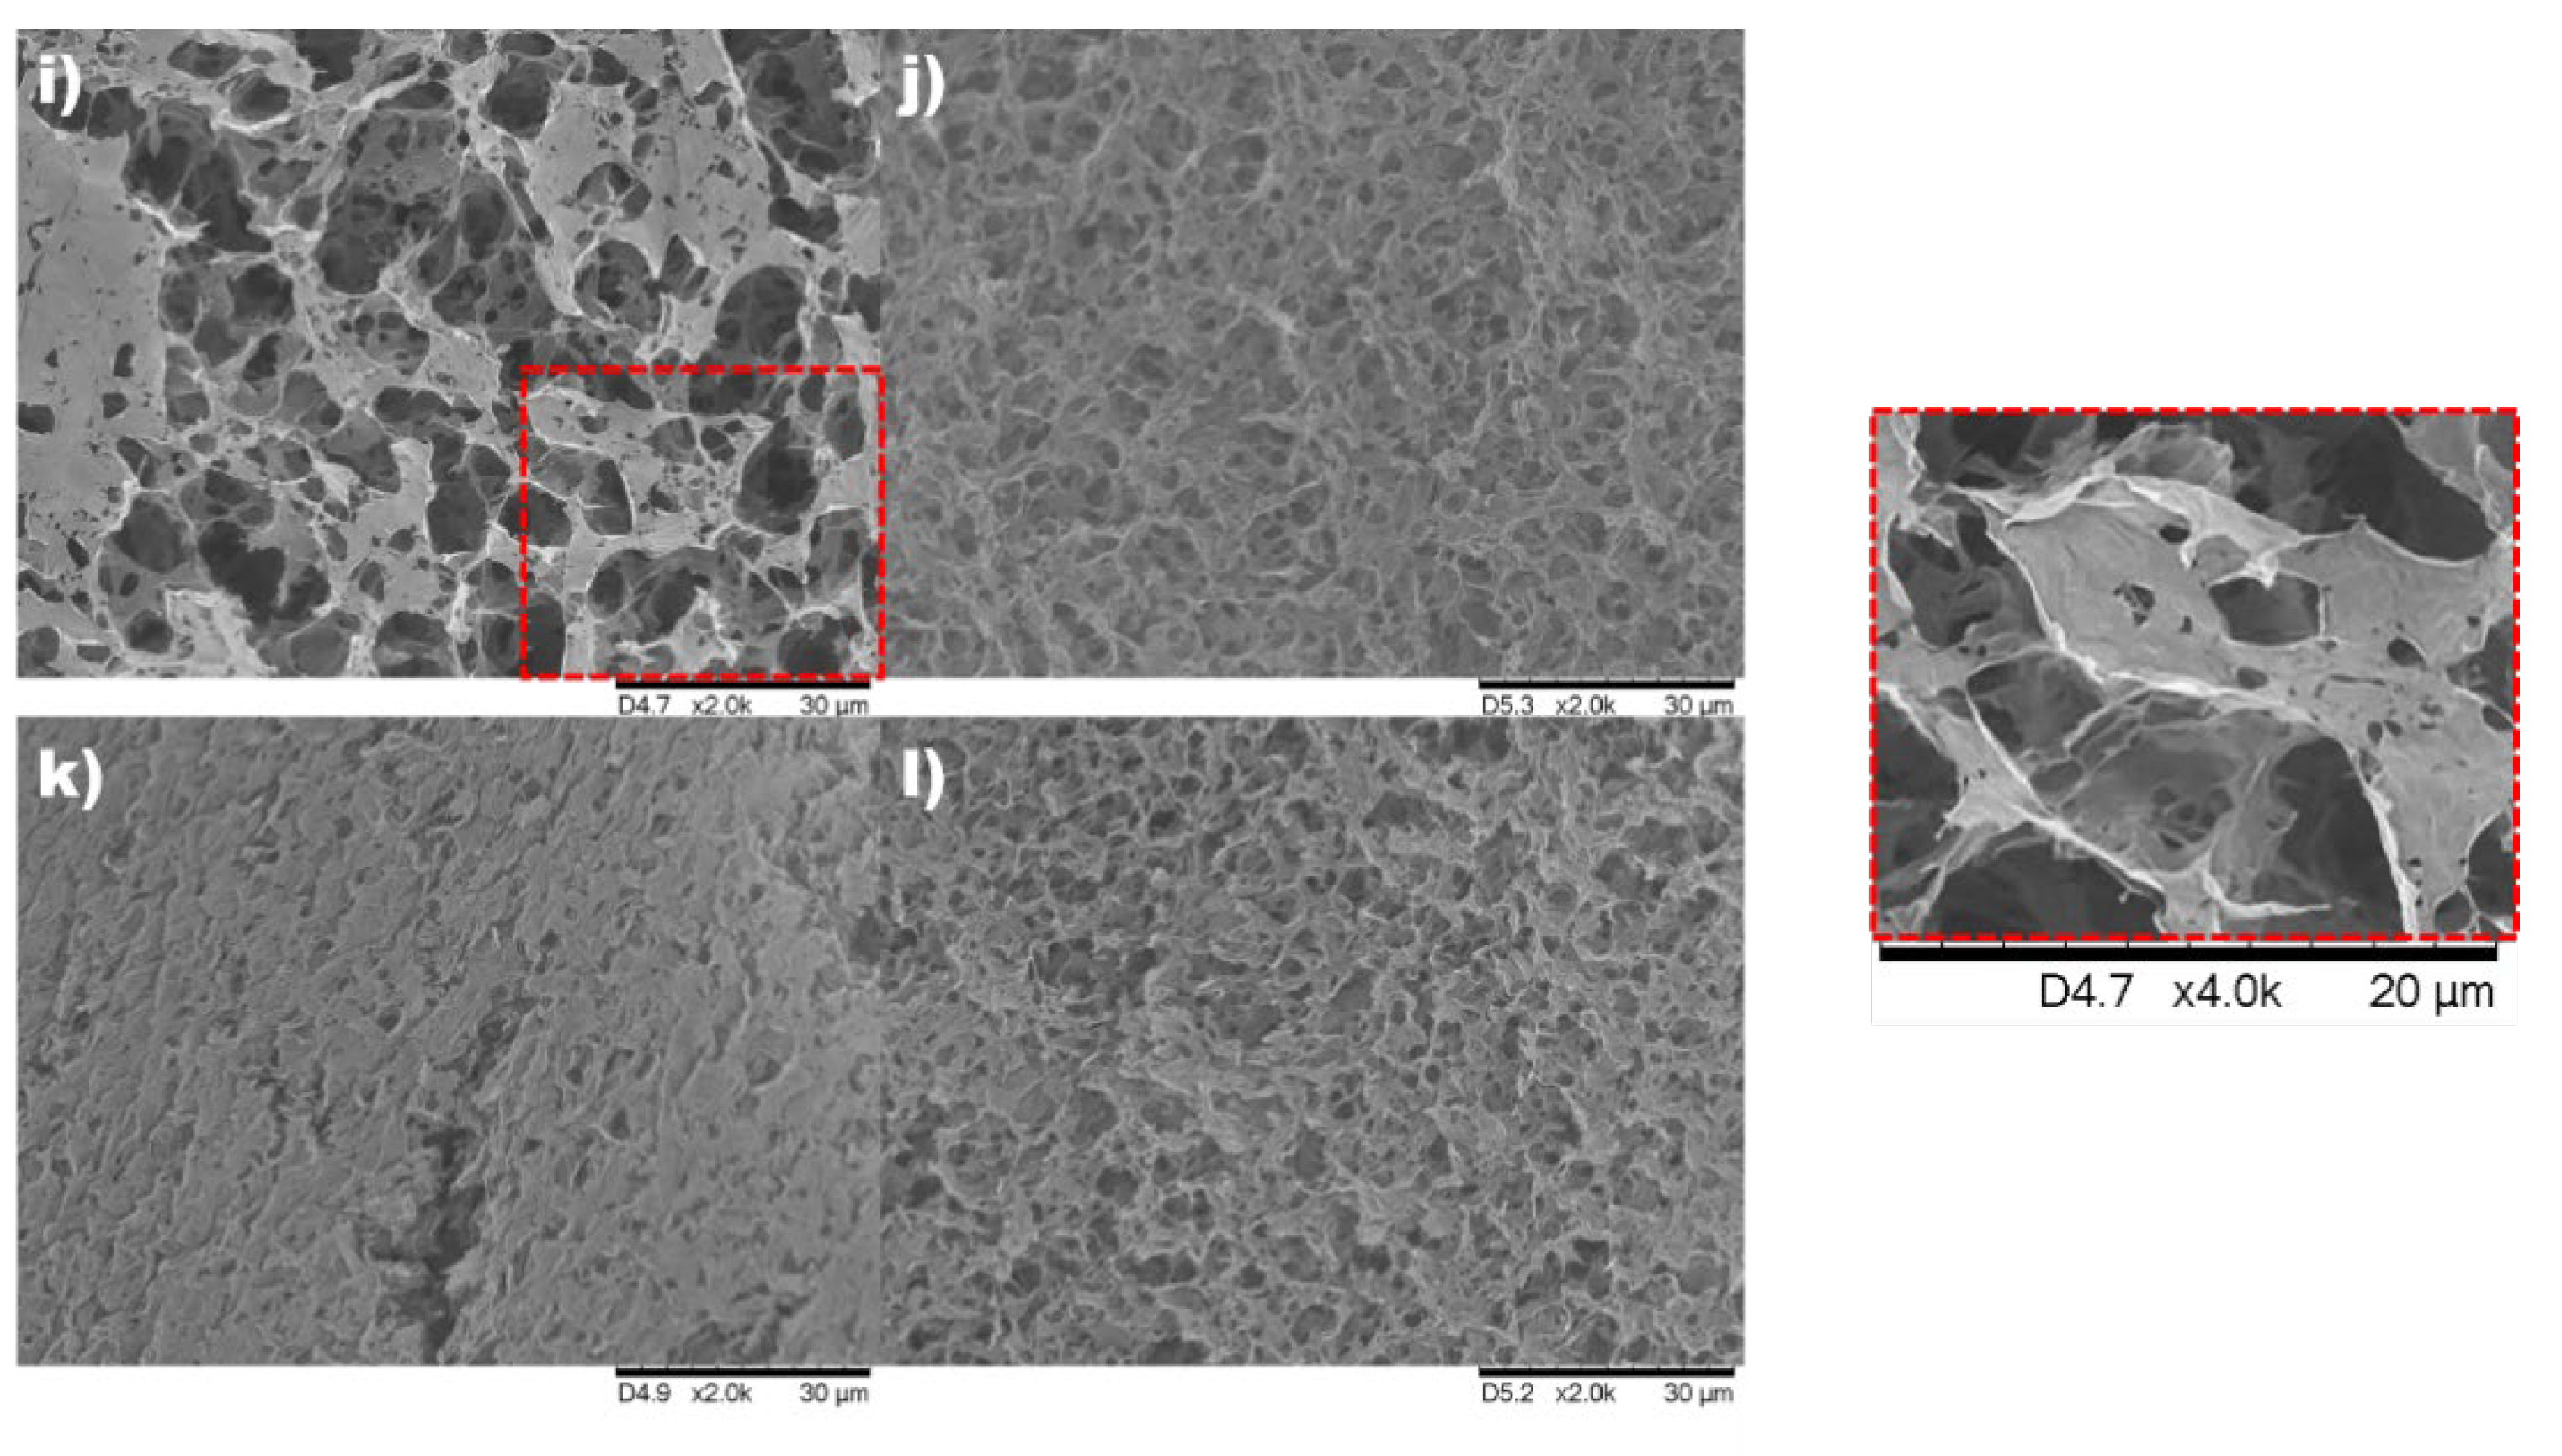
To additionally verify the modifications of the rGO monoliths with TMOS-TMON-TMOSN, we have used solid 13C-NMR.
Figure 3 shows solid 13C-NMR spectra of monolithic samples modified with TMOS, TMON and TMOSN prepared at 60 °C and with 0.5 analogy of AsA. As expected, for monolithic reduced graphene oxide materials [9], many GO groups are eliminated during the reduction process (temperature and AsA). The main peak is attributed to sp2 of the graphene lattice, around 120–130 ppm. Some bands attributed to the rGO are displayed in Figure 3 [9,38]. These bands are found at around 190 ppm (C=O), 164 ppm (O=C-O), 95 ppm (O-C-O), and 69/58 ppm (C-OH/C-O-C epoxy). After the modification reactions, the bands that show actual modification and are common to all samples are found 10–50 ppm attributed to -CH3 and -CH2. Especially samples with TMOSN that have more of these groups showed a more intense band (Figure 3). Moreover, TMON modified sample displays another band attributed to –N-C(O)-NH2;163 ppm. Similarly, TMOSN modified monolith presents two more bands; one at 117 ppm (-CN) [39] and one at 223 ppm (-SC(S)-S) [40]. In the case of TMOSN, a band characteristic of the -SC(S)-S is clearly shown, and in the case of -CN, a broader band in this area is attributed not only to sp2 but also to the -CN, is observed.

3.2. SEM-EDX

To evaluate the structures in terms of structure properties, SEM characterization was performed. SEM images reveal differences among the samples based on how the reduction occurs among the graphene sheets. Figure 4 shows SEM images of the modified samples (the blank, unmodified samples and smaller magnifications of the modified ones can be found in Figure S2).
SEM images clearly show that the use of different modifying reagents alters the 3D structure of the final monolith. Different reagents result in different heteroatoms in the final structure, such as S, N, O, and Si. These heteroatoms can change the physicochemical properties of the material but also, and most importantly, the way graphene sheets are assembled during the reduction process. 3D materials prepared with the same amount of AsA and at the same temperature can give different 3D monoliths because of the heteroatoms present and the steric effects of these molecules among the graphene sheets. [41,42]. Structures obtained at 60 °C seem more porous than those prepared at 90 °C.
Nevertheless, this should be further evaluated through porosimetric measurements. Samples prepared at 90 °C and 0.5 AsA showed a more porous effect. For instance, TMON samples were more porous than TMOSN, which was less porous, and TMOS, more compact. The hydrophilicity of each component could play a role in the self-assembly of the sheets during reduction since some of the components can lead to more hydrophilic graphene that can result in a looser assembly. Similarly, TMON and TMOS samples prepared at 60 °C and 0.5 AsA displayed a quite similar morphology. On the contrary, TMOSN presented a quite porous morphology with defects on the sheets, as seen in the inlet of higher magnification from the SEM image in Figure 4i.
The differences in morphology are SEM derived from both temperature and AsA quantity and the different compounds used for modification. The way they are stacking shows other aggregation degrees and hydrophobic interactions during the self-assembly of the modified graphene oxide platelets. For TMOS and TMON, the images are pretty similar, especially for temperatures at 60 °C. At 90 °C, the monolith modified with TMOS looks more compact with a low quantity of AsA and a little bit more porous with a higher reduction degree (due to more AsA). In the case of TMON, the results are similar, showing a compact structure with less external porosity. The results for monoliths with TMOSN are pretty different, leading to porous monoliths, especially for 60 °C. In TMOSN, the more steric molecule probably helped create a more porous monolith (based on SEM images). The more hydrophobic TMOSN should have created a more porous structure since the modified platelets supposedly were more difficult to self-assemble due to their hydrophobic nature. In addition, with the other two compounds were more hydrophilic (especially TMON), and they were aggregating easier during the reduction of the chemical groups of the GO, leading to more compact structures. Nevertheless, the porosity results will reveal the real values of porosity. Interestingly, EDX measurements (Table 2) showed variations in percentages of S, Si, O, and N elements. The first three components have different analogies for S, Si, and O elements. TMOS has 1 Si, 3 O, and 1 S, TMON has 1 Si, 4 O, and 2 N. In addition, TMOSN has 1 Si, 3 O, 1 N, and 3 S. EDX results show that compared to the blank group, the group modified with TMOS has an increase in O (14%) as well as in percentages of Si and S. Adjusting the percentages of the elements with their molecular weights Si is 0.2 and S 0.18. An analogy of almost 1:1 in moles, similar to the initial structure. Here, it has to be noted that blank samples do not have Si and have a low percentage of S (less than 0.1%) and N (6.93% on average) due to the preparation method of the graphene. The group of samples modified with TMON has almost no S present (0.01–0.02%), while the percentage of O is increased 24% compared to the initial blank samples (die to 4 O atoms present in the structure).
Moreover, Si is increased, while N is increased 9% compared to the blank samples. The analogy of moles for N vs. Si is 2 for the structure, and from EDX results is 6, meaning that the metaphor of moles is increased three times. This is explained since N is an element that has been present in the structure of graphene since the beginning of the preparation, but also due to the ambient N, which is always present. Finally, for the group of samples modified with TMOSN, O is slightly increased, but N showed a decrease. Most importantly, there is an increase in S (8.6%) and Si (2.92%). Interestingly, those groups of samples display a higher percentage of S (3), especially when compared to samples with TMOS.

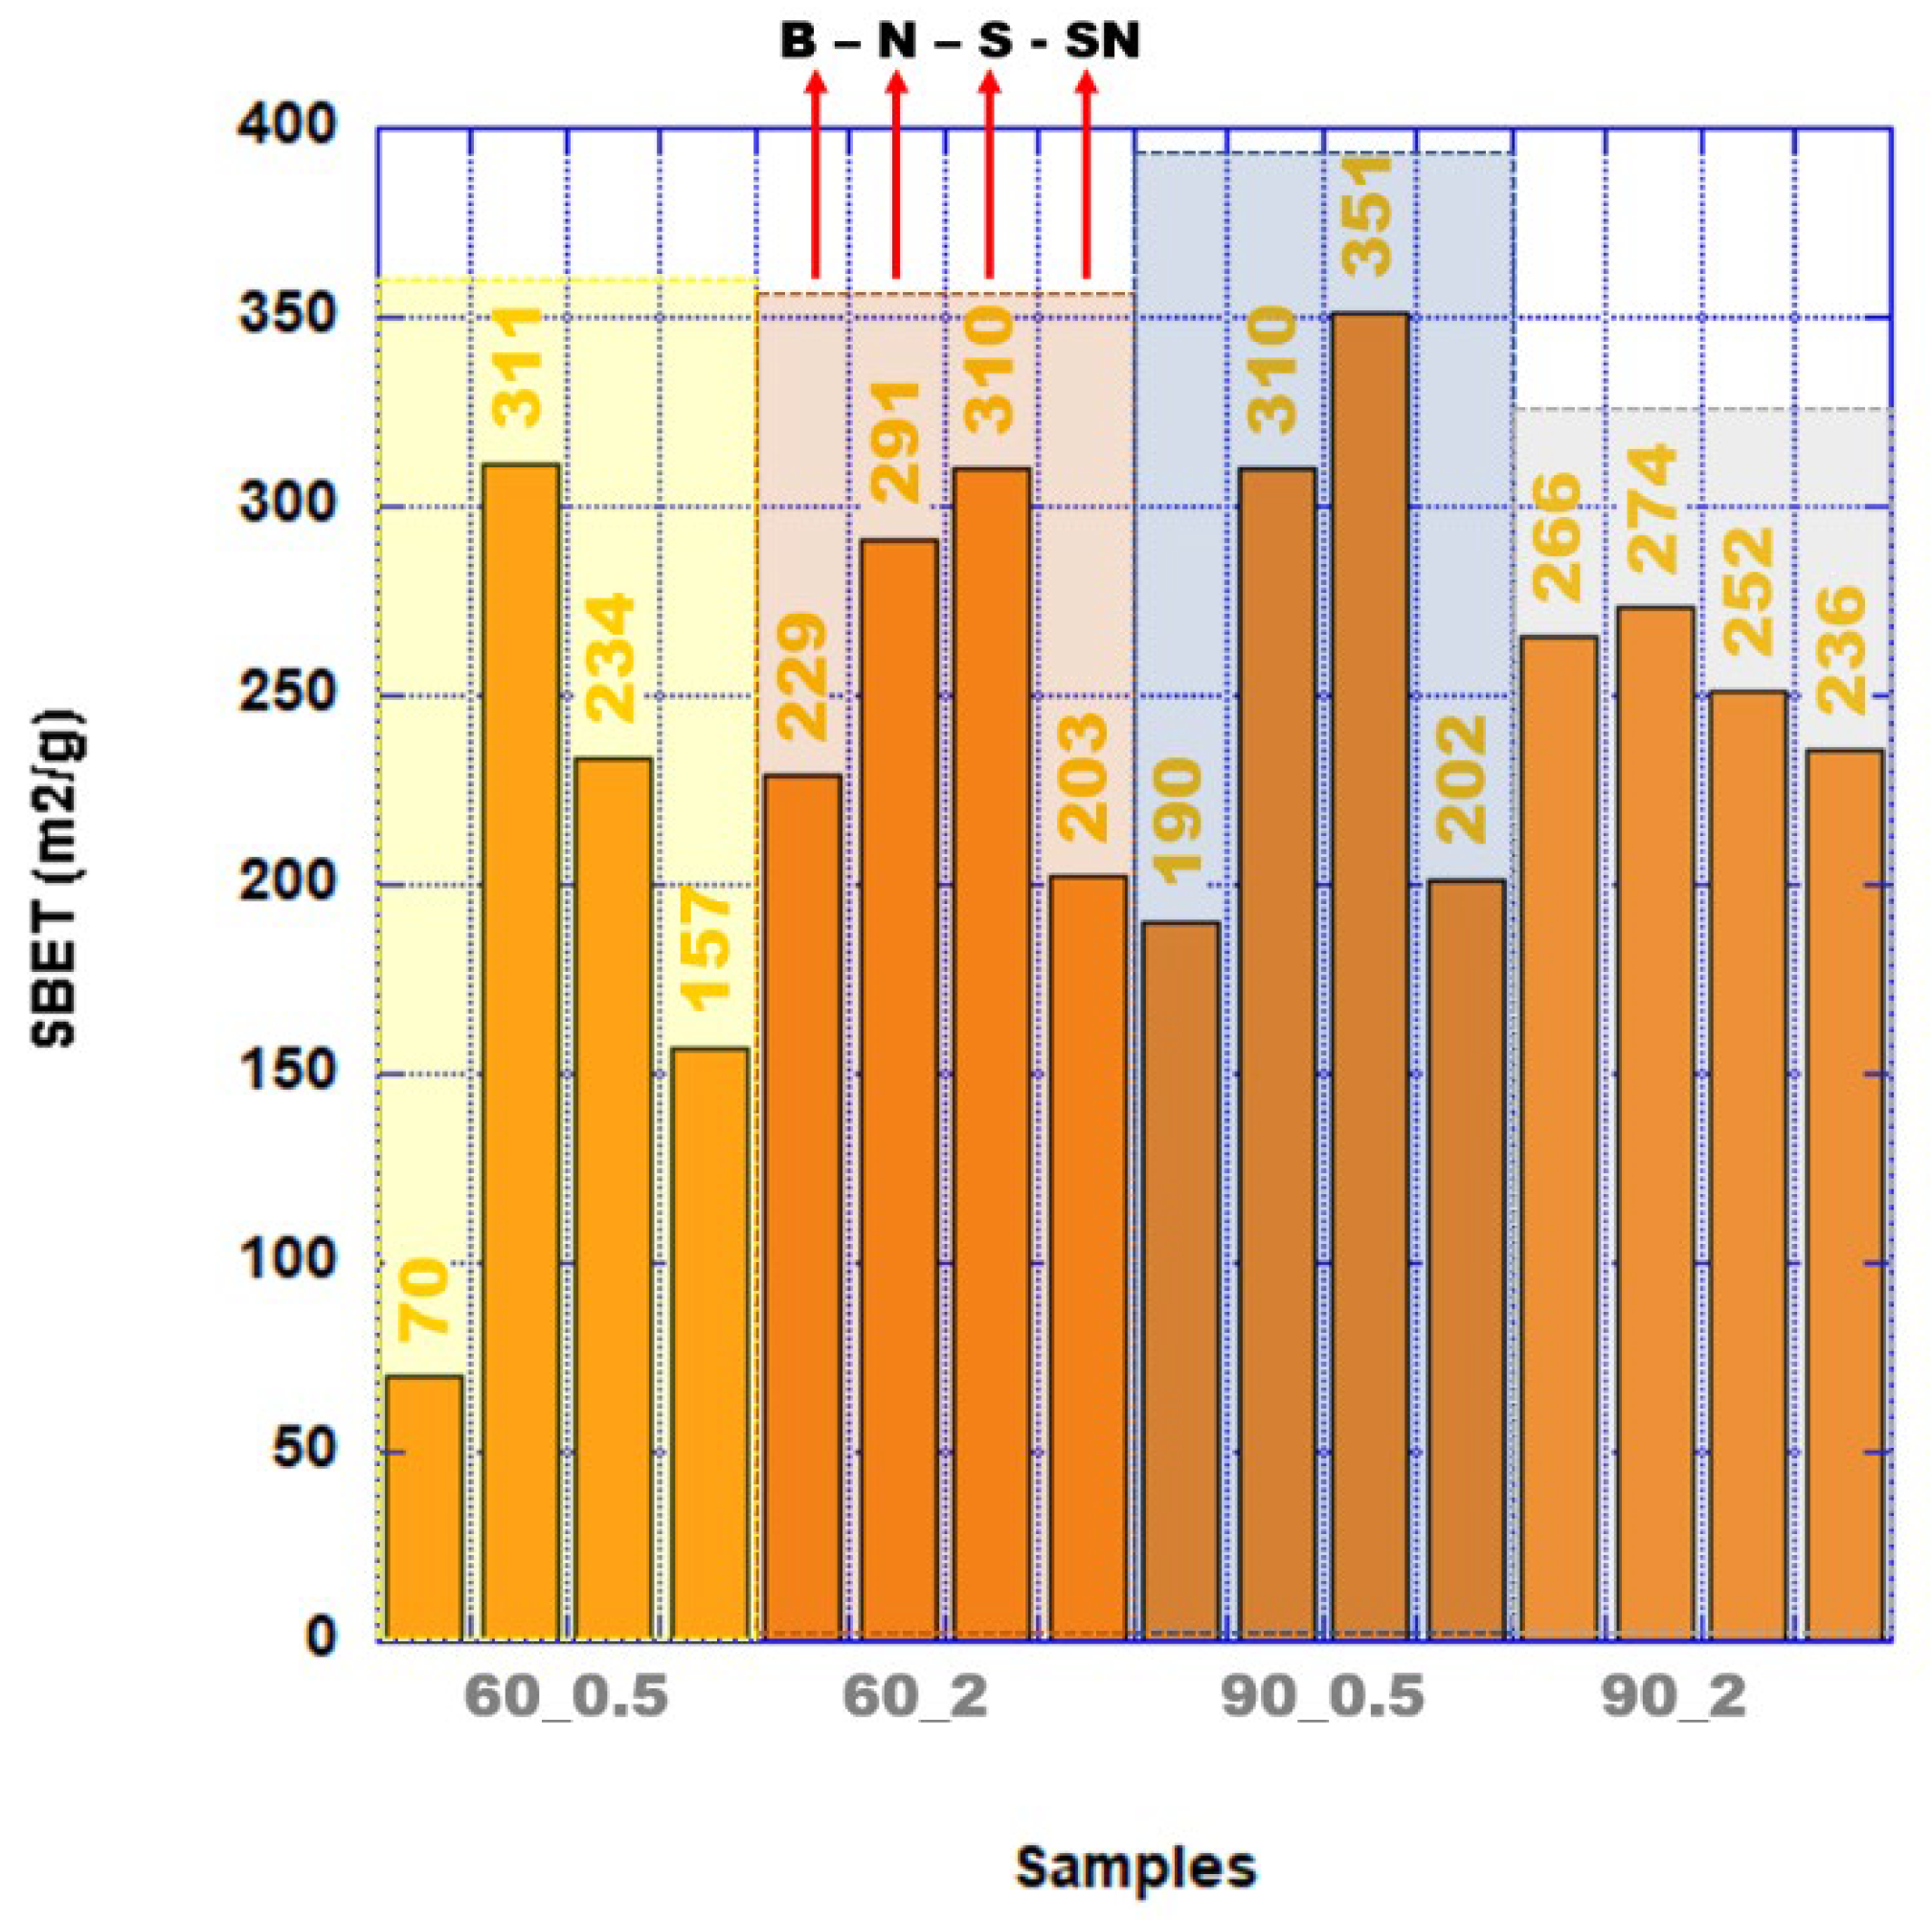
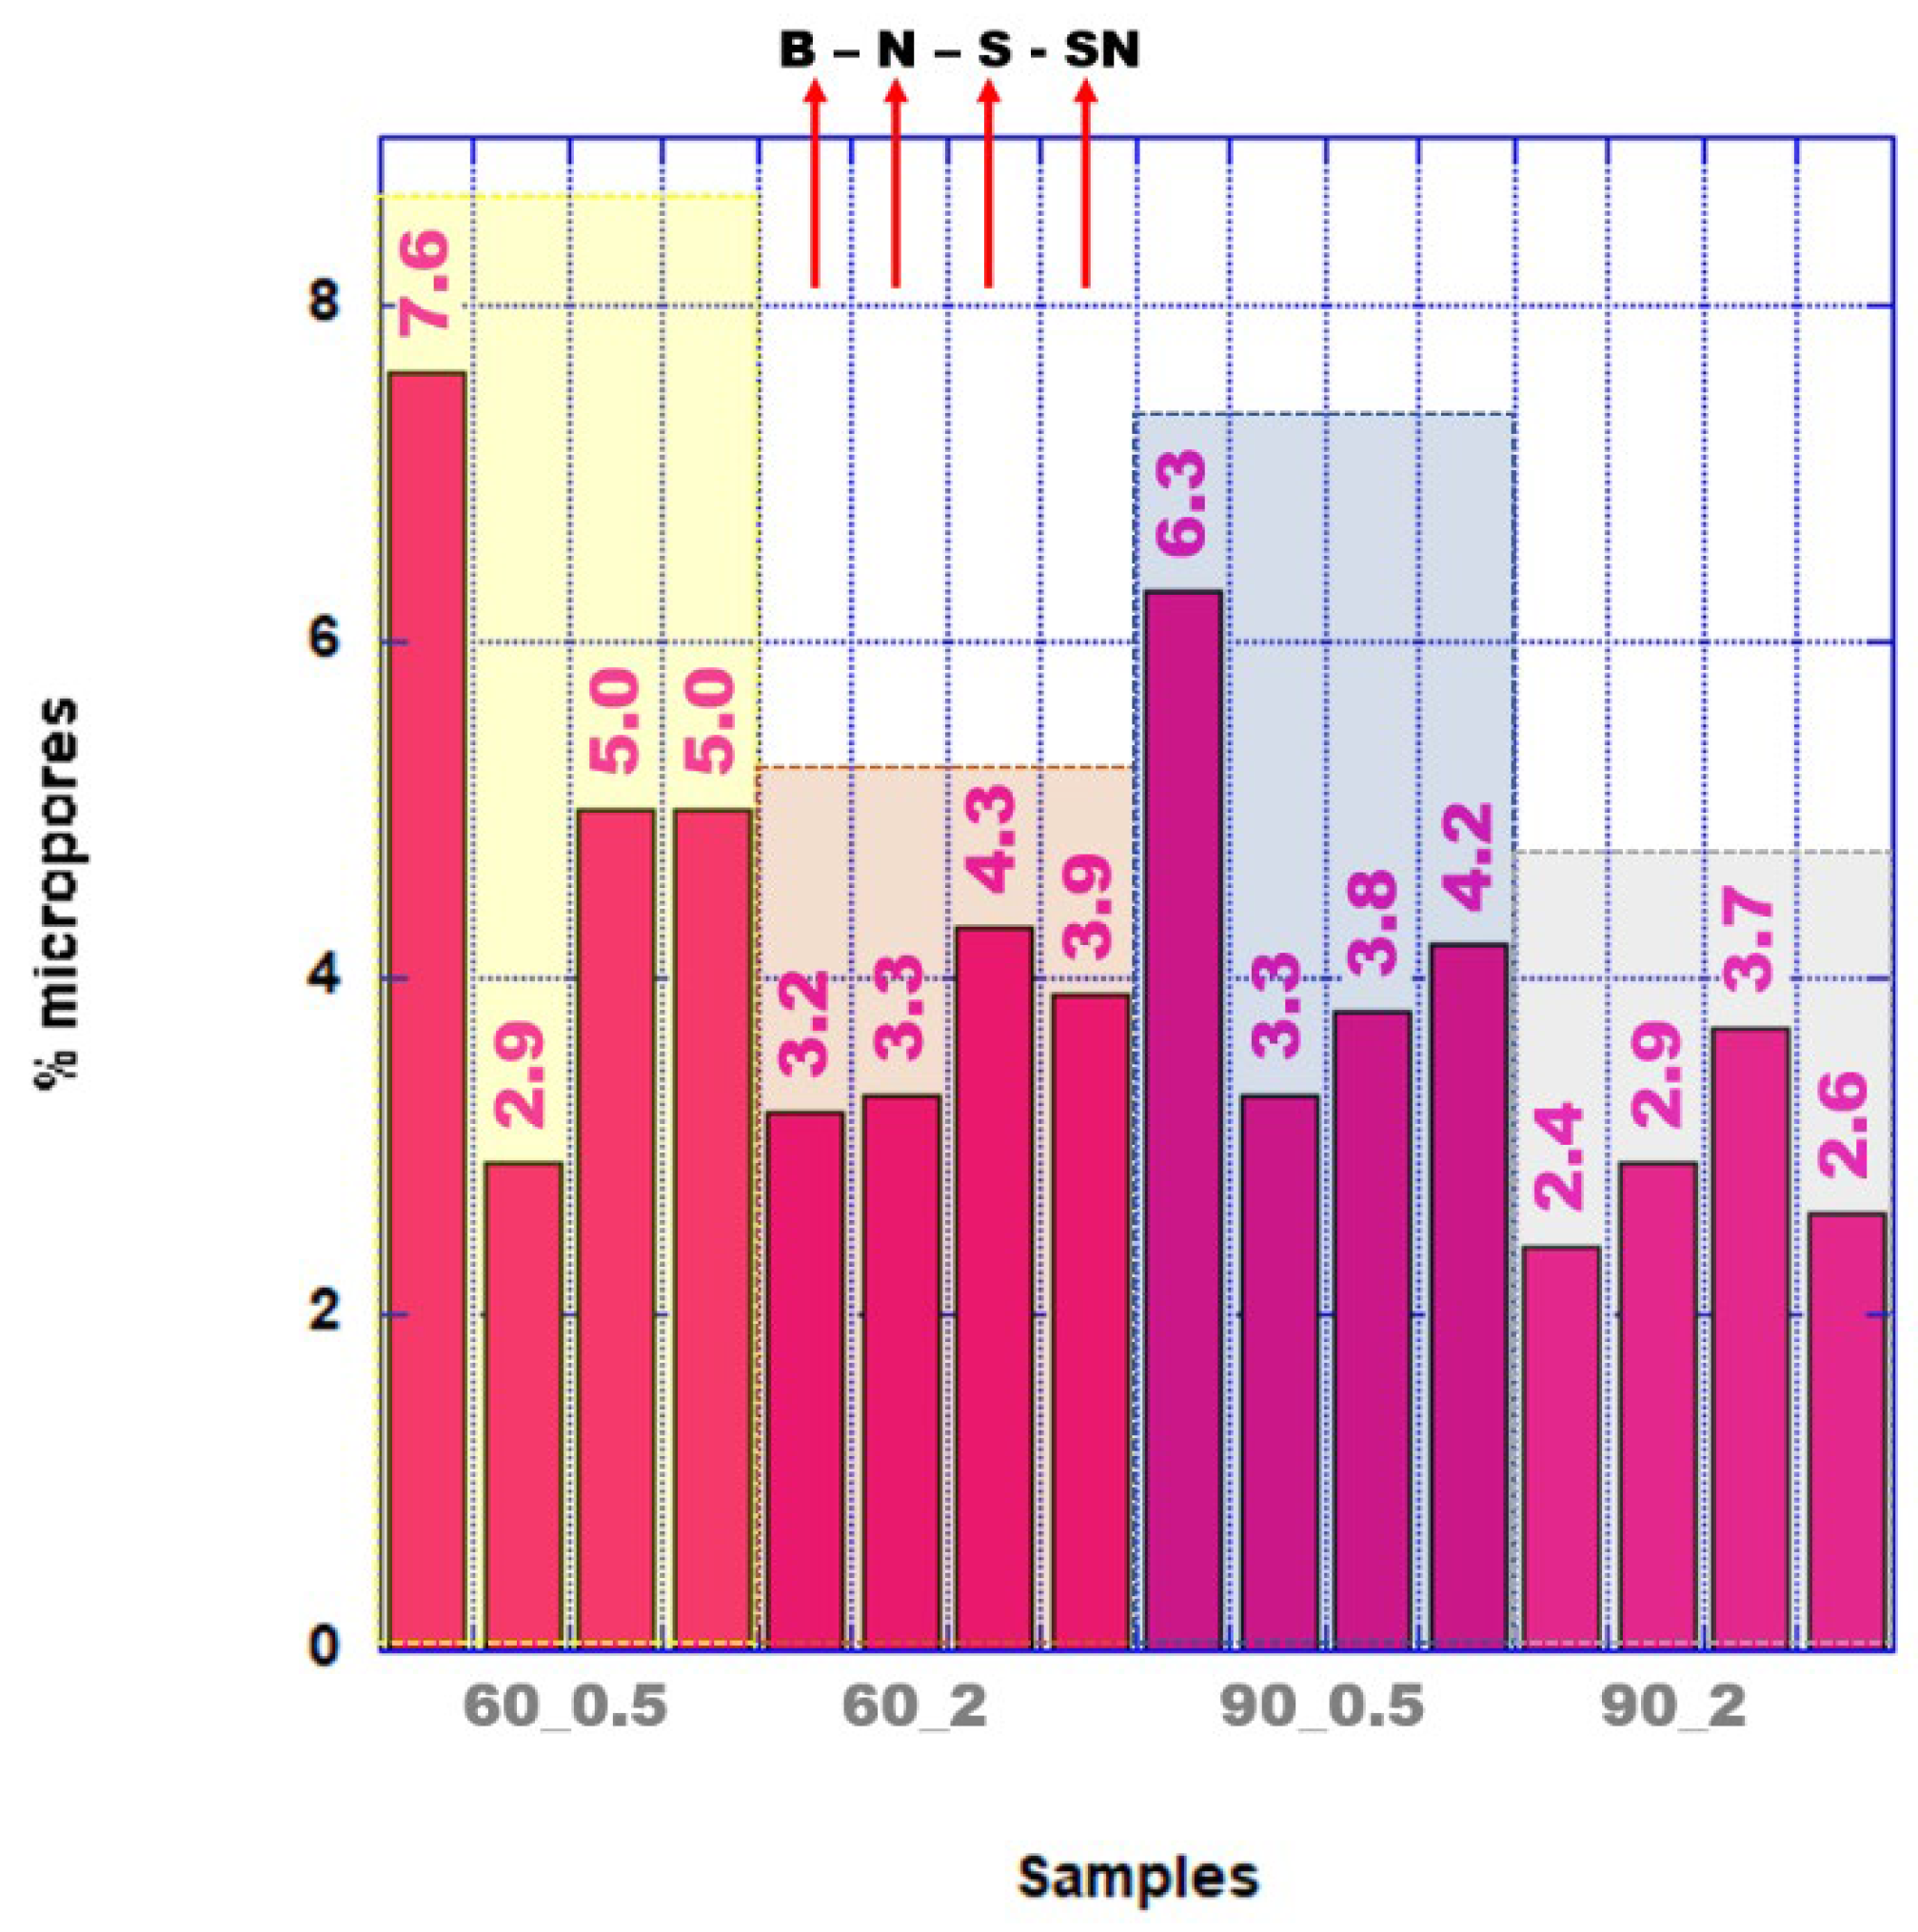
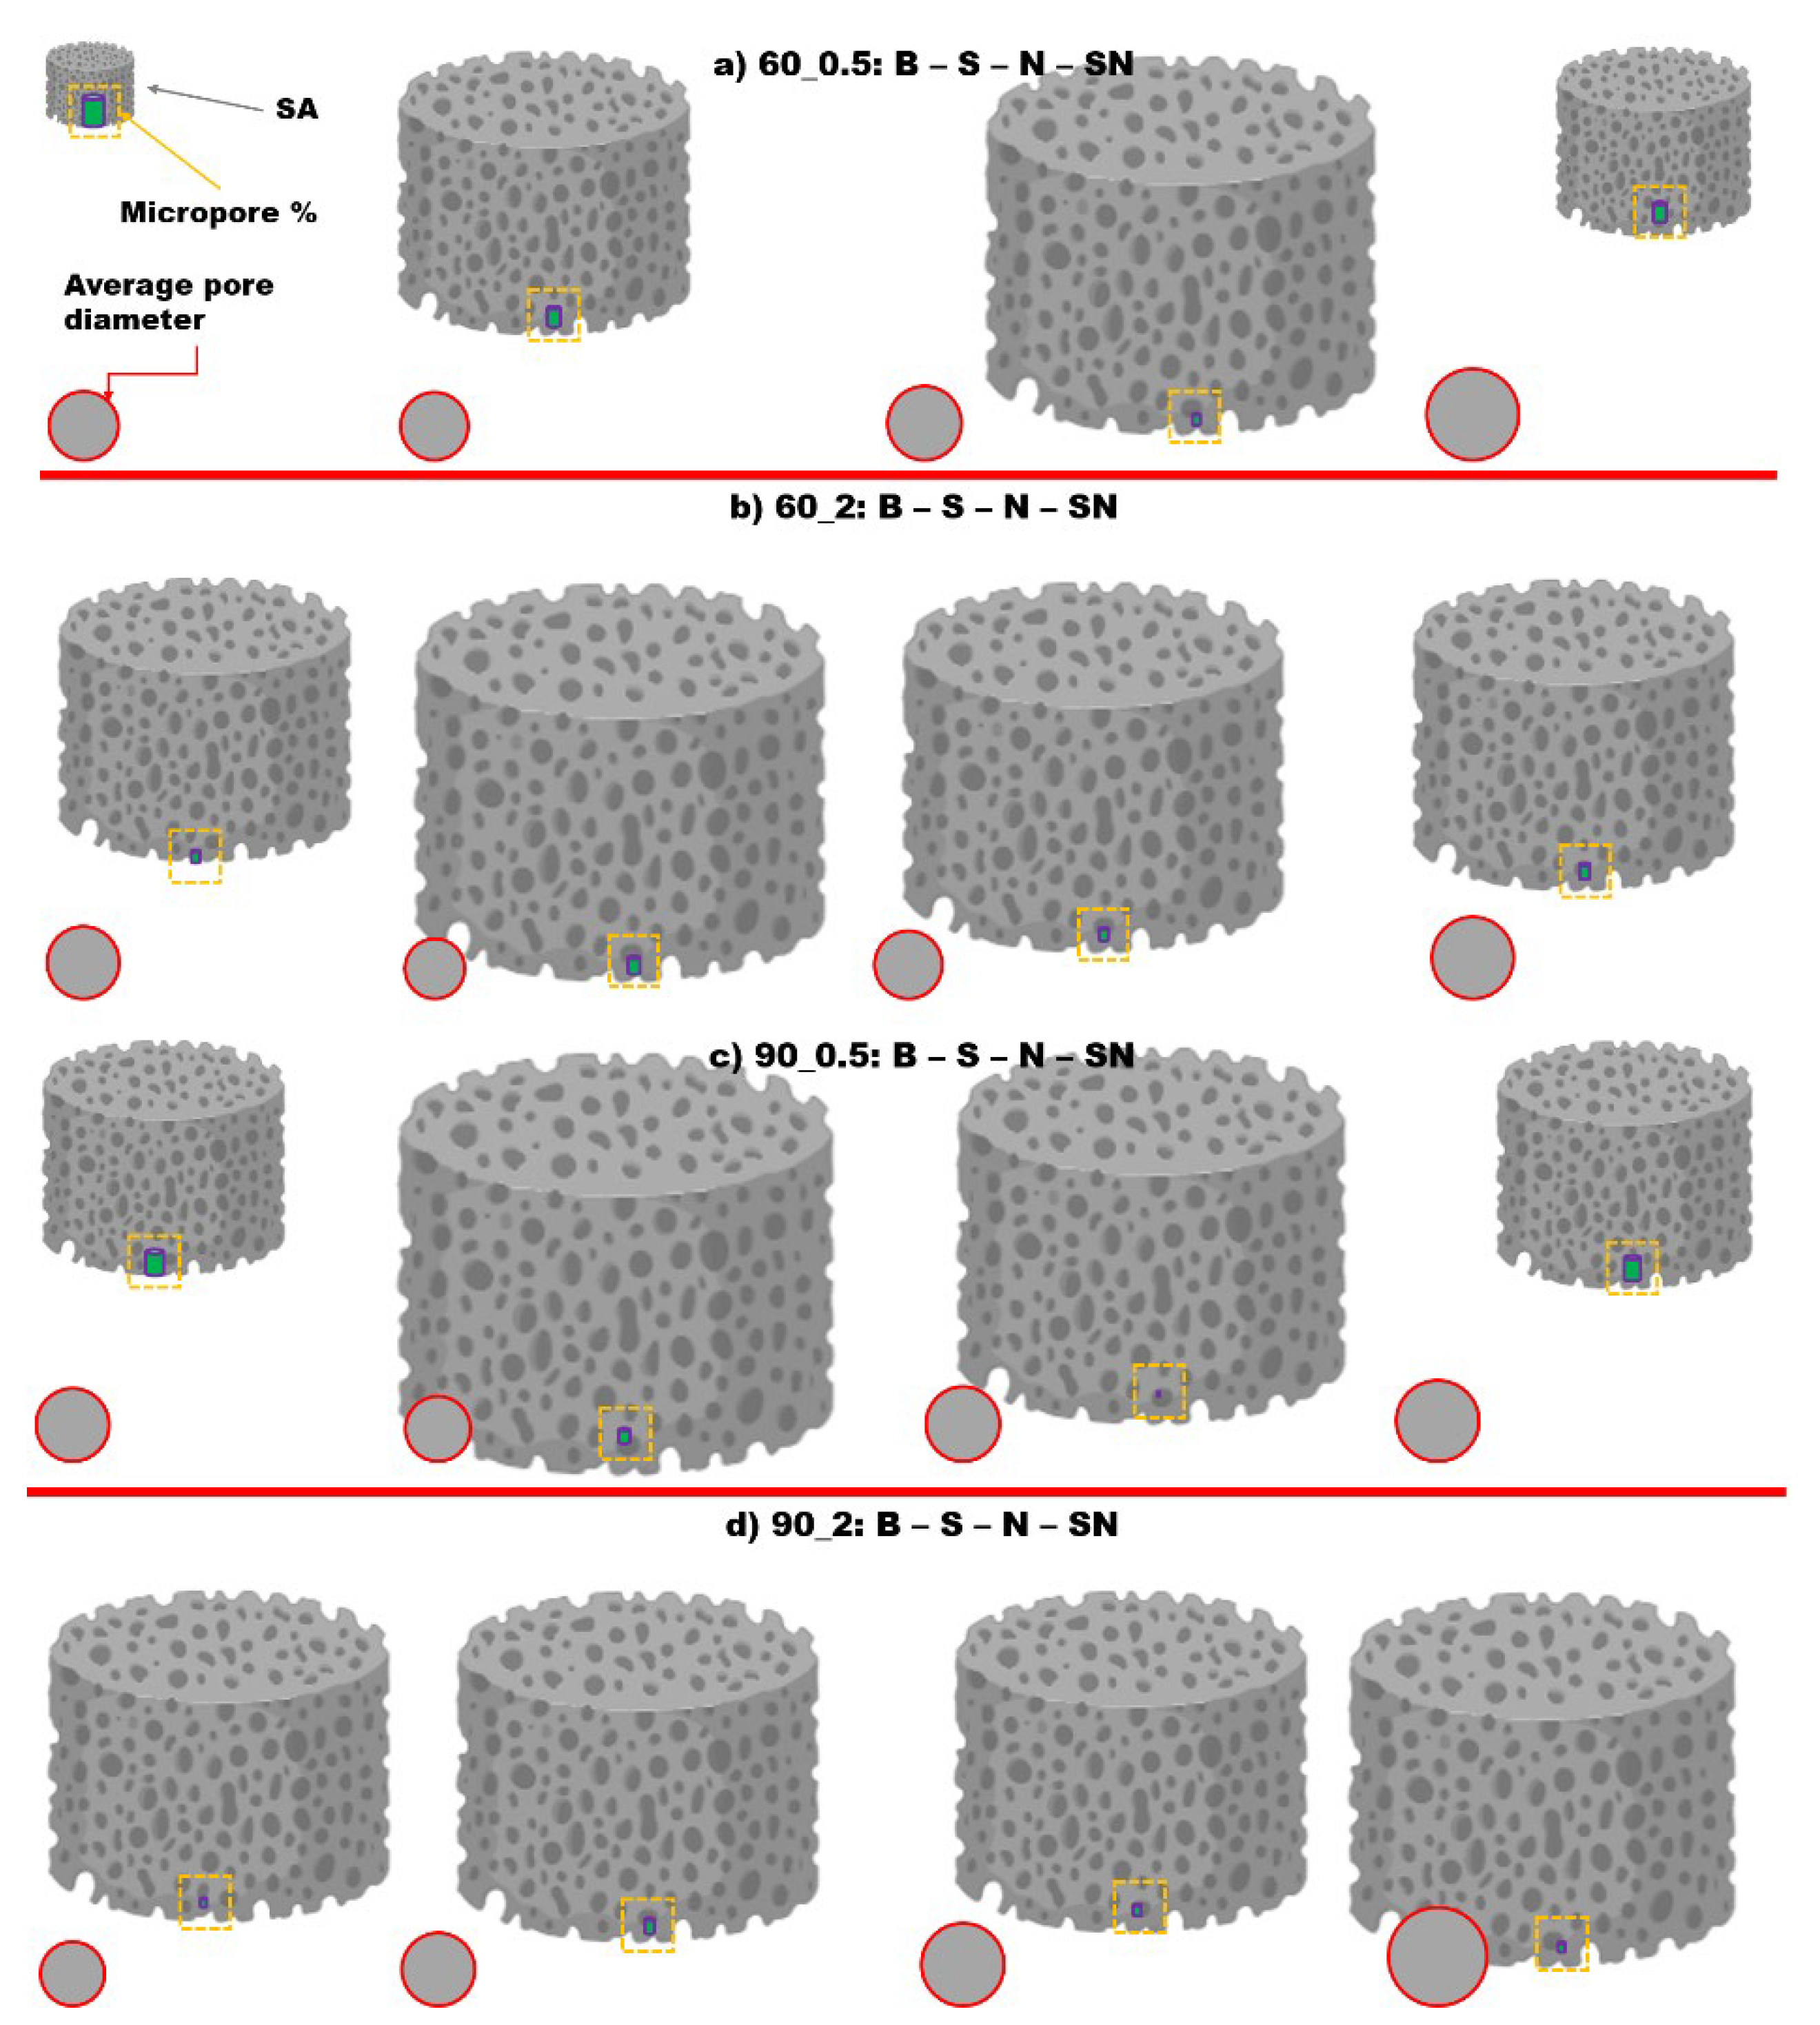
3.3. Porosity Results

We expected that different modifications would result in different rGO’s monolithic structures, meaning differences in characteristics concerning the porosity and specific area.
Porosity results show interesting changes in the specific area (SA) as measured through BET, the total volume of pores, percentage of micropores, and average pore size. Systems modified with different components, different analogies of AsA, and changing the temperature of monolith preparation can significantly affect the parameters mentioned above [8,9].
Figure 5 and Table 3 reveal increment of SA for 9/12 modified samples compared with the initial ones. In system 60_0.5, all three modified monoliths showed higher SA with an average increase of around 237% compared with their corresponding blank. Similarly, in system 60_2, two out of three modified monoliths presented a 17% increase in SA compared with their corresponding blank sample. In system 90_0.5, all three modified monoliths had higher SA with an average increase of 52%. Finally, in the last system, 90_2, only one sample resulted in a higher SA (modified with TMON) while the general trend was a decrease of 5%. When we compared SAs based on the modification component, we observed that the average SA is 297 m2/g, 287 m2/g, 200 m2/g, and 189 m2/g for TMON, TMOS, TMOSN, and blank modified samples, respectively; therefore, all modifications led to an average increase of 57% (TMON Vs. Blank), 52% (TMOS Vs. Blank), and 6% (TMOSN Vs. Blank). Resulted SA values verified our previous observation by SEM imaging that different modifications affected the porosity of the monoliths. The biggest alterations in SA values were found for samples modified with TMON at low AsA quantity and 60 °C. Increment of SA value changes of the systems was as follows: 60_0.5 > 90_0.5 ~ 60_2 > 90_2.
Furthermore, the total pore volume and the different micropores volume and analogies showed changes, depending on the different modifications and preparation parameters [43,44]. The total pore volume as long as the different volumes for mesopores and micropores are shown in Table 3. In 60_0.5, the modified samples had increased pore volumes compared with the blank; displayed 5.4, 3.3, and 3 times more for TMON, TMOS, and TMOSN, respectively. An increment of the quantity of AsA (60_2) at the same temperature showed no significant effect on the whole pore volume. Just TMON modified monoliths displayed a small increment of the total pore volume. Similar behavior was observed for the samples modified at 90 °C. In the case where AsA is in less analogy (0.5), the total pore volume compared to the blank is increased 2.4 times (TMON), 2.1 times (TMOS), and 1.5 times (TMOSN). In addition, when AsA is increased to an analogy of 2, the total pore volume remains almost the same (1.1 times for TMON and TMOSN) and even less in just one case (TMOS). The results mentioned above regarding the range of the pore volume are shown in Figures S3 and S4.
The whole range of pores in the cases where AsA is less, the cumulative pore volume is always higher for the modified samples at both temperatures (Figures S3 and S4). Interestingly, when AsA is at higher analogy (2), the changes are not so evident, and the pore range in terms of cumulative volume is quite similar. Based on these results, one crucial point that should be mentioned is that in the system 90_2 for all modified samples after 1000 Å, a peak is detected, meaning that macropores start forming at these experimental parameters. In addition, from Figure 6 and Table 3 concerning the percentage of the micropores, more of them are formed at lower temperatures [45], and any modified sample has a higher percentage of micropores than the blank sample (system 60_0.5) with less AsA. When the system is at the same temperature and higher AsA (60_2), higher percentages of micropores are observed for the cases of TMOS and TMOSN. The same behavior is observed for all modified samples at 90 °C. At lower AsA concentrations, all modified samples displayed fewer micropores and smaller pores than the system at 60 °C. In the case of sample 90_2, the percentage of micropores for the modified samples is slightly higher than the blank one.
Finally, the resulted porosity (Table 3) is verified from the dp changes of the modified samples. The only system that shows the most significant change in average porous diameter is the 90_2. All modified samples showed a bigger diameter with an average of 163 Å increase, which is 31% compared to the blank (124 Å). For the rest of the systems, a slight increase is found except for rGO with TMOS. In the case of 60_2, on average, there is a decrease in the average porous diameter from 141 Å to 136 Å from two modified samples, and the only sample with TMOSN shows a little bit bigger diameter. This is in accordance with the increased microporous percentage for these systems (as observed before). The system at 90_0.5 has a slight increase (140 Å to 141 Å) only because of the two modified samples except for TMOS. In conclusion, based on modification, the highest increase was observed for samples with TMOSN 27% (171 Å compared to 135 Å for the blanks), then for the TMON 7% (145 Å vs. 135 Å) and the samples with TMPOS, a decrease in the dp was observed −4% (129 Å vs. 135 Å). In Figure 7, an illustration of all monolithic samples can be seen. This illustration is based on the SA, the percentage of micropores compared to the whole volume of the pores, and the average pore diameter. The differences among all the values for the blank sample can be seen compared with the modified ones, especially for the SA and the percentage of the micropores compared to the total pore volume. All analogous illustrations for all monoliths for SA and micropore percentage are derived from the initial values of the sample rGO60_0.5.
The formation of the porous network is a pretty complicated procedure that is not affected only by AsA quantity and temperature of reduction. It is true that AsA and temperature are playing an important role, but not the only one. The hierarchical formation of the monoliths indicates that self-assembly processes can be in different levels of formation in the different sizes of pores [9]. For sure, the presence of heteroatoms and the other compounds for functionalization play an essential role. Oxygen groups from GO are eliminating during this process. Still, functional groups of the compounds anchored to GO are altering how self-assembly is happening due to steric and hydrophobic changes. In general, a higher temperature corresponds to faster reduction processes, which are favorable to produce a well-developed porous morphology and high SA [9]. In this study, increasing temperature for the same quantity of AsA shows different results for SA, total pore volume, and micropore volume comparing blank materials with the functionalized ones. This gives a picture of the strong participation of the heteroatoms in the formation of the porous structure and the SA values. For blank materials, it is true that for both AsA concentrations, SA and total pore volume follow the trend mentioned above. When passing to the system with TMOS, this trend is happening only for the lower analogy of AsA. For the TMON system, this occurs only for the lower quantity of AsA and only for the total pore volume. In the case of TMOSN, it follows the same trend as blank materials. This led us to conclude that among all three systems, the one closer to blank is TMOSN, then TMOS and TMON are less.
Moreover, it seems that AsA is affecting more SA than porosity, in addition to temperature. A higher AsA amount significantly reduces the amount of oxygen functional groups. Under such conditions, the platelets are more wrinkled and more aggregated, becoming more rigid and forming fewer and larger pores. As a result, the external surface area increases [9]. Again, this is true for blank samples but is not the same for samples with heteroatoms. In the system with TMOSN is happening for TMOS only at 60 °C and TMON at neither temperature. Again, here the presence of heteroatoms affects how the platelets are forming the porous network and the magnitude of SA. The different steric hindrance and hydrophobicity of each compound are defiantly acting the way GO-modified platelets are aggregating.

3.4. CO2 Adsorption

For understanding how the functionalization has affected the physisorption of the rGO, TGA was used as a technique where the mass of CO2 was calculated for the initial mass of the monolith. In Table 4, all the obtained results are shown.
Table 4 and Figure S5 show the different adsorptions of CO2 for the different functionalized and blank rGO. High adsorption is observed for the blank sample of the rGO60_0.5 system at 25 °C and relatively more minor for the same system at 60 °C. In all cases at the higher temperature conditions, the adsorption is around 50% less. At 25 °C, the adsorption after functionalization led to substantially lower adsorptions for samples with TMON and TMOSN and approximately 15% less for the case of TMOS. Similar results were obtained when the temperature was at 60 oC, TMOS > TMOSN > TMON. For the system rGO60_2, the modification of the rGO showed better results of increased CO2 adsorption. At 25 °C out of three modifications, the ones with TMOS and TMON showed higher adsorption with an increase of +15% and +26% compared with the blank one. The higher adsorption at this temperature was for TMON > TMOS > TMOSN. At the higher temperature of 60 °C, no modified sample showed higher adsorptions than the initial, but the ones with TMOS and TMON showed the same and were close to the blank one (TMON~TMOS > TMOSN).
Furthermore, the 90 °C showed increased adsorptions but more for the composites prepared with higher AsA content. For system rGO90_0.5, no increased adsorptions were observed compared with the blank ones, similar to rGO60_0.5. For the modified samples at 25 °C of the highest adsorption was observed for TMOS samples, then for TMOSN, and last for TMON. As expected, at 60 °C, TMOS samples showed higher adsorption, followed by TMON and TMOSN samples. The last system studied (rGO90_2) is the one that showed the highest adsorptions of the modified samples when compared with their analogous blank ones. The most significant changes were observed at 25 °C for sample S90_2, which showed an increase of +83%, then was the N90_2 with a +43%, and the last sample SN90_2, which showed a decrease. In the 60 oC, the same modified samples showed higher adsorptions with +38% for S90_2 and +28% for N90_2.
Finally, interesting results are obtained when comparing the different systems in terms of modifications, temperatures, and AsA contents. The different analogy of AsA is affecting the final adsorptions [8,9]. It was found that none of the modified samples with analogy 0.5 showed higher adsorption compared to the blank analogous. On the contrary, samples with analogy 2 of AsA after modification showed higher adsorption for at least half of them (four at 25 °C and two at 60 °C). Regarding the temperature, during the preparation of the composite, it was found that at 90 °C, more modified samples showed better adsorption (two for 25 °C and two for 60 °C), whereas, for samples prepared at 60 °C, only two modified samples at 25 °C were better. Moreover, comparing the changes for each temperature of adsorption (25 °C or 60 °C), it can be seen that two of the TMOS and two of the TMON samples have better behavior at 25 °C, and while one of the TMOS and one of the TMON samples showed an increase in adsorption at 60 °C. In total, six out of twenty-four experiments of adsorption of CO2 showed higher adsorptions (25%). Moreover, a broader range of adsorptions can be seen at 25 °C: the lowest being 0.47 mmol/g and the highest 1.67 mmol/g (a gap of 1.2 mmol/g). At 60 °C, the range is less than half for the same samples, where 0.33 mmol/g is the lowest, and 0.85 mmol/g is the highest (a range of 0.52 mmol/g). It can be noted that the more successful modification is the one with TMOS and then TMON. Both components gave three and three modified samples with higher adsorptions compared to the blank one; however, samples with TMOS, when comparing the modified ones, showed higher adsorptions three times at 25 °C vs. 1 for the TMON and three times for 60 °C vs. none for the TMON. Samples with TMOS have an average of 1.03 mmol/g at 25 °C (higher from the blank ones –1.02 mmol/g) and close at 60 °C (0.57 mmol/g vs. 0.63 mmol/g). They also have higher adsorption compared with the other components of modification for both experimental temperatures. (25 °C: TMOS > TMON > TMOSN, 1.03 mmol/g–0.81 mmol/g–0.65 mmol/g and 60 °C: TMOS > TMON > TMOSN, 0.57 mmol/g–0.49 mmol/g–0.41 mmol/g). In general, the different doping of rGO materials can lead to differentiation of the CO2 adsorption and towards enhanced ones [46,47,48,49].

4. Analysis of CO2 Adsorption in Correlation to the Porosity and the Elemental Functionalities

In this section, an attempt to correlate the adsorption of CO2 measured with other parameters of the samples is analyzed. The adsorption of the gas to these materials is a complex procedure that is governed by different parameters.
As a result of the above mentioned, Table 5 and Figure 8 show the adsorption of CO2 (at 25 °C) for all samples (categorized per system of temperature and AsA content) to find possible trends and correlations. The last column of Table 5 shows general trends labeled with colors; green color represents the obtained highest adsorptions (0.94 mmol/g–1.67 mmol/g), orange color represents medium adsorption (0.68 mmol/g–0.86 mmol/g), and the red color represents low adsorption (0.47 mmol/g–0.60 mmol/g).
Here, we discuss the correlation of the obtained adsorption of CO2 values with other obtained parameters of the samples, such as porosity and elemental functionalities. The adsorption of gas in these materials is a complex procedure that depends on several parameters. The critical factor for high adsorption is based on (a) the elemental composition of these materials and (b) the porosity. This study highlights the most relevant parameters; (i) high O percentage (meaning high O functionalities), (ii) low C/(S-Si-N-O) ratio (meaning high percentages of heteroatoms), (iii) high percentage of micropores (high adsorption), (iv) possible high percentage of macropores (easy traversal of the gas towards the mesopores and micropores), (v) high SV ratio, the surface area to volume (based on the Specific area BET and total pore volume), a high SV means a high driving force to speed up thermodynamics, and (vi) dependence of the average pore size.
As revealed from Table 5 and Figure 8, it is clear that the most critical parameters for high CO2 adsorption are oxygen functionality, micropores percentage, and SV ratio; all samples with high adsorptions have relatively high all the above values. Apart from microporosity, the following important parameter that needs to be considered for high adsorptions is the O functionalities. It has been seen that these functionalities favor CO2 adsorption. Similarly, the relation of the surface to the volume was significant, calculated as ratio surface area/volume (SV). For these calculations, the specific area measured by BET and the total volume of the pores was used. A sample with high SV (more active centers for adsorption) is expected to have higher adsorption. In the case of the same volumes, the higher SV ratio shows the different shapes of the porous system that can go from sphere to ellipsoid to cylindrical. For the same shape of porous, the highest SV ratio means a slimmer and thinner porous design.
Hypothesizing samples with high O functionality (more than 23%), high microporosity percentage (more than 3.7%), and SV more than 0.345 showed the highest CO2 adsorptions in this study. The medium for these parameters is 26.71% (oxygen functionality), 5.5% (micropores), and 0.374 (SV ratio).
Concerning the other parameters that play a pretty important role in increasing CO2 adsorption, the presence of the heteroatoms is also affected. Four out of six samples with the highest adsorption show the low ratio of C/S-Si-N-O (Table 5), meaning a higher presence of heteroatoms, except for rGO90_0.5 (but in this case, no heteroatoms from functionalization exist). Another more ambiguous parameter is the percentage of macropores. It is believed that a high percentage of macropores can help the gas diffuse through the meso and then to micropores. A wide range of macropores that show high adsorption can be found, but this is also related to the micropores. Another important parameter is the average diameter of the pores, which is between 13.2 to 14.4 nm, except for sample SN60_0.5 that has 17.9 nm and has the fifth-highest adsorption. Moreover, the sample mentioned above also has one of the highest macropores percentages, which increases the average pore diameter.
Additionally, the samples that show high adsorptions are two blank ones, two modified with TMOS, one modified with TMON, and the last one with TMOSN. For the oxygen functionality, all samples follow the trend, except S90_2. In the case of ratio for the heteroatoms, the exception comes from rGO90_0.5, which does not have heteroatoms, except O. Microporosity is also a significant trend except for sample N60_0.5 that has a low percentage. In the case of macroporosity, the trend is not followed from sample S90_2. Ratio SV is high for all samples, except sample N60_0.5. Finally, the sample that is out of range for the ideal average pore diameter is the SN60_0.5.
As a general comment to these results, it can be interpreted that the most crucial parameter is the micropores percentage, the functionalities from the heteroatoms (more the oxygen for the blanks ones and then S for the ones with TMOS), and the SV ratio. For the SV ratio, it is also worth noting that it is essential for the monolith to have a high specific area and voluminous pores for adsorbing the gas, as has been shown here. The average pore diameter was found narrowed to a range between 13–14 nm (from the four samples with the highest adsorption), as can be seen at wider average pores; the general trend is dropping the adsorption capacity. Finally, the macropores parameter is considered equivocal since it has been shown that the higher percentage has high adsorption but only in some cases, mainly for the blank ones.
In the literature, similar results and correlations among porosity values and doping with heteroatoms can be found. The doping with heteroatoms can significantly alter the porous structure of the rGO [47]. The addition of heteroatoms, generally speaking, increases CO2 adsorption. The incorporation of S [46] or N [47,48] shows a beneficial result. In terms of porosity, it is found that micropores also help in the CO2 adsorption [46,47], as well as in the tiny mesopores and the specific area of the micropores [49]. Furthermore, it can be beneficial the reduction the SA and increase the CO2 capacity even with the addition of heteroatoms [49]. In this case, the uniform distribution of the heteroatoms and the synergetic effect among different heteroatoms are beneficial for the gas’s adsorption [49]. The addition of heteroatoms may reduce the SA due to change in the synthetic procedure during the preparation of the material that could also hinder the formation of micropores [49]. Nevertheless, that does not mean that CO2 is governed only from one or two parameters (micropores or doping or SA), but it has to be noted that it is a more complex procedure. Therefore, a combination of suitable values of porosity and doping can create a synergetic effect to have enhanced CO2 adsorption.

5. Conclusions

This work shows that graphene oxide can be modified with different heteroatoms based on a simple reaction with triethoxysilanes. Apart from O and Si functionalities, the various chemical compounds can offer other heteroatoms such as S from TMOS, N, and O from TMON, S, and N from TMOSN. This work showed that the different chemical compounds form monolithic structures due to different self-assembly, which led to various properties and porosity. Porosity showed that almost all modified samples increased the pore volume and the specific surface, whereas microporosity imaging showed mixed results. A combination of parameters with the different elements for each monolith led to various adsorption capacities for CO2. Adsorption of gas was measured in two different temperatures (25 °C and 60 °C), and we observed that high specific areas or voluminous pores also result in high adsorptions. It is believed that to achieve high adsorption, a combination of parameters must be in accordance. Microporosity at a high percentage and different functionalities from heteroatoms are the significant parameters that affect adsorption.
Nevertheless, the high SV ratio (a relationship between specific area and pore volume) is also essential. We showed that the monolith has area and volume for hosting the gas molecules. Another important aspect for high CO2 adsorption is the average pore diameter. Finally, the macropores percentage showed ambiguous results and should be studied in more detail.
Ideally, a sample that complies the next values could possibly show high adsorptions: (i) oxygen functionality of more than 23.0%, with a medium of 26.7%; (ii) ratio C/heteroatoms in a range of 1.28–2.07, with a medium of 1.76; (iii) micropores percentage more than 3.7%, with a medium of 5.5%; (iv) macropores percentage more than 48.0%, with a medium of 52.5%; (v) SV ratio of more than 0.345 nm−1 and a medium of 0.374 nm−1; (vi) average pore diameter 13.2–14.4 nm with a medium of 13.8 nm.

Supplementary Materials

The following are available online at https://0-www-mdpi-com.brum.beds.ac.uk/article/10.3390/app11209631/s1, Figure S1: FTIR spectra for blank sample rGO60_2, Figure S2: Blank samples: (a1) rGO60_0.5; (b1) rGO60_2; (c1) rGO90_0.5; (d1) rGO90_2. Modified ones: (a2) S60_0.5; (b2) S60_2; (c2) S90_0.5; (d2) S90_2; (a3) N60_0.5; (b3) N60_2; (c3) N90_0.5; (d3) N90_2; (a4) SN60_0.5; (b4) SN60_2; (c4) SN90_0.5; (d4) SN90_2 at magnification x500, Figure S3: Cumulative pore volume in a micro to macro range pores (Samples 60_0.5 and 60_2), Figure S4: Cumulative pore volume in a micro to macro range pores (Samples 90_0.5 and 90_2), Figure S5: Adsorption of CO2 of all samples (blank and modified ones) at two different temperatures

Author Contributions

Conceptualization, N.P.; methodology, N.P.; formal analysis, N.P., T.C.-L. and R.T.; investigation, N.P. and T.C.-L.; resources, R.T.; data curation, N.P. and T.C.-L.; writing—original draft preparation, N.P.; writing—review and editing, N.P., R.T. and T.C.-L.; project administration, N.P. and R.T.; funding acquisition, R.T. All authors have read and agreed to the published version of the manuscript.

Funding

This research was funded by Basque Government, grant number GV IT999-16.

Institutional Review Board Statement

Not applicable.

Informed Consent Statement

Not applicable.

Data Availability Statement

Data are contained within the article or supplementary material.

Conflicts of Interest

The authors declare no conflict of interest.

References

  1. Climate Change 2007—The Physical Science Basis: Working Group I Contribution to the Fourth Assessment Report of the IPCC. Available online: https://www.ipcc.ch/report/ar4/wg1/ (accessed on 14 October 2021).
  2. Climate Change. In The Physical Science Basis, Ipcc (Intergovernmental Panel on Climate Change); Chapter 10; Cambridge University Press: Cambridge, UK, 2013; pp. 916–917.
  3. Jackson, R.B.; Le Quéré, C.; Andrew, R.M.; Canadell, J.G.; Peters, G.P.; Roy, J.; Wu, L. Warning signs for stabilizing global CO2 emissions. Environ. Res. Lett. 2017, 12, 110202. [Google Scholar] [CrossRef] [Green Version]
  4. Davis, S.J.; Caldeira, K.; Matthews, H.D. Future CO2 Emissions and Climate Change from Existing Energy Infrastructure. Science 2010, 329, 1330–1333. [Google Scholar] [CrossRef] [PubMed] [Green Version]
  5. Olivier, J.G.J.; Peters, J.A.H.W. Trends in Global CO2 and Total Greenhouse Gas Emissions, 2020 Report. Available online: https://www.pbl.nl/en/publications/trends-in-global-co2-and-total-greenhouse-gas-emissions-2020-report (accessed on 14 October 2021).
  6. Miricioiu, M.G.; Zaharioiu, A.; Oancea, S.; Bucura, F.; Simona, R.M.; Filote, C.; Ionete, R.E.; Niculescu, V.-C.; Constantinescu, M. Sewage Sludge Derived Materials for CO2 Adsorption. Appl. Sci. 2021, 11, 7139. [Google Scholar] [CrossRef]
  7. Miricioiu, M.; Niculescu, V.-C.; Filote, C.; Simona, R.M.; Nechifor, G. Coal Fly Ash Derived Silica Nanomaterial for MMMs—Application in CO2/CH4 Separation. Membranes 2021, 11, 78. [Google Scholar] [CrossRef] [PubMed]
  8. Politakos, N.; Barbarin, I.; Cordero-Lanzac, T.; Gonzalez, A.; Zangi, R.; Tomovska, R. Reduced Graphene Oxide/Polymer Monolithic Materials for Selective CO2 Capture. Polymers 2020, 12, 936. [Google Scholar] [CrossRef] [PubMed] [Green Version]
  9. Politakos, N.; Barbarin, I.; Serrano Cantador, L.; Cecilia, J.A.; Mehravar, E.; Tomovska, R. Graphene-Based Monolithic Nanostructures for CO2 Capture. Ind. Eng. Chem. Res. 2020, 59, 8612–8621. [Google Scholar] [CrossRef]
  10. Yu, W.; Sisi, L.; Haiyan, Y.; Jie, L. Progress in the functional modification of graphene/graphene oxide: A review. RSC Adv. 2020, 10, 15328–15345. [Google Scholar] [CrossRef]
  11. Jovanović, S.; Holclajtner-Antunović, I.; Uskoković-Marković, S.; Bajuk-Bogdanović, D.; Pavlović, V.; Tošić, D.; Milenković, M.; Todorović Marković, B. Modification of graphene oxide surfaces with 12-molybdophosphoric acid: Structural and antibacterial study. Mater. Chem. Phys. 2018, 213, 157–167. [Google Scholar] [CrossRef]
  12. Badri, A.; Whittaker, M.R.; Zetterlund, P.B. Modification of graphene/graphene oxide with polymer brushes using controlled/living radical polymerization. J. Polym. Sci. Part A Polym. Chem. 2012, 50, 2981–2992. [Google Scholar] [CrossRef]
  13. Kuila, T.; Bose, S.; Kumar Mishra, A.; Khanra, P.; Kim, N.H.; Lee, J.H. Chemical functionalization of graphene and its applications. Prog. Mater. Sci. 2012, 57, 1061–1105. [Google Scholar] [CrossRef]
  14. Yang, A.; Li, J.; Zhang, C.; Zhang, W.; Ma, N. One-step amine modification of graphene oxide to get a green trifunctional metal-free catalyst. Appl. Surf. Sci. 2015, 346, 443–450. [Google Scholar] [CrossRef]
  15. Zhou, X.; Huang, H.; Zhu, R.; Sheng, X.; Xie, D.; Mei, Y. Facile modification of graphene oxide with Lysine for improving anti-corrosion performances of water-borne epoxy coatings. Prog. Org. Coat. 2019, 136, 105200. [Google Scholar] [CrossRef]
  16. Kang, S.M.; Park, S.; Kim, D.; Park, S.Y.; Ruoff, R.S.; Lee, H. Simultaneous Reduction and Surface Functionalization of Graphene Oxide by Mussel-Inspired Chemistry. Adv. Funct. Mater. 2011, 21, 108–112. [Google Scholar] [CrossRef]
  17. Maleki, A.; Hajizadeh, Z.; Abbasi, H. Surface modification of graphene oxide by citric acid and its application as a heterogeneous nanocatalyst in organic condensation reaction. Carbon Lett. 2018, 27, 42–49. [Google Scholar]
  18. Pruna, A.I.; Barjola, A.; Cárcel, A.C.; Alonso, B.; Giménez, E. Effect of Varying Amine Functionalities on CO2 Capture of Carboxylated Graphene Oxide-Based Cryogels. Nanomaterials 2020, 10, 1446. [Google Scholar] [CrossRef] [PubMed]
  19. An, L.; Liu, S.; Wang, L.; Wu, J.; Wu, Z.; Ma, C.; Yu, Q.; Hu, X. Novel Nitrogen-Doped Porous Carbons Derived from Graphene for Effective CO2 Capture. Ind. Eng. Chem. Res. 2019, 58, 3349–3358. [Google Scholar] [CrossRef]
  20. Iamprasertkun, P.; Krittayavathananon, A.; Sawangphruk, M. N-doped reduced graphene oxide aerogel coated on carboxyl-modified carbon fiber paper for high-performance ionic-liquid supercapacitors. Carbon 2016, 102, 455–461. [Google Scholar] [CrossRef]
  21. Pruna, A.; Cárcel, A.C.; Benedito, A.; Giménez, E. Effect of synthesis conditions on CO2 capture of ethylenediamine-modified graphene aerogels. Appl. Surf. Sci. 2019, 487, 228–235. [Google Scholar] [CrossRef]
  22. Ma, X.-X.; Dai, X.-H.; He, X.-Q. Co9S8-Modified N, S, and P Ternary-Doped 3D Graphene Aerogels as a High-Performance Electrocatalyst for Both the Oxygen Reduction Reaction and Oxygen Evolution Reaction. ACS Sustain. Chem. Eng. 2017, 11, 9848–9857. [Google Scholar] [CrossRef]
  23. Thomou, E.; Diamanti, E.K.; Enotiadis, A.; Spyrou, K.; Mitsari, E.; Boutsika, L.G.; Sapalidis, A.; Moretón Alfonsín, E.; De Luca, O.; Gournis, D.; et al. New Porous Heterostructures Based on Organo-Modified Graphene Oxide for CO2 Capture. Front. Chem. 2020, 8, 564838. [Google Scholar] [CrossRef]
  24. Yap, P.L.; Kabiri, S.; Auyoong, Y.L.; Tran, D.N.H.; Losic, D. Tuning the Multifunctional Surface Chemistry of Reduced Graphene Oxide via Combined Elemental Doping and Chemical Modifications. ACS Omega 2019, 4, 19787–19798. [Google Scholar] [CrossRef] [PubMed]
  25. Li, P.; Zeng, H.C. Hierarchical Nanocomposite by the Integration of Reduced Graphene Oxide and Amorphous Carbon with Ultrafine MgO Nanocrystallites for Enhanced CO2 Capture. Environ. Sci. Technol. 2017, 51, 12998–13007. [Google Scholar] [CrossRef] [PubMed]
  26. Khalili, D. Graphene oxide: A promising carbocatalyst for the regioselective thiocyanation of aromatic amines, phenols, anisols and enolizable ketones by hydrogen peroxide/KSCN in water. New J. Chem. 2016, 40, 2547–2553. [Google Scholar] [CrossRef]
  27. Yu, B.; Wang, X.; Xing, W.; Yang, H.; Wang, X.; Song, L.; Hu, Y.; Lo, S. Enhanced thermal and mechanical properties of functionalized graphene/thiol-ene systems by photopolymerization technology. Chem. Eng. J. 2013, 228, 318–326. [Google Scholar] [CrossRef] [Green Version]
  28. Zhou, S.; Zhou, X.; Jiang, W.; Wang, T.; Zhang, N.; Lu, Y.; Yu, L.; Yin, Z. (3-Mercaptopropyl)trimethoxysilane-Assisted Synthesis of Macro- and Mesoporous Graphene Aerogels Exhibiting Robust Superhydrophobicity and Exceptional Thermal Stability. Ind. Eng. Chem. Res. 2016, 55, 948–953. [Google Scholar] [CrossRef]
  29. Suddai, A.; Nuengmatcha, P.; Sricharoen, P.; Limchoowong, N.; Chanthai, S. Feasibility of hard acid–base affinity for the pronounced adsorption capacity of manganese(II) using amino-functionalized graphene oxide. RSC Adv. 2018, 8, 4162–4171. [Google Scholar] [CrossRef] [Green Version]
  30. Zhang, G.; Ma, J.; Wang, J.; Li, Y.; Zhang, G.; Zhang, F.; Fan, X. Lipase Immobilized on Graphene Oxide as Reusable Biocatalyst. Ind. Eng. Chem. Res. 2014, 53, 19878–19883. [Google Scholar] [CrossRef]
  31. Salehi, Z.; Ghahfarokhi, H.H.; Kodadadi, A.A.; Rahimnia, R. Thiol and urea functionalized magnetic nanoparticles with highly enhanced loading capacity and thermal stability for lipase in transesterification. J. Ind. Eng. Chem. 2016, 35, 224–230. [Google Scholar] [CrossRef] [Green Version]
  32. Shi, L.; Wang, L.; Chen, J.; Chen, J.; Ren, L.; Shi, X.; Wang, Y. Modifying graphene oxide with short peptide via click chemistry for biomedical applications. Appl. Mater. Today 2016, 5, 111–117. [Google Scholar] [CrossRef]
  33. Najafi-Shoa, S.; Roghani-Mamaqani, H.; Salami-Kalajahi, M.; Azimi, R.; Gholipour-Mahmoudalilou, M. Incorporation of epoxy resin and carbon nanotube into silica/siloxane network for improving thermal properties. J. Mater. Sci. 2016, 51, 9057–9073. [Google Scholar] [CrossRef]
  34. Bagkar, N.; Ganguly, R.; Choudhury, S.; Hassan, P.A.; Sawant, S.; Yakhmi, J.V. Synthesis of surfactant encapsulated nickel hexacyanoferrate nanoparticles and deposition of their Langmuir–Blodgett film. J. Mater. Chem. 2004, 14, 1430–1436. [Google Scholar] [CrossRef]
  35. Ran, R.; Yu, Y.; Wan, T. Photoinitiated RAFT polymerization in the presence of trithiocarbonate. J. Appl. Polym. Sci. 2007, 105, 398–404. [Google Scholar] [CrossRef]
  36. Yin, Z.-G.; Sun, W.; Hu, Y.-H.; Guan, Q.-J.; Zhang, C.-H.; Gao, Y.-S.; Zhai, J.-H. Depressing behaviors and mechanism of disodium bis (carboxymethyl) trithiocarbonate on separation of chalcopyrite and molybdenite. Trans. Nonferrous Met. Soc. China 2017, 27, 883–890. [Google Scholar] [CrossRef]
  37. Dong, P.; Cui, K.; Xu, F.; Jiang, T.; Ma, Z. Synthesis of new ionic crosslinked polymer hydrogel combining polystyrene and poly(4-vinyl pyridine) and its self-healing through a reshuffling reaction of the trithiocarbonate moiety under irradiation of ultraviolet light. Polym. Int. 2018, 67, 868–873. [Google Scholar] [CrossRef]
  38. Calovi, M.; Callone, E.; Ceccato, R.; Deflorian, F.; Rossi, S.; Dirè, S. Effect of the Organic Functional Group on the Grafting Ability of Trialkoxysilanes onto Graphene Oxide: A Combined NMR, XRD, and ESR Study. Materials 2019, 12, 3828. [Google Scholar] [CrossRef] [PubMed] [Green Version]
  39. Zhang, K.; Liu, Y.; Han, L.; Wang, J.; Ishida, H. Synthesis and thermally induced structural transformation of phthalimide and nitrile-functionalized benzoxazine: Toward smart ortho-benzoxazine chemistry for low flammability thermosets. RSC Adv. 2019, 9, 1526–1535. [Google Scholar] [CrossRef] [Green Version]
  40. Summers, G.J.; Motsoeneng, T.S.; Summers, C.A. RAFT polymerization of styrene mediated by oxazolyl-functionalized trithiocarbonate RAFT agents. Polym. Bull. 2021, 78, 2251–2285. [Google Scholar] [CrossRef]
  41. Vrettos, K.; Karouta, N.; Loginos, P.; Donthula, S.; Gournis, D.; Georgakilas, V. The Role of Diamines in the Formation of Graphene Aerogels. Front. Mater. 2018, 5, 20. [Google Scholar] [CrossRef]
  42. Garcia-Bordejé, E.; Benito, A.M.; Maser, W.K. Graphene aerogels via hydrothermal gelation of graphene oxide colloids: Fine-tuning of its porous and chemical properties and catalytic applications. Adv. Colloid. Interface Sci. 2021, 292, 102420. [Google Scholar] [CrossRef]
  43. Qian, Y.; Ismail, I.M.; Stein, A. Ultralight, high-surface-area, multifunctional graphene-based aerogels from self-assembly of graphene oxide and resol. Carbon 2014, 68, 221–231. [Google Scholar] [CrossRef]
  44. Sui, Z.-Y.; Cui, Y.; Zhu, J.-H.; Han, B.-H. Preparation of Three-Dimensional Graphene Oxide–Polyethylenimine Porous Materials as Dye and Gas Adsorbents. ACS Appl. Mater. Interfaces 2013, 5, 9172–9179. [Google Scholar] [CrossRef] [PubMed]
  45. Iakunkov, A.; Skrypnychuk, V.; Nordenström, A.; Shilayeva, E.A.; Korobov, M.; Prodana, M.; Enachescu, M.; Larsson, S.H.; Talyzin, A.V. Activated graphene as a material for supercapacitor electrodes: Effects of surface area, pore size distribution and hydrophilicity. Phys. Chem. Chem. Phys. 2019, 21, 17901–17912. [Google Scholar] [CrossRef] [PubMed] [Green Version]
  46. Seredych, M.; Rodríguez-Castellón, E.; Bandosz, T.J. Alterations of S-doped porous carbon-rGO composites surface features upon CO2 adsorption at ambient conditions. Carbon 2016, 107, 501–509. [Google Scholar] [CrossRef]
  47. Xiao, J.; Wang, Y.; Zhang, T.C.; Yuan, S. rGO/N-porous carbon composites for enhanced CO2 capture and energy storage performances. J. Alloy. Compd. 2021, 857, 157534. [Google Scholar] [CrossRef]
  48. Wang, Y.; Wang, H.; Zhang, T.C.; Yuan, S.; Liang, B. N-doped porous carbon derived from rGO-Incorporated polyphenylenediamine composites for CO2 adsorption and supercapacitors. J. Power Sources 2020, 472, 228610. [Google Scholar] [CrossRef]
  49. Li, J.; Zhang, W.; Bao, A. Design of Hierarchically Structured Porous Boron/Nitrogen-Codoped Carbon Materials with Excellent Performance for CO2 Capture. Ind. Eng. Chem. Res. 2021, 60, 2710–2718. [Google Scholar] [CrossRef]
Scheme 1. Chemical structures of: (a) (3-Mercaptopropyl)trimethoxysilane-(TMOS); (b) 1-[3-(Trimethoxysilyl)propyl]urea-(TMON); (c) Cyanomethyl [3-(trimethoxysilyl)propyl] trithiocarbonate-(TMOSN).
Applsci 11 09631 sch001
Figure 1. Schematic representation of the functionalization and formation of the rGO monolith.
Applsci 11 09631 g001
Figure 2. FTIR results for blank: (a) reduced graphene oxide monolith rGO60_0.5; (b) S60_0.5; (c) N90_2; (d) SN60_2.
Applsci 11 09631 g002
Figure 3. 13C-NMR results for reduced graphene oxide monolith rGO60_0.5 modified with TMOS or TMON or TMOSN.
Applsci 11 09631 g003
Figure 4. SEM images from all modified samples: (a) S60_0.5; (b) S60_2; (c) S90_0.5; (d) S90_2; (e) N60_0.5; (f) N60_2; (g) N90_0.5; (h) N90_2; (i) SN60_0.5; (j) SN60_2; (k) Sn90_0.5; (l) SN90_2.
Applsci 11 09631 g004aApplsci 11 09631 g004b
Figure 5. SA of all samples for different parameters and modifications during preparation. Labels of B, N, S, and SN represent the blank system, systems modified with TMON, systems modified with TMOS, and systems modified with TMOSN, respectively.
Applsci 11 09631 g005
Figure 6. Micropores percentage for all samples and for all preparation parameters and modifications. Labels of B, N, S, and SN represent the blank system, systems modified with TMON, systems modified with TMOS, and systems modified with TMOSN, respectively.
Applsci 11 09631 g006
Figure 7. Illustration of the monoliths (B: blank, S: TMOS, N: TMON, and SN: TMOSN) in respect of the SA (grey 3D cylinder), the micropores percentage (orange square), and average pore diameter (red circle) for systems: (a) 60_0.5; (b) 60_2; (c) 90_0.5; (d) 90_2.
Applsci 11 09631 g007
Figure 8. Comparison of CO2 adsorption with: (a) oxygen functionality and ratio C/Heteroatoms; (b) percentages of micropores and macropores; (c) SV ratio and average pore diameter (dp).
Applsci 11 09631 g008
Table 1. Monolith abbreviations, synthesis conditions, and functionalization.
SampleTemperature (°C)GO/AsA wt RatioFunctionalization
rGO60_0.5601:0.5-
rGO60_2601:2-
rGO90_0.5901:0.5-
rGO90_2901:2-
S60_0.5601:0.5TMOS
S60_2601:2TMOS
S90_0.5901:0.5TMOS
S90_2901:2TMOS
N60_0.5601:0.5TMON
N60_2601:2TMON
N90_0.5901:0.5TMON
N90_2901:2TMON
SN60_0.5601:0.5TMOSN
SN60_2601:2TMOSN
SN90_0.5901:0.5TMOSN
SN90_2901:2TMOSN
Table 2. EDX percentages from all samples.
SampleC%O%N%Si%S%
rGO60_0.565.4027.896.350.380.07
rGO60_276.8916.756.350.01-
rGO90_0.568.6525.925.41-0.02
rGO90_280.2210.119.620.05-
S60_0.556.2333.183.563.553.48
S60_261.9614.983.239.8010.03
S90_0.564.2522.443.245.194.97
S90_266.4921.593.644.194.09
N60_0.567.3923.547.131.930.01
N60_263.4124.058.444.10-
N90_0.562.4428.167.671.710.02
N90_266.7024.417.091.80-
SN60_0.561.5223.004.592.848.05
SN60_263.0720.535.002.838.57
SN90_0.565.0217.644.463.329.56
SN90_265.3919.773.962.688.20
Table 3. Porosity results for all samples.
SampleSBET (m2/g)VT (cm3/g)Vmic (cm3/g)Vmes (cm3/g)%micr.Avg. dp (Å)
rGO60_0.5700.190.0140.177.6135
rGO60_22290.760.0240.743.2141
rGO90_0.51900.450.0280.426.3140
rGO90_22660.830.0200.812.4124
S60_0.52340.620.0310.585.0132
S60_23100.780.0330.744.3117
S90_0.53510.960.0360.923.8124
S90_22520.730.0270.703.7140
N60_0.53111.010.0290.982.9144
N60_22910.840.0270.813.3132
N90_0.53101.070.0191.051.8143
N90_22740.940.0270.912.9160
SN60_0.51570.550.0270.525.0179
SN60_22030.770.0300.743.9160
SN90_0.52020.660.0280.644.2155
SN90_22360.950.0250.922.6190
Table 4. CO2 adsorption of all monoliths at two different temperatures (25 °C and 60 °C).
SampleCO2 (25 °C)
mmol/g
%CO2 (60 °C)
mmol/g
%
rGO60_0.51.677.40.853.7
rGO60_20.683.00.532.3
rGO90_0.51.145.00.753.3
rGO90_20.602.60.401.8
S60_0.51.426.20.713.1
S60_20.783.40.472.1
S90_0.50.803.50.552.4
S90_21.104.80.552.4
N60_0.50.944.10.482.1
N60_20.863.80.472.1
N90_0.50.572.50.492.2
N90_20.863.80.512.3
SN60_0.51.004.40.522.3
SN60_20.532.30.341.5
SN90_0.50.602.60.442.0
SN90_20.472.10.331.4
Table 5. Comparison of the CO2 adsorption with different elemental percentages and porosity values.
SampleCO2
vs. O
CO2
vs. S, Si, N, O
CO2
vs. Micro(%)
CO2
vs. Macro(%)
CO2
vs. SV
CO2
vs. Avg dp
High Ads with Green,
Medium with Orange and Red,
Low
Possible
Connection
↑ Ad.
↑ %
↑ Ad.
↓ ratio C/S-Si-N-O
↑ Ad.
↑ %
↑ Ad.
↑ %
↑ Ad.
↑ ratio
Ad.
Vs.
dp
rGO60_0.51.67–13.5
S60_0.51.42–13.2
N60_0.5XX0.94–14.4
SN60_0.51.00–17.9
rGO60_2X0.68–14.1
S60_2XXX0.78–11.7
N60_20.86–13.2
SN60_2XX0.53–16.0
rGO90_0.5X1.14–14.0
S90_0.5X0.80–12.4
N90_0.5XX0.57–14.3
SN90_0.5XXX0.60–15.5
rGO90_2X0.60–12.4
S90_2XX1.10–14.0
N90_2XX0.86–16.0
SN90_2XX0.47–19.0
Follow the trend13/1610/1612/1611/1612/16
Publisher’s Note: MDPI stays neutral with regard to jurisdictional claims in published maps and institutional affiliations.

