1. Introduction
Increasing sensibilities regarding environmental pollution and the health hazards due to emission from diesel or gasoline engines require advanced and further optimized pollutant reduction strategies.
Particularly interesting is the reduction of nitrogen oxide (
) emissions based on selective catalytic reduction (SCR) as a state-of-the-art method for the minimization of
in combustion exhaust gas. In SCR systems, nitrogen oxides are catalytically reacted with ammonia (
) to form molecular nitrogen (
) and water (
). Ammonia is chosen as the reducing agent because it selectively reacts with nitrogen oxide instead of being oxidized by oxygen [
1]. It must be supplied to the process and adjusted to the flow rate of the exhaust gas and its nitrogen oxide content. For safety considerations, however, ammonia is not carried in vehicles as pure liquid. Instead, it is generated within the exhaust gas system. For this purpose, urea–water solution (
urea, often referred to as diesel exhaust fluid (DEF) or AdBlue) is injected into the hot exhaust flow. By thermal decomposition and subsequent hydrolysis of the intermediate product, isocyanic acid (HNCO), it is processed to ammonia and carbon dioxide (
) [
2]. To ensure optimal operation of the SCR system, ammonia must be formed and distributed homogeneously before it enters the catalytic converter, which inhibits further homogenization [
3].
Although de-NO
x SCR has been widely adopted, it still has significant shortcomings. In practice, AdBlue is atomized and injected into the process as a spray. Wetting of the walls of the exhaust system during the injection of the liquid urea solution is an especially undesirable and efficiency-reducing process that can compromise its robustness. The liquid film can flow into the catalytic converter and block it upon the formation of solid byproducts under given adequate temperature and residence time [
4]. Furthermore, as the film formation influences the amount of ammonia supplied to the catalytic converter, it affects the effectiveness of the urea dosing strategy.
The hydrodynamics of drop and spray impact are governed by inertia, surface tension and viscosity. The phenomena of drop impact onto a dry wall and the edge of the film flow generated by spray impact are also influenced by the substrate wettability and morphology. The outcomes of a single drop impact in the isothermal case include mainly rebound, deposition, prompt or corona splash. If the drop velocity is above the splashing threshold [
5] the impact leads to the generation of a number of secondary drops. Several comprehensive reviews of the state-of-the art of the phenomena and modeling in the field of spray and drop impact can be found in the literature [
6,
7,
8,
9].
In the case of spray or drop impact onto a hot substrate, the flow is influenced significantly by the microphysical thermodynamic processes caused by liquid evaporation and boiling [
10,
11]. The heat flux at the substrate interface during spray impact also depends significantly on the thermodynamic or hydrodynamic regime of the interaction. An example of the boiling curve for the evolution of the heat flux over the target temperature, is shown in
Figure 1a. If the wall temperature is higher than the Leidenfrost point, the impinging liquid drop rebounds from the substrate since a thin vapor layer between the wall and the spreading liquid prevents wall wetting, as shown in
Figure 1b. At lower temperature, as illustrated in
Figure 1c,d some wetted spots of boiling liquid appear on the hot substrate [
12]. Their relative area increases in time as soon as the substrate is cooled by the spray. At some wall temperature the substrate is completely wetted by the liquid. At this point, the heat flux reaches its maximum, the critical heat flux (CHF) [
13,
14]. This point is marked as CHF in
Figure 1a. For even lower substrate temperatures a continuous, fluctuating liquid film is created and expanded. If the temperature significantly exceeds the saturation temperature, the flow in this film is influenced by nucleate boiling, leading to the generation of many small bubbles. These bubbles can significantly enhance the splash and formation of the secondary spray.
In an SCR system, multiple phenomena occur simultaneously. First, a spray is injected into a turbulent flow. The individual droplets in the spray do not only interact with the gas flow, but also with each other, and with the walls of the SCR system. When the spray impinges on the surface, there are various scenarios that depend mainly on the wall temperature and the droplet velocity (see
Figure 1) [
5]. Under appropriate operating conditions, these droplets can form a closed film and/or leave solid deposits behind. These processes are strongly interconnected. For example, the AdBlue injection causes a decrease in the wall- and gas temperature due to spray cooling. The lower temperature in return then influences the spray wall interaction.
Previous studies analyzed individual phenomena such as the urea film formation as a result of the spray–wall interaction and single-droplet–wall interaction [
4,
5,
15,
16,
17,
18,
19,
20,
21,
22,
23,
24,
25,
26,
27,
28] to better understand the hydrodynamic processes occurring in the SCR systems. Other studies examine the consequences of wall films in SCR systems, in particular the formation of solid deposits [
27,
28,
29]. Nevertheless, a comprehensive understanding of film formation in SCR systems cannot be achieved by examining individual phenomena only.
To the knowledge of the authors, the transient properties of AdBlue films, from single droplets to separated wetted regions, and to the formation of a closed film and its subsequent drying, have not yet been investigated in detail under generic conditions. The test rig used for the study presented here is designed to facilitate numerical simulations. Thus, the experimental results are well suited to validate numerical simulations. In the future, solvers validated in this way may be used to investigate further operating points and effects numerically as well.
The joint work consisting of experiments on a test rig infrastructure suited for numerical simulations and the validation of such simulations with the experimental results is intended to contribute to understanding film-formation properties as a consequence of all individual phenomena in a generic SCR context.
In order to aid design and optimization of SCR systems using computational fluid dynamics (CFD) based numerical analyses, accurate modeling of the film dynamics and deposit formation is particularly essential. Therefore, the proper numerical description of the AdBlue injection and the subsequent spray–wall interaction plays a key role for determining the result of the AdBlue impingement. For numerical modeling and analysis, Reynolds-averaged Navier–Stokes (RANS) based techniques have been widely adopted [
4,
15,
23,
30,
31,
32] with limitations describing highly unsteady processes. As discussed above, the interaction of spray droplets with the system walls are governed by the properties of the incident droplets (e.g., size, velocity and incident angle) and the wall properties. Using these parameters, various impact regimes are demarcated in the literature based on comprehensive experimental data [
33,
34]. The spray wall interaction model adopted in this work is based on a study by Kuhnke [
35], in which the spray regimes are defined by means of two dimensionless parameters, T* and K, describing the wall temperature and the incident droplet characteristics, respectively. The effect of flow rate and temperature of the hot cross-flow on the spray dynamics within the generic SCR system were investigated using large eddy simulation (LES) [
22,
23]. A hybrid LES-RANS approach has been applied in [
36]. In this contribution and in the literature, however, the behavior of the AdBlue wall films is rather scarcely considered. In order to compare to the experimental results of the time-resolved formation of liquid AdBlue films, characteristic properties of a selected operation point were numerically simulated in this study.
The main objective of the present paper, however, is the experimental characterization of impact of an AdBlue spray onto a solid wall. The evolution of the thickness of the film produced by spray impact is measured using a laser-based optical system at various operating conditions. The parameters varied in these experiments include the initial gas temperature and velocity. In
Section 2, the experimental setup is described, including the generic SCR test bench used for the investigations [
37] and the measurement techniques deployed. In
Section 3, experimental results obtained under characteristic process conditions are addressed, including the time-resolved formation of liquid films due to the AdBlue injection. Once the film thickness reached a steady state, the injection was stopped and the drying of the film by the hot cross-flow was measured.
Section 4 deals with the adopted numerical methodology and simulation setup. Subsequently, the simulation results are presented in
Section 5 and compared to the experimental data with detailed numerical analyses of spray–wall impingement dynamics. In
Section 6, the paper is summarized with concluding remarks.
2. Experimental Setup and Methods
In order to investigate film-formation phenomena in an SCR environment, a generic test bench was set up in previous work [
37]. It was designed to meet operational conditions typically found in SCR systems, allowing performance of reproducible experiments with well-defined boundary conditions. This was needed to deliver a systematic and comprehensive database for the validation of numerical simulations.
To achieve a fully developed turbulent velocity profile in the optically accessible measurement region, the test rig consists of a wind tunnel in which the heated gas first flows into a plenum and is then accelerated through a nozzle. In the plenum, three grids ensure a homogeneous temperature profile. A turbulence grid downstream from the nozzle increases the degree of turbulence (
Figure 2). To achieve a fully developed turbulent block velocity profile at the measurement section, it is located 25 D downstream from the nozzle. By the well-defined turbulent inlet boundary conditions at inlet to the measurement section, the numerical domain is reduced (
Section 4.2).
The test bench includes two optical accesses. All measurements discussed in this study were conducted in the upstream test section. Both test sections are designed such that the processes of interest (spray injection, film evaporation, film evolution) can be monitored through windows from each direction perpendicular to the direction of flow. To prevent flow disturbances or separation, the measurement chambers are designed without edges. For the experiments presented here, the lower window was replaced by a stainless-steel plate on which the AdBlue film is to be formed. The AdBlue injector is mounted upstream of the optical access. A one-hole, pressure-assisted injection nozzle (Cummins S5.3) with a maximum mass flow of 11.7 kg/h and a spray angle of 50° was used, operated at 9 bar and an injection frequency of 1 Hz. The injector is continuously cooled during operation to avoid nozzle clogging with solid urea, which would alter the spray characteristics.
The generic test bench provides a gas flow of a specific velocity and temperature similar to diesel exhaust. The gas flow velocities can be set between 1 and 15 m/s and gas temperatures of up to 700 K with 5 K increments that can be reached in the measurement section. Sensors for recording temperature, pressure and velocity allow for monitoring the process parameters. The temperature of the gas flow and the AdBlue mass flow can be controlled via custom software. All measurements presented in this study were performed with dry air (dew point of 255 K). Between the individual measurements, the optical chamber was thoroughly cleaned to ensure reproducible initial conditions.
2.1. Operating Points
Measurements were conducted at a total of seven different operating conditions (
Table 1), covering three velocities and three temperatures. The quantity of AdBlue injected at the respective operating points was defined by means of a feeding factor,
, which sets the injected amount of ammonia (
) in relation to the amount of nitrogen oxides (
) that would be contained in exhaust flow. The measurements, however, were carried out with dried air. If the feeding factor equals unity, the stoichiometric demand for a complete reduction of nitrogen oxides is supplied. The feeding factor is computed based on the volume flow (
), gas temperature (T) and the pressure (p) (Equation (1)). It was assumed that there is a balanced ratio of NO and
and that two ammonia molecules are formed per urea molecule (
), corresponding to complete decomposition;
denotes the volume fraction of NO and
respectively. To compute the molar exhaust gas flux (
) from the measured volumetric flow rate (
), the ideal gas law was used, where R stands for the universal gas constant.
The investigated operating points included cases with stoichiometric AdBlue injection (
and double- and triple-stoichiometric cases.
The gas temperature covers the range typical for SCR systems, with 180 °C representing the lower limit for the hydrolysis of isocyanic acid [
38]. In addition, ammonium nitrate is deposited in the catalyst at temperatures well below 200 °C [
2]. The velocities are chosen to be similar to gas flow rates in diesel exhaust and cover a wide range of Reynolds numbers.
2.2. Film Thickness Measurement
The film thickness sensor used for the presented experiments was developed in previous work [
39] and is based on the Beer–Lambert Law (Equation (2)), which relates the attenuation of light of intensity
to the incident light intensity
; the path length through an absorbing medium, which is geometrically related to the film thickness
; the absorption coefficient
, which is a function of wavelength
; the film temperature
and wavelength-independent transmission losses
. The indices
and
represent the different wavelengths.
The robustness of the sensor is increased using a second wavelength. In this way, it is ensured that wavelength-independent transmission losses (
) do not influence the measurement. The absorption coefficient
is a wavelength-dependent material-specific constant that varies with temperature and concentration differences. Therefore,
is replaced by the calibration constants a and b determined by a previous, one-time calibration measurement. In this way, a direct relation between the intensities before and after passing the film,
and
, and the liquid film thickness
can be established (Equation (3)).
In a previous work wavelengths of 1441 and 1654 nm were selected, which ensure that cross-sensitivities to temperature and urea concentration only have minimal influence on the measurement [
40].
The sensor used in the present study is depicted in
Figure 3b. Since the sensor is a single-ended transceiver, it requires only one optical access from opposite the wetted wall. This allows the film to be deposited on a stainless-steel surface, comparable to the system walls of a real SCR system. The measurement point is located in the center of the channel, 13 cm downstream from the injection nozzle (see
Figure 3a). As seen in
Figure 3b, light of both wavelengths is time-multiplexed and guided through a glass fiber directly to the optical access. In this way, the free path of the beam is minimized. It is decoupled with a graded index (GRIN) lens and passed through the film and reflected at the bottom wall of the channel, and the returned beam is detected by a photodiode, delivering the intensity
. A prior splitting of 1% of the signal allows measurement of reference intensity
that quantifies the intensity before the beam passes the film. Together with the calibration, the four measured intensities allow computation of the thickness of the investigated liquid film.
To ensure comparability between the individual measurements, the injection of AdBlue was started 30 s after the start of the measurement and continued at 1 Hz repetition rate for 330 s. The measurements were stopped after all liquid was evaporated and solid deposits had formed.
2.3. Error Estimation
Various influencing factors contribute to error in the measurement of the film thickness. Especially during the transition of the laser beam from one medium to another, reflections lead to falsify the measurement. During measurements on the test rig, reflections occur at the interfaces of the glass and when entering the liquid film. Furthermore, the laser beam is diffusely back-reflected from the test rig wall.
Figure 4 illustrates reflections of first order and diffuse laser reflections originating from surface roughness. Shown in green is the portion of the diffused laser beam that is not detected by the sensor.
In particular, the portion of the laser light that is reflected at the film surface has a large impact in the measurement error and is discussed in detail below.
The intensity of the laser beam focused on the detector
is composed of the intensity transmitted through the film
, which is diffusely reflected back, and the intensity reflected from the film surface
. Using Equation (3), the relative error due to the reflection on the film surface for both wavelength
and
can be calculated with Equation (4):
where
indicates the intensity of the laser before it passes through the film and
denotes the proportion of the light that is reflected back by the film surface. Hence,
is given in Equation (5). For angles of incidence up to 30°, the proportion
of light reflected from the film is 2.6%.
Only a portion
of the diffuse radiation
is focused by the bi-convex lens onto the detector;
is an important factor, since the error due to
increases proportionally as
decreases.
can be calculated according to Equation (6) with
describing the part of the light that is transmitted through the film and not the one which is absorbed;
is known from the spectra measured in [
40].
With Equations (5) and (6) and the assumption for simplification that the offset factor
is zero and
is equal to
, the error can be estimated with Equation (7).
Further errors are caused by reflections on the window surface (
), fluctuations in signal intensity resulting from instabilities in the laser intensity and an increase of the urea concentration in the film during the measurement. The influence of urea concentration on film measurement was investigated in [
40]. Another major influencing factor would be the roughness of the test rig surface. However, this can be compensated for by establishing an offset determination before each measurement. An overview of all maximum quantified errors is shown in
Table 2 for a film thickness of 100
.
2.4. Spray Disturbance
The measurement point, 13 cm downstream from the injection, was chosen so that a film forms at this location at each operating point. This causes the laser beam to pass through the spray when AdBlue is injected, resulting in a deflection of the laser beam and a disturbance of the measurement signal. In order to be able to reliably trace this disturbance to the spray droplets, the opening time of the injector was also recorded with an optocoupler. Each time the injector opens, the voltage signal drops. With this it was possible to superimpose both signals.
Figure 5 (left) shows the raw signal of the film thickness in black, and the start and the end of the injection of AdBlue. In the area where spray is injected, the signal has significant interference.
Figure 5 (right) shows a closeup of the same film signal and additionally the signal of the optocoupler. Each time the injector opens, the film signal is disturbed. The disturbance starts when the injector opens and continues until shortly after it closes, which can be explained by the spatial offset between the measurement point and the nozzle. The droplets flying through the measuring area reflect the laser beam and the remaining signal arriving at the
detector does not contain accurate information about the film. To compensate for this effect, this time frame was excluded from further processing. The result is shown in
Figure 5 (left, red line).
3. Experimental Results
In this section, the results of the film thickness measurements are presented. A special focus is on the first operating point C1 (180 °C, 6.5 m/s and
).
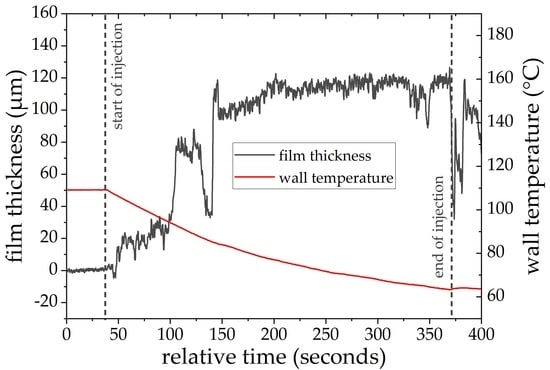
Figure 6a shows the results of a single measurement at this operating point; on the ordinate on the left, the film thickness (black) is plotted in
, on the ordinate on the right, the wall temperature (red) is given in °C. The wall temperature is measured with a thermocouple that is positioned 0.3 mm beneath the surface at the same location as the film thickness measurement. The elapsed time is plotted on the abscissa. The measurement results shown were taken at a frequency of 140 Hz.
In postprocessing, the interference of the measurement signal by the spray is removed (
Figure 5). The lasers are modulated with a top-heat profile at 140 Hz. Two phases of the modulated laser signal are thereby averaged and a moving average is then applied after calculating the film thickness to minimize noise. The effective measurement rate after averaging is 14 Hz.
For all measurement points, the injection starts 30 s after the beginning of the measurements, as indicated in the plot by a dashed vertical line. The injection is stopped after 330 s and also marked by a dashed vertical line. Before starting the injection, the wall is not wetted and a constant signal of the clean stainless-steel surface is measured. This constant signal is used for the in situ determination of the offset-signal quantified by the calibration constant b (Equation (3)).
After the beginning of the injection, the film thickness increases over time. Particularly noticeable is the decrease in the film thickness in the time range between 100 and 150 s and the subsequent increase, just before it reaches a quasi-steady state. This can be explained by the observation that droplets, driven by the flow, ran through the measuring area. At temperatures below the Leidenfrost point, separated spots of boiling liquid appear on the hot wall. Their relative area increases in time while the wetted substrate is cooled by the spray. The single drops flow together until a closed film is formed and the heat flux reaches its maximum [
12]. Depending on the operating point, this effect varies in intensity.
After the AdBlue injection is ended, the film thickness initially drops abruptly. This is to be expected because the film evaporates and is simultaneously drawn out of the measurement chamber due to the high temperature and shear flow. Particularly interesting is the time range between 380 and 400 s in which the film thickness increases again. This is a result of the gradual drying of the film in the direction of flow. The remaining film at the phase boundary between liquid urea–water solution and solid deposit is pushed forward. Subsequently, the film evaporates completely and only solid deposits remain.
Immediately after the start of injection, an apparent “negative” film thickness can be seen. This can be explained with the observation that, at the beginning of the injection, the wall temperature is very high. Since AdBlue is injected at 1 Hz, deposits can form and dissolve between individual spray impacts at the beginning of the measurement. Since the sensor was not designed to measure deposits, it provides the unphysical result of a negative film. In order to verify this hypothesis, another measurement was carried out in which the injection was stopped after 20 cycles. In a subsequent examination, it was found that deposits had already formed. For the remainder of the measurement, however, this effect played a subordinate role, since the deposits only formed locally and appeared to be dissolved as soon as a continuous film was present [
41].
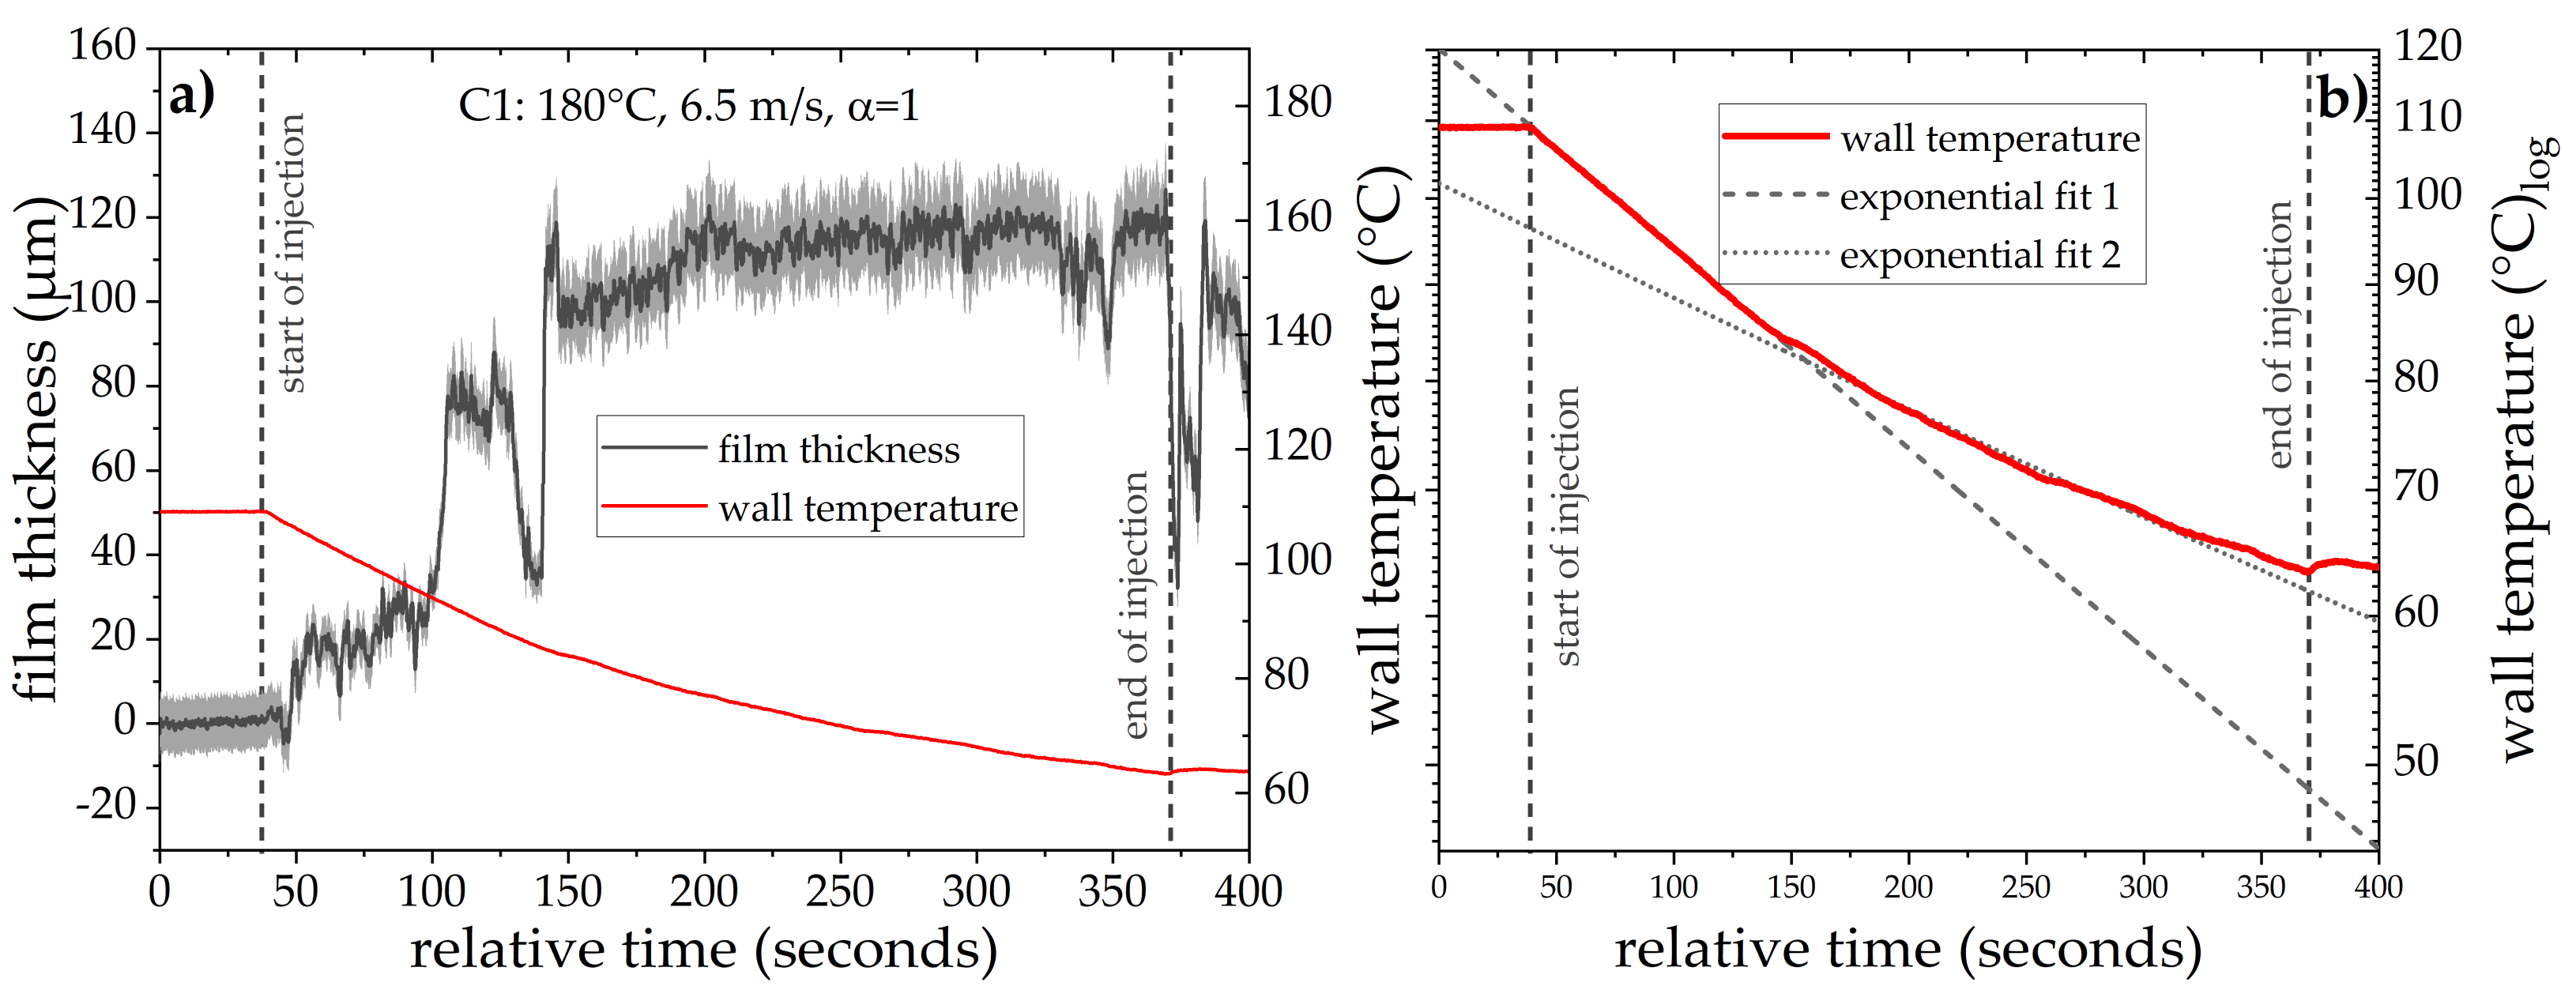
To better understand the influence between film formation, wall temperature and heat flux, the wall temperature in
Figure 6b is plotted logarithmically. Two exponential fits were fitted to the curve in the time prior to the formation of a closed film and afterwards. It is evident that the exponent at which the wall temperature changes coincides with formation of a quasi-stationary film. This effect was expected, as the heat flux reaches its maximum, when the substrate is completely wetted by the liquid. Here, the distinct change in the exponent indicates the transition from spray cooling (separated wetted regions) to pool boiling (closed film). Spray cooling causes a stronger cooling of the wall than a closed liquid film. The timing of the regime change is reflected in both the wall temperature and the film measurements. However, there is an offset of about 13 s between the apparent stagnation of the film thickness (ca. 140 s) and the change in the wall cooling rate (ca. 153 s). This time offset can be explained by the measurement location 0.3 mm below the surface, which leads to a low-pass filtered measurement of the wall temperature.
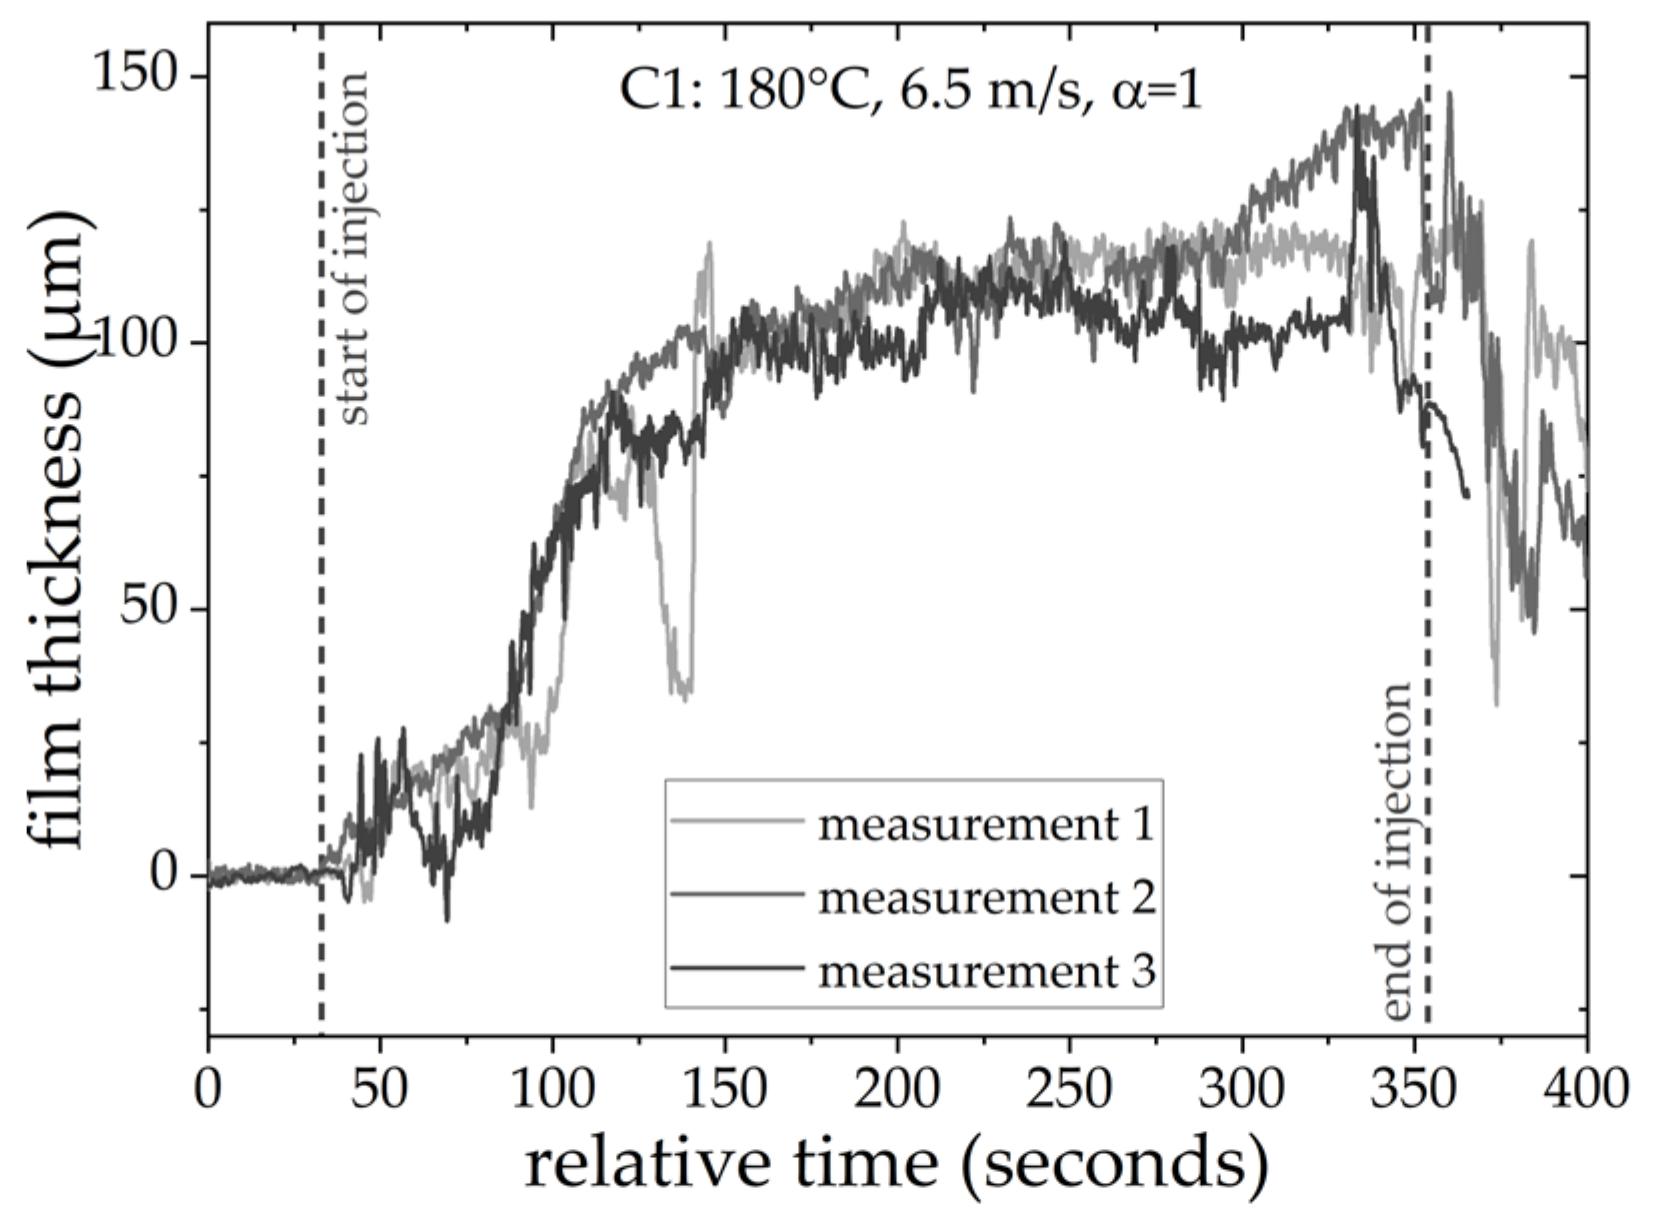
In order to investigate the reproducibility of these findings, three repeated independent measurements were conducted at this operational point (C1)
Table 1. In
Figure 7, the results of these measurements are compared. All three measurements show similar behavior in terms of film buildup, convergence towards a quasi-stationary thickness and decrease of film thickness.
In the first phase of spray cooling, in which a closed film has not yet formed, deviations were observed between the three individual measurements. These differences are a result of the 0 D measurement, which can only provide information on the film thickness within an area of 1 mm
2 area, while the spray impacts on an area of 84 mm × 100 mm. During the initial phase of AdBlue injection, single droplets are formed. Driven by the shear flow, they move in the flow direction. The thickness measured during this phase therefore depends on whether a droplet initially forms in the investigated area or not. The location at which droplets form and their movement paths is different during each individual measurement, which explains the differences. Nevertheless, the standard deviation after convergence (200–300 s) of the film thickness is 3.4% and thus below the maximum specified error (see
Table 2). Despite the differences in the spray cooling phase, the cooling rate through spray cooling show a good comparability with a standard deviation of 5.5% in relation to the gradient of the wall temperature.
The remaining six operating points are shown in
Figure 8. As a supplement, the deposition after the experiments at the corresponding operation conditions is shown in
Figure 9.
All seven cases show different film-formation behavior, which is also evident in the deposits. The formation of a quasi-stationary film as in case 1 (
Figure 6a) can be also seen in the cases 2, 3, 6 and 7 (
Figure 8a,b,e,f). For the two hyperstoichiometric cases (case 6 and 7,
Figure 8e,f), the increased mass flux of impinging spray leads to an enhanced wall cooling. Together with the larger mass flow of AdBlue, a closed film forms almost initially at the start of the injection.
In the second case (
Figure 8a), the lower convection velocity results in lower heat transfer by convection, which reduces the initial wall temperature compared to case 3. In both cases, the gas temperature is 250 °C and the wall temperature is constant before the injection starts, but the velocity is 3 m/s, which is much lower than the 6.5 m/s used for case 3. In addition,
is proportional to the volume flow of the gas (see Equation (1)), which leads to less AdBlue being injected in absolute terms in case 2 compared to case 3. After 250 s, a quasi-stationary film forms, which is about ten times thinner (11
) than the film in case 3 (105
).
In contrast to case 3 at 250 °C, 6.5 m/s and
= 1 (
Figure 8b) where a quasi-stationary film is formed at 250 s, such a behavior is not seen in case 4 (
Figure 8c) of the same temperature but different velocity. In case 4 (
Figure 8c), in contrast, the shear flow over the film is strongly increased with 10 m/s, which also clearly influences the film formation.
For case 5, which has the highest temperature of 350 °C, the film grows steadily without showing any sharp gradient in height. After stopping the injection, however, the film thickness does not decrease, unlike in all other cases. Since the wall temperature is so high, the urea deposits liquefy and melt, so that a film can still be seen after the injection. Only after the channel is switched off and cooled do solid deposits form (see
Figure 9e), which are also clearly distinguishable from the deposits in the other cases.
4. Numerical Methodology and Simulation Setup
Additionally, numerical simulations were carried out. For this purpose, case 1 was selected, which was also discussed in more detail in the
Section 3 and was also measured repeatedly.
In the present work, an Eulerian–Lagrangian-based large eddy simulation (LES) approach is applied to describe the turbulent two-phase flow of AdBlue injection into an air environment, spray dynamics, spray–wall interaction and AdBlue film formation in the experimentally investigated SCR system. Accordingly, the turbulent carrier phase is captured by following the LES framework in which the filtered governing equations of mass, momentum energy and species are solved. In particular, the one-equation subgrid scale (SGS) model is adopted to capture the flow turbulence using the open source CFD software OpenFOAM v1612+ (OpenCFD Ltd., Reading, UK) [
42]. More details about the LES and respective model formulation in the OpenFOAM version used can be found in [
26]. The AdBlue injection and subsequent spray dynamics processes are described by a Lagrange–particle-tracking method as designed in [
43,
44]. In this work, instead of using spray atomization models, parcels with predefined droplet size distribution are injected, while the secondary breakup is neglected owing to its minimal influence [
43,
44] due to the low Weber number (We) of the droplets as also shown later in the results obtained. Since the AdBlue consists of 67.5 wt.% of water and 32.5 wt.% urea, which exhibit significant different thermophysical properties, the liquid phase (both spray droplet and wall film) needs to be described by a multicomponent approach. Especially, the evaporation of AdBlue droplet has peculiar characteristics as demonstrated in [
43]. Thereby, owing to considerably higher volatility, water evaporates first followed by urea [
45]. More details about the adopted multicomponent droplet evaporation model are reported in [
43,
44].
For SCR systems, the injector nozzles are operated with very moderate injection pressure in the narrow exhaust duct leading to intense spray–wall impingement and film formation. Therefore, a reliable description of spray–wall impingement, wall film formation and subsequent multicomponent film transport dynamics are highly imperative. A short description of the adopted models follows.
4.1. Spray–Wall Impingement
As pointed out above, in this work the applied spray–wall interaction model is based on Kuhnke [
35] in which the spray regimes are defined by means of two dimensionless parameters, T* and K, describing the wall temperature and the incident droplet characteristics, respectively:
where
represents the dimensional temperature,
is the wall temperature and
the saturation/boiling point temperature of liquid:
where
represents the kinematic parameter of droplet as function of Weber- and Laplace number, with
and
being the droplet density, surface tension and viscosity, respectively.
is the droplet velocity normal to the wall with diameter
. This way, various regimes such as rebound, splashing, deposition and thermal breakup can be defined in a
diagram, as suggested by Kuhnke [
35].
4.2. Thin Film Governing Equations
In OpenFOAM, the wall film is described by the so-called thin film approach, in which the governing equations for mass, momentum, energy and species are solved in a 2D-auxiliary mesh along the wall where spray–wall interactions take place. Considering AdBlue as an incompressible liquid and following the thin film approximation, the continuity equation can be rewritten as function of film thickness,
, by considering single face area:
where the first term on the left side expresses the transient evolution of the film thickness while the second term accounts for the convective contribution with the film velocity, U
f. The two terms on the right side represent the source term due to spray impingement and mass transfer during the film evaporation, respectively. The term S
impg can have both negative and positive contribution depending on whether the impact results in a deposition or impingement-induced film breakup. It can be defined as:
where
is film density,
the face area,
the time step and
the number of interacting droplets with radius
. In order to describe the transport of AdBlue wall film that contains more than one component, a species transport equation needs to be solved for
species. This yields:
where the source terms due to spray impingement and evaporation in the right side are related to individual species k. Generally, the energy balance in the film consists of heat exchange both with the carrier phase and the wall together with contribution from the impinging spray,
:
where the quantity
is the heat exchange between the film and the gas phase owing to both temperature gradient and evaporation, and
the heat exchange with the wall. The momentum transport in the film can be expressed as:
where the essential contributions are represented in the right side by the source term due to the pressure gradient, the shear force along the film free surface (gas side), the shear force along the wall-film interface, the gravitational force and finally the source term due to the spray impingement on the film, respectively. The reader can find more details of this model in [
35].
The effect of the substrate wettability is not considered in the present computational model. The geometry of the total wetted spot is possibly not precise. Nevertheless, the dynamics of the liquid film in the spray impact region is considered accurately in the model. Therefore, the evolution of the film thickness in this region should be predicted correctly.
4.3. Numerical Setup
In order to assess the predictive capability of the adopted numerical framework and to subsequently carry out numerical sensitivity studies, the generic SCR channel is discretized by fully conformal hexahedral mesh with ca. 1.7 M control volumes. As pointed out in [
46], instead of considering the extended 25 D (see
Section 2), only 1 D channel length is considered while the fully turbulent inlet boundary condition is insured by a digital filtered inlet method, as proposed by Klein et al. [
46]. This allows downsizing the computational domain and thereby reduces considerably the computational cost. The resulting turbulent inlet velocity profile for the case 1 (C1) is depicted in
Figure 10 for two arbitrary instances suggesting a fully developed inflow condition. The AdBlue spray is represented by approximately 600,000 computational parcels for each injection event. The simulations are performed on the 2xIntel
® Xeon
® Platinum 9242 Processor (3.8 GHz) using domain decomposition method available in OpenFOAM. Thereby, the computational time for 1 s of physical time with one injection event is estimated at approximately 255 CPU hours for the C1 configuration. In this way, by running a parallel computation with 60 processors, the simulation of 1 s of physical time takes ca. 4:15 h. Considering the associated computational cost and the fact that AdBlue film buildup takes relatively longer physical time with many subsequent injection events (50–100), the present numerical study is carried out only for the C1 configuration.
5. Numerical Results and Experimental Validation
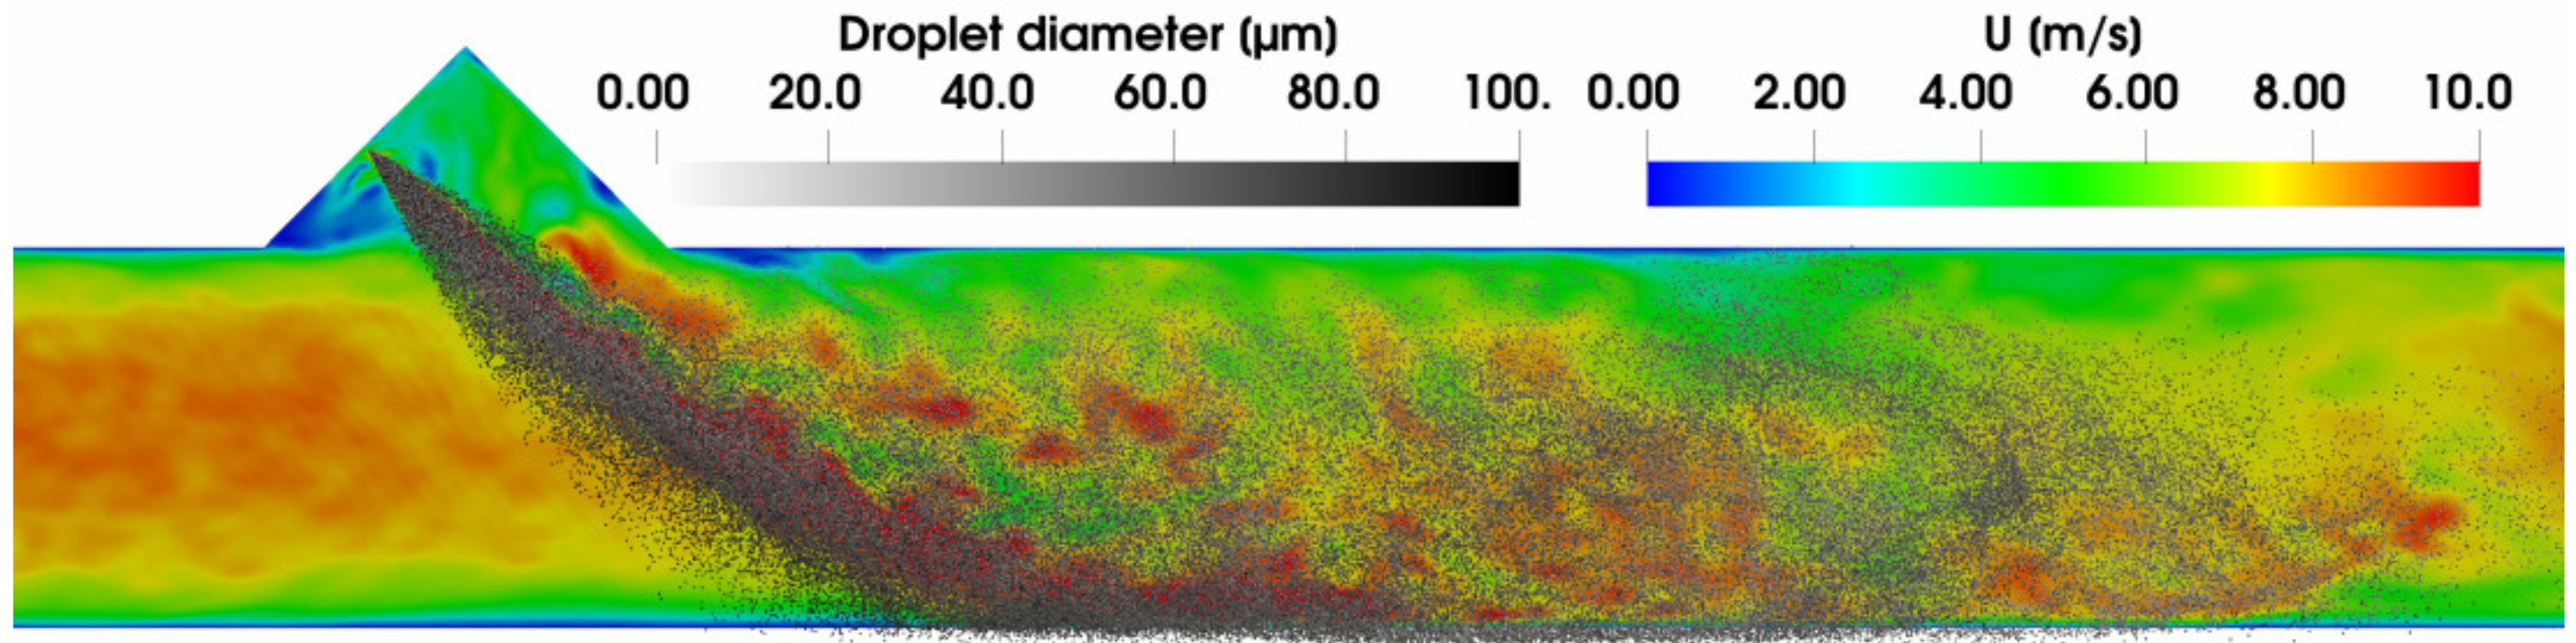
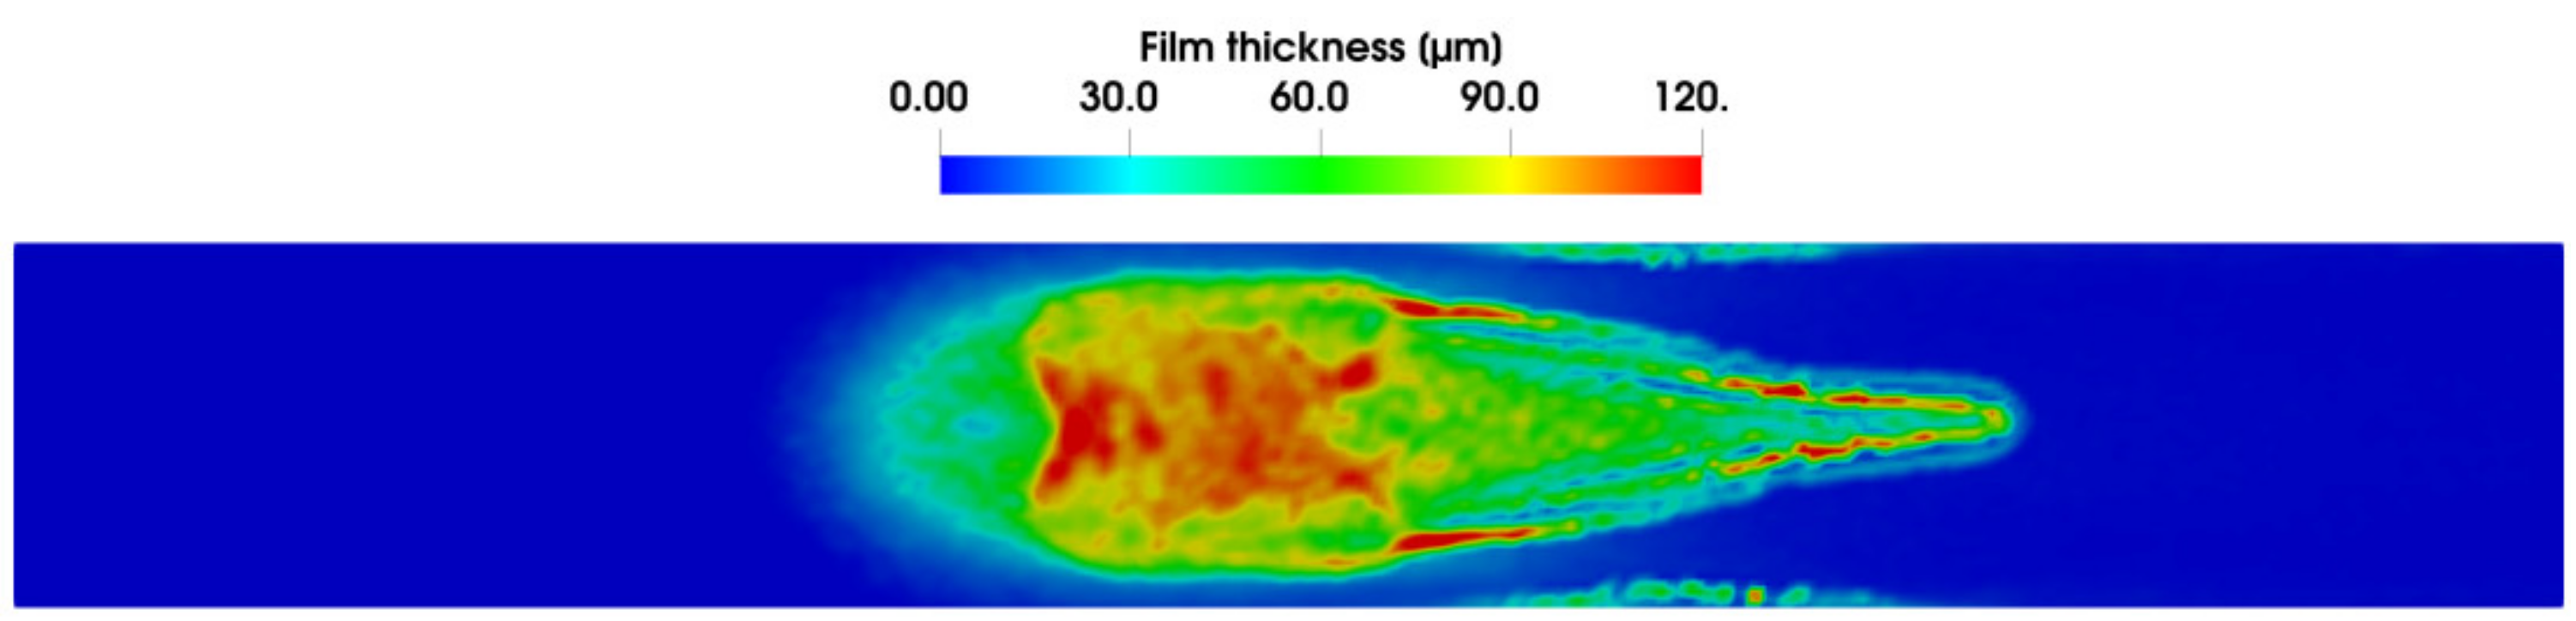
As already stated in the previous section, the AdBlue injected at moderate pressure results in a weakly atomized spray that interacts with the SCR wall boundary especially the lower SCR wall. The spray dynamic is monitored in terms of the spray morphology, the droplet velocity and size, the spray–wall interaction and the liquid wall–film formation and subsequent evolution. The spray profile obtained is depicted in
Figure 11, where it is superposed by the carrier gas velocity profile. Due to their lower momentum, the smaller droplets generally are carried away by the turbulent cross-flow while the larger droplets are responsible for the intense wall impingement events. These result in an AdBlue wall film whose formation and subsequent evolution are observed in
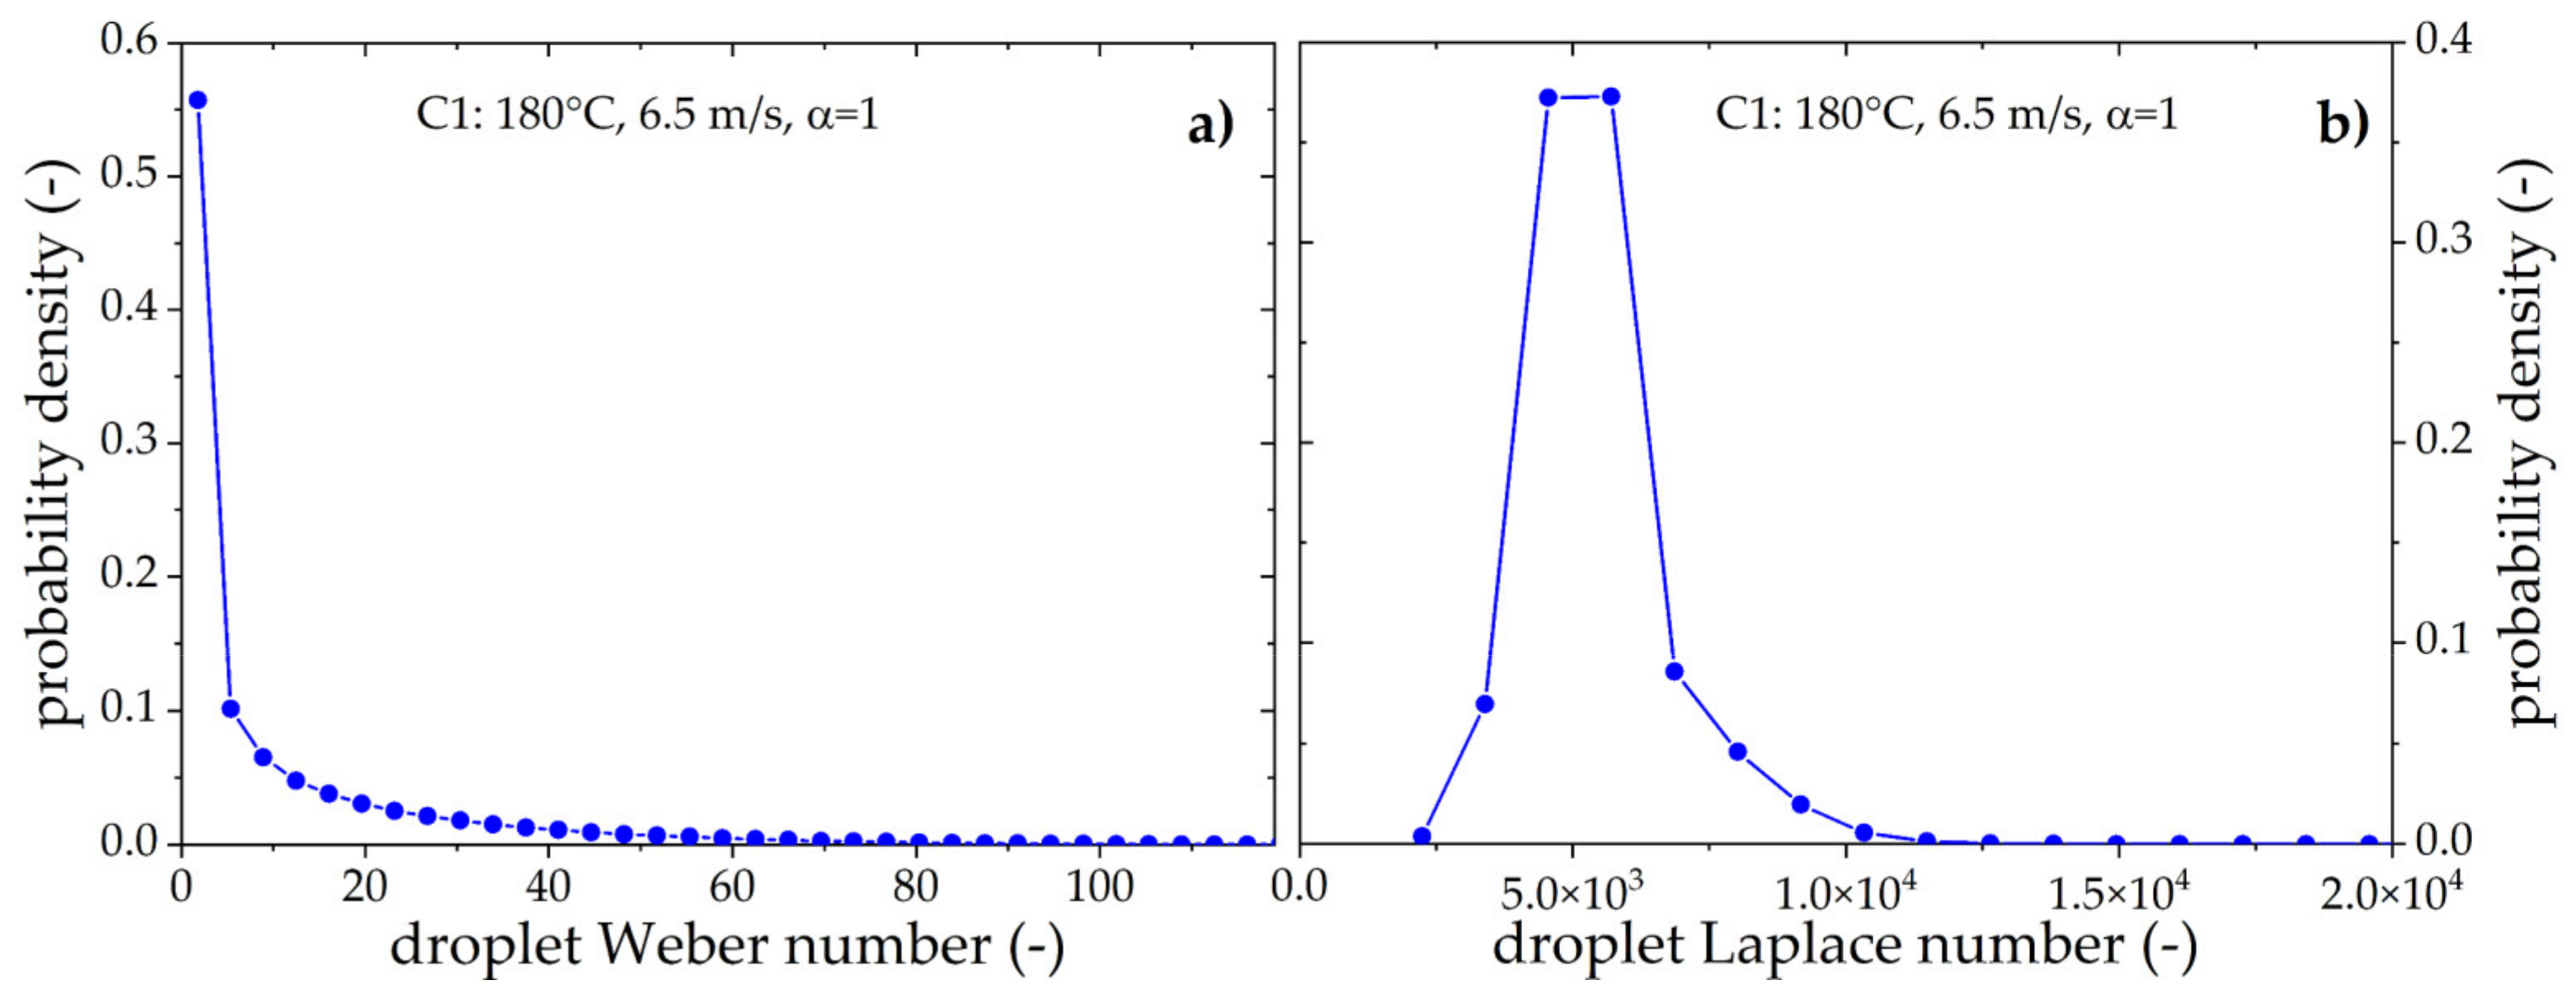
Figure 12 in terms of film thickness. The film dynamic includes the accumulation of impinged droplets and the subsequent transport of formed wall film primarily due to impingement pressure unless there is a gravity force component tangent to a possibly inclined wall plane. The thickness of the wall film is higher towards the spray front due to continuous accumulation of impinged mass. To further quantify the spray–wall interaction, the impinging droplet size and corresponding velocity (normal to the wall) distribution are plotted in
Figure 13, suggesting reasonably that larger-sized droplets (Sauter mean diameter~63 μm) with lower normal velocity impinge on the wall. Furthermore, these droplets feature low We-number (
Figure 14, left) and relatively small La-number (
Figure 14, right), which are responsible for the deposition of the impinging droplets and formation of AdBlue wall film, as also reported in [
34,
35].
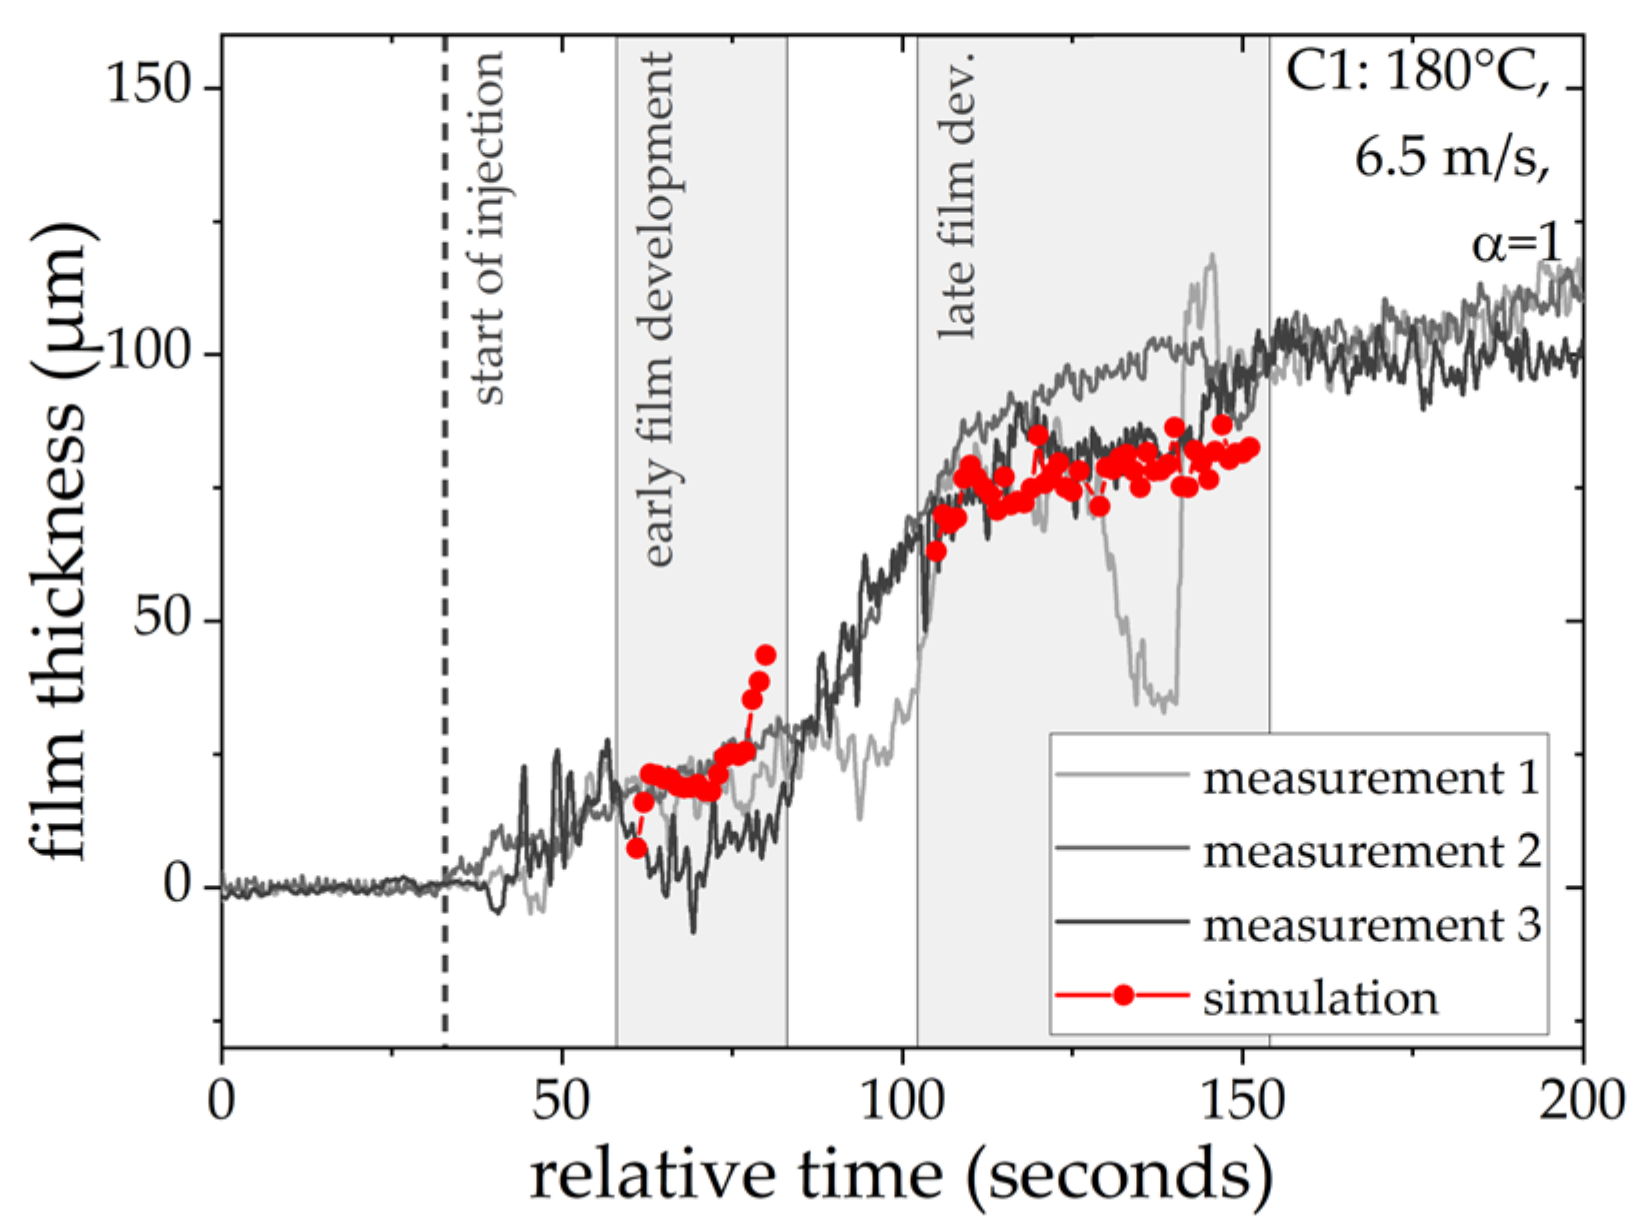
In order to evaluate the predictability of the numerical methodology adopted, the evolution and buildup of the AdBlue wall film are compared against the experimental film thickness obtained for case 1 (C1) shown in
Figure 15, especially during the early and late injection phase. The result shows reasonably good agreement with experiment for the measurement location. The continuous buildup of AdBlue wall film in the early film development phase is well captured by both experiment and numerical simulation but for only 21 injection events due to limited computational time. To gain more insight into the process evolution while further assessing the predictive capability of the suggested numerical model, a simulation is performed with an initial wall film thickness of 50 μm corresponding to a late injection stage for configuration C1. The film is allowed to further build during the next series of injections. The resulting evolution of the AdBlue wall film is compared with the experiment for only 35 injection events. Considering the complex nature of spray–wall interaction and liquid film buildup, the simulated result exhibits a similar trend to the experiment for film thickness evolution. The good agreement observed clearly demonstrates not only the predictive capability of the present numerical method, but also confirms its potential to simulate complex spray–wall-interaction phenomena as encountered in a SCR–DeNOx system.


 ,
, 


