
Analysis of Acoustic Emission (AE) Signals for Quality Monitoring of Laser Lap Microwelding


Department of Mechanical Engineering, National Chung Hsing University, 145 XingDa Rd., Nan Dist., Taichung 402, Taiwan
*
Author to whom correspondence should be addressed.
Appl. Sci. 2021, 11(15), 7045; https://0-doi-org.brum.beds.ac.uk/10.3390/app11157045
Submission received: 27 June 2021
/
Revised: 24 July 2021
/
Accepted: 28 July 2021
/
Published: 30 July 2021
(This article belongs to the Special Issue Quality Control in Welding)
Abstract
:In this study, the correlation between welding quality and features of acoustic emission (AE) signals collected during laser microwelding of stainless-steel sheets was analyzed. The performance of selected AE features for detecting low joint bonding strength was tested using a developed monitoring system. To obtain the AE signal for analysis and develop the monitoring system, lap welding experiments were conducted on a laser microwelding platform with an attached AE sensor. A gap between the two layers of stainless-steel sheets was simulated using clamp force, a pressing bar, and a thin piece of paper. After the collection of raw signals from the AE sensor, the correlations of welding quality with the time and frequency domain features of the AE signals were analyzed by segmenting the signals into ten 1 ms intervals. After selection of appropriate AE signal features based on a scatter index, a hidden Markov model (HMM) classifier was employed to evaluate the performance of the selected features. Three AE signal features, namely the root mean square (RMS) of the AE signal, gradient of the first 1 ms of AE signals, and 300 kHz frequency feature, were closely related to the quality variation caused by the gap between the two layers of stainless-steel sheets. Classification accuracy of 100% was obtained using the HMM classifier with the gradient of the signal from the first 1 ms interval and with the combination of the 300 kHz frequency domain signal and the RMS of the signal from the first 1 ms interval.
1. Introduction
Laser microwelding has received considerable attention in past decades for the manufacturing of high-precision products in the electronics industry. Generally, the microgap generated between the two layers of metal sheets during welding reduces the joint strength and degrades welding quality in the manufacturing of products such as metal masks and the package of a battery. Due to more than hundreds or thousands of welding points being produced on a mask or a fuel cell, any failure of a single welding joint might cause the failure of the whole product and lead to the loss of money and reputation in the industry. To ensure manufacturing quality and apply the technique to these quality-sensitive products, a quality monitoring system is crucial.
Studies have reported the development of monitoring systems for welding processes [1,2,3,4]. However, most have focused on keyhole-mode welding with a conventional welding size. Various types of sensors have been adopted in studies for monitoring laser keyhole-mode welding quality, including audible sound sensors [5], acoustic emission (AE) sensors [6], temperature sensors [7], and optical sensors [8]. AE signal is a kind of solid wave generated by strain in solid material or friction on surface [9]. Due to its high-frequency feature, it provides the advantages of a high signal-to-noise ratio. In laser welding, the thermal expansion of solid material caused by the input of laser energy on a workpiece will generate thermal strain in laser contact and affect the area. Therefore, the AE signal which could be generated in laser welding is considered closely correlated with weld pool generation. Some studies have investigated the correlation between AE signal features and defects resulting from keyhole-mode welding [10], and AE-based quality monitoring has been studied. However, it still needs more work to improve system reliability when trying to apply the AE-signal-based quality monitoring system to the production line. Jolly [11] was the first to apply the AE signal to the process monitoring of stainless-steel welding. The correlation between the crack and AE signal generation was reported. Chan et al. [12] applied the AE signal to identify the lack of fusion in welding. Weeter et al. [13] installed the AE sensor on a workpiece and reported that the feature change of the AE signal could be observed for partial-penetration welding. Hamann et al. [14] also reported the increase in the AE signal as the plasma generated in keyhole-mode welding. Habenicht et al. [15] reported that the energy of the AE signal decreases as the liquid state appears in the welding. Fang et al. [16] observed that the frequency-domain AE signal correlated closely to the cold crack is at around 200 kHz. Shao et al. [6] reviewed studies involving the AE signal for the development of the monitoring issues in welding. Schubert et al. [17] reported that lack-of-fusion defects and pores were successfully detected by AE signals. Jia et al. [18] reported that the evidence of crack propagation after solidification of a weld is successfully captured by an AE sensor. Although the capability of the AE signal to monitor defects in welding is confirmed in most reports, the installation of AE sensors on a workpiece makes it not easy to be implemented in the production line. In 2014, close relationships between laser spot welding and AE signals were reported by Lee et al. [19], and the selected features were adopted as the input features to a back-propagation artificial neural network to predict the weldability of stainless-steel sheets. Furthermore, for keyhole-mode monitoring, hybrid monitoring systems have been developed that integrate AE signals with other sound or optical signals [10,20].
Few studies have reported on monitoring welding quality in conduction mode with AE signals. Chien et al. [21] developed a quality monitoring system based on AE signals for thin-plate butt welding. Kuo and Lu [22] studied the correlation between laser microwelding bonding strength and the feature of audible sound collected during welding by simulating a gap between the layers of metal sheets. In this study, following the study reported by Kuo and Lu [22], the correlation between welding quality and the features of AE signals was analyzed. In the previous work [22], the signals analyzed is audible sound collected by a MEMS microphone with frequency range below 10 kHz. In this paper, the signal studied is the Acoustic Emission (AE) signal with a range from 50 kHz to 400 kHz. The AE signal was collected simultaneously with audible sound studied in Reference [22] from the same welding experiments. The experimental setup simulated the condition in the manufacturing of the metal mask in the production line. To verify the capability of applying the AE signal in detecting the low-strength joint in laser lap microwelding, the same hidden Markov model (HMM)-based monitoring system as shown in Reference [22] was employed to evaluate the performance of the selected AE features.
2. Experimental Setup
2.1. Equipment and Sensors
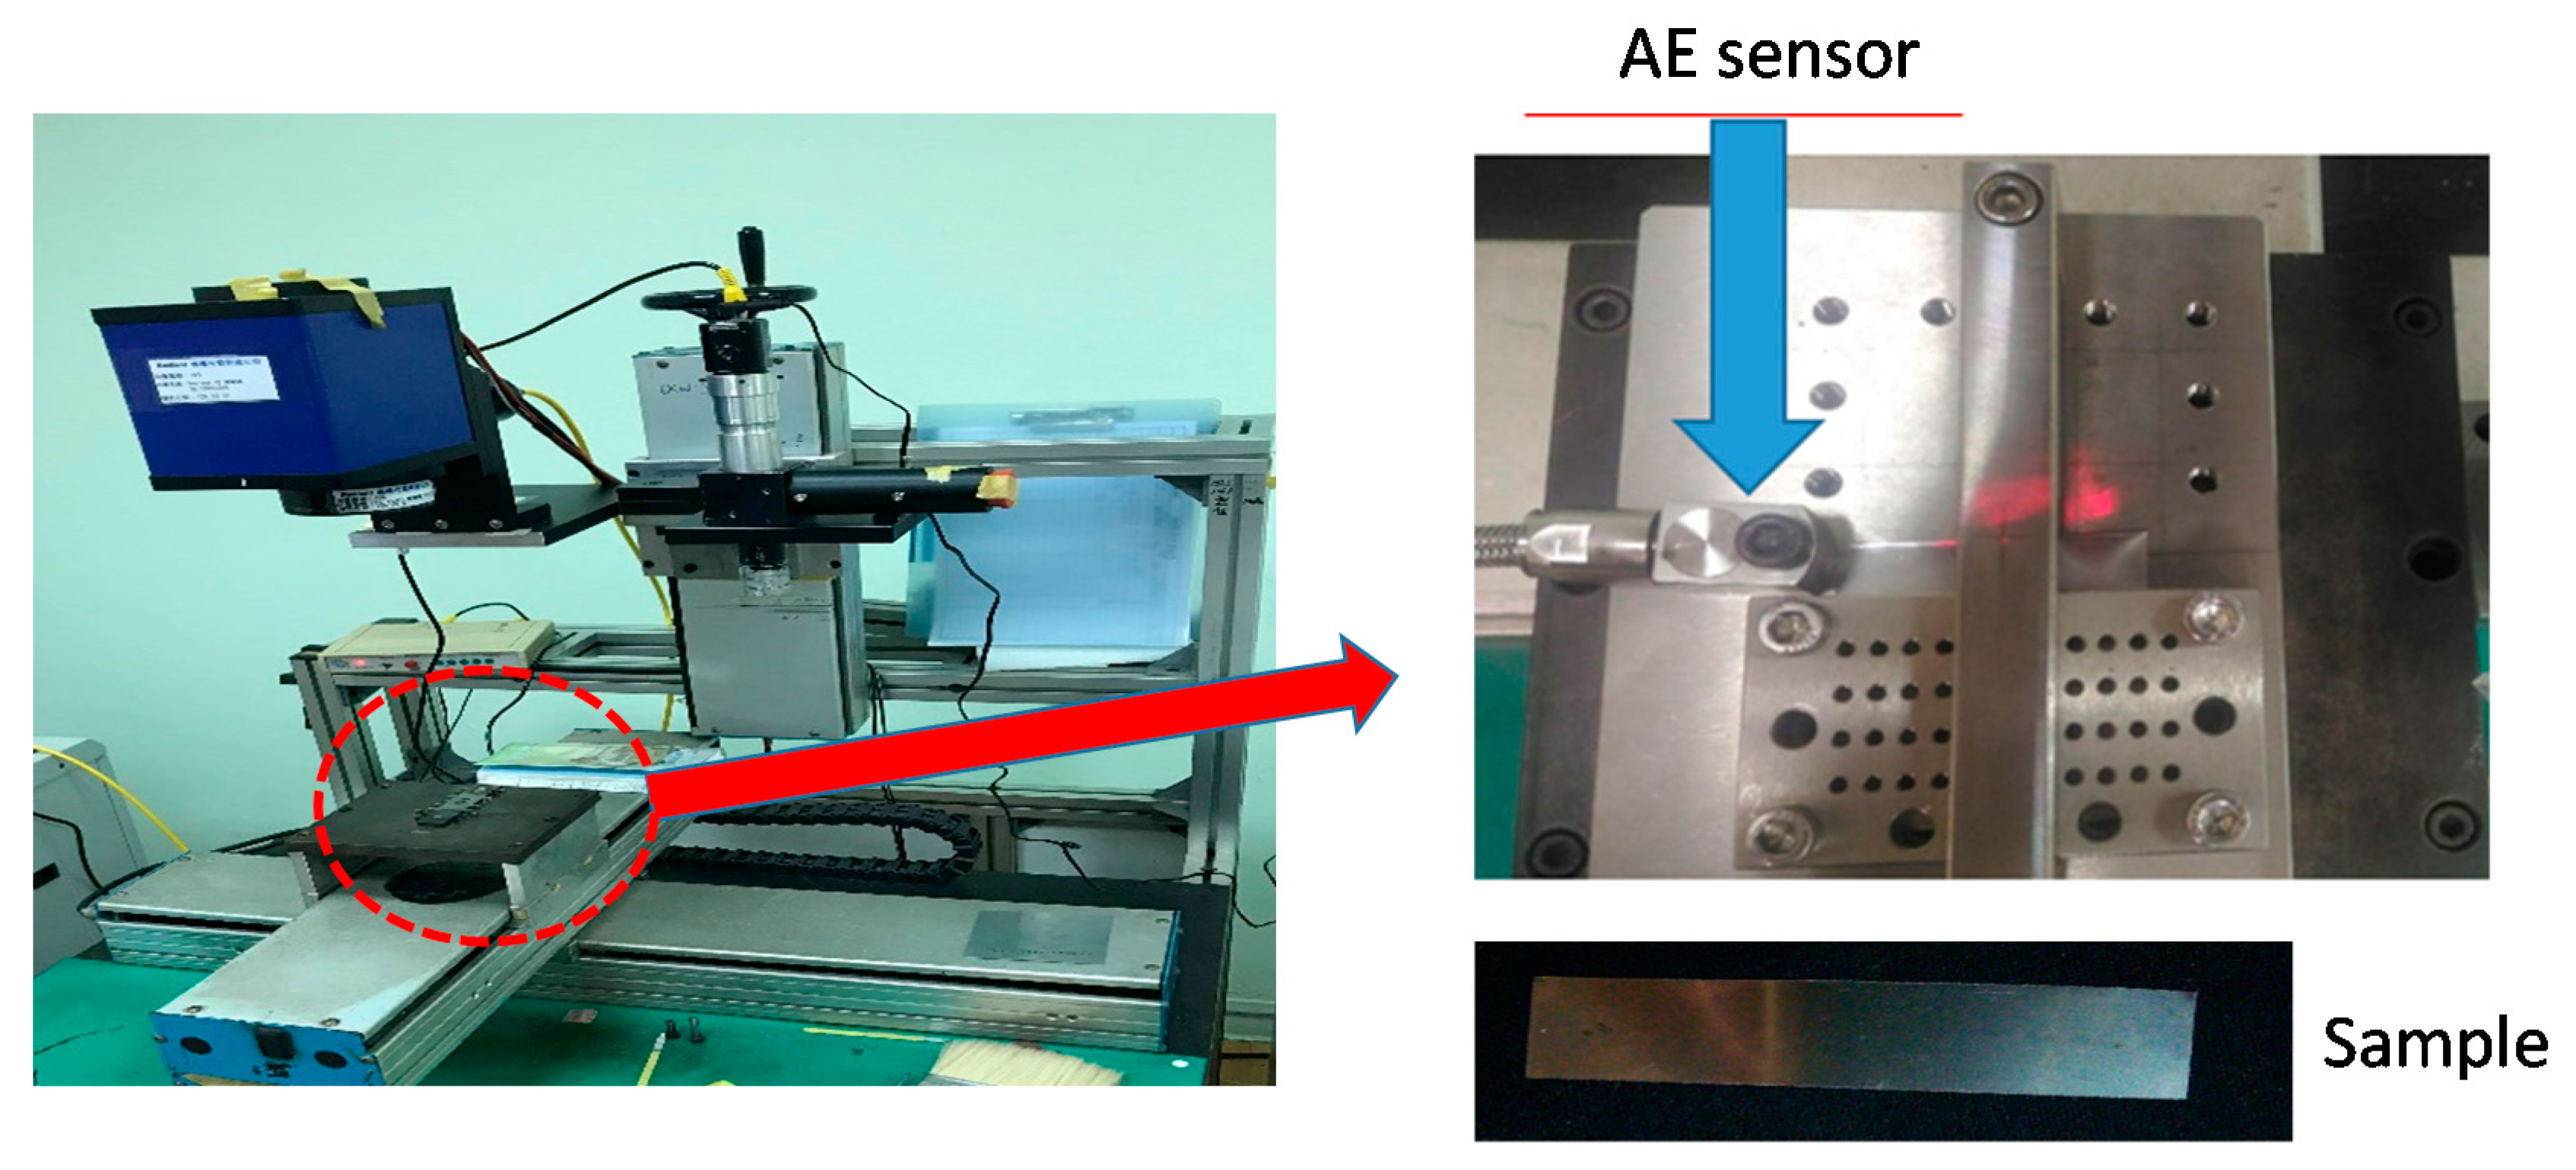
Laser lap microwelding experiments were conducted on a laser microwelding machine (Figure 1) with an integrated Kistler 8152B121 AE sensor (linear frequency range: 50–400 kHz). A QCW fiber laser with wavelength of 1.064 um was implemented in this study. Two 45 mm × 10 mm SUS304 stainless metal sheets with 200 um in thickness was chosen as workpiece. Its thermal expansion (10−6/K), thermal conductivity (W/m K), and melting point (OC) were 18.4, 16.8, and 1723. In the test, the AE sensor was installed on the bottom plate of the fixture with screw to collected AE signal during welding. To avoid aliasing occurring during data acquisition, an NI 6132 was used to collect AE signals with a sampling rate of 2 MHz.
2.2. Experimental Design
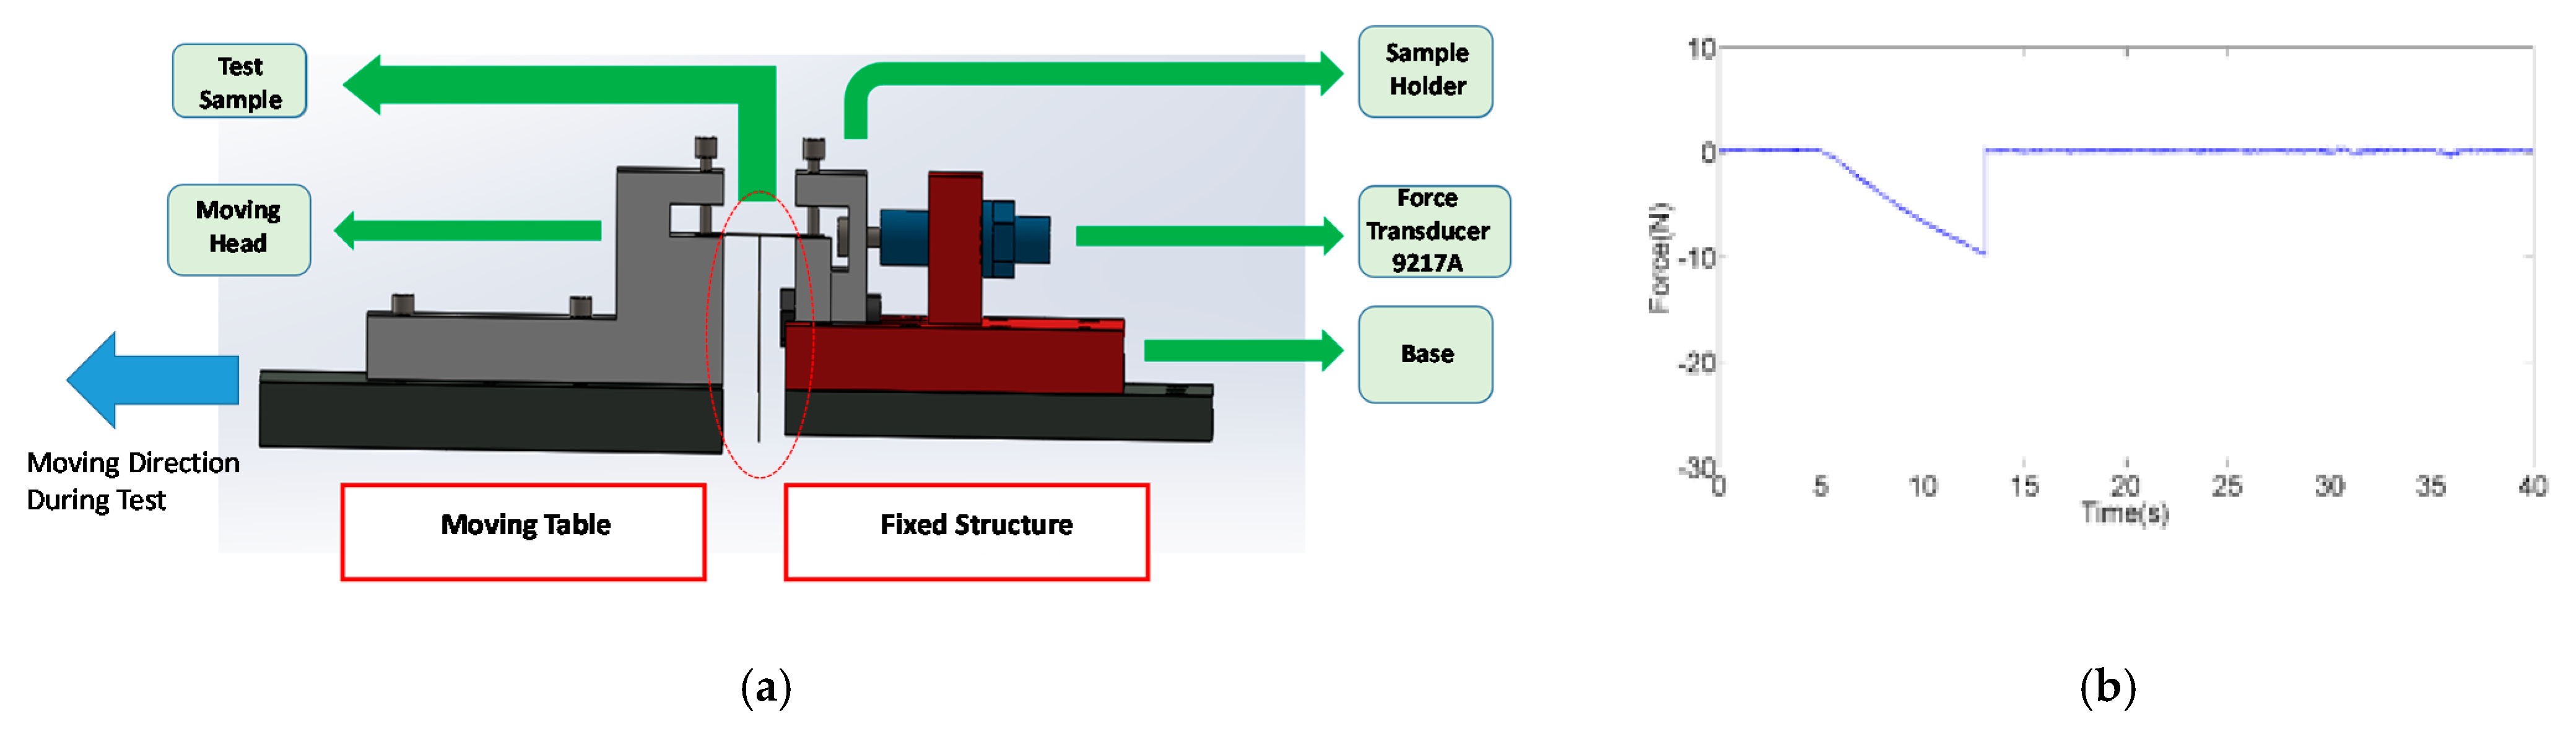
Table 1 presents the welding parameters adopted in this study. The fiber laser delivers 105 W power in pulse mode with an interval of 2 ms for each welding. The laser spot size is 50 um in diameter. To classify the welding quality for signal analysis and monitoring model development, the joint strength was measured after lap microwelding by a peeling test. The peeling test was performed for each welding spot on a sample, and the peeling force was obtained using a force transducer (Kistler 9217A) during the breaking up of a joint with equipment designed by the authors (Figure 2a); the peeling force used to break up the joint was measured and recorded throughout the test (Figure 2b).
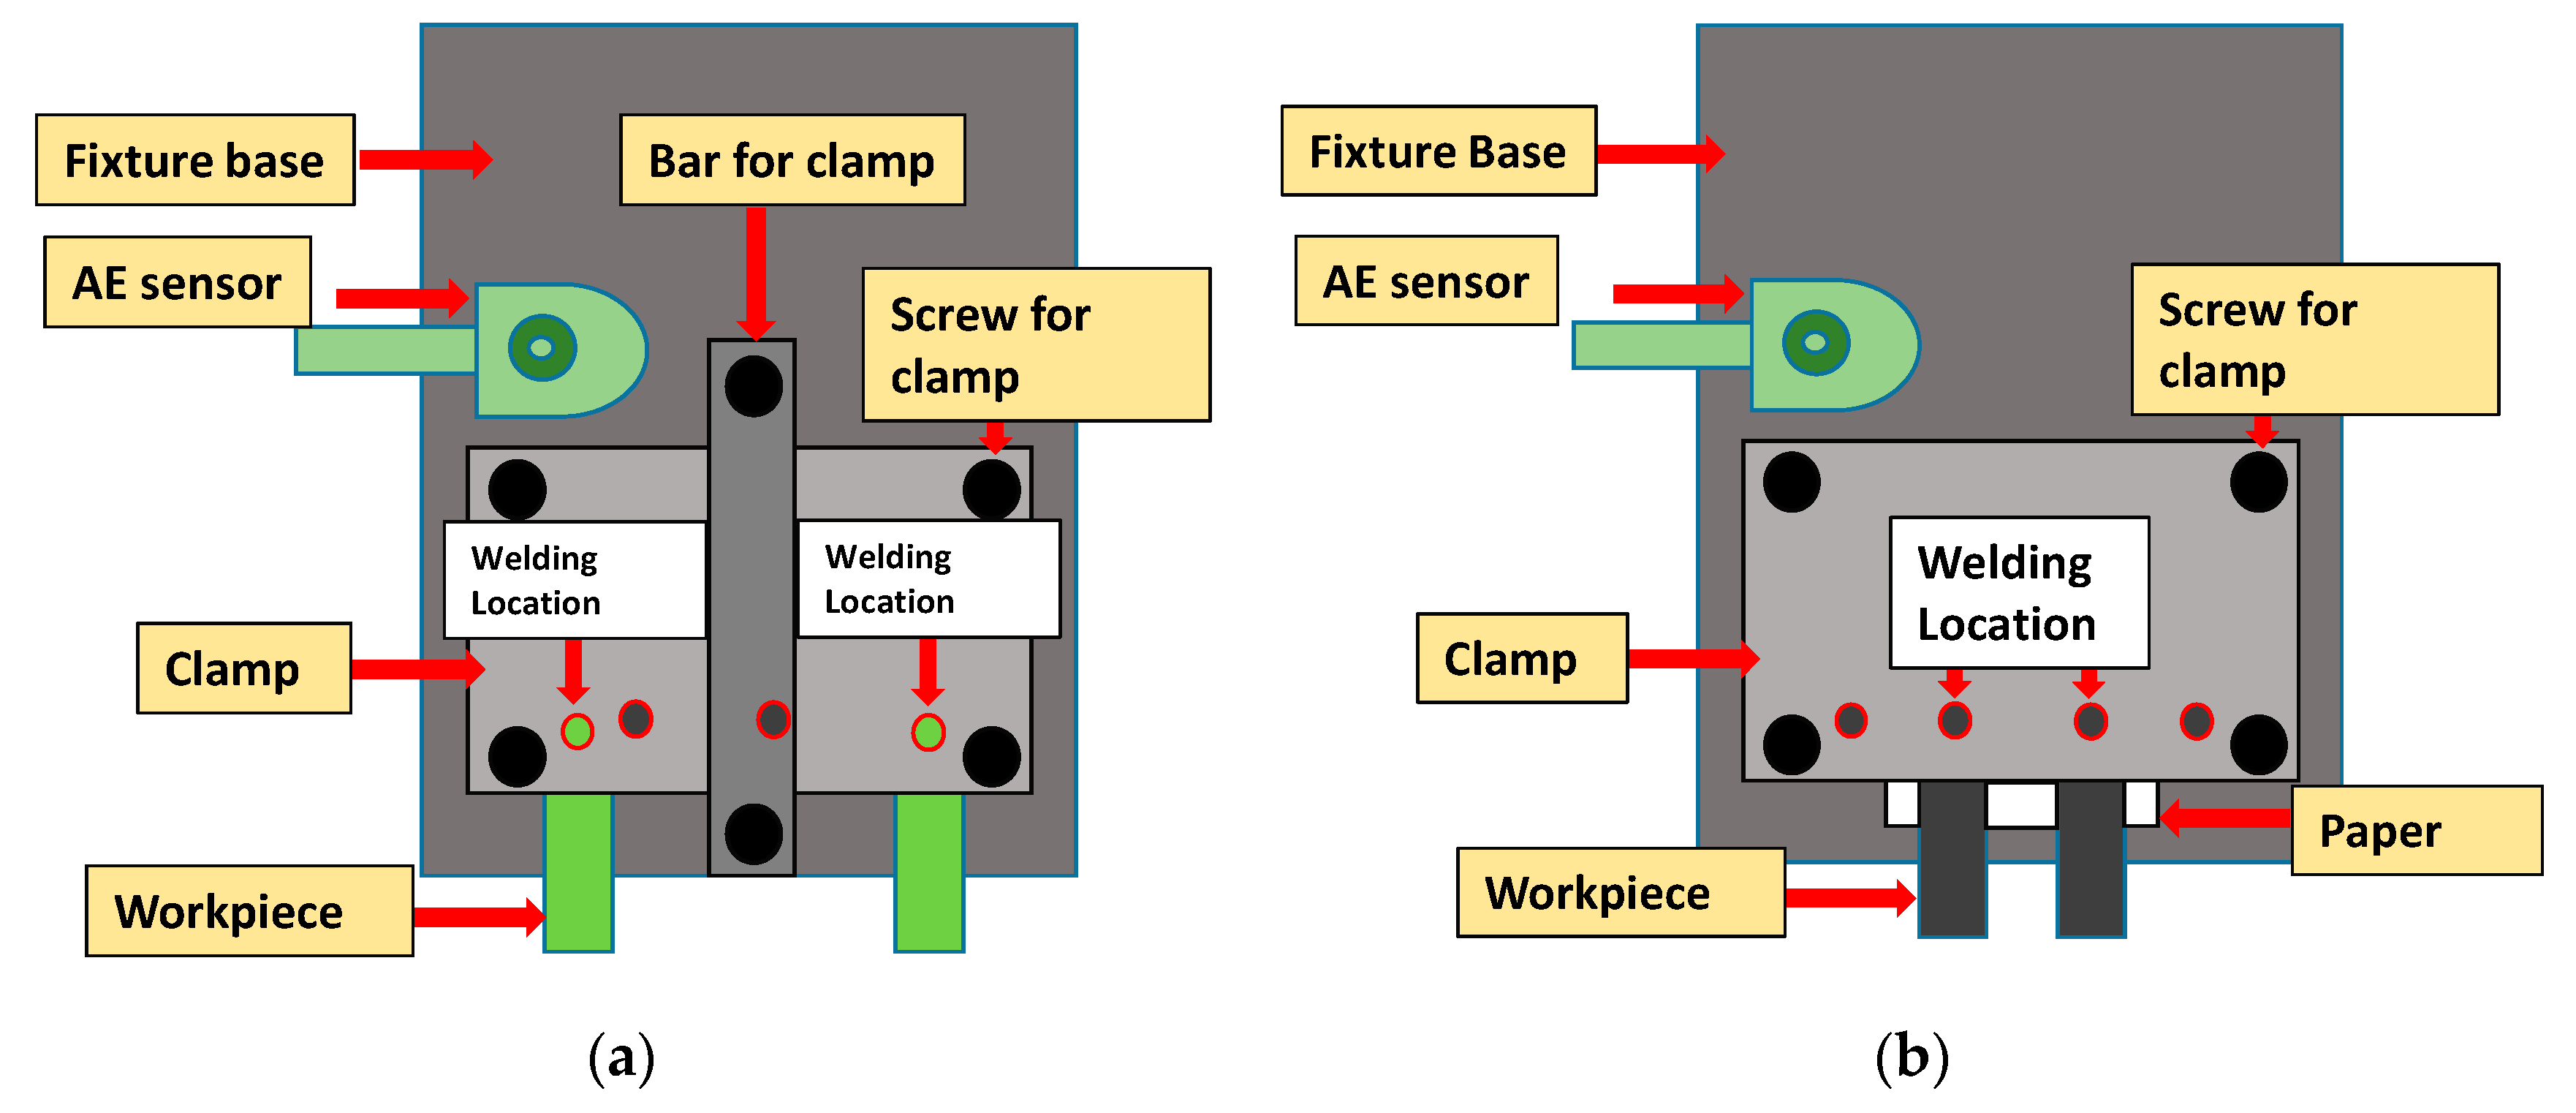
In a production line, loss of contact between the two layers of metal sheets might be caused by the deformation of the metal sheets or insufficient clamping force induced by improper clamper design. Improper contact can yield low joint bonding strength or prevent joint generation. To simulate such conditions to generate different welding quality, the central clamp, the welding location, and two thin sheets of paper between the two layers of metal sheets were used to control the contact between the layers of metal sheets. The thickness of paper used to increase the gap was around 200 um. After the test, the peeling test was performed on each sample to confirm the final welding condition. Figure 3 illustrates the setups used to simulate the two types of contact between the metal sheet layers. To increase the possibility of obtaining improper contact between the layers, the central clamp bar was removed, and low torque (1.5 N) was applied to the screw. In addition, a welding location near the central parts of the fixture was selected. Two paper sheets, which did not cover the welding point, were placed between the metal sheets to help generate a gap. By contrast, to ensure proper contact between the layers of metal sheets, the welding location was moved near the clamp screw, the screw torque setting was high, and the central clamp bar was used. Table 2 presents a summary of the experimental parameters.
3. System Development and Verification
The correlation between selected features and bonding quality was analyzed by the scatter index that estimates the between-class scatter to within-class scatter ratio. The between-class scatter and within-class scatter are defined as follows [23]. The mean of features for each class was obtained using individual features :
where
class
pattern in a class
feature
.
The overall system mean is determined as follows:
where
The within-class scatter is obtained by calculating covariance for each feature as follows:
Moreover, the individual-class scatter is defined as follows:
From Equations (3) and (4), the feature selection criterion, a cost function, is defined as follows:
where
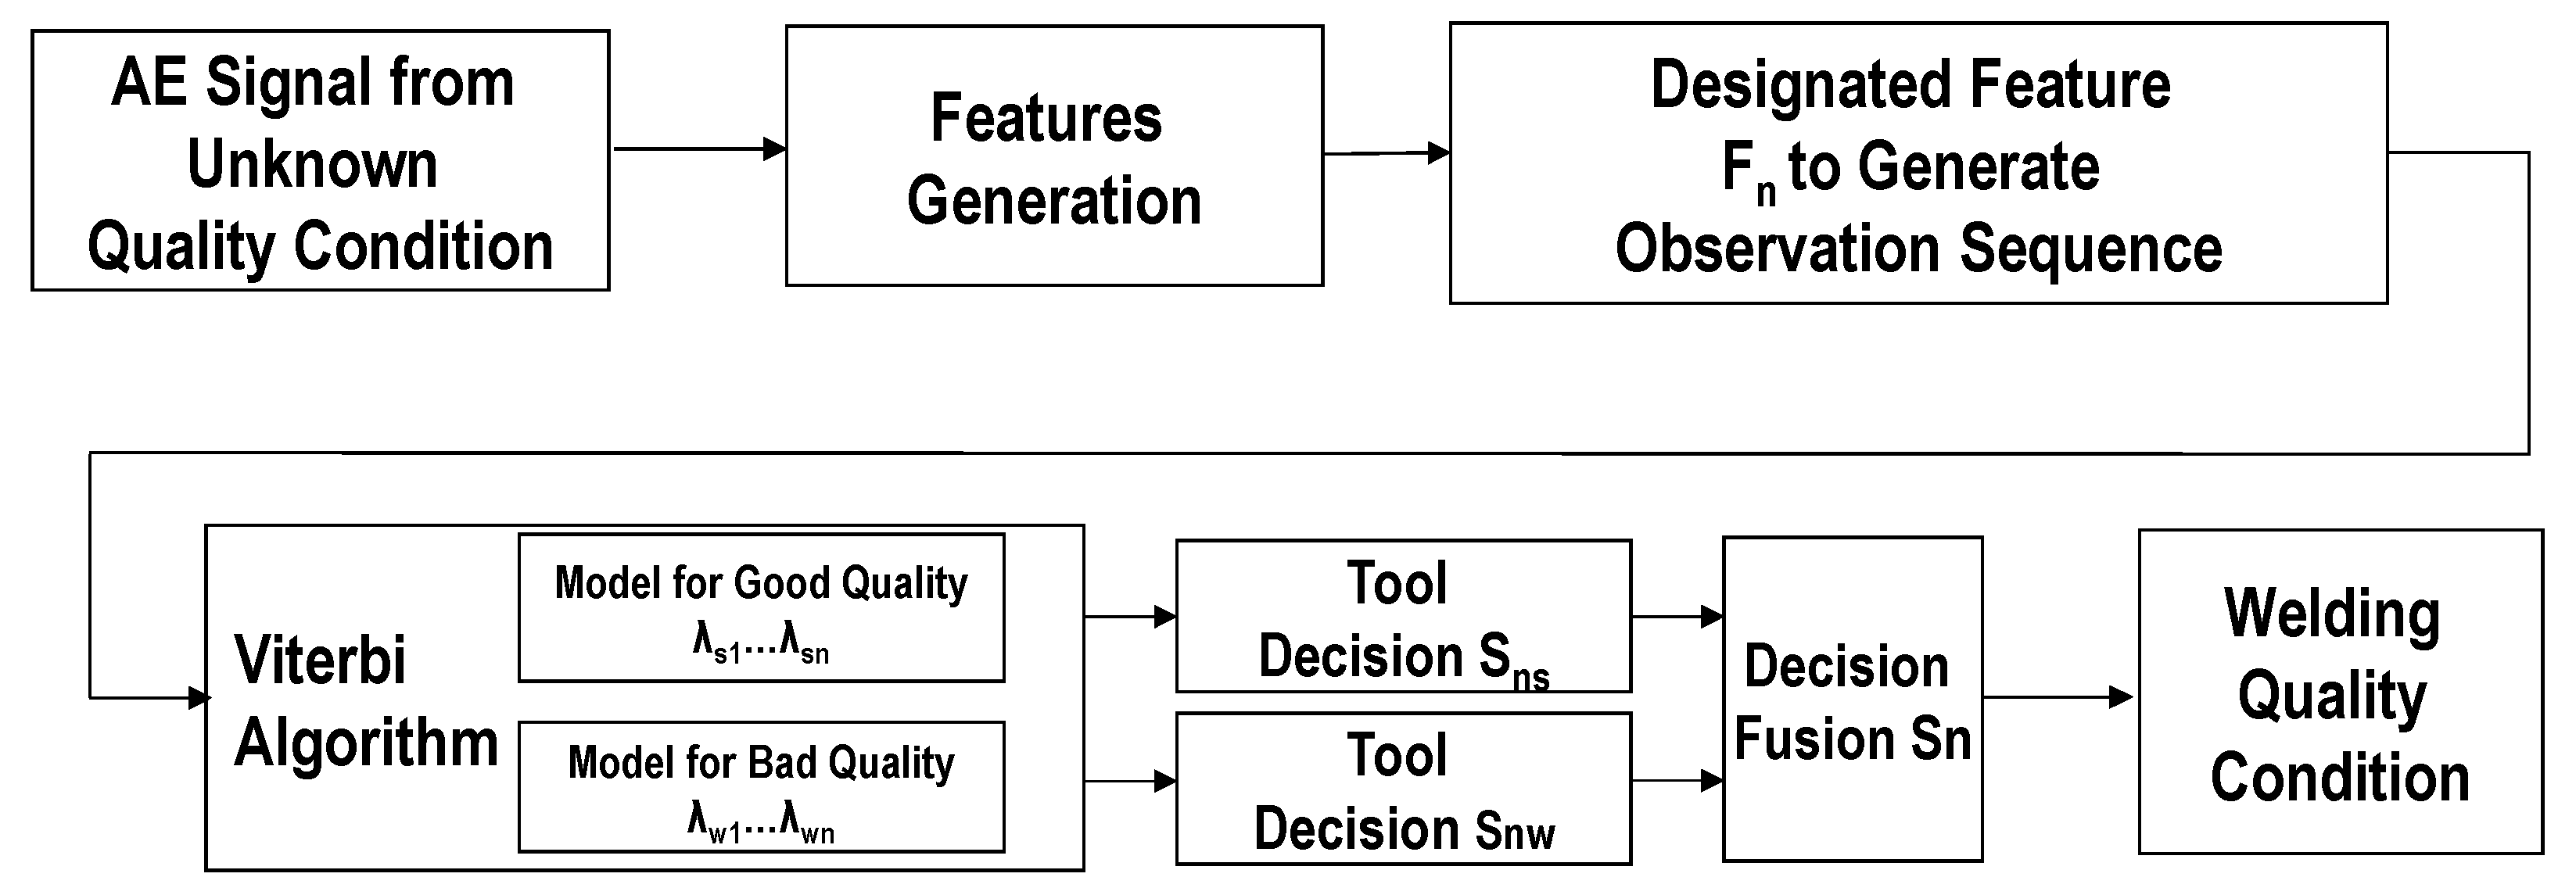
As soon as the features that are closely related to the welding quality were determined, the training AE signal features collected were used to train the HMMs for determining welding quality [24]. Once the models were developed, the unknown condition of welding quality was determined using collected AE signals with selected features and developed HMMs. The schematic of determining the unknown quality condition is illustrated in Figure 4, in which selected AE signal features, other than those used for model development, serve as input data to the system. In the system, to determine the quality, the quality state Sn based on selected features is determined by referring to the model with a large probability value of Sns and Snw based on Viterbi algorithm.
4. Results and Discussions
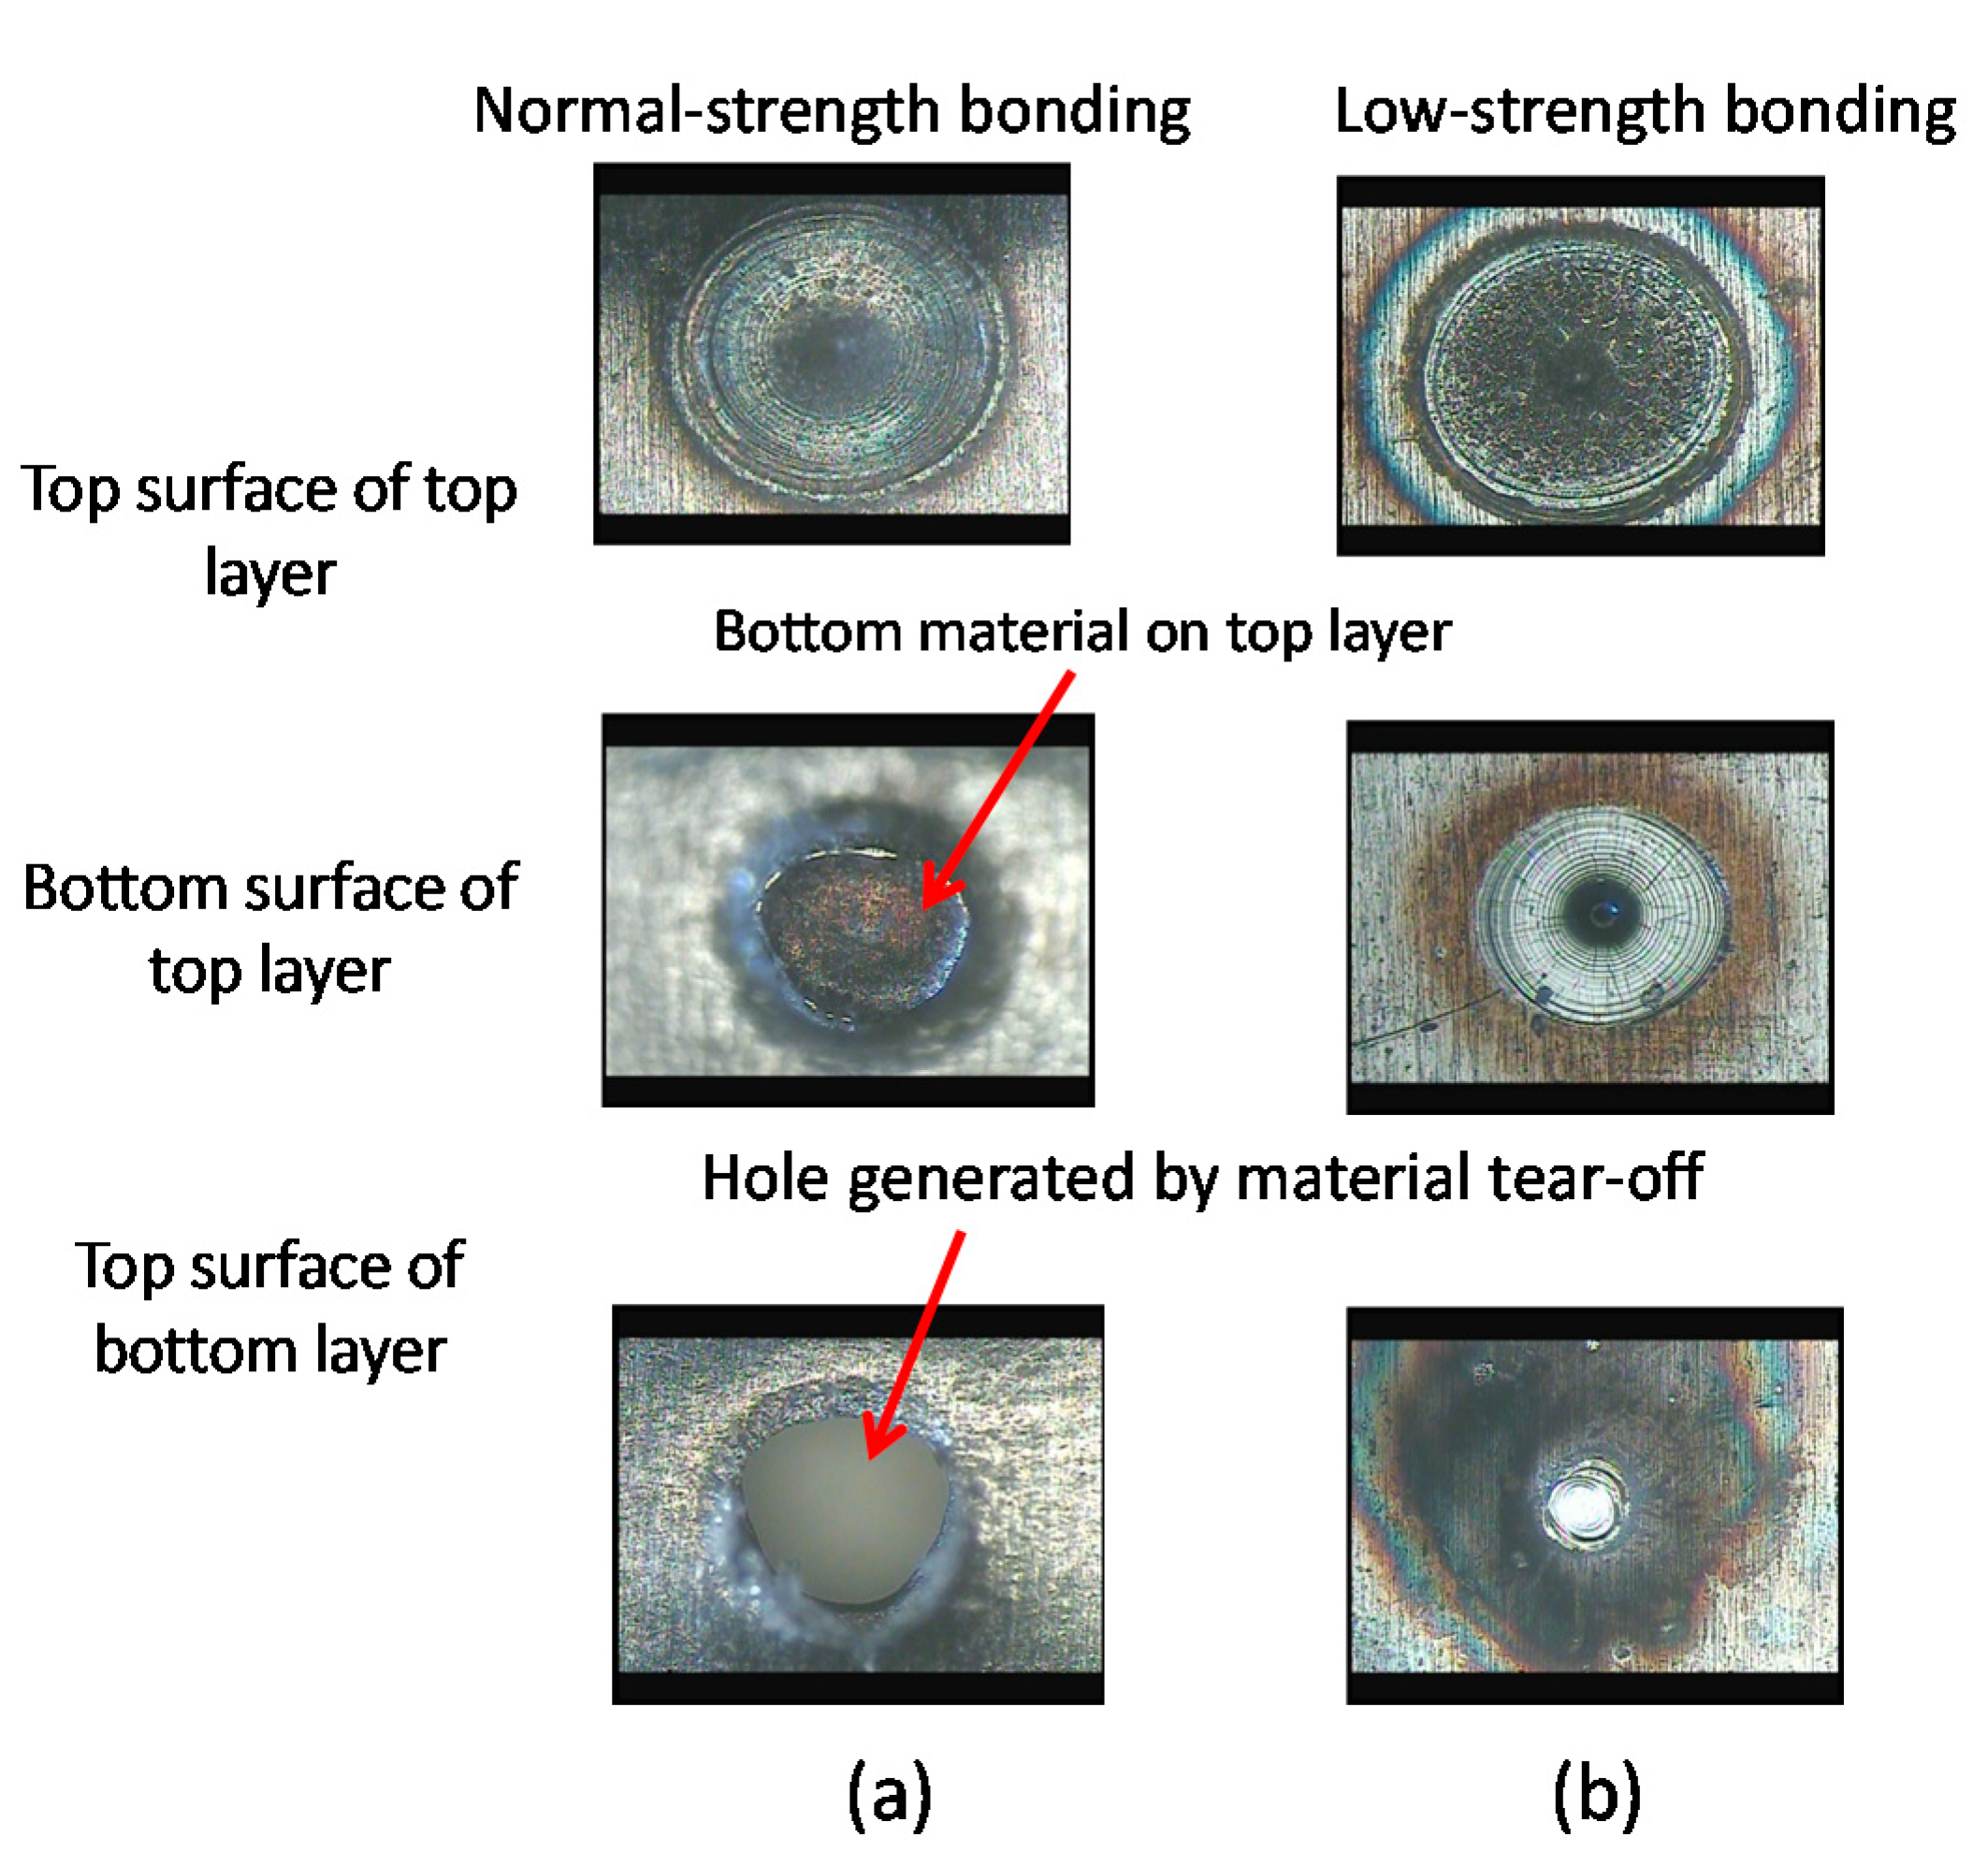
The AE signals studied in this work were collected simultaneously with the audible sound signals in the same experiments as in previous work [22]. Two experimental setups were used to obtain different contact conditions between the two layers of metal sheets. The peeling test was performed to verify the joint bonding strength, and the surface condition of each broken joint was investigated using an optical microscope after the peeling test. Figure 5 illustrates the conditions of the top and bottom surfaces of both layers of metal sheets after peeling [22]. The surface condition presented in Figure 5a was obtained from a case with a peeling force of >15 N and considered to be a normal joint. The surface condition presented in Figure 5b was obtained for a case with low peeling force and considered to be a loss of contact between layers and an unqualified joint. Figure 5a reveals clear tearing of the material on the bottom layer, and the part of material that was removed appears on the bottom surface of the top layer of the sample. By contrast, no material was removed from the bottom layer of the sample (Figure 5b), and only a magnified view of the heat effect observed on the bottom surface of the top layer and the top surface of the bottom layer is presented. This result suggests that no relevant joint was created between the two layers of the welded sample when the gap was generated. The range of peeling forces used for the proper contact cases was 12–17 N. No peeling force was obtained for the low-strength bonding because complete peeling occurred abruptly upon initiation of the peeling test.
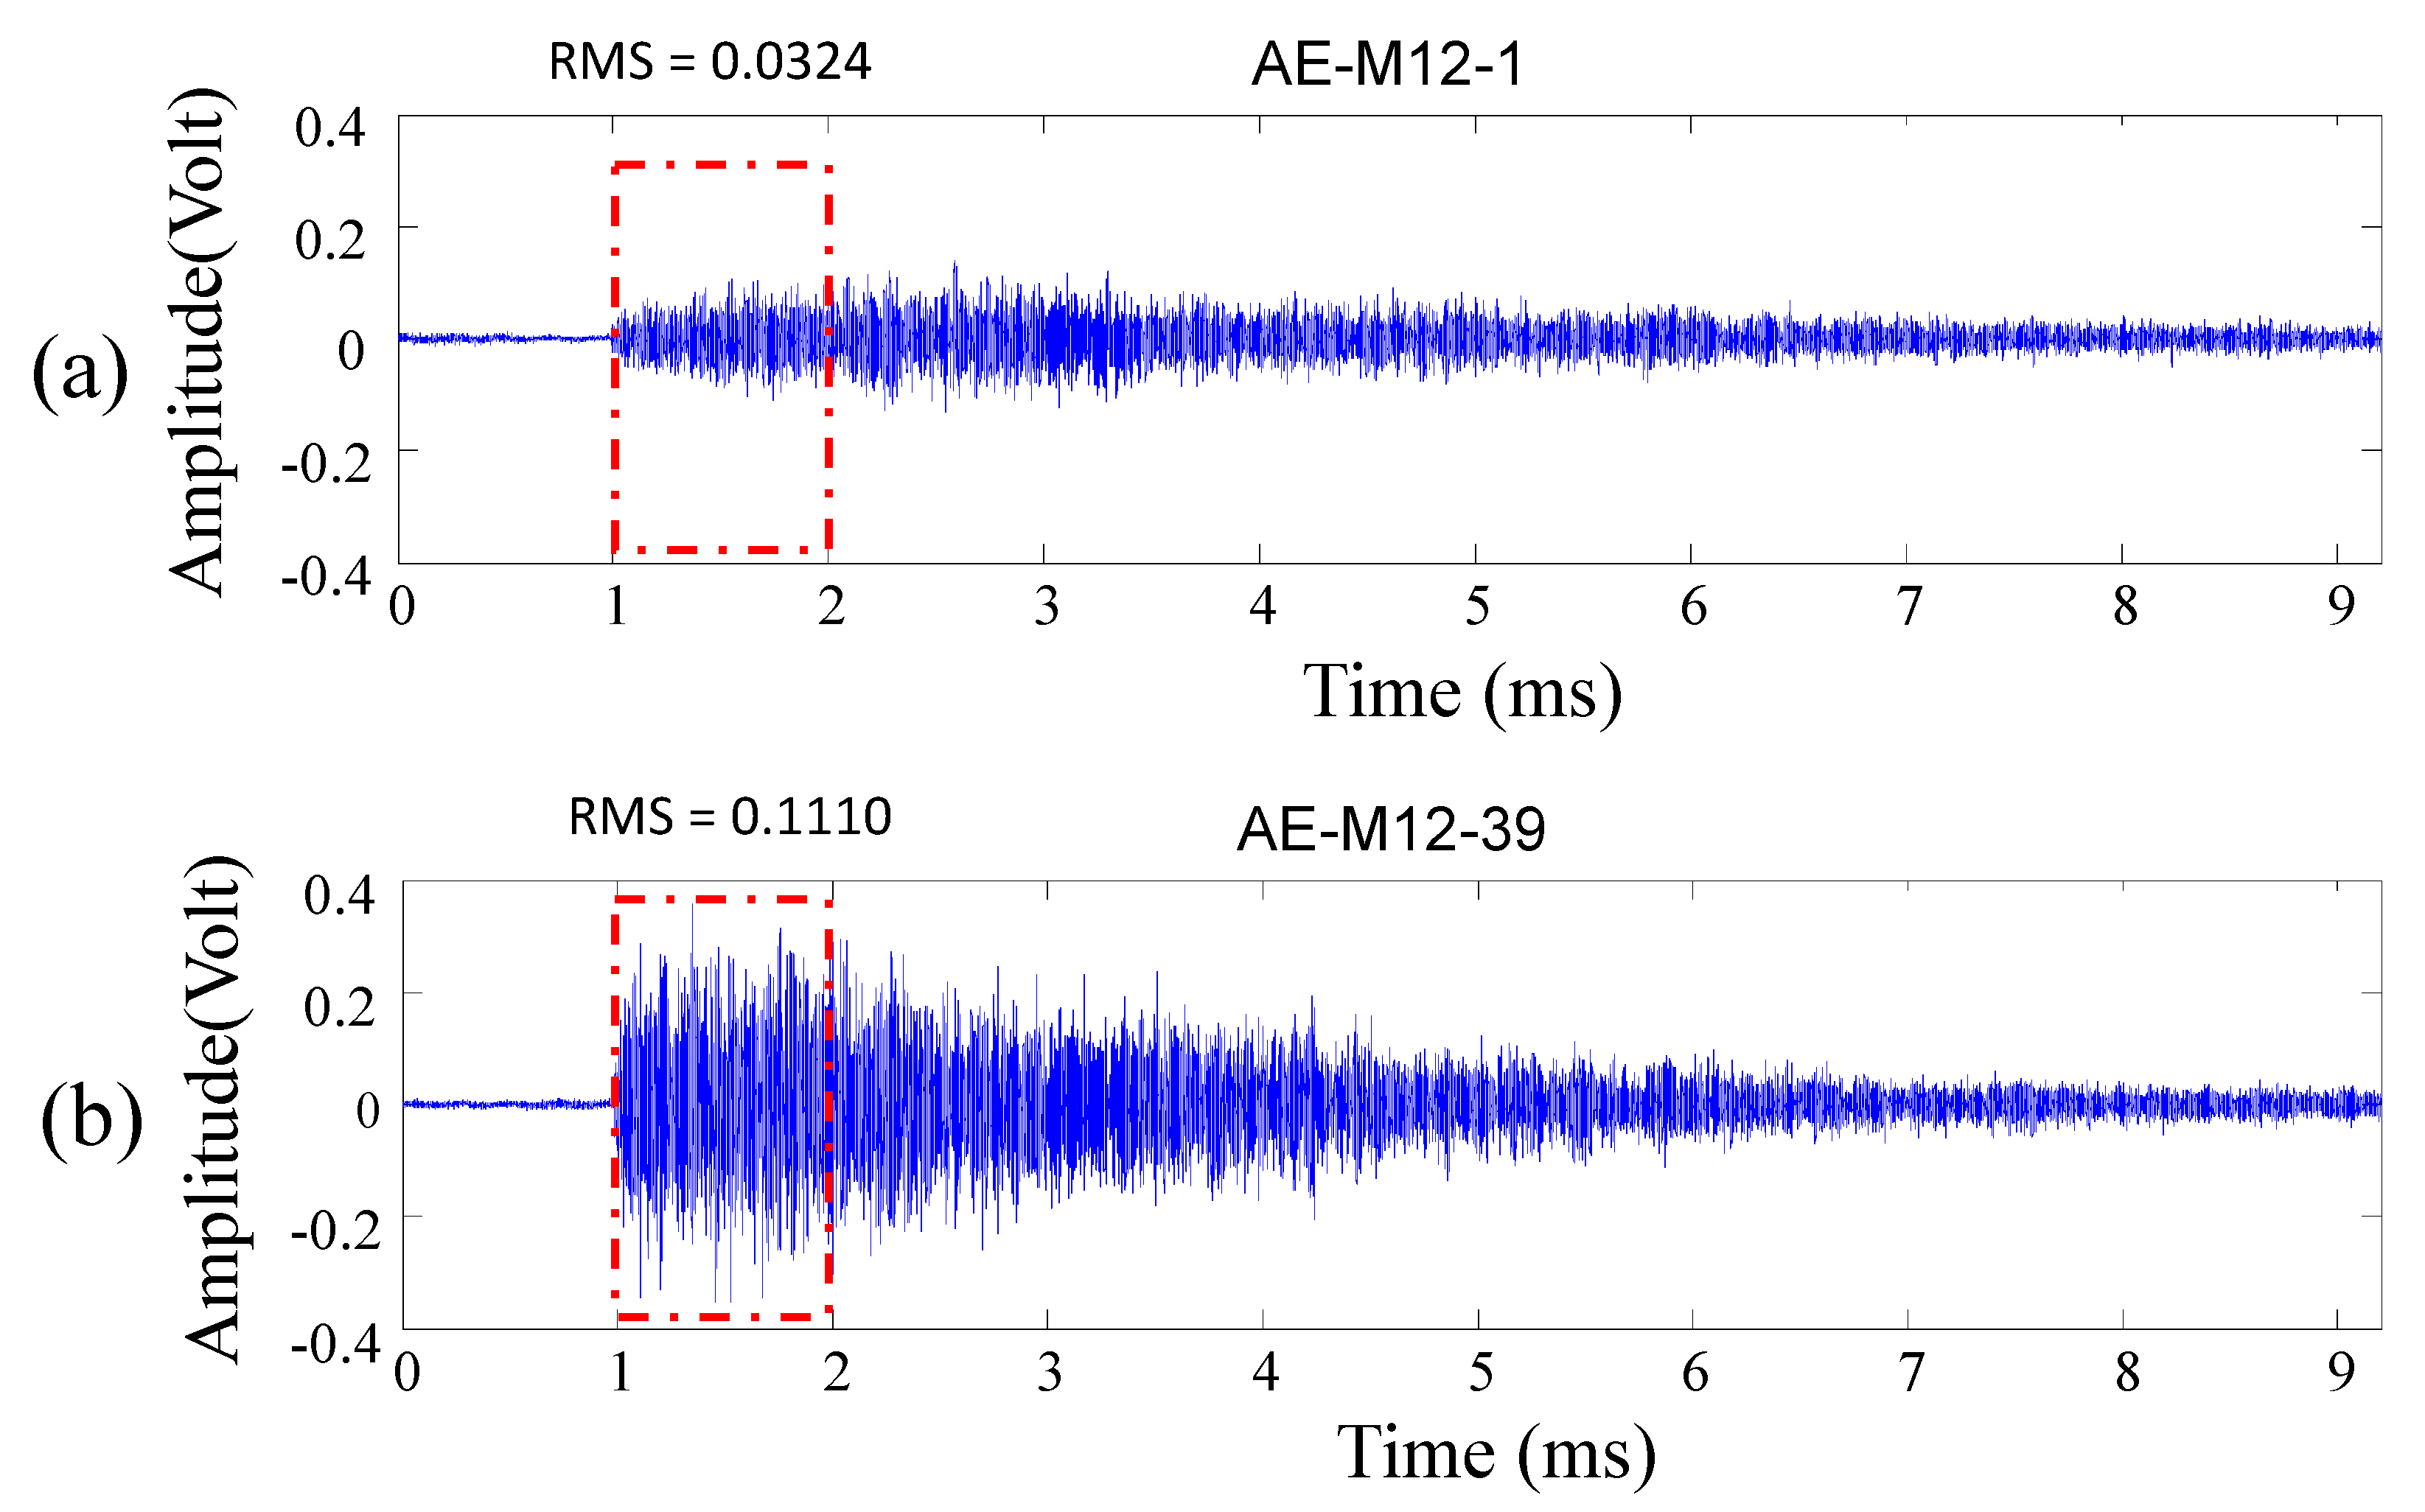
The AE signal was generated immediately after the contact of the laser beam with the sample surface. Figure 6 presents the AE signals collected from cases with normal or low joint strength. Different patterns for the two cases were obtained in the first 1 ms of welding, possibly because various thermal transmission patterns were caused by the different contact conditions between the two layers of metal sheets. Moreover, for the first 4 ms of welding, the energy of AE signals from joints with normal bonding strength was higher than that of the signals from the joints with low bonding strength. The observation matches well the fundamental AE signal generation mechanism in that the higher energy of the AE signal could be generated before the weld pool is created completely because of the higher strain rate generated by thermal expansion on solid material in that period.
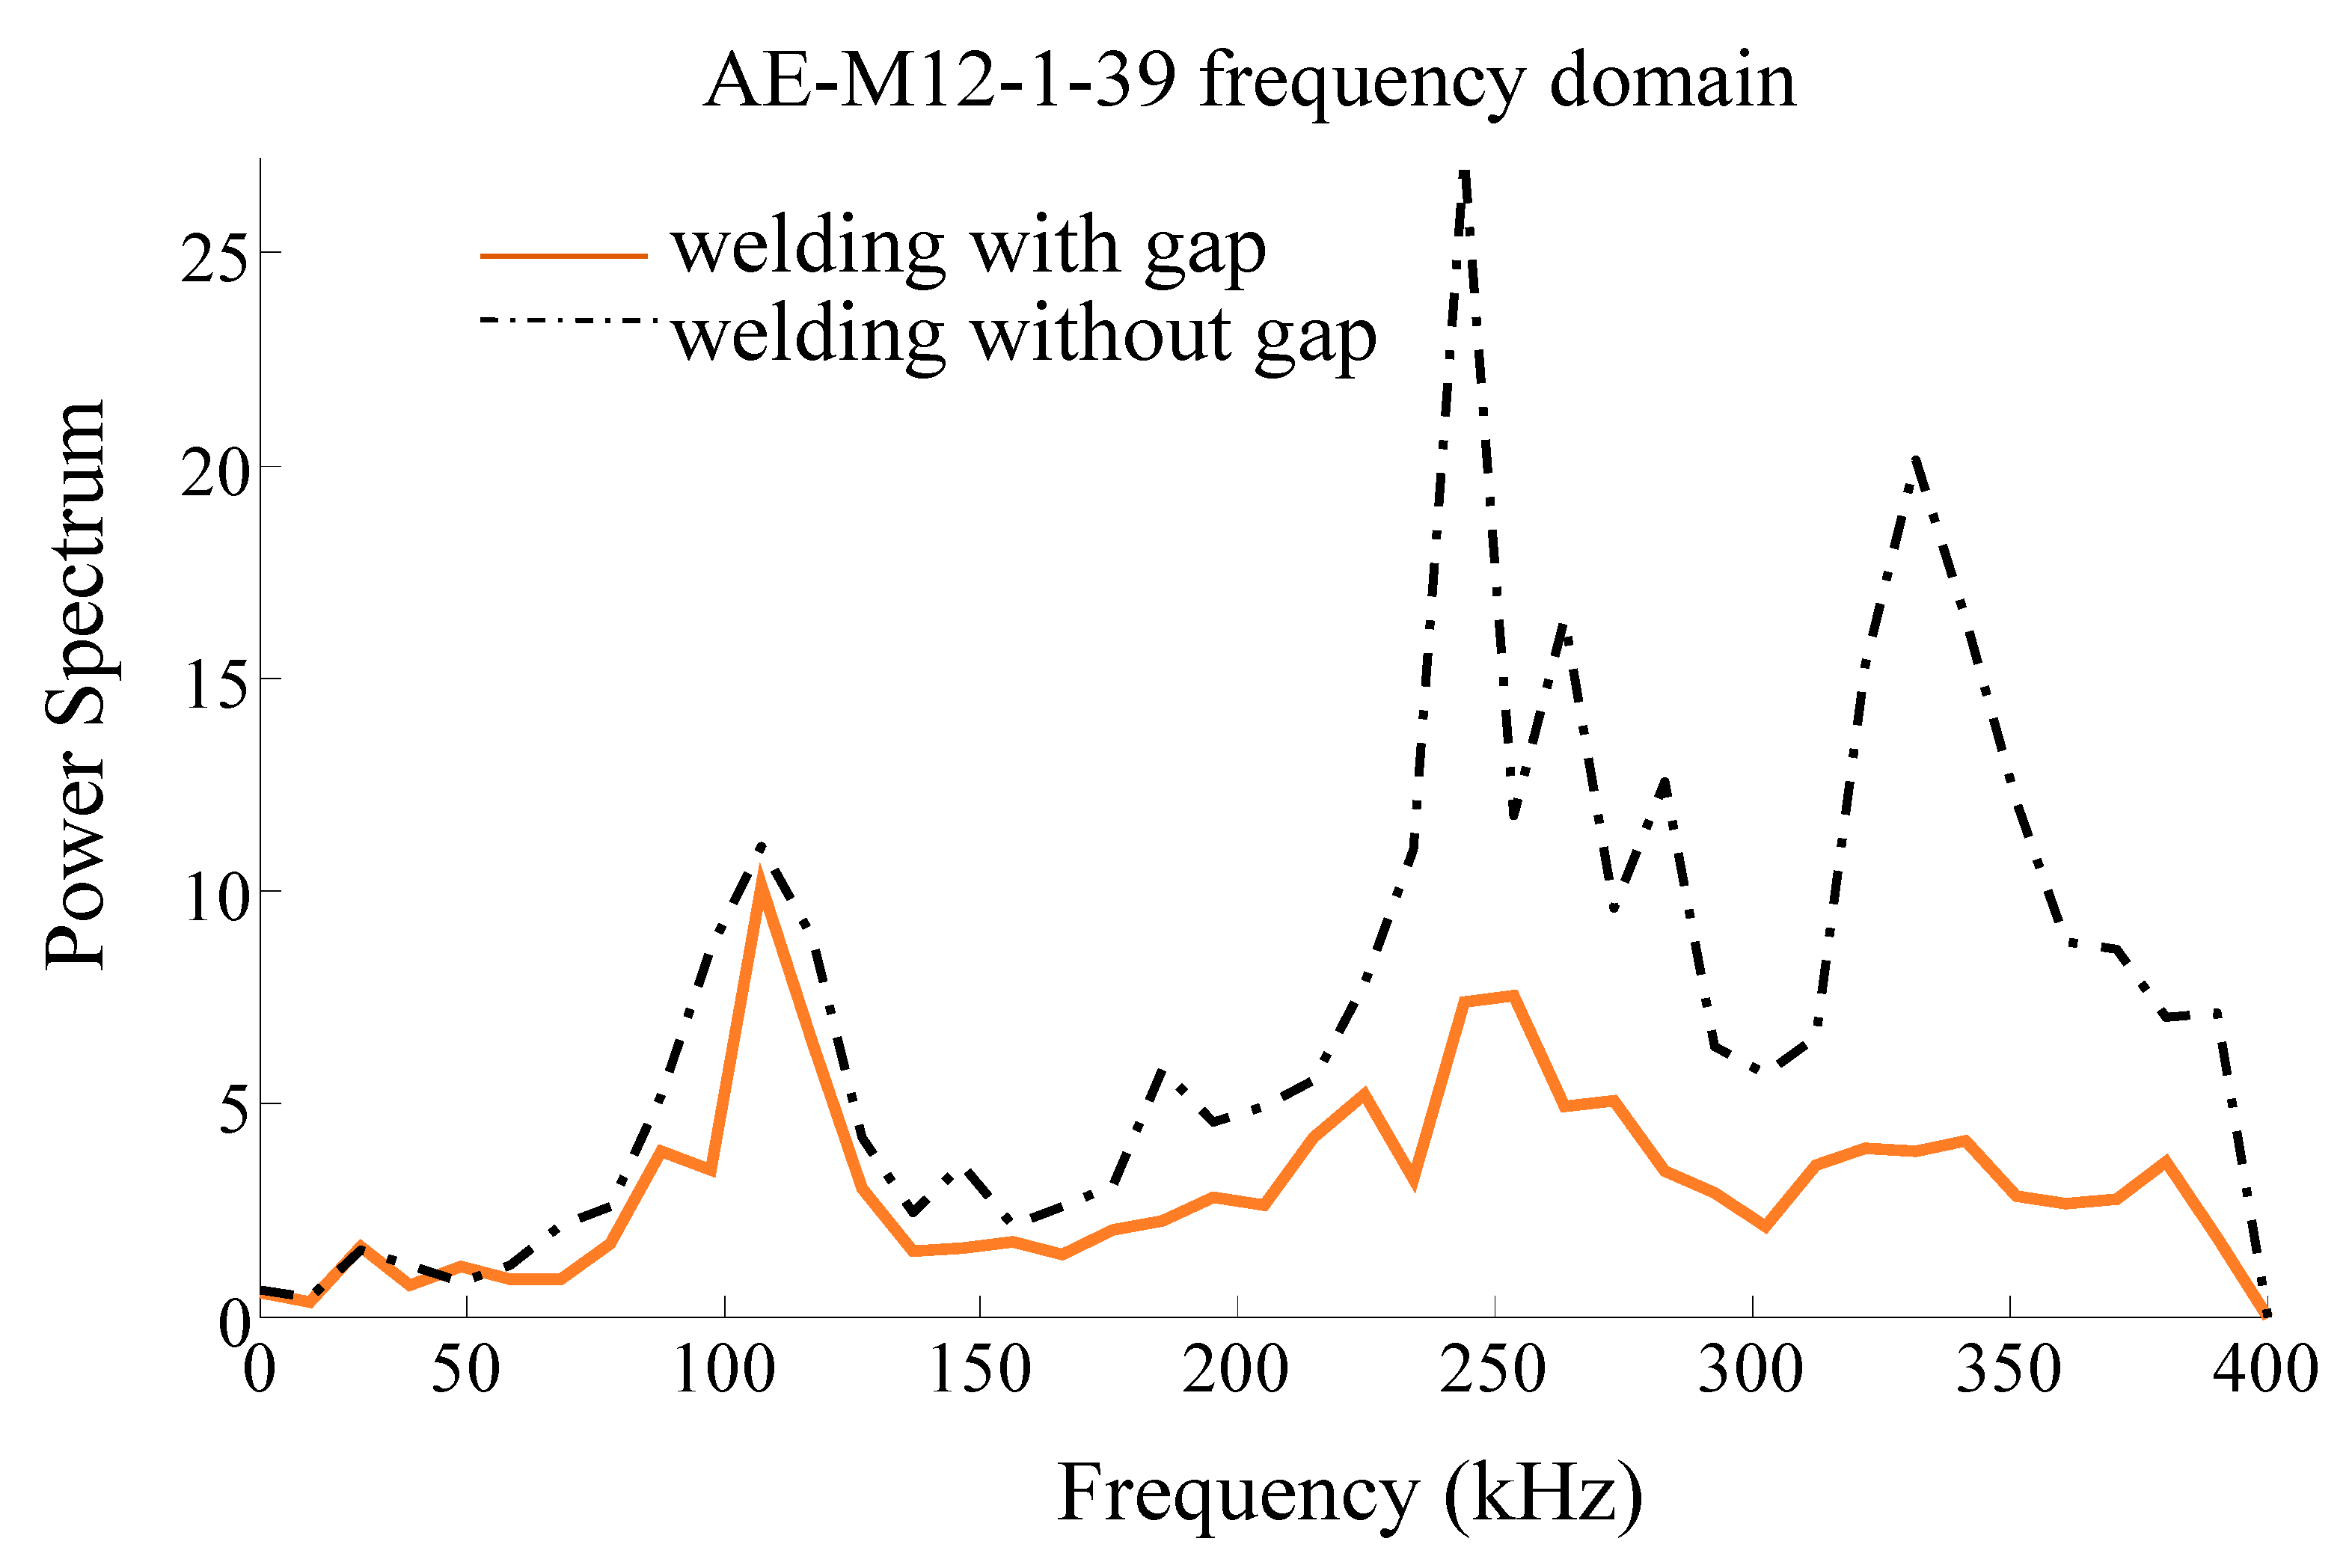
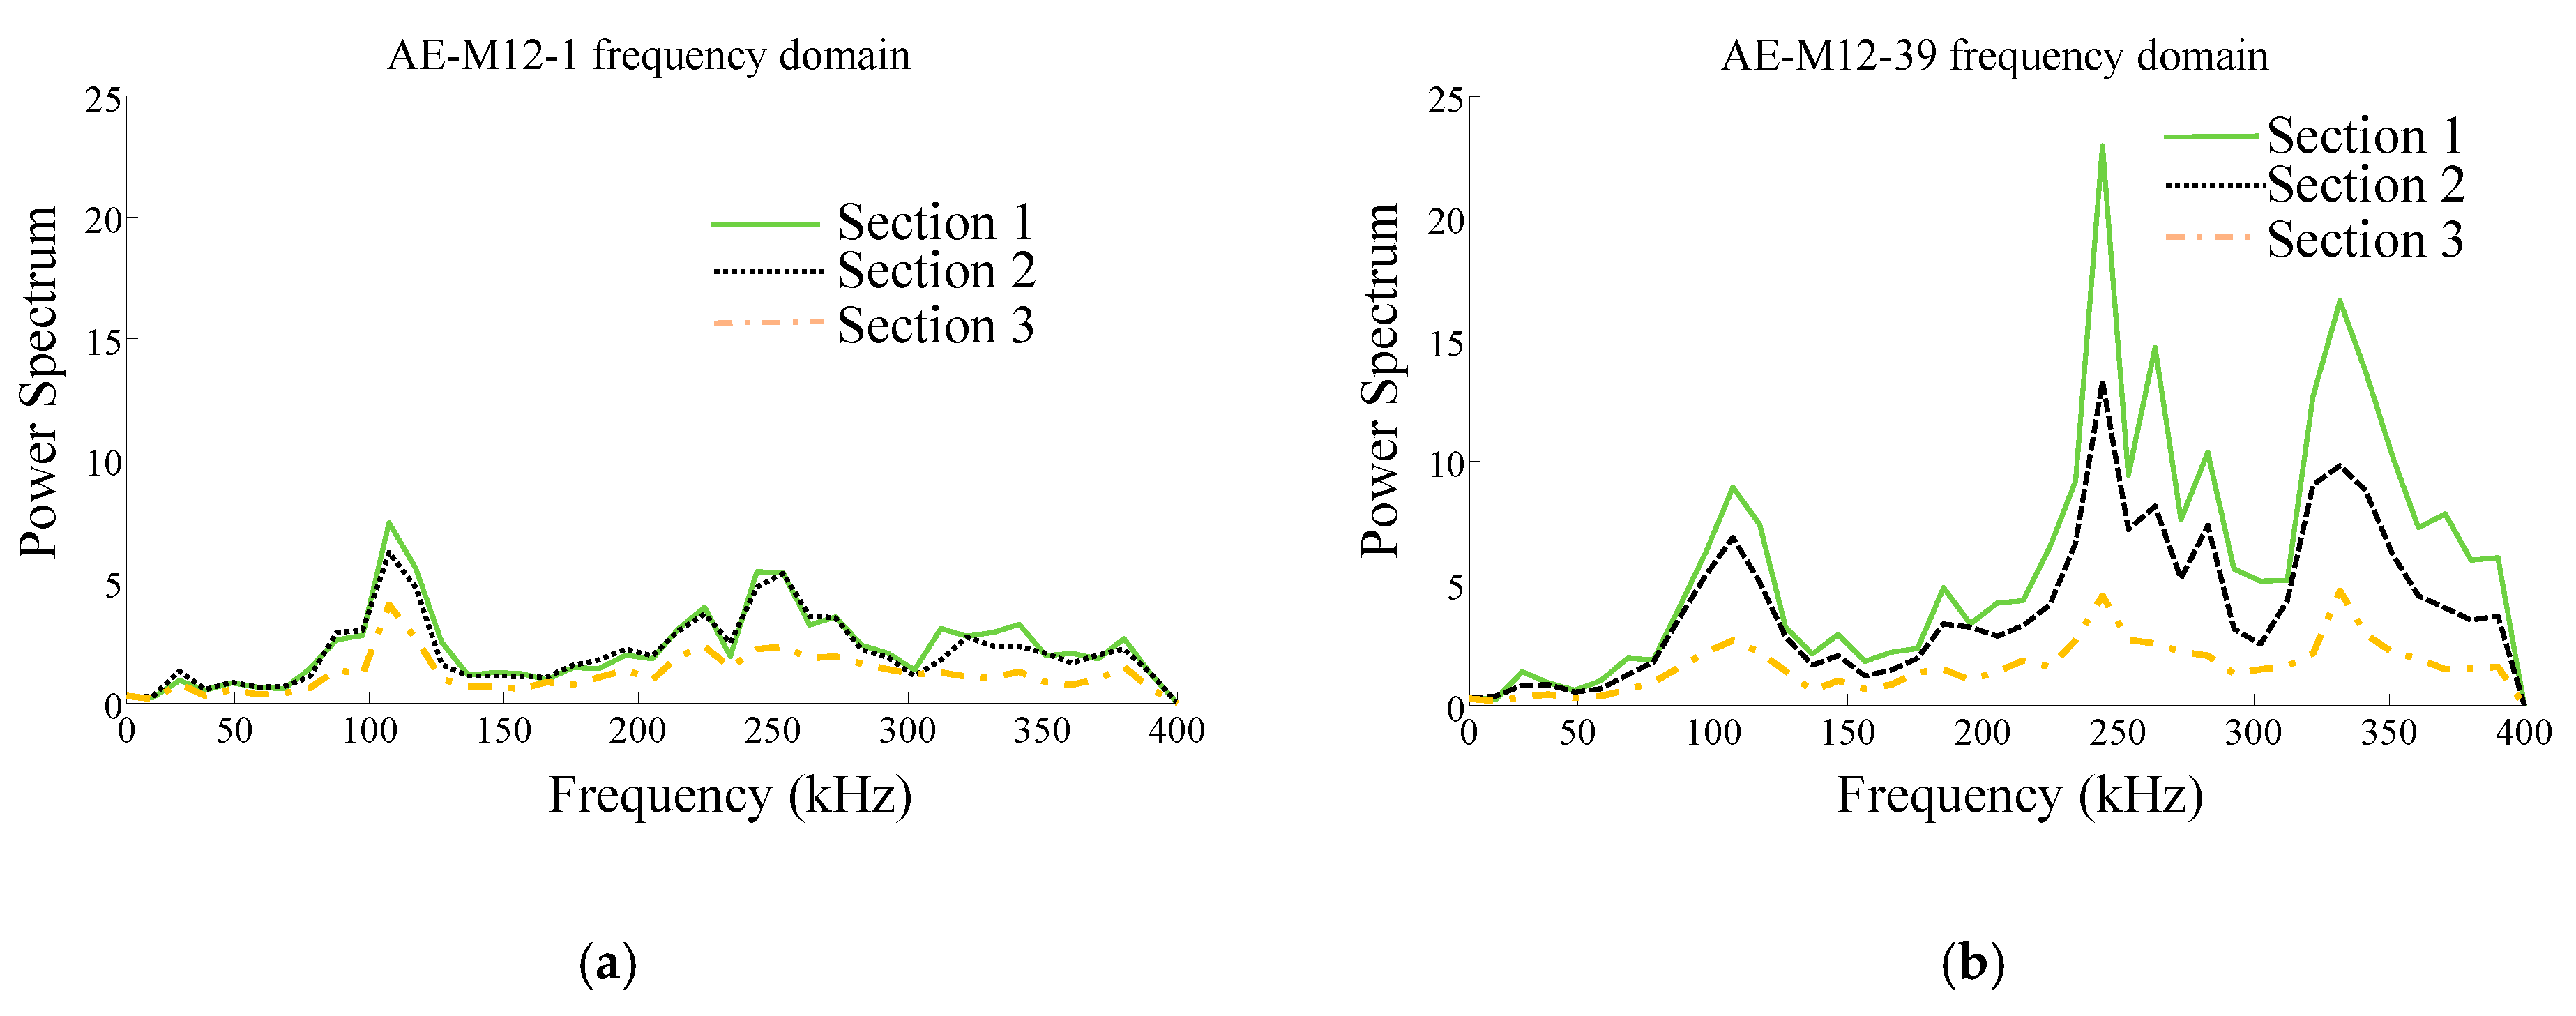
Since the signal in the initial 3 ms might contain more information regarding the weld pool generation, the signal in the initial 3 ms was used to extract the features of the frequency domain that are closely related to joint bonding strength. Figure 7 presents the frequency domain of the first 1 ms of AE signals for both cases. The results indicate no considerable difference between the signal energy for both cases at frequencies of <150 kHz. However, the energy level of signals of >150 kHz for normal bonding strength was higher than that for the case with low joint bonding strength. This indicates that the energy level of the time domain signal in the first 1 ms of welding and frequency domain features are promising features for identifying low joint bonding strength. Figure 8 presents the frequency domain signals for the first three (of eight) 1 ms welding intervals.
For the case with the low bonding strength (Figure 8a), the energy level was the same for the first two 1 ms intervals, and that for the third interval was not much lower. However, unlike those in Figure 8a, the energy levels of the frequency-domain AE signals obtained for the first three 1 ms intervals of welding (Figure 8b) differed for normal and low bonding strength, especially for signals of >200 kHz. Therefore, the frequency signals for the first millisecond of welding were considered suitable features for the development of a monitoring system to identify the loss of bonding strength caused by gaps generated during welding.
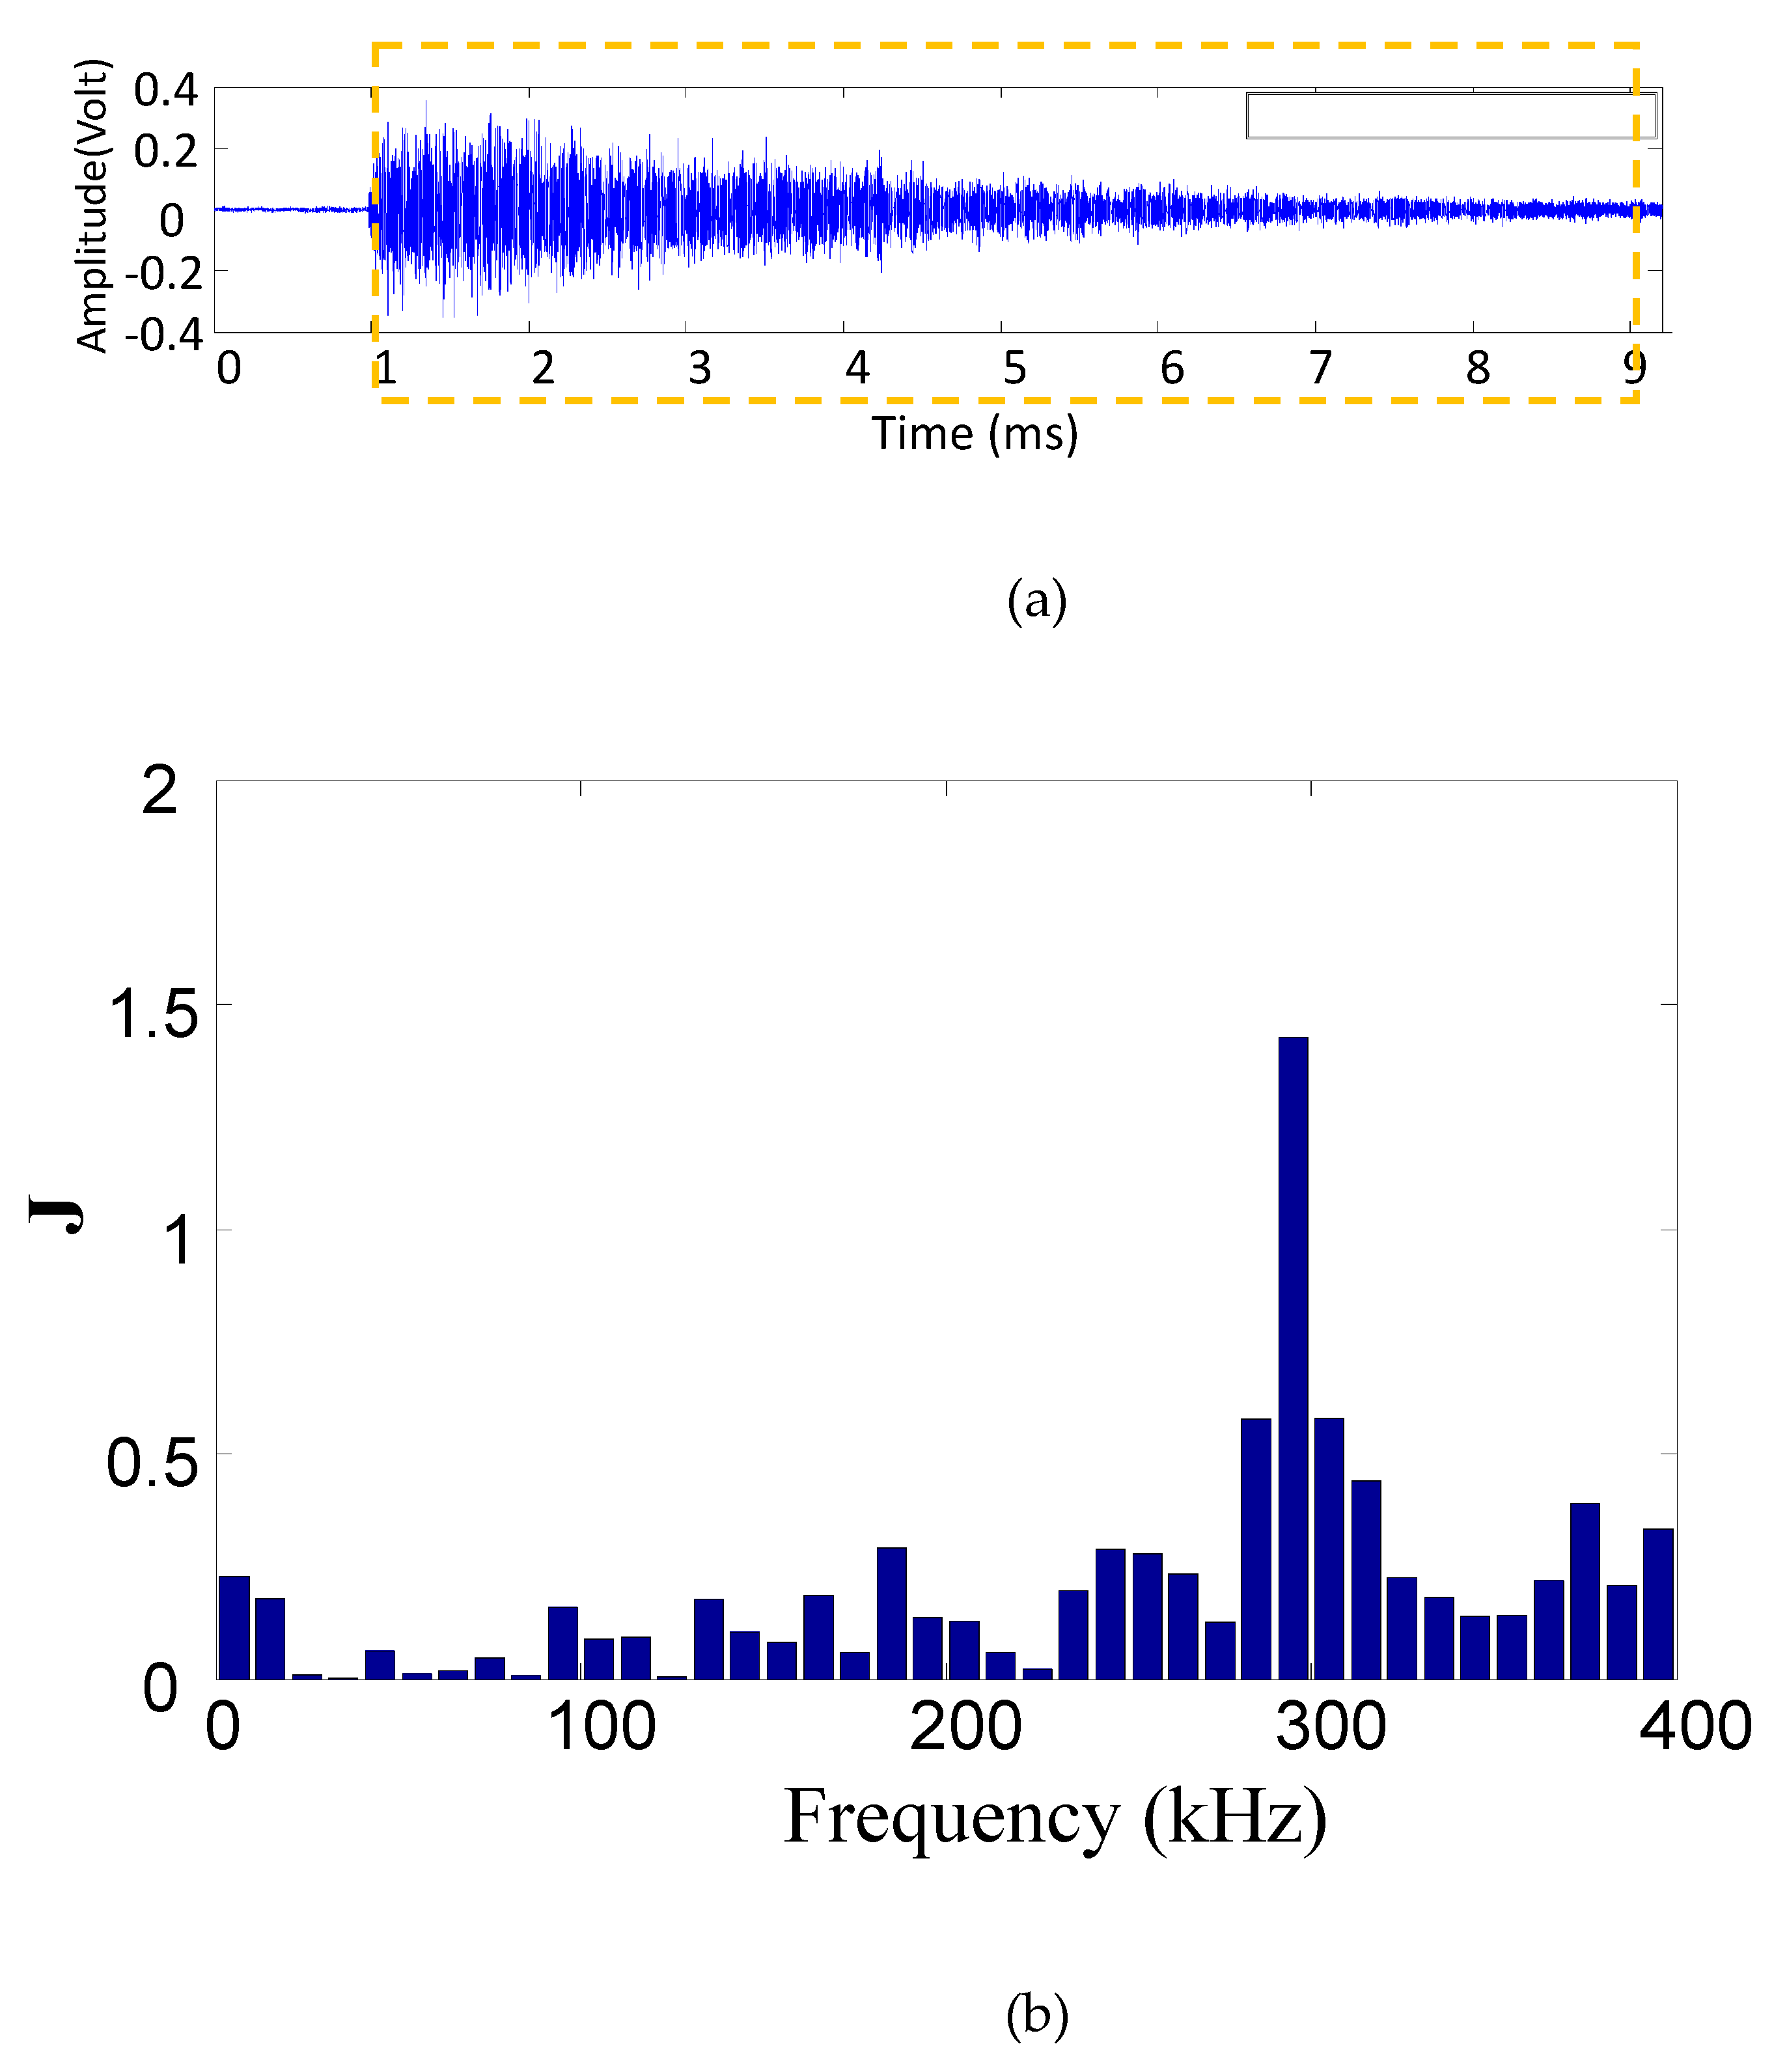
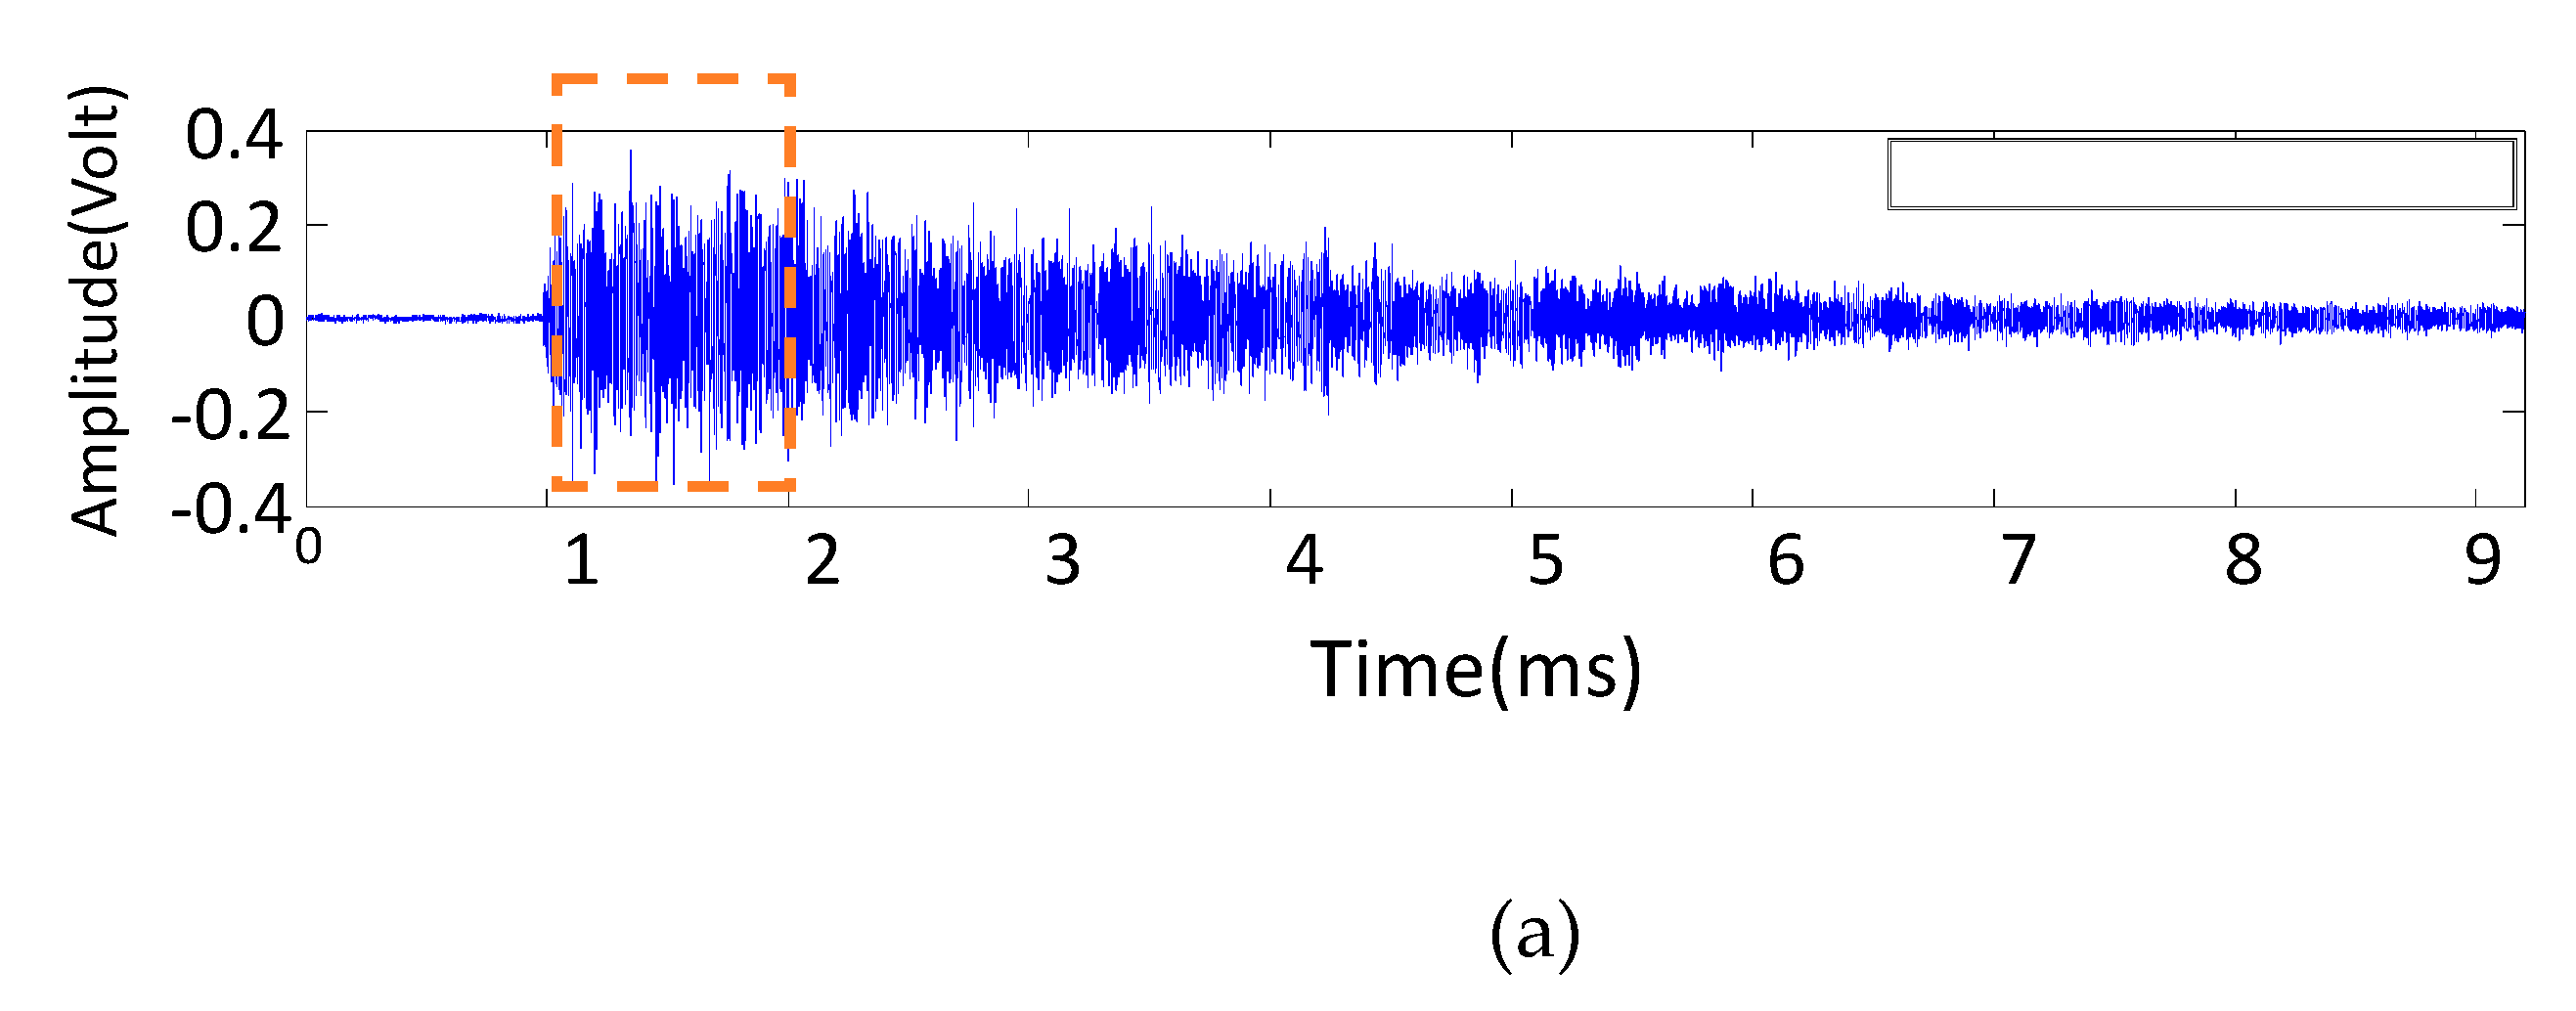
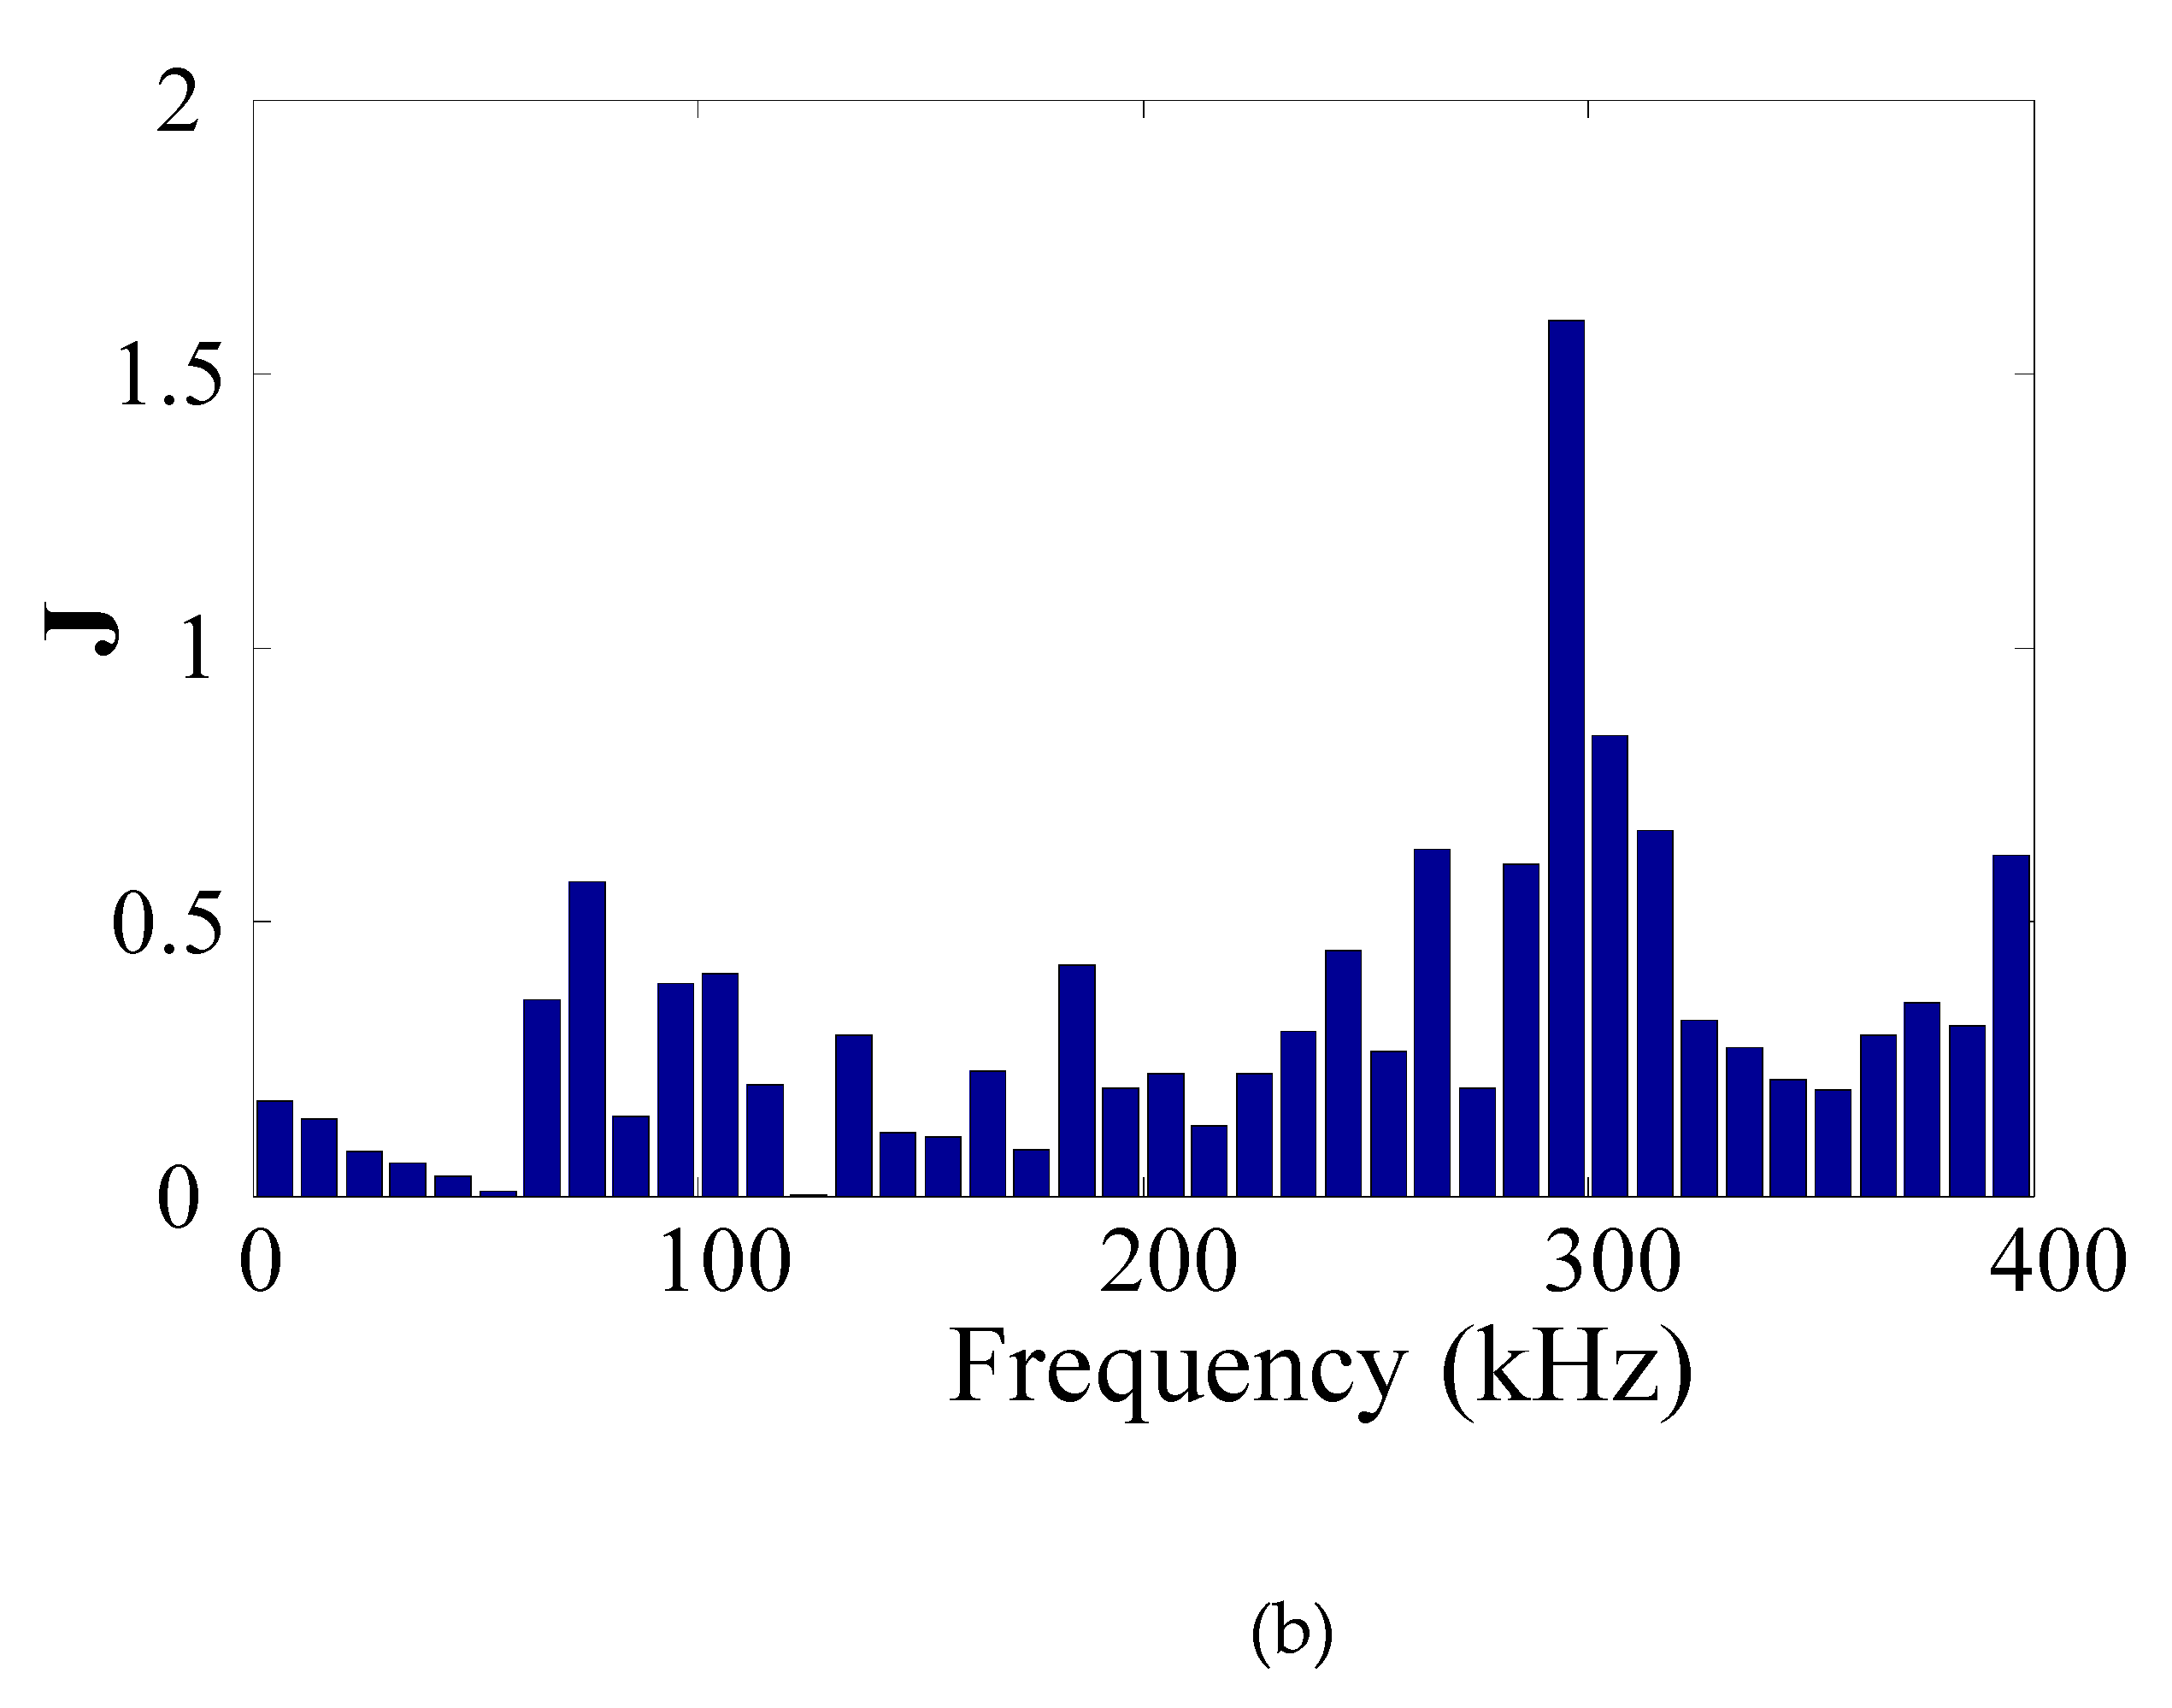
To determine the ability of each feature to identify joint bonding conditions, an index J, based on the ratio of between-class to in-class distribution, was obtained for each of the three aforementioned features for each of the first three 1 ms intervals. The index calculated for all frequency-domain features generated from the AE signals collected during laser operation (Figure 9). The feature with the highest J was obtained at 300 kHz. Figure 10 presents J for signals collected only in the first millisecond of laser operation. The feature with the highest J was located at 300 kHz; moreover, its J was higher than that presented in Figure 9 for the same frequency. This result agrees well with the findings presented in Figure 7 and Figure 8.
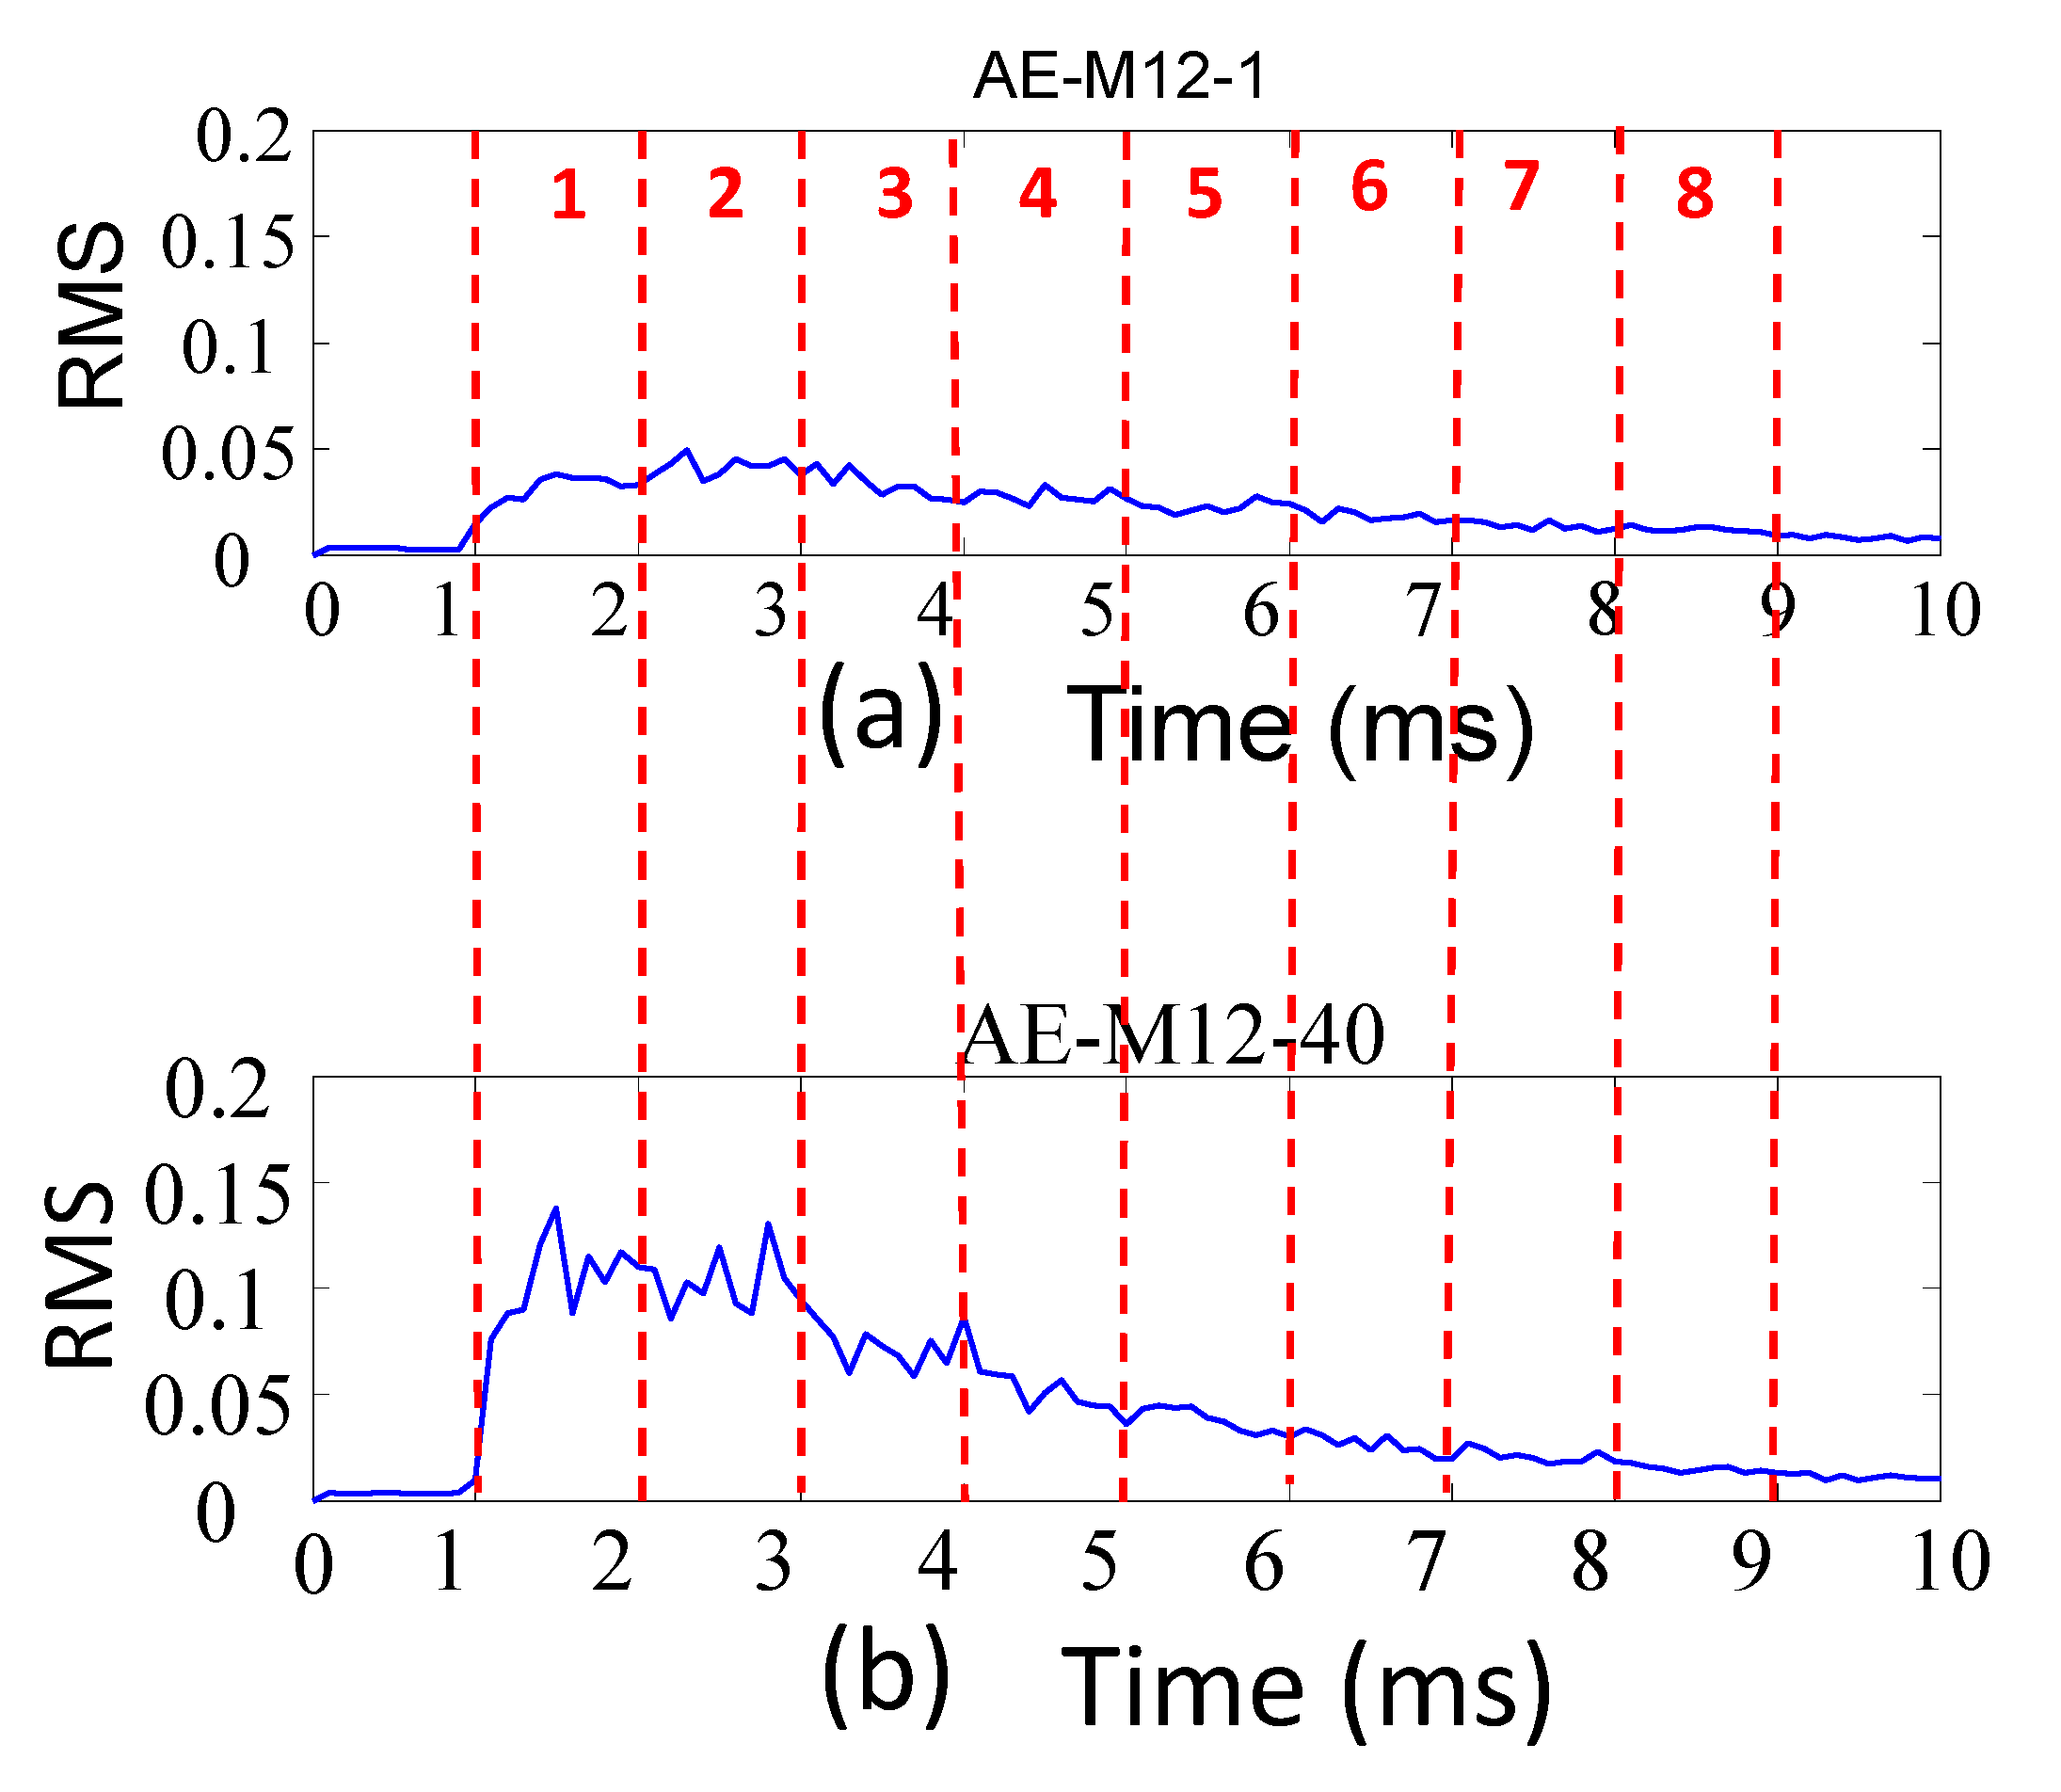
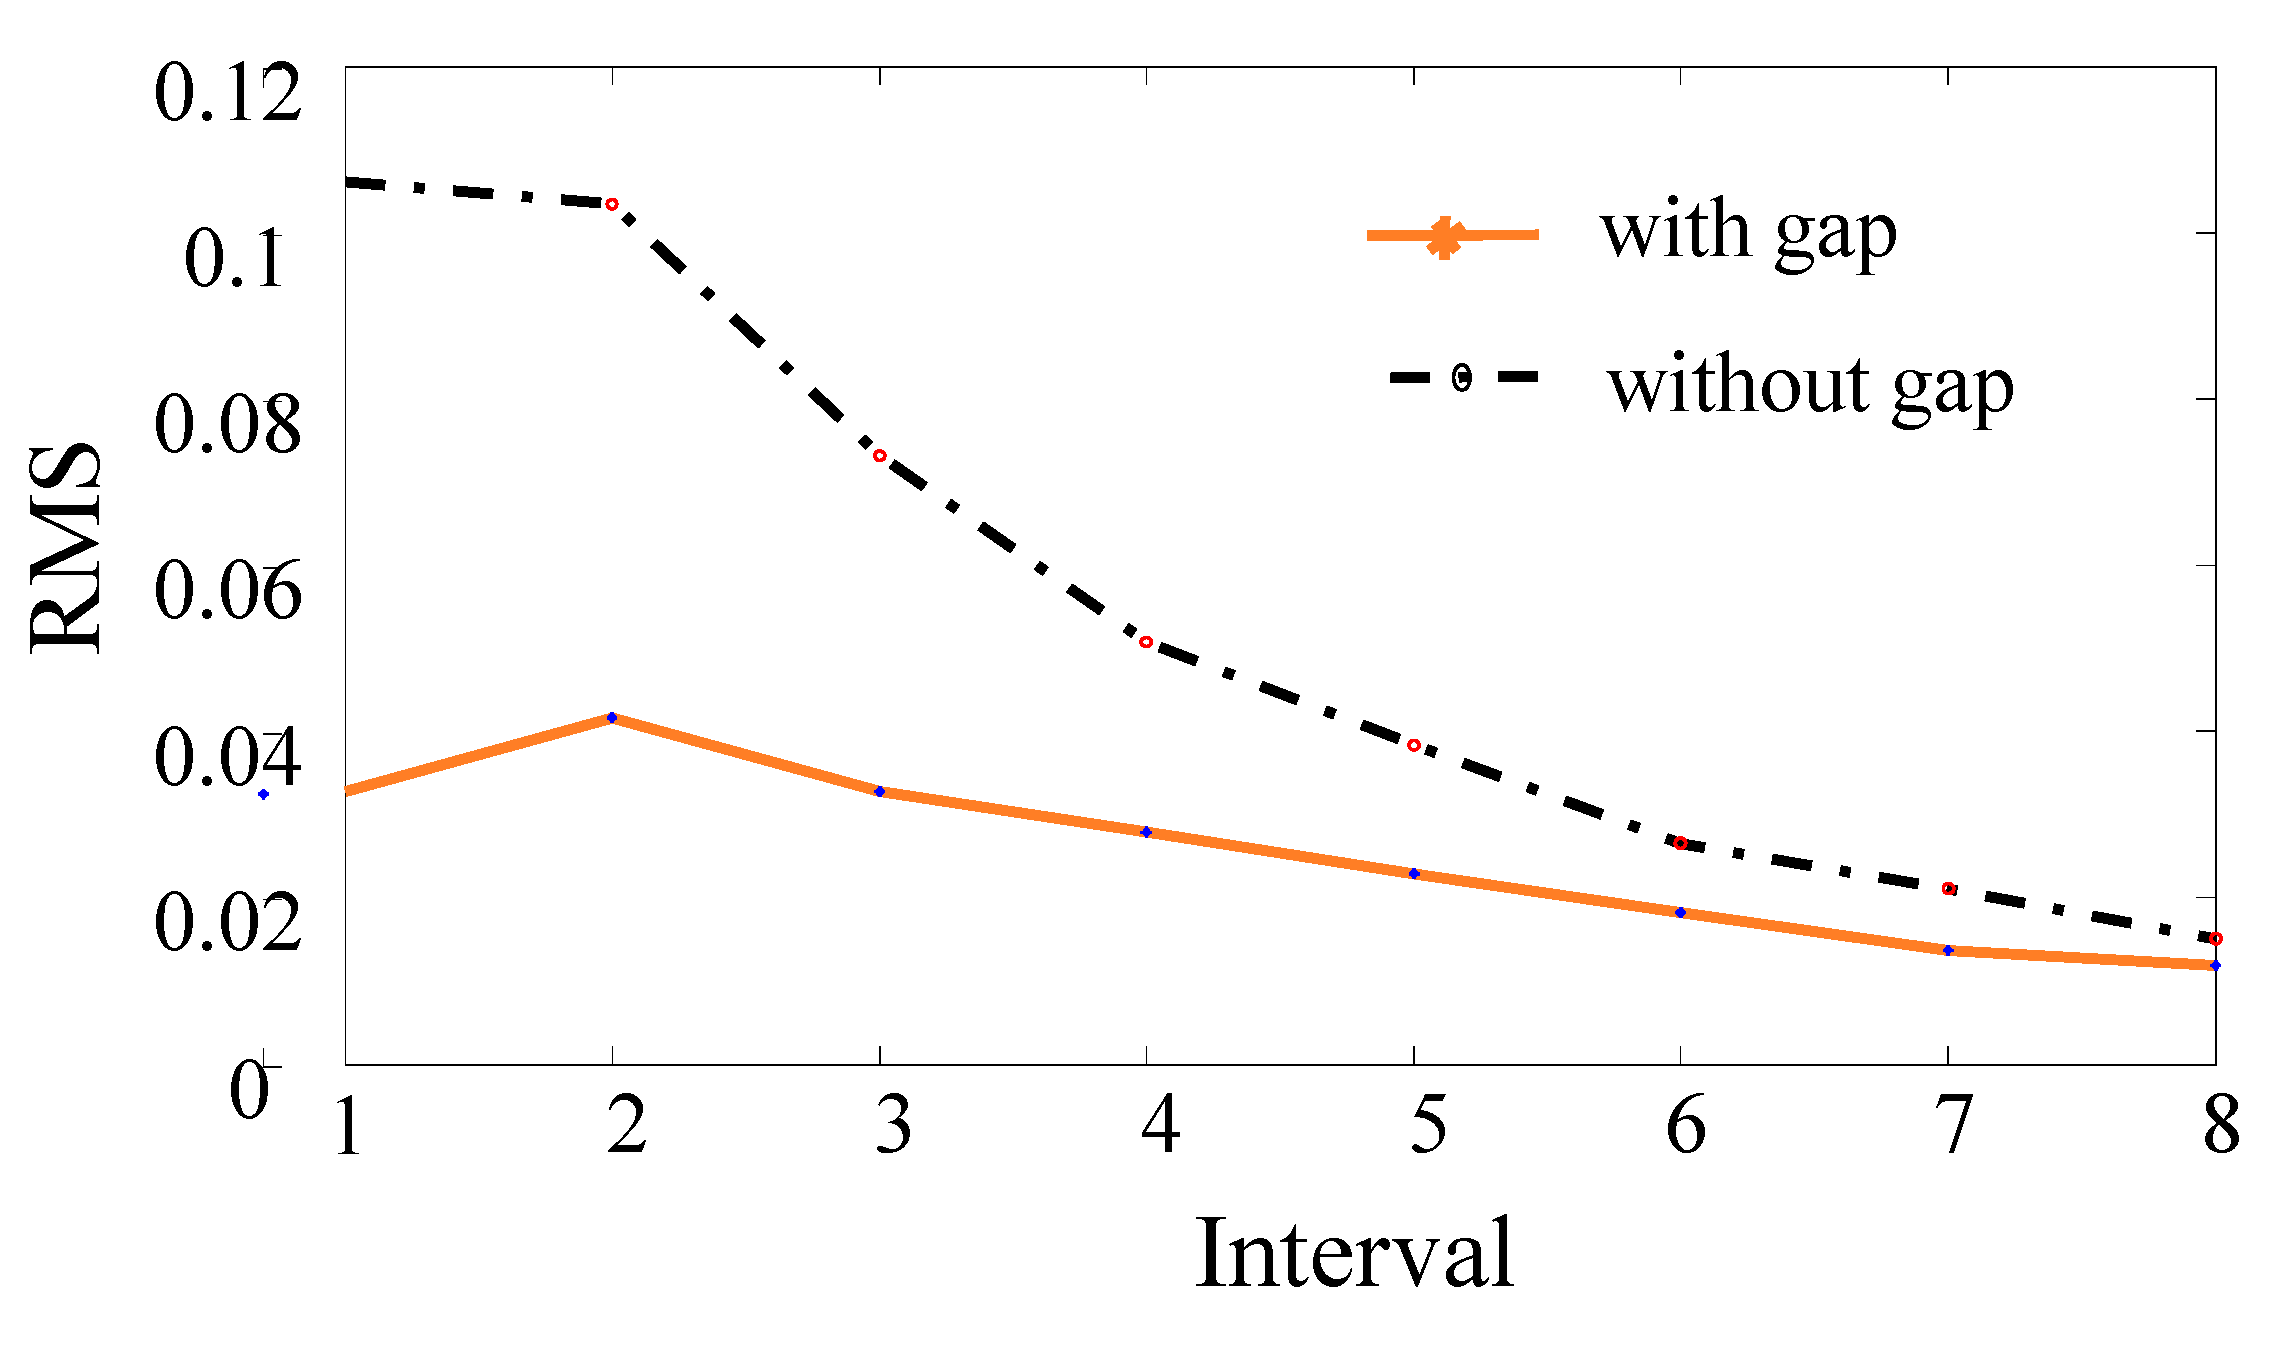
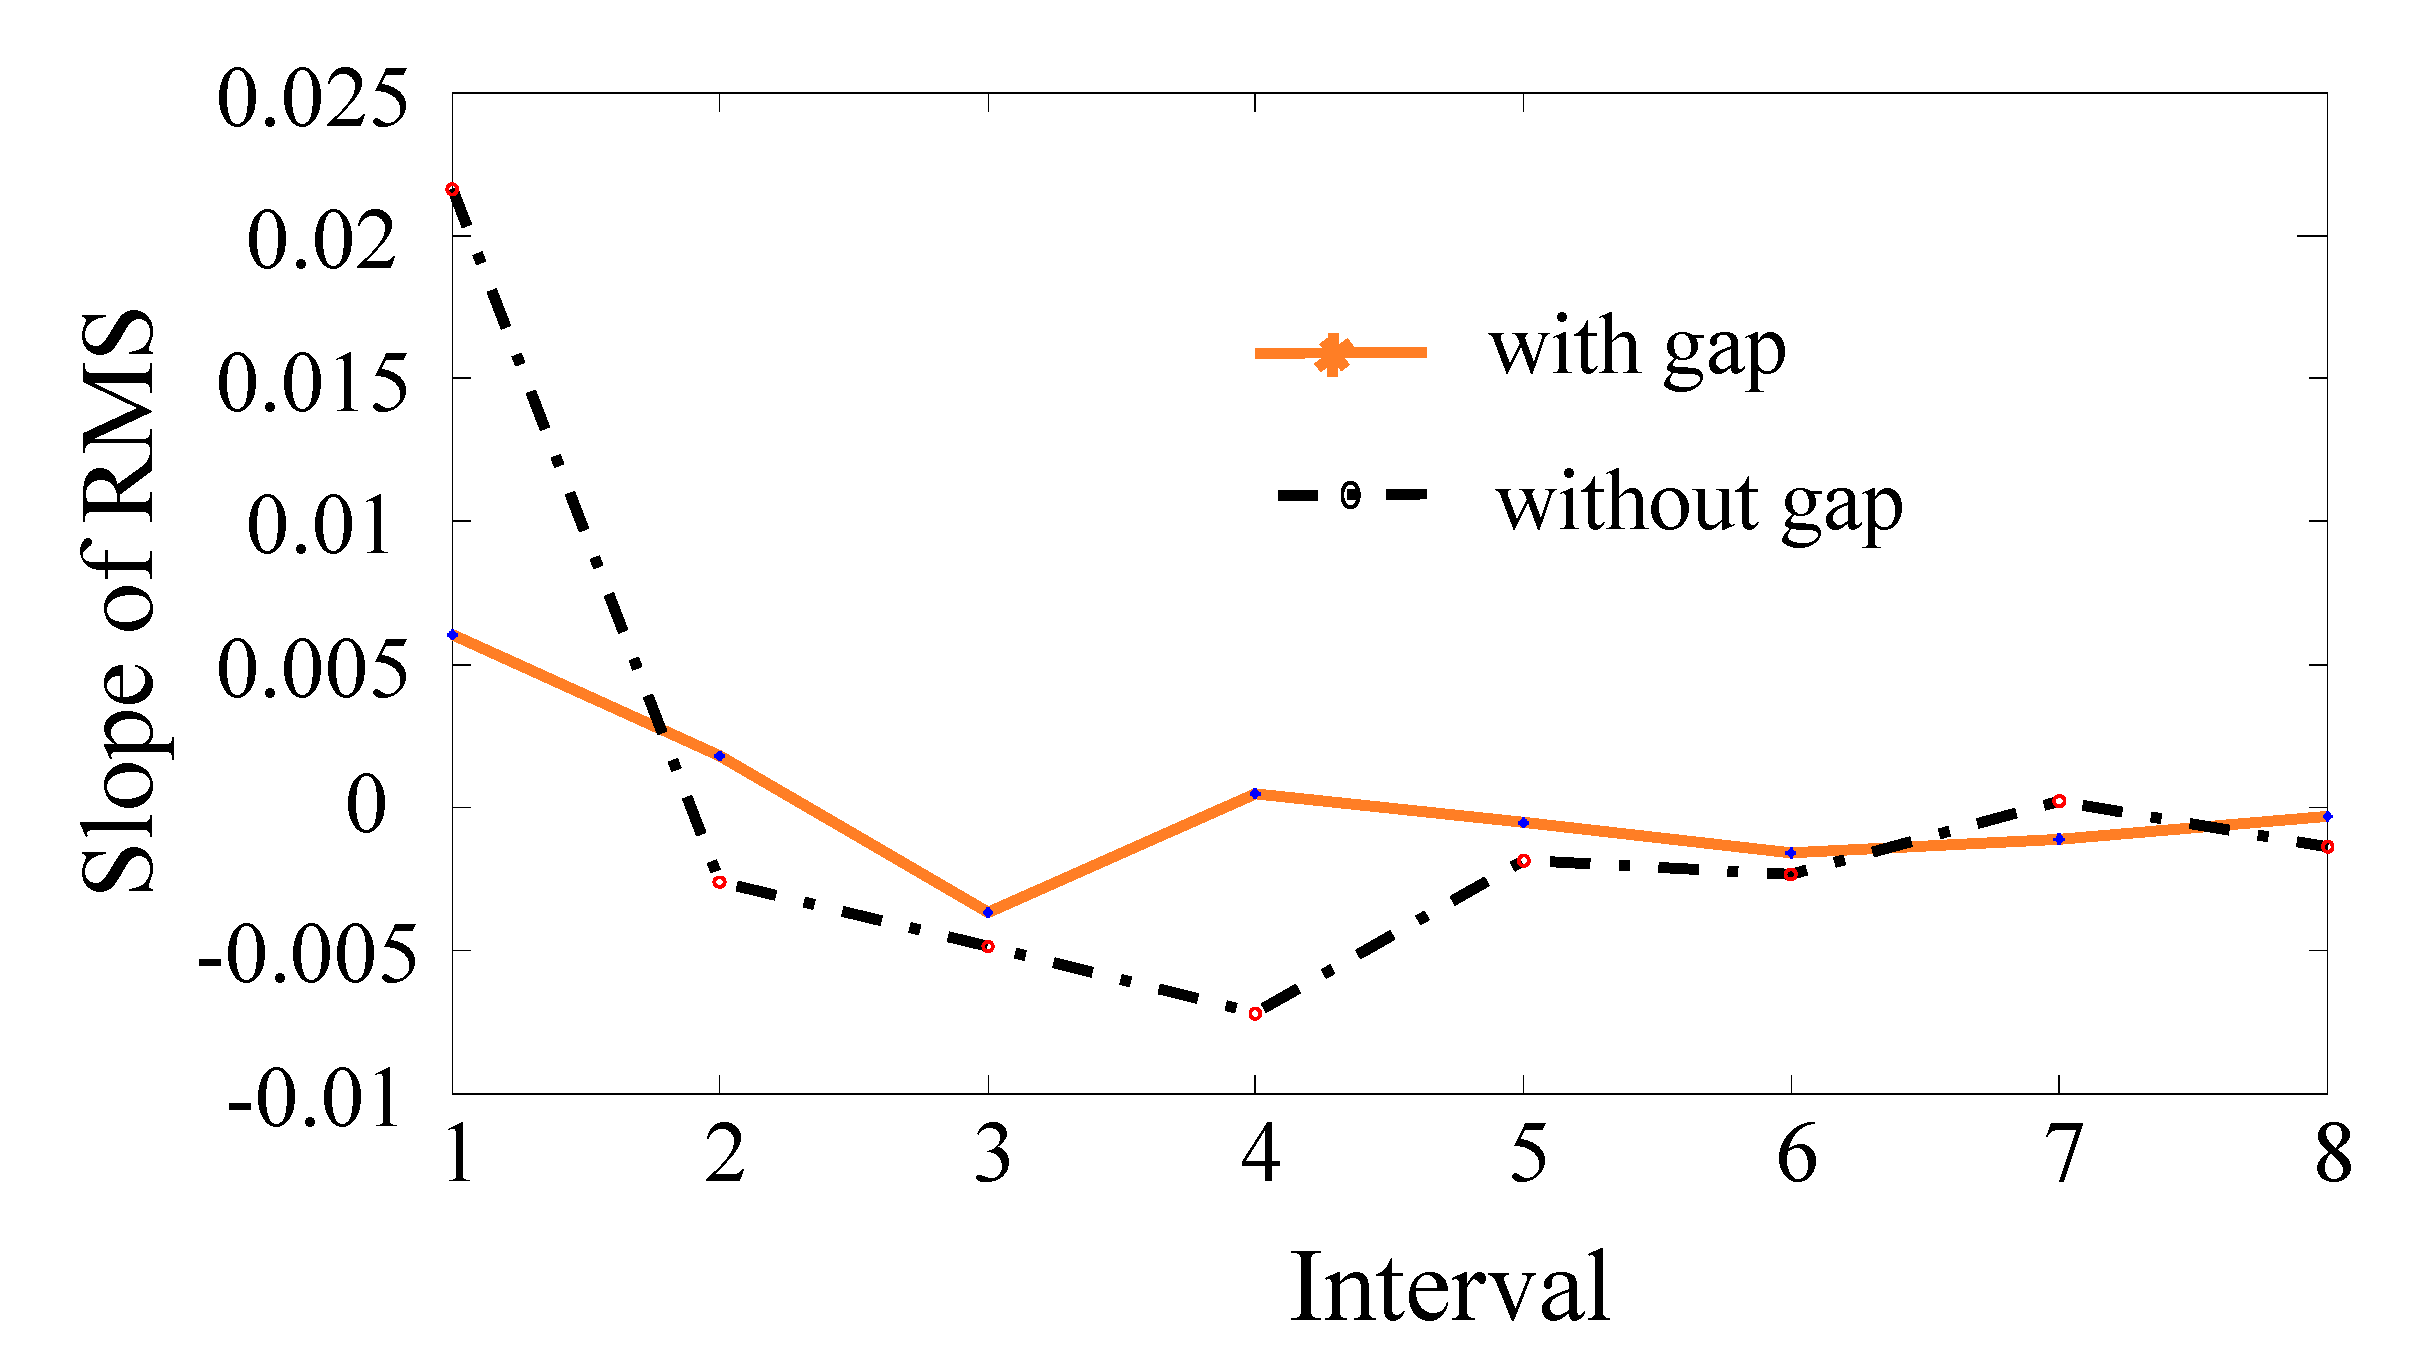
The AE features’ signals for each millisecond of welding are shown in Figure 11; the root mean square (RMS) and gradient of the signals for each 1 ms interval were calculated (Figure 12 and Figure 13, respectively). The average RMS and gradient of the signals were obtained from 20 samples for each 1 ms interval. The difference between the RMS of the cases with high and low bonding strength was obtained for the first four intervals. The gradient of signals from the first interval seems to be the most suitable for identifying low bonding strength. Therefore, the RMS of the AE signal in the first 4 ms and the gradient of the signal in the first millisecond were considered candidates for identifying the joint strength.
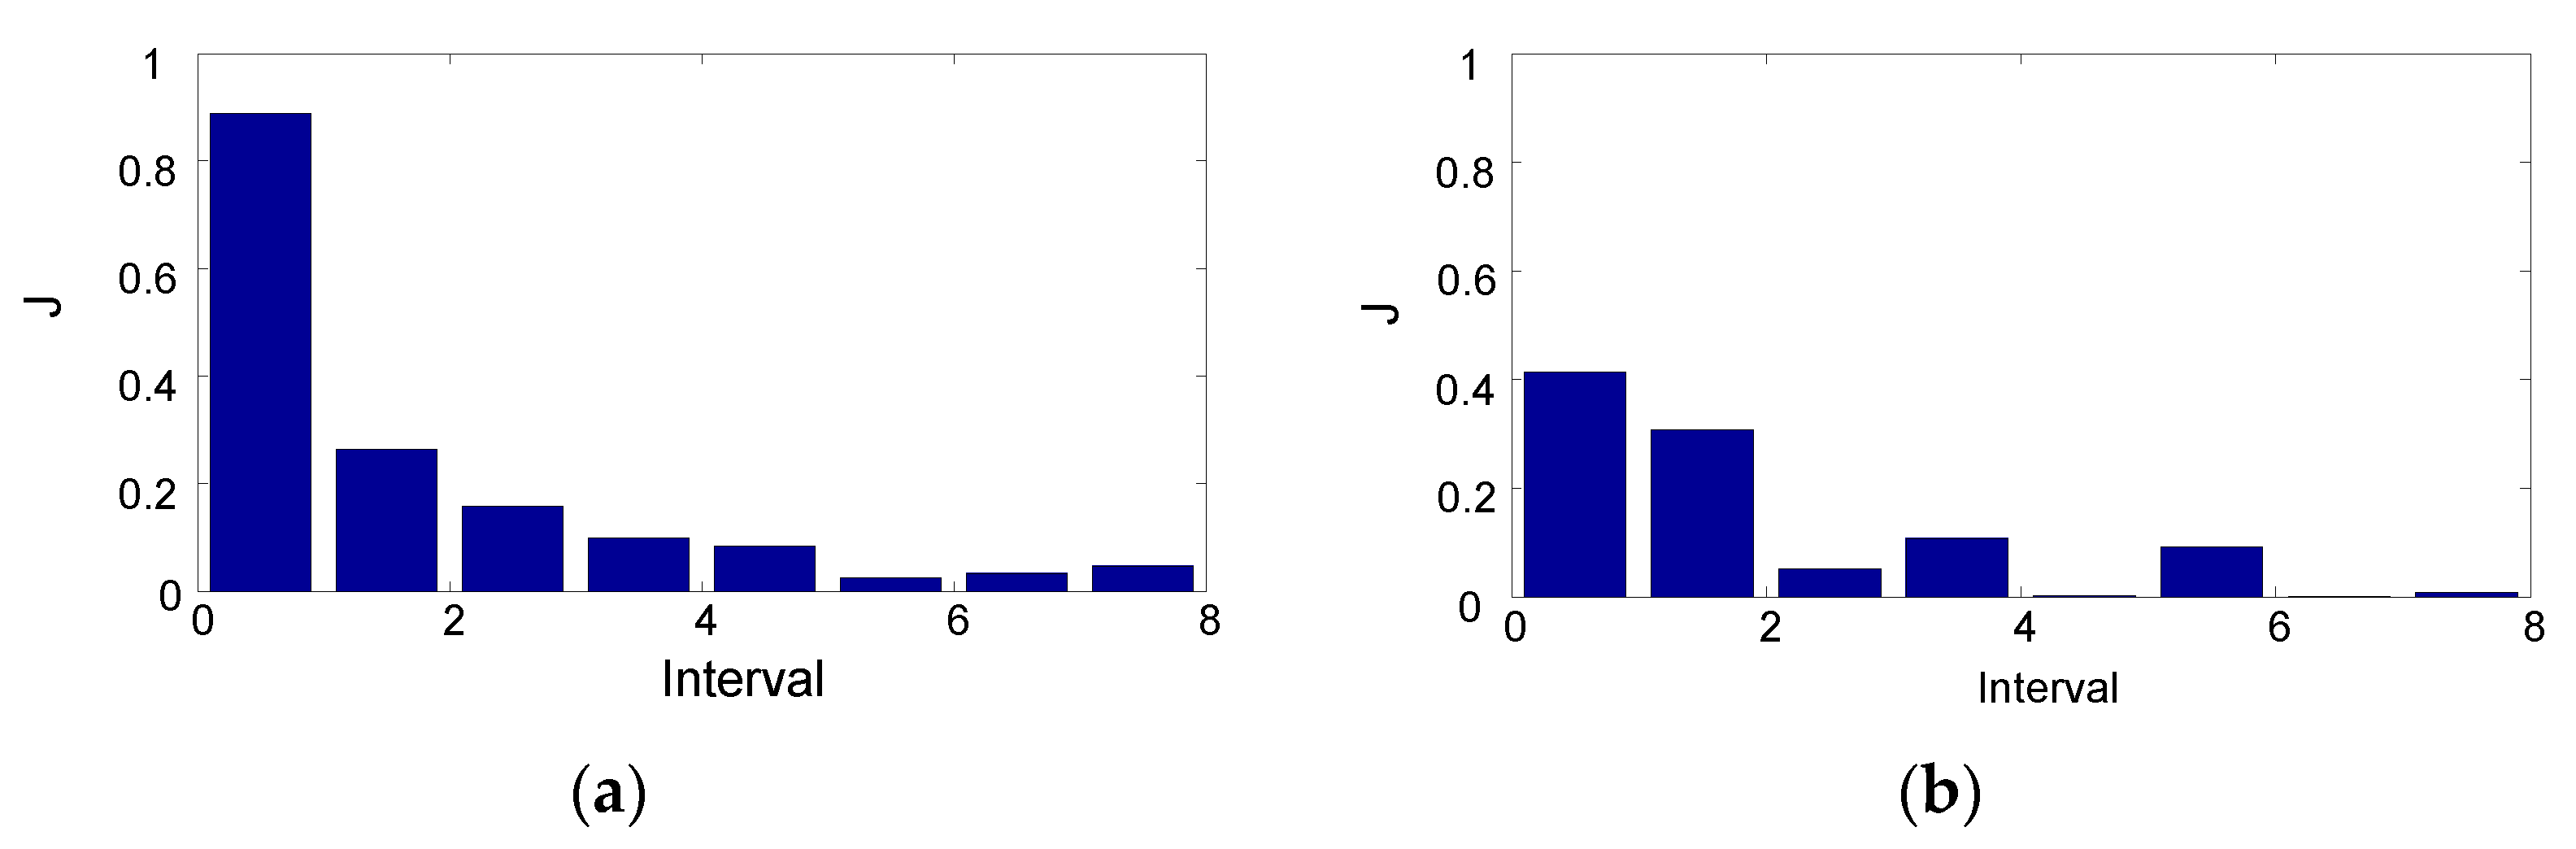
To determine the ability of each feature to identify joint conditions, the index J for both time-domain features for each interval was recalculated. The RMS and gradient of the signals in the first millisecond exhibited the highest J (Figure 14) and thus were considered the most suitable candidates, along with the frequency features of 300 kHz, for inputs for classifiers. To evaluate the performance of the selected features for classifying the joint bonding strength from laser lap microwelding, an HMM classifier was implemented with those features. The model was trained on 10 data sets obtained from 10 samples and evaluated using another 10 data sets. Classification accuracy of 100% was obtained (Table 3) with the features of the AE signal gradient from the first millisecond. Furthermore, by combining the 300 kHz frequency and RMS features of the first millisecond together, 100% classification accuracy was achieved based on the conditions in this study.
5. Conclusions
In this study, experiments were conducted on a laser microwelding machine installed in the industry to investigate the capability of applying an AE signal to monitor the joint quality in lap microwelding of stainless sheets for the manufacturing of the metal mask. The correlation between AE signals and joint bonding strength resulting from laser lap microwelding was analyzed and verified by applying the traditional feature extraction method and the developed HMM classifier. The results show that the RMS and gradient of signals obtained during the first millisecond of welding and the 300 kHz frequency signal feature are promising features for identifying low-strength joints based on the conditions in this study. By applying an HMM classifier with the gradient of the signal from the first 1 ms interval, 100% classification accuracy was achieved. Furthermore, the combination of the 300 kHz frequency feature and the RMS of the signal from the first 1 ms resulted in 100% classification accuracy as well for the welding parameters and material setup in this study. Based on the results obtained in this study, the AE signal is confirmed to be capable of monitoring the joint quality in laser lap microwelding. Along with the work done by Kuo and Lu [12] for audible sound signal analysis to monitor welding quality, the sound/AE multi-sensor joint quality monitoring system is expected to be developed in the future to apply to the production line to increase the reliability of the joint quality monitoring system.
Author Contributions
M.-C.L. contributes to the conceptualization, methodology, development, signal analysis, and writing. S.-J.C. contributes to the conceptualization, methodology, and writing. B.-S.K. contributes to the conduction of experiments. M.-Z.C. contributes to the signal analysis. All authors have read and agreed to the published version of the manuscript.
Funding
This study was supported by GeniRay Technology Corporation, New Taipei, Taiwan. This research was partially funded by the Ministry of Science and Technology, Taiwan, grant number MOST 104-2221-E-005-019.
Institutional Review Board Statement
Not applicable.
Informed Consent Statement
Not applicable.
Data Availability Statement
Not applicable.
Acknowledgments
This study was supported by GeniRay Technology Corporation, New Taipei, Taiwan. This research received partial financial support from the Ministry of Science and Technology, Taiwan. Grant number: MOST 104-2221-E-005-019.
Conflicts of Interest
The authors declare no conflict of interest. The funders had no role in the design of the study; in the collection, analyses, or interpretation of data; in the writing of the manuscript, or in the decision to publish the results.
References
- Luo, H.; Zeng, H.; Hu, L.; Hu, X.; Zhou, Z. Application of artificial neural network in laser welding defect diagnosis. J. Mater. Process. Technol. 2005, 170, 403–411. [Google Scholar] [CrossRef]
- You, D.Y.; Gao, X.D.; Katavama, D. Review of Laser Welding Monitoring. Sci. Technol. Weld. Join. 2014, 19, 181–201. [Google Scholar] [CrossRef]
- Stavridis, J.; Papacharalampopoulos, A.; Stavropoulos, P. Quality Assessment in Laser Welding: A Critical Review. Int. J. Adv. Manuf. Technol. 2018, 94, 1825–1847. [Google Scholar] [CrossRef]
- Cai, W.; Wang, J.; Jiang, P.; Cao, L.; Mi, G.; Zhou, Q. Application of sensing techniques and artificial intelligence-based methods to laser welding real-time monitoring: A critical review of recent literature. J. Manuf. Syst. 2020, 57, 1–18. [Google Scholar] [CrossRef]
- Yusof, M.F.M.; Ishak, M.; Ghazali, M.F. Feasibility of using acoustic method in monitoring the penetration status during the Pulse Mode Laser Welding process. IOP Conf. Ser. Mater. Sci. Eng. 2017, 238, 012006. [Google Scholar] [CrossRef] [Green Version]
- Shao, J.; Yan, Y. Review of techniques for on-line monitoring and inspection of laser welding. J. Phys. Conf. Ser. 2005, 15, 101–107. [Google Scholar] [CrossRef] [Green Version]
- Xiao, X.; Liu, X.; Cheng, M.; Song, L. Towards monitoring laser welding process via a coaxial pyrometer. J. Mater. Process. Technol. 2020, 277, 116409. [Google Scholar] [CrossRef]
- Vakili-Farahani, F.; Lungershausen, J.; Wasmer, K. Wavelet analysis of light emission signals in laser beam welding. J. Laser Appl. 2017, 29, 22424. [Google Scholar] [CrossRef]
- Hung, C.; Lu, M. Model Development for Tool Wear Effect on AE Signal Generation in Micro Milling. Int. J. Adv. Manuf. Technol. 2013, 66, 1845–1858. [Google Scholar] [CrossRef]
- Sun, A.S. Multiple Sensor Monitoring of Laser Welding. Ph.D. Thesis, The University of Michigan, Ann Arbor, MI, USA, 2000. [Google Scholar]
- Jolly, W. Acoustic Emission Exposes Cracks during Welding. Weld. J. 1969, 48, 328–331. [Google Scholar]
- Chan Hay, W.R.; Caron, V.; Hone, M.; Sharp, D. Classification of Acoustic Emission Signals Generated during Welding. J. Acoust. Emiss. 1985, 4, 115–123. [Google Scholar]
- Weeter, L.; Albright, C. The Effect of Full Penetration on Laser Induced Stress Wave Emissions during Laser Spot Welding. Mater. Eval. 1987, 45, 353–357. [Google Scholar]
- Hamann, C.; Rosen, H.-G.; LaBiger, B. Acoustic Emission and Its Application to Laser Spot Welding. High Power Lasers Laser Mach. Technol. Int. Soc. Opt. Photonics 1989, 1132, 275–281. [Google Scholar] [CrossRef]
- Habenicht, G.; Stark, W.; Deimann, R. Quality Assurance of Laser Spot Welds With Acoustic Emission Analysis Using the Example of Selected Copper Alloys. Weld. Cut. 1991, 43, 213–215. [Google Scholar]
- Fang, C.; Kannatey-Asibu, E.; Barber, J. Acoustic Emission Investigation of Cold Cracking in Gas Metal Arc Welding of AISI 4340 Steel. Weld. J. 1995, 74, 177–184. [Google Scholar]
- Schubert, F.; Bendjus, B.; Cikalova, U.; Stephan, M.; Hipp, R.; Schulze, E.; Barth, M.; Bor, Z.; Heuer, H. Non-destructive weld inspection during the welding process-possibilities and limitations of an inline monitoring approach. Proc. Meet. Acoust. ICU Acoust. Soc. Am. 2019, 38, 032008. [Google Scholar] [CrossRef]
- Jia, Z.; Zhang, P.; Yu, Z.; Wu, D.; Tian, Y.; Yan, H. Evidence of solidification crack propagation in pulsed laser welding of aluminum alloy. Opt. Express 2021, 29, 18495–18501. [Google Scholar] [CrossRef]
- Lee, S.; Ahn, S.; Park, C. Analysis of Acoustic Emission Signals during Laser Spot Welding of S304 Stainless Steel. J. Mater. Eng. Perform. 2014, 23, 700–707. [Google Scholar] [CrossRef]
- Jin, X.; Li, L.; Zhang, Y. A Study on Fresnel Absorption and Reflections in the Keyhole in Deep Penetration Laser Welding. J. Phys. D Appl. Phys. 2002, 35, 2304–2310. [Google Scholar] [CrossRef]
- Chien, K. Applications of Acoustic Emission and Sound Signal for Welding Defect Monitoring in Nd: YAG Laser Thin Plate Butt Welding. Master’s Thesis, National Chung Hsing University, Taichung, Taiwan, 2012. [Google Scholar]
- Kuo, B.-S.; Lu, M.-C. Analysis of a Sound Signal for Quality Monitoring in Laser Microlap Welding. Appl. Sci. 2020, 10, 1934. [Google Scholar] [CrossRef] [Green Version]
- Hsieh, W.-H.; Lu, M.-C.; Chiou, S.-J. Application of backpropagation neural network for spindle vibration-based tool wear monitoring in micro-milling. Int. J. Adv. Manuf. Technol. 2011, 61, 53–61. [Google Scholar] [CrossRef]
- Wang, C.Y. The Development of Tool Condition Monitoring in the Millingof Inconel 718 by Recurrent HMMs. Master’s Thesis, National Chung Hsing University, Taichung, Taiwan, 2018. [Google Scholar]
Figure 1.
Laser welding research platform and fixture.

Figure 2.
Peeling test (a) equipment and (b) recorded force data.

Figure 3.
Setup for welding with (a) proper contact and (b) loss of contact.

Figure 4.
Schematic of determining the unknown quality condition by using the developed model.

Figure 5.
Surface condition of samples after peeling: (a) high and (b) low joint strength [22].
Figure 5.
Surface condition of samples after peeling: (a) high and (b) low joint strength [22].

Figure 6.
AE signals collected during laser microwelding for joints with (a) low and (b) normal bonding strength.
Figure 6.
AE signals collected during laser microwelding for joints with (a) low and (b) normal bonding strength.

Figure 7.
Frequency AE signals collected during laser microwelding for normal (without gap) and low bonding strength (with gap).
Figure 7.
Frequency AE signals collected during laser microwelding for normal (without gap) and low bonding strength (with gap).

Figure 8.
Frequency-domain AE signals collected during laser microwelding for different 1 ms intervals of the welding process: (a) low and (b) normal bonding strengths.
Figure 8.
Frequency-domain AE signals collected during laser microwelding for different 1 ms intervals of the welding process: (a) low and (b) normal bonding strengths.

Figure 9.
Raw signal and classification index for frequency features (a) raw signal for index calculation (b) classification index (signals collected throughout laser operation).
Figure 9.
Raw signal and classification index for frequency features (a) raw signal for index calculation (b) classification index (signals collected throughout laser operation).

Figure 10.
Raw signal and classification index for frequency features (a) raw signal for index calculation (b) classification index (signals collected in the first millisecond of laser operation).
Figure 10.
Raw signal and classification index for frequency features (a) raw signal for index calculation (b) classification index (signals collected in the first millisecond of laser operation).


Figure 11.
Intervals of AE signals for (a) low and (b) normal joint strength.

Figure 12.
RMS of AE signals at eight 1 ms intervals for joints with normal and low bonding strength.
Figure 12.
RMS of AE signals at eight 1 ms intervals for joints with normal and low bonding strength.

Figure 13.
Gradient of AE signals for eight 1 ms intervals for joints with normal and low bonding strength.
Figure 13.
Gradient of AE signals for eight 1 ms intervals for joints with normal and low bonding strength.

Figure 14.
Classification index for each 1 ms interval: (a) RMS and (b) gradient of signals.


Table 1.
Welding parameters.
| Laser Type | QCW Fiber Laser |
|---|---|
| Wave length (um) | 1.064 |
| Laser power (W) | 105 |
| Laser scan speed (mm/s) | 200 |
| Frequency for laser (kHz) | 0.01 |
| Time interval for pulse wave (ms) | 2 |
| Spot size (um) | 50 |
Table 2.
Parameter settings for the generation of proper contact and loss of contact [12].
Table 2.
Parameter settings for the generation of proper contact and loss of contact [12].
| Proper Contact | Loss of Contact | |
|---|---|---|
| Torque for screw | 6 N | 1.5 N |
| Extra central clamp | Yes | No |
| Thin paper between workpieces | No | Yes |
| Welding location | Close to the corner of clamp | Close to central Line |
Table 3.
Selected features for HMM.
| Selected Features | Welding with Gap | Welding without Gap | |
|---|---|---|---|
| 1 | 300 kHz | 100% | 88.9% |
| 2 | Gradient (~1 ms) | 100% | 100% |
| 3 | RMS (~1 ms) | 100% | 88.9% |
| 4 | 1, 3 | 100% | 100% |
Publisher’s Note: MDPI stays neutral with regard to jurisdictional claims in published maps and institutional affiliations. |
© 2021 by the authors. Licensee MDPI, Basel, Switzerland. This article is an open access article distributed under the terms and conditions of the Creative Commons Attribution (CC BY) license (https://creativecommons.org/licenses/by/4.0/).
Share and Cite
MDPI and ACS Style
Lu, M.-C.; Chiou, S.-J.; Kuo, B.-S.; Chen, M.-Z. Analysis of Acoustic Emission (AE) Signals for Quality Monitoring of Laser Lap Microwelding. Appl. Sci. 2021, 11, 7045. https://0-doi-org.brum.beds.ac.uk/10.3390/app11157045
AMA Style
Lu M-C, Chiou S-J, Kuo B-S, Chen M-Z. Analysis of Acoustic Emission (AE) Signals for Quality Monitoring of Laser Lap Microwelding. Applied Sciences. 2021; 11(15):7045. https://0-doi-org.brum.beds.ac.uk/10.3390/app11157045
Chicago/Turabian StyleLu, Ming-Chyuan, Shean-Juinn Chiou, Bo-Si Kuo, and Ming-Zong Chen. 2021. "Analysis of Acoustic Emission (AE) Signals for Quality Monitoring of Laser Lap Microwelding" Applied Sciences 11, no. 15: 7045. https://0-doi-org.brum.beds.ac.uk/10.3390/app11157045
Note that from the first issue of 2016, this journal uses article numbers instead of page numbers. See further details here.