1. Introduction
Austenitic stainless steels are used in the construction of parts for automobiles and boats due to their high corrosion resistance and mechanical performance [
1]. They are also used in nuclear, aeronautical, food, petrochemical, and biological applications [
2,
3,
4] due to their robust mechanical, physical, and chemical properties [
5,
6]. To achieve these parts or elements, different manufacturing processes [
7] that allow the welding to stand out [
8] must be used. Welding processes have an important role in the manufacturing of engineering parts and components due to their simplicity, versatility, and automation capability. However, the welding joints are often the weakest links in assemblies [
9]. The quality of the weld depends on the bead geometry [
10], metallurgical and mechanical characteristics [
11], chemical composition [
12], and input parameters such as voltage, current, electrode type, flux and gas type, welding position, travel speed, and others [
4] making the task of finding the best parameters quite challenging [
13]. If the welding parameters are not correctly chosen, they can lead to welded joints with high levels of residual stresses [
14,
15], geometric distortions [
16], and discontinuities [
17,
18].
In stainless steels, excess heat in the welding process can lead to microstructural changes with sensitization, the evolution of secondary phases, and hot cracks [
2,
19]. Such problems are especially problematic because of the high-responsibility applications to which the materials are often applied [
6]. Many studies have focused on the best way to carry out the connection of thin austenitic stainless-steel sheets. Different tools and input parameters were tested for the best results when welding this material,. Wang et al. [
1], Ragavendran and Vasudevan [
5], and Kumar et al. [
19] analyzed parameter changes in laser welds through micrography and mechanical properties. Other authors such as Jonhson and Murugan [
20] and Kumar et al. [
2] proposed the union of thin austenitic steel plates by Friction Stir Welding (FSW), analyzing the mechanical and metallographic properties of the welded joints with the variation of input parameters.
Despite attempts to try alternative welding processes, GMAW welding has been used in many industries due to its ease of fabrication in a wide range of materials with a low initial investment [
21]. In this sense, Ning et al. [
22] compared MIG (Metal Inert Gas) welding and laser–MIG hybrid welding on Nitrogen-rich austenitic steel, analyzing mechanical and microstructural properties of the weld bead. Chakraborty et al. [
23] performed the welding of stainless steel plates varying the type of flux material and the geometry of the MIG weld bead. Jaypuria et al. [
21] studied the variation of parameters in pulse–MIG welding, considering penetration and dilution in the process, and developing a regression model between inputs and outputs using statistical tools.
There are several methods for optimizing input parameters, the main ones being: factorial design; linear regression; response surface methodology; artificial neural networks; finite elements methods; and the Taguchi method [
24,
25]. The Taguchi method is a simple and low-cost method of obtaining process optimization with strong quality and performance. The technique greatly reduces the number of experiments needed and offers a good relationship between input and output parameters. Some studies used the Taguchi method to identify the most relevant parameter: Mallaiah et al. [
26] analyzed the grain refinement in weld beads of a ferritic stainless steel welded by the Gas Tungsten Arc Welding (GTAW) process. The Taguchi method was used to create regression equations and predict mechanical properties. Natrayan et al. [
27] varied three parameters of Tungsten Inert Gas (TIG) welding and evaluated which one had the greatest contribution to tensile strength using the Taguchi method. Ramarao et al. [
28] employed the Taguchi method to evaluate which parameter was the most influential in the welding process of two different metals using the GMAW process. Vinoth et al. [
29] optimized the input parameters for the TIG welding process of stainless steel, using the mechanical properties of the weld bead as output parameters. Gosh et al. [
13] evaluated X-ray radiography of austenitic stainless steel welded joints and considered the effect of current, gas flow, and distance between the nozzle and 3 mm plates.
In the present work, the input parameters for welding austenitic stainless-steel low thickness tubes (DIN EN 10296-2-1.4301) are varied using the GMAW process, and a macrographic analysis is carried out to evaluate the penetration value and the width of the weld bead. The input parameters used are the welding current, the welding voltage, and the travel angle. As far as the authors of this work are aware, few studies of austenitic stainless-steel welding with GMAW have analyzed the influence of travel speed on the quality of weld beads, thus, we consider that we are contributing with new knowledge in this field.
2. Materials and Methods
In this work, the welding of two austenitic stainless-steel (X6CrNiTi18-10) low thickness tubes were carried out in an automated manner. The welding process was implemented following the European standard EN-10296-2:2005 [
30], which is the specific standard of reference in this type of stainless-steel welded tubes, in order to generate different specimens for the two types of tubes.
This European standard mainly specifies the mechanical properties of the welds, the chemical compositions of the materials, and the tests and criteria to ensure the quality and the geometrical features of the welds.
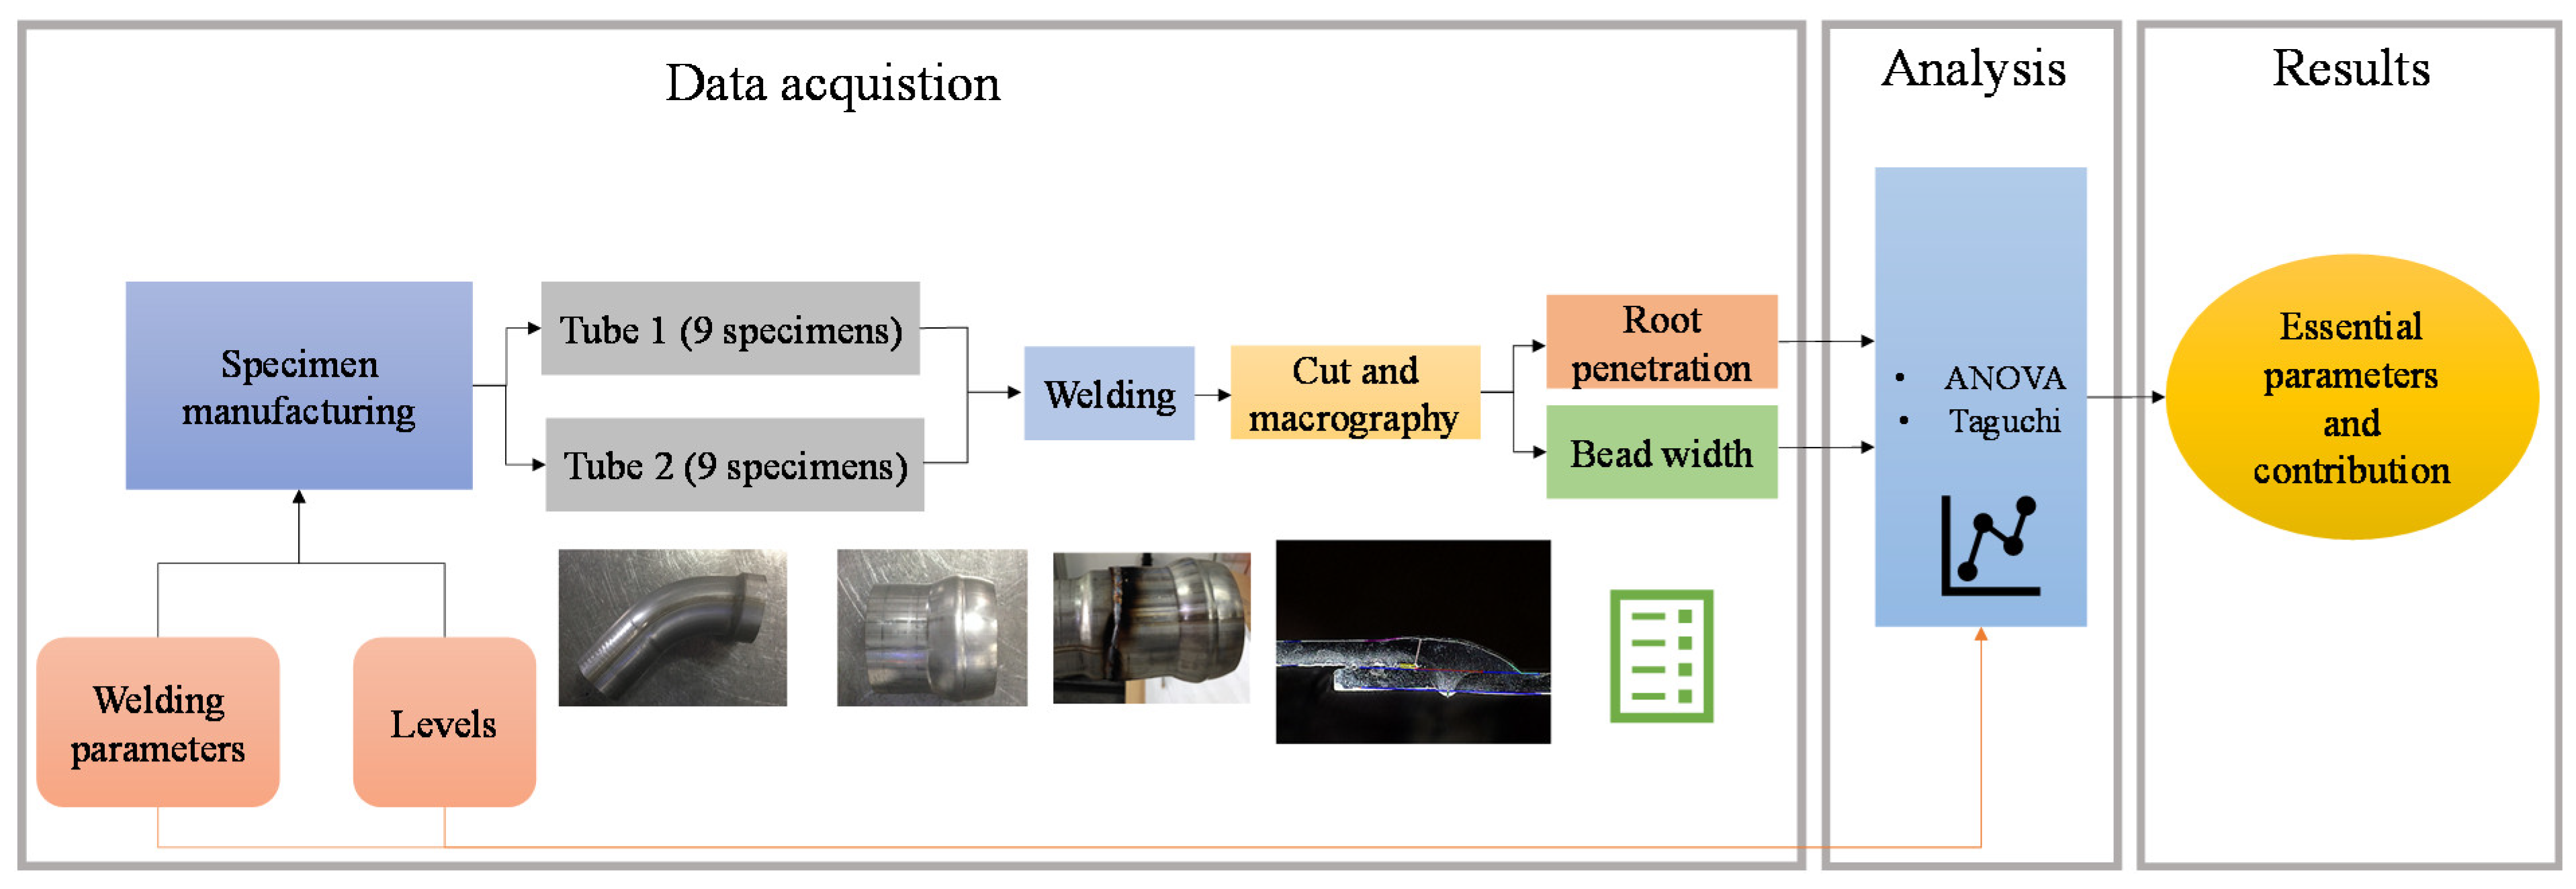
For this research, a specific flow-work (
Figure 1) was ad hoc established to analyze and optimize the essential parameters that affect the quality of the weld such as the weld root penetration and the welding bead width. This process is repeated twice (experiments 1 and 2).
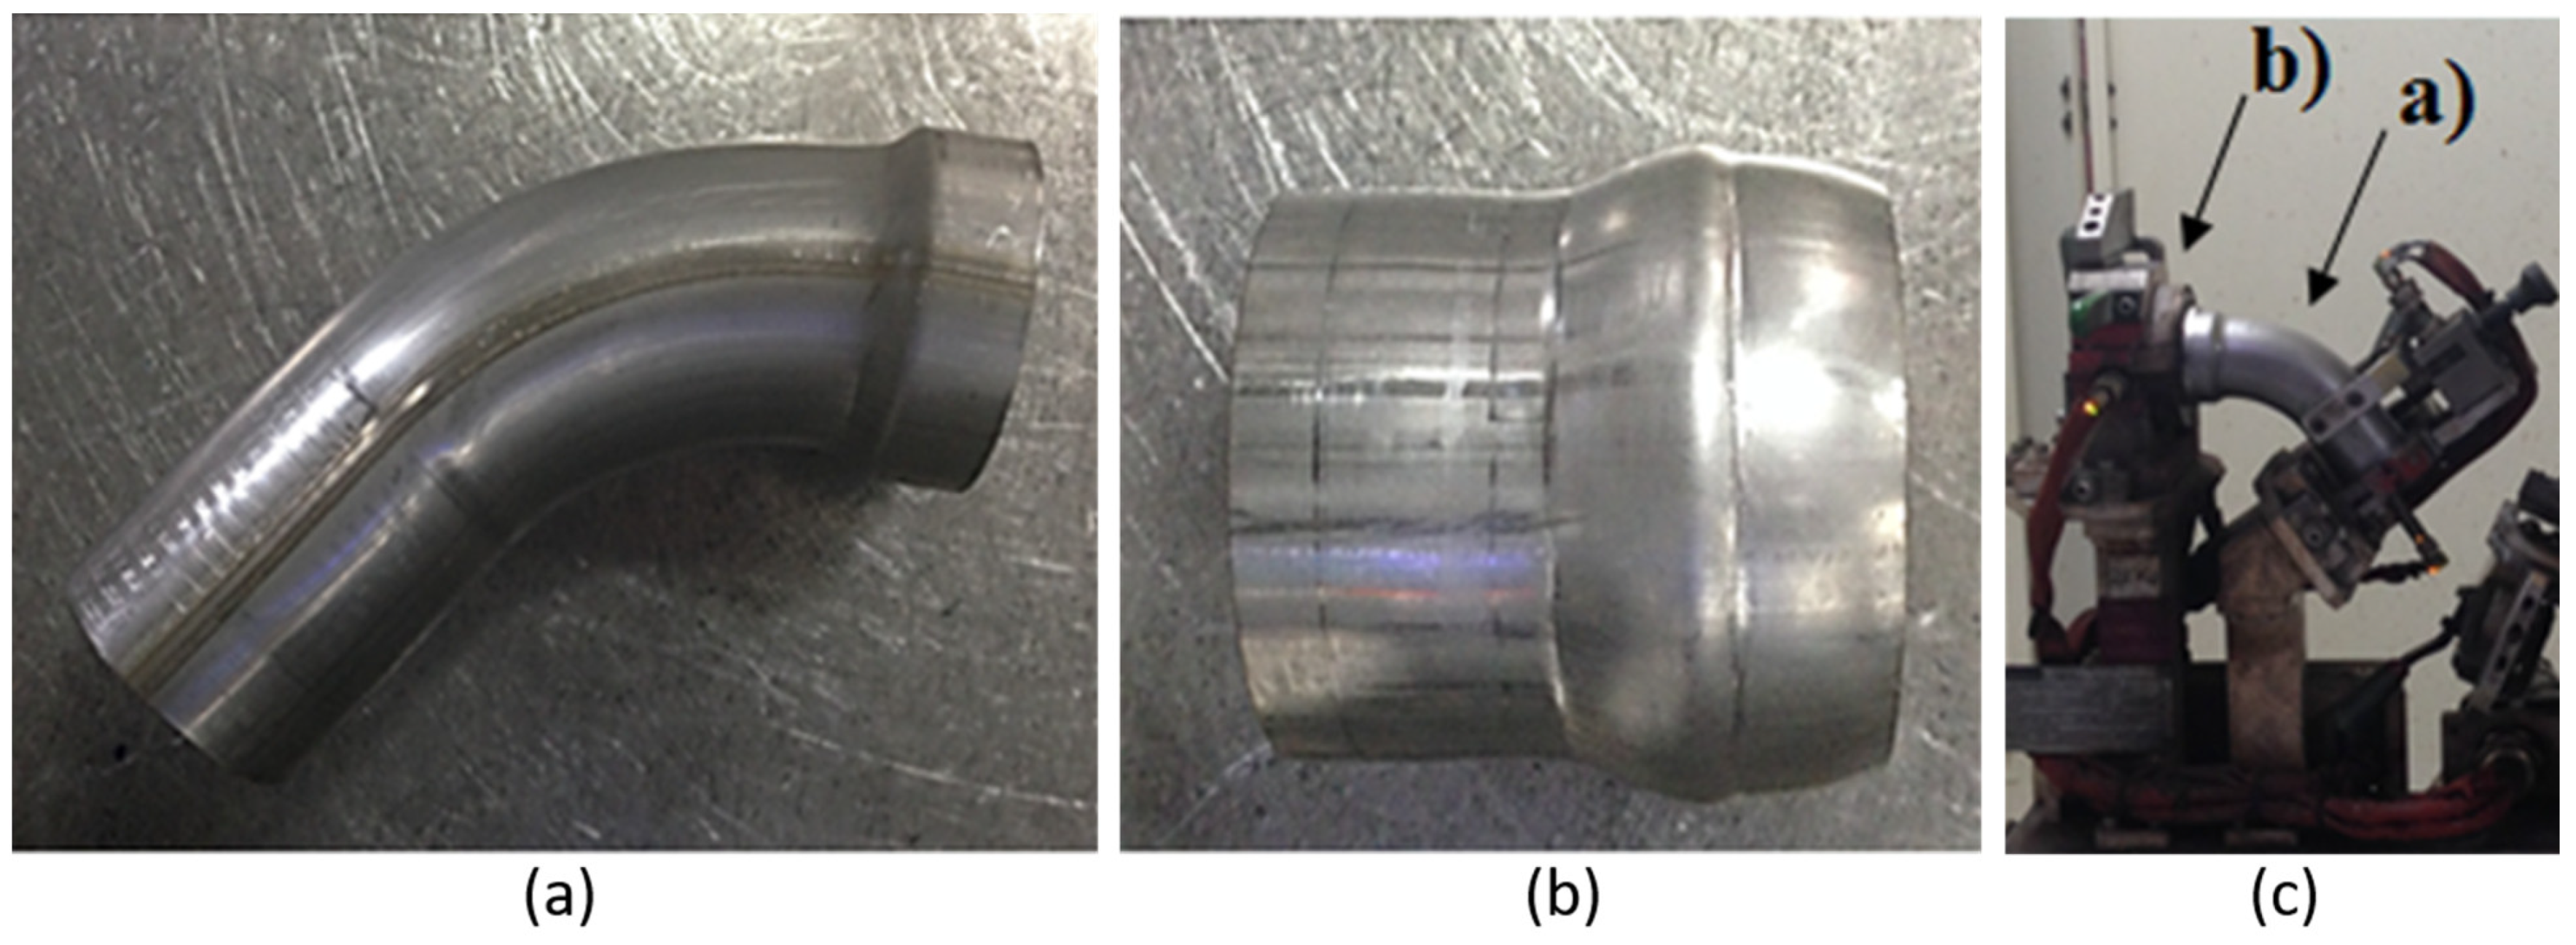
The specimens were manufactured specifically for this research using welding. The union was made between tubes of 63.1 mm (
Figure 2a) and 63.8 mm (
Figure 2b) in diameter, both with 1.5 mm of thickness. The tubes were fixed in welding assembly jig before the welding procedure, as can be seen in
Figure 2c. In total, 18 welds were made: 9 for the first experiment and 9 for the second experiment. The experiment was performed twice to increase statistical validation.
The tubes were joined using the GMAW process, for which a welding machine SKS LSQ5 + Q8p was used together with a Fanuc Arc Mate 120iC cell, SKS PS5 Uncoiler, Collision Box Power Joint SKS, Torch SKS 61-9-120-10, and Neck SKS 58-1-45-400. The robot speed established for this work, after several experimental tests to define this parameter, was 150 cm/min because it was the highest speed where a visually stable weld bead was observed.
The shielding gases used during the process were Argon and O
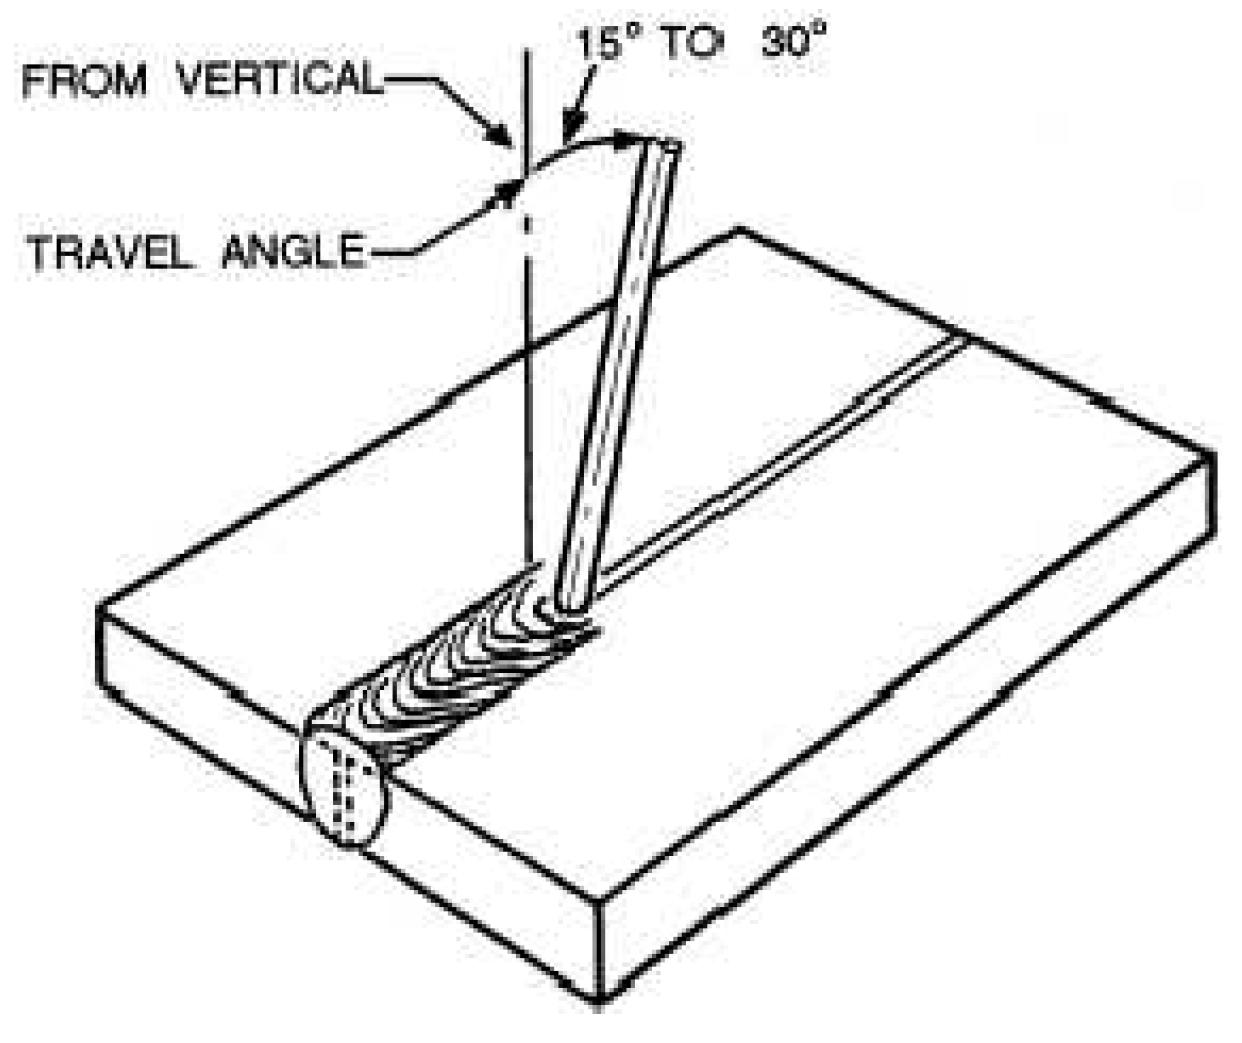
2, with percentages of 98% and 2%, respectively. The additional material was an ESAB brand austenitic steel with 1 mm diameter, and the stick-out value adopted was 12 mm. As input parameters, the welding voltage, travel angle, and welding current were selected for this study.
Figure 3 shows, schematically, the travel angle.
Before carrying out the welding process, the tubes were measured to ensure that they were compliant. Their welding regions were then cleaned with, firstly, sandpaper, then a cotton cloth, followed by a solvent (acetone and ethylic alcohol), and, lastly, a clean cotton cloth. Finally, they were fixed in welding assembly jig as shown in
Figure 2c.
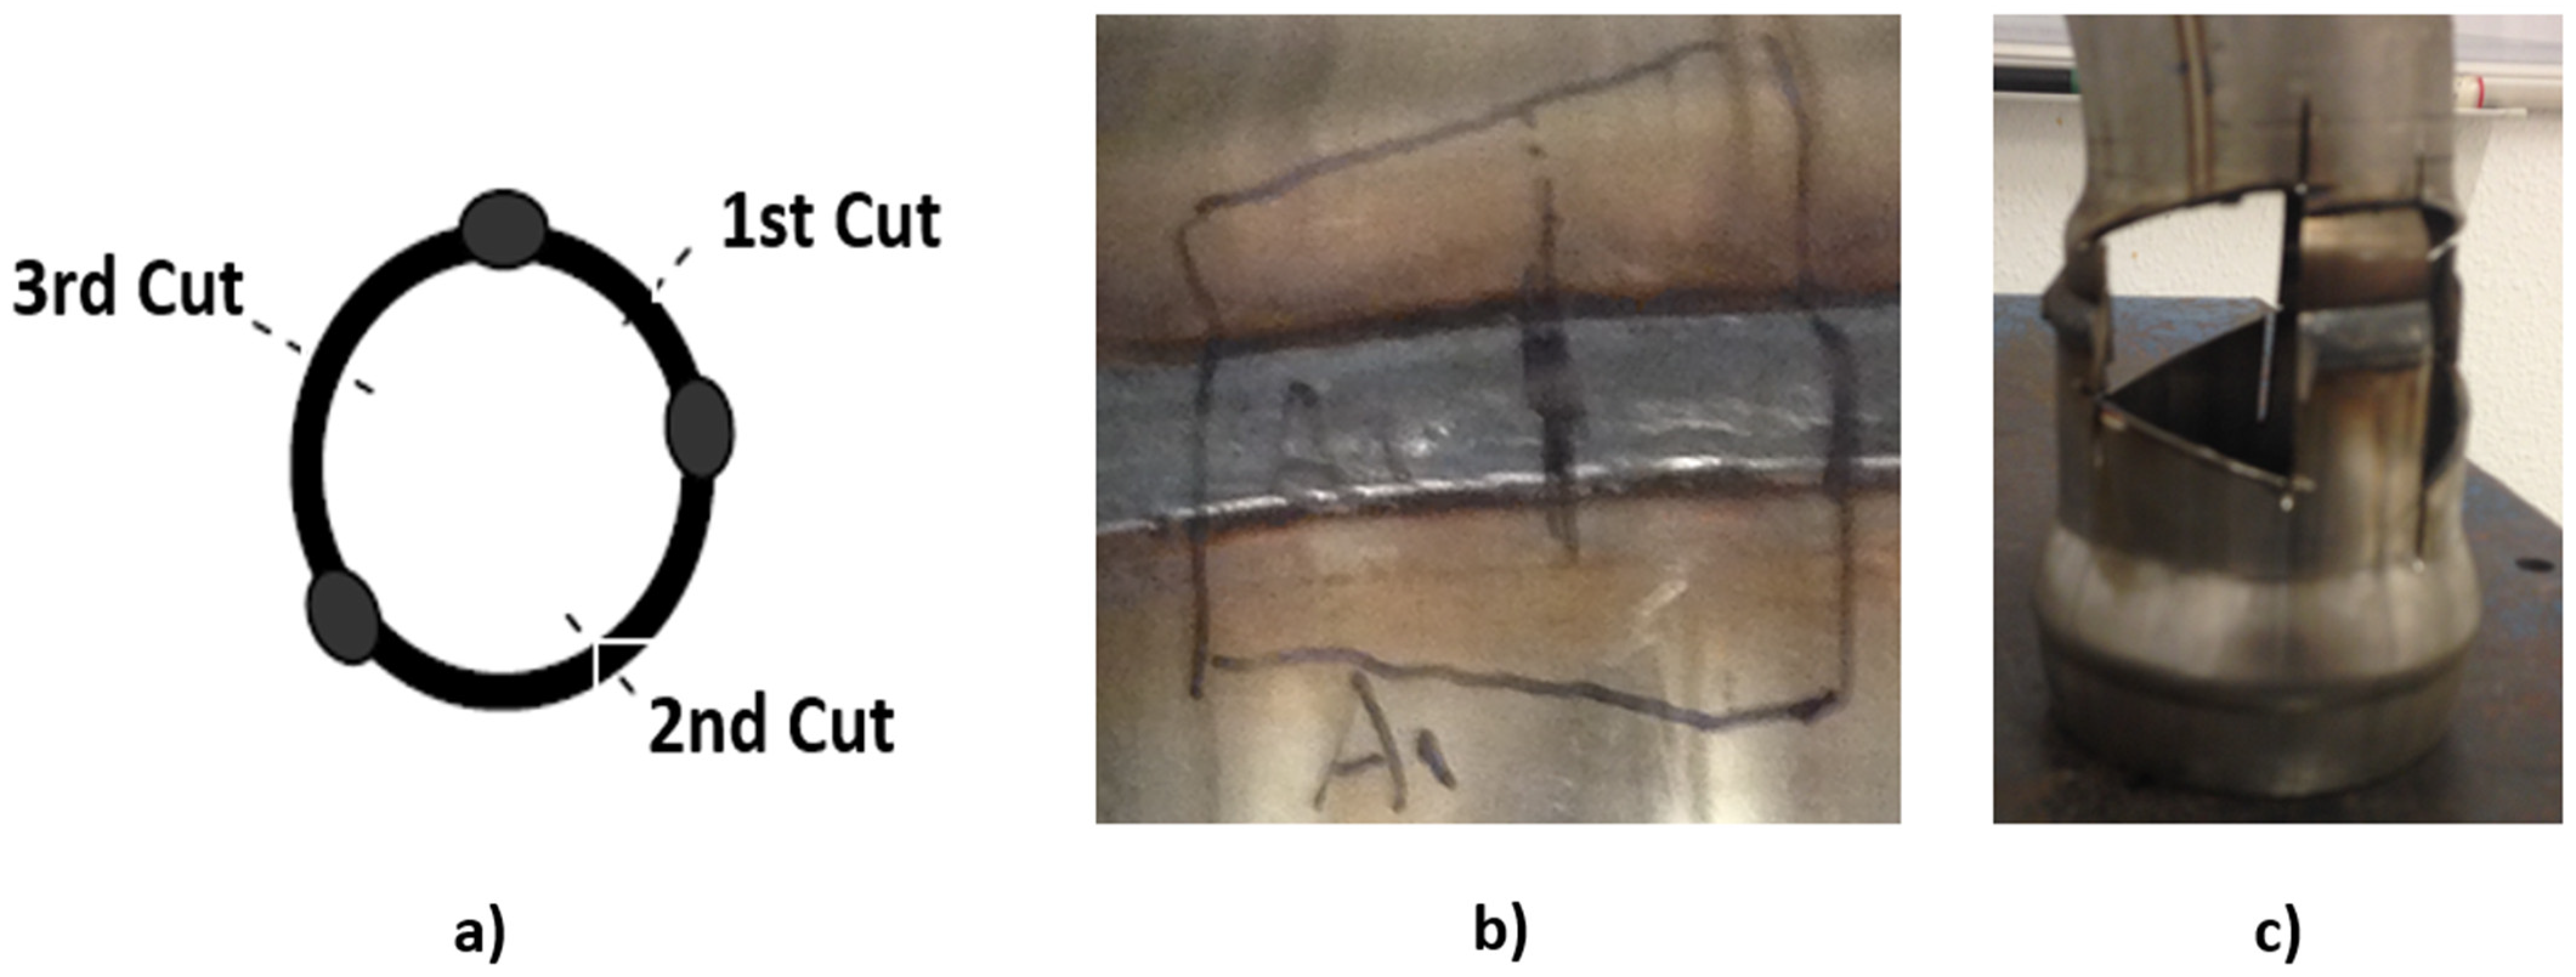
After joining the pieces, the macrographic test was performed in three different regions to identify the quality parameters (width and depth of the weld bead). For this, cuts were made in the weld beads at 45°, 165°, and 285° angles with a conventional cutting machine as shown in
Figure 4.
In the next step, the samples were polished in an LS1 remate polishing machine using sandpapers with 180, 320, and 600 grits. Finally, a chemical attack was carried out for better visualization of the cutting region of the weld bead. For the chemical attack, a solution of hydrochloric acid with nitric acid was used in a proportion of 1:10.
Once this task was completed, 45 samples were obtained out of a possible 54. Some samples were discarded due to imperfections.
The final samples were photographed in high resolution, avoiding lens distortions and aberration, and then evaluated by StructureExpert Weld from Struers [
31]. The software identified the weld bead thickness and weld penetration depth among other parameters.
Based on the data revealed by the StructureExpert Weld integrated software and the input parameters, the Taguchi method was applied to find the most relevant parameter. The Taguchi method involves the reduction of variability in the process through a robust design of experiments. The main objective of this method is to design high-quality products at a low cost to the manufacturer.
The experiments were done in a planned order using the Taguchi L9 orthogonal array design. Three levels were considered for each input parameter as exhibited in
Table 1. Pre-testing was conducted before the experiment to assure the maximum and minimum values were close to the limits where they would not possibly produce welds with acceptable levels of quality. The welding design matrix according to the Taguchi L9 matrix design is demonstrated in
Table 2. The travel speed parameter is one of the most important conditions in a welding process; therefore, most research works have studied the influence of this parameter deeply [
32,
33], and there are fewer researchers that have studied the influence of torch angle. Thus, we chose to carry out this study to glean more information about the torch angle’s influence on welding quality.
The Taguchi method assesses the importance of the parameters through the signal/noise ratio (S/N), which measures how the response varies from the nominal or target value under different noise conditions. It is possible to choose different S/N ratios depending on the intended purpose. In this work, the S/N ratio “Nominal is the better” was chosen. This type of S/N ratio is used when the objective is to create a target response and base the S/N ratio only on standard deviations. Data can be positive, zero, or negative. For this method, Equation (1) was applied
where
are the observed data,
is the average of the observed data, and
is the number of repetitions performed.
In addition to the Taguchi Method, a statistical analysis of variance (ANOVA) was performed. The combination of the two methods allows analyzing each control parameter, in this case, weld penetration and bead width. It is not possible to determine the two parameters simultaneously [
34]. Minitab 17 statistical software [
35] was used as an analysis tool.
3. Results and Discussions
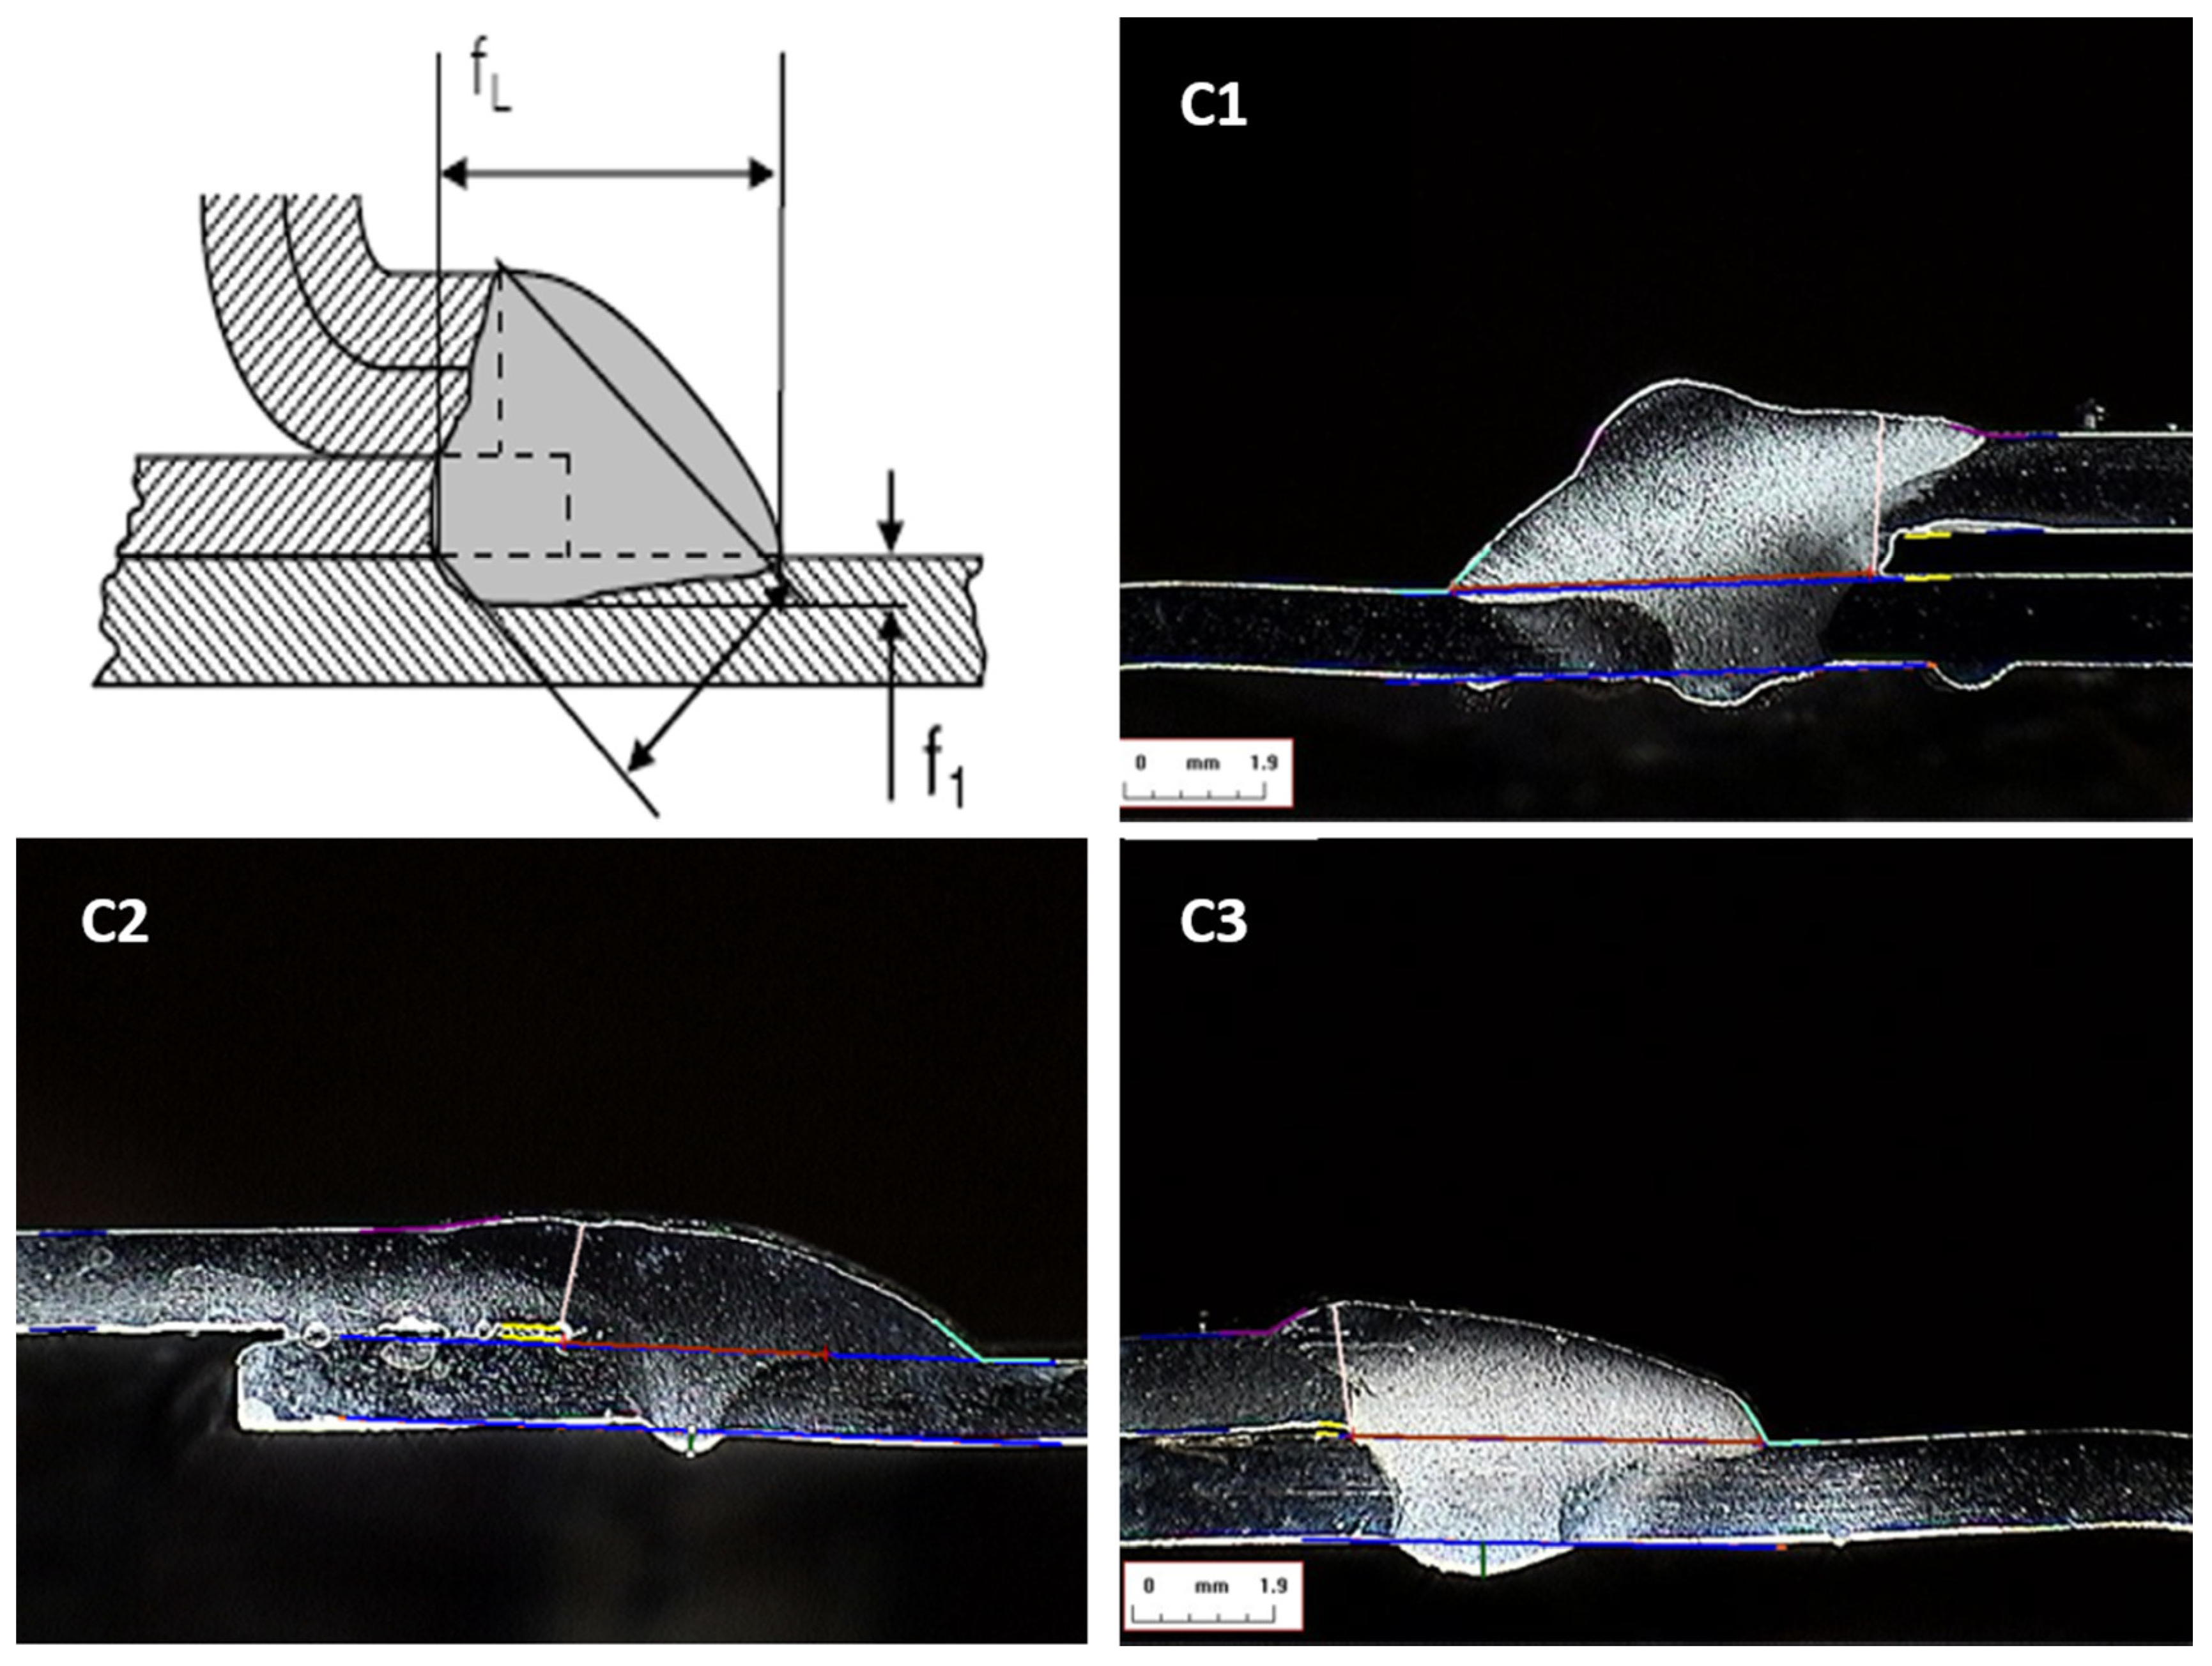
According to the data obtained by the StructureExpert Weld integrated software, the values for welding penetration and weld bead width were extracted. In
Figure 5, it is possible to show an illustration of macrographic images obtained from different samples. On top left is represented schematically a weld bead with the main geometric parameters, on C1, C2 and C3 are macrographic images from different samples. The tests were performed twice in each configuration. The summary of the resulting measurements for the experiment, represented in
Figure 5, are shown in
Table 3. Evaluating the measurements implemented for all experimental tests, an average value of 0.82 mm and 4.50 mm was obtained for the penetration and width of the weld bead, respectively.
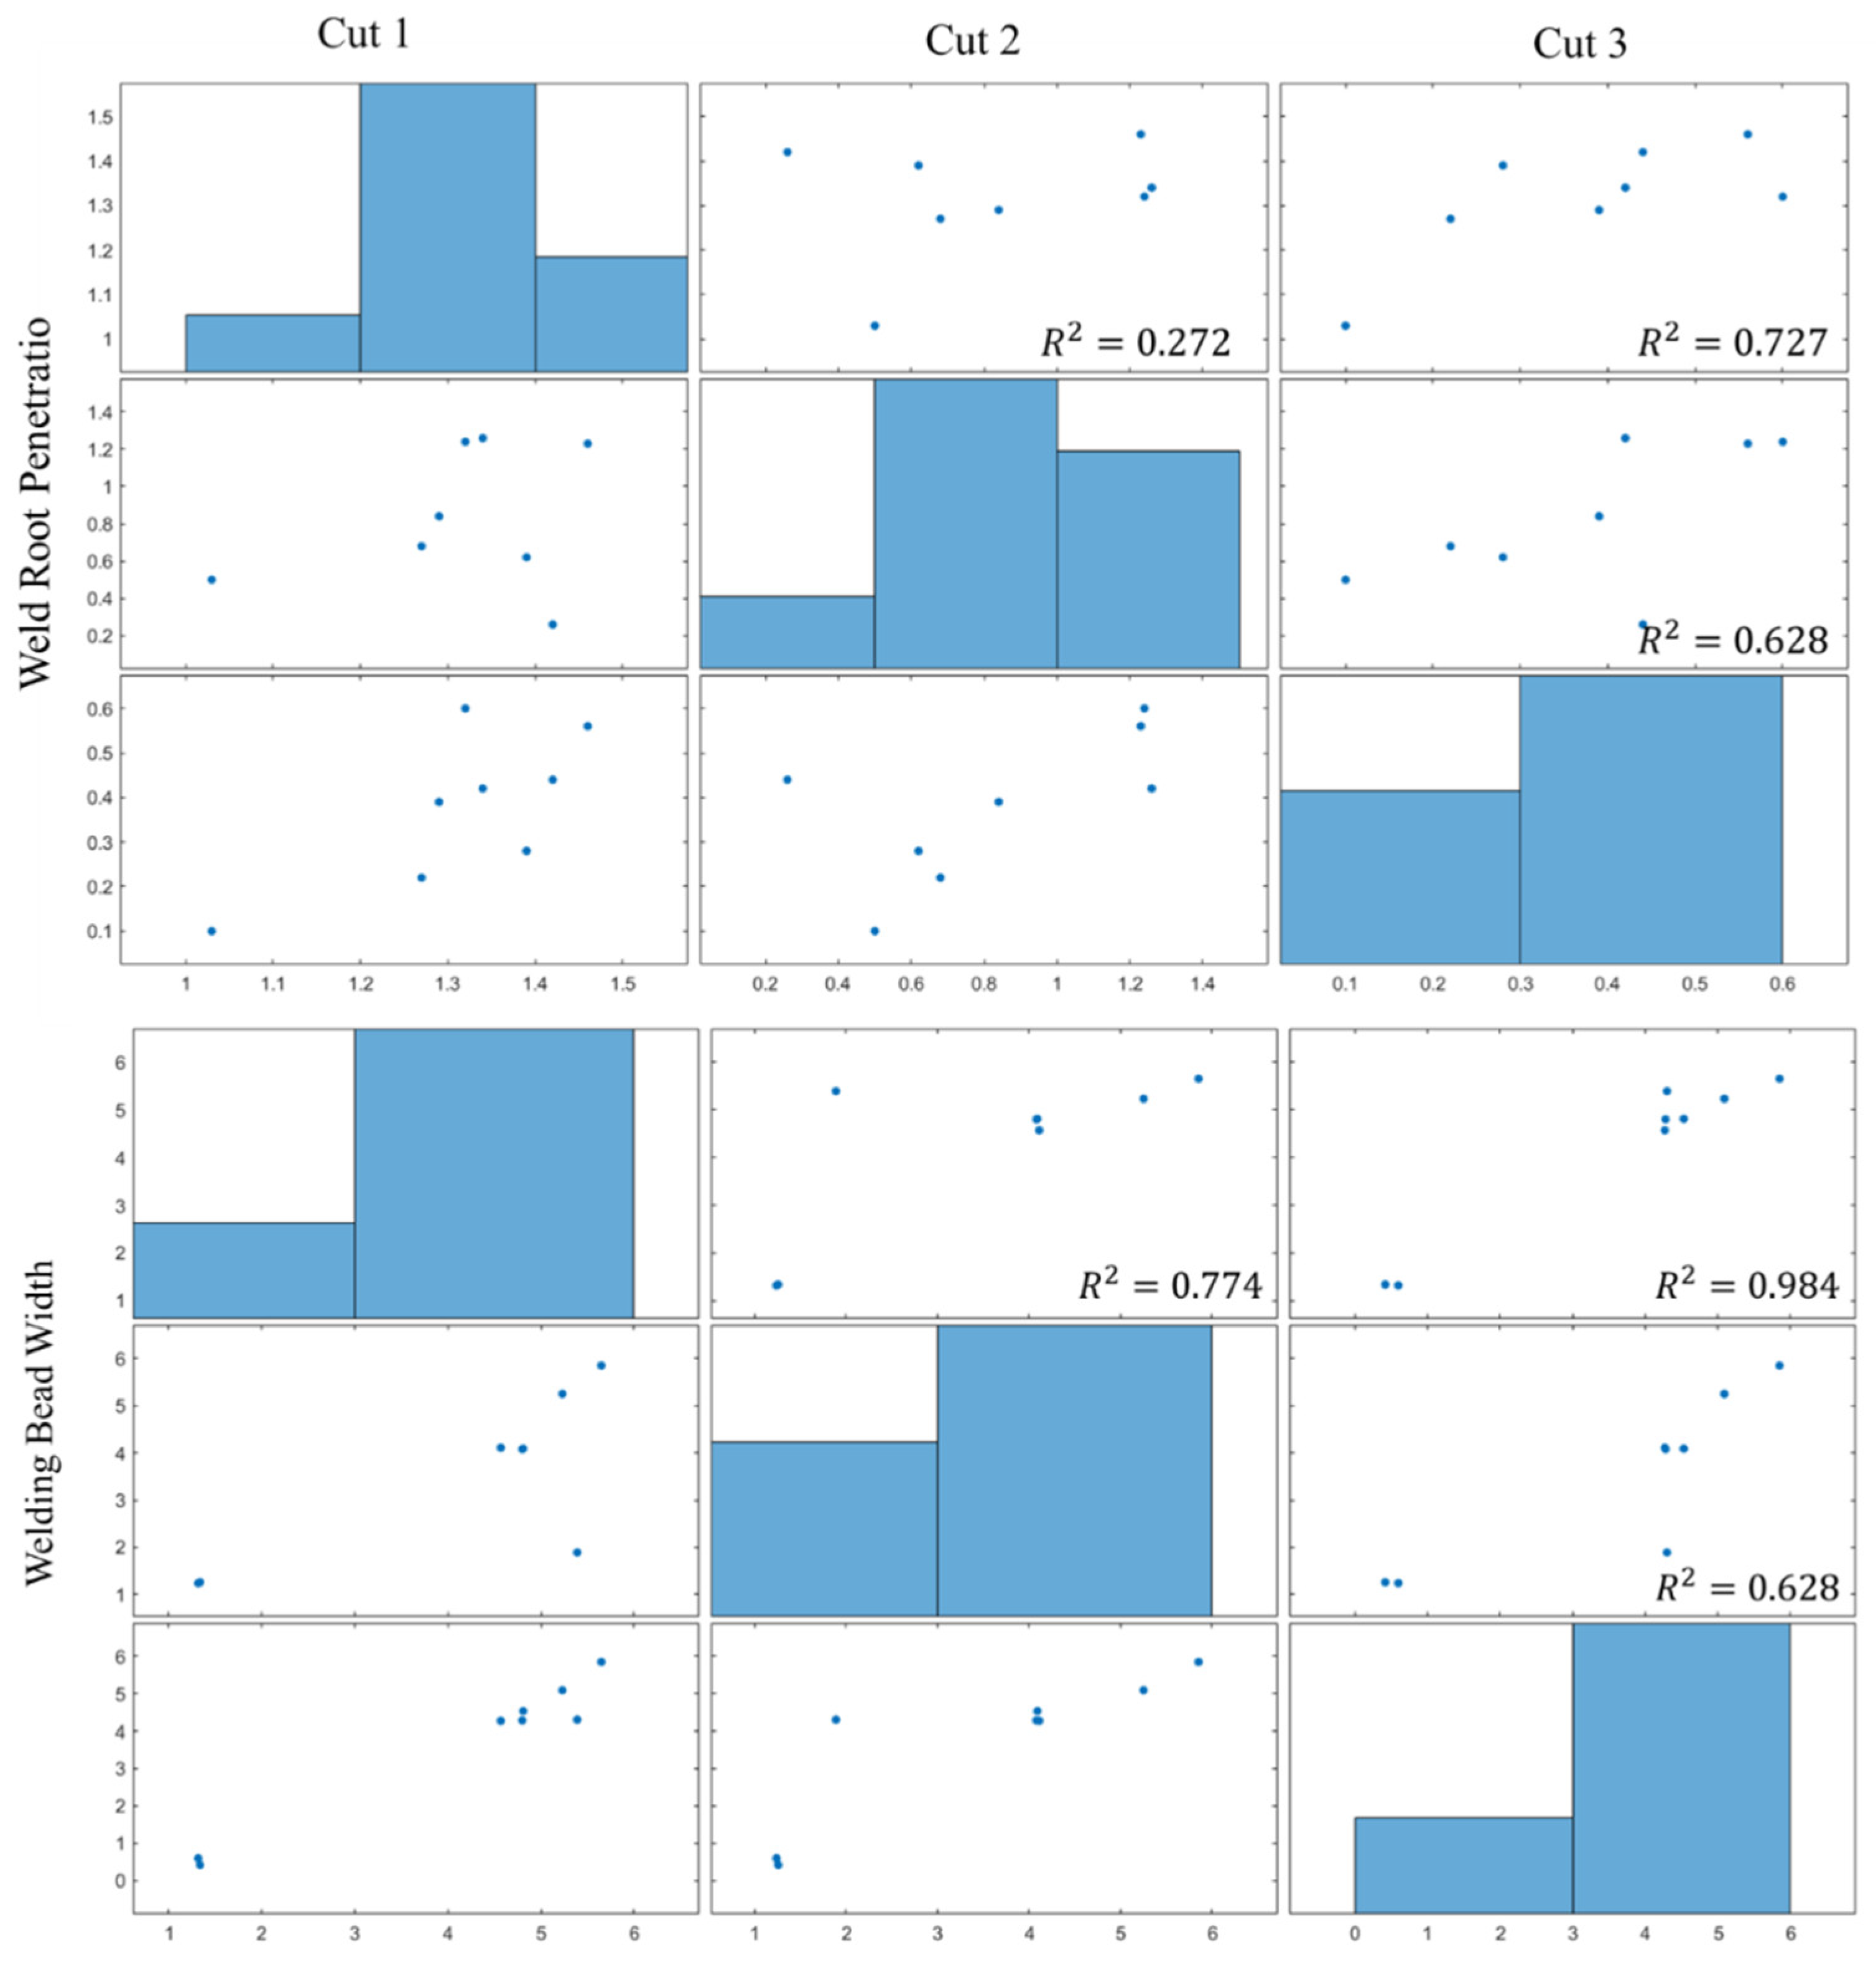
Furthermore, the correlation between the welding features of different cuts for the same weld are shown in
Figure 6. We can find an adequate correlation in most cases. However, as expected, some outliers and slight non-linear trends are appreciated. These anomalies are hypothetically due to the machine and process’s usual variability. Since the measured parameters in
Table 4 do not follow a Gaussian distribution, as they are defined as positive, the mean and standard deviation are reported only for informative purposes. The robust measures of central tendency and dispersion considered for the analysis are the median (m) and median of absolute differences (
MAD) [
36]. The
MAD is defined according to Equation (2):
To measure the variability, the coefficient of quartile variation (
CQV) (Equation (3)) [
37,
38] is also employed, where
Q25 and
Q75 denote the 25th and 75th quantiles of the distribution:
Complementarily, the normalization of the IQR by the median (IQR/median) is also employed as a robust measurement of dispersion. The cut-off value for this statistic is usually defined at 30% (0.3) [
39], and lower values imply a small variability on the data, thus, in the present study, there were no significant differences for the nine tests.
When considering the median value of weld root penetration and bead width for each cut as nominal values, the computed deviation can be assessed for their normality. By means of a Robust Jarque–Bera [
40] normality test implemented in the statistical software STAR (Statistics Tests for Analyzing of Residuals) [
41], they fulfil the Gaussian hypothesis, with the exception of cut 3 of experiment 2 in relation to weld root penetration (
p-value = 4.846 × 10
−7).
Table 5 expands the previous analysis (
Table 3) to consider the deviations from nominal values.
As the median was considered the nominal value for the central tendency, the ratio IQR/median cannot be computed. In all cases, the CQV is greater or less than zero, so significant differences for the deviations in the nine tests for all cuts are found.
Figure 6 shows the Correlation matrix and plot between the three cuts (1, 2 and 3) for the same specimen within the experiment 1. The CQV is a robust measure of relative dispersion, therefore, as stated in
Figure 6, it can be highlighted that there is a significant variation of root penetration for all cuts, except Cut 1 of experiment 1. In relation to the weld bead width, only Cut 2 of experiment 1 has a significant dispersion in relation with the other 5 cuts. These exceptions have to do with the way the welding is done: the torch varies the angle along the weld and so the depth and width of the weld bead also varies.
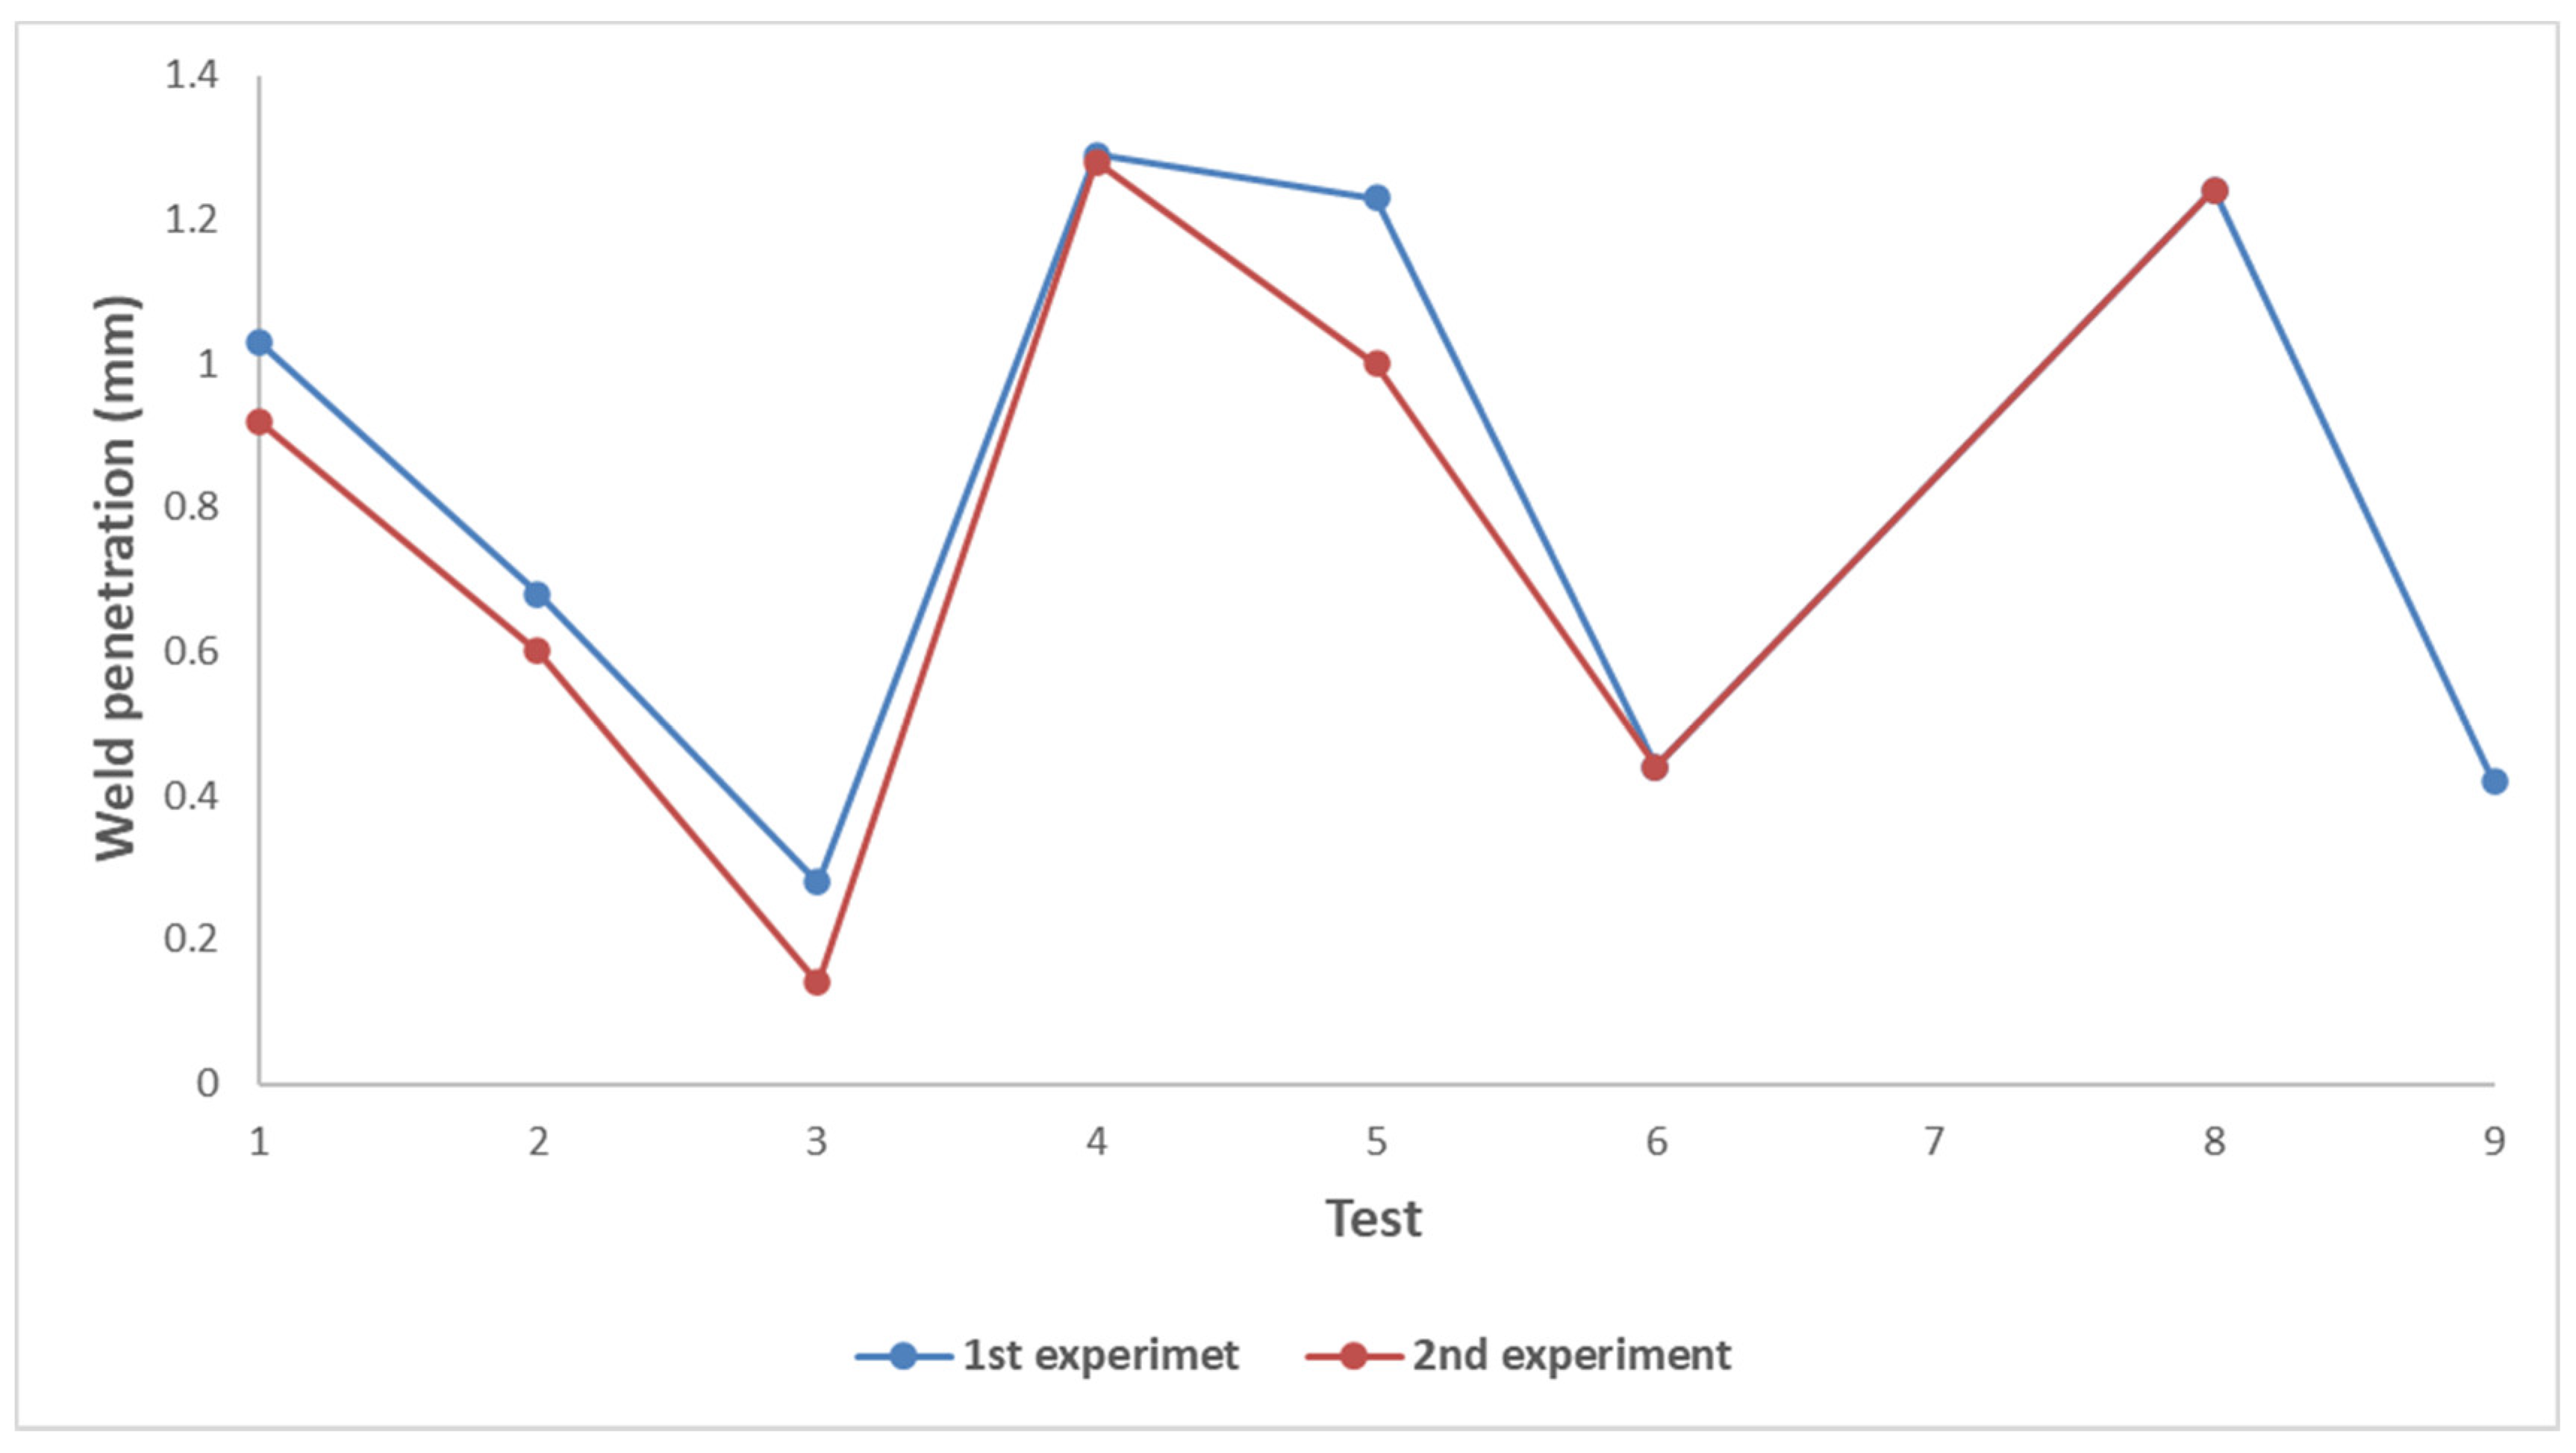
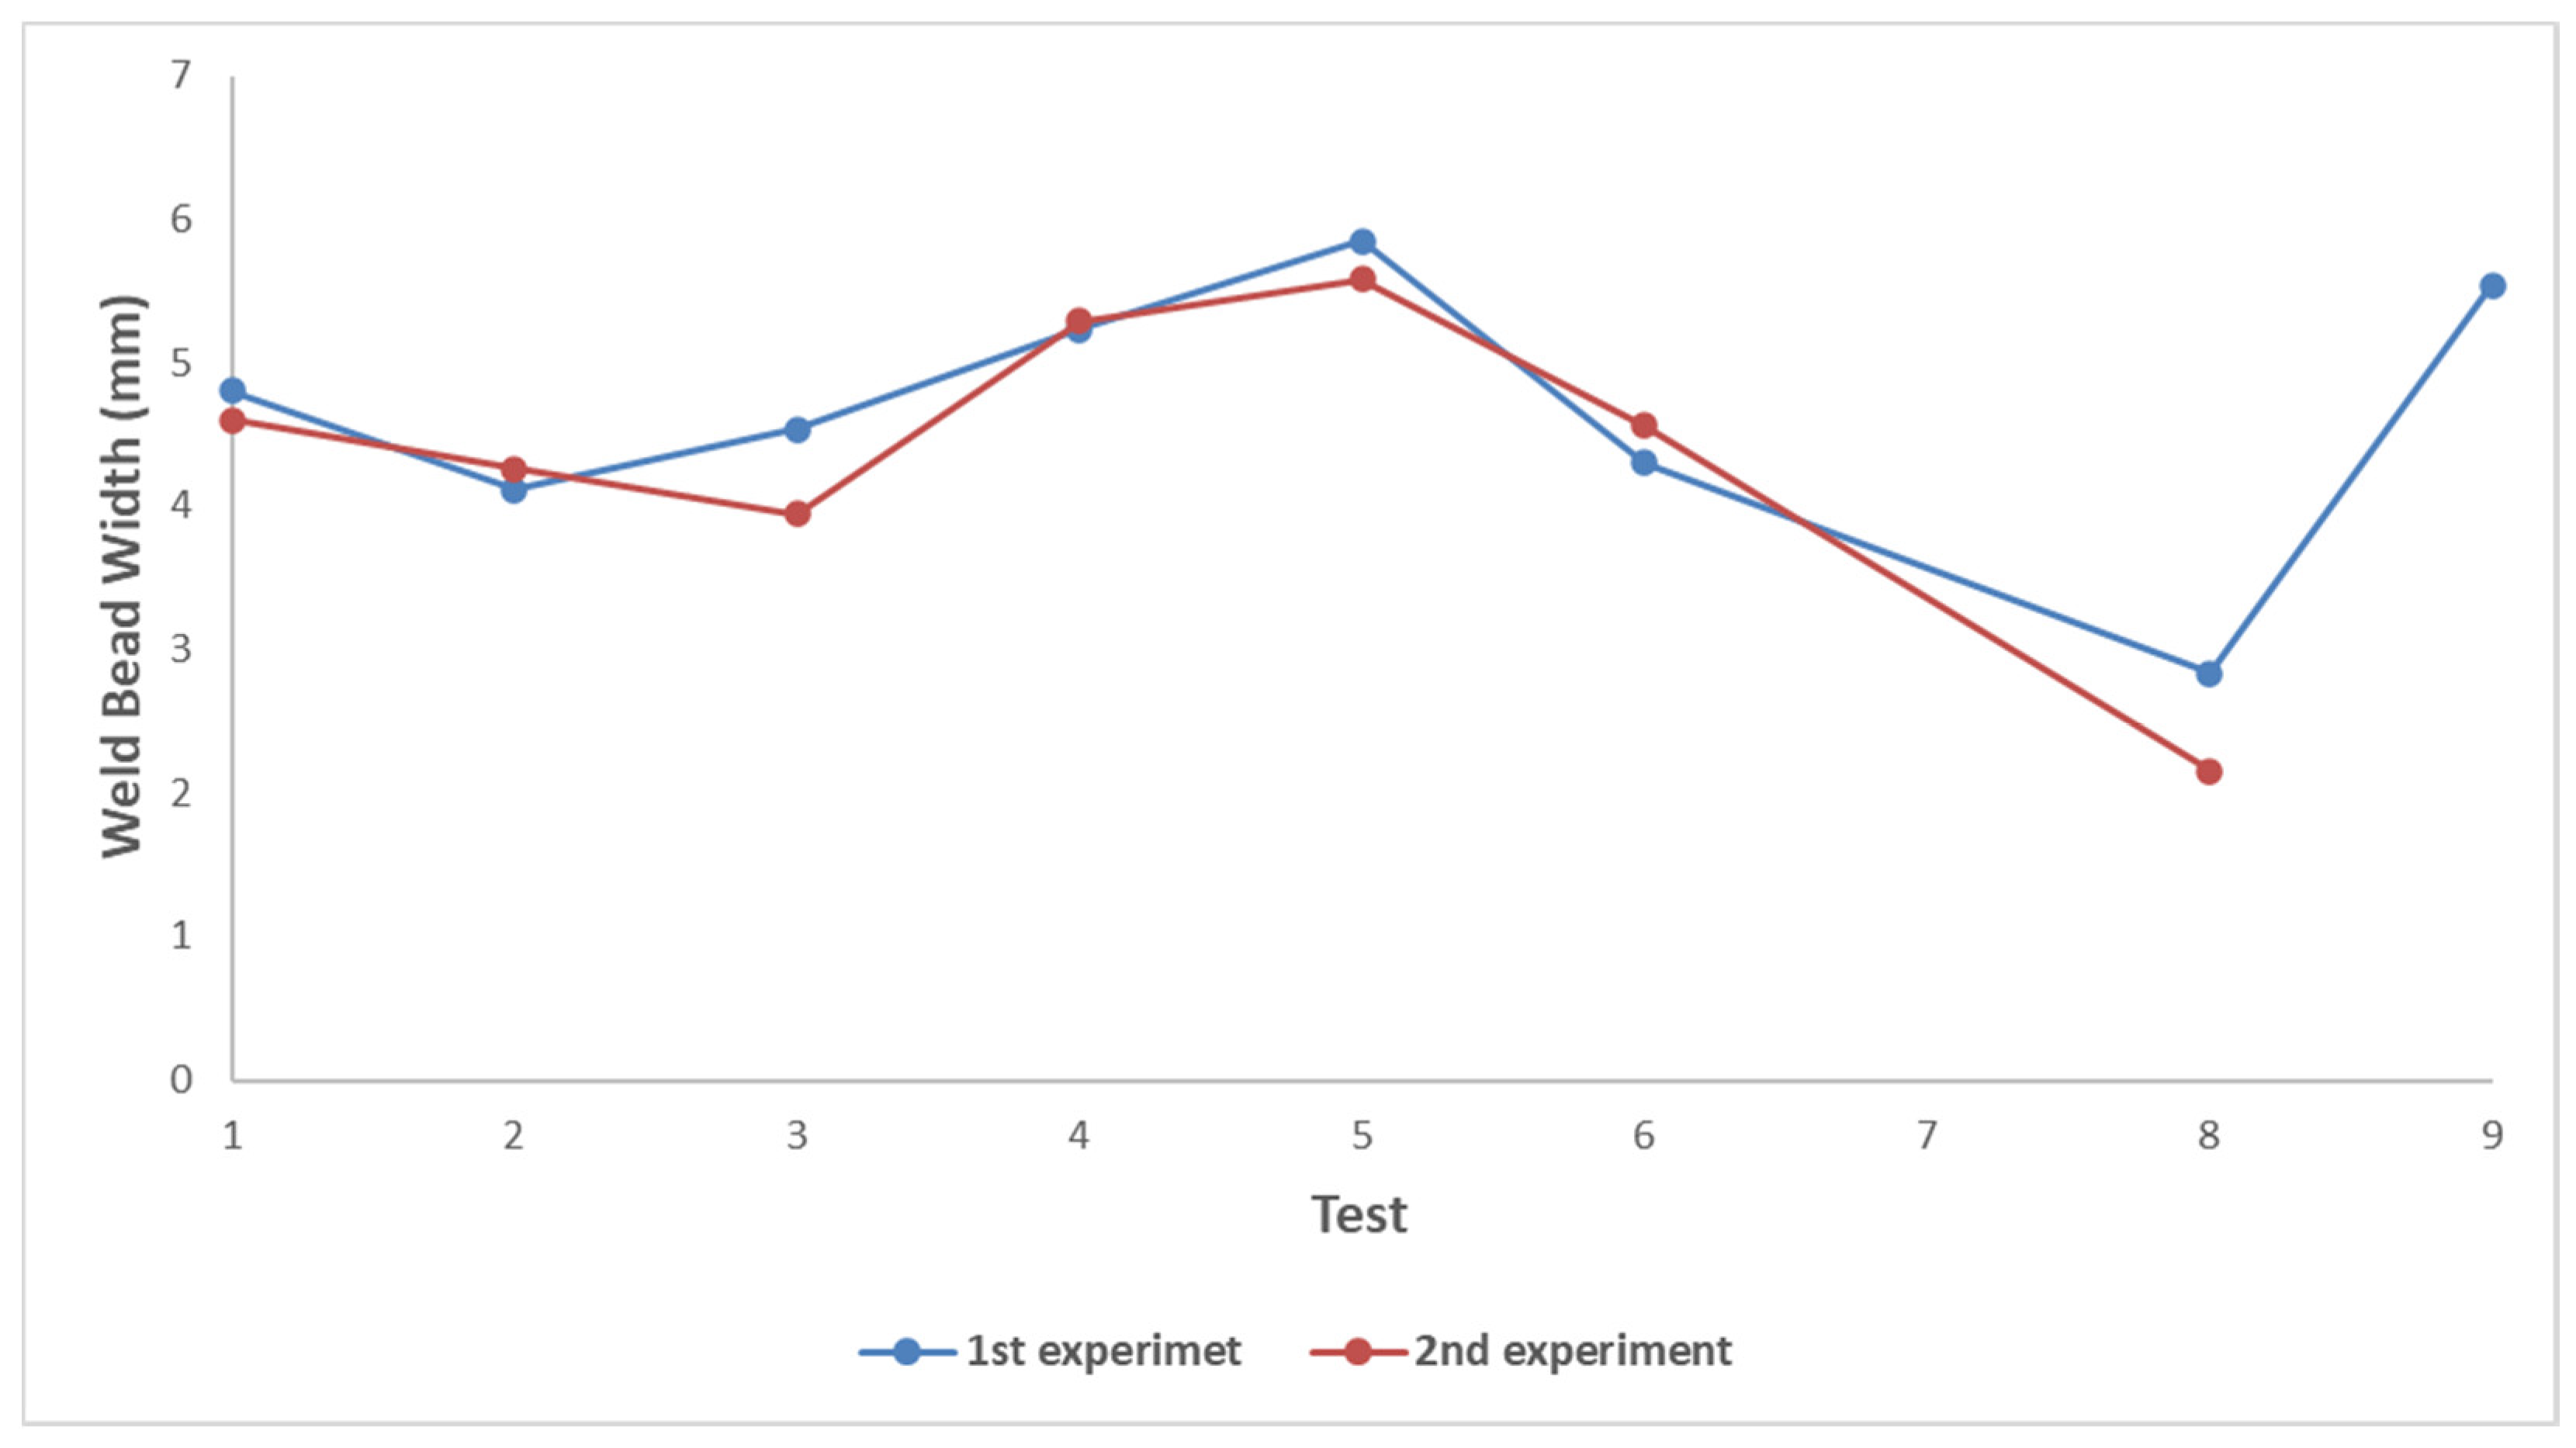
According to Messler JR [
42], the most important geometric characteristics for controlling the quality of a weld are weld penetration and bead width. In the graphs of
Figure 7 and
Figure 8 it is possible to observe the penetration and width values of the weld bead change with the change of input parameters.
In combinations 1, 2, 3, 4, 5, 6, and 8, it is verified that there was a good repeatability of the tests from the first to the second experiment. However, in combinations 7 and 9, the weld bead is not homogeneous along weld of the cord. In some parts of the weld bead occurred excessive weld penetration, while in other parts the weld pierced the tubes, and, in some cases, the welding was not strong enough. A third repetition of combination 9 of this test was carried out to verify the reason for this divergence and it was found that the value of the second test was closer to the third, so it is concluded that this will be the most correct value for that combination of parameters. Regarding combination 7, due to failures in the welding process caused by the absence of material at the regions where the cuts were made, it was not possible to obtain the measurement values.
After acquiring and organizing the results, the Taguchi method was applied. As seen in
Table 6, the values obtained from the S/N ratio for the penetration and width of the weld bead in each experiment are presented.
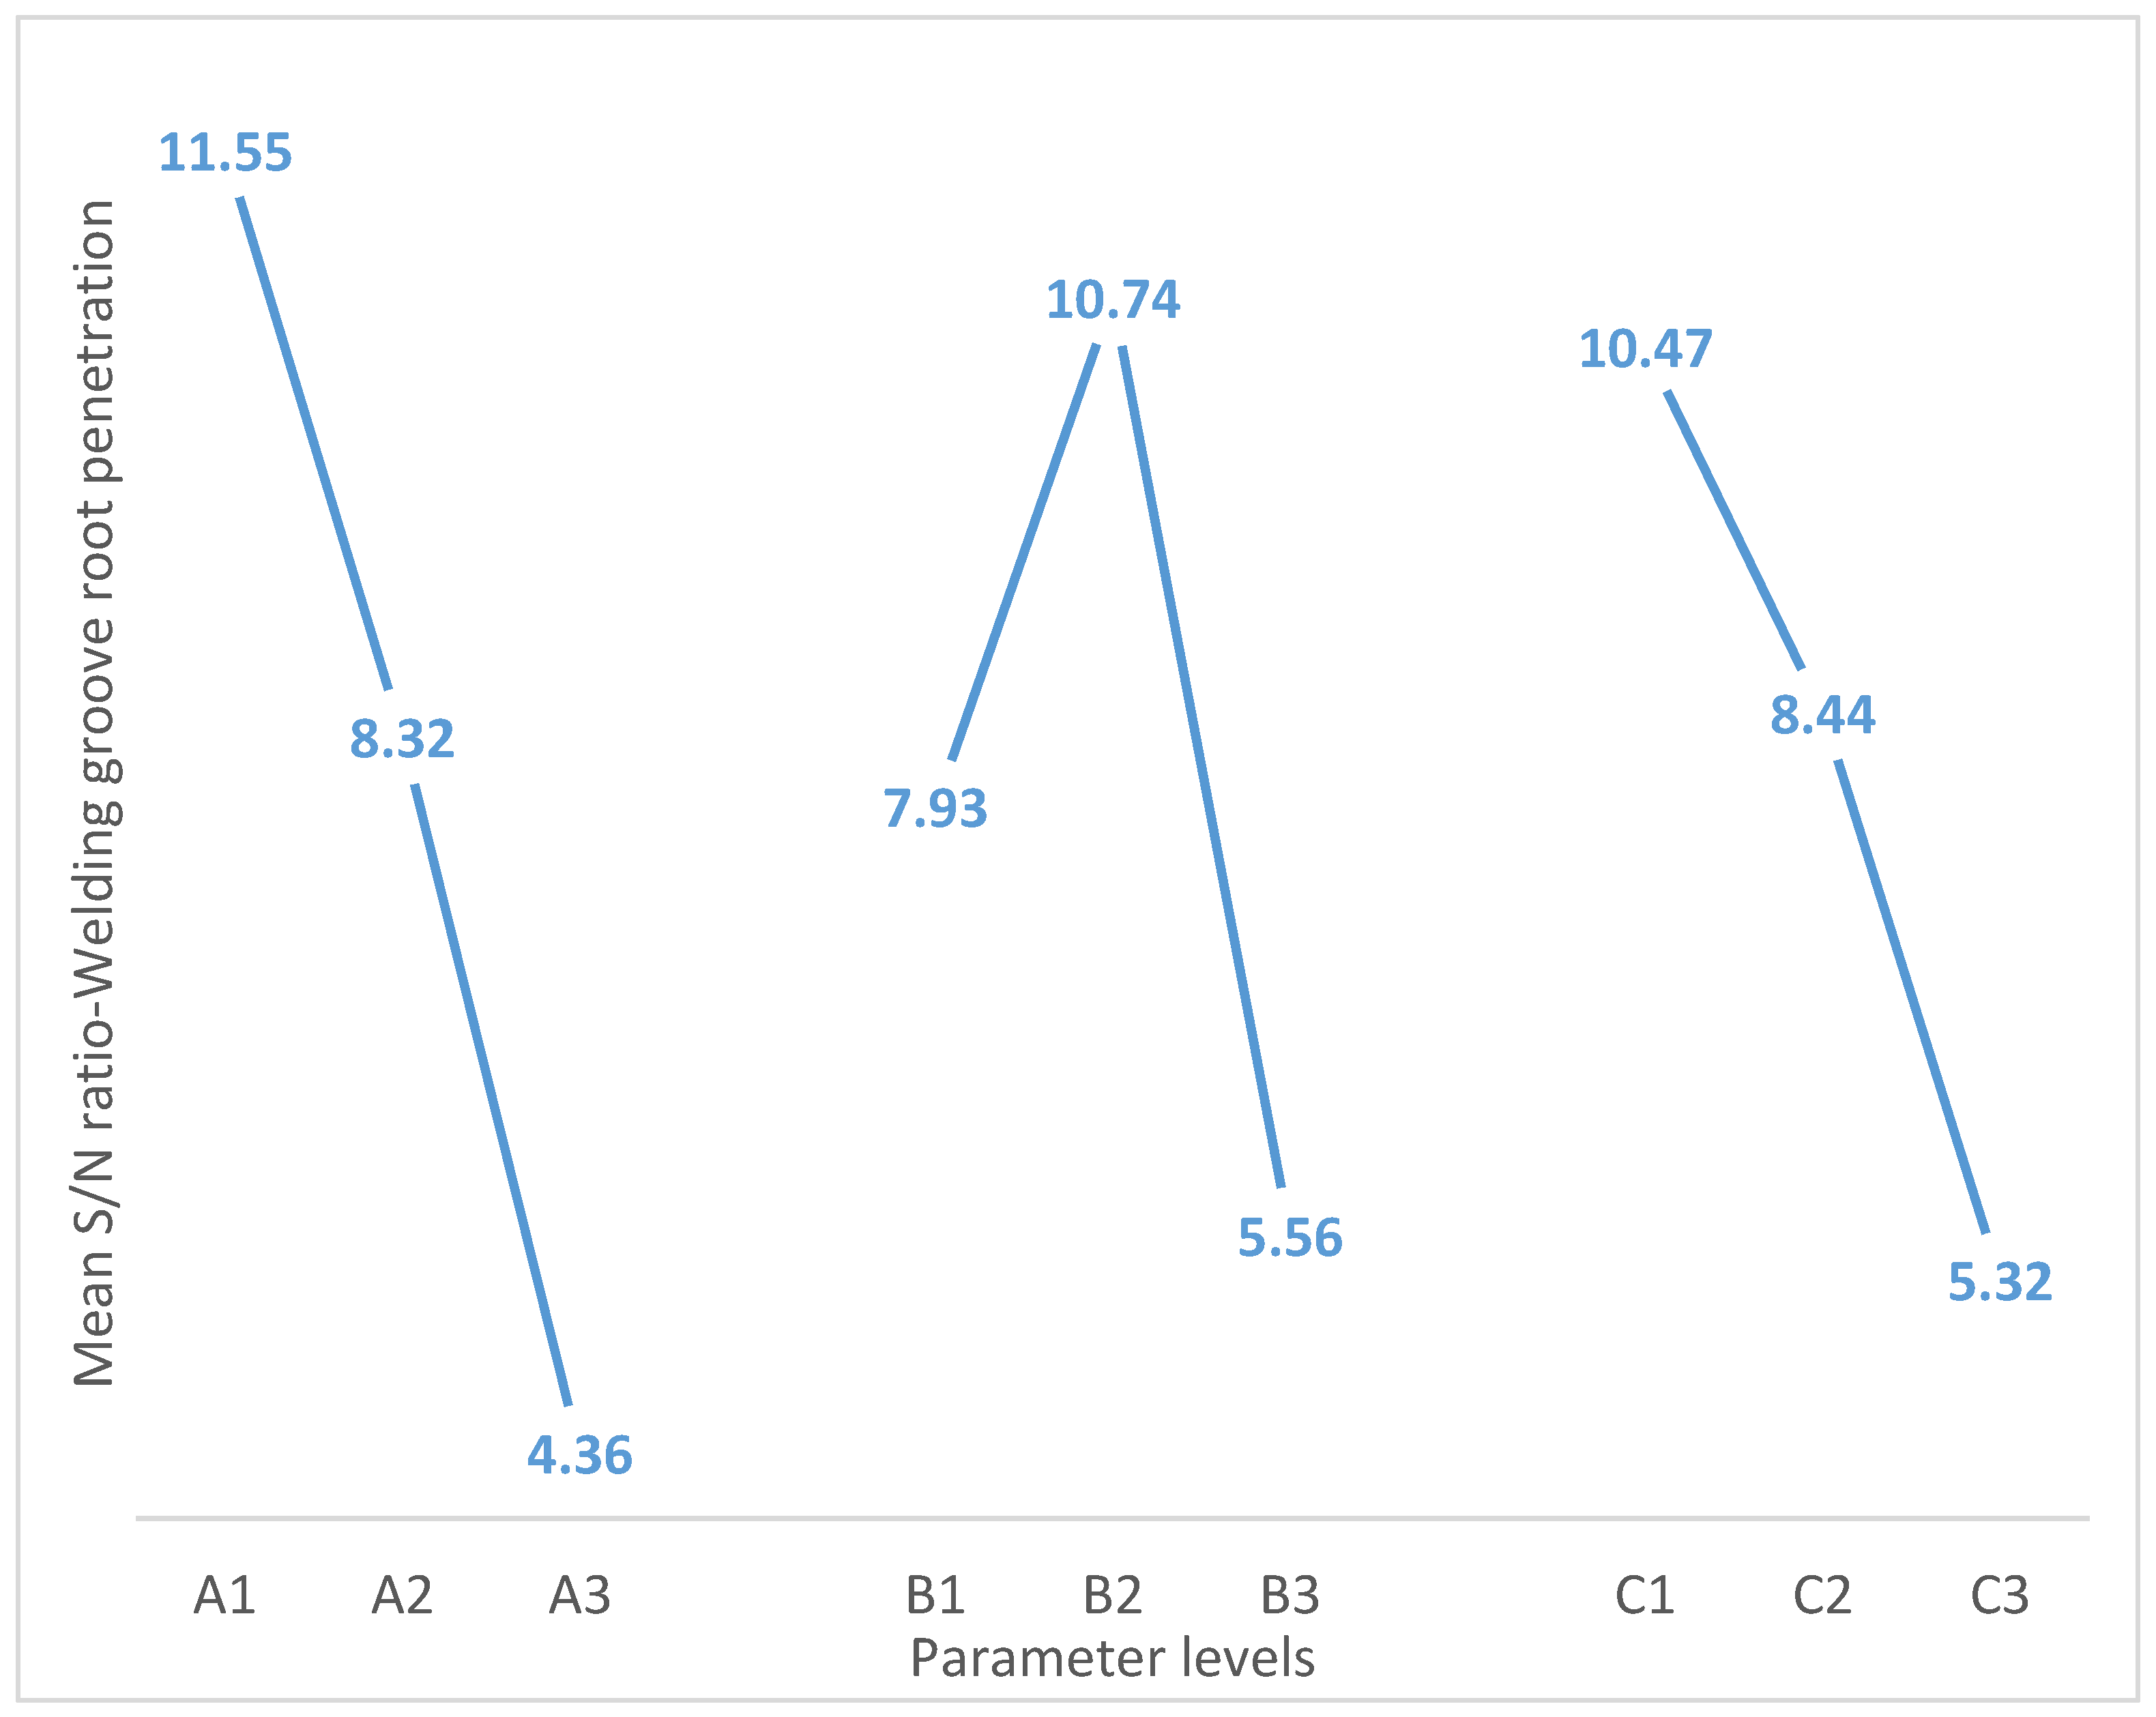
The graphical representation of the mean values obtained for the S/N ratio of welding penetration can be seen in
Figure 9. It is possible to verify that the combination of parameters that gives the optimum value of weld bead root penetration is a welding voltage of 20.8 V, a travel angle of 36°, and a welding current of 180 A.
The values of the S/N ratio were averaged for the different levels established for welding root penetration.
Table 7 reveals these mean values as well as the difference between the maximum and minimum values. The total average of the S/N ratio is 8.08 dB.
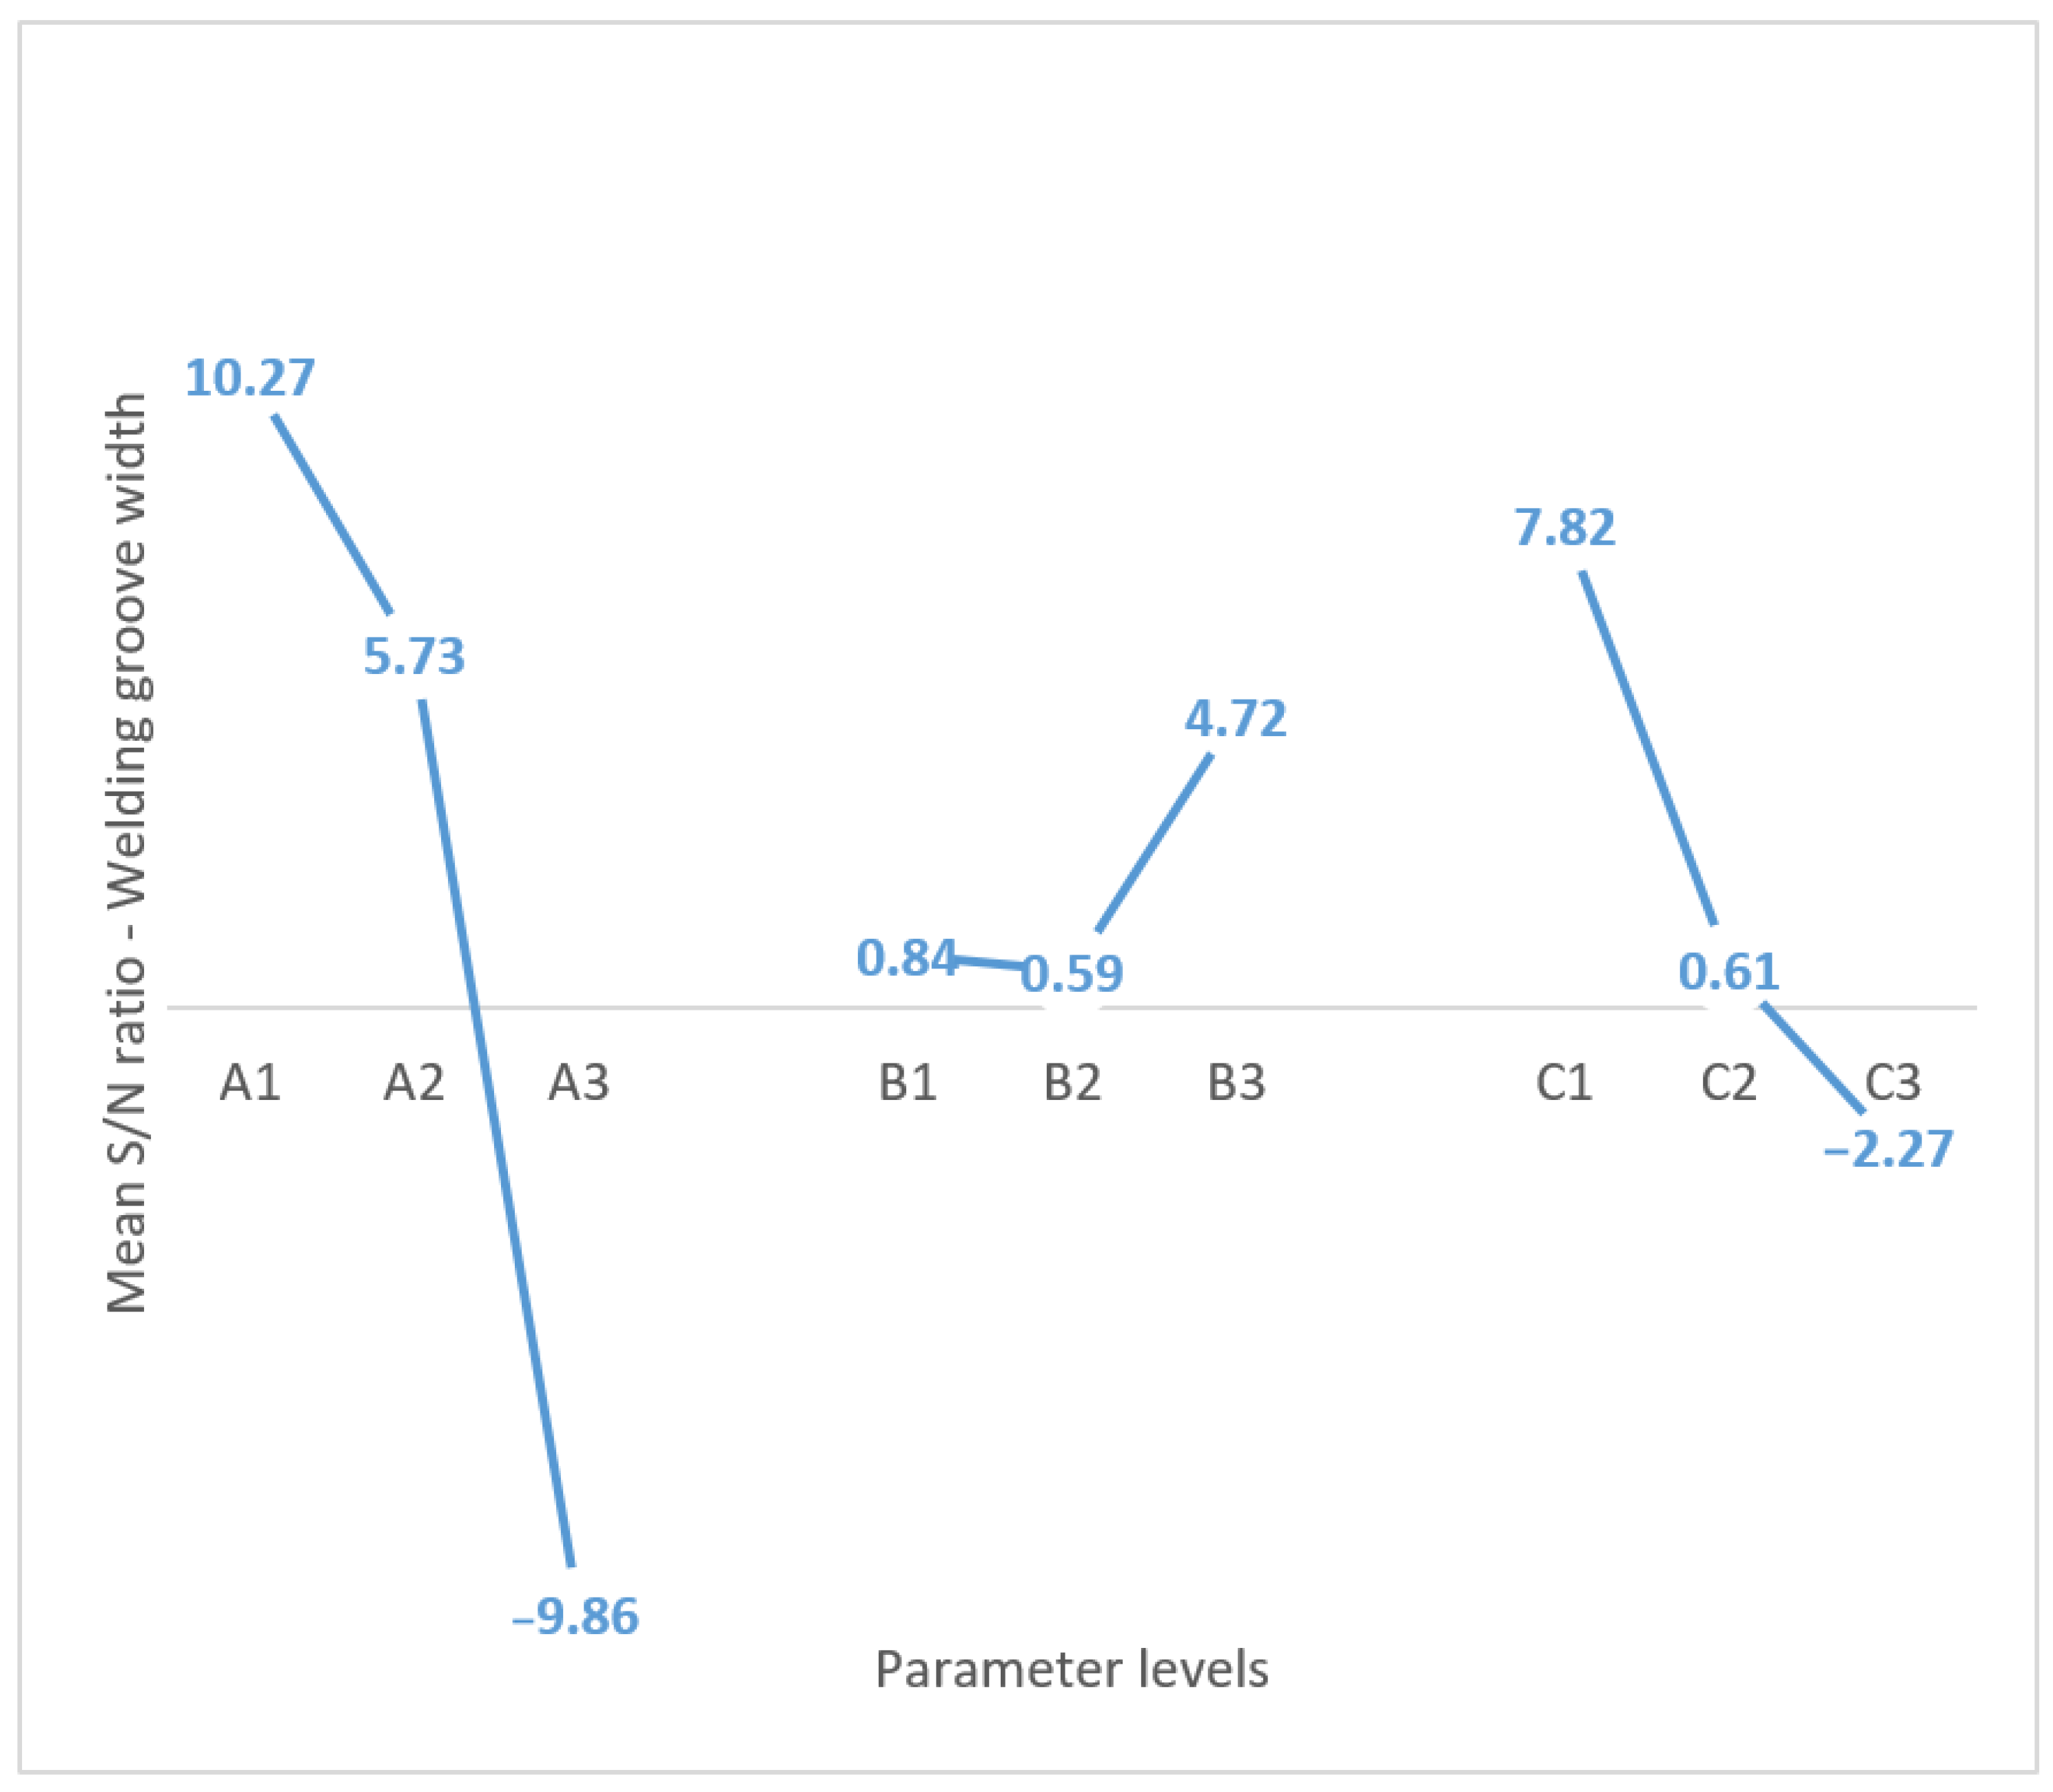
The graphic representation of the mean values obtained for the S/N ratio of the weld bead width can be seen in
Figure 10. Once again, different mean values are observed for the different levels. However, for the weld bead width there are lower S/N values that identify control factor settings that maximize the effects of the noise factors. Analyzing
Figure 10, it is possible to conclude that to optimize the value of weld bead width it is preferable to choose the parameters combination of 20.8 V for the welding voltage, 53° for travel angle, and 180 A for the welding current.
The difference found for the three different levels is notorious. Larger values of S/N ratio identify control factor settings that minimize the effects of noise factors. The same analysis for the width of the weld bead was carried out and the values presented in
Table 8 were obtained. The total average of the S/N ratio is 2.05 dB.
Once more, different mean values are observed for the different levels. However, for weld bead width there are lower S/N ratio values that identify control factor settings that maximize the effects of noise factors.
The ANOVA analysis was then performed using the variables imposed by the Taguchi method and the mean values of the S/N ratio of the weld bead root penetration (
Table 9) and weld bead width (
Table 10).
Where DF represents the degree of freedom, SQ the sum of squares, MQ the mean squares, and the F-value is the variance ratio F.
Analyzing
Table 9 and
Table 10, it is clear that for the width of the weld bead, the most significant parameter is the welding voltage, with 75.6%, followed by the welding current and travel angle, with 18.24% and 3.62% contribution, respectively. Regarding welding bead root penetration, welding voltage is the most significant parameter, with approximately 44%, followed by welding current and movement angle, with 22.61% and 22.55% contribution, respectively. Evaluating statistically, the
p-Value for the weld bead with the value of welding voltage (A) is lower than 0.05, and thus, has a 95% significance level. Meanwhile, for weld bead root penetration the
p-Value is 0.206, which, despite being higher than 0.05, could be acceptable for real industrial applications.
4. Conclusions
In this article, an experiment for the study of the parameters that affect the quality of the automatic welding of stainless-steel tubes processes has been presented. For this aim, nine study specimens have been manufactured under controlled conditions for two different types of tubes (experiment 1 and 2). Three different levels have been set depending on the input parameters of the process. Subsequently, three sections have been obtained for each specimen and two quality welding parameters (weld root penetration and welding bead width) have been measured using macrography. The statistical results show slight differences between these parameters in different sections of each specimen due to the expected variability of the process. Subsequently, two statistical tools have been applied to evaluate the contribution of each welding parameter: the Taguchi method and ANOVA analysis.
The Taguchi method proved to be quite robust and allowed combinations of welding parameters to be reached that show improvements in weld penetration and bead width, essential parameters for obtaining a high-quality weld. For an optimal value of weld bead root penetration, the results of the Taguchi method and ANOVA analysis lead to the combination of a robot speed of 150 cm/min, a welding voltage of 20.8 V, a travel angle of 36°, and a welding current of 180 A. In turn, for an optimal bead width the combination of a robot speed of 150 cm/min, a welding voltage of 20.8 V, a movement angle of 53°, and a welding current of 180 A would be ideal.
From the analysis of variance, it was possible to identify the most influential parameter, being the welding voltage, with a contribution of 43.55% for the welding penetration and 75.26% for the bead width. The target value for welding penetration was 0.672 mm, which leads to the conclusion that test two is the closest to the ideal. For the width of the weld bead, a target value of 4.38 mm was obtained. The test that achieved a value closest to this was test six.


 ,
, 


