Article

WELDMAP: A Photogrammetric Suite Applied to the Inspection of Welds

by
Esteban Ruiz de Oña
1,
Manuel Rodríguez-Martin
2,
Pablo Rodríguez-Gonzálvez
3,
Rocio Mora
1 and
Diego González-Aguilera
1,*
1
Department of Cartographic and Land Engineering, Higher Polytechnic School of Ávila, Universidad de Salamanca, Hornos Caleros 50, 05003 Ávila, Spain
2
Department of Mechanical Engineering, Higher Polytechnic School of Zamora, Campus Viriato, Universidad de Salamanca, Avenida Requejo 33, 49022 Zamora, Spain
3
Department of Mining Technology, Topography and Structures, Universidad de León, Av. Astorga s/n, 24401 Ponferrada, Spain
*
Author to whom correspondence should be addressed.
Submission received: 3 January 2022 / Revised: 3 February 2022 / Accepted: 24 February 2022 / Published: 28 February 2022
(This article belongs to the Special Issue Quality Control in Welding)

Abstract

:
This paper presents a new tool for external quality control in welds using close-range photogrammetry. The main contribution of the developed approach is the automatic assessment of welds based on 3D photogrammetric models, enabling objective and accurate analyses through an in-house tool that was developed, WELDMAP. As a result, inspectors can perform external quality control of welds in a simple and efficient way without requiring visual inspections or external tools, and thus avoiding the subjectivity and imprecisions of the classical protocol. The tool was validated with a large dataset in laboratory tests as well as in real scenarios.

1. Introduction

Welding is a very important task in the field of engineering and construction, since welds that are not properly carried out reduce the mechanical properties of joints, minimising their effective service life, and possibly promoting their collapse, which could entail drastic consequences, being that welding joints are the weakest links in assemblies [1]. For this reason, quality requirements are highly standardised (e.g., [2,3,4] and also highly specified for specific cases such as pressure vessels [5]).
Therefore, welding is a joining process that requires inspection and monitoring tasks. The visual inspection is a simple and widely extended non-destructive test modality [6], which is applied for the assessment of weld bead geometry and the detection of surface imperfections and flaws. Visual inspection tests are regulated by the standard [7].
The application of visual inspection allows for detecting defects and imperfections that have a manifestation on the surface of the weld. The taxonomy of defectology in welds is widely established by the international quality standards (e.g., [3,4]). So, inspection techniques are aimed at detecting and evaluating defects established in these norms. Visual inspection, as a non-destructive testing method, should be implemented by inspectors with training and expertise who have acquired a level of competence also established by the international standards (e.g., [8]). These inspectors are often engineers with extensive knowledge of the welding process and who have passed several exams to demonstrate that they have the right skills.
The inspector usually has the obligation to visit the welds on-site to evaluate the quality of each weld performed according to the international standards, which entails a significant economic investment [6]. In addition, the inspector must evaluate the weld at the site, often in a very short time and record the information of each weld in an analogical way or in traditional databases. To do this, it is common to use different auxiliary tools to evaluate the quality of welds such as tweezers or weld gadget kits [9]. These tools, being for manual use, generate measures with significant errors and especially result in visual fatigue for the inspector.
Currently, some authors are investigating other, more sophisticated techniques for the detection and identification of external pathologies in welds: laser systems [10,11], scanning cameras [12], hybrid laser-based systems and cameras [13,14,15,16], stereo imagery [12,17], close-range photogrammetry [9,18], and, finally, active thermography systems as supports for visual inspection, which are applied directly to the study of cracks in welds [19].
Among these techniques, close-range photogrammetry and laser scanning allow the accurate three-dimensional reconstruction of weld bead geometries in a non-invasive way. Such 3D models can be used for the inspection of external welding imperfections and defects. However, there are several differences in terms of operating principle (i.e., active versus passive sensors), working range, and cost-efficiency ratio. The reader can find more information about this comparison in [20,21]. Close-range photogrammetry has been used for the generation of 3D models that allow for the analysis of defects such as overlap and lack of fusion, among others [9]. It has also been used for the three-dimensional assessment of plaque misalignment [22]. In [9], a pioneering method of inspection based on close-range photogrammetry was established. For its part, active systems such as laser scanning have been also used for the evaluation of the external quality of welds. In [22], authors used a structured light system, which allows the accurate assessment of the weld bead according to the quality criteria. The procedure developed enables the extraction of metric information about the thickness and the deformation angle of the welds. However, to date, there is not a global solution that integrates the 3D reconstruction of welds with the automatic assessment of their external quality according to international standards.
Therefore, this paper presents a software, WELDMAP, which allows systematising the external assessment of welds based on close-range photogrammetry, integrating algorithms to implement defectology analysis in an appropriate manner in accordance with the quality standards.
After this introduction, the document has been structured as follows: Section 2 describes the methodology, highlighting the key steps for the 3D welds’ reconstruction and their defectology analysis. The experimental results are listed and discussed in Section 3. Finally, Section 4 is devoted to outlining the main conclusions and future perspectives.

2. Methods

Currently available commercial products devoted to the quality control of welds bypass the use of robust and accurate 3D models and are more focused on the assessment of internal defectology using consolidated non-destructive techniques (e.g., X-ray, ultrasounds, etc.). Considering this limitation, an in-house software, named WELDMAP, has been developed with the aim of providing a robust tool for the external inspection of welds. Based on the advantages offered by computer vision (low-cost and flexibility) and photogrammetry (accuracy and reliability), together with the different algorithms specifically developed for quality control, the information for the inspection of welds can be computed, analysed, and monitored in an efficient way. As a result, objective and accurate expert reports can be generated by the inspectors. Figure 1 outlines the main workflow codified in the software WELDMAP. The following sections will explain this software’s methodology.

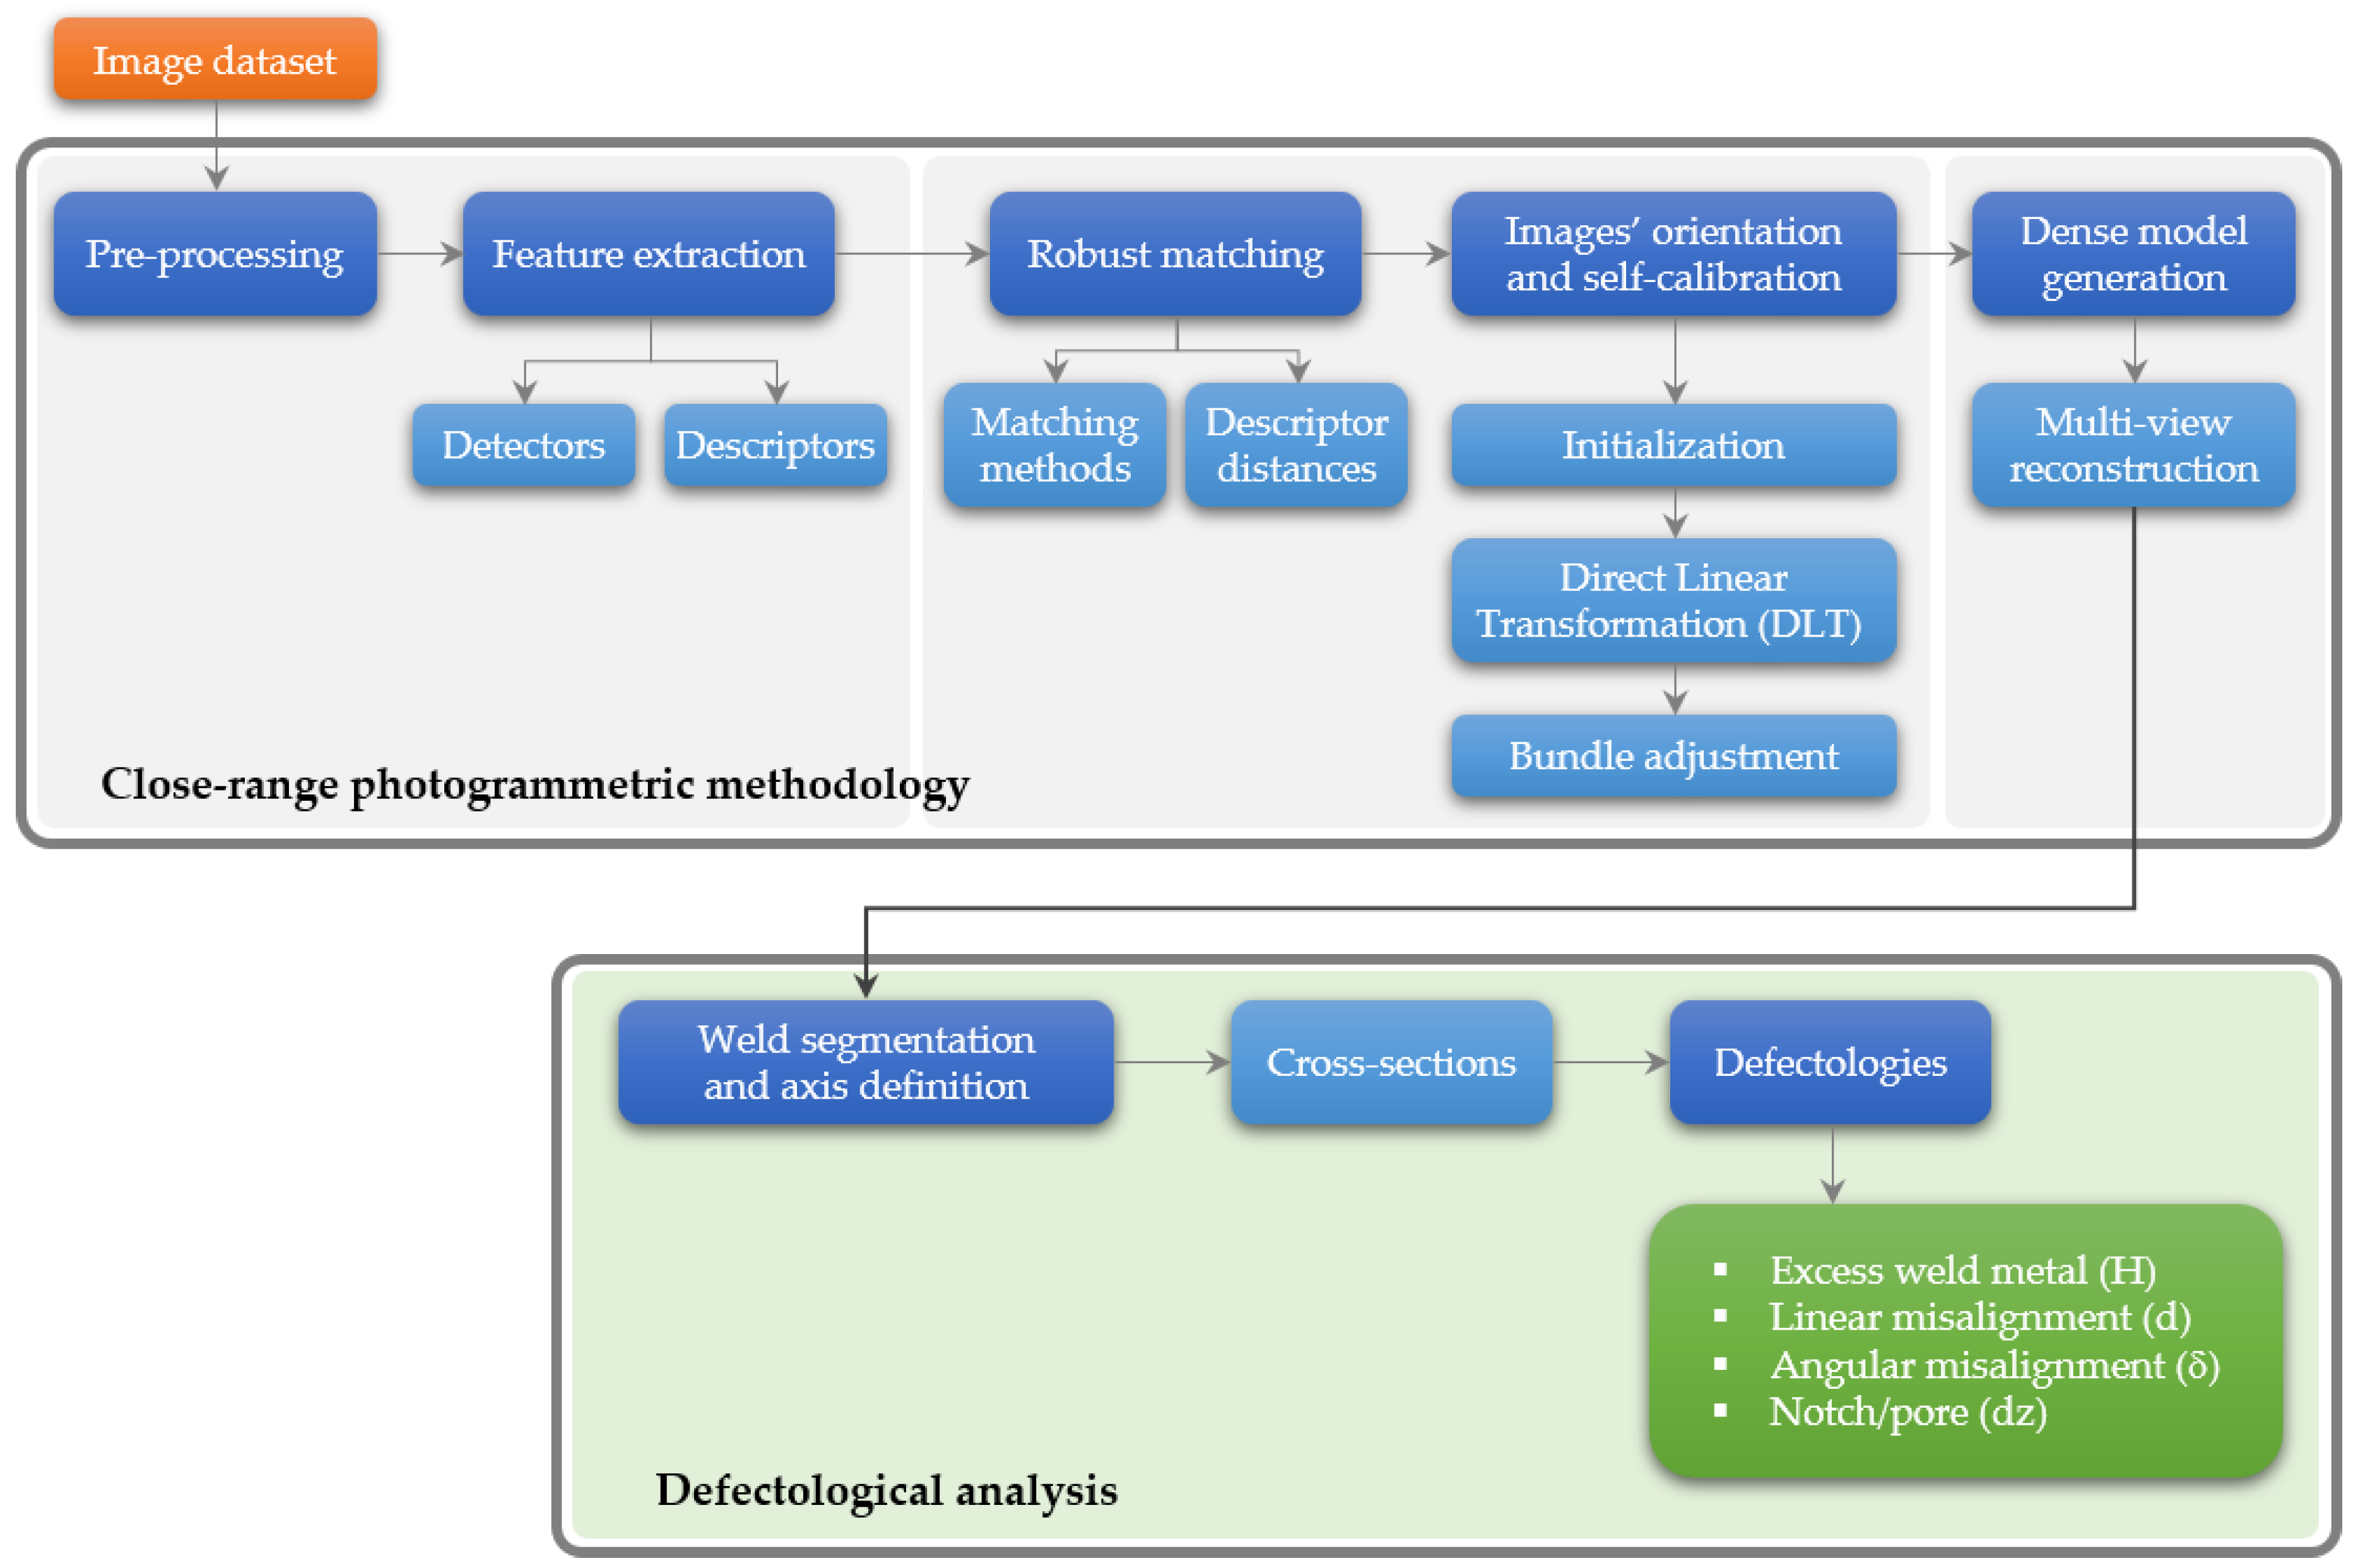
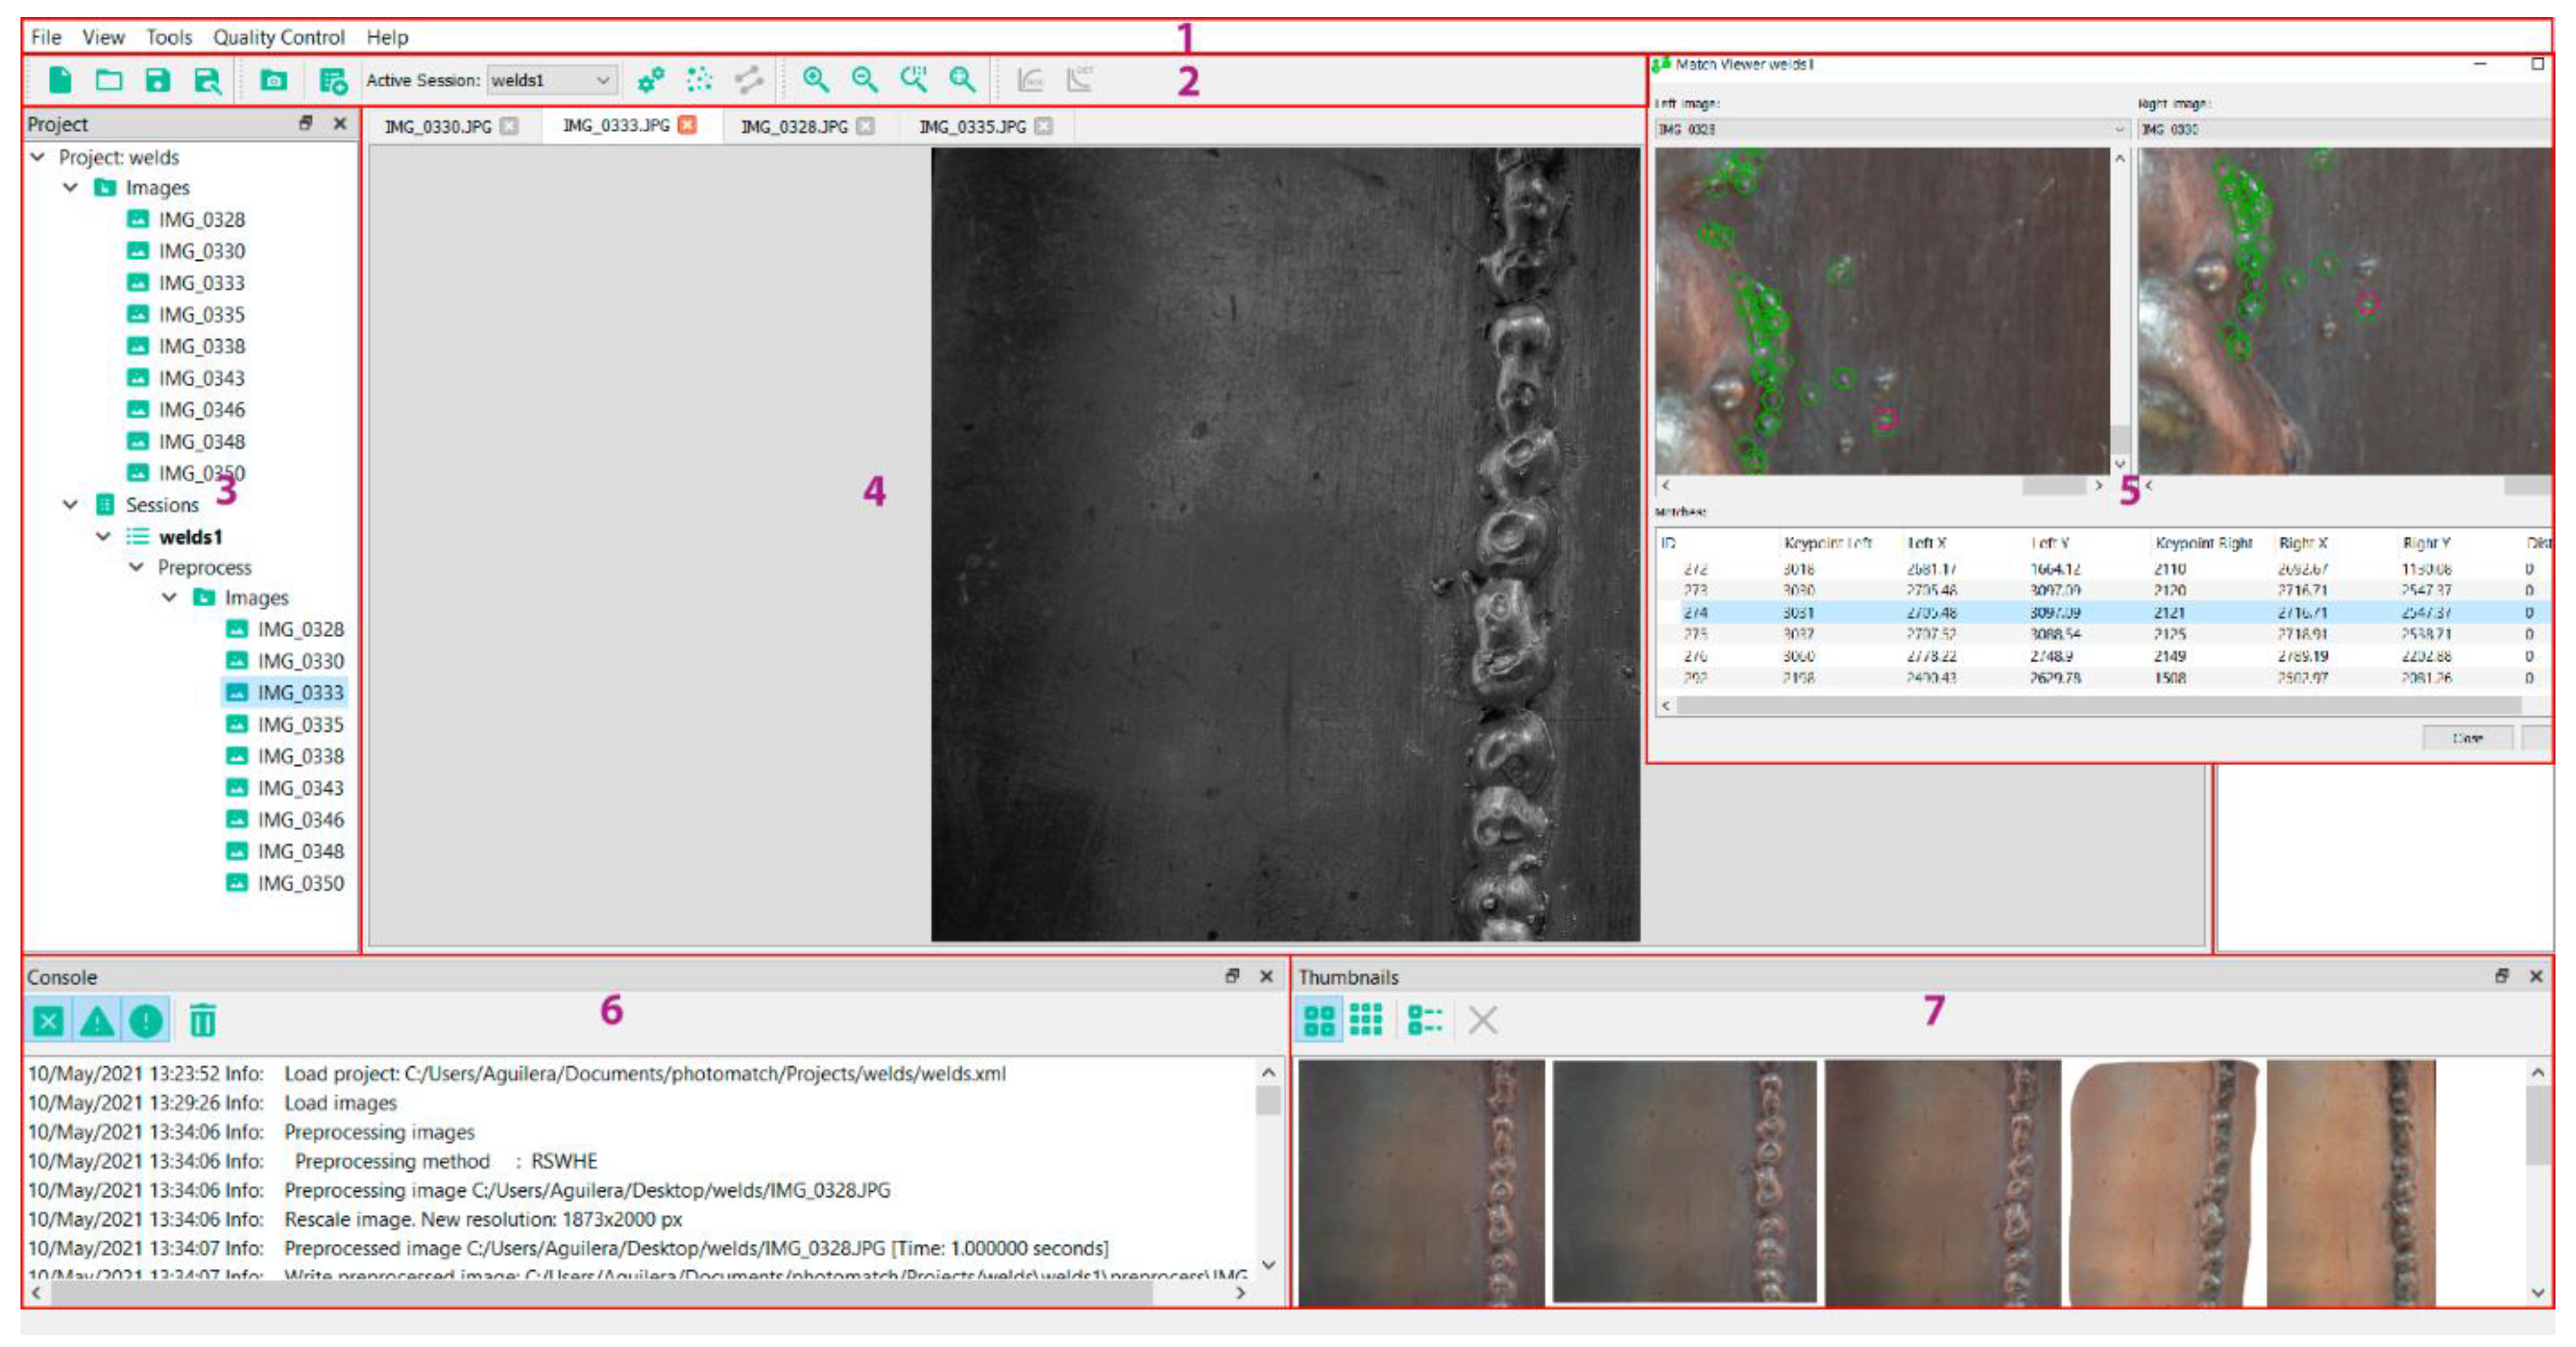
2.1. Close-Range Photogrammetric Methodology

The photogrammetric pipeline is a process oriented to obtain a dense and three-dimensional point cloud of a weld’s surface through the application of different algorithms and phases, which will be detailed in the following subsections.

Extraction and Matching of Features

Since image acquisitions were not only limited to vertical but also an oblique point of view, the processing of the images must incorporate last advances and algorithms in computer vision for images matching [23] and images orientation [24,25]. Before extracting and matching features, images must be pre-processed in order to improve the radiometric contents and ease the successive feature extraction. Image pre-processing has been reported in many papers as a fundamental step, particularly in those cases where the texture quality is non-favourable [26,27,28]. Different pre-processing algorithms are available in WELDMAP, including, among others: ACEBSF [29], POHE [30], RSWHE [31], Wallis [32], etc. This step is facultative but highly suggested in order to achieve better results in the feature extraction and matching step.
WELDMAP implements diverse sets of detectors (e.g., SIFT [33], SURF [34], MSER [35], MSD [36], ORB [37], AKAZE [38], BRISK [39], etc.) and descriptors (e.g., BOOST [40], BRIEF [41], DAISY [42], FREAK [43], etc.) to let the user run and test different combinations and assess the results in different conditions. Any kind of combination is allowed in the software. For each detector–descriptor, several advance parameters can be defined by the user.
Finally, the features extracted are matched robustly using geometric constraints in order to guarantee that they match the same point. To this end, WELDMAP uses projective geometry and more precisely homography, based on epipolar geometry, to refine the matching. Considering this, cameras could be uncalibrated and the possible presence of outliers in the matching, fundamental matrix, and RANSAC [44] are used to verify the matchings from a geometrical point of view.

2.2. Orientation and Dense Model Generation

2.2.1. Images’ Orientation and Self-Calibration

The cameras’ orientation and self-calibration were performed hierarchically in three steps following the pipeline of Figure 1:
  • First, the initialisation of the first image pair was carried out, selecting the best pair of images. To this end, a trifold criterion was established for selecting the initial image pair: (i) guarantee a good ray intersection; (ii) contain a considerable number of matching points; (iii) present a good matching points distribution along the image format. Note that initialising with a good image pair usually results in a more reliable and accurate reconstruction.
  • Second, once the image pair was initialised, image triangulation was performed through the direct linear transformation (DLT) [45], taking the matching points and the camera pose provided by the fundamental matrix as input data. Afterwards, and considering this initial image pair as a reference, new images were firstly registered and then triangulated using again the DLT. The DLT allows us to estimate first the camera pose and then to triangulate matching points in a direct way, that is, without initial approximations and without calibration camera parameters. As a result, 2D–3D correspondences are provided together with the registration of the images.
  • Third, although all the images were registered and triangulated based on DLT, this method suffers from limited accuracy and reliability, which could drift quickly to a non-convergent state. To cope with this problem, a bundle adjustment (BA) based on a collinearity condition [24] was applied with a threefold purpose: (i) compute registration and triangulation together and in a global way; (ii) consider the estimation of the inner parameters of the camera, self-calibration; (iii) obtain more accuracy and precision in the image orientation and self-calibration, using a non-linear iterative procedure supported by the collinearity condition that minimises the reprojection error.
As a result of this orientation and self-calibration stage, an integrated registration and triangulation are obtained which entails that all images are connected and related according to the camera pose (rotation matrix and translation vector), without forgetting the inner parameters of the camera (self-calibration).

2.2.2. Dense Model Generation

Once we had solved the orientation and self-calibration of the imagery dataset, a multi-view reconstruction approach [46] that combines stereo and shape-from-shading energies into a single optimisation scheme was used. Particularly, this method uses image gradients to transition between stereo-matching (which is more accurate at large gradients) and Lambertian shape-from-shading (which is more robust). Furthermore, the dense model generation approach uses an energy function that can be optimised efficiently, using a smooth surface representation based on bicubic patches [47], which allows for defining a surface per view that has continuous depth and normals.

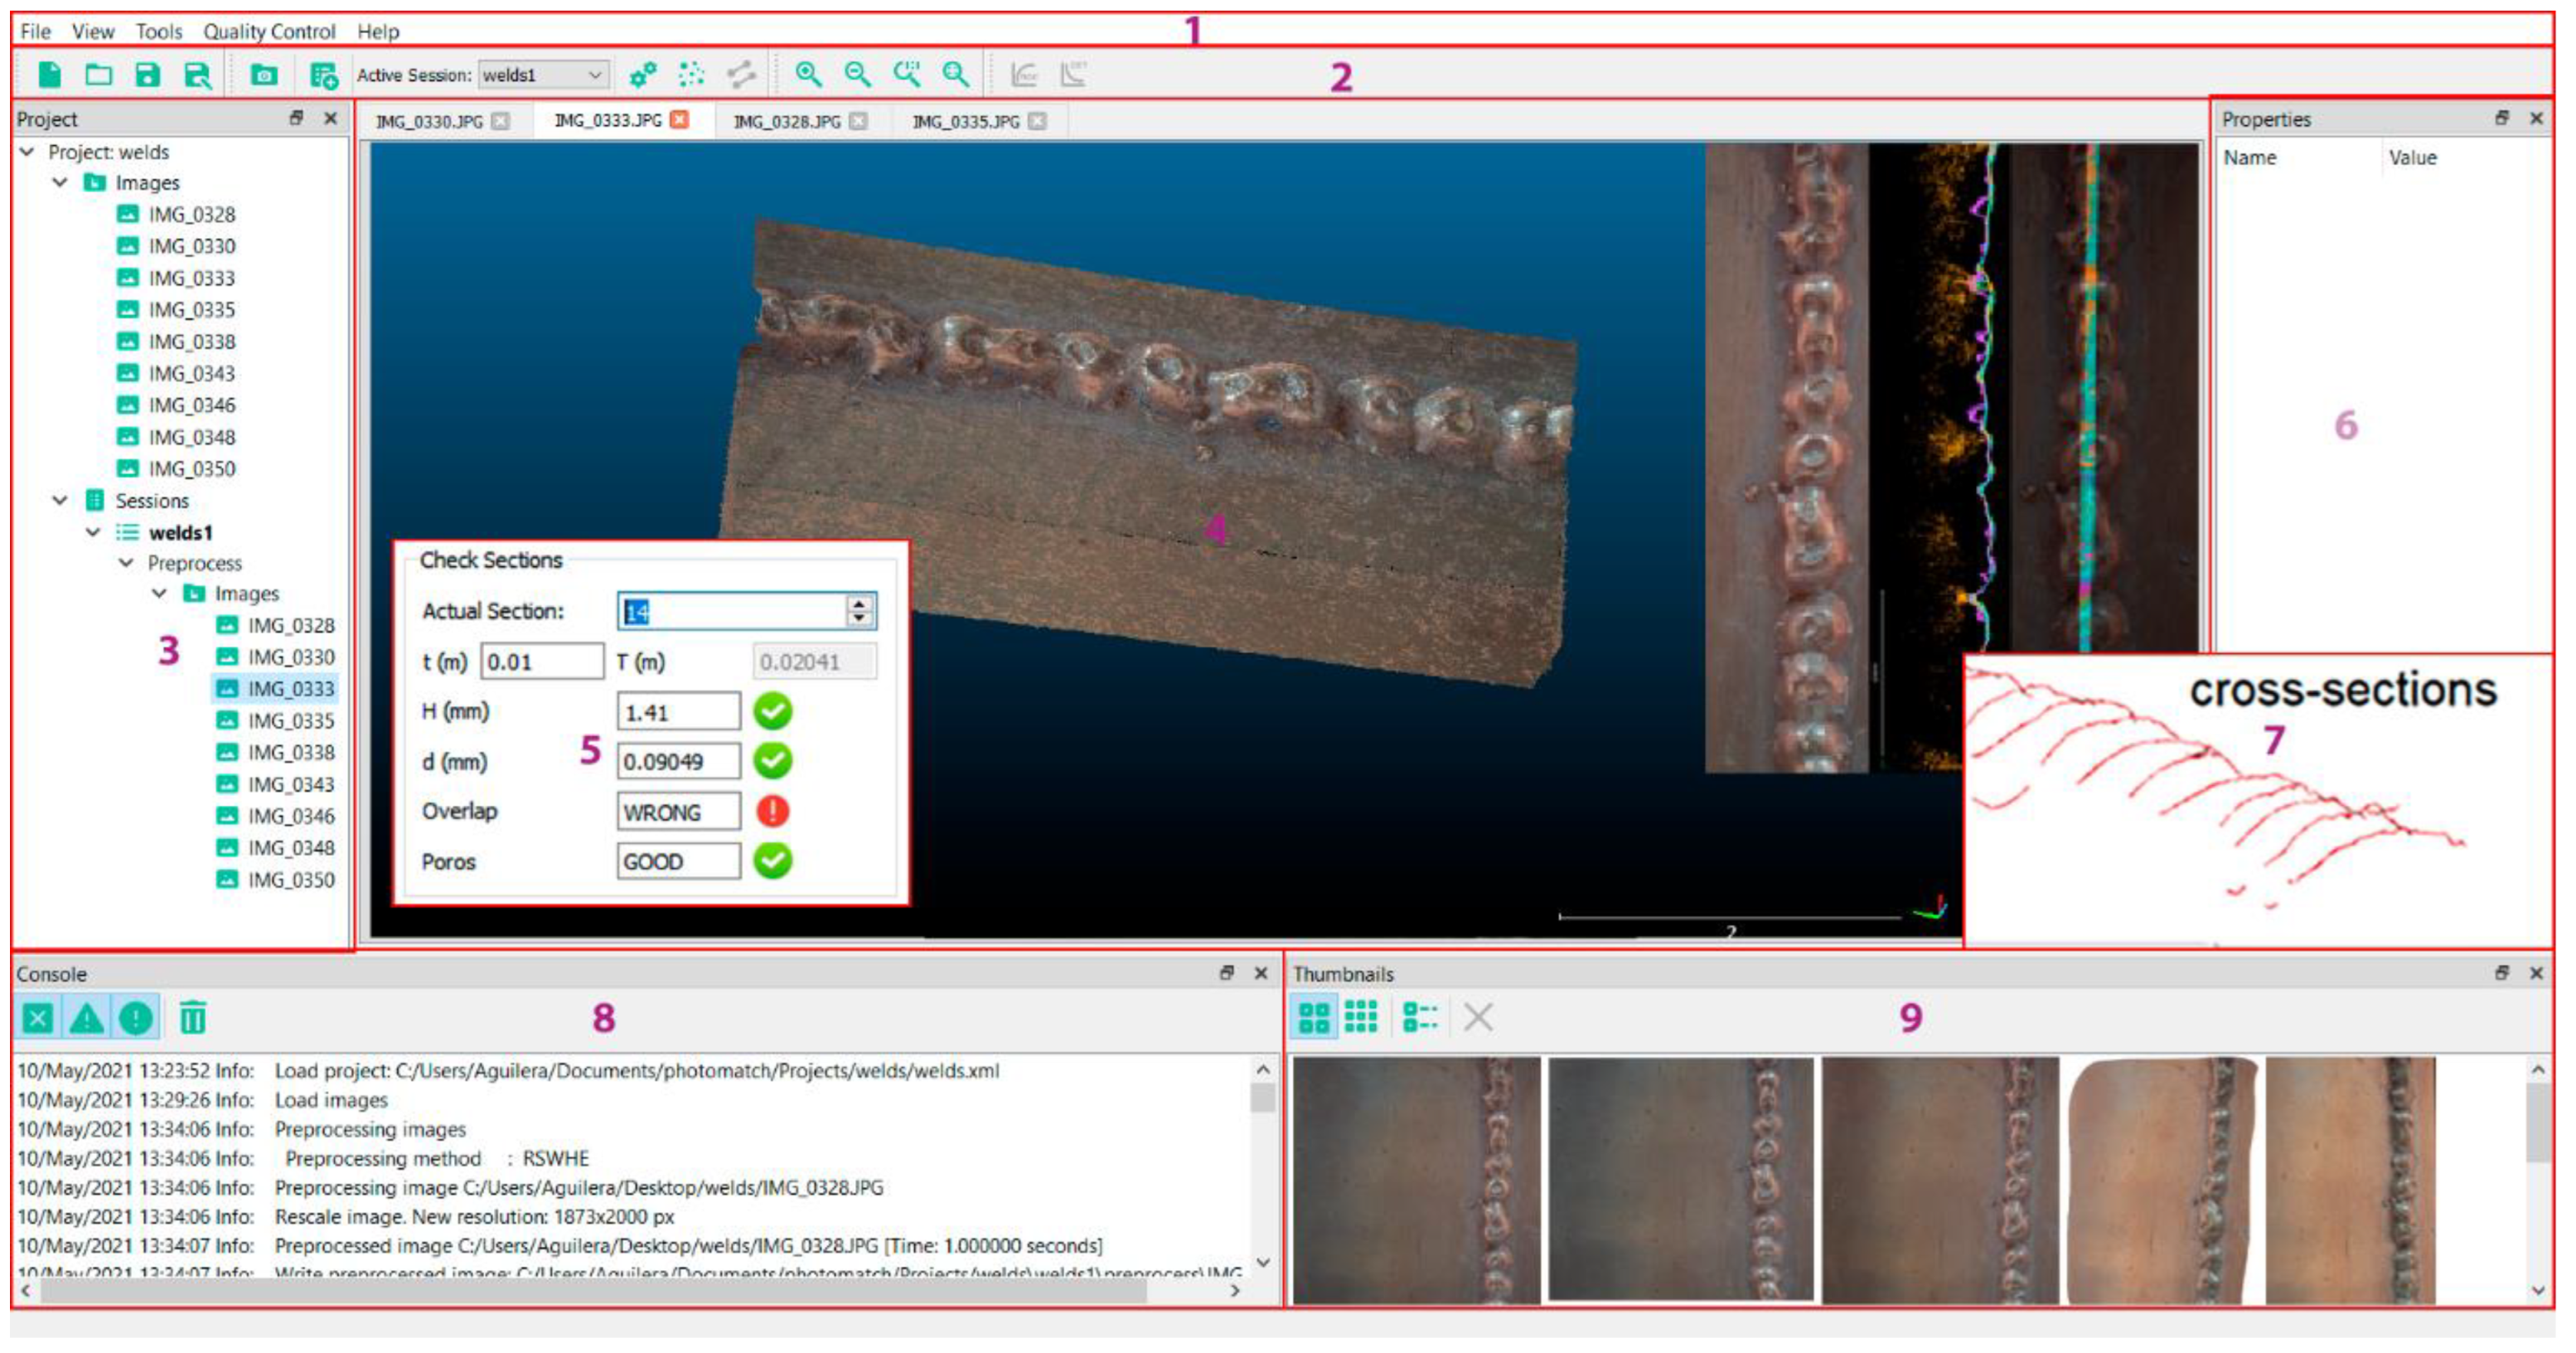
2.3. Defectology Analysis

Imperfections are anomalies that occur in the welded joint. They are considered as a flaw when, due to their magnitude or location, they could compromise the integrity and/or functionality of the part and/ or cause the failure of the joint. The generation of accurate and reliable photogrammetric point clouds models allows the application of different analyses oriented to the extraction of characteristics and the detailed evaluation of the state of the bead (Figure 2). In particular, the defectology analysis was developed considering four different types of defects (references in [2]) and the limits established in the international standard [3]:
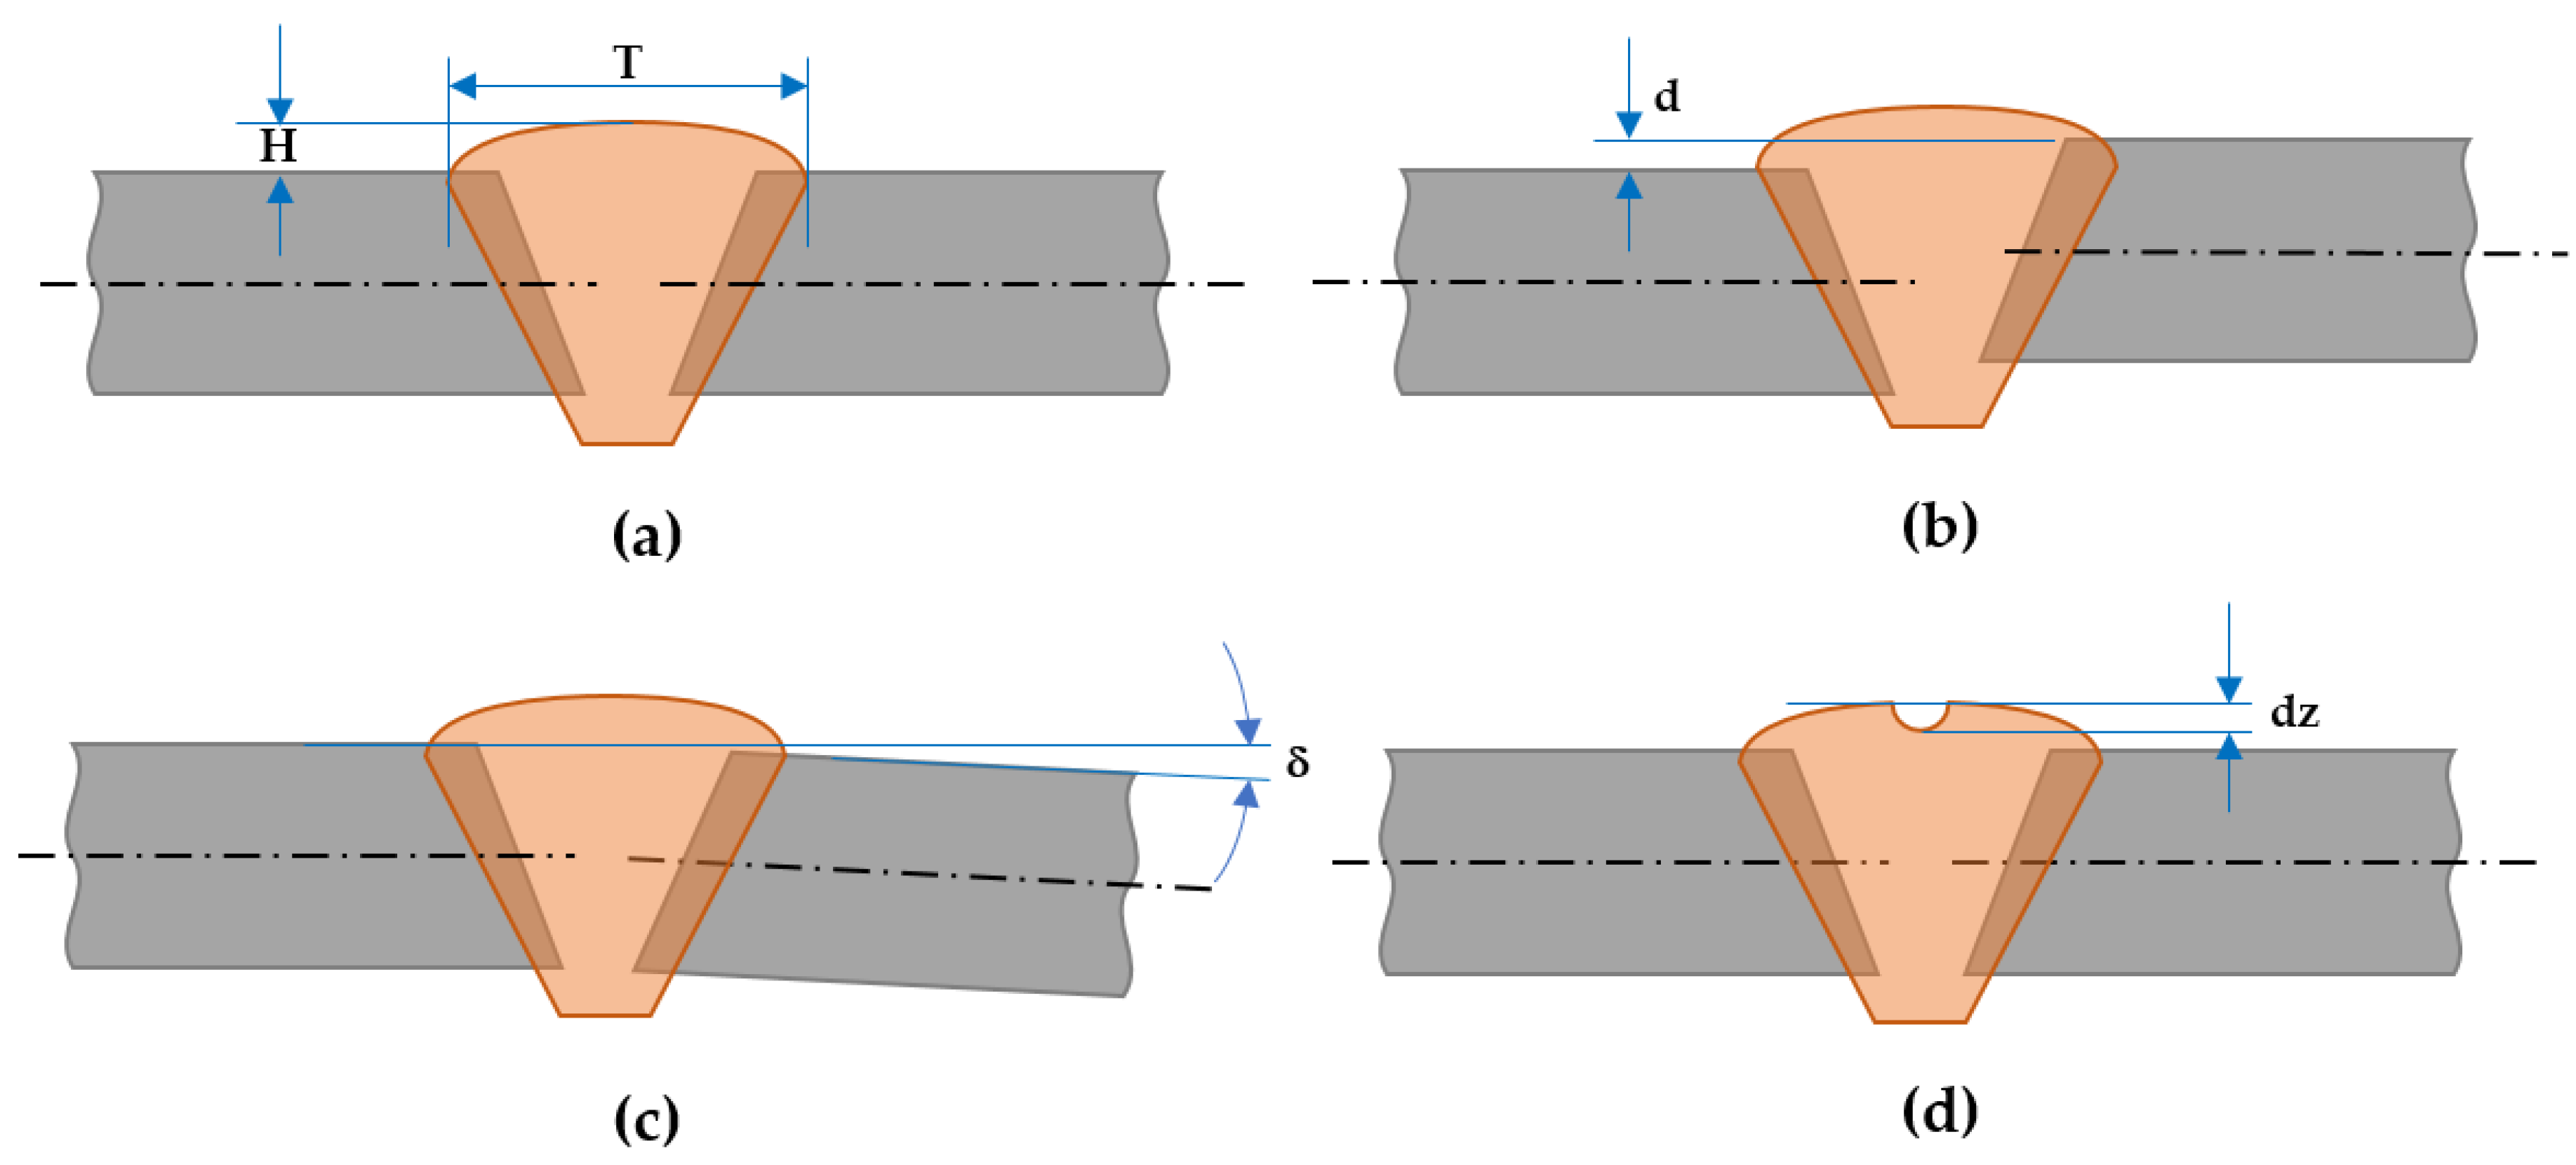
  • Excess weld metal (H) (ref. 502): it is related to the height of the bead over the plaque, H. The following criterion (B level) is established: H ≥ 1 mm + 0.1 × T, T being the width of the bead (max h = 0.5 mm). If this value exceeds 10% of the bead width, a defectology warning will be generated.
  • Linear misalignment (d) (ref. 5071): it is related to the different heights between plaques, d. The following criterion (B level) is established: d ≥ 0.1 × t, t being the thickness of the plaque. If this value exceeds 10% of the plaque thickness, a defectology warning will be generated.
  • Angular misalignment (δ) (ref. 508): it is related to the different orientations between plaques, δ. The following criterion (C level) is established: δ [nlnr] ≥ 2°, being nl and nr the normal vector of plaque left and right, respectively.
  • End crater pipe (dz) (ref. no. 2025): it consists of the detection of holes or depressed areas in the weld beam, dz. The most efficient way to detect them is by analysing the transversal profiles resulting from the weld, establishing a threshold of dz < 0.2 t, t being the thickness of the plaque, with a maximum of 2 mm (D level).
All these defects were analysed using cross-sections along the weld, using the axis of the bead as a reference. Although the software allows the assessment of the weld from an automatic point of view, the photogrammetric point clouds allow for inspecting the main metric characteristics of the weld (quantitative analysis), as well as its visual appearance (qualitative analysis). For instance, the existence of possible friction-affected areas and/or corrosion zones can also be evaluated from a qualitative point of view.

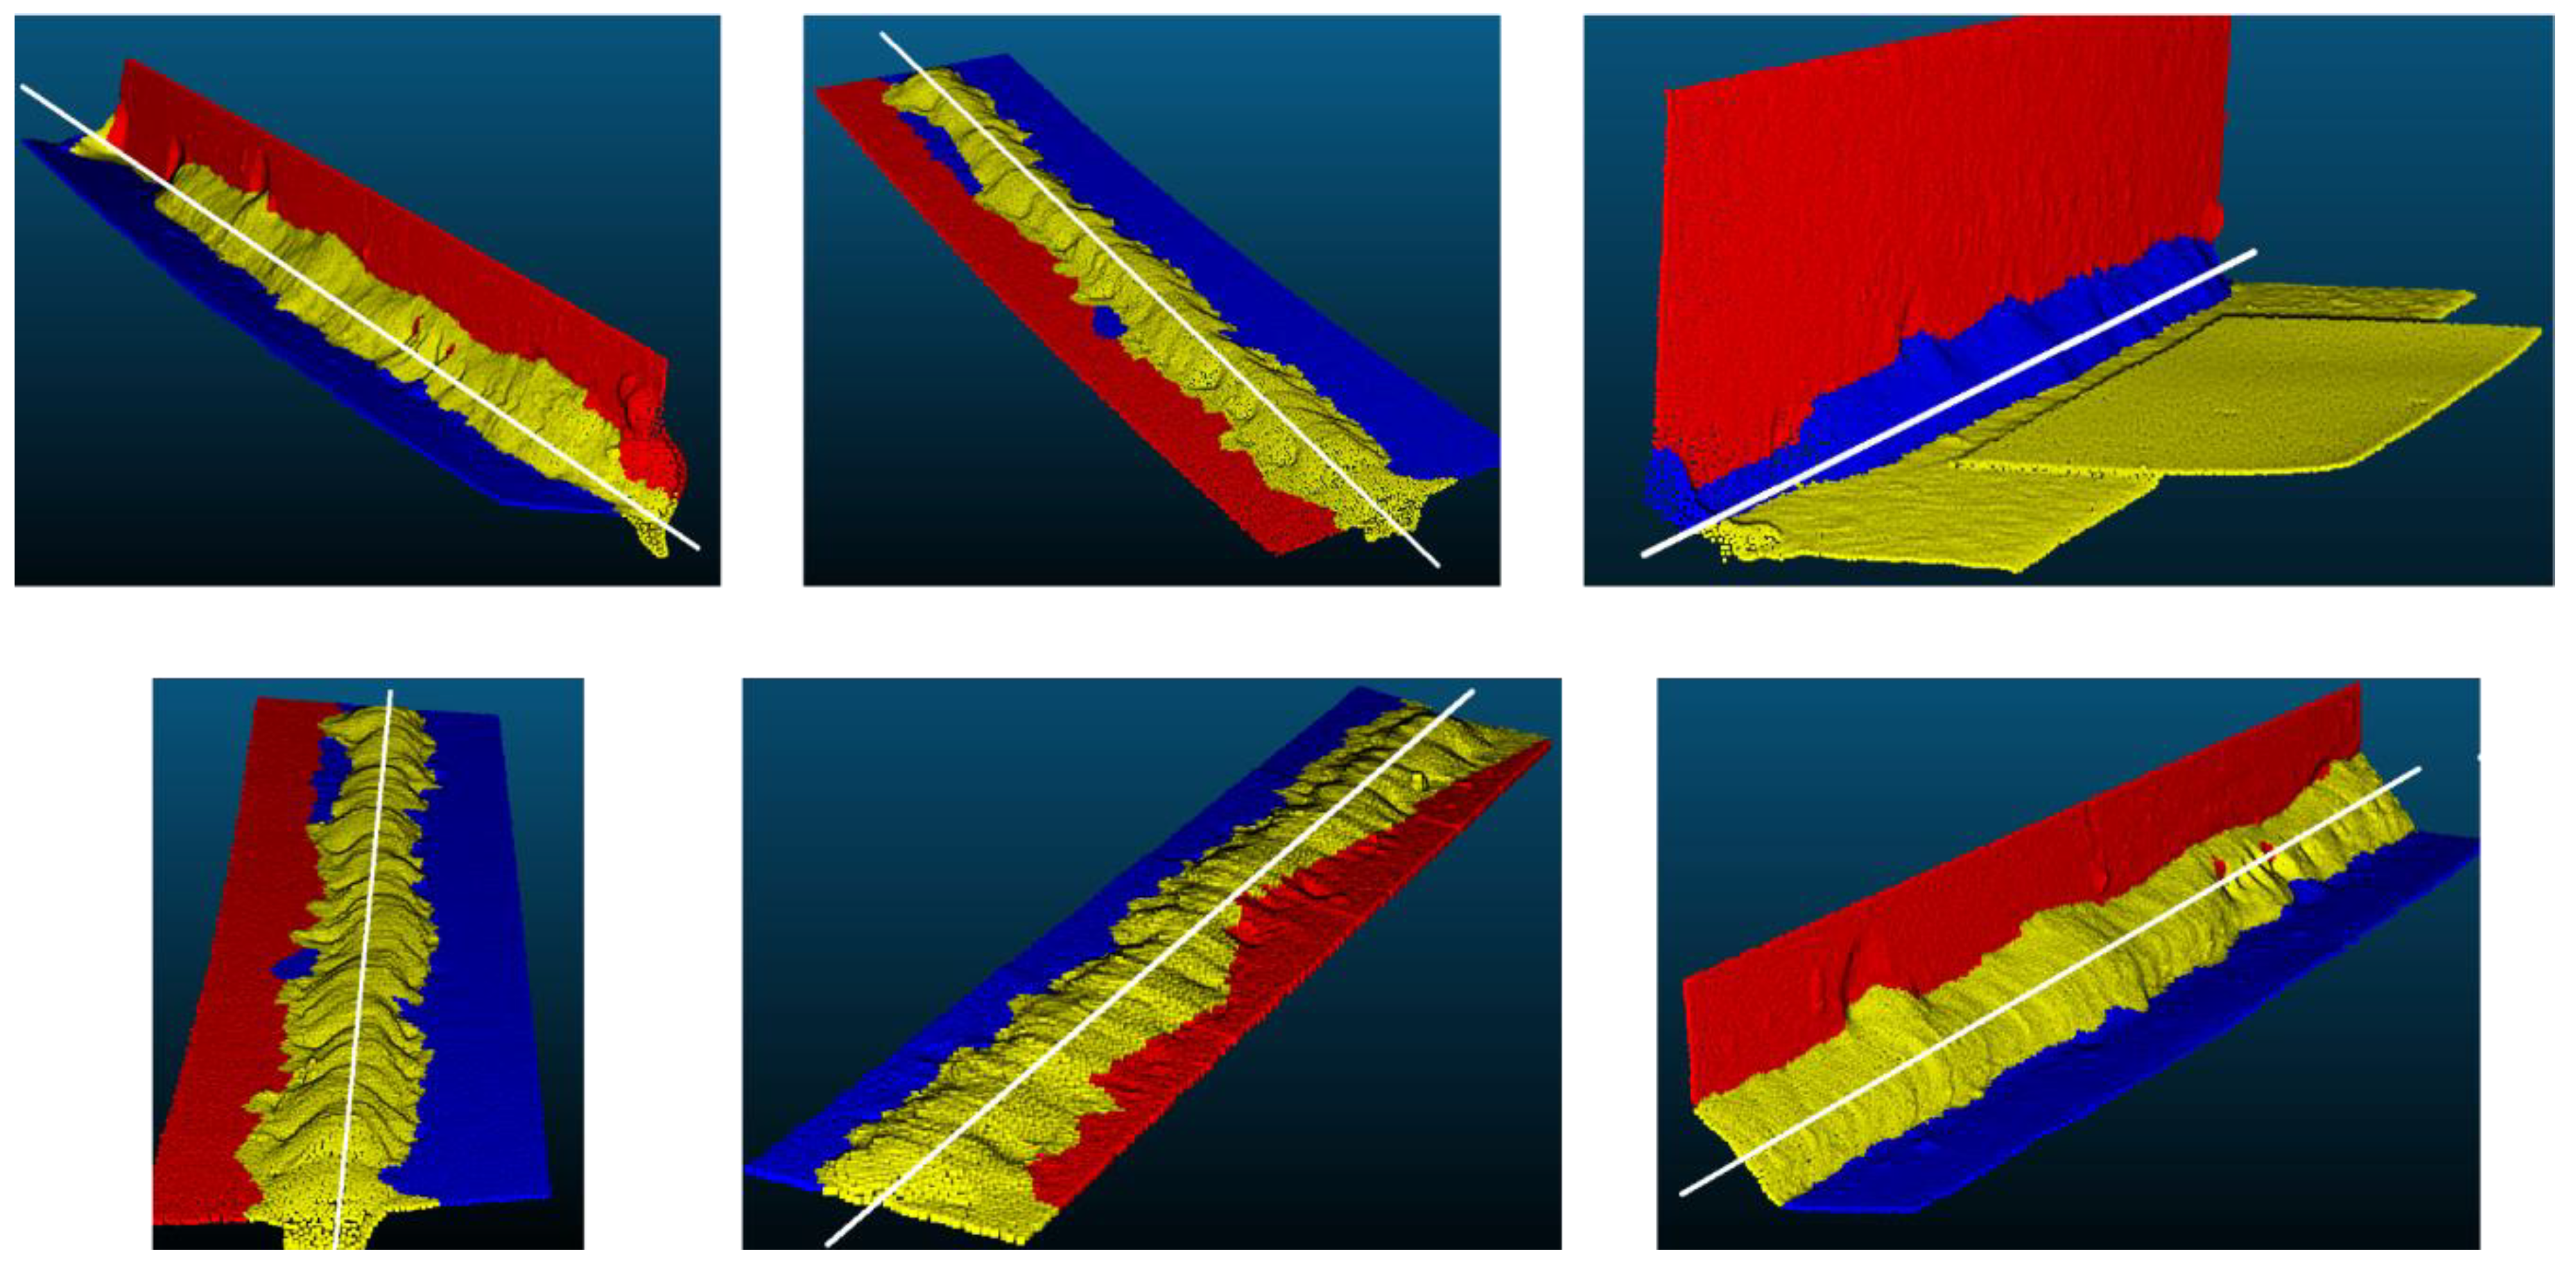
2.3.1. Weld Segmentation and Axis Definition

For the segmentation and extraction of the weld axis, the algorithm classifies the points by computing a set of geometric attributes and minimising a globally regularised energy (Equation (1)). Particularly, different pointwise geometric attributes have been applied (i.e., orthogonal distance to plane, eigenvalues, elevation, etc.) accompanied by geometric relationships between characteristics and classes (energy functions) which have made it possible to classify the point clouds according to 3 classes: (i) left plaque; (ii) right plaque; (iii) bead. Classification is achieved by minimising an energy function over the input point cloud by selecting, for each point, the classification type that gives the best score. More precisely, an energy minimisation was proposed to classify the point cloud. The energy function E(x) is defined as a sum of partial data terms Edi(xi) and pairwise geometric relationships defined by the standard Potts model [48], which integrates spatial coherence between neighbouring elements:
E ( x ) = i = 1 N E d i ( x i ) + γ i ~ j 1 x i x j
where γ > 0 is the parameter of the Potts model which quantifies the regularisation force, i~j represent the pairs of neighbouring points, and 1 { . } is the characteristic function. The partial data term Edi(xi) measures the coherence of the class xi at the ith point. A Graph-Cut based algorithm [49] is applied to minimise the energy function and get a solution.
Finally, once the photogrammetric point clouds have been classified in three different classes, the axis of the bead is extracted based on the computation of centroids along the bead, using RANSAC algorithm (RANdom SAmple Consensus) for the robust fit of the axis [50].

2.3.2. Cross-Sections Generation and Defects Analysis

Once the bead and the plaques have been extracted, an automatic cross-sectional analysis can be performed using the extracted axis as reference. With this analysis, it is possible to locate flaws and imperfections according to the four defects previously defined (Figure 2). Cross-sections are plotted successively and automatically along the direction of the weld axis. The distance between sections could be freely chosen by the inspector according to the level of resolution required, the type of weld, the material, and the defects or imperfections to be detected and measured [9].
Finally, the four defects considered in Figure 2 can be checked for each cross-section deriving a complete analysis of the whole weld, as follows:
  • The excess weld metal, H, was computed automatically, extracting the width of the bead based on the semantic classification of the bead along the axis and taking the median as a robust reference [51].
  • The linear misalignment, d, was computed automatically, extracting the orthogonal distance between plaques based on the classification of the plaques along the axis and considering the median as a robust reference. The thickness of the weld, t, was provided by the manufacturer or measured directly in the 3D model.
  • The angular misalignment, δ, was computed by applying principal component analysis (PCA) to those points in P l ,   P r that belong to the left and right plaques previously classified. Particularly, the third eigenvector was estimated as a normal vector for each plaque, nl, nr and thus used for computing the angular misalignment, δ, between plaques. Here, a threshold value of 0.9 was empirically defined, so normal vectors with the lower vertical component were discarded.
  • The presence of notches or pores, dz, was computed adjusting a plane to the plaques previously classified using RANSAC algorithm [50] and analysing the orthogonal distance from the cross-sections to the fitted plane. All those points that generate an orthogonal distance ≥ 2 mm were considered as notches or pores.

3. Results and Discussion
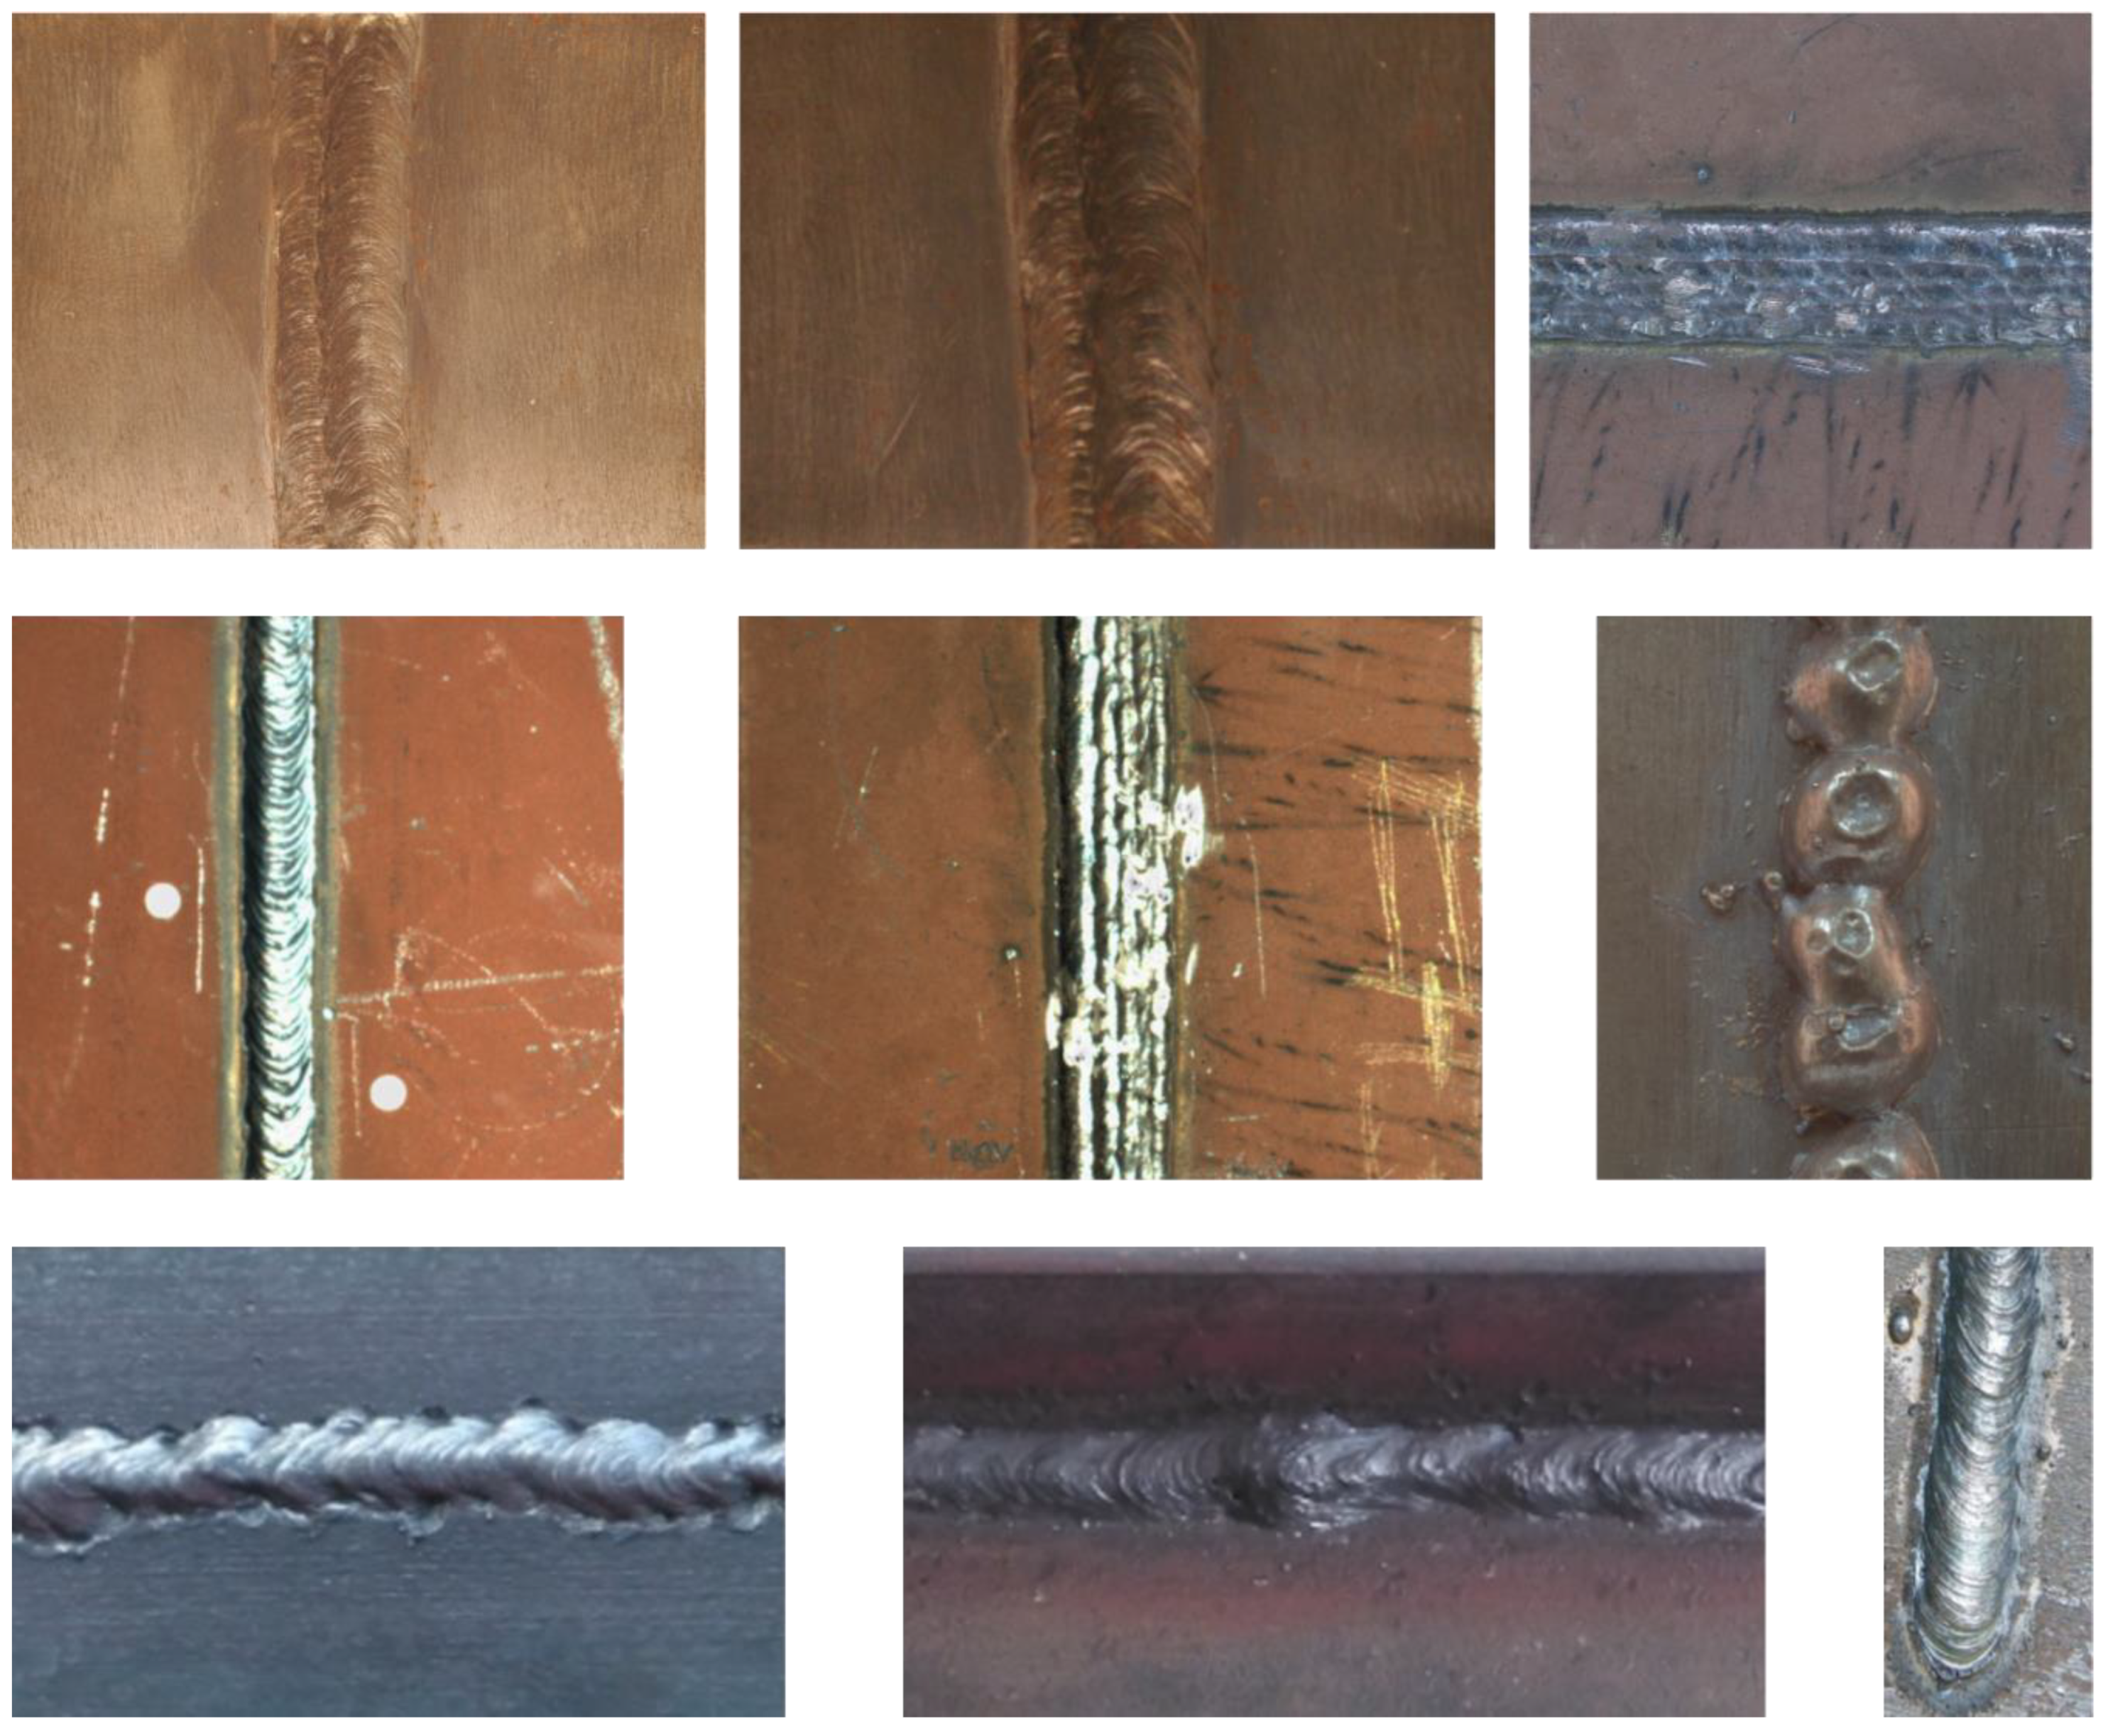
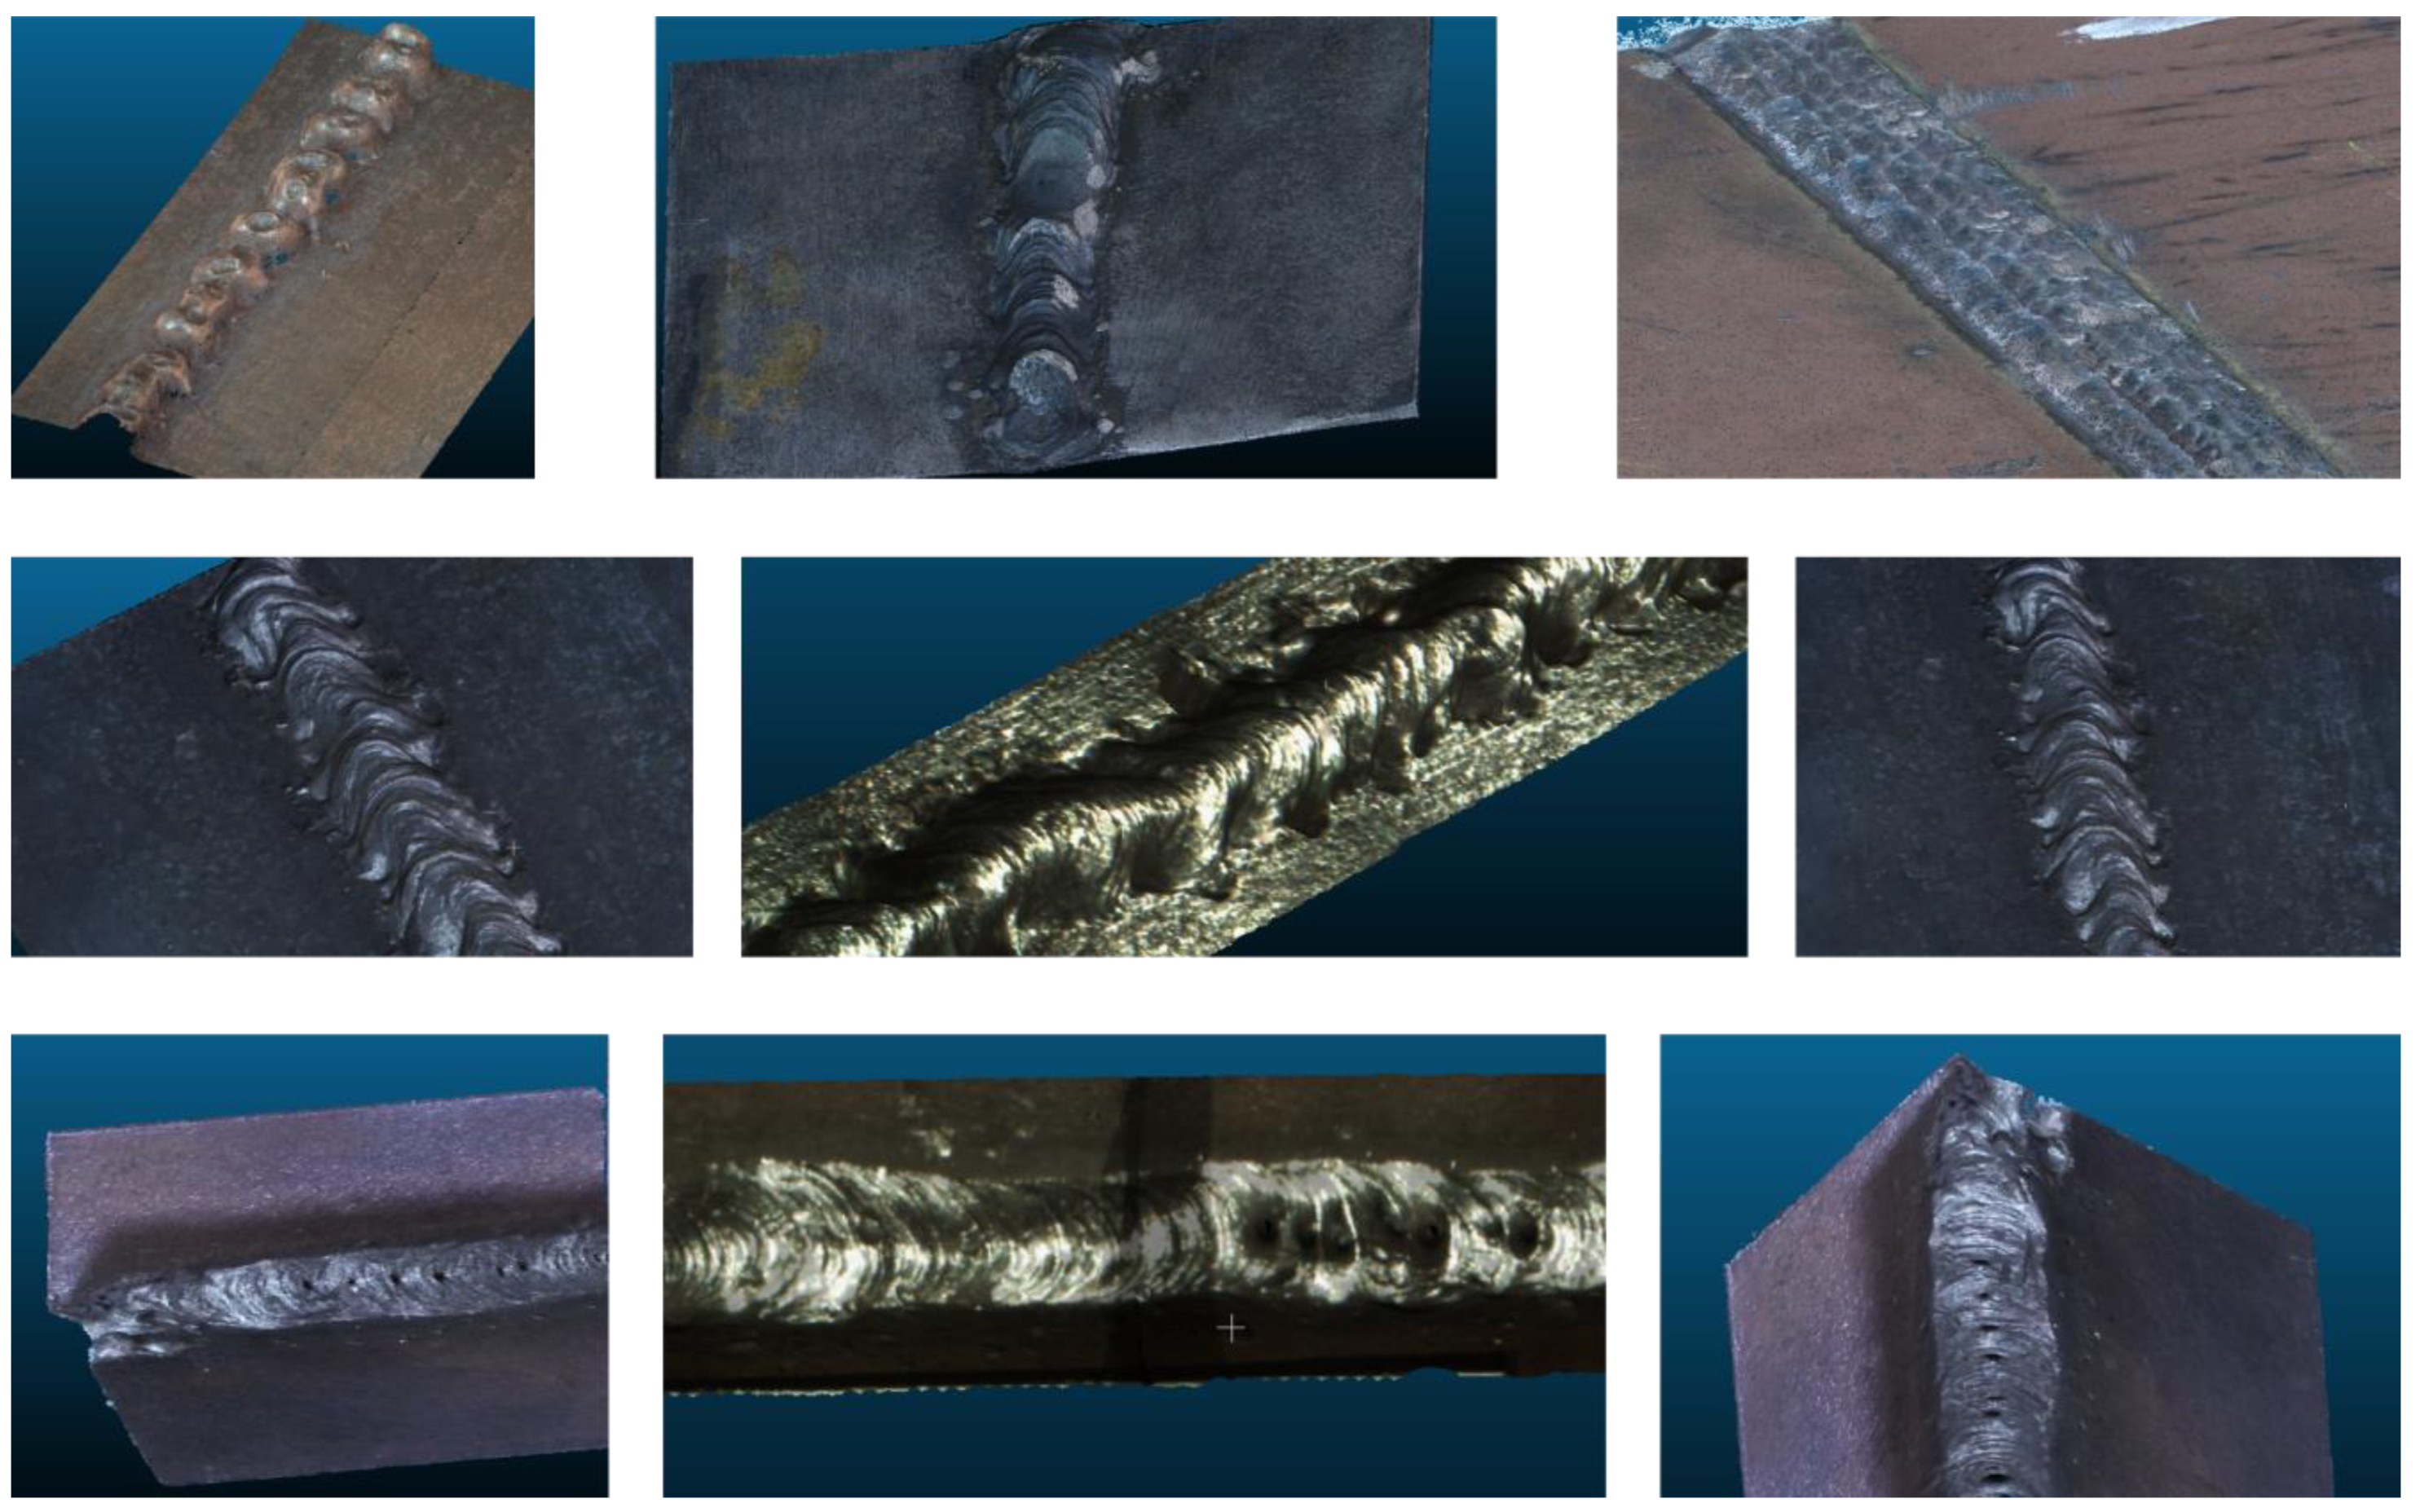
3.1. Study Cases

A dataset composed of different types of metallic welds and joints was used to validate the WELDMAP software. We try to cope with different welds typologies in order to adapt the tool to its demanded use. This dataset was generated with images acquired in different real scenarios (e.g., shipyard and industry) and in the laboratory using specific samples (Figure 3).

3.2. Results and Discussion

The results were obtained by applying the workflow outlined in Figure 1 and the defectology analysed, described in Figure 2, taking multiple RGB images as input data. These images were acquired using a photogrammetric stereoscopic arm composed of two reflex cameras (Canon EOS 700D) with two macro-lenses (EF-S 60 mm) (Figure 4). Trying to check the robustness of the feature extraction and matching process codified in WELDMAP, we used also images acquired with a compact handheld camera (Panasonic Lumix DMC-FZ38). In this case, images were acquired by varying their distances and perspective to reinforce the invariability of the detectors and descriptors.
Subsequently, the images were uploaded to WELDMAP. At each stage of the process (Figure 1) the final user can choose among different algorithms. In order to help the final user to choose among them, the platform incorporates integrated help for the different application cases.
In order to improve the feature extraction and matching (Figure 5), all input images were pre-processed based on the same algorithm: recursively separated and weighted histogram equalisation (RSWHE) [31], since RSWHE preserves the image brightness more accurately and produces images with better contrast enhancement.
All employed detectors were limited in the maximum number of keypoints (5000) and the used matching strategy was robust matching, supported by RANSAC using the fundamental matrix as a geometric test [25]. All the computations were performed by exploiting parallel and GPU capabilities of the hardware. This setup was enough for providing good matches between images, even in those cases with more geometric and radiometric variations between images (dataset coming from a compact handheld camera).
The best combination was obtained by experimenting with the different welds considered, so that the end user is offered this configuration.
For these cases, an MSD detector [36] combined with an SIFT descriptor [33] was the best combination. For the stereoscopic dataset, the SIFT, supported by the GPU [52], provided very good results. For these cases, the MSD detector [36] combined with SIFT descriptor [33] was the best combination. For the stereoscopic dataset, the SIFT supported by GPU [52] provided very good results.
Once images were connected based on matchings, an orientation and self-calibration of the different sets of images were performed combining triangulation supported by the DLT and the BA using the collinearity condition applied in an incremental way. Likewise, this registration process allowed us to revalidate the feature extraction and matching, since a wrong feature extraction and matching would entail an incorrect orientation and self-calibration of images. Finally, a dense model of the welds was provided based on the method described above. For the dataset coming from the compact handheld camera, the 3D models of welds were scaled based on a known distance using a codified target as reference. This was not the case for the stereoscopic dataset, since the point cloud are directly scaled based on the known and calibrated baseline. The following figure (Figure 6) outlines the photogrammetric 3D models of welds obtained, as well as the quality of the photogrammetric 3D models generated (Table 1).
As it was expected, higher quality can be observed in both spatial resolution and precision with the photogrammetric stereoscopic arm. This is due to the strong and efficient configuration defined with the stereoscopic setup in terms of images matching, photogrammetric reconstruction, and dense model generation. Furthermore, the constraint defined by the known baseline between cameras allowed us to work directly with metric models. This is not the case with the compact handheld camera, where the 3D models had to be scaled using artificial targets. On the contrary, it should be noted the greater flexibility and speed of acquisition with the compact handheld sensor, guaranteeing more forward speed and being especially suitable for non-expert operators in photogrammetry, since following a simple protocol of acquisition, the structure from motion approach can successfully solve the photogrammetric 3D model of the weld.
The resolution and precision achieved by photogrammetry improved substantially when compared to the ones achieved by the methods currently used, based on the visual inspection of welds using manual gadgets (e.g., fillet weld gauge, cam gauge). These analogical methods allow verifying if the fillet is acceptable, but they do not allow technicians to record the geometry of the bead. Furthermore, they do not provide submillimetric accuracy and they are highly dependent on the inspector’s skills and expertise. Alternative methods based on geotechnologies have been developed, for example in [53], where a laser-based machine vision system allowed for the monitoring and controlling of welding with a maximum error of 0.55 mm. In [54], a laser line scanner was employed to measure the surface profile of the weld bead. Despite it having a 0.015 mm spatial resolution, it only allowed for measuring a distance of 100 mm with a width of 24 mm. Besides, the classification between bead and base metals was unsatisfactory.
Afterwards, and based on these photogrammetric 3D models, a semantic classification of the welds using geometric features and an unsupervised classification strategy based on Graph Cut was applied, taking three classes as input: left plaque (red colour), right plaque (yellow colour) and bead (blue colour). The axis extraction is outlined in white colour (Figure 7).
It should be noted the accurate and successful results of the classification strategy based on geometric features and energy function. The energy model has a relatively simple formulation and provides convincing results in practice. Figure 7 shows the potential of the model on different types of welds. Trying to validate the results, we obtained an expert on welds who checked the results, inspecting the semantic 3D models visually.
Once the welds were semantically classified, the quality control of welds was performed based on the four defects defined (Figure 2), using cross-sections as reference. Since the process is fully automatic, cross-sections were generated with 2.5 mm resolution. Figure 8 and Table 2 show the results of the defectological analysis of the welds assessed. Only those welds which present a defect are outlined in Table 2.
In view of Table 2, the efficiency of the WELDMAP tool to detect anomalies automatically is clear. It should be noted that the tool allows you to configure the threshold of defects as well as their percentage to consider if a weld should be rejected. In this sense, it must be emphasised that the welds inspected in situ did not provide any defectology, while the welds analysed in the laboratory (no. 1, 2, 3, 4, 5, 6), which came from defective welds, were those that showed the pathologies outlined in Table 2.

4. Conclusions

In this article, an unprecedented tool has been presented that integrates the possibility of providing smart photogrammetric models based on the quality control of welds. Under the name WELDMAP, the ability to reconstruct 3D welds, both geometrically and radiometrically, allow us to perform external quality control according to normalised standards. More specifically, this article proposes the use of RGB images acquired with reflex cameras as a non-destructive and low-cost technique for the digitisation of welded joints and the automation of their quality control by means of an in-house software, successfully tested in different scenarios and with different types of welds. The results come to support its usefulness, since today these quality control tasks have been carried out visually supported by expeditious measures, and in most cases with an analogue record.
Looking ahead, it is expected to be able to work with images from other wavelengths (e.g., thermography, X-rays) and new materials (e.g., composites, fibres, etc.), so that multimodal registration techniques have to be incorporated together with the application of artificial intelligence techniques for quality inspection tasks. So, further developments will be carried out to include additional types of defects.

Author Contributions

Conceptualisation, E.R.d.O. and D.G.-A.; methodology, E.R.d.O., M.R.-M., P.R.-G. and D.G.-A.; software, R.M.; validation, M.R.-M. and P.R.-G.; formal analysis, D.G.-A., R.M. and M.R.-M.; writing—original draft preparation, E.R.d.O.; writing—review and editing, M.R.-M. and D.G.-A. All authors have read and agreed to the published version of the manuscript.

Funding

This research was partially supported by Ministry of Science and Innovation, Government of Spain, through the research project titled Fusion of non-destructive technologies and numerical simulation methods for the inspection and monitoring of joints in new materials and additive manufacturing processes (FaTIMA) with code RTI2018-099850-B-I00.

Institutional Review Board Statement

Not applicable.

Informed Consent Statement

Not applicable.

Data Availability Statement

Not applicable.

Acknowledgments

Authors would like to thank the Junta de Castilla y León and the Fondo Social Europeo for the financial support given through programs for human resources (EDU/1100/2017) to one of the authors of this paper (R.M.).

Conflicts of Interest

The authors declare no conflict of interest.

References

  1. Nobrega, G.; Souza, M.S.; Rodríguez-Martín, M.; Rodríguez-Gonzálvez, P.; Ribeiro, J. Parametric Optimization of the GMAW Welding Process in Thin Thickness of Austenitic Stainless Steel by Taguchi Method. Appl. Sci. 2021, 11, 8742. [Google Scholar] [CrossRef]
  2. ISO 6520-1:2007; Welding and allied Processes—Classification of Geometric Imperfections in Metallic Materials—Part 1: Fusion Welding. International Organization for Standardization: Geneva, Switzerland, 2007. Available online: https://www.iso.org/standard/40229.html (accessed on 29 December 2021).
  3. ISO 5817:2014; Welding. Fusion-Welded Joints in Steel, Nickel, Titanium and Their Alloys (Beam Welding Excluded). Quality Levels for Imperfections. International Organization for Standardization: Geneva, Switzerland, 2014. Available online: https://www.iso.org/standard/54952.html (accessed on 29 December 2021).
  4. ISO 10042:2018; Welding. Arc-Welded Joints in Aluminium and Its Alloys. Quality Levels for Imperfection. International Organization for Standardization: Geneva, Switzerland, 2018. Available online: https://www.iso.org/standard/70566.html (accessed on 29 December 2021).
  5. PD 5500:2018; Specification for Unfired Fusion Welded Pressure Vessels. British Standards Institution: London, UK, 2018. Available online: https://0-shop-bsigroup-com.brum.beds.ac.uk/ProductDetail/?pid=000000000030366997 (accessed on 29 December 2021).
  6. Rodríguez-Gonzálvez, P.; Rodríguez-Martín, M.; Ramos, L.F.; González-Aguilera, D. 3D reconstruction methods and quality assessment for visual inspection of welds. Autom. Constr. 2017, 79, 49–58. [Google Scholar] [CrossRef]
  7. ISO 17637:2016; Non-Destructive Testing of Welds—Visual Testing of Fusion-Welded Joints. International Organization for Standardization: Geneva, Switzerland, 2016. Available online: https://www.iso.org/standard/67259.html (accessed on 29 December 2021).
  8. ISO 9712:2012; Non-Destructive Testing—Qualification and Certification of NDT Personnel. International Organization for Standardization: Geneva, Switzerland, 2012. Available online: https://www.iso.org/standard/57037.html (accessed on 29 December 2021).
  9. Rodríguez-Martín, M.; Lagüela, S.; González-Aguilera, D.; Rodríguez-Gonzálvez, P. Procedure for quality inspection of welds based on macro-photogrammetric three-dimensional reconstruction. Opt. Laser Technol. 2015, 73, 54–62. [Google Scholar] [CrossRef]
  10. Zhang, L.; Ke, W.; Ye, Q.; Jiao, J. A novel laser vision sensor for weld line detection on wall-climbing robot. Opt. Laser Technol. 2014, 60, 69–79. [Google Scholar] [CrossRef]
  11. Lei, T.; Rong, Y.; Wang, H.; Huang, Y.; Li, M. A review of vision-aided robotic welding. Comput. Ind. 2020, 123, 103326. [Google Scholar] [CrossRef]
  12. Dinham, M.; Fang, G. Autonomous weld seam identification and localisation using eye-in-hand stereo vision for robotic arc welding. Robot. Comput. Integr. Manuf. 2013, 29, 288–301. [Google Scholar] [CrossRef]
  13. Liu, Y.; Zhang, Y. Control of 3D weld pool surface. Control Eng. Pract. 2013, 21, 1469–1480. [Google Scholar] [CrossRef]
  14. Caggiano, A.; Nele, L.; Sarno, E.; Teti, R. 3D Digital Reconfiguration of an Automated Welding System for a Railway Manufacturing Application. In Proceedings of the 8th International Conference on Digital Enterprise Technology, Stuttgart, Germany, 25–28 March 2014; Volume 25, pp. 39–45. [Google Scholar] [CrossRef]
  15. Jia, N.; Li, Z.; Ren, J.; Wang, Y.; Yang, Y. 3D reconstruction method based on grid laser and gray scale photo for visual inspection of welds. Opt. Laser Technol. 2019, 119, 105648. [Google Scholar] [CrossRef]
  16. Lei, T.; Wang, W.; Rong, Y.; Xiong, P.; Huang, Y. Cross-lines laser aided machine vision in tube-to-tube sheet welding for welding height control. Opt. Laser Technol. 2020, 121, 105796. [Google Scholar] [CrossRef]
  17. Bračun, D.; Sluga, A. Stereo vision based measuring system for online welding path inspection. J. Mater. Process. Technol. 2015, 223, 328–336. [Google Scholar] [CrossRef]
  18. Rodríguez-Martín, M.; Rodríguez-Gonzálvez, P.; Lagüela, S.; González-Aguilera, D. Macro-photogrammetry as a tool for the accurate measurement of three-dimensional misalignment in welding. Autom. Constr. 2016, 71, 189–197. [Google Scholar] [CrossRef]
  19. Rodríguez-Martín, M.; Lagüela, S.; González-Aguilera, D.; Rodríguez-Gonzálvez, P. Crack-Depth Prediction in Steel Based on Cooling Rate. Adv. Mater. Sci. Eng. 2016, 2016, 1016482. [Google Scholar] [CrossRef] [Green Version]
  20. Remondino, F. Heritage Recording and 3D Modeling with Photogrammetry and 3D Scanning. Remote Sens. 2011, 3, 1104–1138. [Google Scholar] [CrossRef] [Green Version]
  21. Evgenikou, V.; Georgopoulos, A. Investigating 3d reconstruction methods for small artifacts. Int. Arch. Photogramm. Remote Sens. Spat. Inf. Sci. 2015, XL-5/W4, 101–108. [Google Scholar] [CrossRef] [Green Version]
  22. Rodríguez-Martín, M.; Rodríguez-Gonzálvez, P.; González-Aguilera, D.; Fernández-Hernández, J. Feasibility Study of a Structured Light System Applied to Welding Inspection Based on Articulated Coordinate Measure Machine Data. IEEE Sens. J. 2017, 17, 4217–4224. [Google Scholar] [CrossRef] [Green Version]
  23. Gonzalez-Aguilera, D.; Ruiz de Ona, E.; Lopez-Fernandez, L.; Farella, E.M.; Stathopoulou, E.; Toschi, I.; Remondino, F.; Fusiello, A.; Nex, F. Photomatch: An open-source multi-view and multi-modal feature matching tool for photogrammetric applications. ISPRS Ann. Photogramm. Remote Sens. Spat. Inf. Sci. 2020, 43, 213–219. [Google Scholar] [CrossRef]
  24. Schönberger, J.L.; Frahm, J. Structure-from-Motion Revisited. In IEEE Conference on Computer Vision and Pattern Recognition (CVPR); IEEE: Las Vegas, NV, USA, 2016; pp. 4104–4113. [Google Scholar]
  25. González-Aguilera, D.; López-Fernández, L.; Rodríguez-Gonzálvez, P.; Hernández-López, D.; Guerrero, D.; Remondino, F.; Menna, F.; Nocerino, E.; Toschi, I.; Ballabeni, A.; et al. GRAPHOS–open-source software for photogrammetric applications. Photogramm. Rec. 2018, 33, 11–29. [Google Scholar] [CrossRef] [Green Version]
  26. Aicardi, I.; Nex, F.; Gerke, M.; Lingua, A.M. An image-based approach for the co-registration of multi-temporal UAV image datasets. Remote Sens. 2016, 8, 779. [Google Scholar] [CrossRef] [Green Version]
  27. Gaiani, M.; Apollonio, F.I.; Ballabeni, A.; Remondino, F. Securing color fidelity in 3D architectural heritage. Sensors 2017, 17, 2437. [Google Scholar] [CrossRef] [Green Version]
  28. Jende, P.; Nex, F.; Gerke, M.; Vosselman, G. A fully automatic approach to register mobile mapping and airborne imagery to support the correction of platform trajectories in GNSS-denied urban areas. ISPRS J. Photogramm. Remote Sens. 2018, 141, 86–99. [Google Scholar] [CrossRef]
  29. Lal, S.; Chandra, M. Efficient algorithm for contrast enhancement of natural images. Int. Arab. J. Inf. Technol. 2014, 11, 95–102. [Google Scholar]
  30. Liu, Y.F.; Guo, J.M.; Lai, B.S.; Lee, J.D. High efficient contrast enhancement using parametric approximation. In Proceedings of the 2013 IEEE International Conference on Acoustics, Speech and Signal Processing, Vancouver, BC, Canada, 26–31 May 2013; pp. 2444–2448. [Google Scholar] [CrossRef]
  31. Kim, M.; Chung, M.G. Recursively separated and weighted histogram equalization for brightness preservation and contrast enhancement. IEEE Trans. Consum. Electron. 2008, 54, 1389–1397. [Google Scholar] [CrossRef]
  32. Wallis, K.F. Seasonal adjustment and relations between variables. J. Am. Stat. Assoc. 1974, 69, 18–31. [Google Scholar] [CrossRef]
  33. Lowe, D.G. Distinctive image features from scale-invariant keypoints. Int. J. Comput. Vis. 2004, 60, 91–110. [Google Scholar] [CrossRef]
  34. Bay, H.; Tuytelaars, T.; Gool, L.V. SURF: Speeded-Up Robust Features. In European Conference on Computer Vision; Springer: Berlin, Germany, 2006; pp. 404–417. [Google Scholar] [CrossRef]
  35. Matas, J.; Chum, O.; Urban, M.; Pajdla, T. Robust wide-baseline stereo from maximally stable extremal regions. Image Vis. Comput. 2004, 22, 761–767. [Google Scholar] [CrossRef]
  36. Tombari, F.; Di Stefano, L. Interest Points via Maximal Self-Dissimilarities. In Asian Conference on Computer Vision; Springer: Cham, Swizerland, 2014; pp. 586–600. [Google Scholar] [CrossRef] [Green Version]
  37. Rublee, E.; Rabaud, V.; Konolige, K.; Bradski, G.R. ORB: An efficient alternative to SIFT or SURF. In Proceedings of the 2011 International Conference on Computer Vision, Barcelona, Spain, 6–13 November 2011; pp. 2564–2571. [Google Scholar] [CrossRef]
  38. Alcantarilla, P.F.; Nuevo, J.; Bartoli, A. Fast explicit diffusion for accelerated features in nonlinear scale spaces. In Proceedings of the British Machine Vision Conference 2013, Bristol, UK, 9–13 September 2013; Volume 34, pp. 1281–1298. [Google Scholar]
  39. Leutenegger, S.; Chli, M.; Siegwart, R. BRISK: Binary robust invariant scalable keypoints. In Proceedings of the 2011 International Conference on Computer Vision, Barcelona, Spain, 6–13 November 2011; pp. 2548–2555. [Google Scholar] [CrossRef] [Green Version]
  40. Trzcinski, T.; Christoudias, M.; Lepetit, V. Learning Image Descriptors with Boosting. IEEE Trans. Pattern Anal. Mach. Intell. 2014, 37, 597–610. [Google Scholar] [CrossRef] [Green Version]
  41. Calonder, M.; Lepetit, V.; Ozuysal, M.; Trzcinski, T.; Strecha, C.; Fua, P. BRIEF: Computing a local binary descriptor very fast. IEEE Trans. Pattern Anal. Mach. Intell. 2011, 34, 1281–1298. [Google Scholar] [CrossRef] [Green Version]
  42. Tola, E.; Lepetit, V.; Fua, P. Daisy: An efficient dense descriptor applied to wide-baseline stereo. IEEE Trans. Pattern Anal. Mach. Intell. 2010, 32, 815–830. [Google Scholar] [CrossRef] [Green Version]
  43. Alahi, A.; Ortiz, R.; Vandergheynst, P. Freak: Fast retina keypoint. In Proceedings of the 2012 IEEE Conference on Computer Vision and Pattern Recognition, Providence, RI, USA, 16–21 June 2012; pp. 510–517. [Google Scholar] [CrossRef] [Green Version]
  44. Schaffalitzky, F.; Zisserman, A. Multi-view matching for unordered image sets, or How do I organize my holiday snaps? In European Conference on Computer Vision; Springer: Berlin, Germany, 2002; pp. 414–431. [Google Scholar]
  45. Abdel-Aziz, Y.I.; Karara, H.M.; Hauck, M. Direct linear transformation from comparator coordinates into object space coordinates in close-range photogrammetry. Photogramm. Eng. Remote Sens. 2015, 81, 103–107. [Google Scholar] [CrossRef]
  46. Langguth, F.; Sunkavalli, K.; Hadap, S.; Goesele, M. Shading-aware multi-view stereo. In European Conference on Computer Vision; Springer: Cham, Switzerland, 2016; pp. 469–485. [Google Scholar]
  47. Semerjian, B. A new variational framework for multiview surface reconstruction. In European Conference on Computer Vision; Springer: Cham, Switzerland, 2014; pp. 719–734. [Google Scholar]
  48. Li, S. Markov Random Field Modeling in Image Analysis; Springer: Cham, Switzerland, 2001. [Google Scholar]
  49. Boykov, Y.; Veksler, O.; Zabih, R. Fast approximate energy minimization via graph cuts. IEEE Trans. Pattern Anal. Mach. Intell. 2001, 23, 1222–1239. [Google Scholar] [CrossRef] [Green Version]
  50. Fischler, M.A.; Bolles, R.C. Random sample consensus: A paradigm for model fitting with applications to image analysis and automated cartography. Commun. ACM 1981, 24, 381–395. [Google Scholar] [CrossRef]
  51. Rodríguez-Gonzálvez, P.; Garcia-Gago, J.; Gomez-Lahoz, J.; González-Aguilera, D. Confronting passive and active sensors with non-Gaussian statistics. Sensors 2014, 14, 13759–13777. [Google Scholar] [CrossRef] [PubMed] [Green Version]
  52. Wu, C. A GPU Implementation of Scale Invariant Feature Transform (SIFT). Available online: https://github.com/pitzer/SiftGPU (accessed on 2 January 2022).
  53. Huang, W.; Kovacevic, R. Development of a real-time laser-based machine vision system to monitor and control welding processes. Int. J. Adv. Manuf. Technol. 2012, 63, 235–248. [Google Scholar] [CrossRef]
  54. Ye, G.; Guo, J.; Sun, Z.; Li, C.; Zhong, S. Weld bead recognition using laser vision with model-based classification. Robot. Comput. Manuf. 2018, 52, 9–16. [Google Scholar] [CrossRef]
Figure 1. WELDMAP: structure and modules organisation.
Applsci 12 02553 g001
Figure 2. Defects and quality criterions considered in the WELDMAP software: (a) excess weld metal; (b) linear misalignment; (c) angular misalignment; (d) crater.
Applsci 12 02553 g002
Figure 3. Different types of metallic welds acquired in real scenarios and in the laboratory.
Applsci 12 02553 g003
Figure 4. Stereoscopic photogrammetric arm composed by two reflex cameras (Canon EOS 700D) with two macro-lens (EF-S 60 mm).
Applsci 12 02553 g004
Figure 5. Feature extraction and matching in WELMAP software. In red are highlighted the different parts of the interface: menu (1), toolbar (2), tree view of the different inputs and intermediate results of the projects (3), view of the individual images (4), pop-up window with the matching results (5), console (6), and thumbnails (7).
Applsci 12 02553 g005
Figure 6. Sample of the 3D photogrammetric models obtained with WELDMAP software.
Applsci 12 02553 g006
Figure 7. Sample of the semantic weld 3D models taking the plaques (red and blue), bead (yellow), and bead axis (white) as the main elements.
Applsci 12 02553 g007
Figure 8. Quality control of welds based on cross-sections and the four defects analysed. In red are highlighted the different parts of the interface: menu (1), toolbar (2), tree view of the different inputs and intermediate results of the projects (3), 3D model viewers (4), pop-up window with the defects analysis (5), property view (6), pop-up window with the cross-sections generated (7), console (8), and thumbnails (9).
Applsci 12 02553 g008
Table 1. Quality results of the photogrammetric 3D models obtained with the different cameras.
Photogrammetric Stereoscopic ArmCompact Handheld Camera
Resolution (mm)0.05–0.06 mm≤0.2 mm
Precision (mm)0.10–0.15 mm≤0.4 mm
Table 2. Results of the four defects assessed in WELDMAP software. In red colour are highlighted those defects which did not pass the threshold established. Only those cross-sections which produced defects are reported in the table. T is the width of the bead, t is the width of the weld, nl and nr the normal vectors of the right and left plaques, respectively.
Type of DefectCriterion for the Quality Assessment (mm/°)No. WeldPositioning along Bead Axis x (mm)Results
Excess Weld MetalH ≥ 0.1T + 1128.22.59 ≥ 1.98not pass
4150.83.01 ≥ 1.75not pass
6161.04.23 ≥ 3.98not pass
Linear
misalignment
d ≥ 0.1t123.40.75 ≥ 0.70not pass
274.51.45 ≥ 1.20not pass
5110.90.68 ≥ 0.50not pass
Angular
misalignment
δ [nlnr] ≥ 2°315.32.5not pass
390.62.7not pass
3115.43.0not pass
Notch or poredz ≥ 2 mm112.32.3not pass
460.62.8not pass
5116.33.2not pass
Publisher’s Note: MDPI stays neutral with regard to jurisdictional claims in published maps and institutional affiliations.

