Article

PLGA-CS-PEG Microparticles for Controlled Drug Delivery in the Treatment of Triple Negative Breast Cancer Cells

by
Sandra Musu Jusu
1,2,
John David Obayemi
2,3,
Ali Azeko Salifu
2,3,
Chukwudalu Clare Nwazojie
1,
Vanessa Obiageli Uzonwanne
4,
Olushola Segun Odusanya
5 and
Winnston Oluwole Soboyejo
1,2,3,4,*
1
Department of Materials Science and Engineering, African University of Science and Technology, Km 10 Airport Road, Abuja 900107, Nigeria
2
Department of Mechanical Engineering, Worcester Polytechnic Institute, Worcester, MA 01609, USA
3
Department of Biomedical Engineering, Gateway Park Life Sciences Center, 60 Prescott Street, Worcester Polytechnic Institute (WPI), Worcester, MA 01605, USA
4
Department of Materials Science and Engineering, Worcester Polytechnic Institute, Worcester, MA 01609, USA
5
Biotechnology and Genetic Engineering Advanced Laboratory, Sheda Science and Technology Complex (SHESTCO), Abuja 900107, Nigeria
*
Author to whom correspondence should be addressed.
Submission received: 19 June 2021 / Revised: 26 July 2021 / Accepted: 30 July 2021 / Published: 31 July 2021
(This article belongs to the Special Issue Novel Technology and Applications of Micro/Nano Devices and System)

Abstract

:
In this study, we explore the development of controlled PLGA-CS-PEG microspheres, which are used to encapsulate model anticancer drugs (prodigiosin (PGS) or paclitaxel (PTX)) for controlled breast cancer treatment. The PLGA microspheres are blended with hydrophilic polymers (chitosan and polyethylene glycol) in the presence of polyvinyl alcohol (PVA) that were synthesized via a water-oil-water (W/O/W) solvent evaporation technique. Chitosan (CS) and polyethylene glycol (PEG) were used as surface-modifying additives to improve the biocompatibility and reduce the adsorption of plasma proteins onto the microsphere surfaces. These PLGA-CS-PEG microspheres are loaded with varying concentrations (5 and 8 mg/mL) of PGS or PTX, respectively. Scanning electron microscopy (SEM) revealed the morphological properties while Fourier transform infrared spectroscopy (FTIR) was used to elucidate the functional groups of drug-loaded PLGA-CS-PEG microparticles. A thirty-day, in vitro, encapsulated drug (PGS or PTX) release was carried out at 37 °C, which corresponds to human body temperature, and at 41 °C and 44 °C, which correspond to hyperthermic temperatures. The thermodynamics and kinetics of in vitro drug release were also elucidated using a combination of mathematical models and the experimental results. The exponents of the Korsmeyer–Peppas model showed that the kinetics of drug release was well characterized by anomalous non-Fickian drug release. Endothermic and nonspontaneous processes are also associated with the thermodynamics of drug release. Finally, the controlled in vitro release of cancer drugs (PGS and PTX) is shown to decrease the viability of MDA-MB-231 cells. The implications of the results are discussed for the development of drug-encapsulated PLGA-CS-PEG microparticles for the controlled release of cancer drugs in treatment of triple negative breast cancer.

1. Introduction

Cancer is the second leading cause of death globally [1,2]. It was the cause of death for an estimated 9.6 million people in 2018 [1,2]. Based on projections, cancer deaths will continue to rise, with 13 million people projected to die of cancer in 2030. At this rate, cancer may surpass cardiovascular disease as the leading cause of death, globally [2]. Current scientific evidence suggests that cancer can be triggered by environmental and genetic factors [3]. Current treatment modalities include radiotherapy, chemotherapy, hormonal therapy, and surgical removal [4]. These conventional treatment modes, however, are known to induce multiple side effects that can have negative long-term effects on a patient’s quality of life [4].
The emergence of drug delivery systems (DDS) for delivery of anticancer agents has created a profound impact on clinical therapeutics. DDS are used to deliver drugs to desired cells, tissues, organs, and subcellular organs for drug release and adsorption, through a variety of drug carriers [5]. In general, DDS are aimed at addressing some of the shortcomings of conventional cancer treatment methods, thereby improving treatment efficacy, while avoiding toxicity in normal cells. Their desirable features include improving the pharmaceutical activities of therapeutic drugs and alleviating the side effects of therapeutic drugs, thereby addressing the problem of low bioavailability, lack of selectivity, limited solubility, poor biodistribution, and drug aggregation [5]. Since the main aim of drug delivery is to attain and maintain the required therapeutic concentration of the drug in plasma, or at the site of action, for the period of treatment [6], controlled drug delivery presents several advantages. It reduces premature degradation, improves drug uptake, sustains drug concentrations within the therapeutic window, and reduces side effects associated with toxicity [7]. Hence, the concept of efficient drug delivery is important in disease management [8].
Over the past three decades, polymeric materials have played an important role in the controlled release of therapeutic agents over extended periods [9]. Due to their desirable characteristics, polymers are premier choices for localized, targeted, and controlled delivery of cancer drugs [9,10]. Biodegradable polymeric drug delivery systems have also been used to achieve the controlled delivery of drugs, macromolecules, cells, and enzymes [11,12,13,14]. Biopolymers have been used extensively in drug delivery applications. Their increased use is due to their biocompatibility and favorable degradation properties. These result in the breakdown of biopolymers to produce nontoxic byproducts [15,16].
Prodigiosin (PGS) and paclitaxel (PTX) were used as our model drugs. PGS is a natural red pigment produced as a secondary metabolite by numerous bacterial species, which include Serratia marcescens, Pseudomonas magneslorubra, Vibrio psychroerythrous, Serratia rubidaea, Vibrio gazogenes, Alteromonas rubra, Rugamonas rubra, and Gram positive actinomycetes, such as Streptoverticillium rubrireticuli and Streptomyces longisporus ruber [17,18,19,20,21]. Some members of the PGS family have antifungal, antimicrobial, antitumor, and immunosuppressive properties, and apoptotic effects in vitro [21,22,23,24,25]. PTX, also known as Taxol, is a natural product that was isolated from the yew tree Taxus brevifolia [26,27]. PTX is used as a chemotherapeutic agent and has been reported to have a broad spectrum of antitumor activity [27,28].
To design controlled drug release systems for effective therapy, it is critical to understand drug release kinetics and thermodynamics. The kinetics of drug release conveys relevant knowledge about the function of material systems [29]. Mathematical models can be used to evaluate drug release mechanisms and kinetics [30]. Furthermore, thermodynamic parameters such as enthalpy (ΔH), entropy (ΔS), and Gibbs free energy (ΔG) can be used to explain the drug kinetic release profiles [31]. Even though there has been extensive research on drug delivery systems, relating the drug release parameters with their thermodynamic parameters is still in its infancy [31,32].
In an effort address this unmet need, polymeric microspheres were developed using the W/O/W emulsion technique [33,34] in order to explore the kinetics and thermodynamics of anticancer drug release. The polymers of choice are poly (lactic-co-glycolic acid) (PLGA), chitosan, and polyethylene glycol (PEG). PLGA and PEG are biocompatible polymers that have been approved by the Food and Drug Administration (FDA) for use in the field of drug delivery [35,36,37]. The drug release characteristics of PLGA are tunable by altering the ratios of polylactic acid and polyglycolic acid [35]. PEG decreases interactions with blood components [36]. Chitosan is a naturally abundant polymer and is useful in medicine due to its biodegradability, biocompatibility, mucoadhesive, and nonimmunogenic properties, together with its ability to enhance the penetration of large molecules across mucosal surfaces [38]. These polymers have been used in several investigations related to drug delivery applications in cancer treatment [34,39,40,41].
The physicochemical and morphological properties of synthesized PLGA-CS-PEG microspheres were characterized using Fourier transform infrared spectroscopy (FTIR) and scanning electron microscopy (SEM). Mathematical models were used to analyze the kinetics and thermodynamics of the in vitro drug release from the microspheres at hyperthermic and human body temperatures [11,12]. Alamar blue assay was used to evaluate the cell viability and drug-induced cytotoxicity on triple negative breast cancer cells [11,12]. The implications of the results are then discussed as they relate to the development of drug-encapsulating microspheres for controlled release of cancer drugs in triple negative breast cancer treatment.

2. Materials and Methods

2.1. Materials

Chitosan (low molecular weight, 75–85% deacetylated), Poly vinyl alcohol (PVA) (98% hydrolyzed, MW = 13,000–23,000), and Poly (D, L-lactide-co-glycolide) (PLGA 65:35, viscosity 0.6 dL/g) were obtained from Sigma-Aldrich (St. Louis, MO, USA). One percent glacial acetic acid, Polyethylene glycol (PEG) (8000), Phosphate Buffer Saline (PBS), and Dichloromethane (DCM) were acquired from Fisher Scientific (Hampton, NH, USA). Prodigiosin (PGS) was synthesized in Soboyejo’s Laboratory at the Worcester Polytechnique Institute (WPI), Worcester, MA, USA. Ninety-six well plates and paclitaxel (PTX) was obtained from Thermo Fisher Scientific (Waltham, MA, USA). For cell culture and in vitro cell viability studies, Leibovitz’s-15 (L-15), Fetal Bovine Serum (FBS), trypsin-ethylenediamine-tetra-acetic acid (Trypsin-EDTA), Penicillin–streptomycin, Dulbecco’s phosphate-buffered saline (DPBS), and Alamar Blue Cell Viability reagent were also purchased from Thermo Fisher Scientific (Waltham, MA, USA). All reagents used were of analytical grade.

2.2. Preparation of Drug-Loaded PLGA-CS-PEG Microspheres

Drug-loaded blend of PLGA-CS-PEG microspheres were prepared using the water-oil-water (W/O/W) emulsions method with slight modifications [33,34]. Briefly, 100 mg of PLGA polymer was dissolved in 3 mL of organic solvent (dichloromethane). This was followed by adding 5 mg/mL or 8 mg/mL of PGS or PTX, respectively, to form primary emulsions. Chitosan solution (4% w/w) was prepared in 1% glacial acetic acid, filtered, and then added to the aqueous PVA solution. PEG (5%, w/w) with a molecular weight of 8 kD was added to the aqueous PVA and chitosan solution before emulsification to produce PLGA-CS-PEG microparticles.
The emulsification was done in an aqueous PVA solution (12 mL, 2% w/v) to form an oil-in-water (o/w) emulsion using an Ultra Turrax T10 basic homogenizer (Wilmington, NC, USA), set at a speed of 30,000 rpm for 3 min over an ice bath. The emulsion was kept in a magnetic stirrer that was operated overnight at 1000 revolutions per minute (rpm) for the evaporation of the organic solvent. Next, the emulsifier and nonincorporated drugs were rinsed off. A VirTis BenchTop Pro freeze dryer (VirTis SP Scientific, Stone Ridge, NY, USA) was used to lyophilize the recovered microparticles for 48 h. The nonloaded PLGA-CS-PEG microparticles were also prepared as described above without incorporating the drug.

Material Characterization of Drug-Loaded Microparticles

SEM (JEOL 7000F, JEOL Inc., Peabody, MA, USA) was used to characterize the structure of the microparticles. Prior to the SEM session, the freeze-dried drug-encapsulated PLGA-CS-PEG microparticles samples were mounted on double-sided copper tape, with the other end affixed to an aluminum stub. This was followed by sputter-coating the resulting microparticles with a 5 nm gold–palladium layer. The ImageJ software package (National Institutes of Health, Bethesda, MD, USA) was then used to analyze the mean diameter of the microparticles.
The physicochemical properties of the drug-loaded PLGA-CS-PEG microparticles were analyzed using Fourier transform infrared spectroscopy (FTIR) (IRSpirit, Shimadzu Corporation, Tokyo, Japan). Using the IR solution software package (ver.1.10) (IRSpirit, Shimadzu Corporation, Tokyo, Japan), the lyophilized drug-encapsulated PLGA-CS-PEG microparticles were scanned at 4 mm/s at a resolution of 2 cm−1 from 400 to 3500 cm−1.

2.3. In Vitro Drug Release

After encapsulating PGS (5 mg/mL or 8 mg/mL) or PTX (5 mg/mL or 8 mg/mL) in their blend of PLGA-CS-PEG polymer, a thirty-day in vitro drug release study was carried out in a bid to analyze the kinetics and thermodynamics of in vitro drug release. The in vitro drug release experiments were carried out at three temperatures: 37, 41, and 44 °C. The first temperature (37 °C) corresponds to human body temperature while the later (41 °C and 44 °C) correspond to hyperthermic temperatures.
For each formulation, 10 mg of lyophilized PLGA-CS-PEG microparticles were suspended separately in a centrifuge tube containing 10 mL of PBS (pH = 7.4) with 0.01% (v/v) Tween 80 to maintain sink condition. This was done in triplicate for each formulation. Then, for in vitro drug release process, the centrifuge tubes containing samples were positioned back into the orbital shaker (Innova 44 Incubator, Console Incubator Shaker, New Brunswick, NJ, USA) rotating at 80 rpm and maintained at the respective set temperatures (37, 41, and 44 °C). At the predetermined time duration, 1 mL of the centrifuged supernatant was obtained for drug content analysis and then replaced with 1 mL PBS (pH 7.4). The samples in the centrifuge tubes were swirled gently and returned into the shaker incubator to continue the drug release study.
A UV–visible spectrophotometer manufactured by UV-1900 Shimadzu Corporation, Tokyo, Japan, was employed to evaluate the absorbance of each 1 mL supernatant sample released at set temperatures after 24 h. To measure the absorbance for prodigiosin (PGS) analysis, the wavelength of the UV–visible spectrophotometer was fixed at 535 nm and 229 nm for PGS and PTX, respectively. The concentrations of drug (PGS or PTX) released from their respective PLGA-CS-PEG microparticles loaded with drugs were determined from a standard curve [42].
In addition, to determine the drug encapsulation efficiencies of drug-loaded PLGA-CS-PEG microspheres, a predetermined amount of drug-loaded PLGA-CS-PEG microparticles was dissolved in DCM. The UV–visible spectrophotometer was used to determine the concentration of drug in the suspension.
Equation (1) was used to determine the Drug Encapsulation Efficiency (DEE) of drug-loaded PLGA-CS-PEG microparticles:
D r u g   E n c a p s u l a t i o n   E f f i c e n c y   ( D E E ) = M X M Z × 100
where Mx represents the amount of drug that was encapsulated and Mz represents the amount of drug used for preparing the PLGA-CS-PEG microparticle.

2.4. Modeling of Drug Release

2.4.1. Kinetics of Drug Release

The mechanism of drug release from the various PLGA-CS-PEG microsphere formulations was investigated using zeroth order, first order, Higuchi, and Korsmeyer–Peppas mathematical models. The drug release data were fitted to the four kinetic models and R2 value close to 1, was the criterion for selection of the best fit model.
Zeroth order model describes the drug release in which the release rate does not depend on concentration [30]. First order model is associated with the dissolution of water-soluble drugs in porous matrices [43]. This model reveals a release rate that depends on concentration [44]. Higuchi model characterizes the release from polymer matrices [45,46]. Using Fick’s first law, the Higuchi model describes release of drug from insoluble matrix as a square root of time [43,45]. Korsmeyer–Peppas (K–P) model explores the drug release from polymeric matrix systems and is only applicable to the first 60% of drug release [43,44]. For K–P drug release, a plot of log M t M vs. log t was used to obtain the slope, n, of the resulting line, which corresponds to the underlying mechanism of drug release. For example, n < 0.45 corresponds to a Fickian diffusion mechanism, while 0.45 < n < 0.89 corresponds to non-Fickian transport, n = 0.89 corresponds to Case II (relaxational) transport, while n > 0.89 corresponds to super case II transport [44,45,47].
The equations for the respective models are summarized in Table 1.
Table 1. Kinetic models and their respective equations.
S/NKinetic ModelEquation
1Zeroth order Q t = Q 0 + K . t
2First order log Q t = log Q 0 + K t 2.303
3Higuchi Q t = K . t 1 2
4Korsmeyer–Peppas (K–P) M t M = K t n
where Q0 is the initial amount of drug in the solution, Qt is the cumulative amount of drug released at time t, and K is the kinetic constant, t is the time, M t M is a fraction of drug released after time t, and n is the release exponent.

2.4.2. In Vitro Drug Release Thermodynamics

The data for the in vitro release of drug from PLGA-CS-PEG microspheres were used to calculate the thermodynamic parameters (activation energy (Ea), enthalpy (ΔH), Gibbs free energy (ΔG), and the entropy (ΔS) changes) [48,49]. This paper uses expressions from prior studies [12] to estimate the thermodynamic parameters. These are summarized in Table 2, where their mathematical expressions are presented. The magnitude and signs of these parameters provide insight to the spontaneity and feasibility of drug release processes from the microspheres.
In the expressions presented, R is 8.314 J mol−1 K−1, which represents the universal gas constant, T is the absolute temperature in Kelvin, the thermodynamic equilibrium constant is Kt, Ea is the activation energy, and the pre-exponential factor is denoted by Df. A Van Hoff plot of ln Kt vs. 1/T was used to estimate Ea (kJ mol−1). Thus, the gradient gives E a R . Given the Eyring expression for Kt, when a plot is for ln K t vs. 1 T is linear, then the gradient of the plot equals the enthalpy change and intercept of the plot equals entropy change [48]. Hence, the gradient m is given as H R and ln K B h + Δ S R equals the intercept c, respectively, where KB is the Boltzmann constant with value 1.38065 × 10⁻³⁴ m2 kg s−2w K−1, ΔS is change in entropy, h is Planck’s constant (6.626 × 10⁻³⁴ J sec), and ΔH is the enthalpy change.

2.5. In Vitro Cell Viability and Cytotoxicity

Several studies have demonstrated in vitro and in vivo studies that PGS, or PTX, has anticancer activity against breast cancer [11,12,50,51]. In this context, to investigate the potential anticancer effect of these drugs (PGS and PTX), Alamar blue assay was carried out on MDA-MB-231 breast cancer cells. The percentage of Alamar blue reduction was used to measure the cell viability with or without treatment with drug-loaded microparticles. A higher percent reduction value implies a higher cell growth and, by extension, a higher cell viability. The breast cancer cell line (MDA-MB-231) was obtained from American Type Culture Collection (ATCC) (Manassas, VA, USA). The passage number of used cell culture was 10, and the cells were maintained under standard cell culture conditions to prevent contamination by mycoplasma, bacteria, fungi, and virus. The materials and supplements used for the cell culture were sterile and all cell culture procedures were carried out in a Labconco Delta Series Purifier Class II Biosafety Cabinet (Labconco Corporation, Kansas City, MO, USA). The dosage levels used was based on prior studies [11,12,50]. The cells were incubated with drug-loaded PLGA-CS-PEG microspheres or nonloaded PLGA-CS-PEG microsphere suspension at 10 mg/mL, respectively, at time intervals 0, 6, 24, 48, and 72 h. In addition, the cells were treated with free PTX and PGS at 15 µM concentration at the time intervals.
In this study, a complete cell culture medium referred to as Leibovitz’s 15+ (L15+) was used. L15+ contains Leibovitz’s 15 (L15), 10% FBS, and 2% penicillin/streptomycin. MDA-MB-231 cells were cultured in a T75 flask using L15+ medium and incubated in a humidified incubator set at 37 °C. The cells were harvested at 70–80% confluence (log phase of growth) using trypsin-EDTA. Alamar blue cell viability assay was used to perform the in vitro cell viability and drug-induced cytotoxicity studies on MDA-MB-231 cells, as described in our previous work [11]. Approximately 104 cells per well were seeded in 24-well plates (n = 4) [11]. Prior to the cell culture experiments, the drug-loaded microspheres were exposed to UV light under sterile conditions. Three hours post cell seeding, the L15+ medium was replaced with 1 mL of L15+ containing 10 mg/mL of PLGA-CS-PEG microparticles loaded with drugs and the plates were incubated at 37 °C and 5% CO2 for 3 h in a humidified incubator. At predetermined time intervals (0, 6, 24, 48, and 72 h after the incorporation of the drug-loaded microspheres), the L15+ medium was replaced with L15+ containing 10% Alamar blue reagent. After incubating the plates for 3 h at 37 °C and 5% CO2, 100 μL aliquots were transferred into duplicate wells of a black opaque 96-well plate for fluorescence intensity measurements using a 1420 Victor3 multilabel plate reader (Perkin Elmer, Waltham, MA, USA) set at 544 nm excitation and 590 nm emission. Similar protocol was followed to assess the cell viability of nonloaded PLGA-CS-PEG microparticles and free drugs. The nonloaded PLGA-CS-PEG microparticles acted as the control. The percentage Alamar blue reduction data were normalized to the time 0 values (time 0) such that the initial values approximated 100% cell viability.
Equations (2) and (3) were used to determine the percentage (%) Alamar blue reduction and the percentage (%) cell growth inhibition [11]:
%   A l a m a r   B l u e   R e d u c t i o n = F I s a m p l e F I 10 % A B F I 100 % R F I 10 % A B × 100 ,  
%   G r o w t h   I n h i b i t i o n = ( 1 F I s a m p l e F I c e l l s ) × 100 ,  
where F I s a m p l e is the sample’s fluorescence intensity, F I 10 % A B is 10% Alamar blue reagent fluorescence intensity, F I 100 % R is 100% reduced Alamar blue fluorescence intensity, and F I c e l l s is the fluorescence intensity of untreated cells [11].

2.6. Statistical Analysis

Statistical analysis was carried out using the analysis of variance (ANOVA) test. The statistical analysis includes two-way ANOVA testing of the cell viability and cytotoxicity data. It also includes one-way ANOVA testing of drug release data. This was used to evaluate the differences between the control and the study groups. Thus, p < 0.05 was used to determine the significance. Post hoc Tukey tests were also used to distinguish between statistically significant groups. All the experimental results were reported as mean ± standard deviation. All experiments were carried out in triplicate unless otherwise stated.

3. Results

Figure 1a–e shows the morphological analysis (SEM) that the particles were spherical in shape with a smooth surface for all formulations. The morphology of the drug-loaded microspheres was not significantly different from that of the nonloaded PLGA-CS-PEG microspheres, which implies that the morphologies of the PLGA-CS-PEG microspheres were not significantly affected by drug encapsulation. Figure 2 reveals that the mean particle sizes of the microparticles ranged from 1.17 μm to 1.39 μm.
FTIR analysis was used to confirm the existence of CS and PEG on PLGA-CS-PEG microspheres. It was also used to study the interactions between the drug and polymer matrix. A representative FTIR spectrum for the PLGA-CS-PEG microspheres is shown in Figure 3. There was no evidence of strong bonds between the respective drugs (PGS or PTX) and PLGA-CS-PEG microparticles. In the FTIR spectrum, the characteristic band at 3422 cm−1 is attributed to –NH2 and –OH groups stretching vibration in the chitosan matrix [52] and followed by a peak at ~2995 cm−1 due to the amino group. The strong band at 1749 cm−1 corresponds to the C=O stretching vibration of the carbonyl in the lactide and glycoside structure [53]. The characteristic peak revealed at 1084 cm−1 of the PEG polymer is attributed to the C–O–C stretching vibration of the repeated—OCH2CH2—units of the PEG backbone. That was were. The occurrence of these characteristic peaks indicates that PEG and CS were successfully blended in the microspheres. Other peaks obtained in the fingerprint region are shown in Figure 3.

3.1. In Vitro Drug Release Kinetics

Figure 4a–d illustrates the profiles for in vitro drug release from PLGA-CS-PEG microspheres in PBS (pH 7.4, 0.01% Tween 80) at 37, 41, and 44 °C. The four types of PLGA-CS-PEG microsphere formulations (PLGA-CS-PEG_PGS5, PLGA-CS-PEG_PGS8, PLGA-CS-PEG_PTX5, and PLGA-CS-PEG_PTX8) all exhibited controlled drug release with over 50% release by the end of day 30. After 48 h, the initial burst release for each microsphere formulation is presented in Table 3. The initial burst release depended on the drug type encapsulated. In the case of PGS loaded PLGA-CS-PEG microspheres, a lower burst release was observed. This could be as a result of the hydrophilic and hydrophobic moieties in the PGS drug [11,12]. For PLGA-CS-PEG microspheres encapsulated with PTX drug, a higher release was noticed. Similar findings have been reported in previous studies [11,12]. The results also revealed that PLGA-CS-PEG microspheres loaded with 8 mg/mL concentration of drug have an overall higher burst release than PLGA-CS-PEG microspheres loaded with a drug concentration of 5 mg/mL. On day 30, the overall cumulative drug release reveals a similar pattern for the respective drug-loaded microspheres. It is also important to note that the overall % CDR after the 30 day release was slightly lower for paclitaxel-loaded PLGA-CS-PEG microsphere than prodigiosin-loaded PLGA-CS-PEG microspheres, which could be ascribed to the hydrophobic moiety of PTX drug [11,12].
The drug encapsulation efficiencies for the PLGA-CS-PEG_PGS5, PLGA-CS-PEG_PGS8, PLGA-CS-PEG_PTX5, and PLGA-CS-PEG_PTX8 microspheres were determined to be 56.5%, 58.5%, 57.5%, and 56%, respectively, and are presented in Table 3. Furthermore, the drug release profiles were similar at the set temperatures (37, 41, and 44 °C), which implies that the variation in temperature used during the drug release do not significantly (p-value > 0.05) influence the drug release profiles for the PLGA-CS-PEG microspheres. However, comparing the respective cumulative drug release, the results were significant with p-value < 0.05. Overall, these results suggest the potential of drug-loaded microspheres for controlled release of therapeutic levels of anticancer drugs were within clinically relevant durations [11].
To understand the in vitro drug release kinetics from PLGA-CS-PEG microspheres, four kinetic models were explored. These include the zeroth order model, the first order model, the Higuchi model, and the Korsmeyer–Peppas (K–P) model [30]. The kinetic constant (K) and correlation coefficients (R2) obtained for the release kinetics are presented in Table 4.
It is clear from Table 4 that the release kinetics for the various PLGA-CS-PEG microsphere formulations with the highest correlation coefficients R2 fit the K–P model the best. The release exponents, n, were also found to be within the range of 0.45 < n < 0.89, signifying that the release mechanism was by anomalous non-Fickian diffusion.
Table 5 presents the values for the thermodynamic parameters that were calculated from in vitro drug release data in this study. The ΔG which is the most important thermodynamic parameter associated with the release process, was positive for PLGA-CS-PEG microspheres, indicating a nonspontaneous natural process. This nonspontaneous process could be attributed to the controlled release of drug from the PLGA-CS-PEG microspheres and probably aids controlled drug release over a one month period [11,15].
Figure 5 shows a plot of ΔG (kJ mol−1) vs. temperature (K) for PLGA-CS-PEG microspheres. A positive value was obtained for ΔH, which shows that the release of drug from PLGA-CS-PEG microspheres was an endothermic process. Additionally, as the drug diffused in the medium to try to reach equilibrium, there was reduction in system disorder. This was clearly indicated by the negative values for ΔS for all PLGA-CS-PEG formulations. Such nonspontaneous release may be due to the controlled release and more likely to promote the release of the drug at a controlled rate during a period of one month. The Ea is the energy required to move the drug molecule from within the polymer matrix to the medium. A positive Ea value was obtained for the drug release from PLGA-CS-PEG formulations, with values < 10 kJ/mol indicating that the in vitro drug release was mainly by diffusion-driven processes.

3.2. In Vitro Drug Release Thermodynamics

Table 5 represents the calculated thermodynamic parameters obtained.

3.3. In Vitro Cell Viability and Cytotoxicity

The data in Figure 6a compare the viability of untreated cells with those treated with drug-loaded microparticles after 6, 24, 48, and 72 h post treatment. At all durations, cell viability was lower for breast cancer MDA-MB-231 cells treated with drug-loaded PLGA-CS-PEG microparticles encapsulating drugs vs. the untreated cells. In addition, the cells treated with paclitaxel-loaded microparticles were less viable than their prodigiosin-loaded counterparts. Among the treated cells, increasing the concentration of prodigiosin and paclitaxel in PLGA-CS-PEG microparticles resulted in decreased cell viability, as manifested in the lower normalized percentage Alamar blue reduction values. There was an initial decline in the viability of the treated cells after 6 h of exposure followed by a gradual rise in cell viability until 72 h. In the case of the paclitaxel-loaded PLGA-PEG-CS microparticles at 8 mg/mL, the viability continued to decrease after 6 h. There was an initial decline in the viability of the treated cells after 6 h of exposure followed by a gradual rise in cell viability until 72 h, except for the paclitaxel-loaded PLGA-PEG-CS microparticles at 8 mg/mL concentration, which continued to decline further. The initial decline in cell viability was probably due to the initial burst release of the drugs from the microparticles that shocked the cells, which were still in their lag growth phase and in their most fragile state.
The data in Figure 6b show the effect of adding PLGA-CS-PEG microspheres encapsulating drugs to the cells inhibit MDA-MB-231 breast cancer cell growth after 6, 24, 48 and 72 h exposure when compared to the untreated MDA-MB-231 breast cancer cells. Percentage cell growth inhibition was used as a measure of the drug-induced cytotoxicity level. A higher percent inhibition value implies an elevated cytotoxicity level due to drug treatment. Again, the data show that at all durations, paclitaxel-loaded microparticles exhibited higher percent inhibition values than prodigiosin-loaded microparticles, meaning that cells exposed to the former were more cytotoxic than the latter. In addition, increasing the concentration of drugs in the microparticles resulted in higher cytotoxicity levels as manifested in the higher percent growth inhibition values. In effect, loading the microparticles with 8 mg/mL of paclitaxel was more effective in impeding the growth of MDA-MB-231 breast cancer cells, while prodigiosin at a concentration of 5 mg/mL was least effective.

4. Discussion

This study suggests that the combination of PLGA, CS, and PEG can be used to form microspheres for the controlled release of cancer drugs such as paclitaxel and prodigiosin into cancer cells and tissues. The purpose of this study is to explore the effects of immobilized drug-loaded microparticles that are injected into regions from which tumor tissues have been extracted. Unlike the injectable drug-loaded nanoparticles that have sizes below certain critical sizes, the use of immobilized/implantable microparticle systems or scaffolds within a tumor site (after surgical removal of tumor to treat local regional/residual cancer tumor) has been reported to be safe [11,12].
The extended release of paclitaxel and prodigiosin also inhibits the growth (reduces the viability) of MDA-MB-231 cells under in vitro conditions (Figure 6a,b).
However, although further in vivo work is needed to investigate the possible outcome of extended cancer drug (prodigiosin and paclitaxel) release from the microparticles that were produced in this study, the current work does show that the combined use of PEG and CS polymer can be used to control the thermodynamics and the kinetics of the controlled release characteristics (Figure 4a–d and Table 4 and Table 5).
Furthermore, since the extended release of prodigiosin and paclitaxel from other PLGA microparticles did not elicit any observable cytotoxic responses in our prior work [12], we are hopeful that the in vivo elution of the same drugs (prodigiosin and paclitaxel) from PLGA-CS-PEG PEG microparticles will not induce cytotoxic effects. This suggests that the combination of two hydrophilic polymers (PEG and CS) could be advantageous in terms of preventing the adhesion of blood proteins to the surface, thereby improving the longevity in blood circulation.
In any case, the in vitro drug release profiles obtained in this study (Figure 4a–d) exhibited a biphasic-controlled drug release from PLGA-CS-PEG microspheres with >50% drug released at day 30. This is because the result is characterized by an initial burst release of drug followed by a constant rate of drug release [54]. Thus, the burst release phase occurs because of the initial exposure of the microspheres to the phosphate-buffered saline and the next phase basically relates the power-law relationship between cumulative amount of drug release and time [55]. A similar biphasic release was observed in the work of Suphiya Parveen and Sanjeeb K. Sahoo [34]. This controlled release can be attributed to the presence of CS and PEG as a blend, implying that they act as physical barriers that limit diffusion and erosion processes associated with drug transport through the microspheres.
Hence, it was not surprising that the best fit to the drug release data obtained in this study was the Korsmeyer–Peppas model [11,12,47,51]. This model corresponds to n values within the range 0.45 < n < 0.89, which is consistent with anomalous drug release by a combination of non-Fickian diffusion and erosion by polymer network degradation. The initial stage of drug release is due to diffusion from the polymer microspheres. However, the remaining drugs trapped in the microspheres are only released as the polymer degrades. Therefore, it is necessary to use a degradable material to slow the release of the drugs from the PLGA-CS-PEG microspheres. The use of PLGA polymer enables controlled release of drug due to their biocompatibility and degradability properties. Typically, as the drug-loaded microspheres break down inside the body, they produce nontoxic natural byproducts such as water and carbon dioxide that are easily eliminated [15,16].
The occurrence of erosion by polymer network degradation is attributed to a two-step process in which the blend of hydrophilic polymers on the microspheres first form a swollen structure (due to water absorption) leading to the detangling of chemical, prior to the subsequent erosion of the PLGA microparticles. It is also worth mentioning that, during the burst release phase when poorly encapsulated and surface bound drugs are released, a higher level of burst release was observed from PTX-loaded microspheres than that observed from PGS-loaded microspheres. In addition, at the set temperatures (37, 41, and 44 °C) similar drug release profiles were seen.
The values obtained for the thermodynamic parameters such as enthalpy (ΔH), entropy (ΔS), and Gibbs free energy (ΔG) showed that the drug release was feasible at 37, 41, and 44 °C. They also revealed that the drug release process was orderly, endothermic, and nonspontaneous.
Finally, it is important to note that the therapeutic potency of the various drug-loaded PLGA-CS-PEG microsphere formulations was assessed using Alamar blue assay. The results confirmed that the MDA-MB-231 breast cancer cell growth was highly repressed by PLGA-CS-PEG_PTX8 microspheres, with PLGA-CS-PEG_PGS5 microspheres being the least efficient. In any case, PLGA-CS-PEG microspheres loaded with drugs exhibited drug release and MDA-MB-231 cell growth inhibition that suggest that they are promising candidates for the controlled release of drugs (paclitaxel and prodigiosin) for triple negative breast cancer treatment.
Before concluding, it is important to compare the results from this study to the results from a prior study by Jusu et al. (2020) in which similar materials (PLGA-PEG) were used to encapsulate anticancer drugs. As in prior work by Jusu et al. (2020) in which PLGA-PEG microspheres were studied, the current study in which we introduced chitosan into the polymer matrix resulted in the anomalous non-Fickian release of cancer drugs that was well characterized by the Korsmeyer–Peppas model. The drug release at the end of day 30 was also slightly lower for PLGA-CS-PEG microspheres than for PLGA-PEG microspheres at the same time duration.
The slower rate of drug release suggests that extended release of cancer drugs due to the chitosan-PEG blend in the PLGA-CS-PEG microparticles could give rise to further extensions of the drug release durations than those associated with drug release from only PEG blend with PLGA. Finally, it is important to note here that prior in vivo studies of targeted drug release from implanted drug-loaded PLGAPEG microparticles Jusu et al. (2020) did not reveal any additional cytotoxicity effects after the extended elution of targeted cancer drugs (PGS and PTX) from the microparticles. This suggests that the PLGA-CS-PEG microspheres examined in this study are likely to elute targeted and untargeted drugs for longer durations at lower rates that are not likely to induce any additional cytotoxicity effects.

5. Conclusions

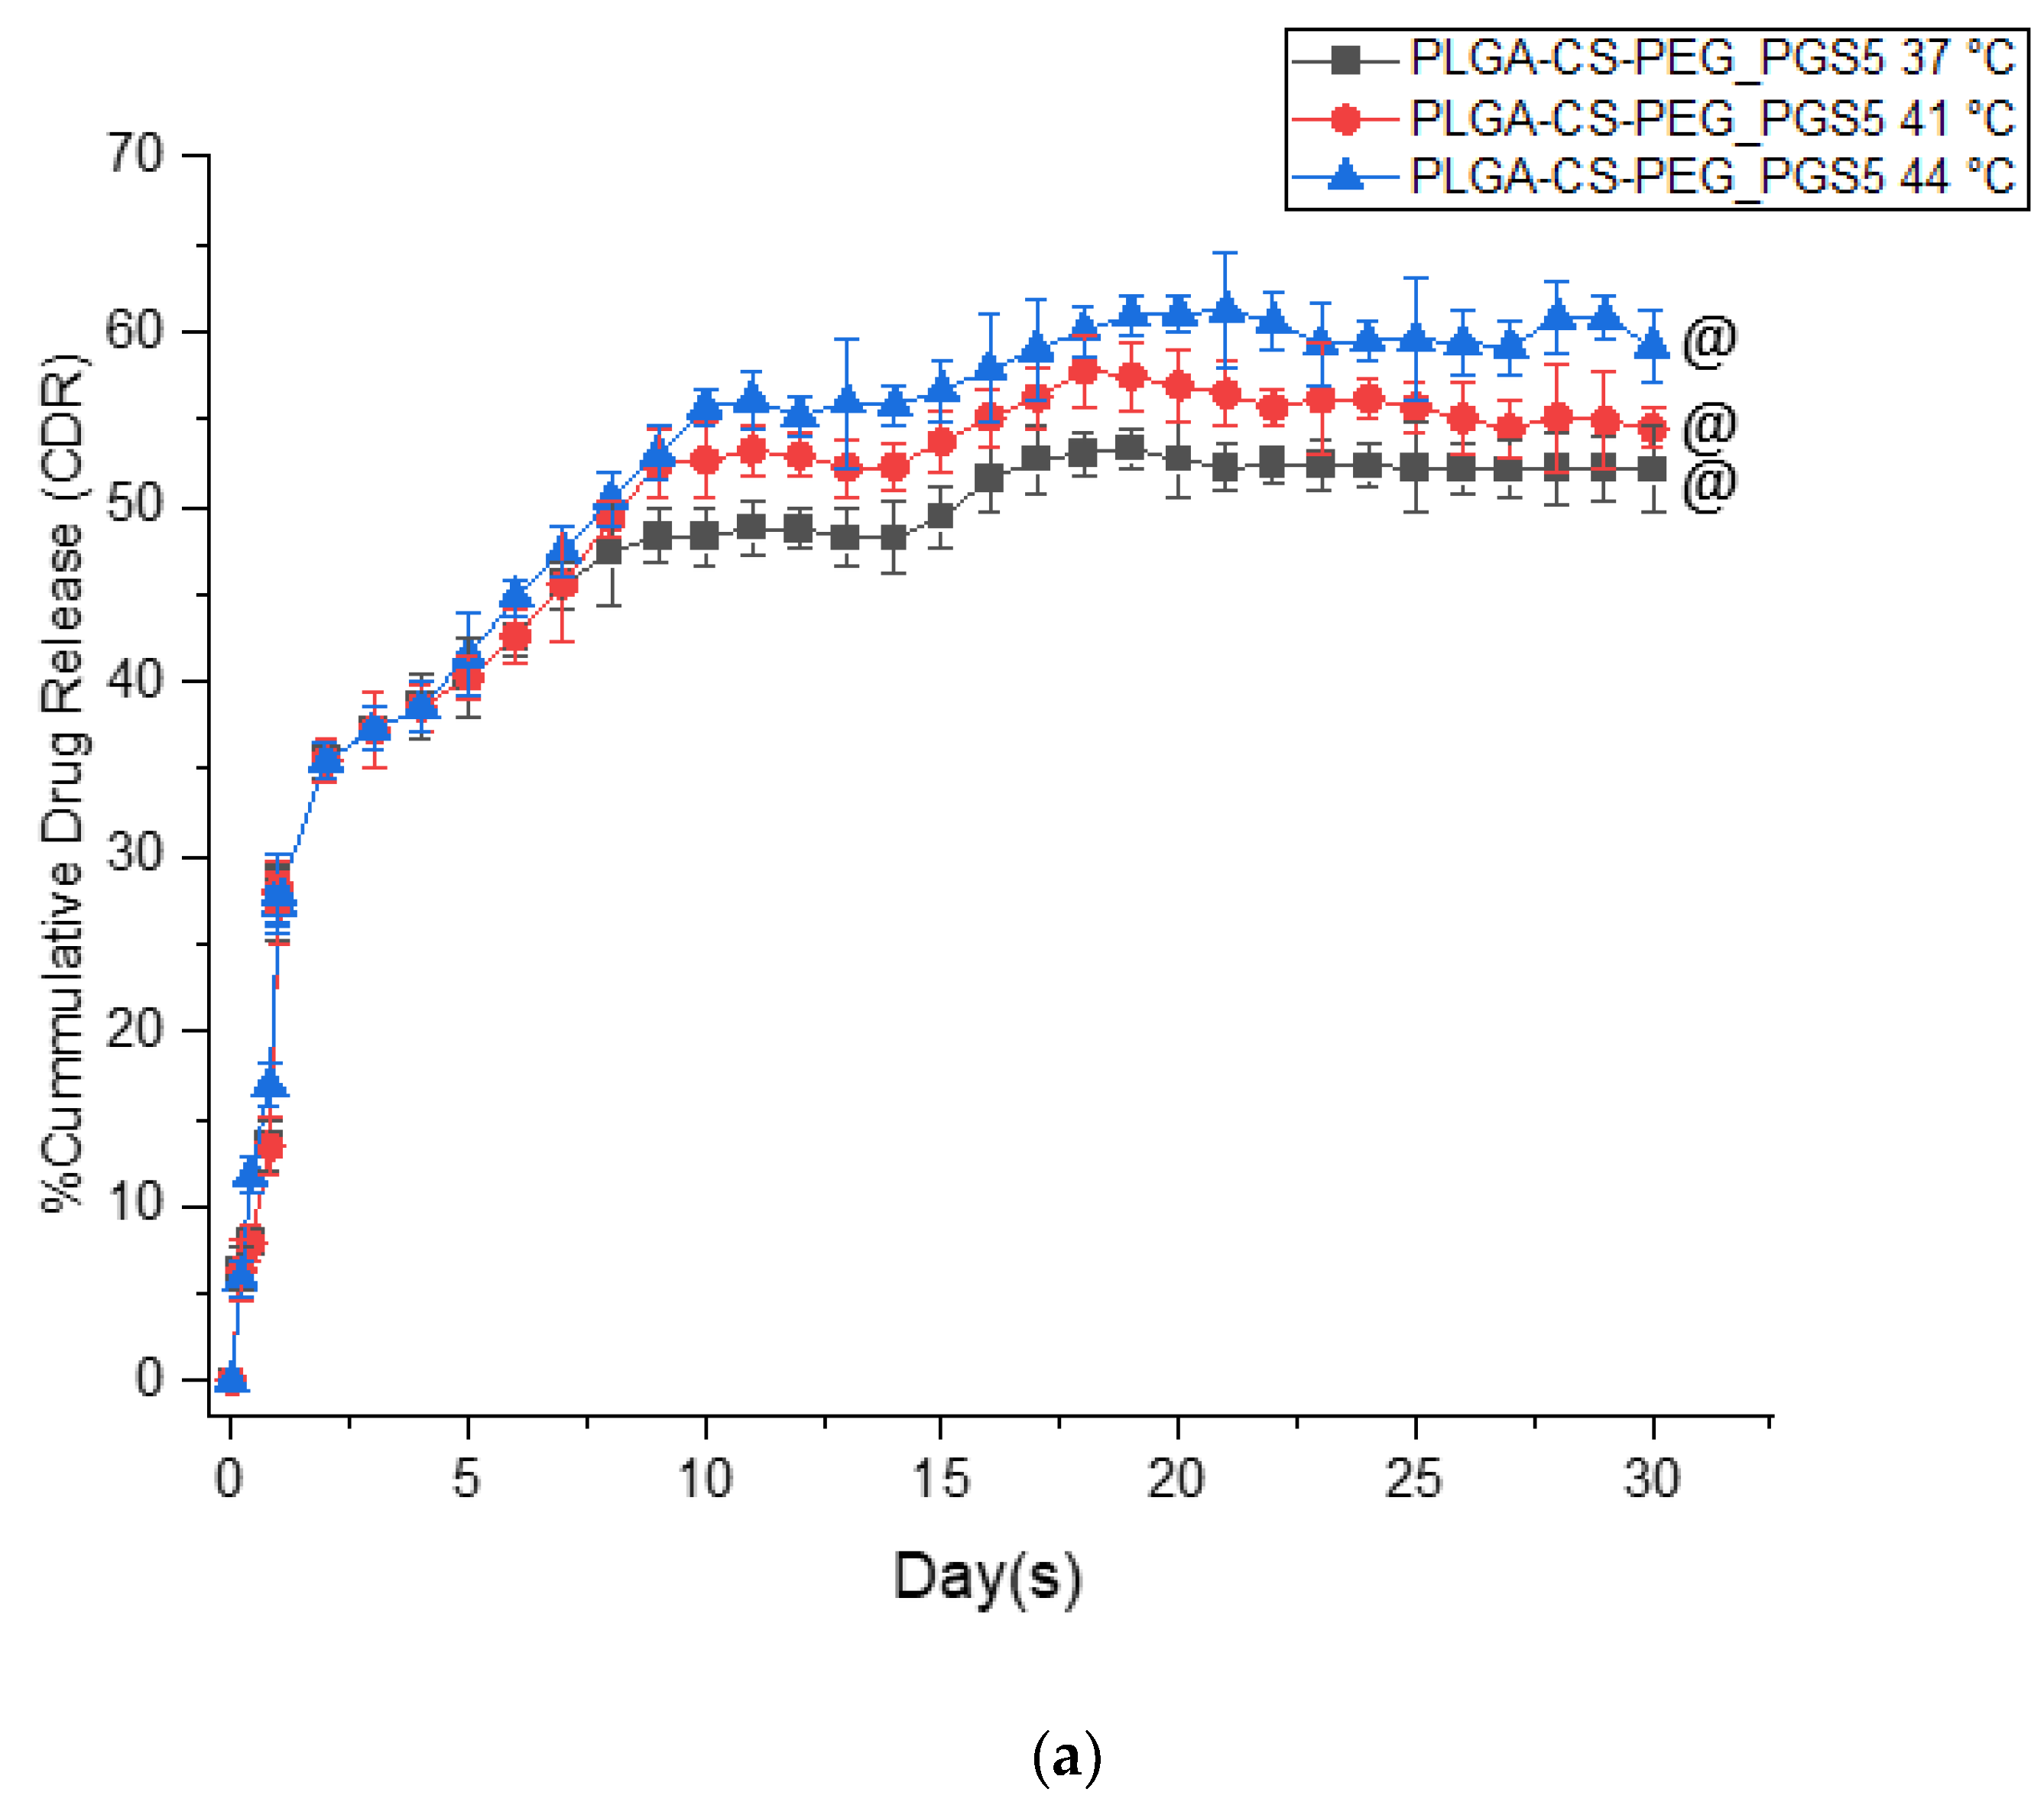
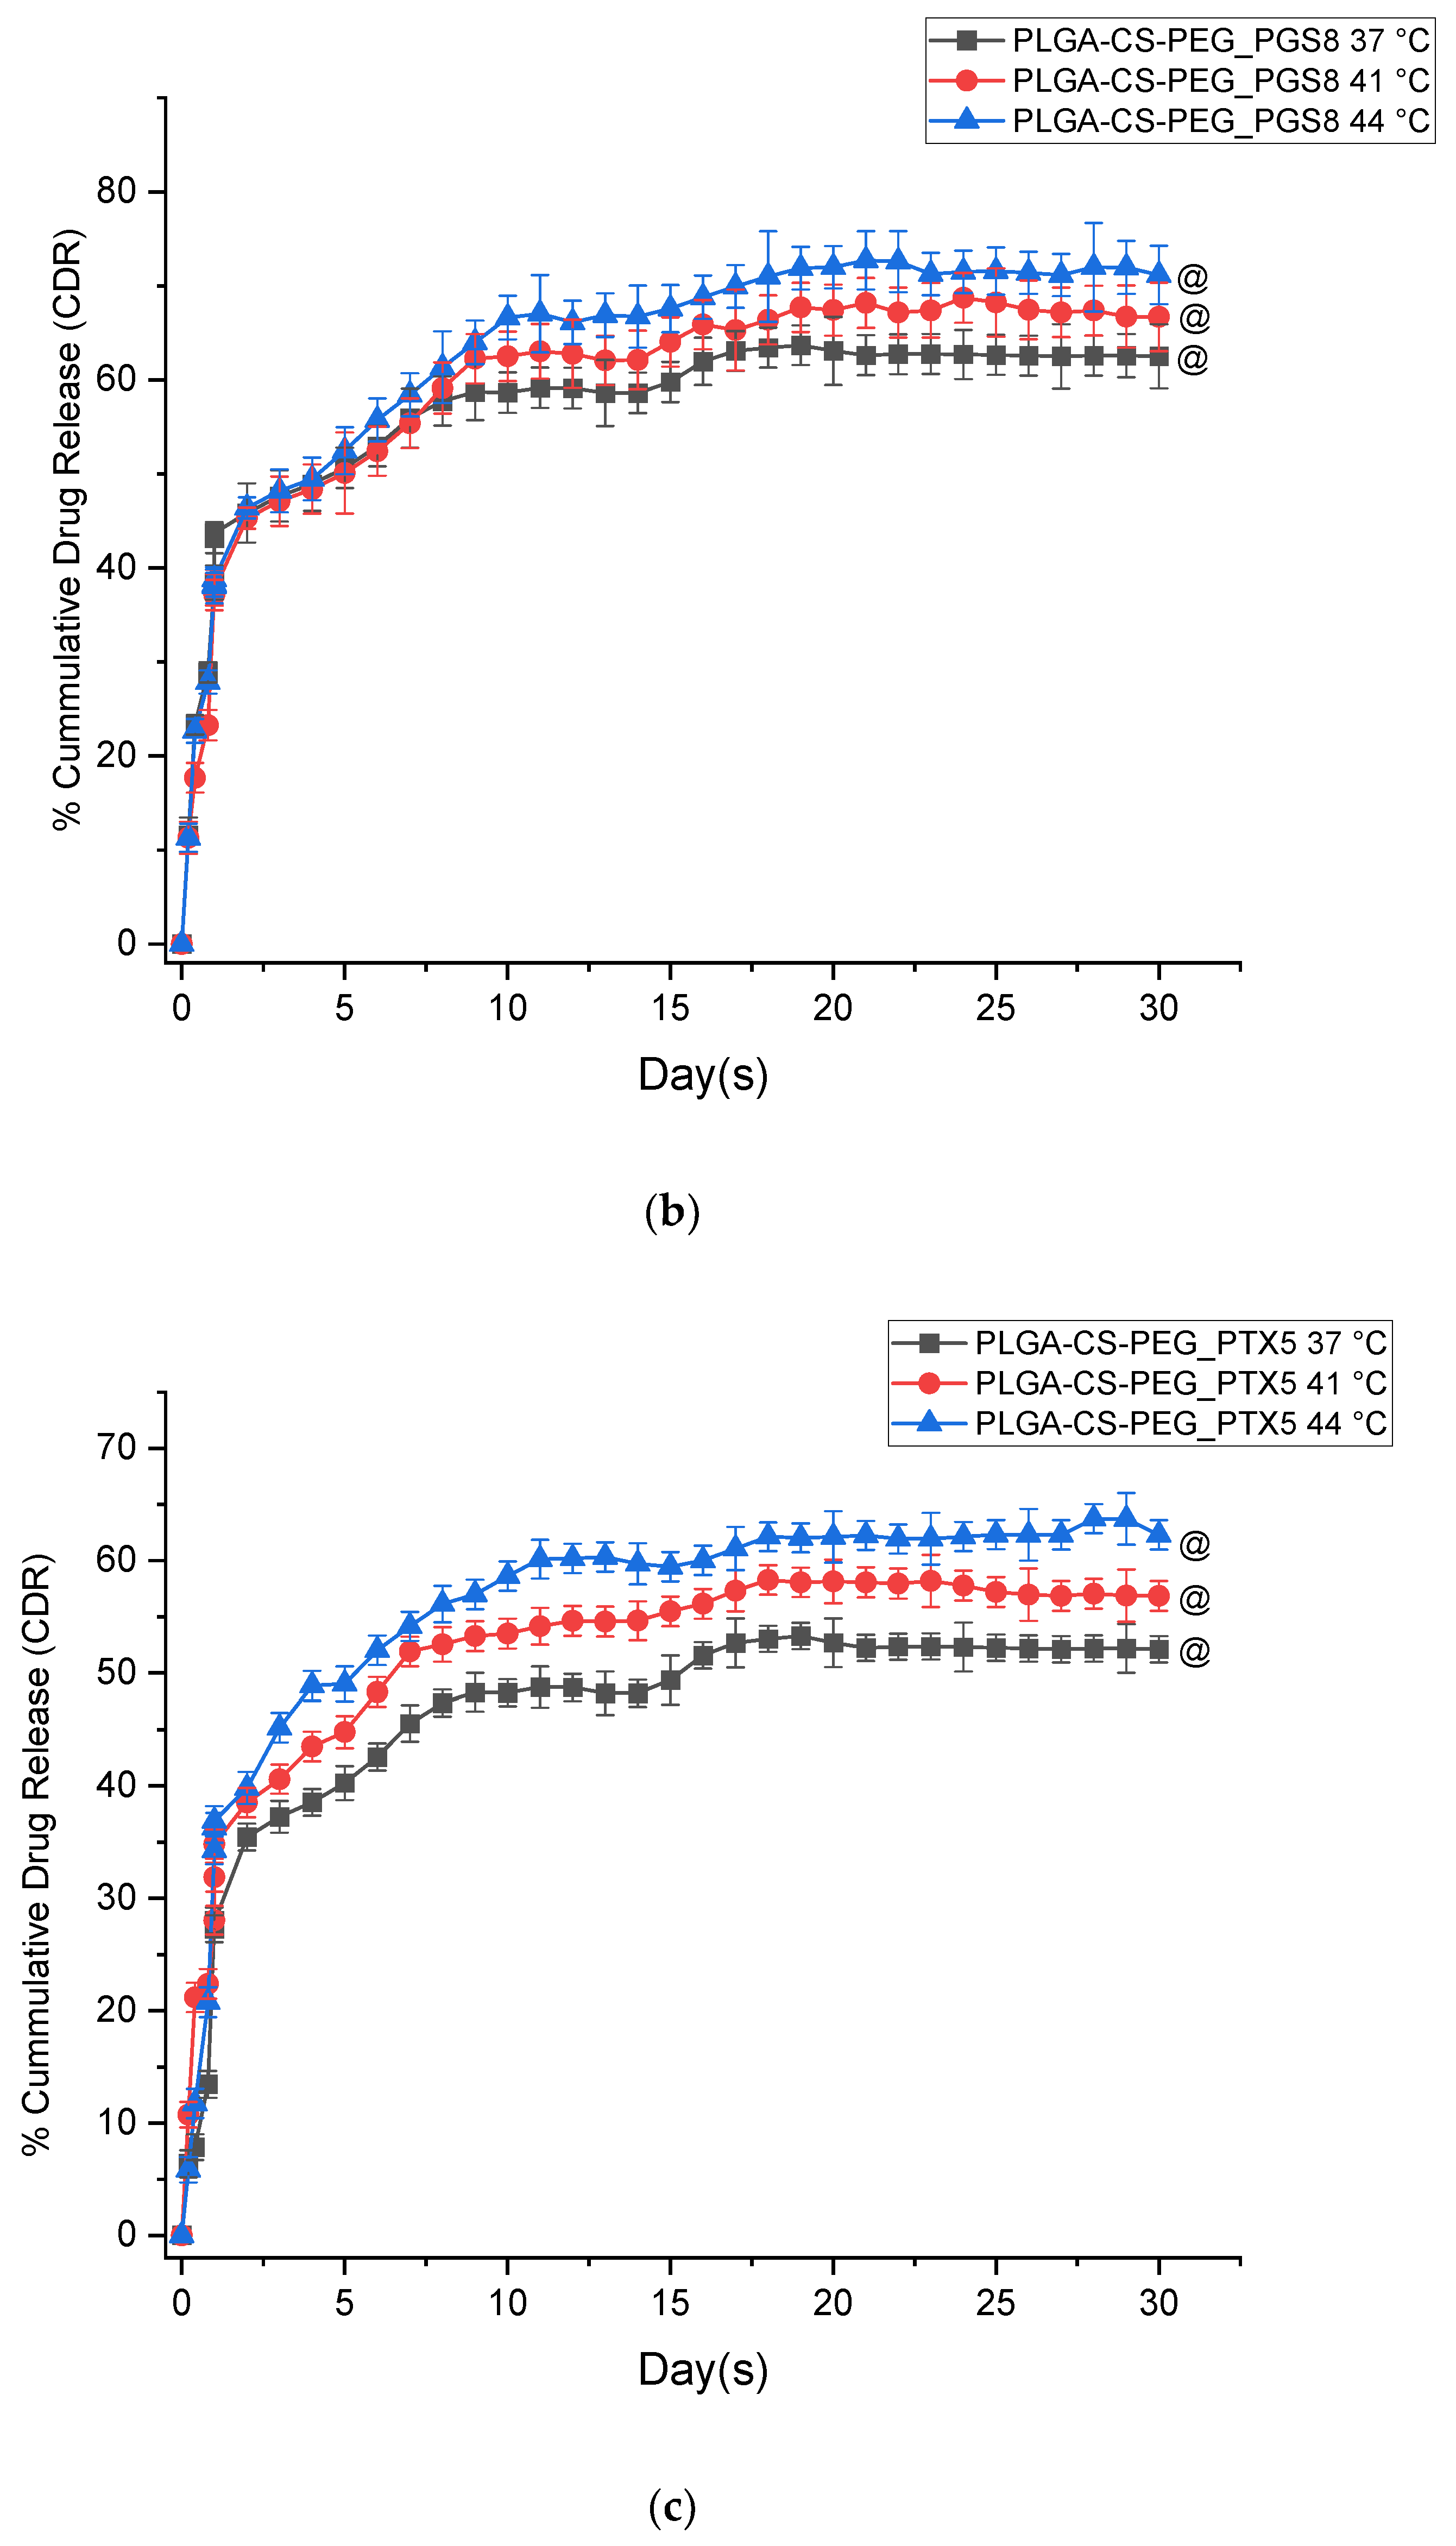
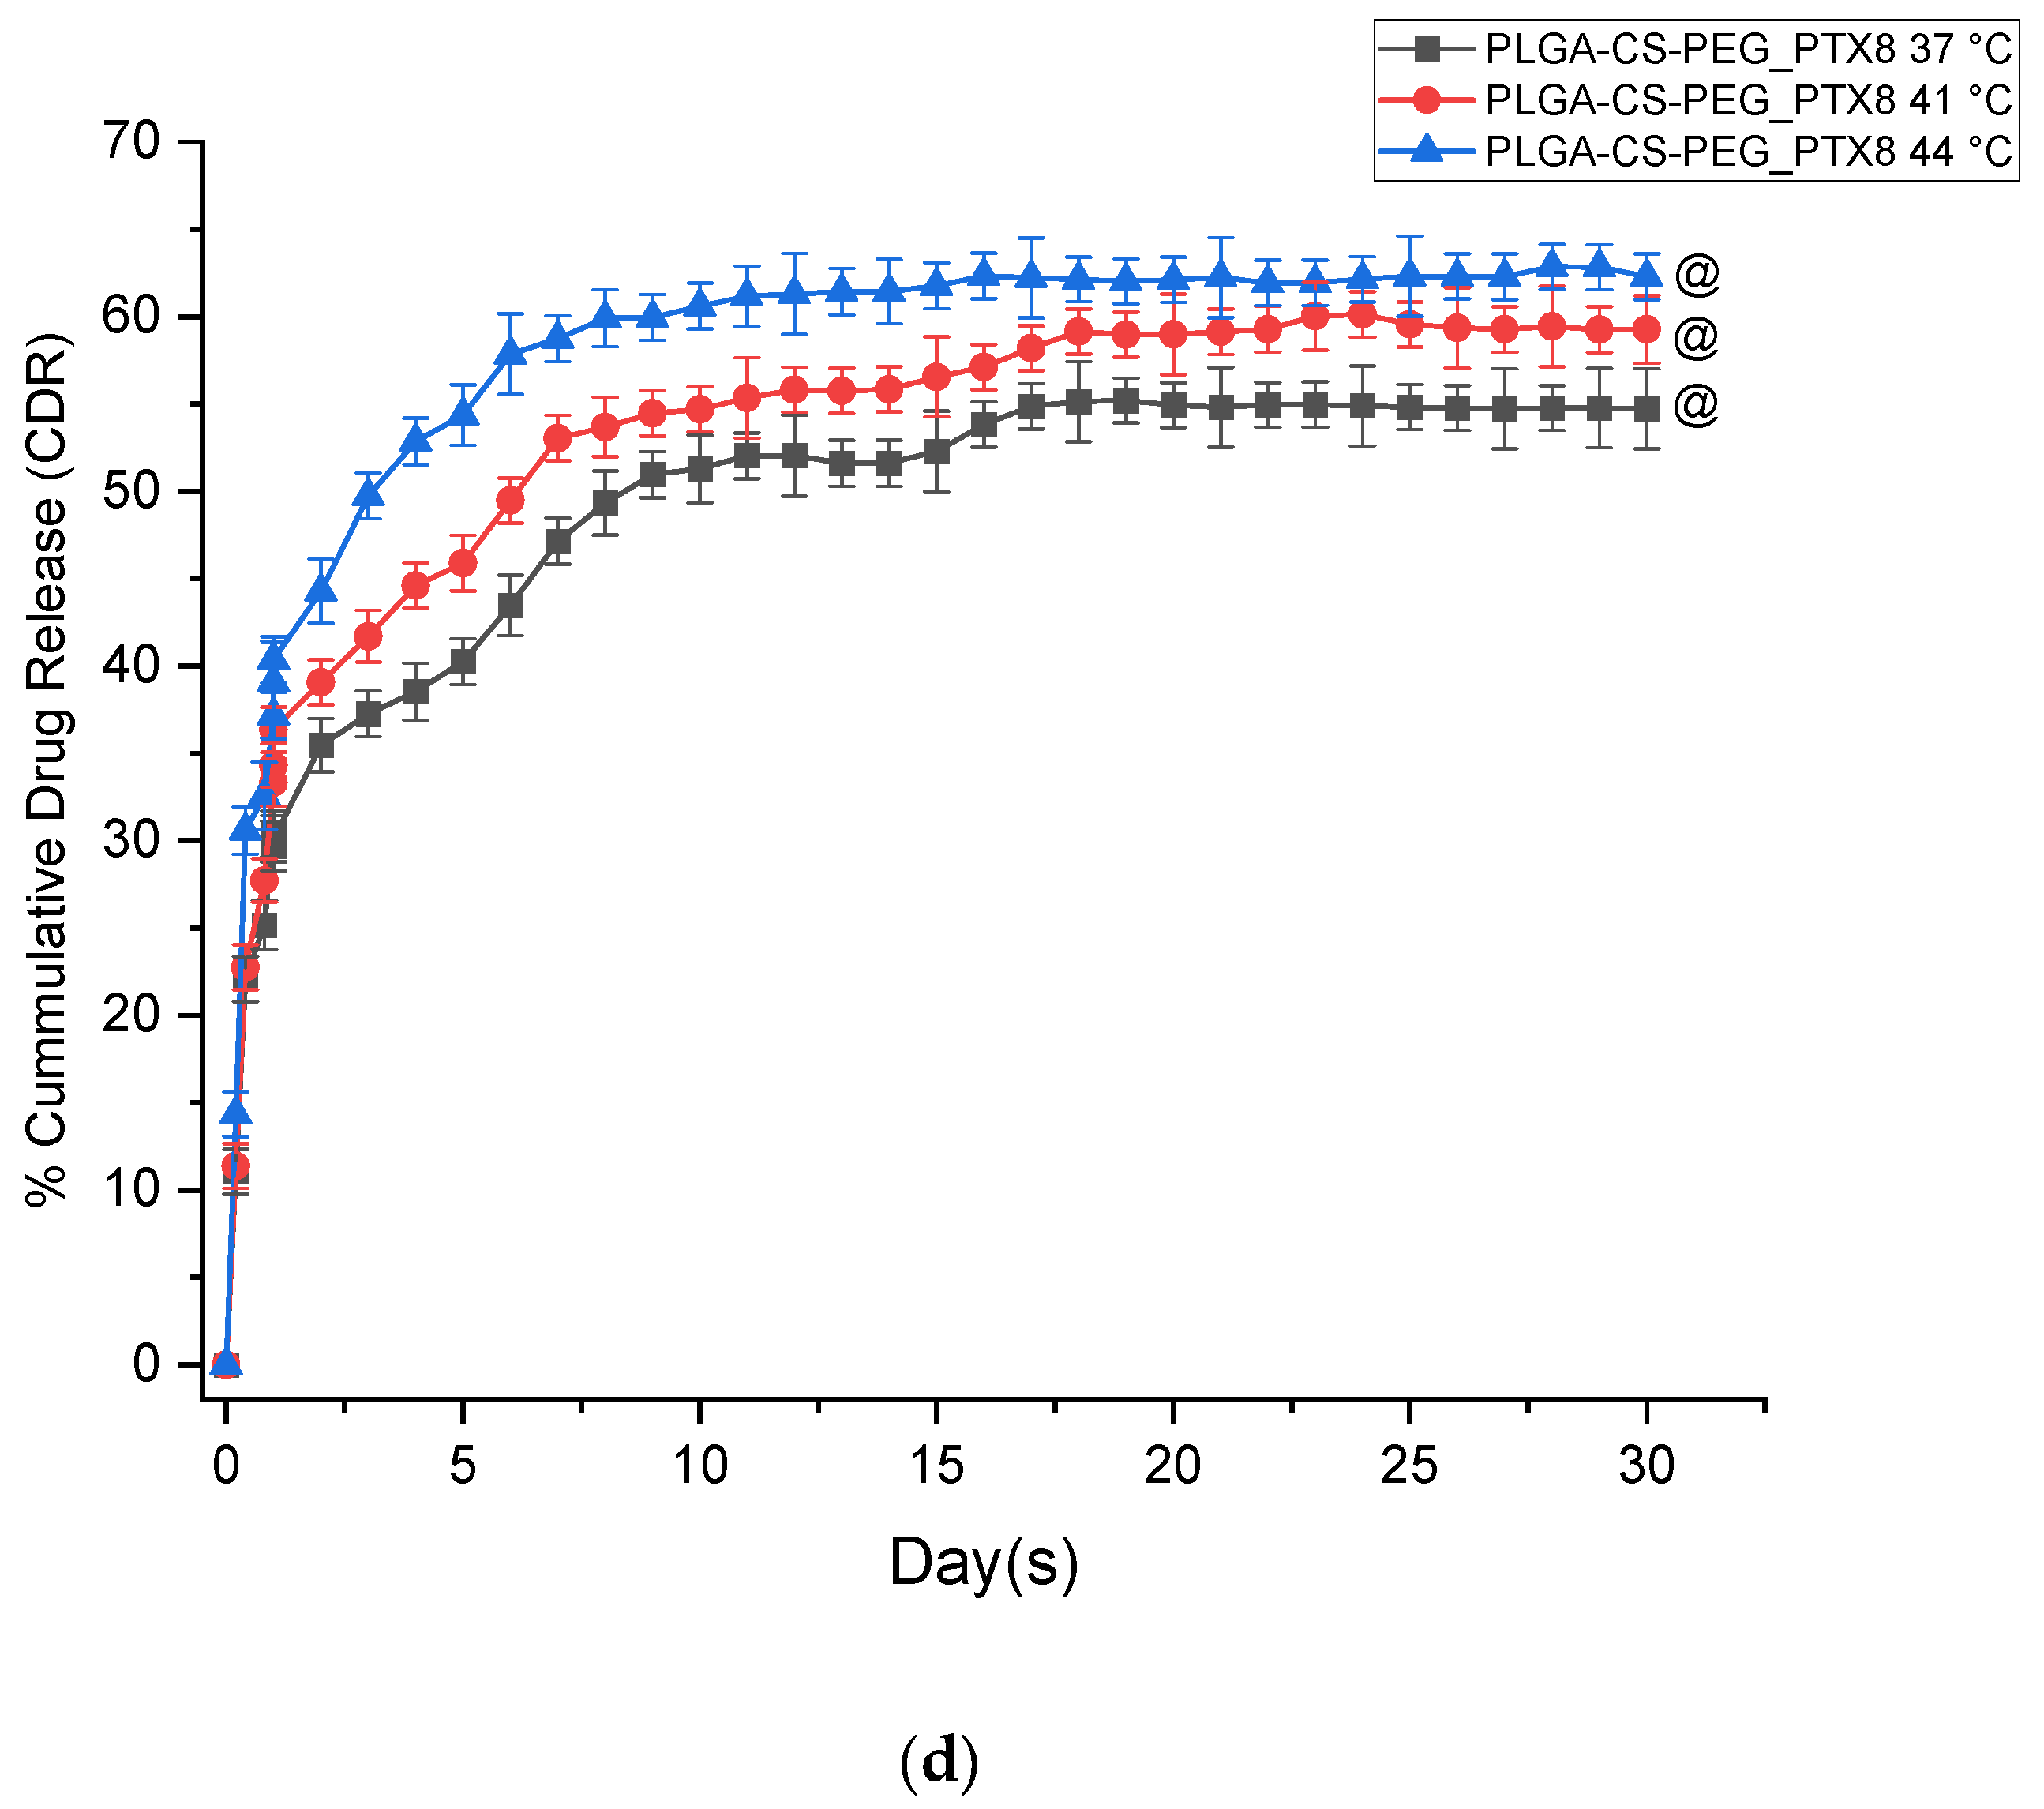
  • The PGS-loaded microspheres have lower burst release profiles than the PTX-loaded microspheres. The kinetics of drug release from both types of microspheres are also well characterized by the Korsmeyer–Peppas model, with release exponents n within the range of 0.45 < n < 0.89. This range of n corresponds to drug release occurring by anomalous non-Fickian release and is associated with drug diffusion and the relaxation of the polymer chains between the networks.
  • The in vitro drug release profiles obtained in this study exhibit a biphasic-controlled release of anticancer drugs (paclitaxel and prodigiosin) from drug-loaded PLGA-CS-PEG microspheres with >50% drug released at day 30. This controlled release is attributed to the presence of CS and PEG blends that limit the diffusion and erosion processes associated with drug transport through the blended microspheres.
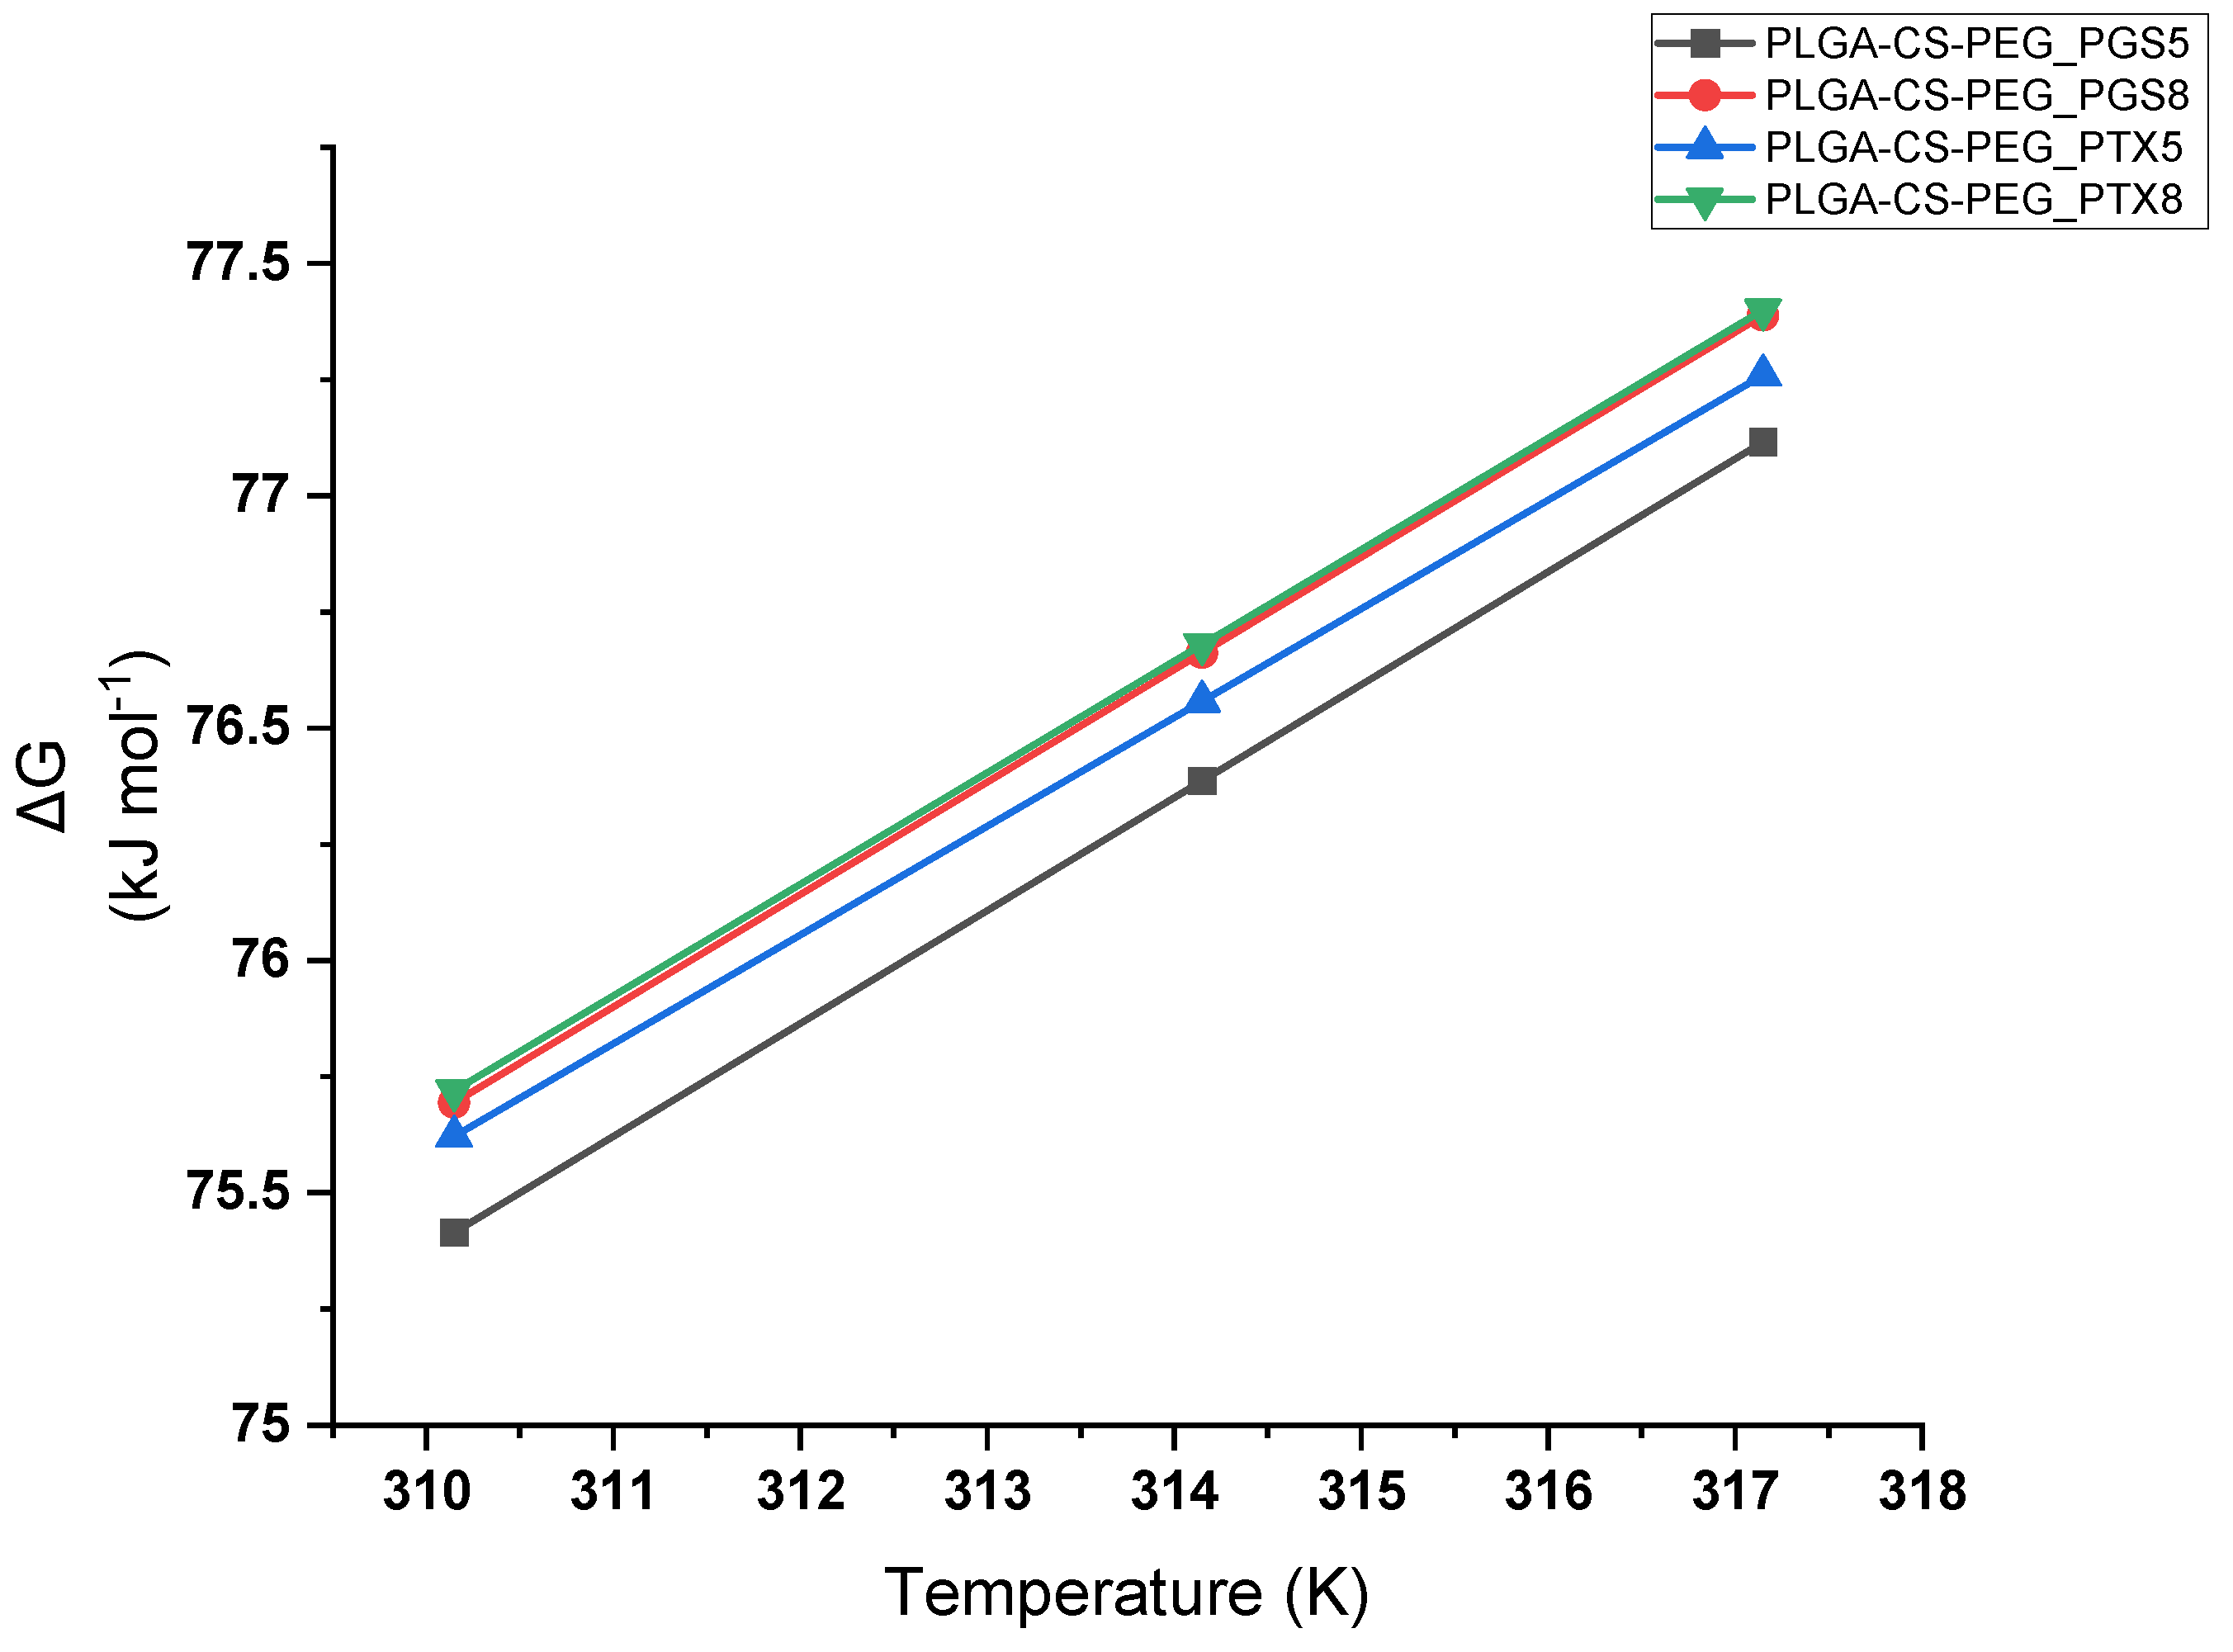
  • The thermodynamic analysis of in vitro drug release from PLGA-CS-PEG microspheres loaded with drugs revealed positive values of ΔG and ΔH, and negative values of ΔS at set temperatures of 37, 41, and 44 °C. This is compatible with endothermic, nonspontaneous, ordered release of anticancer drugs.
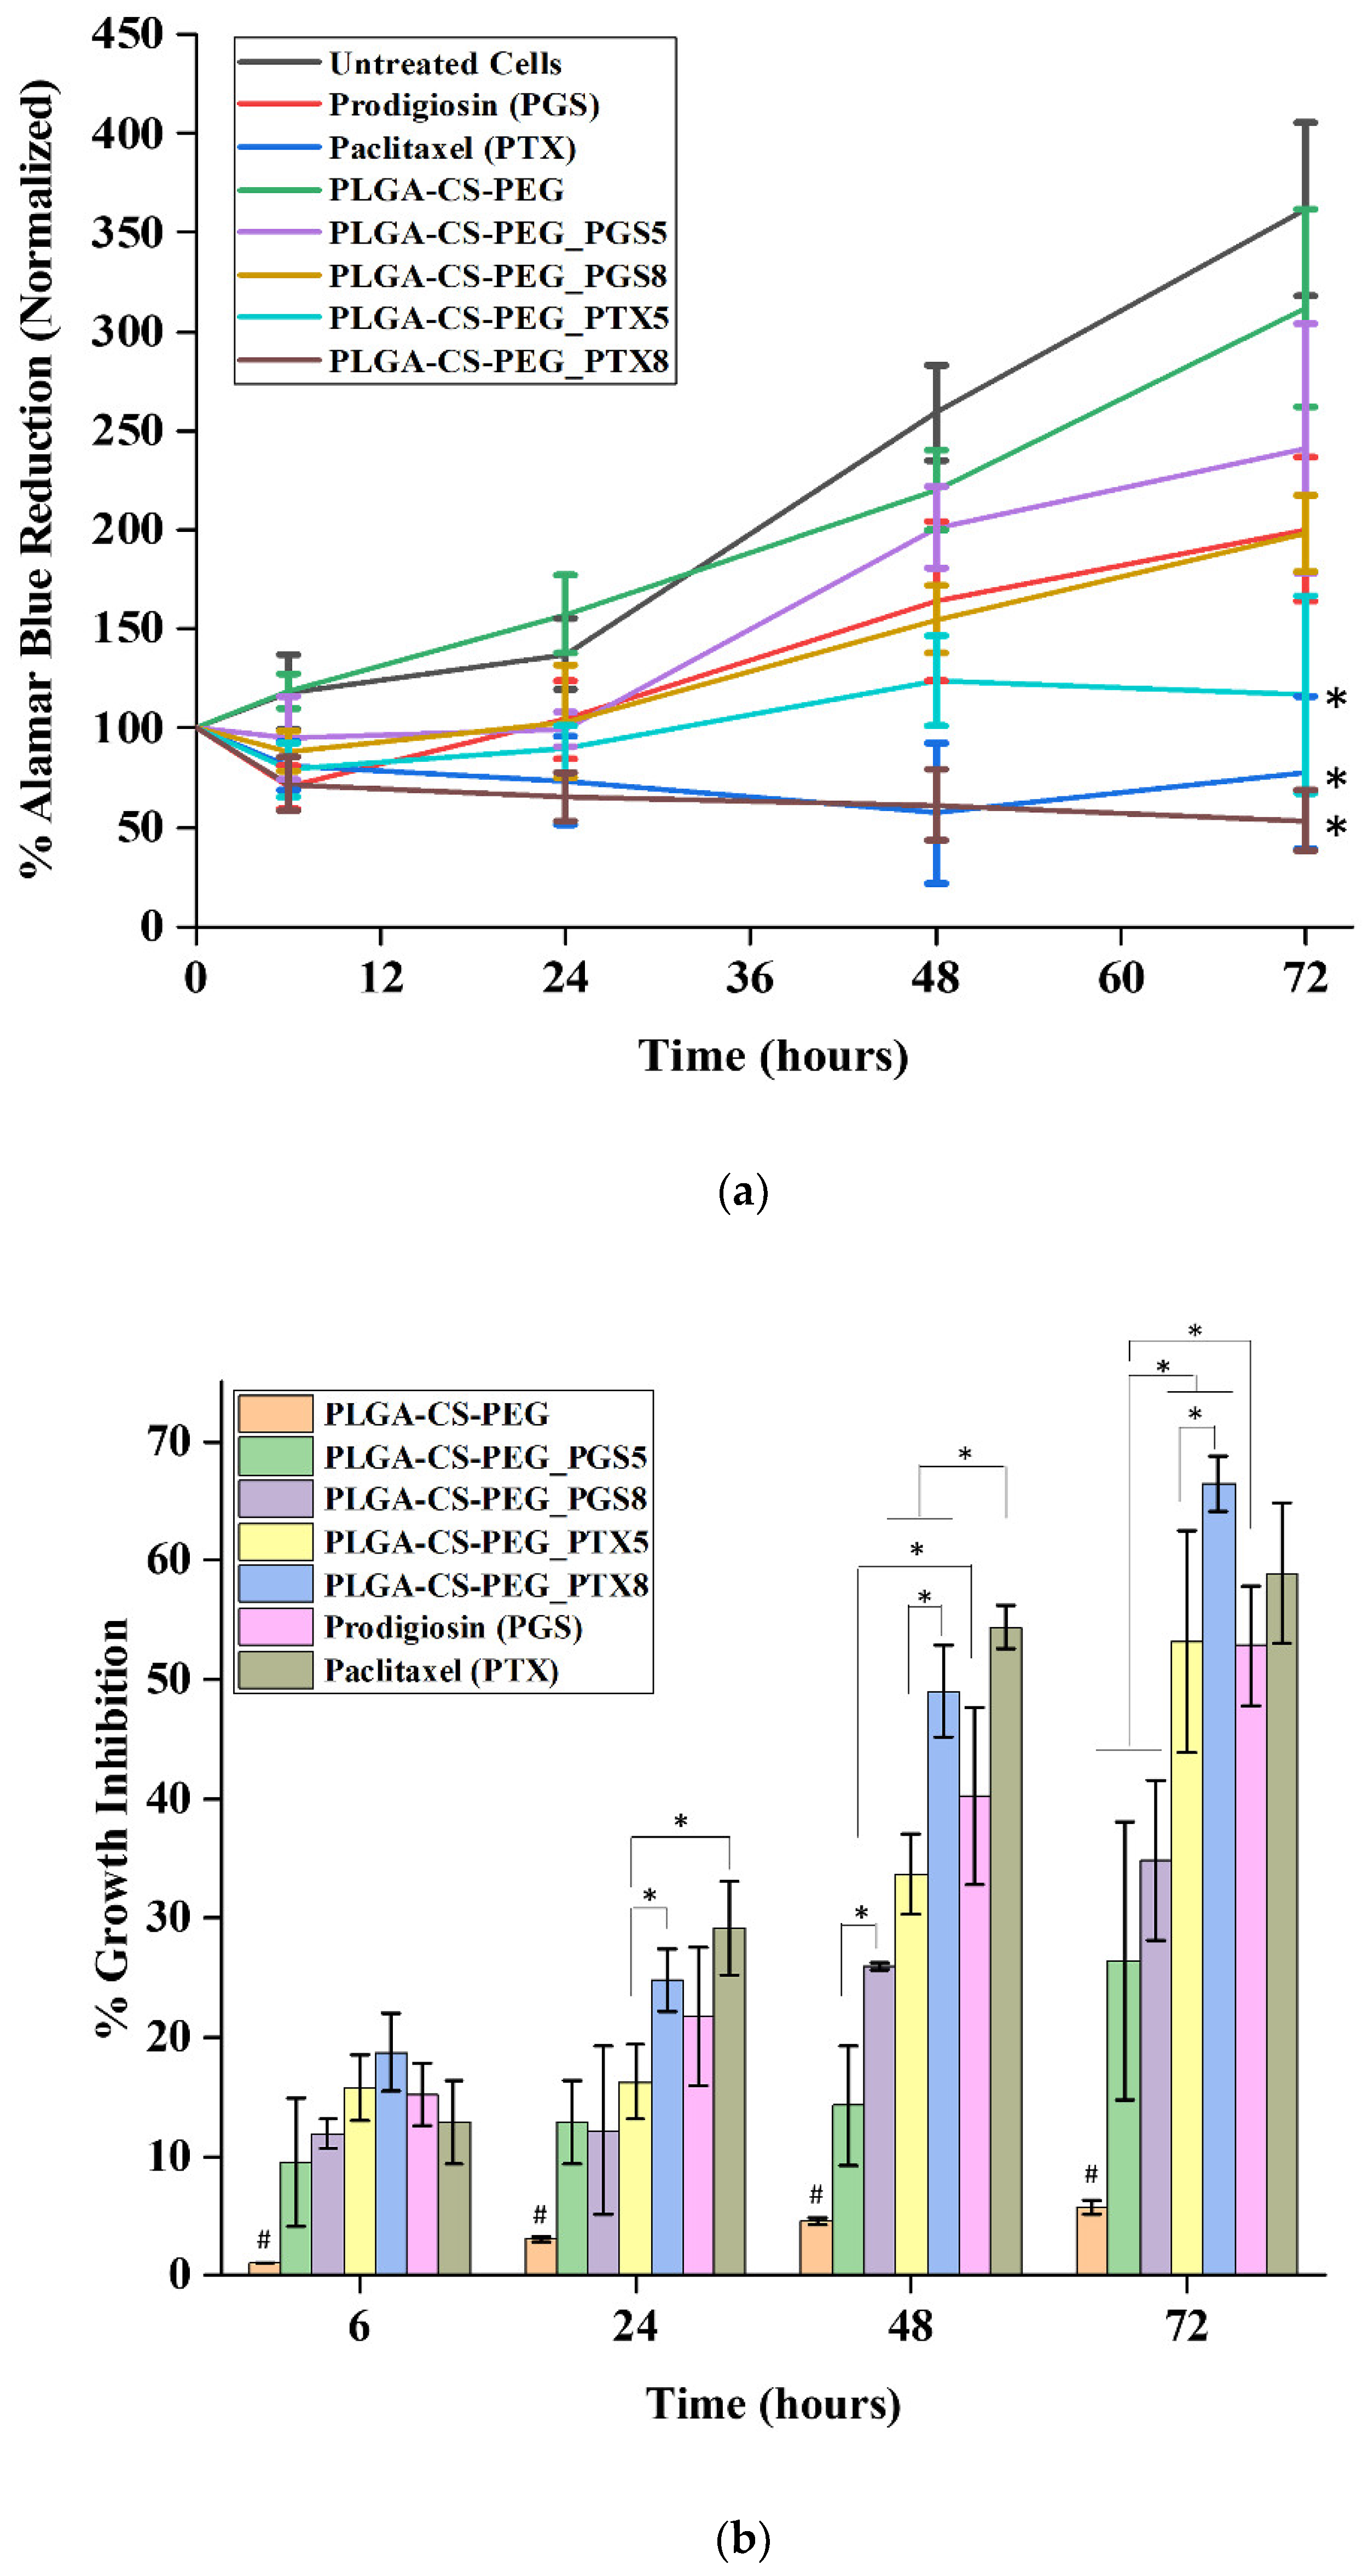
  • Controlled in vitro drug release from cancer drug (paclitaxel and prodigiosin)-loaded PLGA-CS-PEG microspheres reduces the viability of MDA-MB-231 cancer cells.
  • The controlled release of cancer drugs (paclitaxel and prodigiosin) from drug-loaded PLGA-CS-PEG microspheres occurs at slower rates than the controlled release of cancer drugs from PLGA-PEG microspheres during the first 30 days of controlled cancer drug (paclitaxel and prodigiosin) release.
  • Prior to in vivo studies, further work is required to provide more insight into the nonspecific toxicity to noncancer cells. There is also a need for further studies of biodegradability.

Author Contributions

Conceptualization, J.D.O. and W.O.S.; Data curation, S.M.J.; Formal analysis, S.M.J., J.D.O. and A.A.S.; Investigation, S.M.J., J.D.O., C.C.N. and V.O.U.; Methodology, V.O.U.; Supervision, J.D.O., A.A.S., O.S.O. and W.O.S.; Validation, S.M.J., J.D.O., A.A.S. and C.C.N.; Visualization, W.O.S.; Writing—original draft, S.M.J.; Writing—review & editing, J.D.O., A.A.S. and W.O.S. All authors have read and agreed to the published version of the manuscript.

Funding

This research was funded by African Union Commission (Mwalimu Nyerere Scholarship), World Bank African Center of Excellence (ACE) Program through the Pan-African Materials Institute (PAMI) (Grant No. P126974) at the African University of Science and Technology (AUST), Abuja, Federal Capital Territory, Nigeria, and Worcester Polytechnic Institute (WPI), MA, USA.

Institutional Review Board Statement

Not Applicable.

Informed Consent Statement

Not Applicable.

Data Availability Statement

Data is contained within the article.

Conflicts of Interest

The authors declare no conflict of interest.

References

  1. Bray, F.; Ferlay, P.; Soerjomataram, I.; Siegel, R.L.; Torre, L.A.; Jemal, A. 2018 GLOBOCAN stats. CA Cancer J. Clin. 2018, 68, 394–424. [Google Scholar] [CrossRef] [Green Version]
  2. World Health Organization. World Health Organization—Key Facts on Cancer. Available online: https://www.who.int/cancer/resources/keyfacts/en/ (accessed on 9 September 2019).
  3. Boyle, J. Molecular biology of the cell, 5th edition by B. Alberts, A. Johnson, J. Lewis, M. Raff, K. Roberts, and P. Walter. Biochem. Mol. Biol. Educ. 2008, 36, 317–318. [Google Scholar] [CrossRef]
  4. Abbas, Z.; Rehman, S. An Overview of Cancer Treatment Modalities. In Neoplasm; IntechOpen: London, UK, 2018; Volume 1, pp. 139–157. [Google Scholar]
  5. Li, C.; Wang, J.; Wang, Y.; Gao, H.; Wei, G.; Huang, Y.; Yu, H.; Gan, Y.; Wang, Y.; Mei, L.; et al. Recent progress in drug delivery. Acta Pharm. Sin. B 2019, 9, 1145–1162. [Google Scholar] [CrossRef]
  6. Mitra, A.; Dey, B. Chitosan microspheres in novel drug delivery systems. Indian J. Pharm. Sci. 2011, 73, 355. [Google Scholar] [PubMed]
  7. Tyler, B.; Gullotti, D.; Mangraviti, A.; Utsuki, T.; Brem, H. Polylactic acid (PLA) controlled delivery carriers for biomedical applications. Adv. Drug Deliv. Rev. 2016, 107, 163–175. [Google Scholar] [CrossRef]
  8. Gao, N.; Li, X.J. Controlled drug delivery using microfluidic devices. In Microfluidic Devices for Biomedical Applications, 1st ed.; Li, X., Zhou, Y., Eds.; Woodhead Publishing: Sawston, UK, 2013; pp. 167–185e. ISBN 9780857096975. [Google Scholar]
  9. Kumari, A.; Yadav, S.K.; Yadav, S.C. Biodegradable polymeric nanoparticles based drug delivery systems. Colloids Surf. B Biointerfaces 2010, 75, 1–18. [Google Scholar] [CrossRef]
  10. Hans, M.L.; Lowman, A.M. Lowman Biodegradable nanoparticles for drug delivery and targeting. Curr. Opin. Solid State Mater. Sci. 2002, 6, 319–327. [Google Scholar] [CrossRef]
  11. Obayemi, J.D.; Jusu, S.M.; Salifu, A.A.; Ghahremani, S.; Tadesse, M.; Uzonwanne, V.O.; Soboyejo, W.O. Degradable porous drug-loaded polymer scaffolds for localized cancer drug delivery and breast cell/tissue growth. Mater. Sci. Eng. C 2020, 112, 110794. [Google Scholar] [CrossRef]
  12. Jusu, S.M.; Obayemi, J.D.; Salifu, A.A.; Nwazojie, C.C.; Uzonwanne, V.; Odusanya, O.S.; Soboyejo, W.O. Drug-encapsulated blend of PLGA-PEG microspheres: In vitro and in vivo study of the effects of localized/targeted drug delivery on the treatment of triple-negative breast cancer. Sci. Rep. 2020, 10, 14188. [Google Scholar] [CrossRef]
  13. Obayemi, J.D.; Danyuo, Y.; Dozie-Nwachukwu, S.; Odusanya, O.S.; Anuku, N.; Malatesta, K.; Yu, W.; Uhrich, K.E.; Soboyejo, W.O. PLGA-based microparticles loaded with bacterial-synthesized prodigiosin for anticancer drug release: Effects of particle size on drug release kinetics and cell viability. Mater. Sci. Eng. C 2016, 66, 51–65. [Google Scholar] [CrossRef]
  14. Mir, M.; Ahmed, N.; ur Rehman, A. Recent applications of PLGA based nanostructures in drug delivery. Colloids Surf. B Biointerfaces 2017, 159, 217–231. [Google Scholar] [CrossRef]
  15. Fredenberg, S.; Wahlgren, M.; Reslow, M.; Axelsson, A. The mechanisms of drug release in poly(lactic-co-glycolic acid)-based drug delivery systems—A review. Int. J. Pharm. 2011, 415, 34–52. [Google Scholar] [CrossRef] [PubMed]
  16. Kamaly, N.; Yameen, B.; Wu, J.; Farokhzad, O.C. Degradable controlled-release polymers and polymeric nanoparticles: Mechanisms of controlling drug release. Chem. Rev. 2016, 116, 2602–2663. [Google Scholar] [CrossRef] [PubMed] [Green Version]
  17. Khanafari, A.; Assadi, M.M.; Fakhr, F.A. Review of Prodigiosin, Pigmentation in Serratia marcescens. Online J. Biol. Sci. 2006, 6, 1–13. [Google Scholar] [CrossRef]
  18. Pérez-Tomás, R.; Montaner, B.; Llagostera, E.; Soto-Cerrato, V. The prodigiosins, proapoptotic drugs with anticancer properties. Biochem. Pharmacol. 2003, 66, 1447–1452. [Google Scholar] [CrossRef]
  19. Manderville, R.A. Synthesis, proton-affinity and anti-cancer properties of the prodigiosin-group natural products. Curr. Med. Chem. Anticancer Agents 2001, 1, 195–218. [Google Scholar] [CrossRef]
  20. Darshan, N.; Manonmani, H.K. Prodigiosin and its potential applications. J. Food Sci. Technol. 2015, 52, 5393–5407. [Google Scholar] [CrossRef] [Green Version]
  21. Anwar, M.M.; Shalaby, M.; Embaby, A.M.; Saeed, H.; Agwa, M.M.; Hussein, A. Prodigiosin/PU-H71 as a novel potential combined therapy for triple negative breast cancer (TNBC): Preclinical insights. Sci. Rep. 2020, 10, 14706. [Google Scholar] [CrossRef]
  22. Sang, B.H.; Se, H.P.; Young, J.J.; Young, K.K.; Hwan, M.K.; Kyu, H.Y. Prodigiosin blocks T cell activation by inhibiting interleukin-2Rα expression and delays progression of autoimmune diabetes and collagen-induced arthritis. J. Pharmacol. Exp. Ther. 2001, 299, 415–425. [Google Scholar]
  23. Venil, C.K.; Zakaria, Z.A.; Ahmad, W.A. Bacterial pigments and their applications. Process Biochem. 2013, 48, 1065–1079. [Google Scholar] [CrossRef]
  24. Singh, B.; Vishwakarma, R.; Bharate, S. QSAR and Pharmacophore Modeling of Natural and Synthetic Antimalarial Prodiginines. Curr. Comput. Aided-Drug Des. 2013, 9, 350–359. [Google Scholar] [CrossRef] [PubMed]
  25. Ibrahim, D.; Nazari, T.F.; Kassim, J.; Lim, S.H. Prodigiosin—An antibacterial red pigment produced by Serratia marcescens IBRL USM 84 associated with a marine sponge Xestospongia testudinaria. J. Appl. Pharm. Sci. 2014, 4, 1–6. [Google Scholar] [CrossRef]
  26. Wani, M.C.; Taylor, H.L.; Wall, M.E.; Coggon, P.; Mcphail, A.T. Plant Antitumor Agents. VI. The Isolation and Structure of Taxol, a Novel Antileukemic and Antitumor Agent from Taxus brevifolia. J. Am. Chem. Soc. 1971, 93, 2325–2327. [Google Scholar] [CrossRef]
  27. Weaver, B.A. How Taxol/paclitaxel kills cancer cells. Mol. Biol. Cell 2014, 25, 2677–2681. [Google Scholar] [CrossRef]
  28. Renneberg, R. Biotech History: Yew trees, paclitaxel synthesis and fungi. Biotechnol. J. Healthc. Nutr. Technol. 2007, 2, 1207–1209. [Google Scholar] [CrossRef]
  29. Fu, Y.; Kao, W.J. Drug release kinetics and transport mechanisms of non-degradable and degradable polymeric delivery systems. Expert Opin. Drug Deliv. 2010, 7, 429–444. [Google Scholar] [CrossRef]
  30. Dash, S.; Murthy, P.N.; Nath, L.; Chowdhury, P. Kinetic modeling on drug release from controlled drug delivery systems. Acta Pol. Pharm. Drug Res. 2010, 67, 217–223. [Google Scholar]
  31. Freire, M.C.L.C.; Alexandrino, F.; Marcelino, H.R.; Picciani, P.H.d.S.; Silva, K.G.d.H.; Genre, J.; de Oliveira, A.G.; do Egito, E.S.T. Understanding drug release data through thermodynamic analysis. Materials 2017, 10, 651. [Google Scholar] [CrossRef] [Green Version]
  32. Maria, G.; Luta, I. Precautions in using global kinetic and thermodynamic models for characterization of drug release from multivalent supports. Chem. Pap. 2011, 65, 542–552. [Google Scholar] [CrossRef]
  33. Wang, J.; Shi, A.; Agyei, D.; Wang, Q. Formulation of water-in-oil-in-water (W/O/W) emulsions containing trans-resveratrol. RSC Adv. 2017, 7, 35917–35927. [Google Scholar] [CrossRef] [Green Version]
  34. Suphiya Parveen, S.K.S. Long circulating chitosan/PEG blended PLGA nanoparticle for tumor drug delivery. Eur. J. Pharmacol. 2011, 670, 372–383. [Google Scholar] [CrossRef]
  35. Makadia, H.K.; Siegel, S.J. Poly Lactic-co-Glycolic Acid (PLGA) as biodegradable controlled drug delivery carrier. Polymers 2011, 3, 1377–1397. [Google Scholar] [CrossRef]
  36. Katrin, K.; Richard, H.; Dagmar, F.; Schubert, U.S. Poly(ethylene glycol) in Drug Delivery: Pros and Cons as Well as Potential Alternatives. Angew. Chem. Int. Ed. 2010, 49, 6288–6308. [Google Scholar] [CrossRef]
  37. Uhrich, K.E.; Cannizzaro, S.M.; Langer, R.S.; Shakesheff, K.M. Polymeric Systems for Controlled Drug Release. Chem. Rev. 1999, 99, 3181–3198. [Google Scholar] [CrossRef]
  38. Al Rubeaan, K.; Rafiullah, M.; Jayavanth, S. Oral insulin delivery systems using chitosan-based formulation: A review. Expert Opin. Drug Deliv. 2016, 13, 223–237. [Google Scholar] [CrossRef] [PubMed]
  39. Abd-Rabou, A.A.; Ahmed, H.H. CS-PEG decorated PLGA nano-prototype for delivery of bioactive compounds: A novel approach for induction of apoptosis in HepG2 cell line. Adv. Med. Sci. 2017, 62, 357–367. [Google Scholar] [CrossRef] [PubMed]
  40. Kapoor, D.N.; Bhatia, A.; Kaur, R.; Sharma, R.; Kaur, G.; Dhawan, S. PLGA: A unique polymer for drug delivery. Ther. Deliv. 2015, 6, 41–58. [Google Scholar] [CrossRef] [PubMed]
  41. Sadoughi, F.; Mansournia, M.A.; Mirhashemi, S.M. The potential role of chitosan-based nanoparticles as drug delivery systems in pancreatic cancer. IUBMB Life 2020, 72, 872–883. [Google Scholar] [CrossRef] [PubMed]
  42. Kesarwani, P.; Tekade, R.K.; Jain, N.K. Spectrophotometric estimation of paclitaxel. Int. J. Adv. Pharm. Sci. 2011, 2, 29–32. [Google Scholar]
  43. Narasimhan, B.; Mallapragada, S.K.; Peppas, N.A. Release kinetics, data interpretation. Encycl. Control. Drug Deliv. 1999, 2, 921–935. [Google Scholar]
  44. Shaikh, H.K.; Kshirsagar, R.V.; Patil, S.G. Mathematical models for drug release characterization: A review. World J. Pharm. Pharm. Sci. 2015, 4, 324–338. [Google Scholar] [CrossRef]
  45. Higuchi, T. Mechanism of sustained-action medication. Theoretical analysis of rate of release of solid drugs dispersed in solid matrices. J. Pharm. Sci. 1963, 52, 1145–1149. [Google Scholar] [CrossRef]
  46. Bruschi, M.L. Strategies to Modify the Drug Release from Pharmaceutical Systems; Woodhead Publishing: Sawston, UK, 2015; ISBN 9780081001127. [Google Scholar]
  47. Korsmeyer, R.W.; Gurny, R.; Doelker, E.; Buri, P.; Peppas, N.A. Mechanisms of solute release from porous hydrophilic polymers. Int. J. Pharm. 1983, 15, 25–35. [Google Scholar] [CrossRef]
  48. Smith, J.M. Introduction to chemical engineering thermodynamics. J. Chem. Educ. 1950. [Google Scholar] [CrossRef] [Green Version]
  49. Sari, A.; Tuzen, M.; Citak, D.; Soylak, M. Equilibrium, kinetic and thermodynamic studies of adsorption of Pb(II) from aqueous solution onto Turkish kaolinite clay. J. Hazard. Mater. 2007, 149, 283–291. [Google Scholar] [CrossRef]
  50. Obayemi, J.D.; Salifu, A.A.; Eluu, S.C.; Uzonwanne, V.O.; Jusu, S.M.; Nwazojie, C.C.; Onyekanne, C.E.; Ojelabi, O.; Payne, L.; Moore, C.M.; et al. LHRH-Conjugated Drugs as Targeted Therapeutic Agents for the Specific Targeting and Localized Treatment of Triple Negative Breast Cancer. Sci. Rep. 2020, 10, 8212. [Google Scholar] [CrossRef]
  51. Danyuo, Y.; Ani, C.J.; Salifu, A.A.; Obayemi, J.D.; Dozie-Nwachukwu, S.; Obanawu, V.O.; Akpan, U.M.; Odusanya, O.S.; Abade-Abugre, M.; McBagonluri, F.; et al. Anomalous Release Kinetics of Prodigiosin from Poly-N-Isopropyl-Acrylamid based Hydrogels for The Treatment of Triple Negative Breast Cancer. Sci. Rep. 2019, 9, 3862. [Google Scholar] [CrossRef] [Green Version]
  52. Hassani Najafabadi, A.; Abdouss, M.; Faghihi, S. Synthesis and evaluation of PEG-O-chitosan nanoparticles for delivery of poor water soluble drugs: Ibuprofen. Mater. Sci. Eng. C 2014, 41, 91–99. [Google Scholar] [CrossRef]
  53. Sánchez-López, E.; Egea, M.A.; Cano, A.; Espina, M.; Calpena, A.C.; Ettcheto, M.; Camins, A.; Souto, E.B.; Silva, A.M.; García, M.L. PEGylated PLGA nanospheres optimized by design of experiments for ocular administration of dexibuprofen-in vitro, ex vivo and in vivo characterization. Colloids Surf. B Biointerfaces 2016, 147, 241–250. [Google Scholar] [CrossRef] [Green Version]
  54. Jha, M.K.; Rahman, M.H.; Rahman, M.M. Biphasic oral solid drug delivery system: A review. Int. J. Pharm. Sci. Res. 2011, 2, 1108. [Google Scholar]
  55. Yoo, J.; Won, Y.Y. Phenomenology of the Initial Burst Release of Drugs from PLGA Microparticles. ACS Biomater. Sci. Eng. 2020, 6, 6053–6062. [Google Scholar] [CrossRef]
Figure 1. SEM pictures of PLGA-CS-PEG microsphere formulations: (a) PLGA-CS-PEG_PGS5, (b) PLGA-CS-PEG_PGS8, (c) PLGA-CS-PEG, (d) PLGA-CS-PEG_PTX5, and (e) PLGA-PEG_PTX8 microspheres.
Applsci 11 07112 g001
Figure 2. Mean particle size of PLGA-PEG microspheres using Image J Software.
Applsci 11 07112 g002
Figure 3. A representative FTIR spectrum for the respective PLGA-CS-PEG microspheres synthesized.
Applsci 11 07112 g003
Figure 4. In vitro drug release profile of drug-loaded PLGA-CS-PEG microspheres: (a) PLGA-CS-PEG_PGS5, (b) PLGA-CS-PEG_PGS8, (c) PLGA-CS-PEG_PTX5, and (d) PLGA-CS-PEG_PTX8 performed in phosphate-buffered saline (pH = 7.4, 0.01% Tween 80) at set temperatures (37, 41, and 44 °C). In all cases (n = 3, @ p > 0.05). Error bars represent the standard deviation for n = 3.
Applsci 11 07112 g004aApplsci 11 07112 g004bApplsci 11 07112 g004c
Figure 5. A graph of Gibbs free energy vs. temperature for PLGA-CS-PEG microspheres at different temperatures.
Applsci 11 07112 g005
Figure 6. (a) Percentage Alamar blue reduction for untreated MDA-MB-231 cells and MDA-MB-231 cells treated with nonloaded microspheres, PGS, PGS-loaded microspheres, PTX, and PTX-loaded microspheres at 6, 24, 48, and 72 h post treatment. Error bars represent the standard deviation for n = 3; * p < 0.05 (significantly different from untreated cells). (b) A graph of percentage cell growth inhibition vs. time for MDA-MB-231 cells treated with nonloaded microspheres, PGS, PGS-loaded microspheres, PTX, and PTX-loaded microspheres at 6, 24, 48 and 72 h post treatment. Error bars represent the standard deviation for n = 3; * p < 0.05; # p < 0.05 (significantly lower than the others).
Applsci 11 07112 g006
Table 2. Thermodynamic parameters and their respective mathematical expressions.
Serial NumberName of EquationMathematical Expression
1Arrhenius (1st form) K t = D f e E a R T
2Arrhenius (2nd form) l n K t = l n D f E a R × 1 T
3Eyring ln K t T = H R 1 T + ln K B h + Δ S R
4Change in Gibbs free energy G = H T S
Table 3. Parameters for in vitro drug release from PLGA-CS-PEG microspheres as a function of time and temperature. Data are mean ± SD, n = 3.
FormulationsDrug Release Temperature (°C)Percentage Burst Release after 48 hEncapsulation Efficiency (%)Percentage Cumulative Drug Release for 30 Days
PLGA-CS-PEG_PGS53727.290 ± 2.07456.552.117 ± 2.506
PLGA-CS-PEG_PGS54127.290 ± 1.03154.471 ± 1.095
PLGA-CS-PEG_PGS54427.130 ± 1.03159.151 ± 2.084
PLGA-CS-PEG_PGS83728.910 ± 1.08258.562.502 ± 3.412
PLGA-CS-PEG_PGS84123.277 ± 1.23066.700 ± 3.641
PLGA-CS-PEG_PGS84427.872 ± 1.80771.153 ± 3.103
PLGA-CS-PEG_PTX53728.055 ± 1.15757.552.117 ± 1.172
PLGA-CS-PEG_PTX54128.055 ± 1.27056.862 ± 1.329
PLGA-CS-PEG_PTX54434.275 ± 1.23162.300 ± 1.309
PLGA-CS-PEG_PTX83730.400 ± 1.31056.054.728 ± 2.290
PLGA-CS-PEG_PTX84133.323 ± 1.34659.287 ± 1.930
PLGA-CS-PEG_PTX84437.176 ± 1.32062.300 ± 1.300
Table 4. The kinetic constant (K), correlation coefficient (R2) and release exponent (n) of kinetic data analysis of drug released from drug-loaded PLGA-CS-PEG microsphere formulations.
FormulationsTemperature
°C
Zeroth OrderFirst OrderHiguchiKorsmeyer–Peppas
KR2KR2KR2KR2n
PLGA-CS-PEG_PGS5371.1620.5930.0340.4188.0200.7911.2770.8400.462
PLGA-CS-PEG_PGS5411.2950.6110.0370.4388.9020.8091.2790.8600.482
PLGA-CS-PEG_PGS5441.4520.6720.0380.4889.8110.8591.3080.8940.464
PLGA-CS-PEG_PGS8371.1460.5390.0230.4158.0050.7371.1790.9340.542
PLGA-CS-PEG_PGS8411.4380.6240.0290.4869.8280.8171.2660.8390.494
PLGA-CS-PEG_PGS8441.5460.6480.0290.50910.5070.8381.2050.9480.536
PLGA-CS-PEG_PTX5371.1620.5930.0340.4188.0200.7911.2770.8400.462
PLGA-CS-PEG_PTX5411.1620.5870.0270.4818.0590.7911.0650.9000.522
PLGA-CS-PEG_PTX5441.3320.5750.0320.3849.2380.7761.3710.8140.457
PLGA-CS-PEG_PTX8371.1220.6260.0260.5307.6810.8221.0810.9080.488
PLGA-CS-PEG_PTX8411.1690.6010.0250.4898.0530.7991.1260.8840.483
PLGA-CS-PEG_PTX8441.0670.4940.0200.4187.6200.7061.1150.9130.591
Table 5. Values for thermodynamic parameters for PLGA-CS-PEG microspheres.
FormulationsTemperature
°C/K
Ea
(kJ mol−1)
ΔS
(kJ mol−1 K−1)
ΔH
(kJ mol−1)
ΔG
(kJ mol−1)
PLGA-CS-PEG_PGS537/310.152.656−0.2430.05075.415
41/314.1576.387
44/317.1577.116
PLGA-CS-PEG_PGS837/310.153.245−0.2420.63875.694
41/314.1576.662
44/317.1577.388
PLGA-CS-PEG_PTX537/310.155.653−0.2343.04775.622
41/314.1576.558
44/317.1577.260
PLGA-CS--PEG_PTX837/310.153.890−0.2401.28475.720
41/314.1576.680
44/317.1577.400
Publisher’s Note: MDPI stays neutral with regard to jurisdictional claims in published maps and institutional affiliations.

