
MuseStudio: Brain Activity Data Management Library for Low-Cost EEG Devices


Laboratory of User Interaction & Software Engineering (LoUISE), Department of Computing Systems, University of Castilla-La Mancha, 02071 Albacete, Spain
*
Author to whom correspondence should be addressed.
Appl. Sci. 2021, 11(16), 7644; https://0-doi-org.brum.beds.ac.uk/10.3390/app11167644
Submission received: 26 May 2021
/
Revised: 9 July 2021
/
Accepted: 16 August 2021
/
Published: 20 August 2021
(This article belongs to the Special Issue Advances in Neuroimaging Data Processing)
Abstract
:Collecting data allows researchers to store and analyze important information about activities, events, and situations. Gathering this information can also help us make decisions, control processes, and analyze what happens and when it happens. In fact, a scientific investigation is the way scientists use the scientific method to collect the data and evidence that they plan to analyze. Neuroscience and other related activities are set to collect their own big datasets, but to exploit their full potential, we need ways to standardize, integrate, and synthesize diverse types of data. Although the use of low-cost ElectroEncephaloGraphy (EEG) devices has increased, such as those whose price is below 300 USD, their role in neuroscience research activities has not been well supported; there are weaknesses in collecting the data and information. The primary objective of this paper was to describe a tool for data management and visualization, called MuseStudio, for low-cost devices; specifically, our tool is related to the Muse brain-sensing headband, a personal meditation assistant with additional possibilities. MuseStudio was developed in Python following the best practices in data analysis and is fully compatible with the Brain Imaging Data Structure (BIDS), which specifies how brain data must be managed. Our open-source tool can import and export data from Muse devices and allows viewing real-time brain data, and the BIDS exporting capabilities can be successfully validated following the available guidelines. Moreover, these and other functional and nonfunctional features were validated by involving five experts as validators through the DESMET method, and a latency analysis was also performed and discussed. The results of these validation activities were successful at collecting and managing electroencephalogram data.
1. Introduction
Data are crucial elements of all systems that surround us today. Data collection is the process of gathering and measuring information on variables of interest, in an established systematic fashion that enables one to answer stated research questions, test hypotheses, and evaluate outcomes. The data collection component of research is common to all fields of study including physical and social sciences, humanities, business, etc. While methods vary by discipline, the emphasis on ensuring accurate and honest collection remains the same.
Indeed, storing valuable data is beneficial as this enables comparisons between different situations of the same subject, the same situation between different subjects, and a combination of both. As a result, proper treatment provides evidence in the scope of several environments, such as: patient monitoring with automatic health checks; sleep tracking with state detection; student performance analysis and prediction; obtaining a birds-eye view of how people travel, given the difficulties imposed by COVID-19; many other possibilities ruled by the quality of the data acquired.
In particular, the demand for ElectroEncephaloGraphy (EEG) and the devices that allow gathering brain activity has been increasing in the last few years. That interest is expected to keep growing in the future [1]. Medicine, marketing, interaction, and signal processing are some disciplines that require these kinds of products, especially those that feature dry sensors, knowing that some of them are relatively inexpensive.
Regardless of the field of study or preference for defining data (quantitative, qualitative), accurate data collection is essential to maintain the integrity of research. Both the selection of appropriate data collection instruments (existing, modified, or newly developed) and clearly delineated instructions for their correct use reduce the likelihood of errors occurring.
One of the main contributions is the compatibility with the Brain Imaging Data Structure (BIDS) [2] standard, which facilitates research activities related to the use of EEG devices. This standard allows researchers to organize and share the data associated with studies carried out in their laboratories. However, some EEG devices available on the market are not compatible with the BIDS. This issue makes managing recordings, sessions, and users a very difficult and inconvenient task. The majority of low-cost EEG devices have this limitation, and even though they are compatible with proprietary software for brain activity, the features included are limited and not very flexible [3].
In this context, we used a low-cost EEG device, known as Interaxon Muse 2 [4] (Muse and Muse S devices are also compatible). The manufacturer offered an SDK with computer support in the past (which was never compatible with Muse 2 and Muse S). However, it was deprecated, and currently, there is no viable alternative to use the devices in a research or professional environment. This only enables their connection to the original smartphone app, which is limited to guided meditation, and not intended for experiments.
To overcome the imposed limitations, we developed a Python library, called MuseStudio [5], that allows managing brain activity data from users with several sessions, including other helpful characteristics. The main research question that guided the development of this paper is the following: What (internal and external) features should a low-cost EEG library have to manage users’ information while performing different activities? Among the solutions that MuseStudio provides, importing and exporting data stand as key differentiators using Muse. To ensure compatibility with current and future research, we focused on compliance with the best practices in data analysis and sharing [2]. Additionally, the recommendations from the OHBM COBIDAS MEEG committee [6] entirely apply to the introduced library in this paper.
There are multiple scenarios in which MuseStudio is helpful: sharing brain activity data recordings with colleagues thanks to the BIDS standard support; bulk importing other recordings in BIDS format, including raw recordings; converting to MNE format for further noise reduction, signal transformation, and analysis; viewing the experiments taking place in real time with several devices connected at the same time. For instance, a experiment can be performed with multiple Muse 2 devices, connected to a single computer running MuseStudio. Once the recording is finished, it can be converted for feature extraction and exported to share it with peers or attached to a research article for its publication, as it can be imported by anyone interested. Moreover, there is a big community around Muse devices due to its convenience and precision.
The article provides the related work, first. Then, the set of features included in the software with their specific purpose is presented. Afterwards, different examples of use are shown, outlining the results and the aspects of the visualization screen. Lastly, some insights about the necessity of this proposal are given, together with the discussion and the conclusion sections.
2. Background
An electroencephalogram is a data-intensive test that allows detecting abnormalities in brain waves, or the electrical activity of the brain [7]. During the procedure, electrodes consisting of small metal discs with thin wires are pasted onto the scalp. This technology has a wide variety of uses, especially in the emotion recognition domain, as the results of these articles showed [8,9].
Due to the previously annotated increasing demand of EEG devices, the number of available devices is on the rise, and they have many different characteristics [3,10,11]. Moreover, these devices are not only present in the research environment [12,13,14,15,16,17], but also in the entertainment one [18,19,20]. A recent article [21] analyzed the number of electrodes included in devices depending on their design. The authors concluded that the availability of more or less electrodes depends on the final application in which the device will be used. However, in these scenarios, the number of sensors is not the only key factor: data collection and software for supporting them are other relevant factors for success.
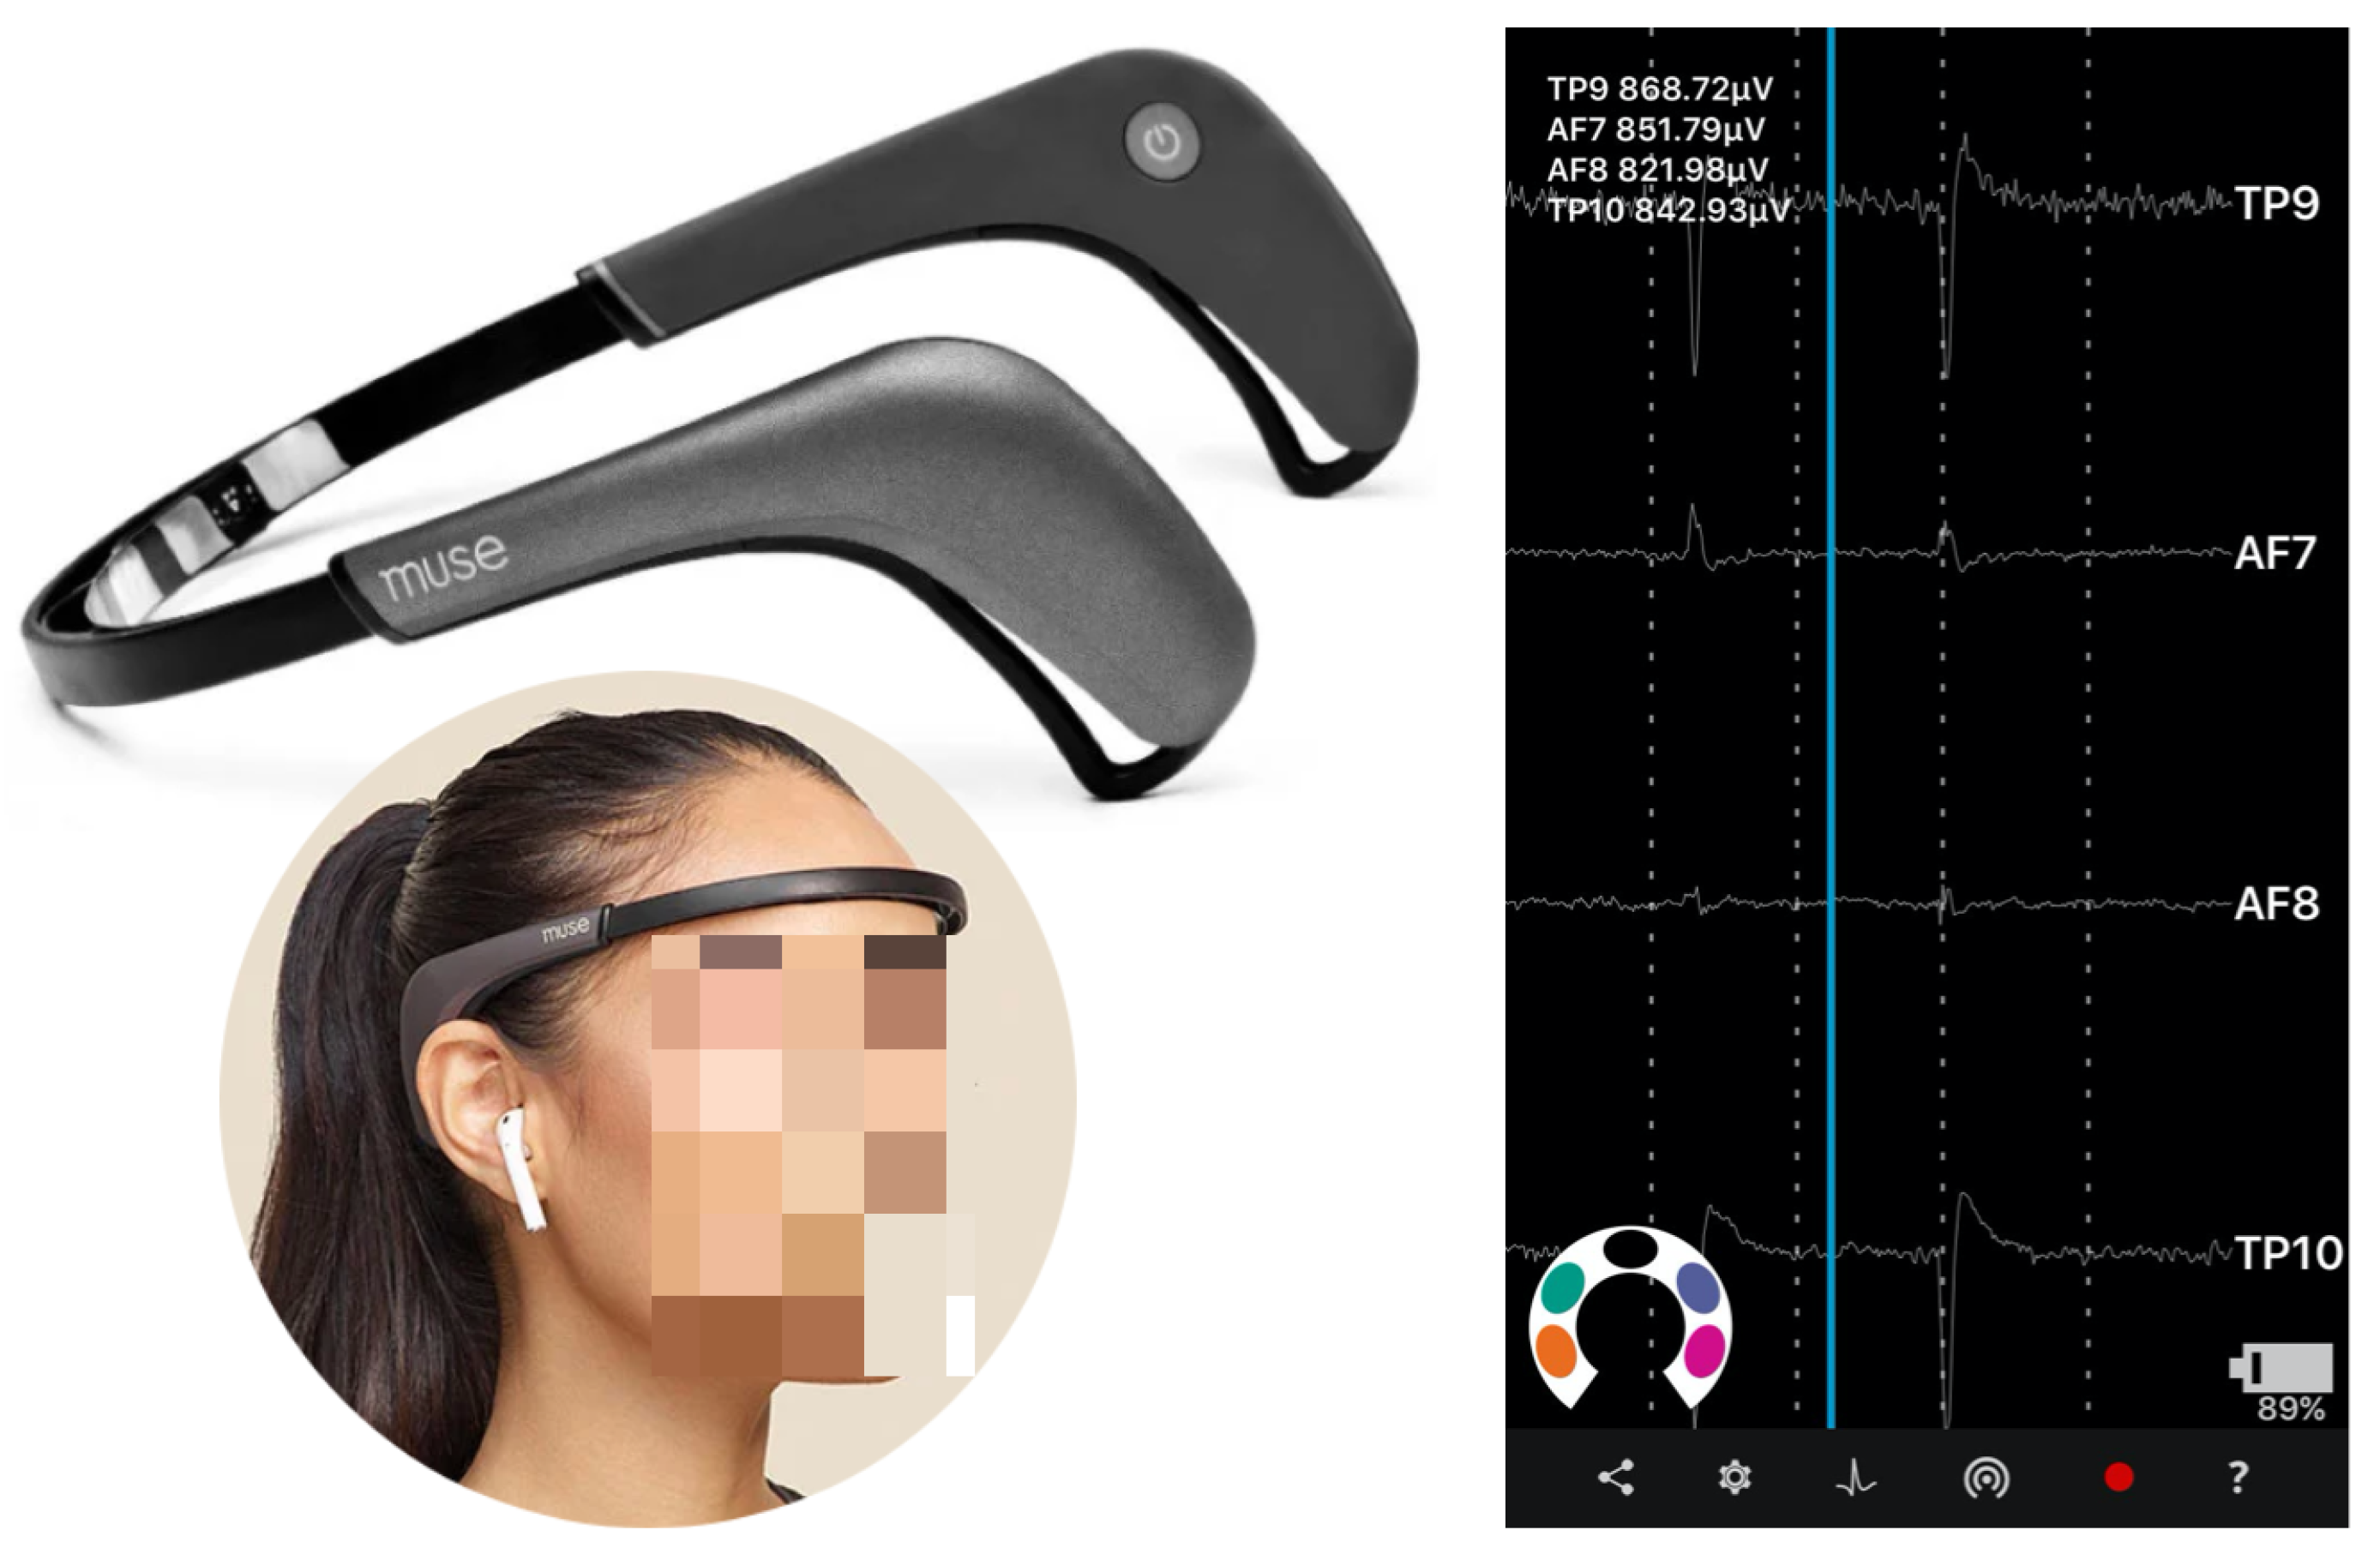
In our case, we focused on low-cost EEG devices [10,22,23]. The price requirement results in the number of electrodes being reduced, and then, the device has less capabilities depending on the field in which it is deployed [21]. Considering that there are still plenty of applications that can be explored and relate to meditation, relaxation, concentration, stress, and anxiety, many therapeutic and entertainment activities can be approached. In this research, Muse 2 was chosen among other viable alternatives. It features a sampling rate of 256 Hz for EEG concurrent signals, four dry capturing electrodes, plus frontal reference channels, an accelerometer, a gyroscope, a PhotoPlethysmoGraphy (PPG) sensor, a built-in battery, and Bluetooth. Following the 10-20 standard system, the device locates its sensors at AF7, AF8, TP9, and TP10.
Muse has been validated as a device for conducting Event-Related Potential (ERP) research [24]. This device has been compared with other wearable sensors resulting in high performance in the fields of ease of integration and applied usability [25]. In addition, many other studies have used Muse for several purposes, including brain wave activity detection during training [26], enjoyment evaluation [27], accelerometer measurement of head movement during surgery [28], and concentration and stress measurement during surgery [29].
In addition to the inherent hardware limitations of the devices, the software restrictions in terms of applications, software development kits, and application programming interfaces should be considered as well [3]. The great majority of software provided by manufacturers cannot manage activities, record sessions, and provide remote real-time visualization while participants are being evaluated. These issues are important limitations in supporting scientific activities. The community of users and researchers of, for instance, Muse products cannot perform data management for several sessions and different users and, later, analyze these data. The traditional manner of making evaluations with Muse is shown in Figure 1. To overcome some of these issues, MuseStudio allows storing data in a structured manner and sharing them.
Specifically, Muse does not include brain data management software, nor real-time visualization, nor recording, so one cannot make use of its potential features. Our solution provides a Python library that allows working with those functionalities, even with several devices and places at the same time.
2.1. Connection with Muse Devices
In order to connect Muse with a computer using Bluetooth, there exist two applications that use Lab Streaming Layer (LSL) to transmit data. While MUSE-LSL [30] connects to one Muse, BlueMuse (https://github.com/kowalej/BlueMuse, accessed on 17 November 2020) can stream data from multiple Muse devices at the same time. However, note that the multidevice capabilities rely on the capacity of the receiving Bluetooth adapter. The data can be further recorded in files with LabRecorder (https://github.com/labstreaminglayer/App-LabRecorder, accessed on 30 November 2020), which can store data from several Muse devices in a single eXtensible Data Format (XDF) file.
As an alternative, there is a hardware-based framework [31] that measures EEG data obtained from 10 or more people using the Muse headband and allows acquiring EEG data at up to a 1 kHz frequency from up to 20 people simultaneously. However, in this hardware proposal, EEG data management cannot be provided, and it is only a graphical visualization tool.
The developed library requires some specific Python packages to work with the data, which are outlined in the repository. Additionally, it is compatible with other software applications that extend its functionality. The library has two main starting points: recordings already stored and live visualization of EEG data. The former requires files in XDF (https://github.com/sccn/xdf, accessed on 5 November 2020), which is a container specifically designed to include multichannel time series data with associated meta information. It can handle multiple types of data, including EEG. The latter adds compatibility with LSL (https://github.com/sccn/labstreaminglayer, accessed on 5 November 2020), which allows sending and receiving data in research experiments through the network. In addition, it features time synchronization and real-time data access in a structured manner. LSL can send several channels at the same time through the same stream, which ensures synchronization even at the channel level. As described previously, Muse has different kinds of data, including EEG, PPG, accelerometer, and gyroscope data. Those sensors do not function at the same sampling frequency, so they must be separated into different streams because of this incompatibility. The sampling frequencies are: 256 Hz for EEG, 64 Hz for PPG, 50 Hz for the accelerometer, and 50 Hz for the gyroscope. For this reason, the channels of the same type are sent in the form of a container with the captured data for a particular sample, but different types are sent over distinct containers. Four streams or containers are expected for a standard experiment with three channels in each of them, except for EEG, which contains four due to the four channels available. In general, equally sampled data are always sent in the same package.
2.2. Raw Data Import
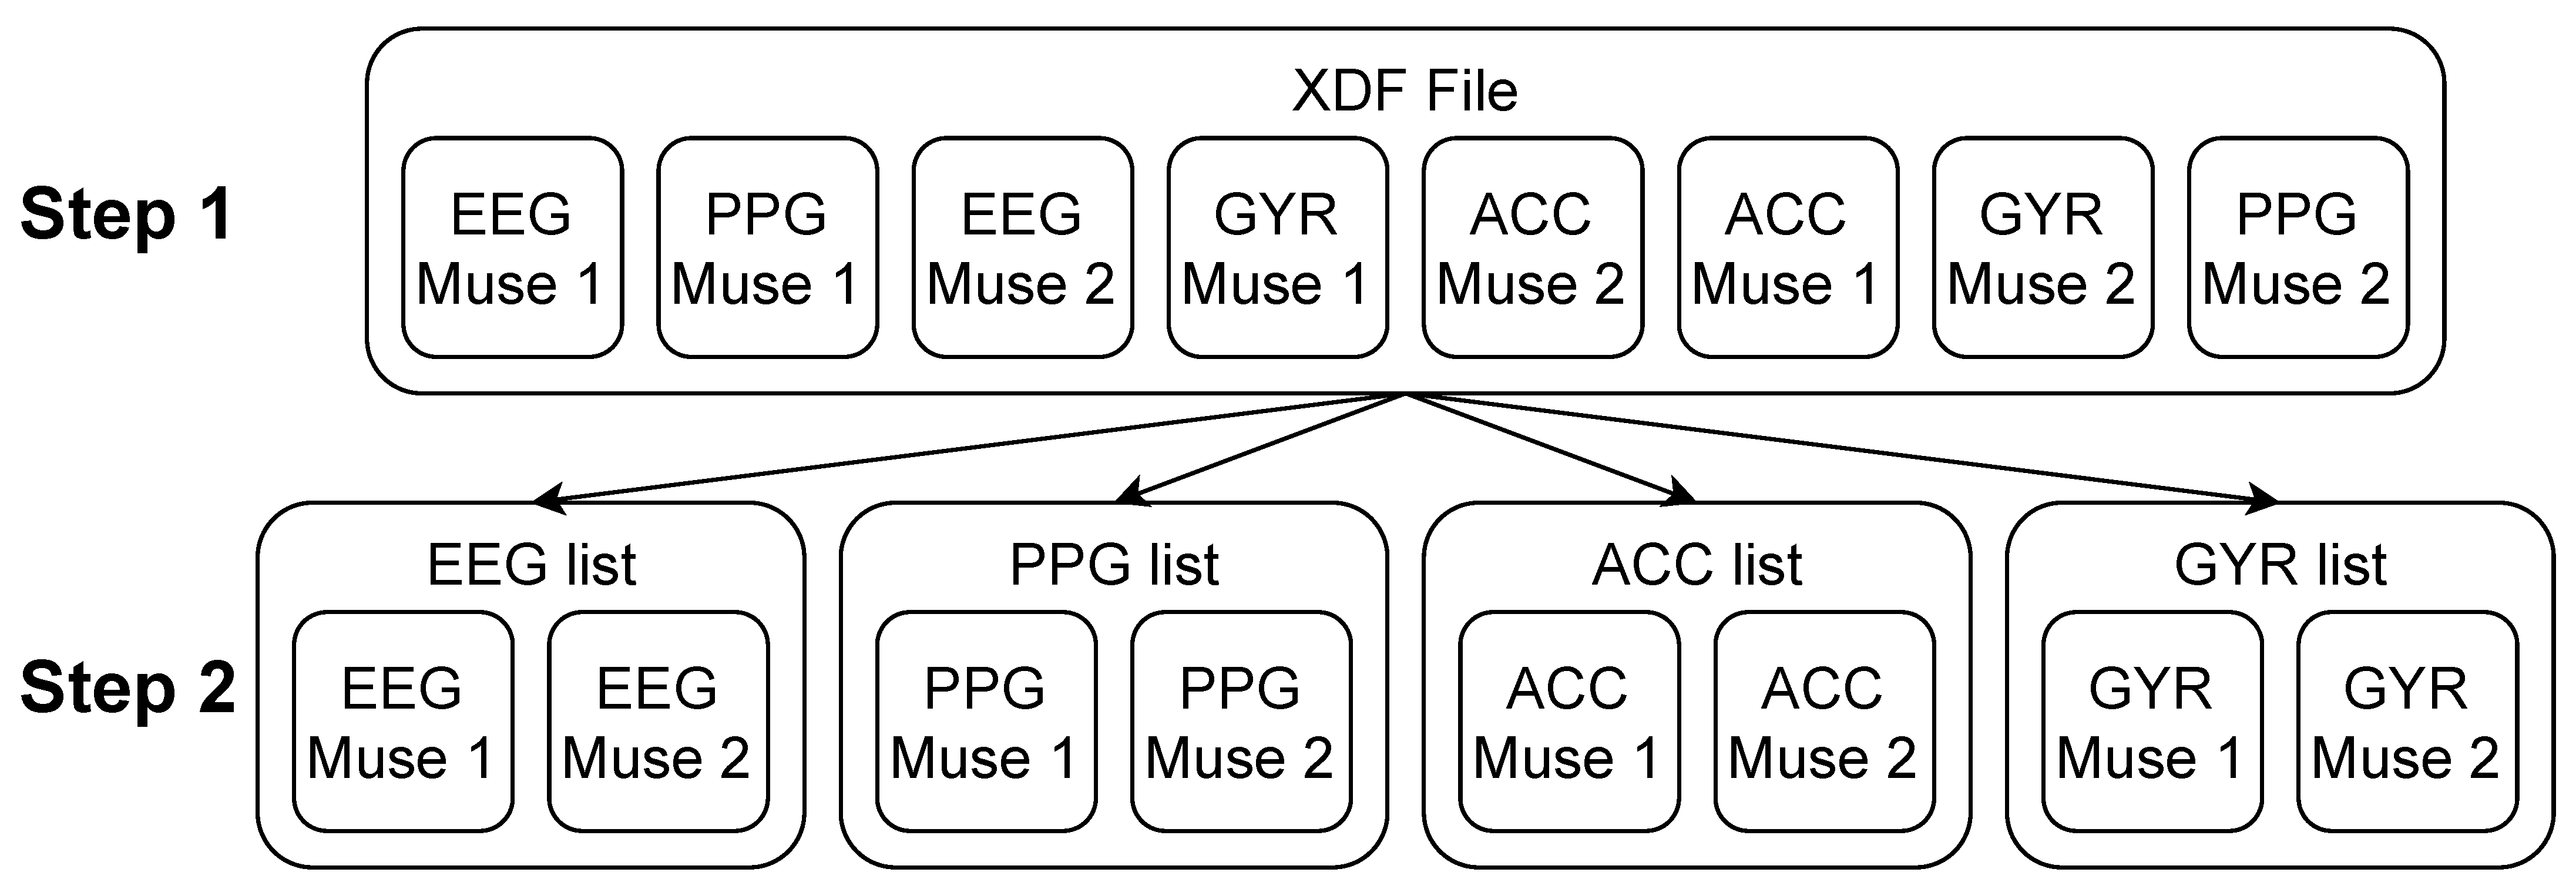
MuseStudio facilitates the data import process from raw XDF files. Those can contain EEG, PPG, accelerometer, and gyroscope recordings from multiple Muses at the same time. That adds processing complexity because the captured data are not properly organized at recording time. The separation of recordings into different containers causes the reception of disordered data at the stream-type level. For instance, EEG and PPG may not be received in such an order, but it is ensured that channels inside those streams are correctly ordered and ready to use afterwards. For this reason, the library seeks the metadata of every channel to rearrange them into different sets of recordings, which can be further used accordingly. Figure 2 shows an example of a file containing the recording of two Muses (Step 1), which were used in a experiment simultaneously. The library then converts the file into four independent lists with the same length as the number of devices used (Step 2). Those lists already contain the information of the device used in each recording.
Additionally, there is compatibility for importing all the XDF files located inside a particular folder. In such a case, the output remains the same, being four lists with a length that is equivalent to the sum of all the recordings inside all the files. Moreover, the library provides flexibility to researchers using Muse and Python because the data import approach only returns the lists without any other manipulation, so they can start working with native data.
2.3. Convert Data
Apart from being able to work with lists, there are two packages that are relevant exponents in their respective fields:
For researchers, being able to work with those packages is critical. This is especially relevant with MNE, because it is the most viable alternative when operating with EEG data. However, the package does not provide any kind of support for Muse, nor its native file formats. As a result, we provided a native implementation in MuseStudio that brings full interoperability for both packages.
Converting data into MNE format requires some considerations. In general, the conversion includes information about the sensor coordinates, the physiological coordinates of the study participants, the powerline frequency (which depends on the region, 50 Hz or 60 Hz), the data in volts, the channels’ names, the associated annotations, and the type of data. In this case, only EEG data were considered because MNE does not work with PPG, accelerometer, and gyroscope data. The result of the transformation is an array of RawArray objects with the same order as the list obtained in the previous stage. Those objects can be iterated to perform the analysis in any research study.
The outcome of the conversion to Pandas is a list with several data frames that can be used for analysis using data science techniques. A single data frame has the following columns: timestamp, AF7, AF8, TP9, TP10, X_acc, Y_acc, Z_acc, X_gyr, Y_gyr, Z_gyr, 1_ppg, 2_ppg, 3_ppg. These correspond to all the streams provided by Muse. The differences between the sampling frequencies of the streams result in blank fields in rows.
2.4. BIDS Format Import and Export
MuseStudio, in order to support the data management of brain activity with Muse products, must consider data structural mechanisms. These mechanisms are inspired by the standard Brain Imaging Data Structure (BIDS) [2]. The addition of the BIDS support allows sharing Muse recordings with other researchers, even if they do not have the set of tools required to work with the device. The library, with the support of MNE-BIDS [34], manages all the necessary information to save the configuration data that the BIDS requires according to its specification. With that aim, two structures were defined, setup and participants, which are available in Appendix A. These are lists of dictionaries, so that every recording has a corresponding dictionary with its particular details.
The setup structure includes this information: the name of the subject; the session and run numbers; the acquisition parameters; the task performed; the processing label; the name of the recording; the coordinate space; the split of the continuous recording; the file name suffix and extension; the root path of the files. In the following examples, all the fields were simplified to None, but they should be modified accordingly.
The BIDS also requires a participants’ file with the details of every member of the research study. The structure presented contains the information about the name of the subject (which must coincide with those in the setup), the age, the sex, the dominant hand, and root directory path. This file is an explicit recommendation of the BIDS specification [35], which suggests its addition in the root path of the main recordings directory.
The purpose of this configuration is to simplify how recordings are exported and imported. In addition, it allows knowing the characteristics of the experiments and the participants rapidly. When sharing one or more recordings, a researcher would only share the BIDS-formatted directory and the two updated lists described above. Using the designed method, no ambiguity is possible. Lastly, the creation of two structures, which are related thanks to the “subject” field (that is unique), avoids the repetition of information. A participant can have several recordings, but it is still the same participant. Therefore, his/her details must be added to the participants’ structure only once, while the setup structure can hold several recordings.
2.5. Real-Time Remote View
Performing neural experiments usually requires real-time visualization of the brain signals captured. With time-based graphs, it is possible to detect how good the data received from the electrodes are, due to the fact that they may not have full contact with the skin and produce extra noise. Muse, with four electrodes, is especially vulnerable to this issue because one bad sensor can invalidate a full recording. The current available solution [30] only shows real-time visualization for one device at a time. Moreover, it only works on the same computer to which Muse is connected. This problem narrows down the flexibility when researchers want to perform experiments with multiple devices at once. The MuseStudio library provides access to real-time graphs no matter the number of devices attached. Additionally, it shows when the contact of the sensors with the skin is good for each of them independently.
Globalization has broken many barriers, and healthcare is one of them. Telemedicine [36] is increasingly being adopted for receiving medical treatment at a distance. In fact, patients who receive palliative care by telemedicine are very satisfied with the results. For this reason, we want everyone to be able to access neuroevaluations anywhere in the world without need to travel long distances to reach experts.
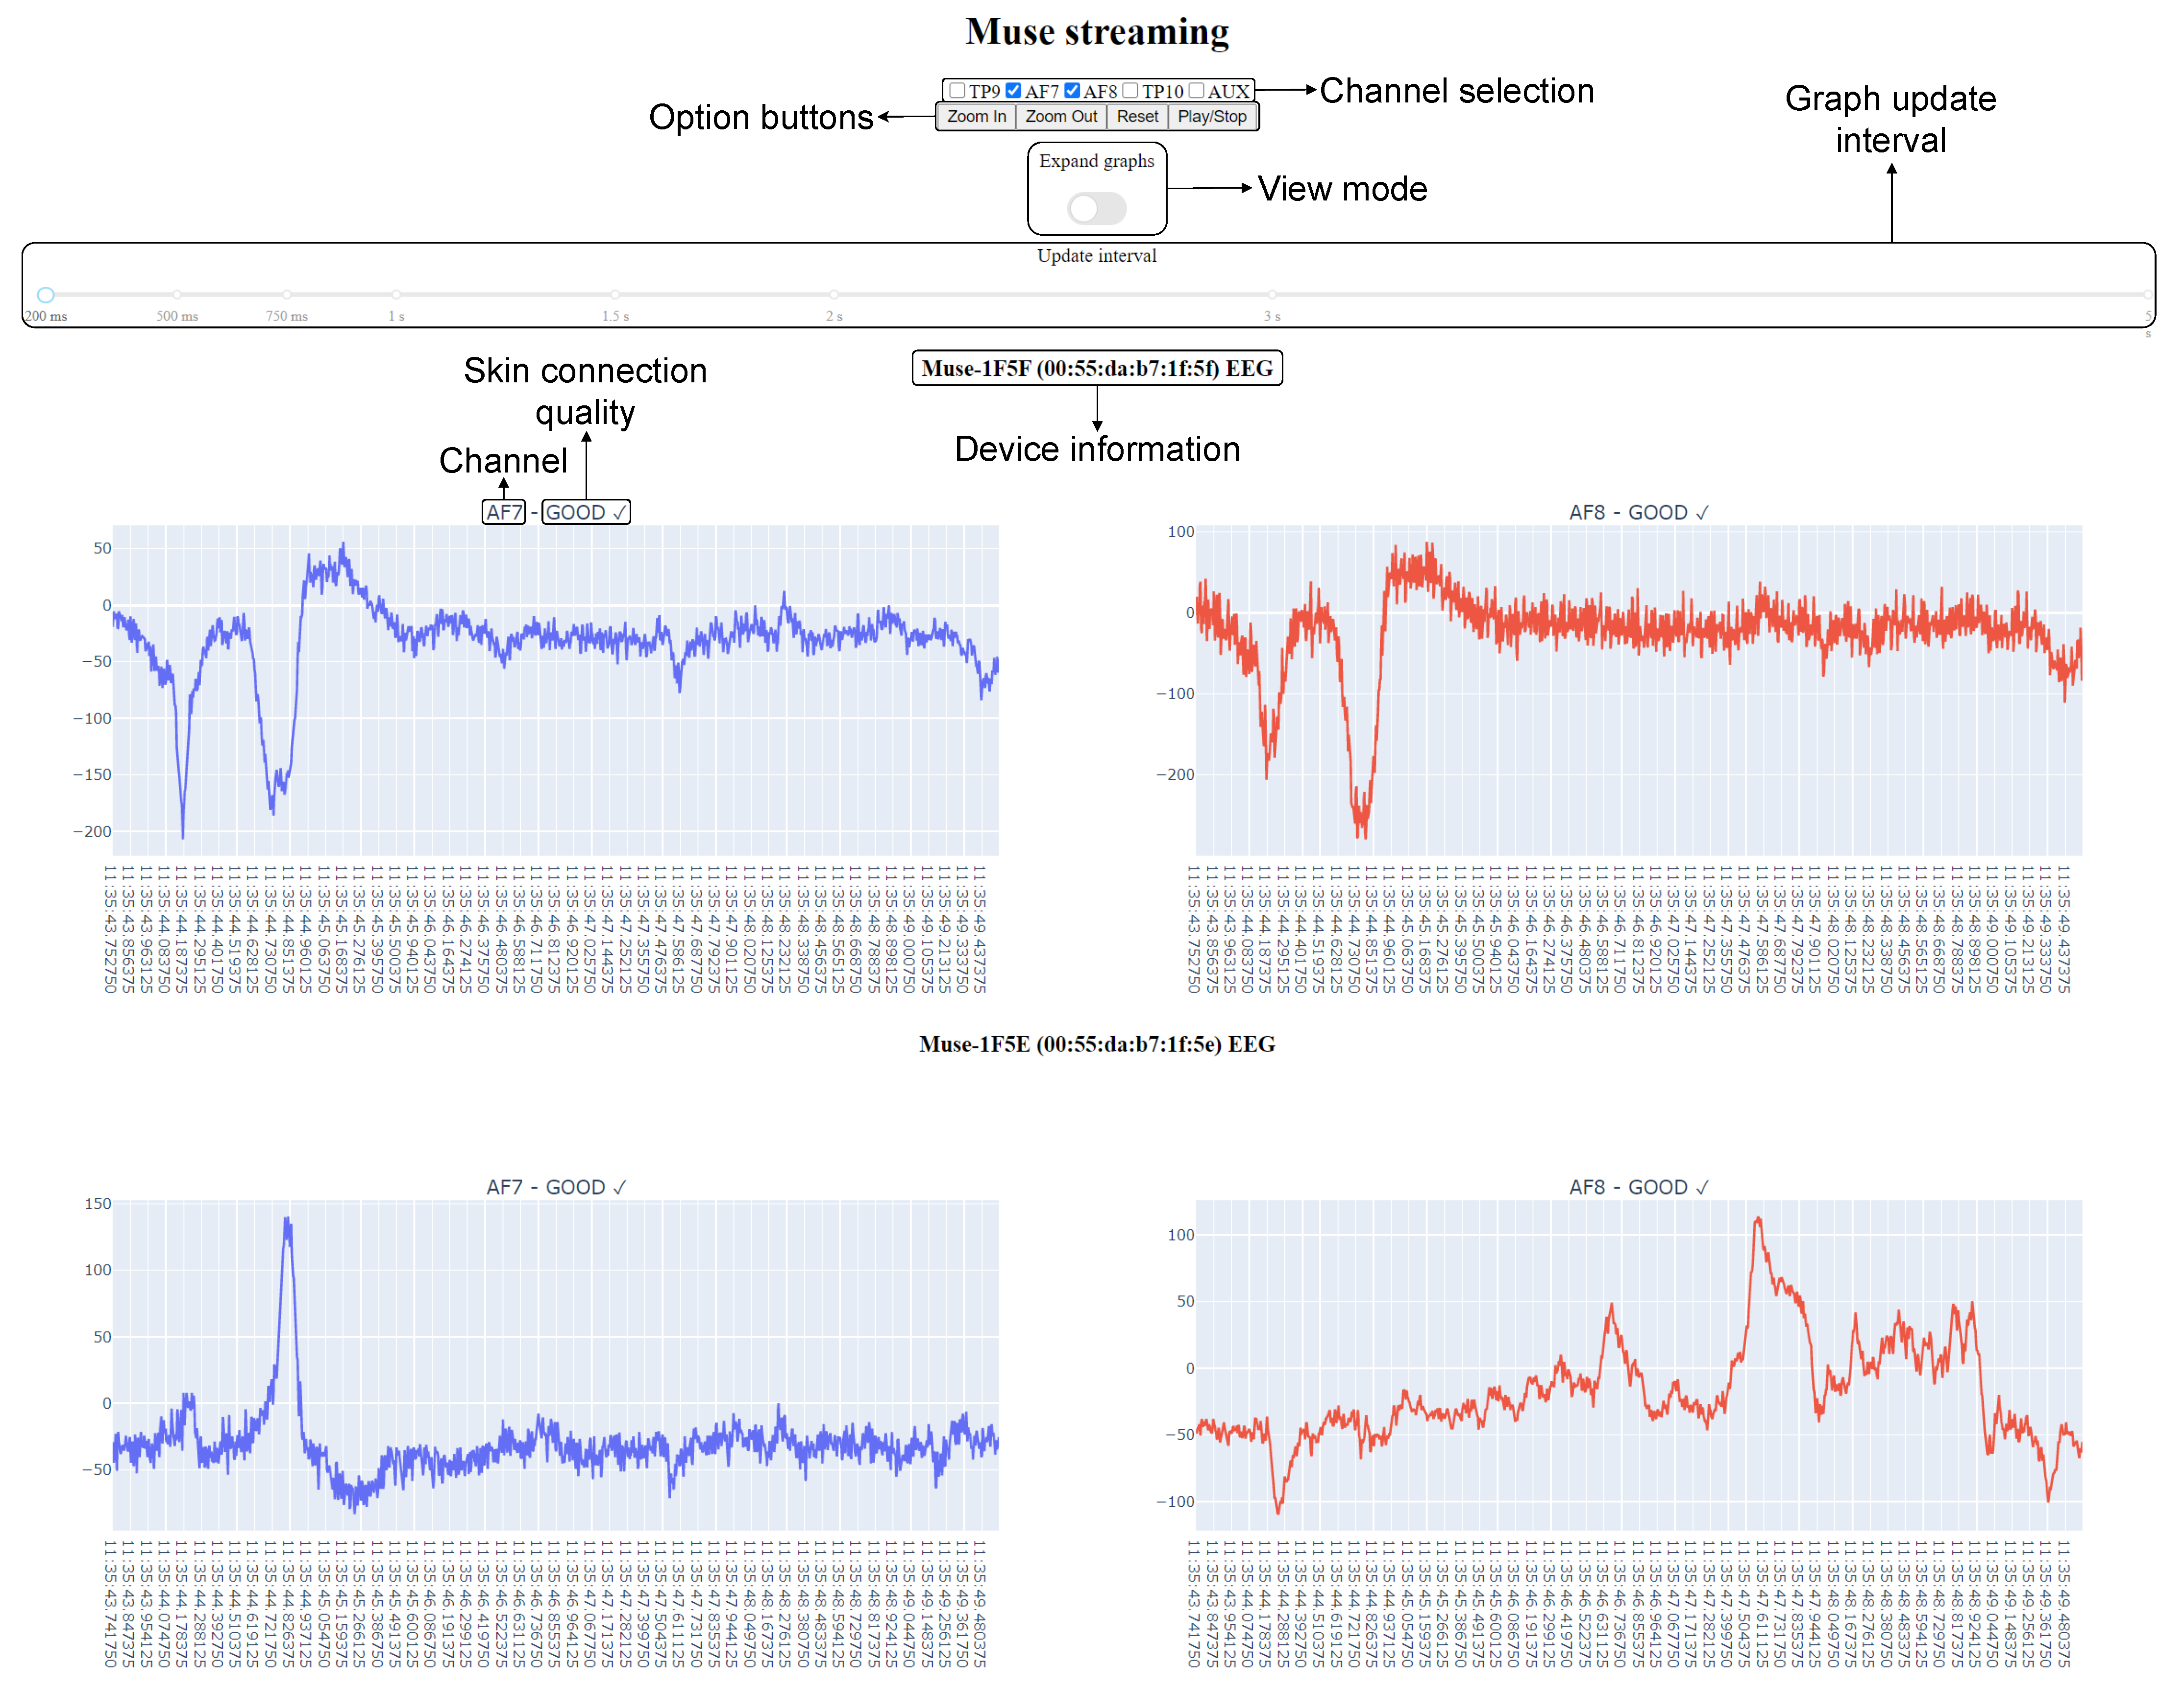
Instead of creating a local instance of a program, we created a web server with an IP address and a port that users can access through a web browser. This allows many users to be connected to the same endpoint, even if they are located outside the local area network. However, as a prerequisite, the server port must be connected to the Internet for external access. The implementation can be used straight away without authentication, and it is modular, so it can be integrated with other Python environments without adaptation, such as a website with a log-in required. The web browser must have JavaScript enabled to show the graphs. Finally, the complete set of options added is: sensor selection, update interval (from 200 ms to 5 s), play/pause, zoom in/out, and expand graphs.
3. Method
This section identifies and describes the internal characteristics of the MuseStudio library [5] available at https://github.com/miguelascifo/MuseStudio, accessed on 26 February 2021, which can be installed through the Python pip package manager (https://pypi.org/project/musestudio/, accessed on 3 March 2021) as well. The main internal requirements derived from the functionality of MuseStudio are presented in this section, including raw data importation and real-time data visualization. Raw data importation involves two activities: data conversion and data organization with the BIDS. All these activities are described below.
3.1. Data Conversion
MuseStudio can import from XDF files to work with Python arrays. There are two methods created for importing recordings, and both return the same data. The method read_raw_xdf handles one file, and read_raw_xdf_dir handles a directory with several XDF files. The following code shows an example of the latter:
where stream_eeg, stream_acc, stream_ppg, stream_gyr, and filenames are lists containing the data for EEG, the accelerometer, PPG, the gyroscope, and the file names of all recordings, respectively.
| stream_eeg, stream_acc, stream_ppg, stream_gyr, filenames = read_raw_xdf_dir("/path/to/directory") |
Once the data are imported using the methods exposed by the library, they can be converted into the MNE RawArray and Pandas data frame. One key difference between them is that MNE provides a powerful set of tools for EEG streams, but does not support the rest. For that reason, all data can be manipulated through data frames. Again, one method is necessary for the conversion:
where eegstream is the list of EEG data previously imported, line_freq the powerline frequency of the region (50 for Europe), and filenames the list of file names imported. The three following lists correspond to the nasion fiducial point (nasion), the left periauricular fiducial point (lpa), and the right periauricular fiducial point (rpa). Those indicate a precise reference for the EEG sensors’ position on the head [37].
| raw = to_mne_eeg(eegstream = stream_eeg, line_freq = 50, filenames = filenames, nasion = [0,0,0], |
| lpa = [0,0,0], rpa = [0,0,0]) |
The conversion to the Pandas data frame gives the flexibility to import only the streams in which the researcher is interested. This example of usage includes all the streams at once:
the parameters being those variables that were already described. The resulting data frame contains blank spaces (Pandas NotaNumber data types) between rows in the last three columns. That happens because the sampling rates are different, as explained previously.
| df = to_df(mne_eeg = raw, eegstream = stream_eeg, accstream = stream_acc, ppgstream = stream_ppg, |
| gyrstream = stream_gyr) |
3.2. Working with the BIDS Specification
The BIDS specification establishes the directory structure to standardize how researchers store and share EEG recordings. The huge advantages make using it useful for working in a collaborative environment. To simplify the process, we created the setup structure. In order to export recordings, the BIDS file name paths are necessary, which is the information of the type BIDSPath object. Afterwards, the paths of the recordings included in setup are returned. Then, the first step is to execute the appropriate method provided for such a task:
| bids_paths = create_bids_path(setup = setup) |
After that, there is another method that uses those paths together with other parameters to finally export the recordings in the BIDS format. This example uses the participants structure to specify the characteristics of the subjects and the list of BIDSPath objects:
| export_bids(raweeg = raw, bids_paths = bids, participants = participants, overwrite = False, |
| verbose = False) |
With that process, the recordings are exported to the directory indicated in the “root” field inside setup. In contrast, importing from the BIDS requires executing one method with a single parameter, which is setup. It returns the list of RawArray objects and the list of BIDSPath objects for the recordings in setup:
| raw, bids_paths = import_bids(setup = setup) |
With the solution proposed, anyone can import directly into MNE to start working with Muse as if it were any other more advanced device, provided that other researchers have exported the recordings previously.
3.3. Signal Visualization
Performing experiments with EEG can be very complex due to the difficulty of creating high-quality recordings. One of the main issues, apart from the design of the experiment itself, is measuring how well the data were captured. Electrodes inside devices are very sensitive to electromagnetic noise, so ensuring good skin contact is critical to avoid inconsistent results across recordings. For this reason, the library includes the necessary features to enable researchers to watch the signals of several devices in real time.
Sometimes, experiments are not run by medical experts, which is especially the case for low-cost devices. Therefore, we ensured that anyone can have access to the data while participants are being evaluated. The web server is started from the machine to which the devices are connected and returns to the console the internal IP address, together with the associated port. The process was simplified as two methods:
| start_streaming(search_streams(), debug=True) |
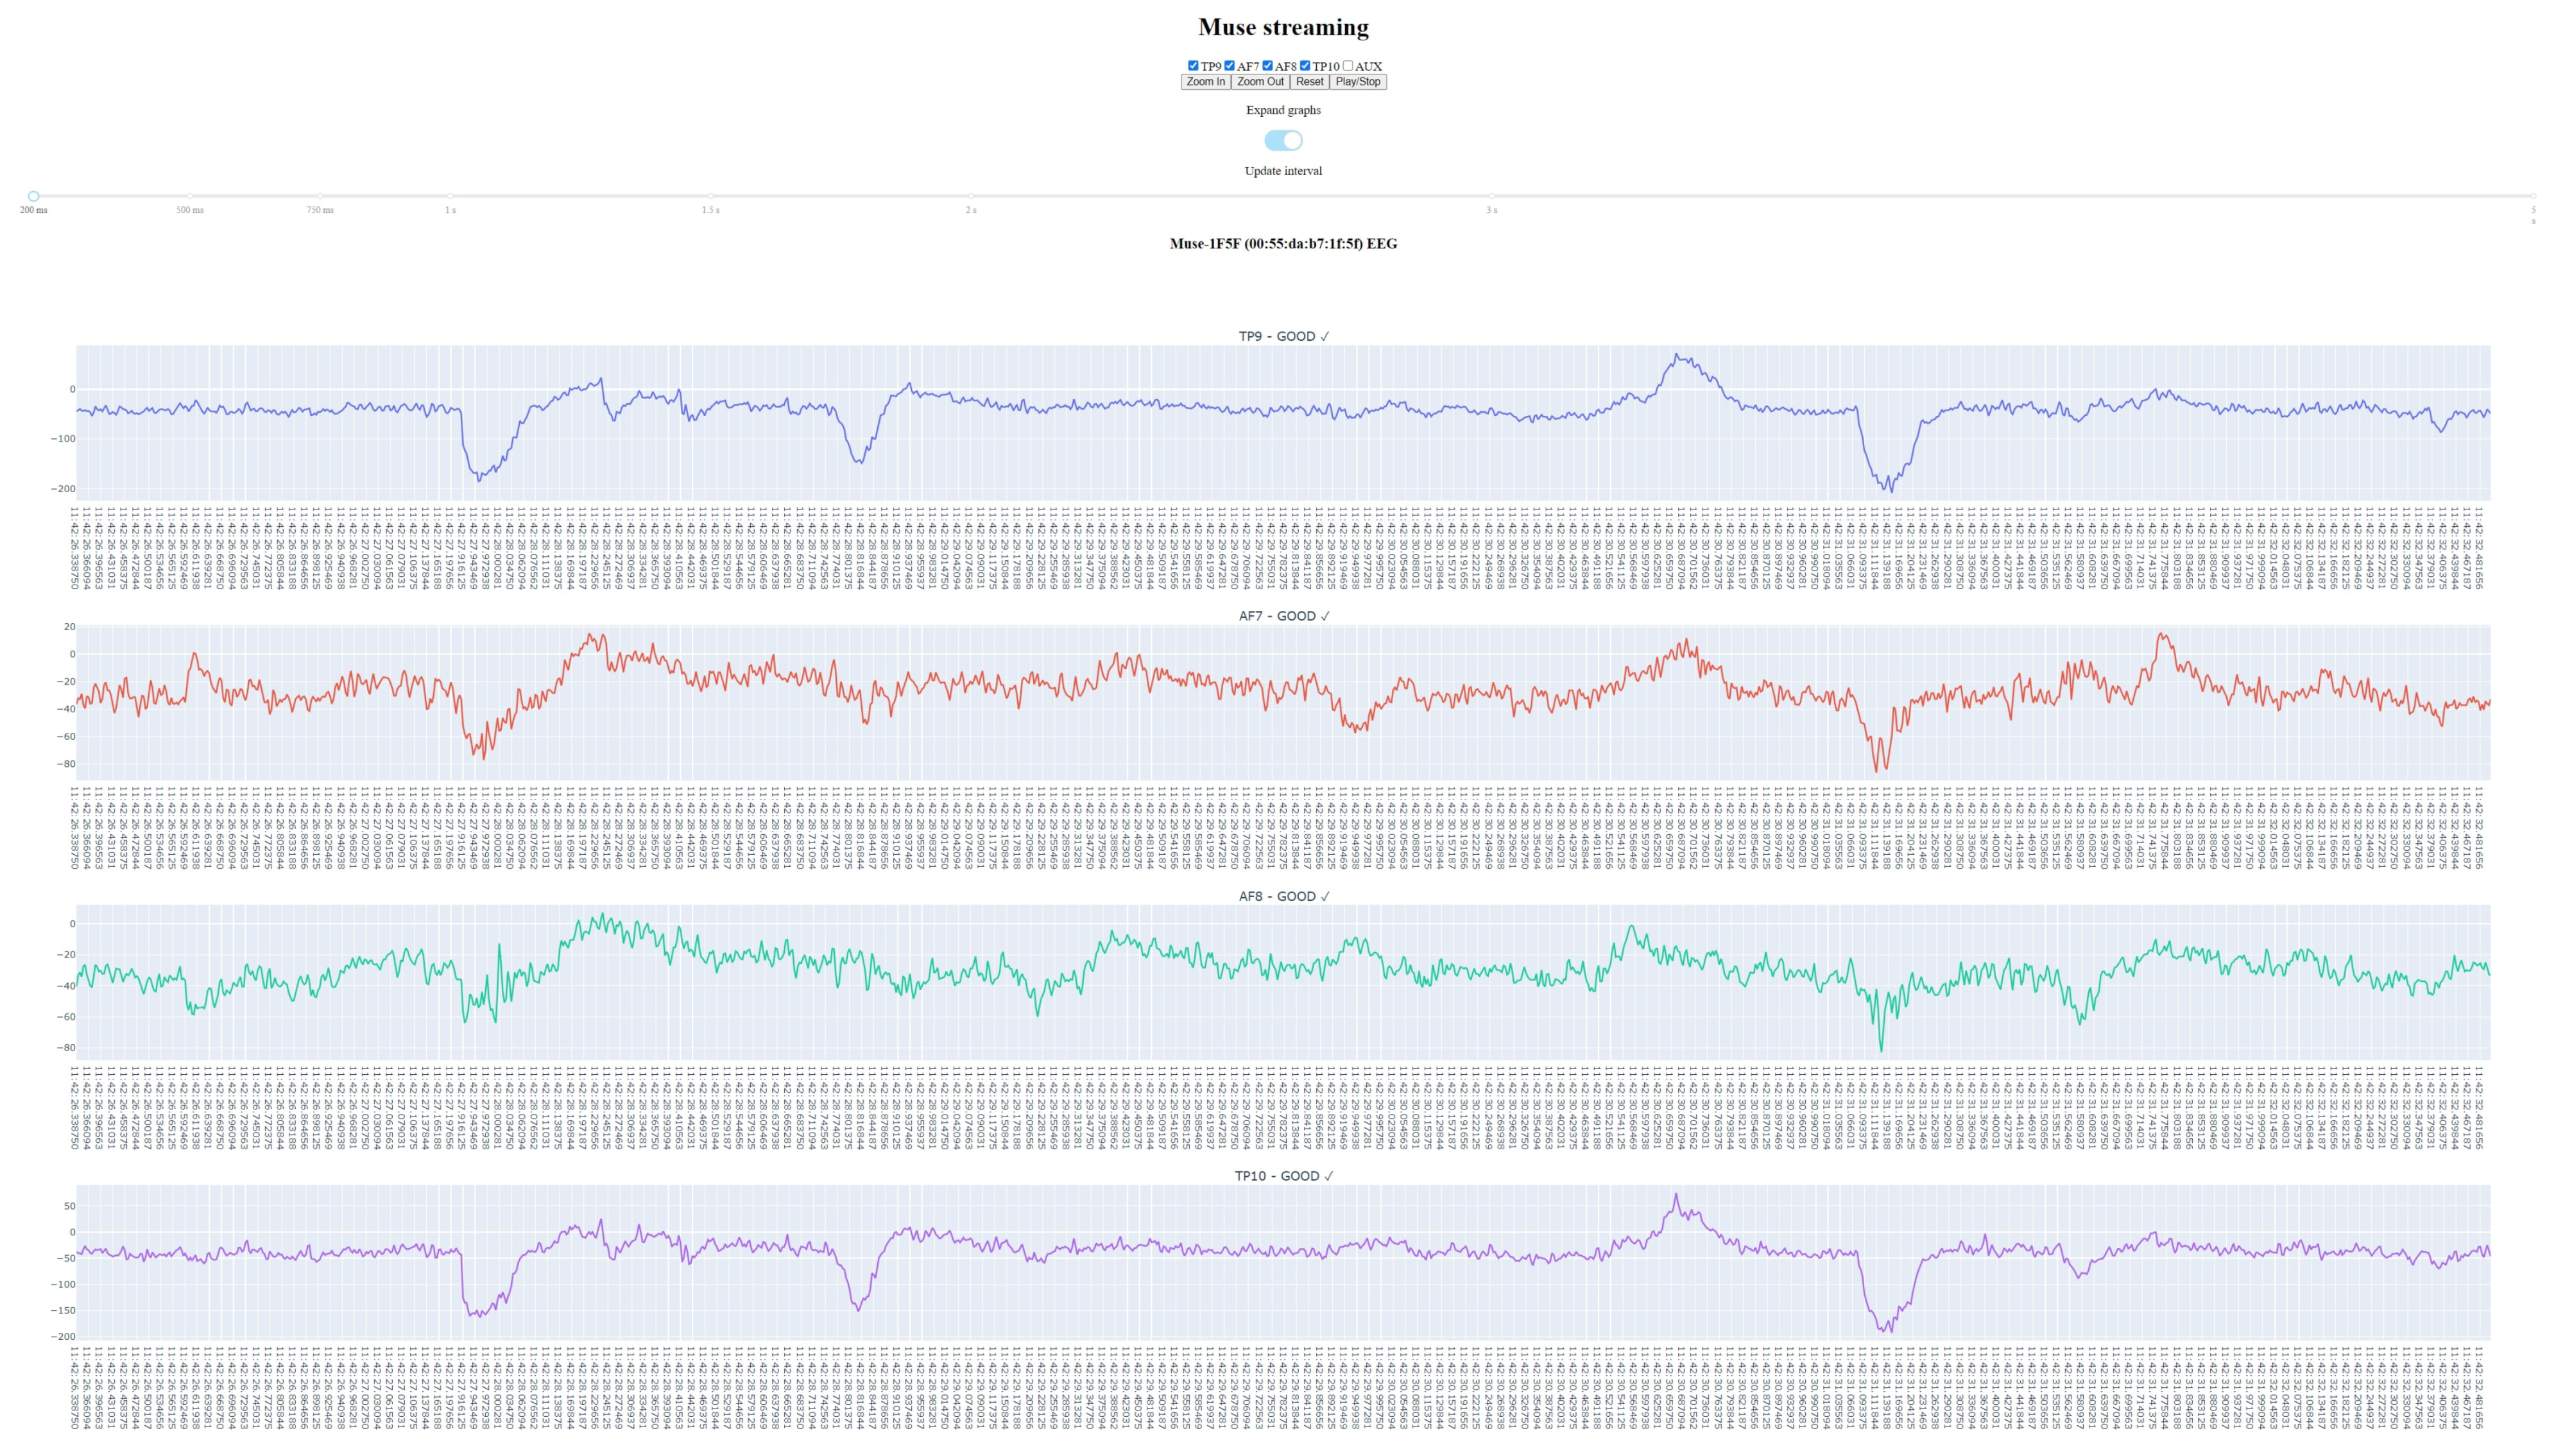
There are two different ways of visualizing the signals, compressed and expanded. In Figure 3, the overall compressed view of the website is shown with two devices at the same time. The latter is shown in Figure 4. Additionally, there are controls for the update interval (from 200 ms to 5 s), the channels to watch, the zoom level, and the possibility to play and pause the live view. For anyone without deep knowledge about performing experiments, we included a marker to know if a particular electrode had good skin contact. This helps to keep noise sufficiently low to retain a high probability of success. Lastly, the library automatically detects how many Muses are connected to the computer and adapts the interface to show those.
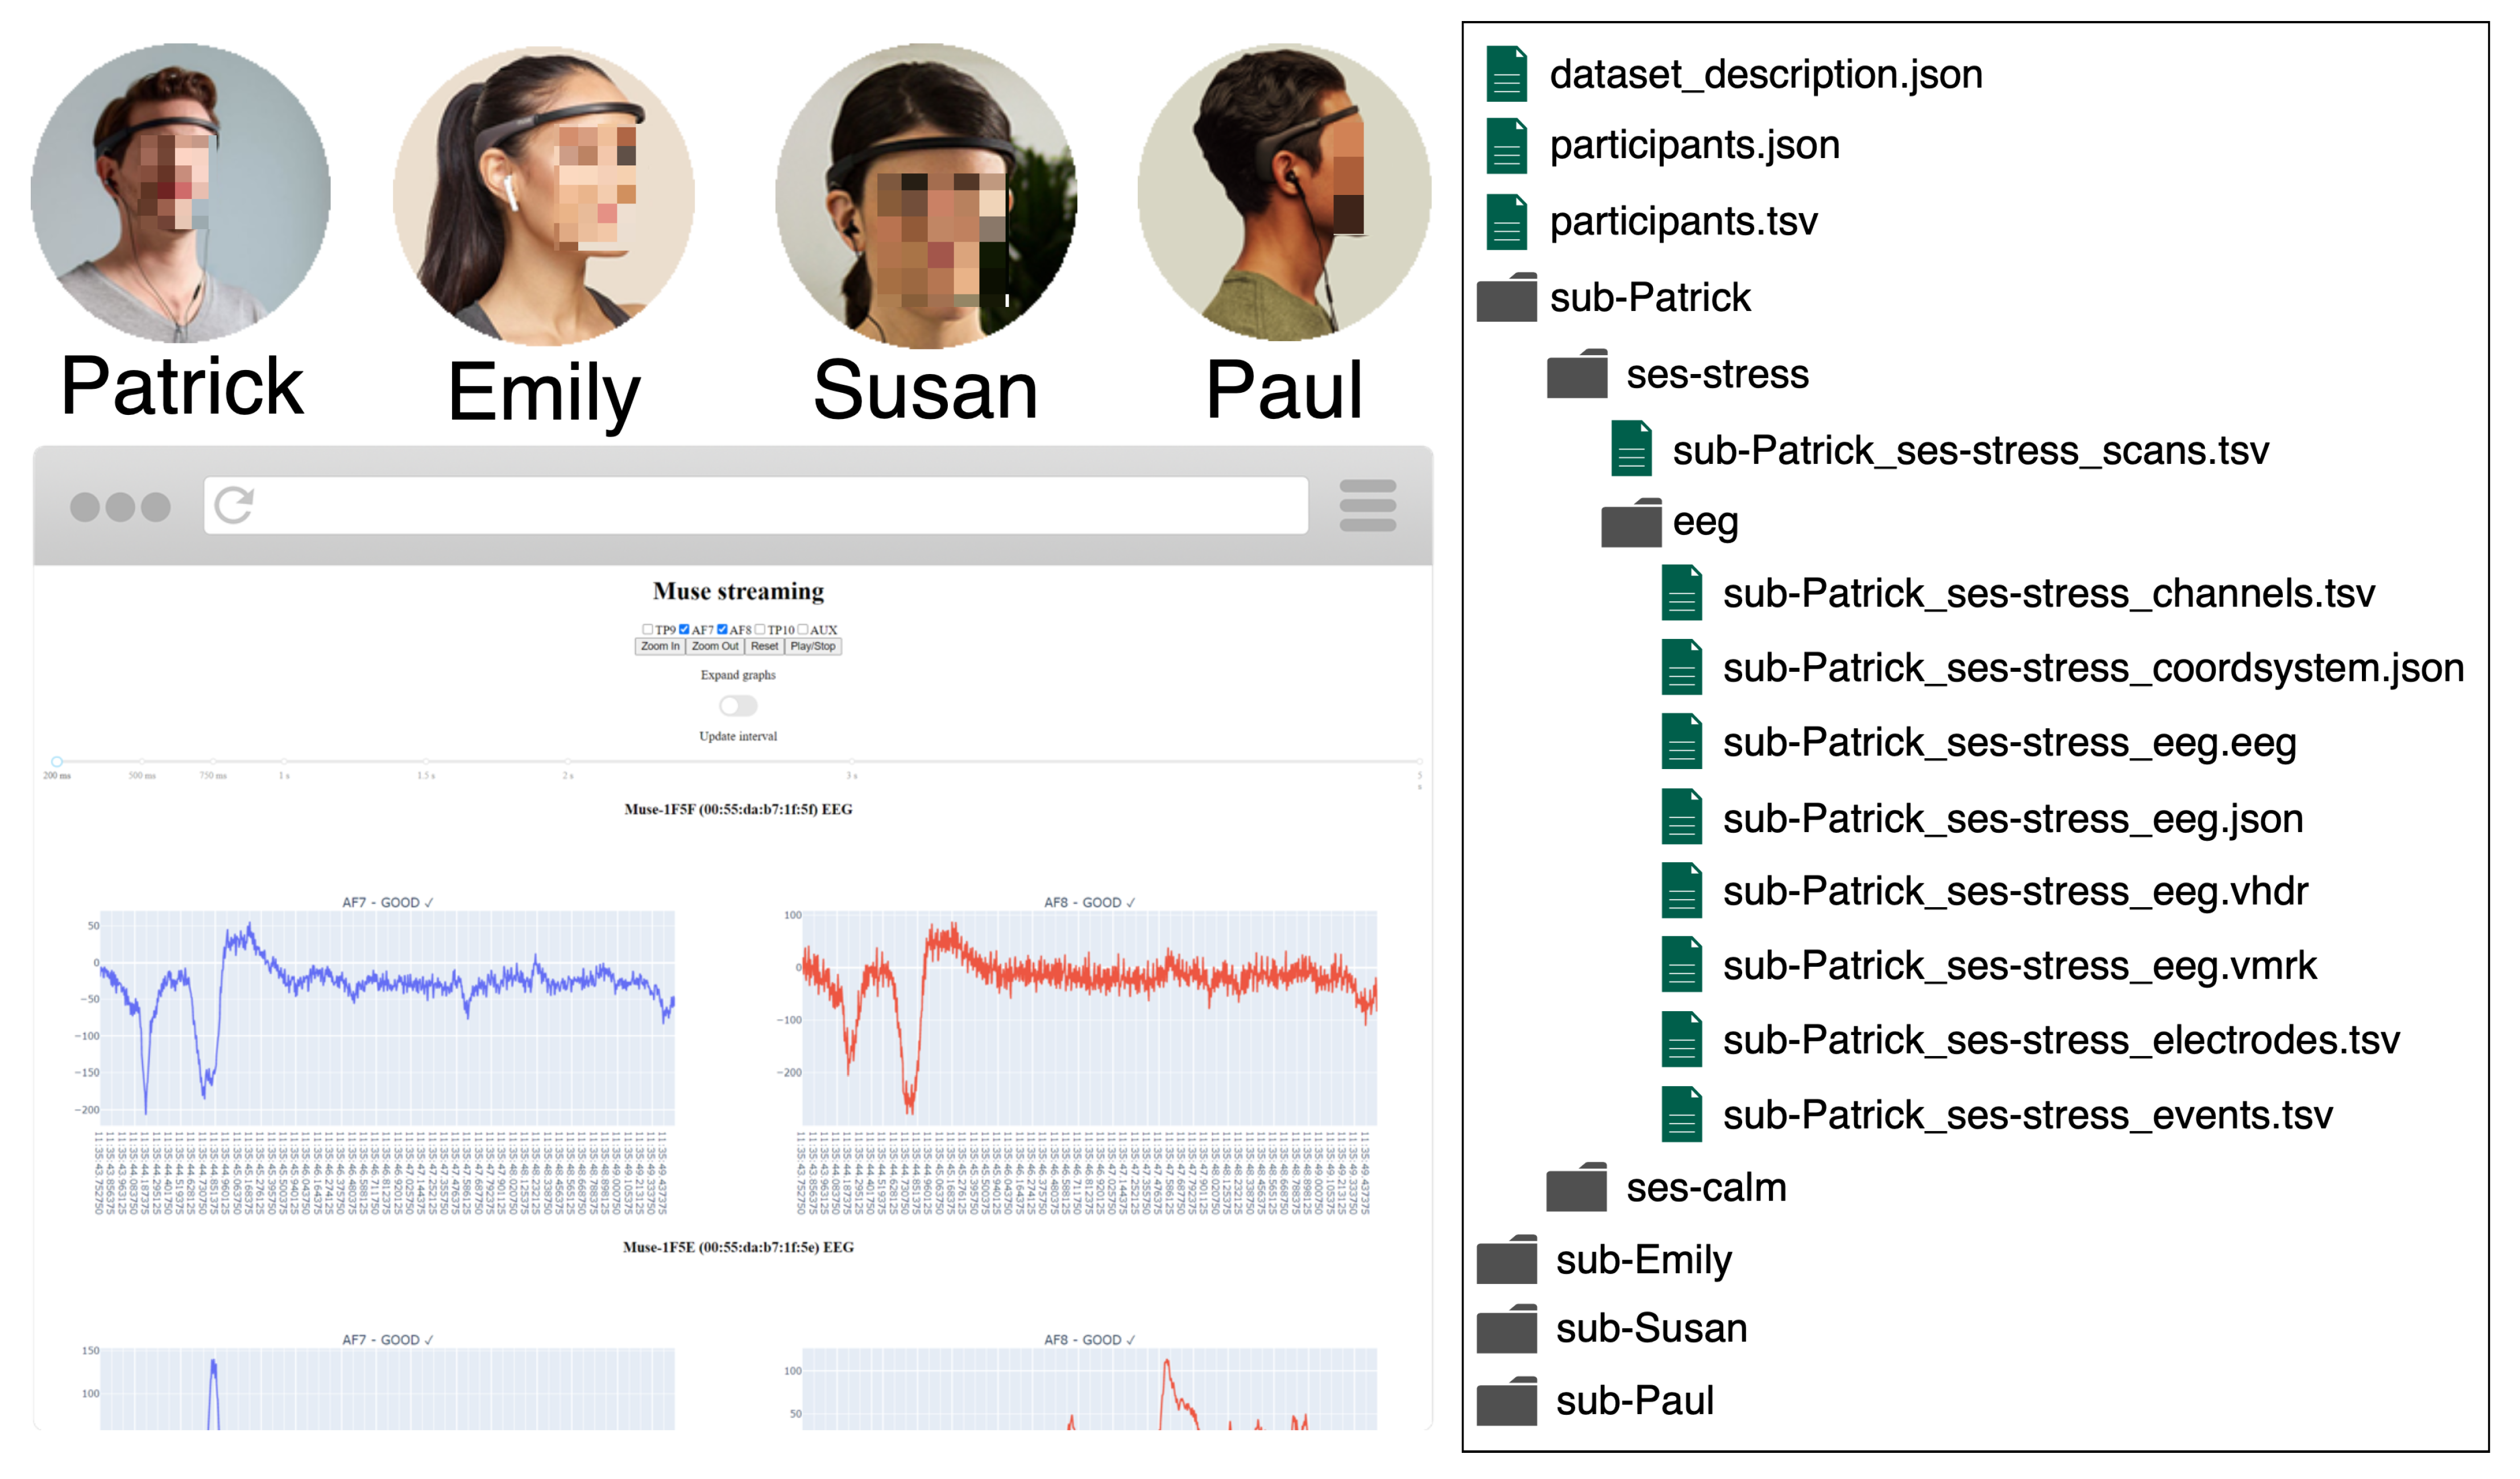
In Figure 5, we show our solution for experiments with multiple devices connected at the same time, while watching the streams. Additionally, the data file structure exported using the BIDS format is presented.
4. Validation
The main validation activities of MuseStudio are described in this section. The relevant external features of MuseStudio were evaluated by using qualitative and quantitative methods. For the evaluation of the functional and nonfunctional features of a library for supporting brain data management, such as MuseStudio, a well-known evaluation method from the software engineering field was use. Performance and latency are other important elements when brain data are collected and visualized.
First, over the years, many software engineering methodology evaluation frameworks have been published. DESMET [38] is a methodology for evaluating software engineering methods/tools by Barbara Kitchenham. DESMET can be used to compare a generic method or a method that is a specific approach within a generic method or tool. This methodology has been used in other articles for evaluation purposes [39]. According to DESMET, there are two types of evaluations:
- 1
- The evaluation of the measureable effects of using a method or tool;
- 2
- The evaluation of the appropriateness of the method or tool, i.e., how usable or useful the method is.
DESMET refers to the measureable effects of using a method as quantitative or objective, while method appropriateness is referred to as qualitative, feature analysis, or subjective. Method appropriateness is accessed usually in terms of features provided by the method/tool or the training requirements. Another important consideration is how to organize the evaluation process. According to DESMET, for a qualitative evaluation, it can be organized as a survey, a case study, or a formal experiment. In qualitative screening, it can be organized as a feature screening mode, a survey, a formal experiment, or a case study. DESMET qualitative feature screening mode can be performed by a single person for a number of methods where the evaluator not only determines the features to be accessed and their rating scale, but also performs the assessment. In qualitative screening mode, the evaluations are usually based on the literature describing the software method, rather than actually using the method.
Secondly, a latency study in MuseStudio was also conducted, and the data gathered are shown.
4.1. Analyzing the Main Features of MuseStudio
Using as the input a demonstration of MuseStudio, the evaluation of this library was carried out using DESMET [38]. This is a set of techniques applicable to evaluating both software engineering methods and tools. We used the method based on a qualitative case study, which describes a feature-based evaluation. Following the guidelines specified for this technique, an initial list of features that a library or tool for EEG data management should provide was defined (see Table 1). These features were established by two experts (full professors) in cognitive neuropsychology from the University of Castilla-La Mancha (UCLM). As can be observed, some of the features are directly related to the availability of the BIDS.
DESMET was deployed by involving five experts. First, two experts were asked about the main requirements a library for low-cost EEG devices should provide. Second, another three experts were involved to validate MuseStudio by considering the previously proposed requirements. All the experts were professionals with knowledge and skills related to EEG devices, neuroscience, and psychology.
Once Table 1 has been filled in by the experts, DESMET determines the importance degree that should be assigned to each identified feature. Specifically, the importance degrees are Mandatory (M), Highly Desirable (HD), Desirable (D), and Nice to have (N). This importance was also established by the consulted experts.
By using these importance degrees, Table 2 was filled in. As can be noticed, the most important functional and nonfunctional requirements to be supported are signal visualization, import and export data management, and scalability.
Afterwards, according to DESMET, a scale to evaluate each of the described features should be provided. The scale proposed by DESMET (see Table 3) was applied to evaluate each feature according to the following factors: Conformance Acceptability Threshold (CAT) and Conformance score obtained (CSO) for MuseStudio. In particular, three experts (associate professors) from the University of Castilla-La Mancha with experience in the fields emotion recognition, health psychology, and signal processing/computer science agreed about the values of CSOi.
Once each feature was evaluated, the difference between the CAT and CSO factors was computed as shown in the column Difference (Dif) in Table 4.
Therefore, in order to interpret the values shown in Table 4, the following equations should be considered:
We should highlight that a variation of the DESMET method was created. The Importance (Imp) of each feature was weighed using a scale from 1 to 4 (Nice to have—1, Desirable—2, Highly Desirable—3, Mandatory—4). The importance was used to compute the final score of each feature or requirement by multiplying the importance by the difference. This computation is shown in the column Score (Sco) in Table 4. This score is useful for comparing different alternatives, but in our case, the score was only for the MuseStudio’s valorization. Lastly, the final score of each technique (Total) was obtained by adding the scores of all the features.
The MuseStudio library achieved a positive total score (15 points). Moreover, it was especially evaluated positively for the “at a distance” feature, since MuseStudio provides full support for exporting the brain activity data. It was also highlighted that the MuseStudio tool has consistency and easily represents the requirements’ importance, giving no support to determining which requirements are more important than the others. In any case, MuseStudio provides facilities for data gathering and collection in conformance with the BIDS proposal. Brain data from Muse devices are organized and structured with MuseStudio, and these data can be visualized, imported, exported, and analyzed.
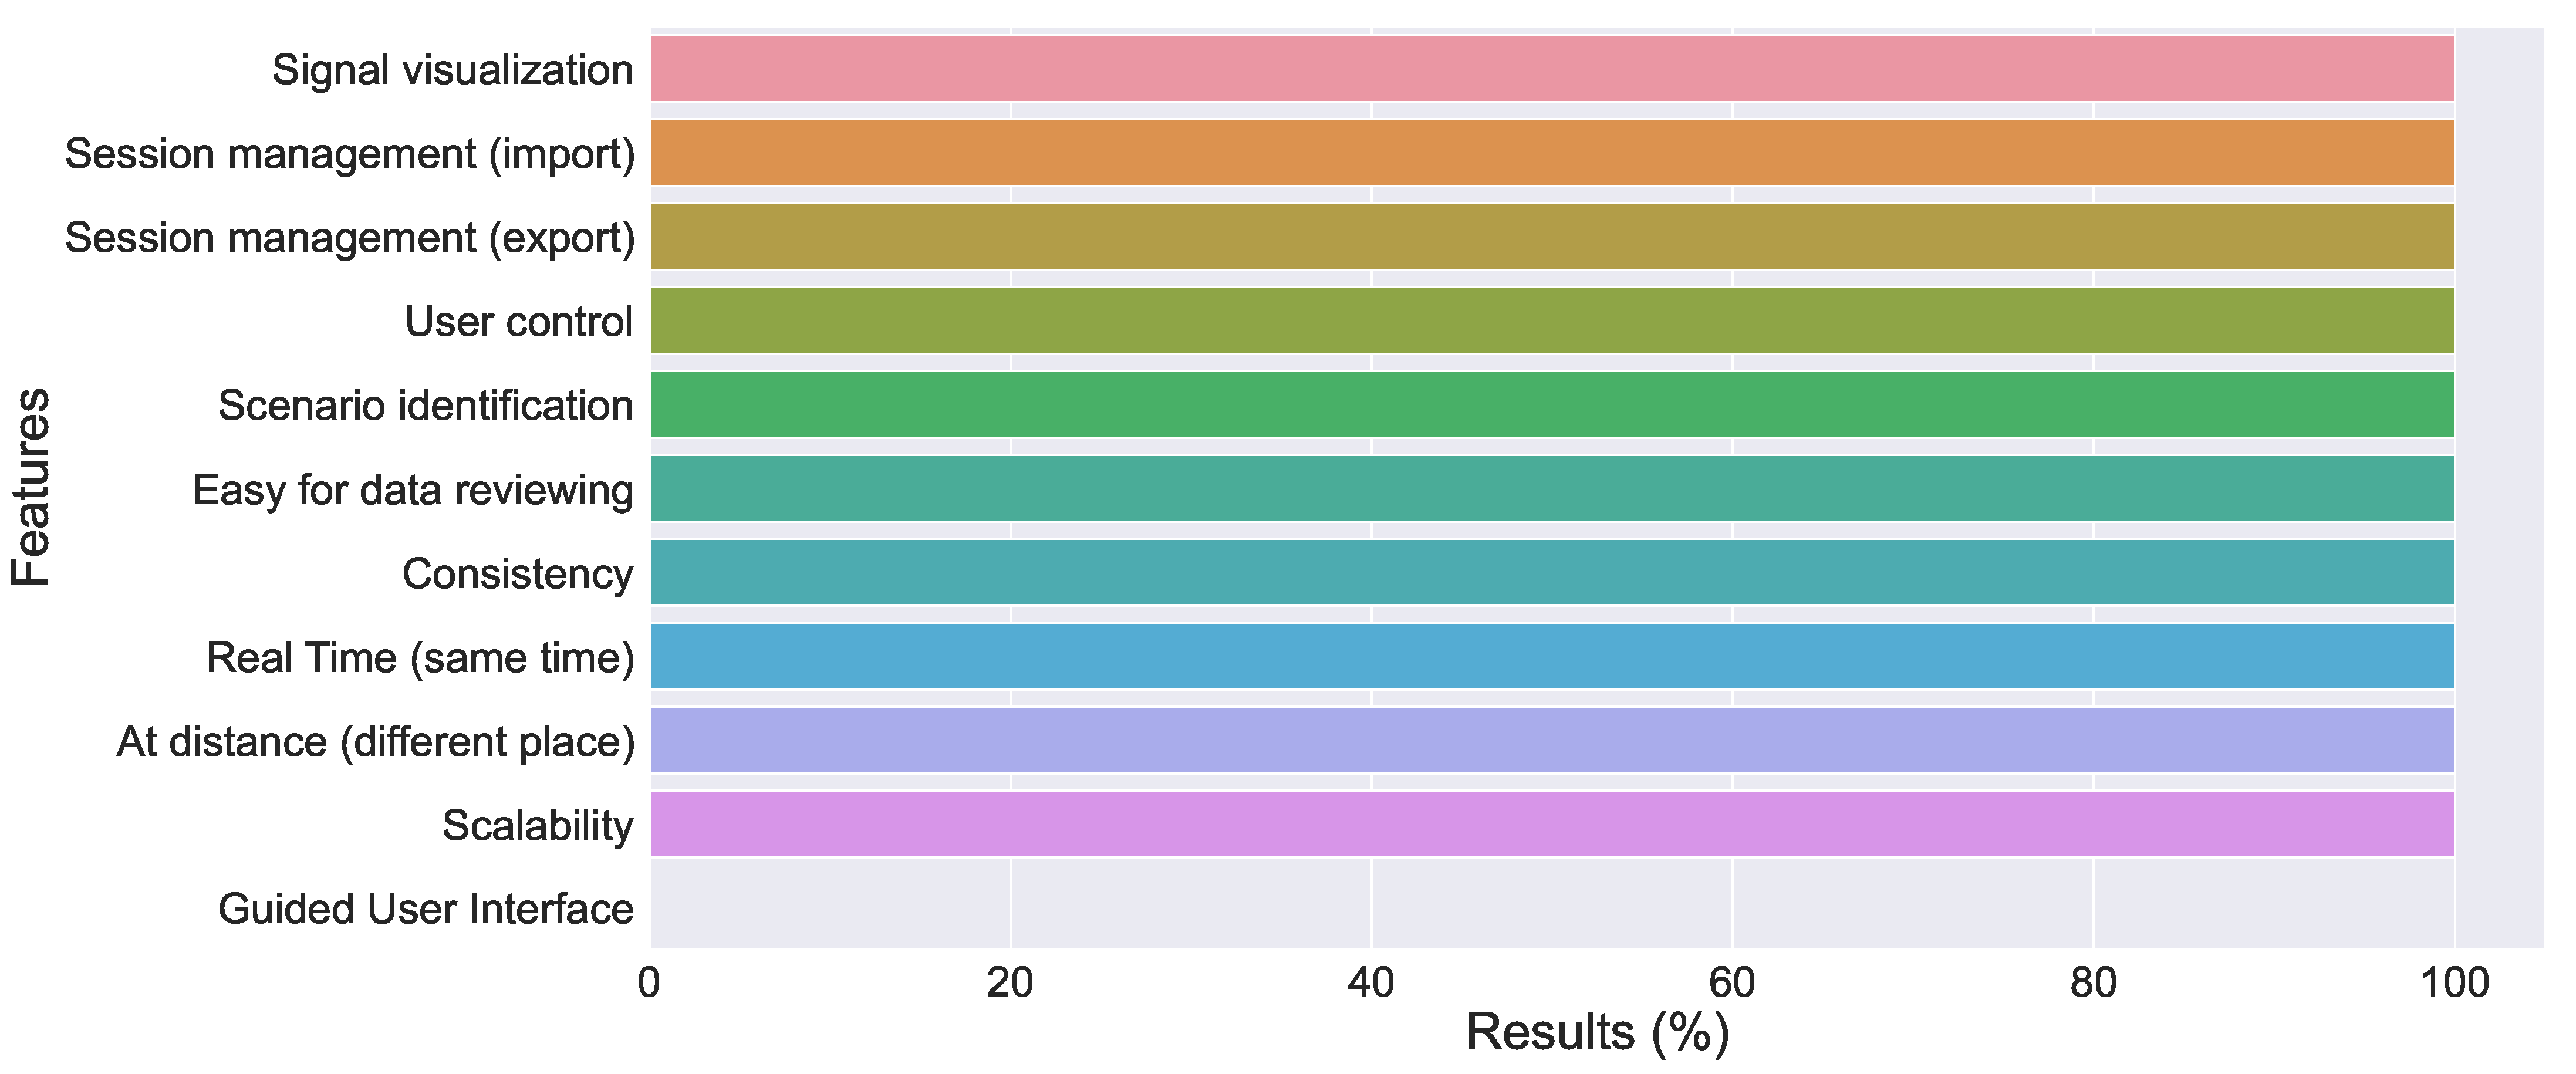
In addition, as DESMET suggests, we performed a comparison of the percentage of each feature satisfied by MuseStudio. Figure 6 illustrates the results relative to the considered features. The outcomes of the validation are graphically shown in Figure 6. All previously established requirements were fully achieved. However, additional effort could be made on the user interface feature. At this moment, the information of the sessions and participants must be established directly by modifying this information in different files. Forms may be designed to ease these tasks.
Understanding the score requires knowing how DESMET works. First, the level of importance of a feature was determined by experts without trying the library (between −1 and 5). Thereafter, other experts determined how well implemented a particular feature was (between −1 and 5 again).
The current implementation of MuseStudio satisfies the requirements or features related to visualization, import data, scenario identification, and scalability. Other features of MuseStudio, such as data reviewing and data consistency, are more than satisfied, and the rest are also oversatisfied. At this time, the identified weakness of MuseStudio is that its users need to have certain knowledge about Python, because it does not have a guided user interface yet.
4.2. Latency Test
Some experiments with MuseStudio may require real-time data visualization, which is an included feature in the library. However, researchers may have special requirements in terms of the latency between the time an event occurs in the brain of a participant and the moment it is visible on screen. For this reason, we performed a latency test with all the different update intervals selectable. Those intervals were: 200 ms, 500 ms, 750 ms, 1 s, 1.5 s, 2 s, 3 s, and 5 s.
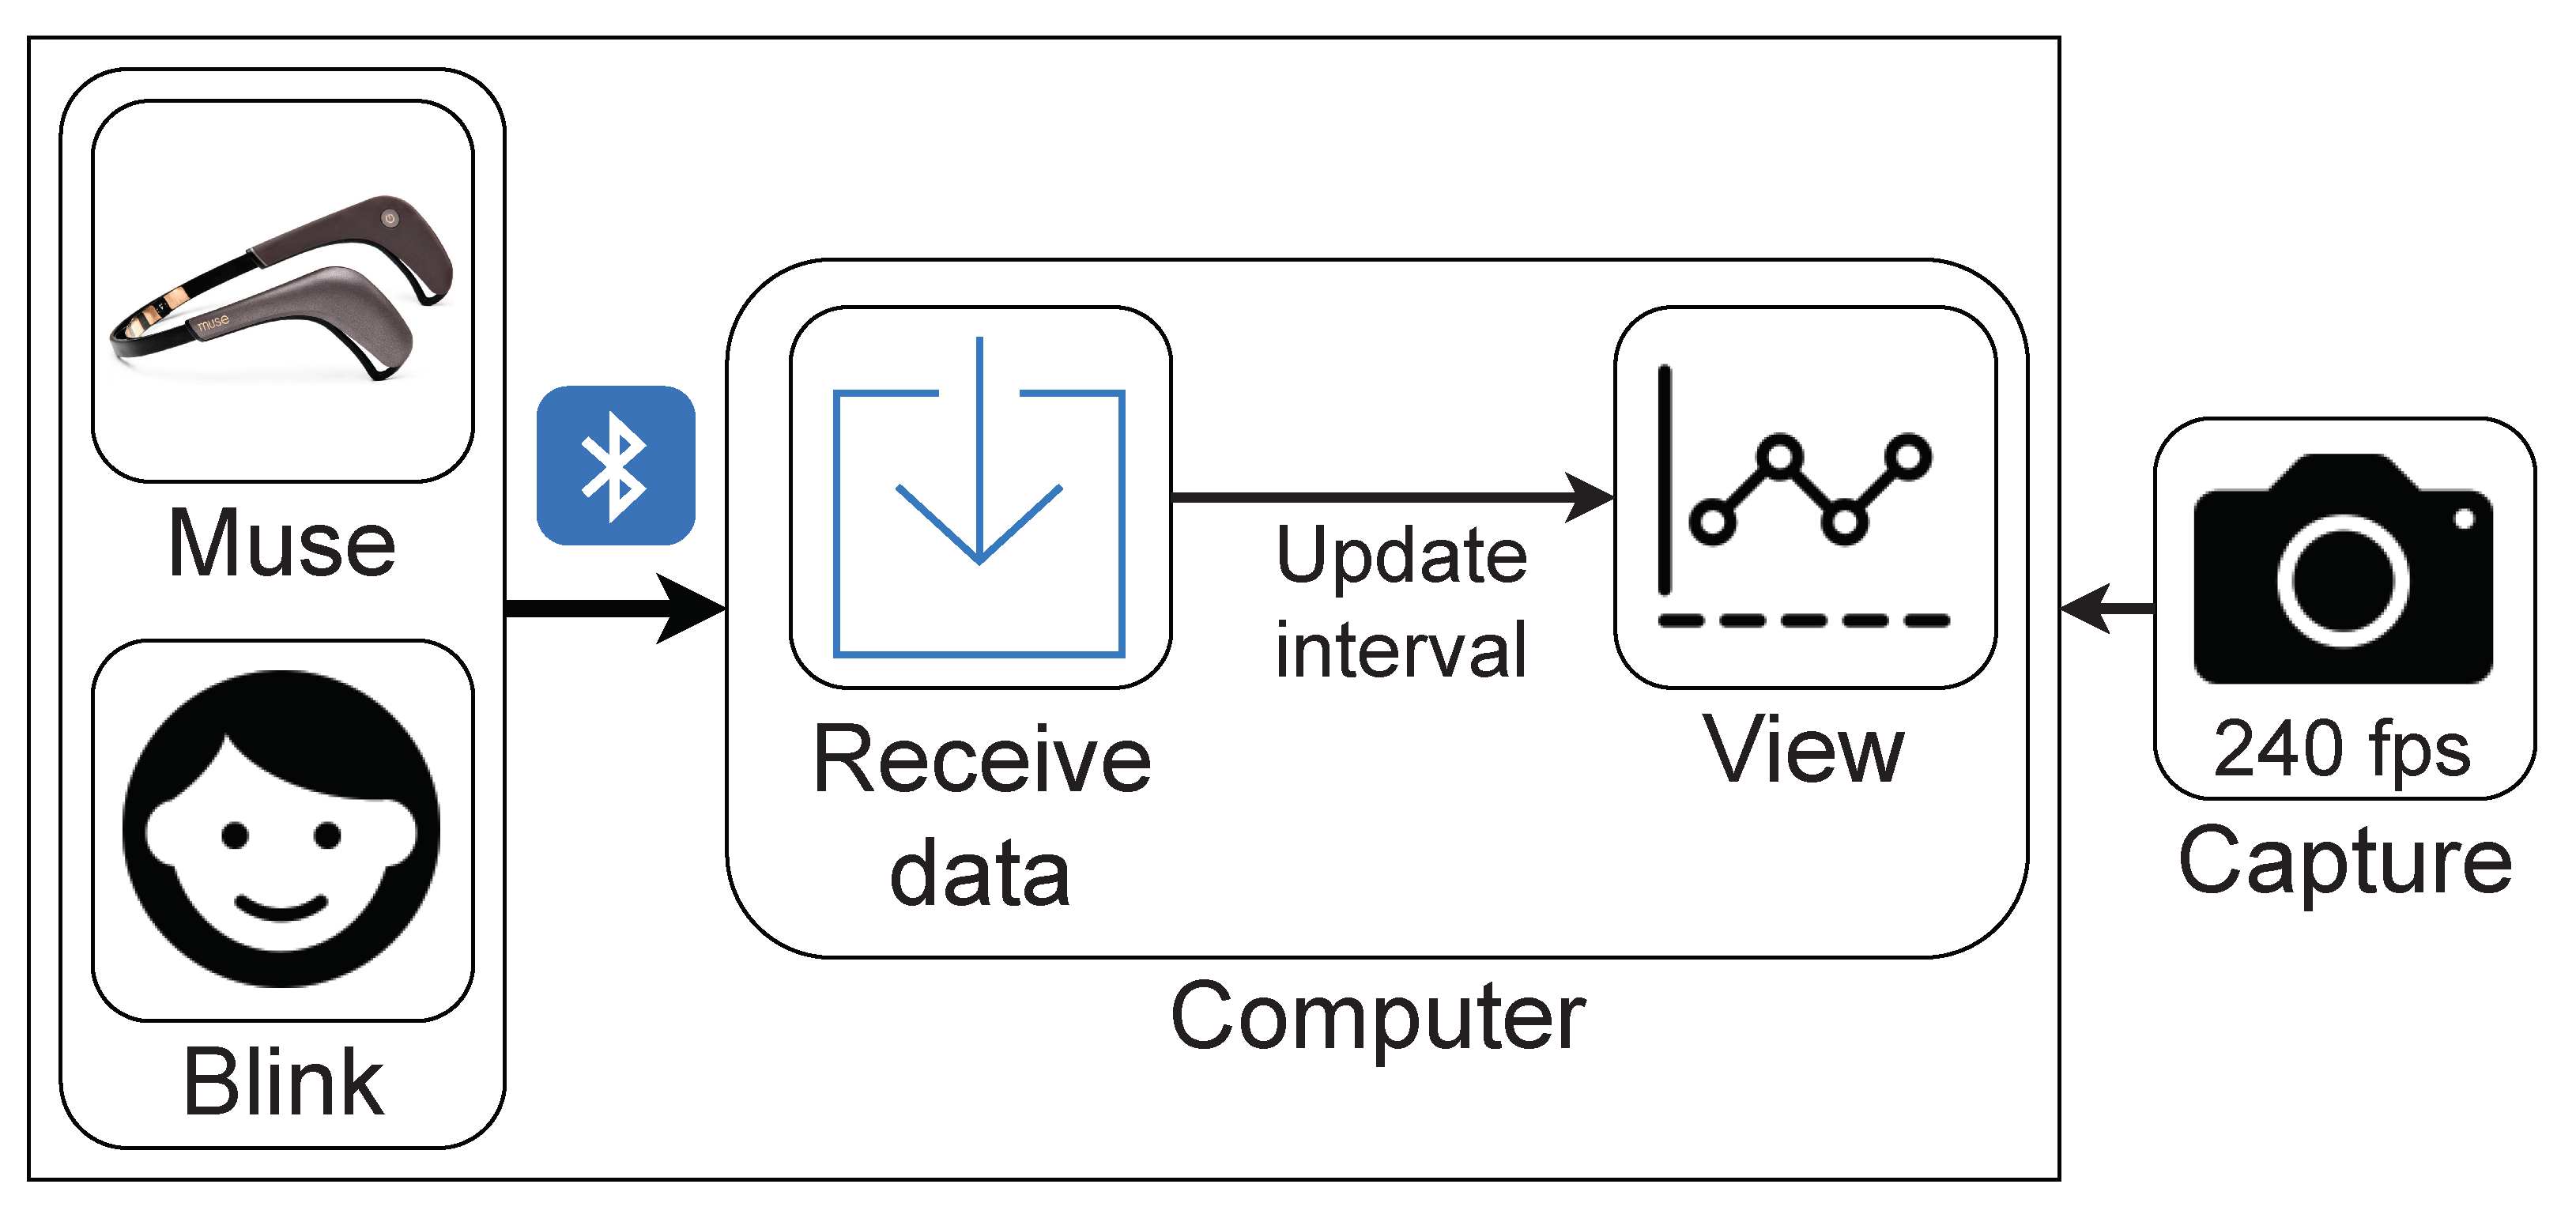
The design of the experiment measured the latency with real events, having a subject wearing Muse and a computer with the device connected. In particular, the device is able to capture eye blinks clearly, so this was the event that was going to be recorded repeatedly with the slow-motion camera of a Samsung Galaxy S20+ (Sony IMX555 main camera sensor) at a resolution of 1920 × 1080 and 240 frames per second. Then, the procedure consisted of a slow-motion camera pointing at the screen showing the real-time graphs and the subject performing the experiment, simultaneously. Afterwards, the subject was instructed to blink his/her eyes exactly when the graph updated. We are aware that there might be a slight variability regarding the time at which the subject blinks, so the experiment was repeated ten times with all the intervals, and then, we calculated the arithmetic mean between the values. Figure 7 shows a summary of the recording stage of the experiment. When that phase was finished, we loaded the video into an editor to count the frames between the blinks and the instant of those shown on screen. Once the frames were collected, we converted them into seconds knowing that 240 frames is equivalent to 1 s.
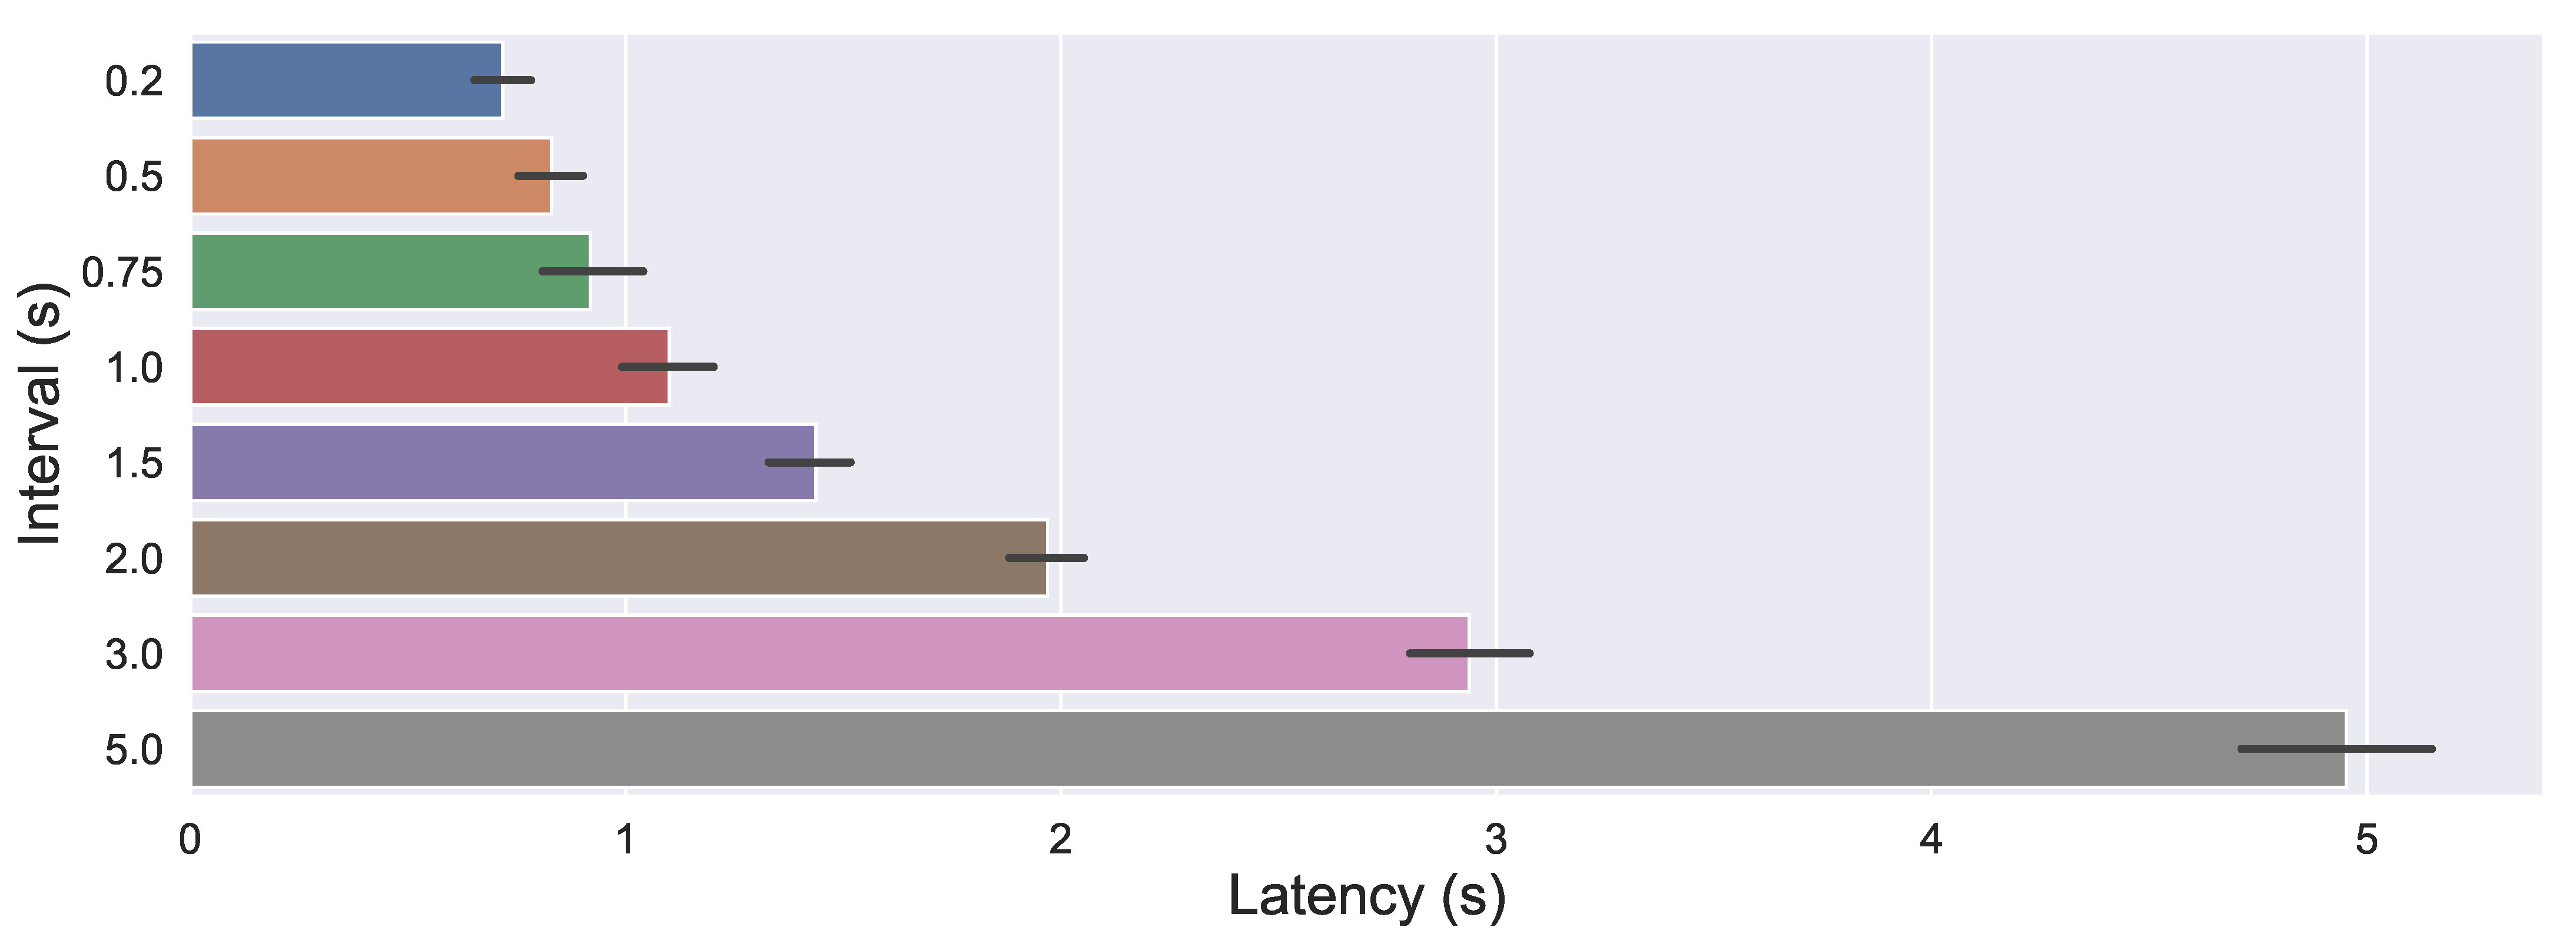
For the sake of reproducibility, Muse was connected to a computer with these specifications: Intel Core i7-9750H (base frequency 2.60 GHz and turbo frequency 4.50 GHz), 16 GB of RAM, and SSD (although no brain data were stored). The screen had an input lag of 5ms, which was discounted to each measurement. The connection with another computer to the server was not contemplated because that would add the latency of the network. Time synchronization was ensured by the LSL protocol [40], which achieves submillisecond accuracy on a local network without further action on practically all consumer PC hardware. The results are presented in Figure 8 through a bar plot that includes the variability of the measurements for each interval. It is observable that update intervals equal to or greater than one second showed the events with the correct timing and the expected latency. However, less than one-second values did not show a latency equivalent to the interval. This happened due to a combination of two different sources of delay: the time it takes for the device to send data and the time needed for the computer to attach the new values, create a visual representation, and update the interface. The difference in latency between those values was around 1ms, which did not correspond to the interval chosen. Nevertheless, we maintained those options because higher-performing CPUs are able to reduce the latency tested.
5. Discussion
The objective of the study covered the creation of an open-source software product that allows working with brain activity data and facilitates the management of activities designed for performing experiments. In particular, Muse was chosen as the low-cost device to allow researchers to focus on their research.
The library MuseStudio provides a set of tools for management activities, including the import, conversion, export, and visualization of brain data. Thus, the solution adapts to real-time usage and recorded experiments. Moreover, those steps can be performed far from the place where the trial is being conducted, due to the tools provided.
The internal features of MuseStudio are the following: open-source cross-platform library; developed for Python 3 [41]; complies with the best practices in data analysis [2] and the recommendations from the OHBM COBIDAS MEEG committee [6]; allows visualizing real-time data from multiple devices concurrently without being in the same place; imports data from unlimited raw recordings and multiple devices in a structured manner; exports using the standard for EEG data; converts to MNE- and Pandas-compatible data formats. These internal features drove the MuseStudio development activities. Moreover, other external features were identified by two external experts in neuroscience.
Making the library open-source allows its usage and modification without worries, so other researchers and people interested in this field can use low-cost and minimally invasive devices in their experiments. In addition, the community can help by introducing new features and adapt the library to their particular necessities. It has been developed for all three major operating systems (Windows, Linux, and macOS) to ensure compatibility. As a prerequisite to use the library, having prior knowledge of Python is required. Python has converted into the preferred programming language for data science [41].
MuseStudio complies and follows the recommendations provided by the BIDS standard for neuroscience [42] to manage data recordings adequately. Therefore, it can import and export the data associated with multiple subjects and sessions using multiple devices. These data are not limited to the tasks that Muse natively supports, such as meditation. Instead, it supports any other validated activity. Following the BIDS [43] standard allows sharing data between partners and replicating experiments easily through the import and export functionalities.
The external features of MuseStudio were validated by three external experts in neuroscience. They validated the presence of these features and their relevance. All these features, initially established by using the DESMET method, were identified and properly evaluated in the current version of MuseStudio.
In MuseStudio, there are no limitations softwarewise, except for the lack of a guided user interface. This software shortcoming was previously identified and discussed. It can be overcome by designing and integrating user interface forms to provide session and participant descriptors and identifiers. Hardwarewise, the number of Muse devices simultaneously connected to a single computer is limited by the bandwidth and throughput of the Bluetooth module, which is different across machines. The library supports pausing the visualization at some point to explore a certain moment in time, and if the connection is lost, it automatically continues after reconnection. Additionally, the latency was tested with real-world usage in a controlled environment to maximize the delay between an event and its visualization on screen. The results showed exact timing from a 1 s update interval and times that varied depending on the interval if it was lower than 1 s. Nonetheless, those can be further reduced using a computer with better specifications.
In summary, MuseStudio shows that low-cost devices related to neuroscience, such as Muse, can have a complete set of tools to manage brain data. It offers features that increase flexibility, reliability, and the ease of data management.
6. Conclusions and Further Work
An electroencephalogram is an electrophysiological monitoring method that records the electrical activity of the brain. It is a noninvasive technique through electrodes placed on the scalp, and therefore, it is suitable for use in a wide variety of situations, not just the laboratory ones. Moreover, this method is data intensive, and in order to successfully manage these data, effective data visualization and collection are important. Software applications are needed for brain data management.
The article had special interest in affordable and low-cost EEG devices. A particular one is Muse from Interaxon, which although limited by the number of electrodes, is widely used for meditation and relaxation activities [14,15,17], being useful in the contexts of stress and anxiety. In this paper, we wanted to identify internal and external features for EEG data management and low-cost EEG devices; this collection of features should be the answer to our research question. These requirements were proposed and identified in the Method and Validation sections of this paper. In the internal dimension, several requirements were proposed, data import and conversion, the BIDS management of data, and real-time data visualization, and all these features were considered in the MuseStudio implementation. Later, using DESMET, external requirements were proposed and used in a validation activity. These external features were related to session data management (data importation and exportation), data visualization (signal visualization, consistency, scenario identification, easy for data reviewing), and ease of operation (scalability, same time, and different place).
Nevertheless, the software associated (manufacturer developed) with this device has many limitations, due to the lack of support for data collection and management. In this article, we overcame this deficiency with the creation of a library to manage brain activity data using Muse (different versions of Muse, Muse 2 and Muse S). MuseStudio provides a set of tools that facilitate storing, importing, exporting, visualizing, and sharing data. This article described the main features and strengths of the library, as well as a validation of those features, including to what extent they were achieved. In terms of hardware limitations, they were set by the particular low-cost device, Muse in this case. Depending on the specifications, some domains may be out of scope, not providing valuable insights.
Initially, several experts from the Psychology Department of the University of Castilla-La Mancha helped to determine which were the functional and nonfunctional features that a library related to brain data should include. Thanks to this collaboration, a set of features was identified by these experts to determine what tasks a software brain data management software tool should be able to perform. These features were used in order to validate MuseStudio by other experts, but additionally, these features can be used to compare MuseStudio with other alternatives in the future. In our functional and nonfunctional validation, other experts identified the presence or absence of those features using surveys, heuristic evaluation techniques, and analyzing MuseStudio in particular.
The library implemented is already a relevant contribution because it covers the initial necessities established. This library has been shared with the community through an open-source license [5]. Since its inception, MuseStudio has not been intended for the general public, but rather for researchers who are already familiar with the use and interpretation of brain signals. However, we can address other evaluations in the future as the library grows and improves. For instance, it could be useful as soon as a graphical interface is included, which is the main nonfunctional limitation. This feature would encourage the use of the library.
The library can be further improved by adding authentication and additional security capabilities. At this moment, for instance, the authentication of users and sessions must be performed by analysts, and these identification activities are not supported by the current version of MuseStudio. In this sense, users that need remote access should be able to establish secure connections between peers.
Author Contributions
Conceptualization, M.Á.S.-C. and F.M.; methodology, M.Á.S.-C., F.M. and M.T.L.; validation, M.Á.S.-C., F.M. and M.T.L.; investigation, M.Á.S.-C.; resources, M.T.L.; writing—original draft preparation, M.Á.S.-C.; writing—review and editing, F.M. and M.T.L.; funding acquisition, M.T.L. and F.M. All authors have read and agreed to the published version of the manuscript.
Funding
This work was supported by the European Regional Development Fund under the Grant Evaluando la eXperiencia de Usuario de personas mayores con técnicas de Neuroevaluación—NeUX (SBPLY/17/180501/000192).
Data Availability Statement
Not Applicable.
Acknowledgments
The authors acknowledge the participation of the staff from the Psychology Department and the Computer Science Department at the University of Castilla-La Mancha and the Spanish Ministerio de Economía y Competitividad for partially supporting this research through Grant 2gether (PID2019-108915RB-I00).
Conflicts of Interest
The authors declare no conflict of interest.
Abbreviations
The following abbreviations are used in this manuscript:
| EEG | ElectroEncephaloGraphy |
| PPG | PhotoPletismoGraphy |
| BIDS | Brain Imaging Data Structure |
| LSL | Lab Streaming Layer |
| XDF | eXtensible Data Format |
| ERP | Event-Related Potential |
Appendix A. Structures Defined for BIDS
setup = [
{
"subject": None,
"session": None,
"task": None,
"acquisition": None,
"run": None,
"processing": None,
"recording": None,
"space": None,
"split": None,
"root": None,
"suffix": None,
"extension": None
}
]
participants = [
{
"subject": None,
"age": None,
"sex": None,
"hand": None,
"root": None
}
]
References
- TechNavio. Global EEG Electrodes Market 2019–2023; Technical Report; TechNavio: Elmhurst, IL, USA, 2019. [Google Scholar]
- Pernet, C.; Garrido, M.; Gramfort, A.; Maurits, N.; Michel, C.; Pang, E.; Salmelin, R.; Schoffelen, J.M.; Valdes-Sosa, P.; Puce, A. Best Practices in Data Analysis and Sharing in Neuroimaging using MEEG. Preprint 2018. [Google Scholar] [CrossRef] [Green Version]
- Soufineyestani, M.; Dowling, D.; Khan, A. Electroencephalography (EEG) Technology Applications and Available Devices. Appl. Sci. 2020, 10, 7453. [Google Scholar] [CrossRef]
- InteraXon. Muse—Meditation Made Easy with the Muse Headband; InteraXon: Toronto, ON, Canada, 2021. [Google Scholar]
- Sanchez-Cifo, M.A.; Montero, F.; López, M.T. MuseStudio. Zenodo 2021. [Google Scholar] [CrossRef]
- Pernet, C.; Garrido, M.I.; Gramfort, A.; Maurits, N.; Michel, C.M.; Pang, E.; Salmelin, R.; Schoffelen, J.M.; Valdes-Sosa, P.A.; Puce, A. Issues and recommendations from the OHBM COBIDAS MEEG committee for reproducible EEG and MEG research. Nat. Neurosci. 2020, 23, 1473–1483. [Google Scholar] [CrossRef] [PubMed]
- Johns Hopkins University. Electroencephalogram (EEG); Johns Hopkins University: Baltimore, MD, USA, 2021. [Google Scholar]
- Wang, L.; Liu, H.; Zhou, T.; Liang, W.; Shan, M. Multidimensional emotion recognition based on semantic analysis of biomedical eeg signal for knowledge discovery in psychological healthcare. Appl. Sci. 2021, 11, 1338. [Google Scholar] [CrossRef]
- Al-Nafjan, A.; Hosny, M.; Al-Ohali, Y.; Al-Wabil, A. Review and classification of emotion recognition based on EEG brain-computer interface system research: A systematic review. Appl. Sci. 2017, 7, 1239. [Google Scholar] [CrossRef] [Green Version]
- Peake, J.M.; Kerr, G.; Sullivan, J.P. A Critical Review of Consumer Wearables, Mobile Applications, and Equipment for Providing Biofeedback, Monitoring Stress, and Sleep in Physically Active Populations. Front. Physiol. 2018, 9, 743. [Google Scholar] [CrossRef]
- LaRocco, J.; Le, M.D.; Paeng, D.G. A Systemic Review of Available Low-Cost EEG Headsets Used for Drowsiness Detection. Front. Neuroinform. 2020, 14, 42. [Google Scholar] [CrossRef]
- Alsuradi, H.; Park, W.; Eid, M. EEG-Based Neurohaptics Research: A Literature Review. IEEE Access 2020, 8, 49313–49328. [Google Scholar] [CrossRef]
- Lai, C.Q.; Ibrahim, H.; Abdullah, M.Z.; Abdullah, J.M.; Suandi, S.A.; Azman, A. Literature survey on applications of electroencephalography (EEG). In AIP Conference Proceedings; American Institute of Physics Inc.: Melville, NY, USA, 2018; Volume 2016. [Google Scholar] [CrossRef]
- Millstine, D.M.; Bhagra, A.; Jenkins, S.M.; Croghan, I.T.; Stan, D.L.; Boughey, J.C.; Nguyen, M.D.T.; Pruthi, S. Use of a Wearable EEG Headband as a Meditation Device for Women With Newly Diagnosed Breast Cancer: A Randomized Controlled Trial. Integr. Cancer Ther. 2019, 18, 1534735419878770, PMID:31566031. [Google Scholar] [CrossRef]
- O’Sullivan, M.; Temko, A.; Bocchino, A.; O’Mahony, C.; Boylan, G.; Popovici, E. Analysis of a Low-Cost EEG Monitoring System and Dry Electrodes toward Clinical Use in the Neonatal ICU. Sensors 2019, 19, 2637. [Google Scholar] [CrossRef] [Green Version]
- Segawa, J.A. Hands-on Undergraduate Experiences Using Low-Cost Electroencephalography (EEG) Devices. J. Undergrad. Neurosci. Educ. JUNE A Publ. FUN Fac. Undergrad. Neurosci. 2019, 17, A119–A124. [Google Scholar]
- Giorgi, A.; Ronca, V.; Vozzi, A.; Sciaraffa, N.; di Florio, A.; Tamborra, L.; Simonetti, I.; Aricò, P.; Di Flumeri, G.; Rossi, D.; et al. Wearable Technologies for Mental Workload, Stress, and Emotional State Assessment during Working-Like Tasks: A Comparison with Laboratory Technologies. Sensors 2021, 21, 2332. [Google Scholar] [CrossRef]
- Vasiljevic, G.A.M.; de Miranda, L.C. Brain–Computer Interface Games Based on Consumer-Grade EEG Devices: A Systematic Literature Review. Int. J. Hum.-Comput. Interact. 2020, 36, 105–142. [Google Scholar] [CrossRef]
- Svetlov, A.S.; Nelson, M.M.; Antonenko, P.D.; McNamara, J.P.; Bussing, R. Commercial mindfulness aid does not aid short-term stress reduction compared to unassisted relaxation. Heliyon 2019, 5, e01351. [Google Scholar] [CrossRef] [Green Version]
- Stockman, C. Can a Technology Teach Meditation? Experiencing the EEG Headband InteraXon Muse as a Meditation Guide. Int. J. Emerg. Technol. Learn. 2020, 15, 83. [Google Scholar] [CrossRef]
- Park, S.; Han, C.H.; Im, C.H. Design of Wearable EEG Devices Specialized for Passive Brain–Computer Interface Applications. Sensors 2020, 20, 4572. [Google Scholar] [CrossRef]
- Rieiro, H.; Diaz-Piedra, C.; Morales, J.M.; Catena, A.; Romero, S.; Roca-Gonzalez, J.; Fuentes, L.J.; Di Stasi, L.L. Validation of Electroencephalographic Recordings Obtained with a Consumer-Grade, Single Dry Electrode, Low-Cost Device: A Comparative Study. Sensors 2019, 19, 2808. [Google Scholar] [CrossRef] [PubMed] [Green Version]
- Peterson, V.; Galván, C.; Hernández, H.; Spies, R. A feasibility study of a complete low-cost consumer-grade brain-computer interface system. Heliyon 2020, 6, e03425. [Google Scholar] [CrossRef] [PubMed]
- Krigolson, O.E.; Williams, C.C.; Norton, A.; Hassall, C.D.; Colino, F.L. Choosing MUSE: Validation of a Low-Cost, Portable EEG System for ERP Research. Front. Neurosci. 2017, 11, 109. [Google Scholar] [CrossRef] [PubMed] [Green Version]
- Leape, C.; Fong, A.; Ratwani, R.M. Heuristic usability evaluation of wearable mental state monitoring sensors for healthcare environments. In Proceedings of the Human Factors and Ergonomics Society; Human Factors an Ergonomics Society Inc.: Washington, DC, USA, 2016; pp. 583–587. [Google Scholar] [CrossRef]
- Chen, H.J.; Lin, C.J.; Lin, P.H.; Guo, Z.H. The effects of 3d and 2d imaging on brain wave activity in laparoscopic training. Appl. Sci. 2021, 11, 862. [Google Scholar] [CrossRef]
- Abujelala, M.; Sharma, A.; Abellanoza, C.; Makedon, F. Brain-EE: Brain enjoyment evaluation using commercial EEG headband. In Proceedings of the 9th ACM International Conference on PErvasive Technologies Related to Assistive Environments (PETRA ’16), Corfu Island, Greece, 29 June–1 July 2016; ACM: New York, NY, USA, 2016; Volume 2016. [Google Scholar] [CrossRef]
- Viriyasiripong, S.; Lopez, A.; Mandava, S.H.; Lai, W.R.; Mitchell, G.C.; Boonjindasup, A.; Powers, M.K.; Silberstein, J.L.; Lee, B.R. Accelerometer measurement of head movement during laparoscopic surgery as a tool to evaluate skill development of surgeons. J. Surg. Educ. 2016, 73, 589–594. [Google Scholar] [CrossRef]
- Maddox, M.M.; Lopez, A.; Mandava, S.H.; Boonjindasup, A.; Viriyasiripong, S.; Silberstein, J.L.; Lee, B.R. Electroencephalographic monitoring of brain wave activity during laparoscopic surgical simulation to measure surgeon concentration and stress: Can the student become the master? J. Endourol. 2015, 29, 1329–1333. [Google Scholar] [CrossRef]
- Barachant, A.; Morrison, D.; Banville, H.; Kowaleski, J.; Shaked, U.; Chevallier, S.; Torre Tresols, J.J. muse-lsl. Zenodo 2019. [Google Scholar] [CrossRef]
- Lee, S.; Cho, H.; Kim, K.; Jun, S.C. Simultaneous EEG Acquisition System for Multiple Users: Development and Related Issues. Sensors 2019, 19, 4592. [Google Scholar] [CrossRef] [Green Version]
- Gramfort, A.; Luessi, M.; Larson, E.; Engemann, D.A.; Strohmeier, D.; Brodbeck, C.; Goj, R.; Jas, M.; Brooks, T.; Parkkonen, L.; et al. MEG and EEG data analysis with MNE-Python. Front. Neurosci. 2013, 7, 267. [Google Scholar] [CrossRef] [Green Version]
- Pandas. The pandas development team. Zenodo 2020. [Google Scholar] [CrossRef]
- Appelhoff, S.; Sanderson, M.; Brooks, T.L.; van Vliet, M.; Quentin, R.; Holdgraf, C.; Chaumon, M.; Mikulan, E.; Tavabi, K.; Höchenberger, R.; et al. MNE-BIDS: Organizing electrophysiological data into the BIDS format and facilitating their analysis. J. Open Source Softw. 2019, 4. [Google Scholar] [CrossRef] [Green Version]
- BIDS-Contributors. The Brain Imaging Data Structure (BIDS) Specification. Zenodo 2021, 25–26. [Google Scholar] [CrossRef]
- Calton, B.; Abedini, N.; Fratkin, M. Telemedicine in the Time of Coronavirus. J. Pain Symptom Manag. 2020, 60, e12–e14. [Google Scholar] [CrossRef]
- Martínez, E.E.G.; González-Mitjans, A.; Bringas-Vega, M.L.; Valdés-Sosa, P.A. Automatic detection of fiducials landmarks toward development of an application for EEG electrodes location (digitization): Occipital structured sensor based-work. arXiv 2019, arXiv:1912.07221. [Google Scholar]
- Kitchenham, B.A. Evaluating Software Engineering Methods and Tool Part 1: The Evaluation Context and Evaluation Methods. SIGSOFT Softw. Eng. Notes 1996, 21, 11–14. [Google Scholar] [CrossRef]
- Insuasty, D.F.; Ceron, R.E.; López, D.M. A Mobile System for the Collection of Clinical Data and EEG Signals By Using The Sana Platform. Stud. Health Technol. Inform. 2014, 200, 116–123. [Google Scholar] [CrossRef]
- Kothe, C.; Medine, D.; Boulay, C.; Grivich, M.; Stenner, T. Labstreaminglayer documentation. In Time Synchronization; Labstreaminglayer: San Diego, CA, USA, 2019. [Google Scholar]
- Muller, E.; Bednar, J.A.; Diesmann, M.; Gewaltig, M.O.; Hines, M.; Davison, A.P. Python in neuroscience. Front. Neuroinform. 2015, 9, 11. [Google Scholar] [CrossRef]
- Pernet, C.R.; Appelhoff, S.; Gorgolewski, K.J.; Flandin, G.; Phillips, C.; Delorme, A.; Oostenveld, R. EEG-BIDS, an extension to the brain imaging data structure for electroencephalography. Sci. Data 2019, 6, 103. [Google Scholar] [CrossRef] [Green Version]
- Pernet, C.R.; Martinez-Cancino, R.; Truong, D.; Makeig, S.; Delorme, A. From BIDS-Formatted EEG Data to Sensor-Space Group Results: A Fully Reproducible Workflow With EEGLAB and LIMO EEG. Front. Neurosci. 2021, 14, 1407. [Google Scholar] [CrossRef]
Figure 1.
Traditional usage of Muse in experiments.

Figure 2.
Example of XDF file conversion into separate lists.

Figure 3.
Overview of the interface.

Figure 4.
Expanded view of the signals.

Figure 5.
Solution designed for experiments.

Figure 6.
Results depending on each feature.

Figure 7.
Design of the setup for the latency test.

Figure 8.
Results of the latency test.


Table 1.
List of features for MuseStudio’s evaluation.
| Feature | Description |
|---|---|
| Signal visualization | The tool should be able to provide graphic visualization of the associated signals to each sensor of the headband and differentiate among them. |
| Session management (import) | The tool has to store or import the associated data of each session and use and differentiate among them. |
| Session management (export) | The tool has to allow sharing stored data, that is the tool should be able to export the stored data of each session and user. |
| User control | The tool has to provide user control during a session. For instance, the graphical visualization of EEG signals should be stopped and restarted. |
| Scenario identification | The tool should be able to identify rare scenarios, for instance a poorly worn headband. |
| Easy of data reviewing | The stored data of each session should be easy to review and manage. |
| Consistency | The stored data of each session and user should be jointly managed. |
| Real time (same time) | The tool must allow following a session in real time, including minimal latency to improve the performance. |
| At a distance (different place) | The tool must allow following a session at a distance, so that the user/headband can be in different places and the data visualization can be performed in different places. |
| Scalability | The tool must allow using several headbands simultaneously with different users. |
| Guided user interface | The tool must provide a user-friendly interface to operate easily with its features. |
Table 2.
Relevance of features (Mandatory (M), Highly Desirable (HD), Desirable (D), and Nice to have (N)).
Table 2.
Relevance of features (Mandatory (M), Highly Desirable (HD), Desirable (D), and Nice to have (N)).
| Feature | Importance |
|---|---|
| Signal visualization | M |
| Session management (import) | M |
| Session management (export) | M |
| User control | HD |
| Scenario identification | HD |
| Easy for data reviewing | D |
| Consistency | D |
| Real time (same time) | HD |
| At a distance (different place) | HD |
| Scalability | M |
| Guided user interface | HD |
Table 3.
Judgment scale to assess tool support for a feature.
| Generic Scale Point | Definition of Scale Point | Scale Point Mapping |
|---|---|---|
| Makes things worse | Causes confusion. The way the feature is represented makes its modeling difficult and/or encourages its incorrect use. | −1 |
| No support | Fails to recognize it. The approach is not able to model a certain feature. | 0 |
| Little support | The feature is supported indirectly, for example using another model/approach in a nonstandard combination. | 1 |
| Some support | The feature is explicitly in the feature list of the model. However, it does not cater to some aspects of the feature use. | 2 |
| Strong support | The feature is explicitly in the feature list of the model. All aspects of the feature are covered, but its use depends on the expertise of the user. | 3 |
| Very strong support | The feature is explicitly in the feature list of the model. All aspects of the feature are covered, and the approach provides a guide to assist the user. | 4 |
| Full support | The feature appears explicitly in the feature list of the model. All its aspects are covered, and the approach provides a methodology to assist the user. | 5 |
Table 4.
Results of MuseStudio’s evaluation.
| Feature | Imp | CAT | CSO | Dif | Score |
|---|---|---|---|---|---|
| Signal visualization | 4 | 5 | 5 | 0 | 0 |
| Session management (import) | 4 | 5 | 5 | 0 | 0 |
| Session management (export) | 4 | 4 | 5 | 1 | 4 |
| User control | 3 | 3 | 4 | 1 | 3 |
| Scenario identification | 3 | 3 | 3 | 0 | 0 |
| Easy for data reviewing | 2 | 2 | 4 | 2 | 4 |
| Consistency | 2 | 2 | 4 | 2 | 4 |
| Real time (same time) | 3 | 3 | 4 | 1 | 3 |
| At a distance (different place) | 3 | 3 | 5 | 2 | 6 |
| Scalability | 4 | 4 | 4 | 0 | 0 |
| Guided user interface | 3 | 3 | 0 | −3 | −9 |
| Total | 15 |
Publisher’s Note: MDPI stays neutral with regard to jurisdictional claims in published maps and institutional affiliations. |
© 2021 by the authors. Licensee MDPI, Basel, Switzerland. This article is an open access article distributed under the terms and conditions of the Creative Commons Attribution (CC BY) license (https://creativecommons.org/licenses/by/4.0/).
Share and Cite
MDPI and ACS Style
Sánchez-Cifo, M.Á.; Montero, F.; López, M.T. MuseStudio: Brain Activity Data Management Library for Low-Cost EEG Devices. Appl. Sci. 2021, 11, 7644. https://0-doi-org.brum.beds.ac.uk/10.3390/app11167644
AMA Style
Sánchez-Cifo MÁ, Montero F, López MT. MuseStudio: Brain Activity Data Management Library for Low-Cost EEG Devices. Applied Sciences. 2021; 11(16):7644. https://0-doi-org.brum.beds.ac.uk/10.3390/app11167644
Chicago/Turabian StyleSánchez-Cifo, Miguel Ángel, Francisco Montero, and María Teresa López. 2021. "MuseStudio: Brain Activity Data Management Library for Low-Cost EEG Devices" Applied Sciences 11, no. 16: 7644. https://0-doi-org.brum.beds.ac.uk/10.3390/app11167644
Note that from the first issue of 2016, this journal uses article numbers instead of page numbers. See further details here.