Article

Spatio-Temporal Variation of Reference Evapotranspiration and Its Climatic Drivers over the Tibetan Plateau during 1970–2018

1
Beijing Laboratory of Water Resources Security, College of Resource Environment and Tourism, Capital Normal University, Beijing 100048, China
2
Land Satellite Remote Sensing Application Center (LASAC), Beijing 100048, China
3
Key Laboratory of Water Cycle & Related Land Surface Process, Institute of Geographic Sciences and Natural Resources Research, Chinese Academy of Sciences, Beijing 100101, China
*
Authors to whom correspondence should be addressed.
Submission received: 2 July 2021 / Revised: 16 August 2021 / Accepted: 26 August 2021 / Published: 30 August 2021
(This article belongs to the Special Issue New Trends in Air Quality and Climate Change Interlinks)

Abstract

:
Reference evapotranspiration (ET0) is a key component of hydrologic cycle and it is important for water resources management. Analysis of ET0 changes is particularly critical for understanding the impacts of climatic change on hydrology in ecologically fragile regions. In this study, using the Penman–Monteith method and the Mann–Kendall test, the variation characteristics of ET0 on the Tibetan Plateau (TP) from 1970 to 2018 was analyzed, and the dominant climatic factors controlling the change of ET0 was also explored. The result shows that in TP region: (1) there was an abrupt change in the trend of ET0 around 1997, and the ET0 declined at a rate of −25.9 mm/decade during 1970–1996 but increased by 31.1 mm/decade during 1997–2018; (2) ET0 is most sensitive to solar radiation, then relative humidity, wind speed and mean temperature; (3) the decrease of ET0 before 1997 was mainly due to the decline of wind speed and the increase of relative humidity, while the increase of ET0 after 1997 was mainly due to the decrease of relative humidity. The results of this study can provide data reference for the research of water balance on the TP.

1. Introduction

As a link between water balance and surface energy balance [1], evapotranspiration is an important index reflecting climate variation and water circulation [2,3]. Reference evapotranspiration (ET0) represents the maximum amount of evapotranspiration from a hypothetical reference surface under specific climatic conditions, given an adequate supply of water [4]. ET0 plays a critical role in irrigation management [5] and is also an important parameter for agriculture water demand estimation and water balance analysis [6]. The Penman–Monteith (P-M) method is a fairly reliable method to estimate ET0, which considers radiative and aerodynamic terms [7]. It focuses on the meteorological factors controlling evaporation process and is widely used in numerous research [8,9]. Understanding the spatial–temporal changes in ET0 and the main causes can provide considerable understanding into the impact of climatic variation on water resources and hydrological cycles [10].
Extensive research has explored the spatial variation characteristics of ET0 and the impact of climate factors on ET0 in the late years [11]. It reported that pan-evaporation and ET0 both have shown a steady downward trend in many regions of the world over the past several decades, including China, India, New Zealand and Italy [12,13,14,15], which is called ‘evaporation paradox’ [16]. The reasons for decreasing ET0 have been widely discussed, global dimming and wind stilling were usually employed to explain the changes. For example, Han et al. [17] analyzed the entire trend in ET0 in Jing-Jin-Ji region, finding that the decrease of wind speed and sunshine hours offset the influence of increased air temperature and led to a reduction in ET0 before 1992. Xu et al. [18] found downward trends in ET0 in the Yellow River and the reduction of wind speed was the major driving force for decreasing trends. However, in recent years, increased ET0 has been found in some regions, such as India and China [19]. Investigating long term change in ET0 over India’s humid tropical Narmada River watershed, Pandey et al. [20] found an increasing trend in ET0. Cong et al. [21] found that annual pan evaporation in China has increased since 1986. The changes in climatic variables such as air temperature, wind speed may explain the increase of ET0. The increase of pan evaporation in China is mainly owing to the increase of vapor pressure deficit [21]. Liu et al. [22] investigated the ET0 trends in the Northwest China from 1960 to 2010, finding the ET0 began to increase in 1994, mainly caused by the increasing atmospheric temperature and wind speed. Since there are many factors affecting ET0, the temporal and spatial differences between its changes and the changes of climate factors are complex and diverse. In addition, it is still uncertain how much ET0 changes are caused by a certain factor. Therefore, it is necessary to further study the variation of ET0 and its possible causes.
The Tibetan Plateau (TP), as the ‘third pole’ of the earth, is very sensitive to global change due to its unique climate conditions and natural environment [23]. The TP is rich in lakes, glaciers, and wetlands and is the main source area of several major rivers in Asia. The management of affluent water resources on the plateau are not only a major issue related to China, but also the neighboring countries located in the lower reaches of the international rivers originating from the plateau. The management of abundant water ET0 is the key constituent of the hydrologic cycle and has a great impact on regional water resources. Several studies have focused on the variation of ET0 over the TP under the background of climatic change [3,24,25]. Zhang et al. [26] pointed out that the decrease of wind speed and sunshine duration were the dominant factors for the significant decline of ET0 in the northern and southeastern TP from 1971 to 2004. Wang et al. [27] pointed out that ET0 increased from 1997 to 2014 and the reduction of relative humidity played a crucial role in increasing of ET0. This study will analyze and quantify the possible abrupt change characteristics of ET0 and the impact of climatic factors on ET0 during different stages over the TP.
This paper focused on the following objectives: (1) to analyze the temporal–spatial trends and transition characteristics of ET0 from 1970 to 2018 on the TP region; (2) to investigate the temporal–spatial variation characteristics of climatic variables controlling the evaporation process; (3) to identify the main climate reasons for ET0 change in different stages. The findings can improve the understanding of climate change impacts on ET0 and provide useful information for water resources management and sustainable development.

2. Materials and Methods
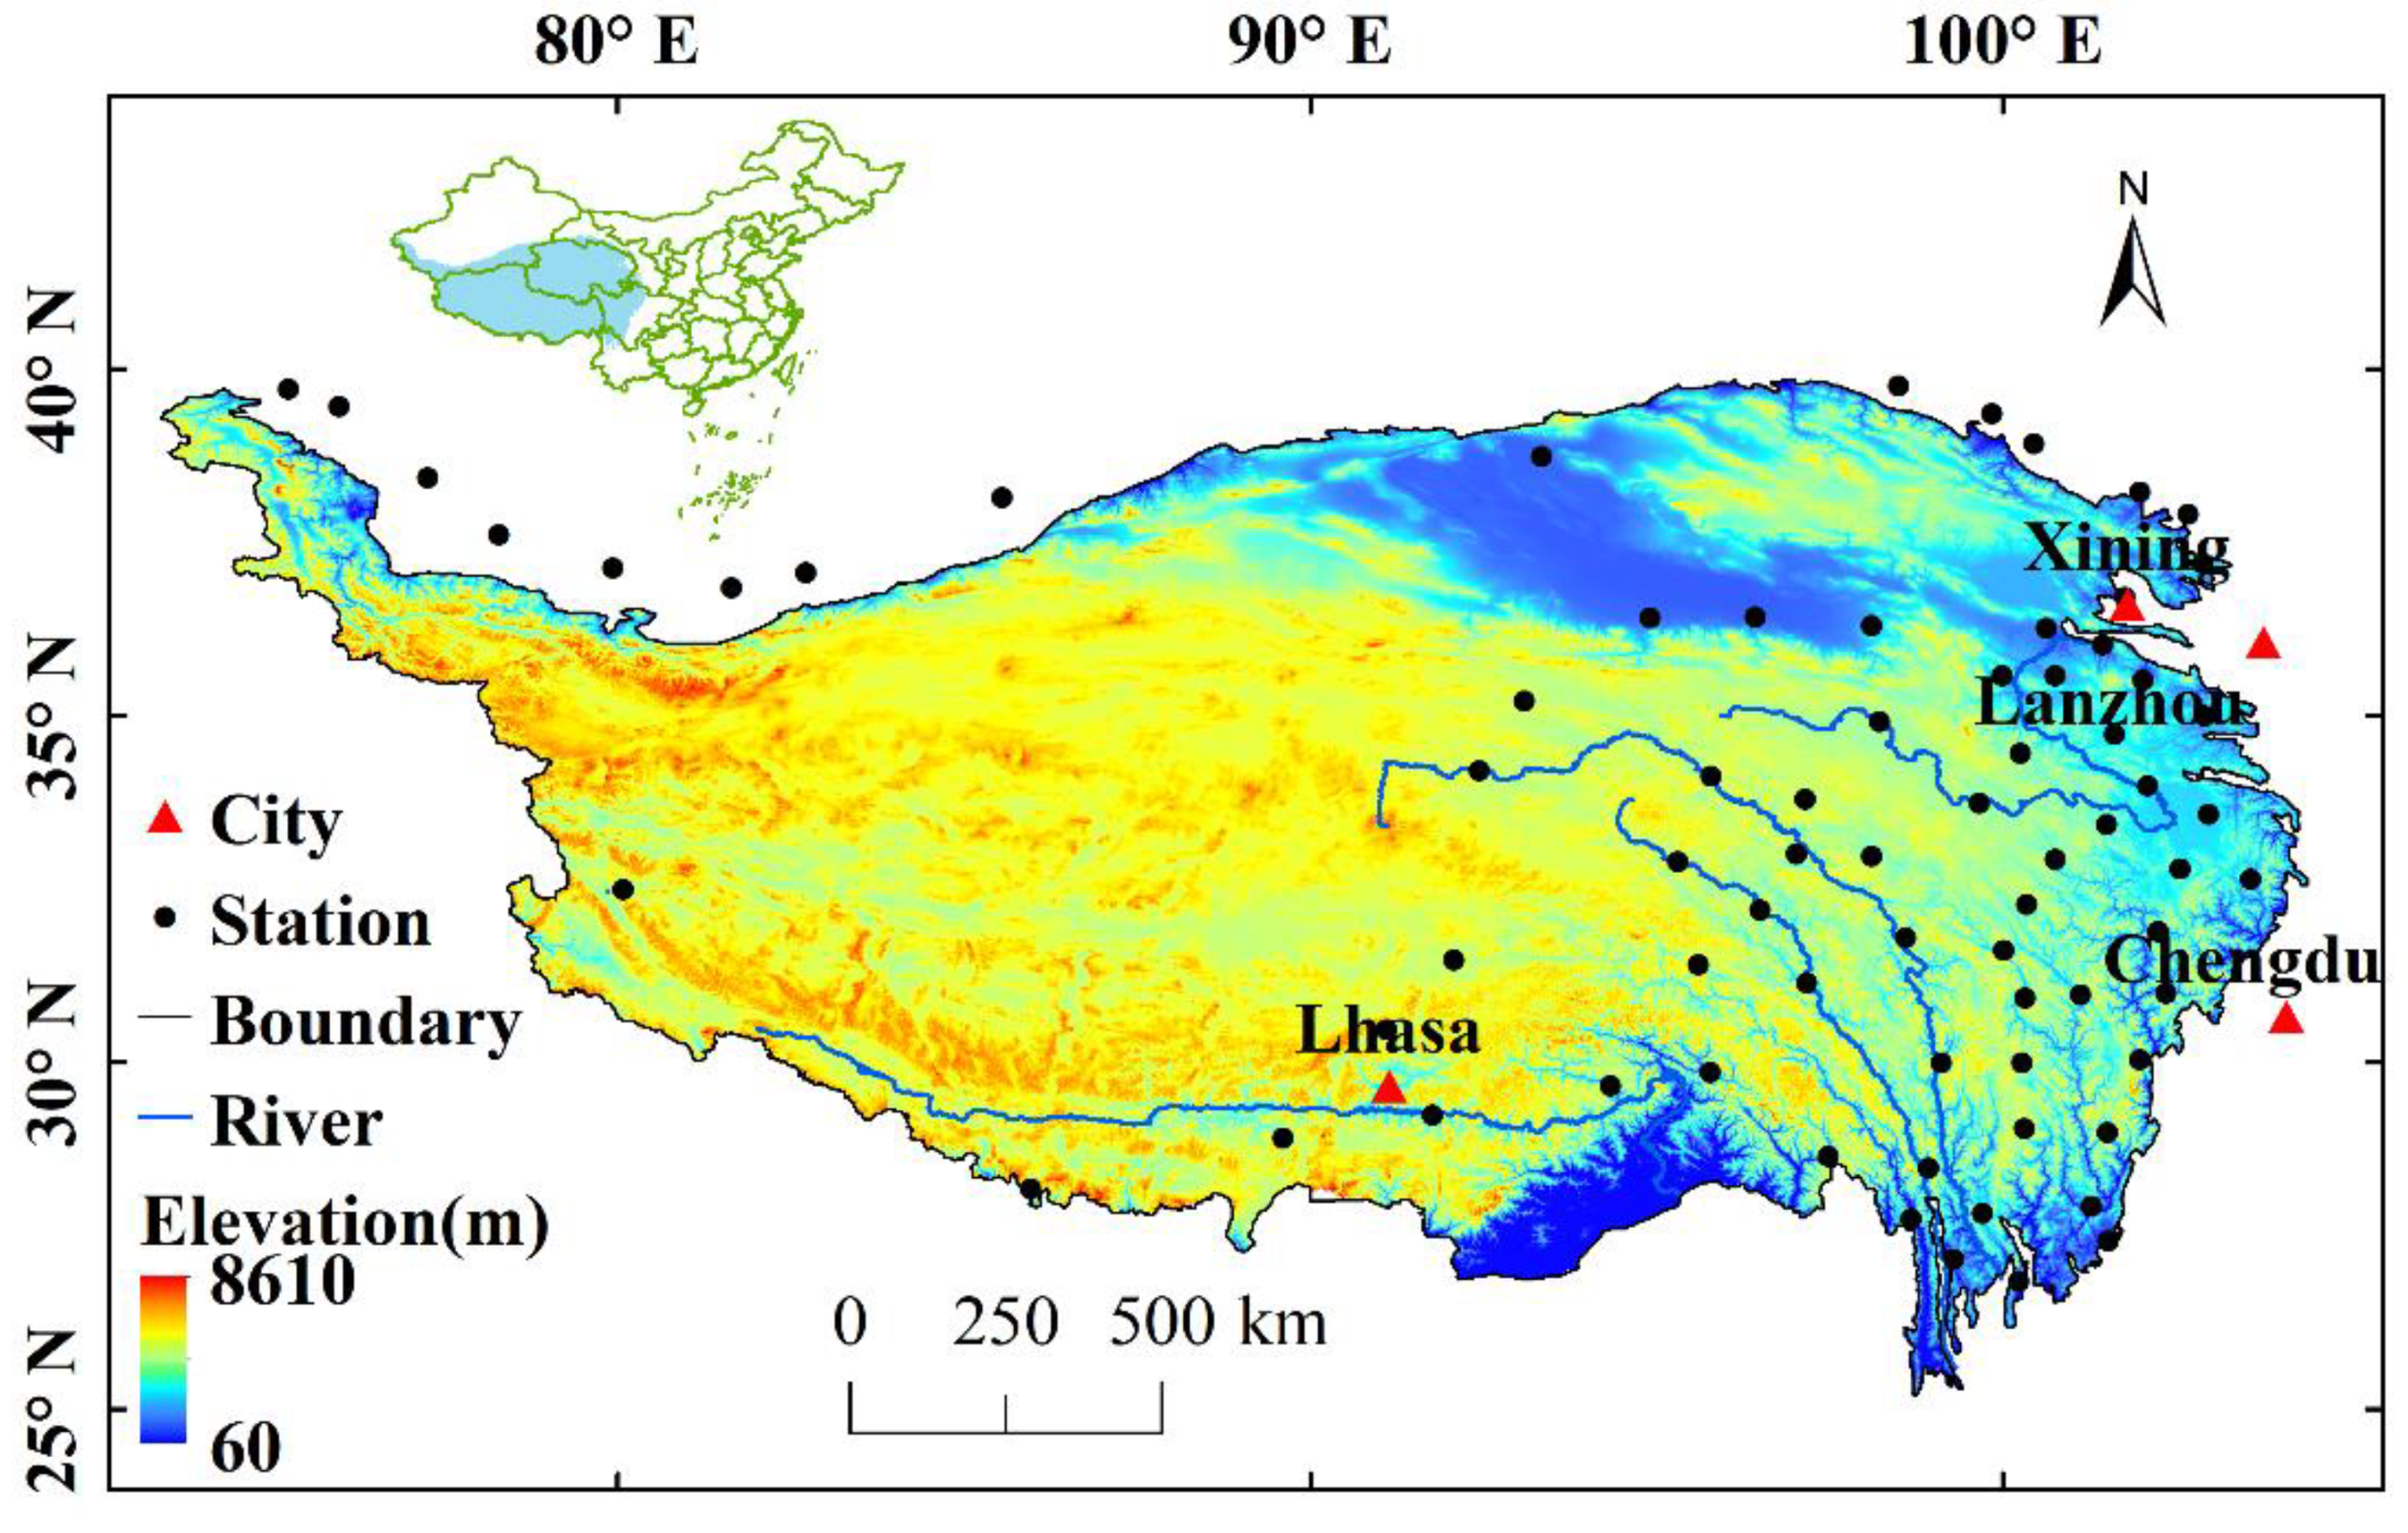
2.1. Study Area

The TP is the largest geomorphologic unit on the Eurasian continent, ranging from 25°–40° N and 75°–105° E, covering most of the Tibet Autonomous Region and Qinghai Province in western China, with a total area of more than 2.5 million km2 (Figure 1). The TP is the highest and most extensive plateau in the world, known as the ‘roof of the world’, with about 56% of the region over 4000 m above sea level [28]. Due to its high altitude and large volume, it forms a unique ‘plateau climate’. The annual average temperature of the TP is reduced from 20 °C in the southeast to below −6 °C in the northwest. The annual precipitation is also reduced from 2000 mm to below 50 mm. The main vegetation cover in this area is grassland and forest. The grassland is mainly divided into alpine meadow, alpine grassland and alpine desert [29].

2.2. Data Sources

Daily meteorological records from 73 meteorological stations in and around the TP during the period 1970–2018 were used in this study and the altitude of these stations ranges from 1231.2 to 4645.1 m. The meteorological data includes daily average air temperature, maximum air temperature, minimum air temperature, relative humidity, wind speed, air pressure, sunshine duration and the 20 cm pan evaporation. These datasets were provided by the China Meteorological Data Service Center (CMDC) (http://data.cma.cn/, accessed on 6 May 2019) and were processed with quality control. The 90 m DEM data set of the TP is provided by Geospatial Data Cloud site, Computer Network Information Center, Chinese Academy of Sciences (http://www.gscloud.cn, accessed on 12 August 2019).

2.3. Methods

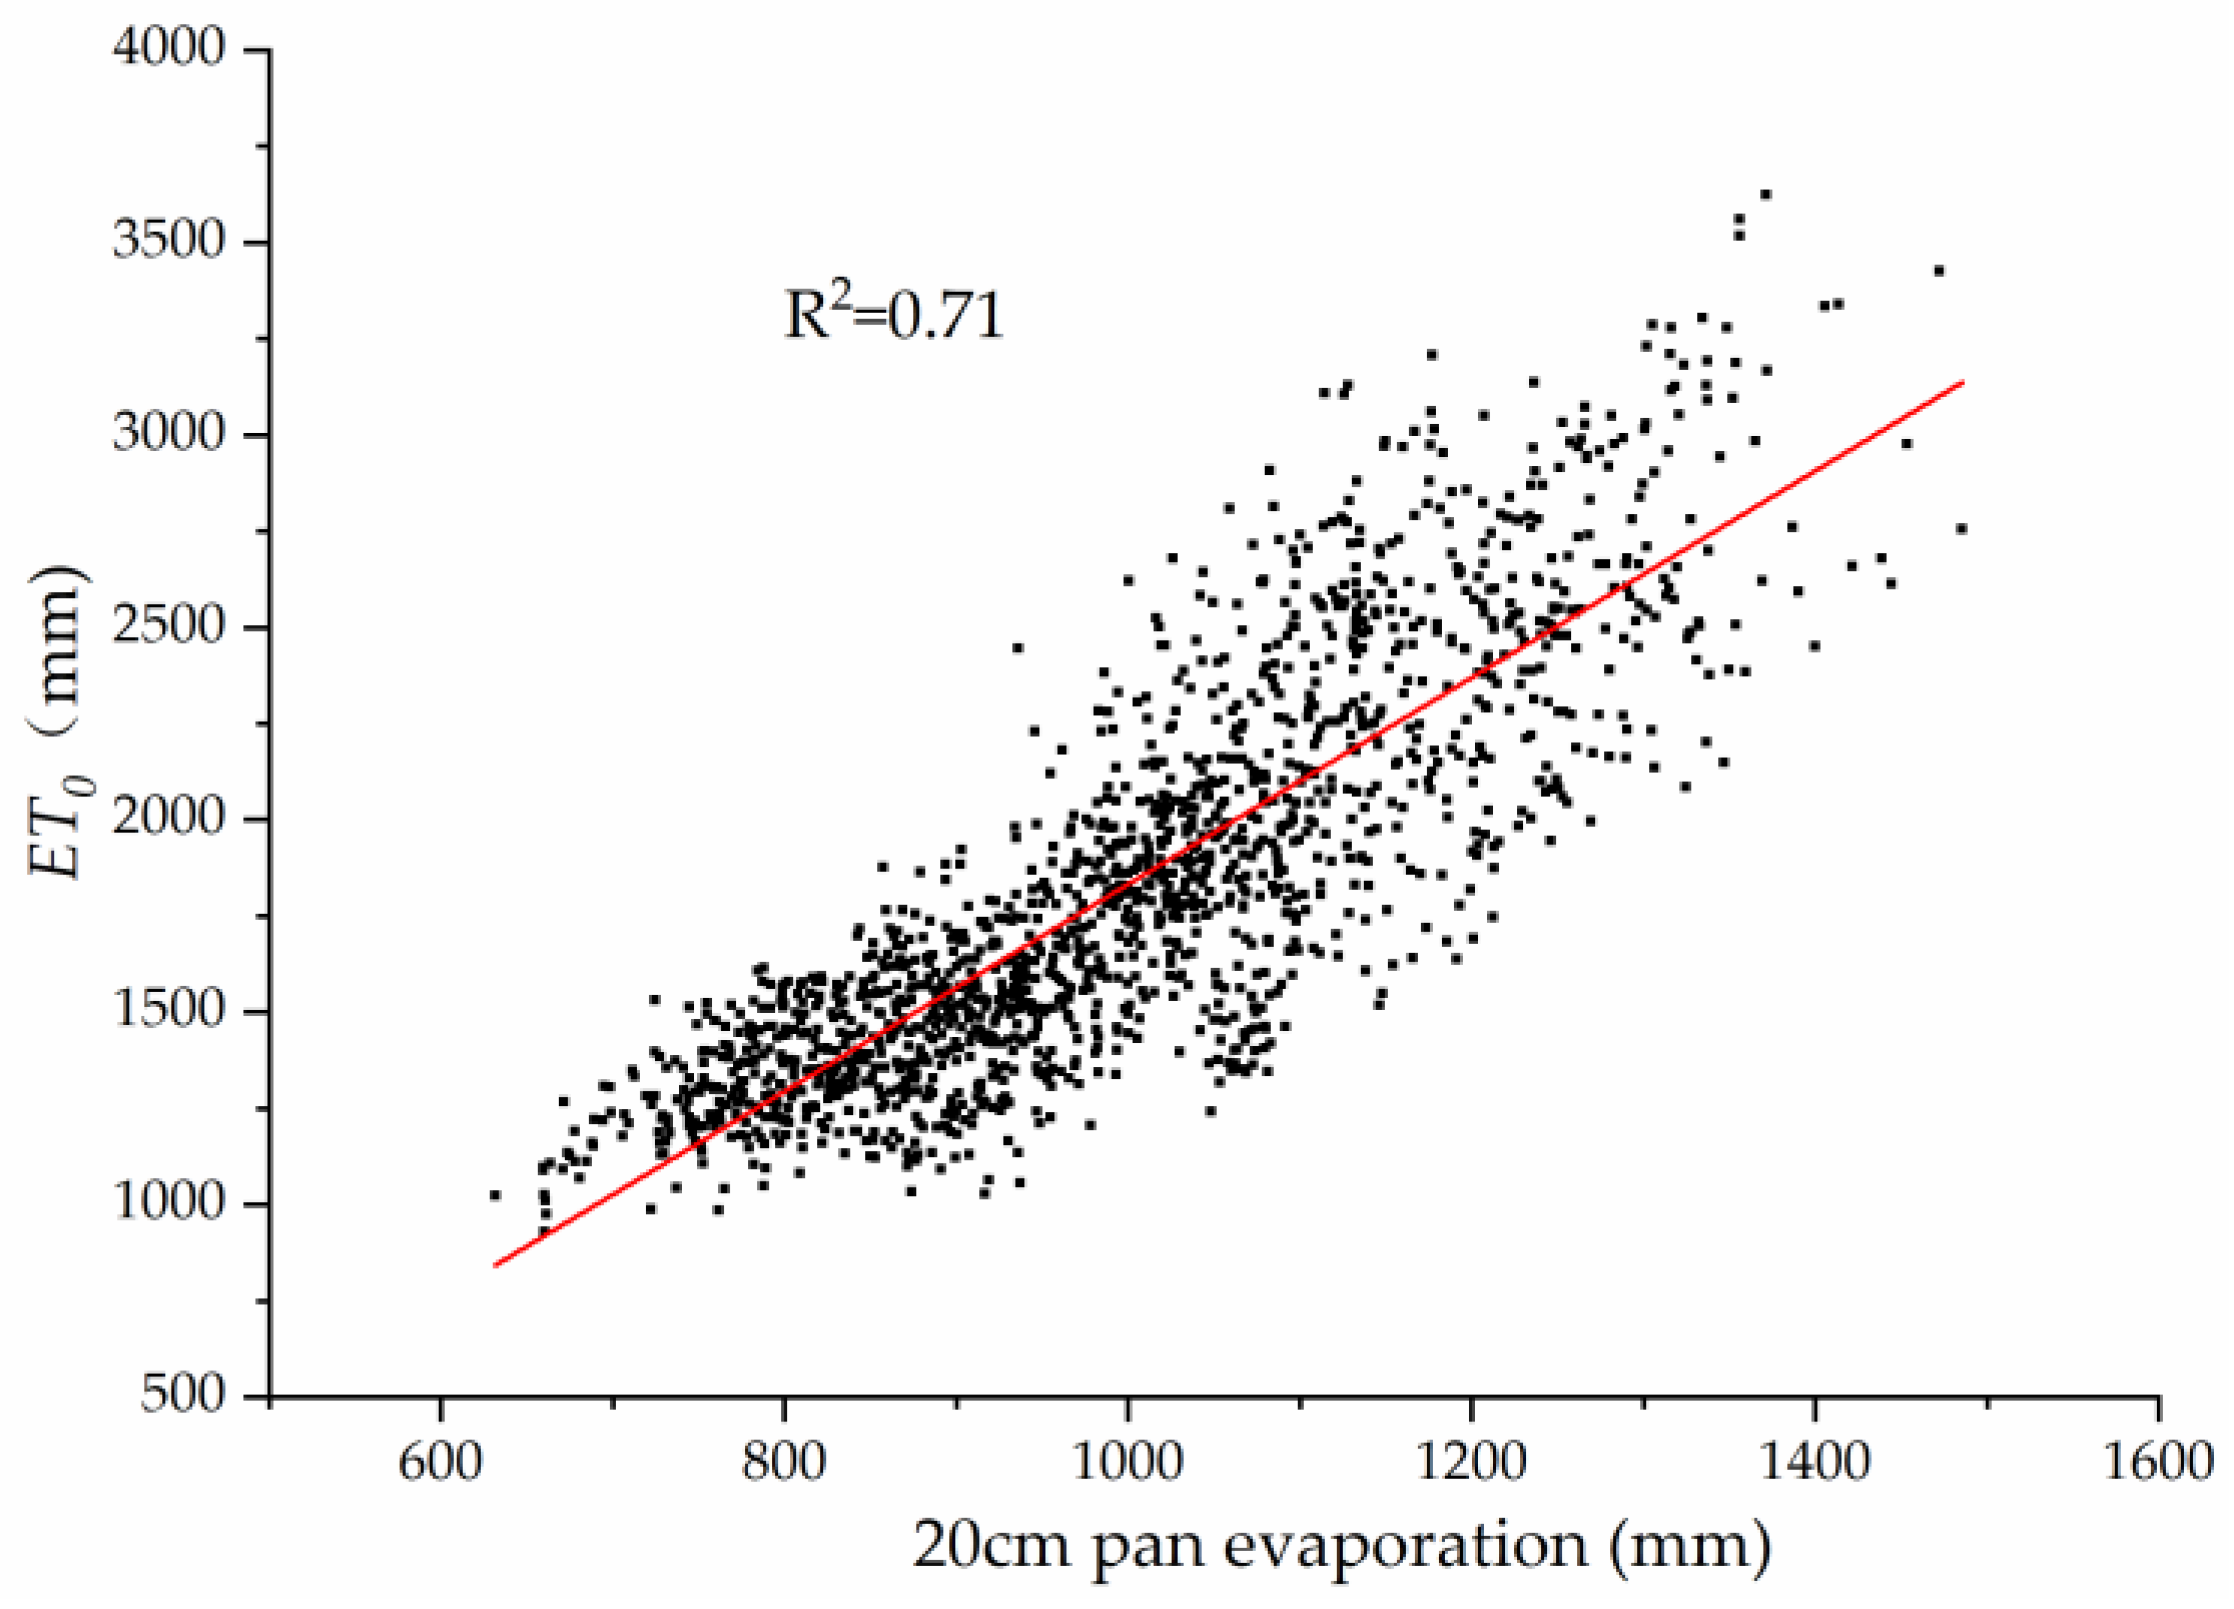
2.3.1. Calculation of ET0

Penman–Monteith (P-M) formula was used to estimate daily ET0 in this article which was proposed by the FAO (Food and Agriculture Organization). The P-M method estimates ET0 from hypothetical reference grass with an assumed height of 0.12 m, a fixed surface resistance of 70 m·s−1, and an albedo of 0.23 [30]. The formula is:
E T 0 = 0.408 Δ R n G + γ 900 T m e a n + 273 U 2 e s e a Δ + γ 1 + 0.34 U 2
where ET0 is the daily reference evapotranspiration (mm/d), Δ is the slope of the vapor pressure curve and γ is the psychometric constant (kPa/°C), Rn is the net radiation and G is the soil heat flux density (MJ·m−2·day−1), Tmean is the mean air temperature (°C), U2 is the wind speed at 2 m height (m/s), es is the saturation vapor pressure and ea is the actual vapor pressure (kPa).
Reference evapotranspiration and pan evaporation both represent evaporative capacity of a basin under certain climatic conditions and their good relationship had been manifested by previous research [31]. The pan coefficient and correlation between them were calculated to verify the applicability of the P-M model (Figure 2). The correlation coefficient between pan evaporation and reference evapotranspiration was 0.71 with a pan coefficient of 1.75, which indicates that the P-M model is suitable for the analysis of reference evapotranspiration on the TP.

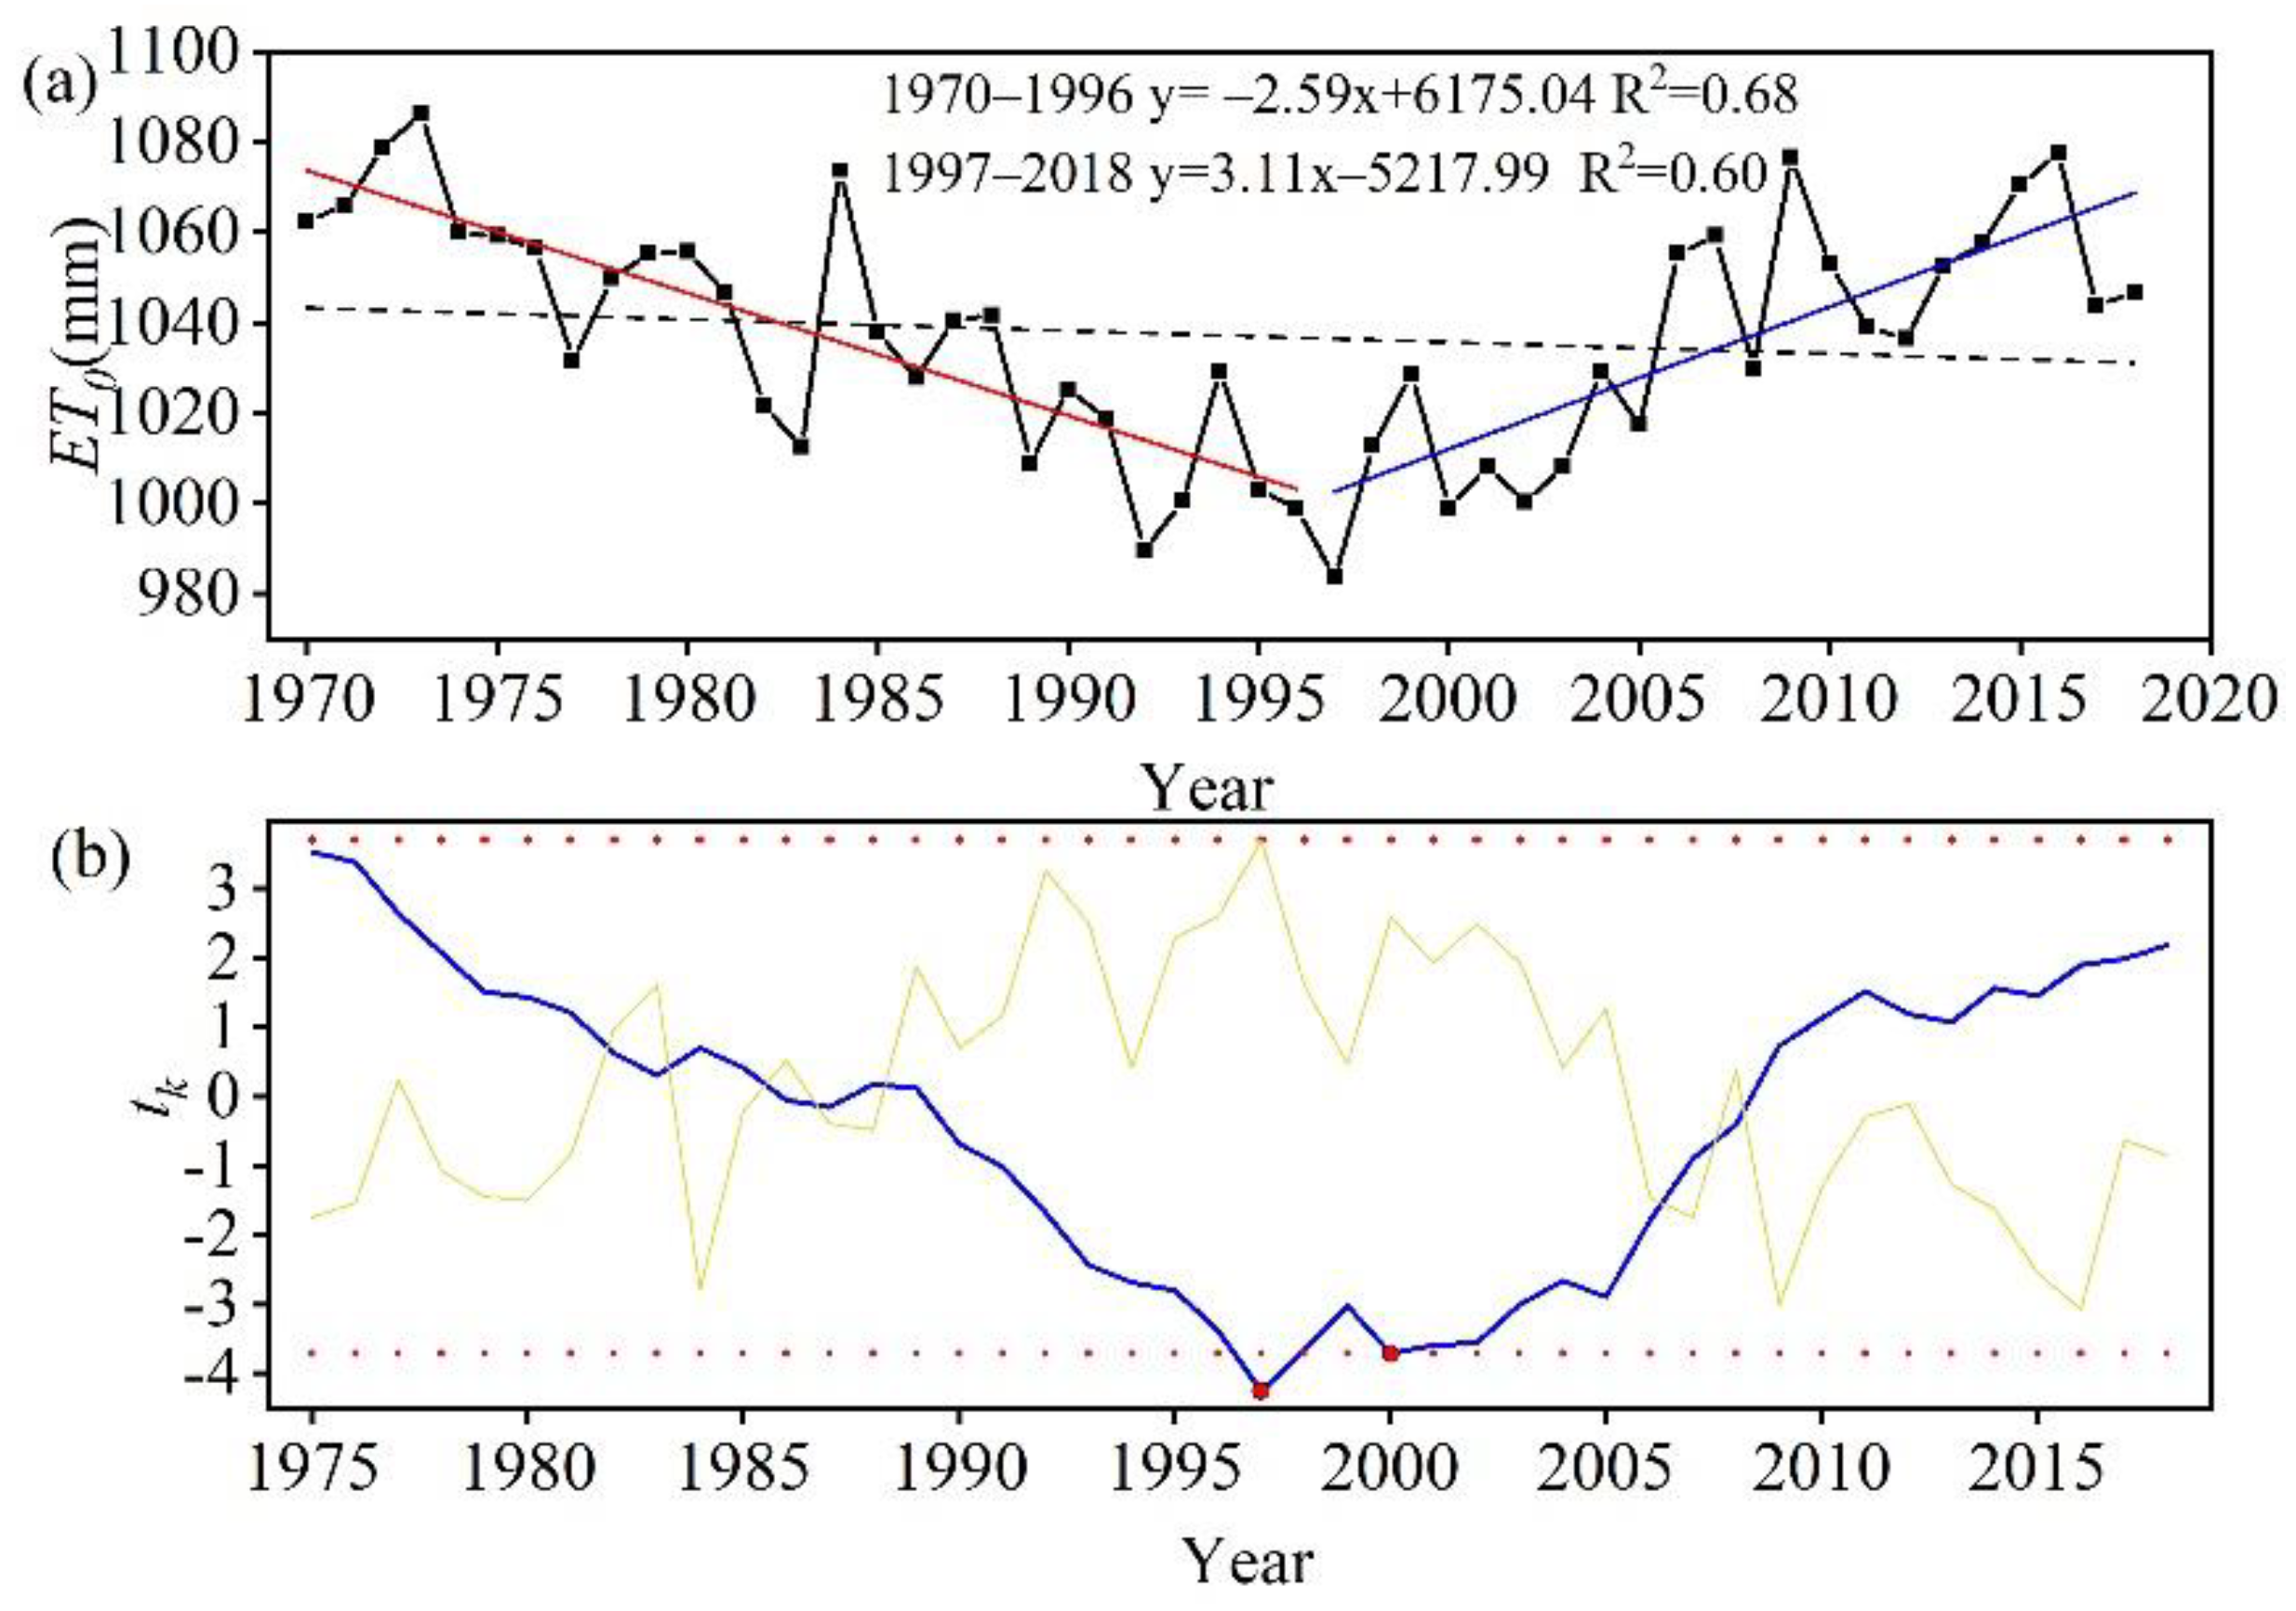
2.3.2. Cramer Test for Abrupt Change Point

The Cramer test is used to detect the mutation of ET0 series. Cramer’s test has displayed fine performance in checking the stabilization of records by comparing the whole average value of the record and the means of certain parts of the record [32]. The Cramer’s test statistic tk is calculated as follows:
t k = n N 2 N n 1 + τ k 2 × τ k
τ k = x ¯ k x ¯ S , x ¯ k = 1 n i = k + 1 k + n x i , x ¯ = 1 N i = 1 N x i
where x ¯ and S are the mean and standard deviation, for the entire period of N years, and x ¯ k is the mean of the sub period of the n years to be compared with x ¯ .

2.3.3. Mann–Kendall Test for Trend Analysis

The Mann–Kendall (MK) test is used to analyze ET0 and climate factors trends. This method does not need to consider the distribution form of the detection sequence, and can exclude the influence of individual extreme values on the sequence test, which is suitable for testing the trend change of time series of meteorological, hydrological and other types of variables [32,33]. It is highly recommended for general use by the World Meteorological Organization [34]. Its principle is as follows: the original assumption is that H0 is n (x1, x2, ..., xn) independent time series samples with the same distribution; alternative hypothesis H1 is a bilateral test, the statistical value S is calculated as follows [17]:
S = i = 2 n j 1 i 1 s i g n ( X i X j )
  s i g n X i X j = 1 X i X j > 0 0 X i X j = 0 1 X i X j < 0
where: any ij, in, jn, when S approximately obeys normal distribution, and the trend test statistical value Z is obtained by means of S standardization processing:
Z = S 1 V a r S 0 S + 1 V a r S S > 0 S = 0 S < 0
If |Z| > Z1−α/2, the null hypothesis is rejected with a given confidence level α; namely, there is a significant trend in the time series data. When α is equal to 0.05, Z1−α is equal to 1.96, respectively. The Z value is used to assess the statistics trend; a positive Z value expresses an upward trend, a negative Z value expresses a downward trend.
The annual change rate of data is evaluated by the least square method. The principle is to look for the best function matching of data by minimizing the square sum of errors [35].

2.3.4. Spatial Interpolation Method

Spatial interpolation is very important for obtaining the spatial distribution characteristics of climate variables when meteorological stations are few and widely separated. In this paper, the gradient plus inverse distance squared (GIDS) method is used for interpolating climate variables and ET0 [36]. It is an inverse distance weighting method that takes into account the changes of meteorological factors with latitude, longitude and altitude. Previous studies have shown that this method has good applicability in areas with large terrain undulations and uneven site distribution [37]. The interpolating climate variable is calculated as follows [36,37]:
Z = [ i = 1 N Z i + X X i × C x + Y Y i × C y + E E i × C e d i 2 ] / [ i = 1 N 1 d i 2 ]
where Z is the estimated climatic variable, Z i is the value at climate station i, di is the distance from the site to climate station i and N is the number of climate stations used for the interpolation. X, Y and E are the longitude, latitude, and altitude of the point to be estimated, respectively, Xi, Yi and Ei are the longitude, latitude, and altitude of climate station i, respectively, and Cx, Cy and Ce are regression coefficients for X, Y and E, respectively.
The daily ET0 of 73 meteorological stations on the TP in 1970–2018 is calculated and transformed into ET0 at annual scale. The annual average ET0 on the TP is obtained by interpolating the annual ET0 of 73 stations to the centroid of the area using the GIDS method.

2.3.5. Sensitivity Analysis and Contribution Rate Calculation

The sensitivity coefficient method is used to analyze the sensitivity of climate factors to ET0 quantitatively [38]. The commonly used sensitivity analysis method is to assume that other variables are fixed, and to evaluate the impact of a variable change on the model output. The sensitivity coefficient of the ET0 to a climate variable x is defined by [39,40]:
S x = l i m Δ x 0 Δ E T 0 / E T 0 Δ x / x = E T 0 x · x E T 0
A first-order Taylor series approximation was applied to calculate S x [41,42]:
S x = Δ E T 0 Δ x · x E T 0
where S x is the sensitivity coefficient of the climate variable x, Δ x is the relative change of climate factor x, and Δ E T 0 is the relative change in ET0 induced by Δ x .
In this study, ET0 was recalculated by making a ±10% change to each meteorological factors (solar radiation (RS), relative humidity (RH), air temperature (Tmean) and wind speed (U2)) while keeping the other factors constant; sensitivity coefficient S x was calculated from Equation (9). A positive value of S x indicates that ET0 increases as x increases, and vice versa. The greater the absolute value of the sensitivity coefficient, the greater the effect of the variable on ET0.
The sensitivity coefficient reflects the influence of meteorological variables on ET0, but it is not equal to the ET0 change caused by a certain variable. Here, the contribution rate is introduced to analyze the change of ET0 caused by a single meteorological factor. It is the product of the sensitivity coefficient of a climate factor and its multi-year change rate [11]. A positive contribution means that the variety of a meteorological factor has a positive effect on the variety of ET0 and vice versa. The larger the absolute value is, the greater the impact on ET0 will be. The contribution rate was calculated using the following formulas [43,44]:
C R x = S x · R C x
R C x = n · a x x ¯ × 100 %
where C R x is the contribution rate climate variable x to ET0; R C x is the multi-year change rate of x ; n is the number of years; a x represents the trend rate of meteorological factor x during the corresponding study period; x ¯ is the multi-year absolute average value of x during the evaluation period. In this paper, we calculated the sensitivity of ET0 to RS, RH, Tmean and U2, and calculated the contribution rate of these four climatic factors to ET0. The evaluation period includes three periods: during the period from 1979 to 2018 and two periods before and after the mutation point.
C _ E T 0 = C R R S + C R R H + C R T m e a n + C R U 2 + ε
where CRRS, CRRH, CRTmean, CRU2 are the individual contributions to the long-term trend in ET0 as a result of the change in RS, RH, Tmean and U2, respectively. C_(ET0) is the sum of the contribution of variation in RS, RH, Tmean and U2 to the change in ET0. ε is the error between C(ET0) and ET0 trend calculated by P-M model (LR_(ET0)).

3. Results

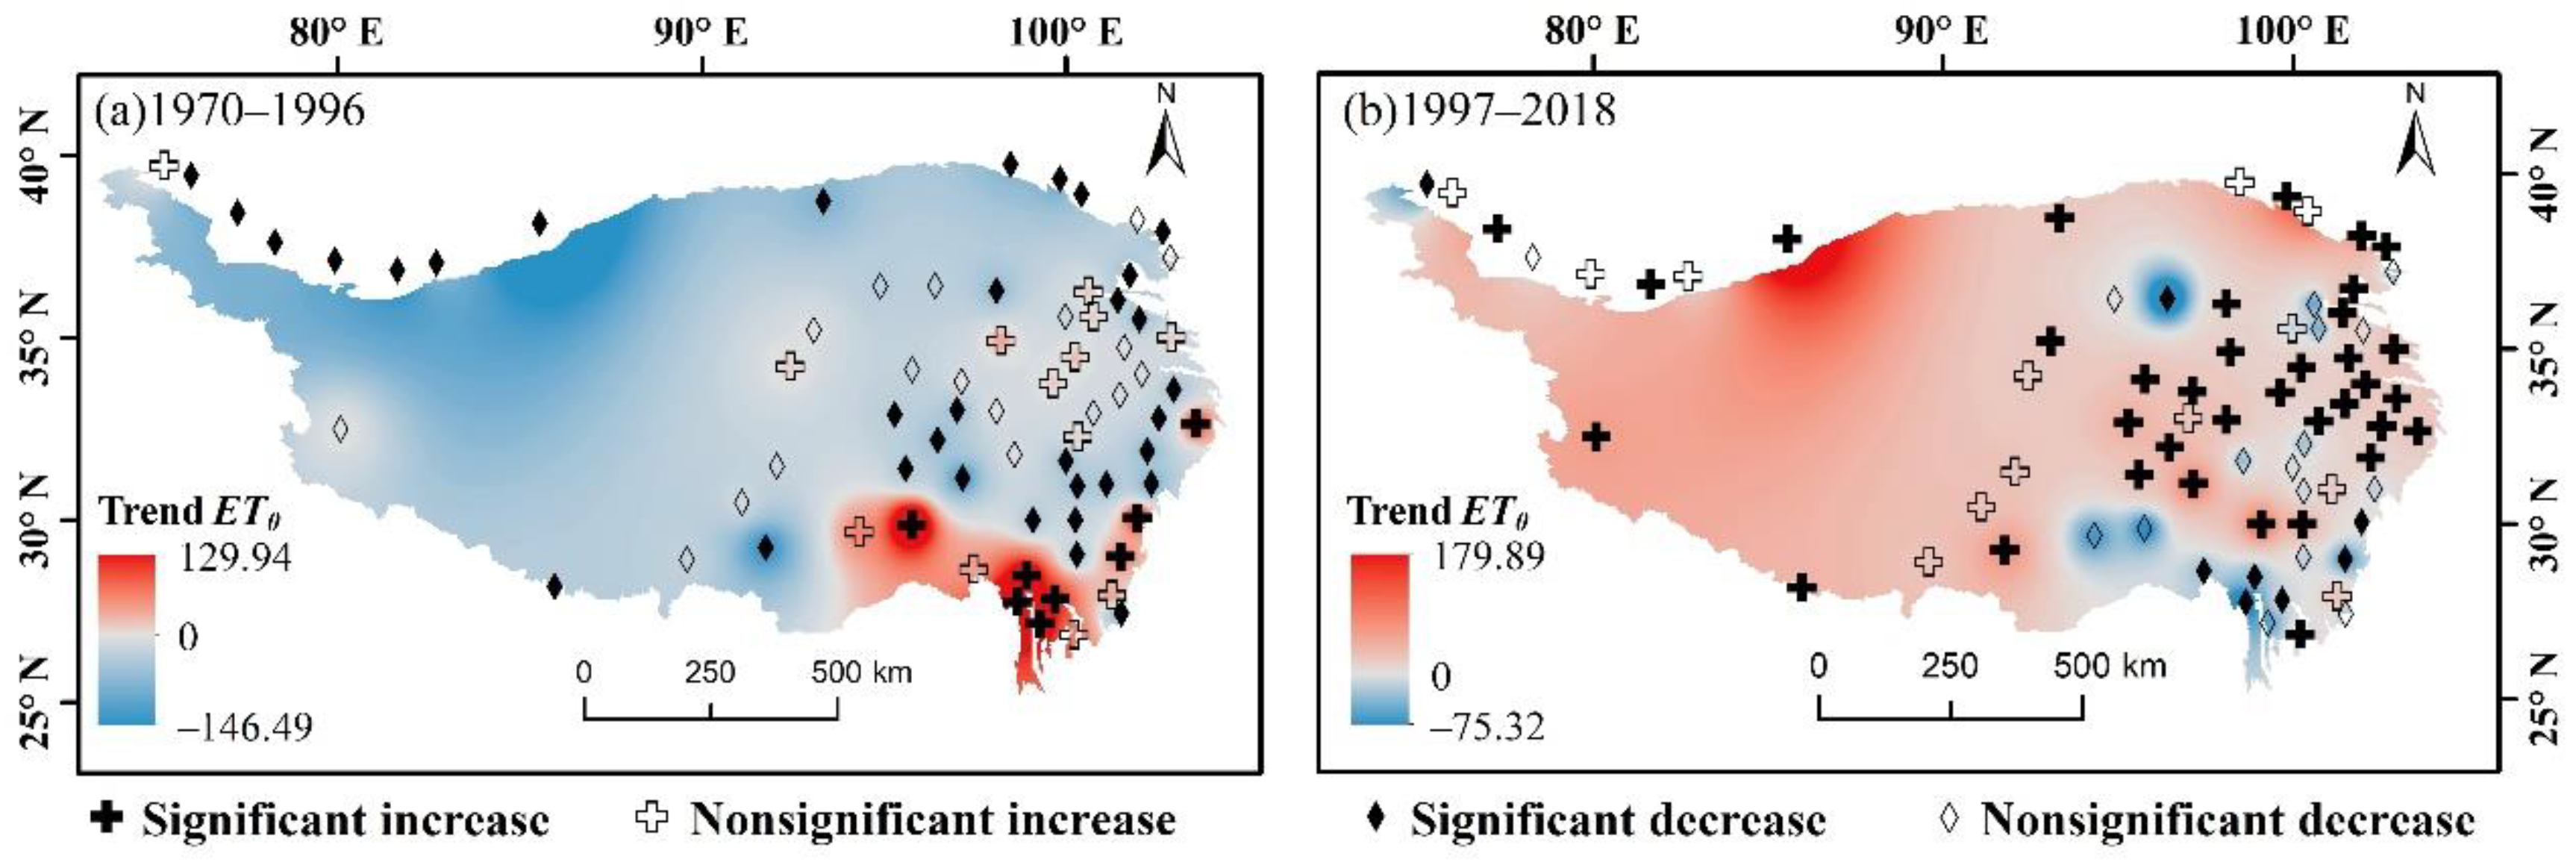
3.1. Spatio-Temporal Variation Characteristics of ET0

Figure 3a shows the tendency of annual ET0 on the TP. The annual average ET0 was 1037.17 mm, ranging from 983.53 to 1091.94 mm from 1979 to 2018. The annual ET0 experienced a non-significant (α = 0.05) decrease by 2.1 mm/decade (Table 1). According to the Cramer’s test, there are two abrupt change points in ET0 series of TP, which are 1997 and 2000, respectively (Figure 3b). We found the decline rate of ET0 was −25.9 mm/decade before 1997 and the change is significant, but the annual ET0 increased significantly (α = 0.05) at a rate of 31.1 mm/decade after 1997. Furthermore, the Cramer’s test was also performed on all 73 stations to verify the representativeness of 1997, and the results showed that 41 of them could detect the mutation point in 1997. Therefore, it can represent the main mutation characteristics of ET0 in the region. Since the variation of ET0 is the result of the comprehensive effects of climate variables, it is necessary to analyze each climate variable during the two periods separately. Using the inflection point of ET0 as the basis for dividing the period, all the time series of the 73 stations were divided in these two periods for the subsequent analysis.
Figure 4 shows spatial distribution of ET0 trends on the TP during 1970–1996 and 1997–2018. There were significant spatial differences in the trends of ET0 before and after 1997. During 1970–1996, there are 52 stations showing a downward trend, and these downward trends were remarkable (α = 0.05) at 34 meteorological stations; while 21 stations increased in the southeast TP from 1997 to 2018, there were annual ET0 increasing trends at 49 meteorological stations, of which 36 meteorological stations increased significantly (α = 0.05). Only 24 stations in the eastern TP showed a decreasing trend.

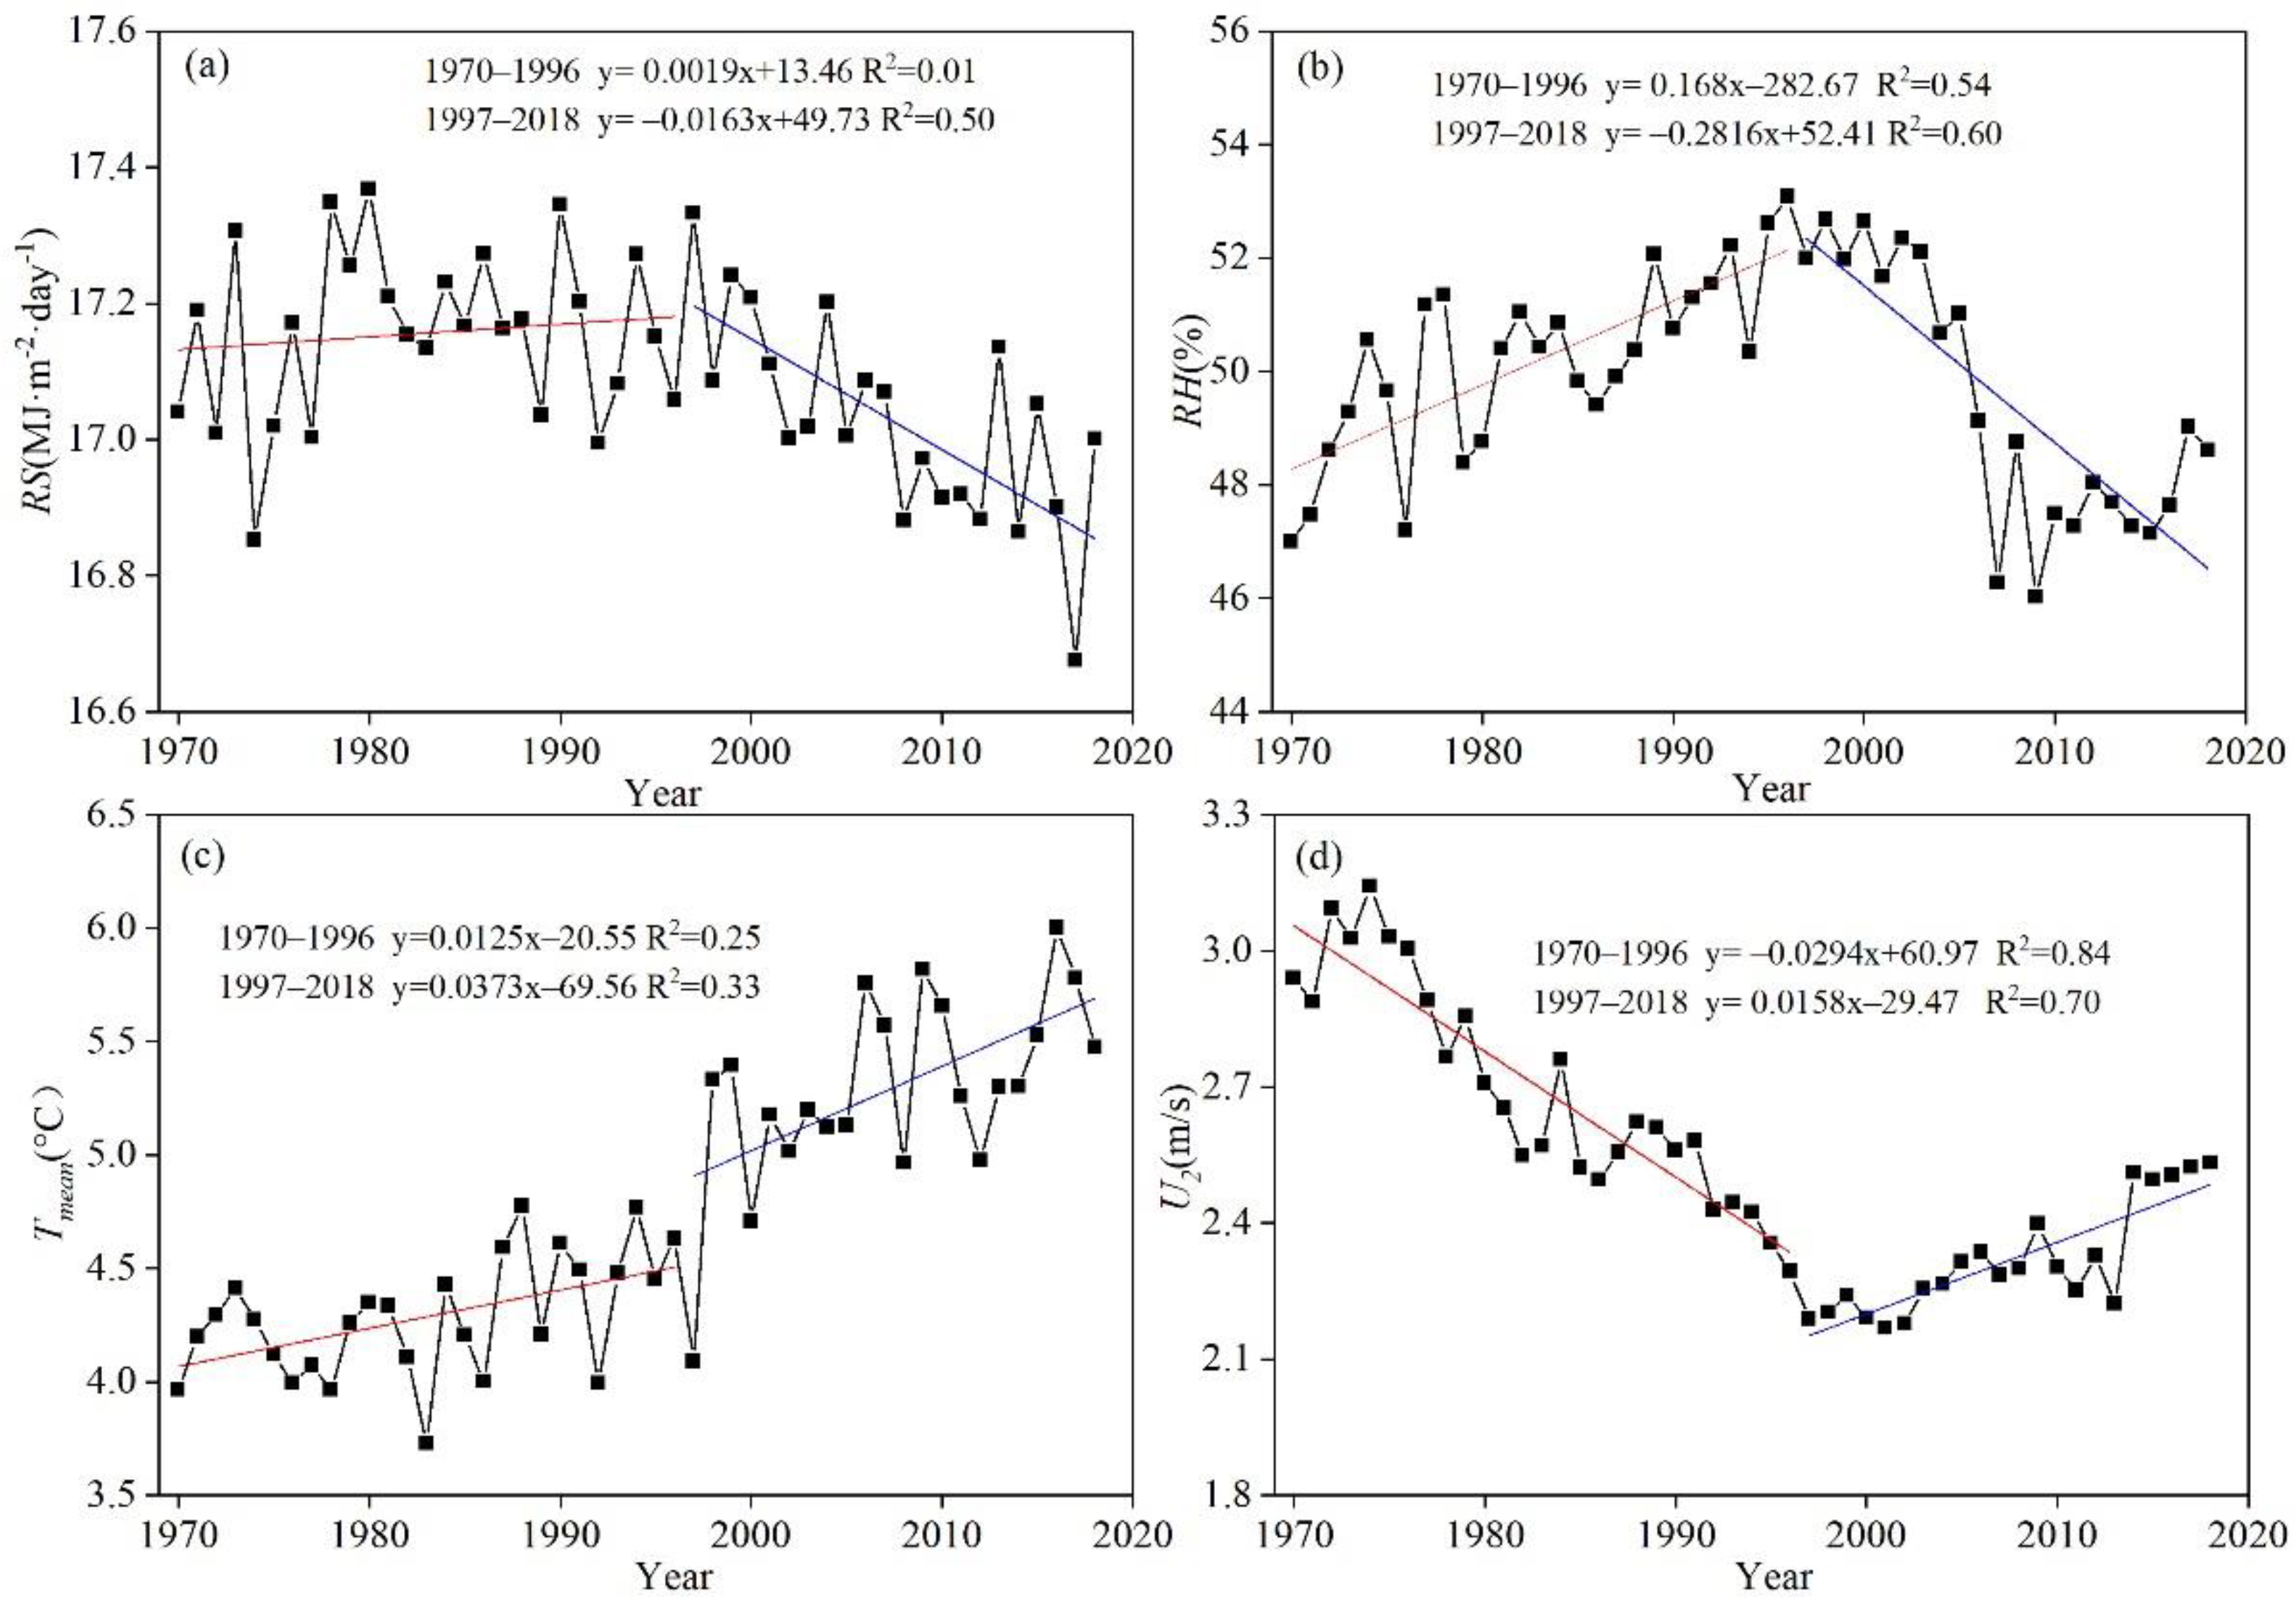
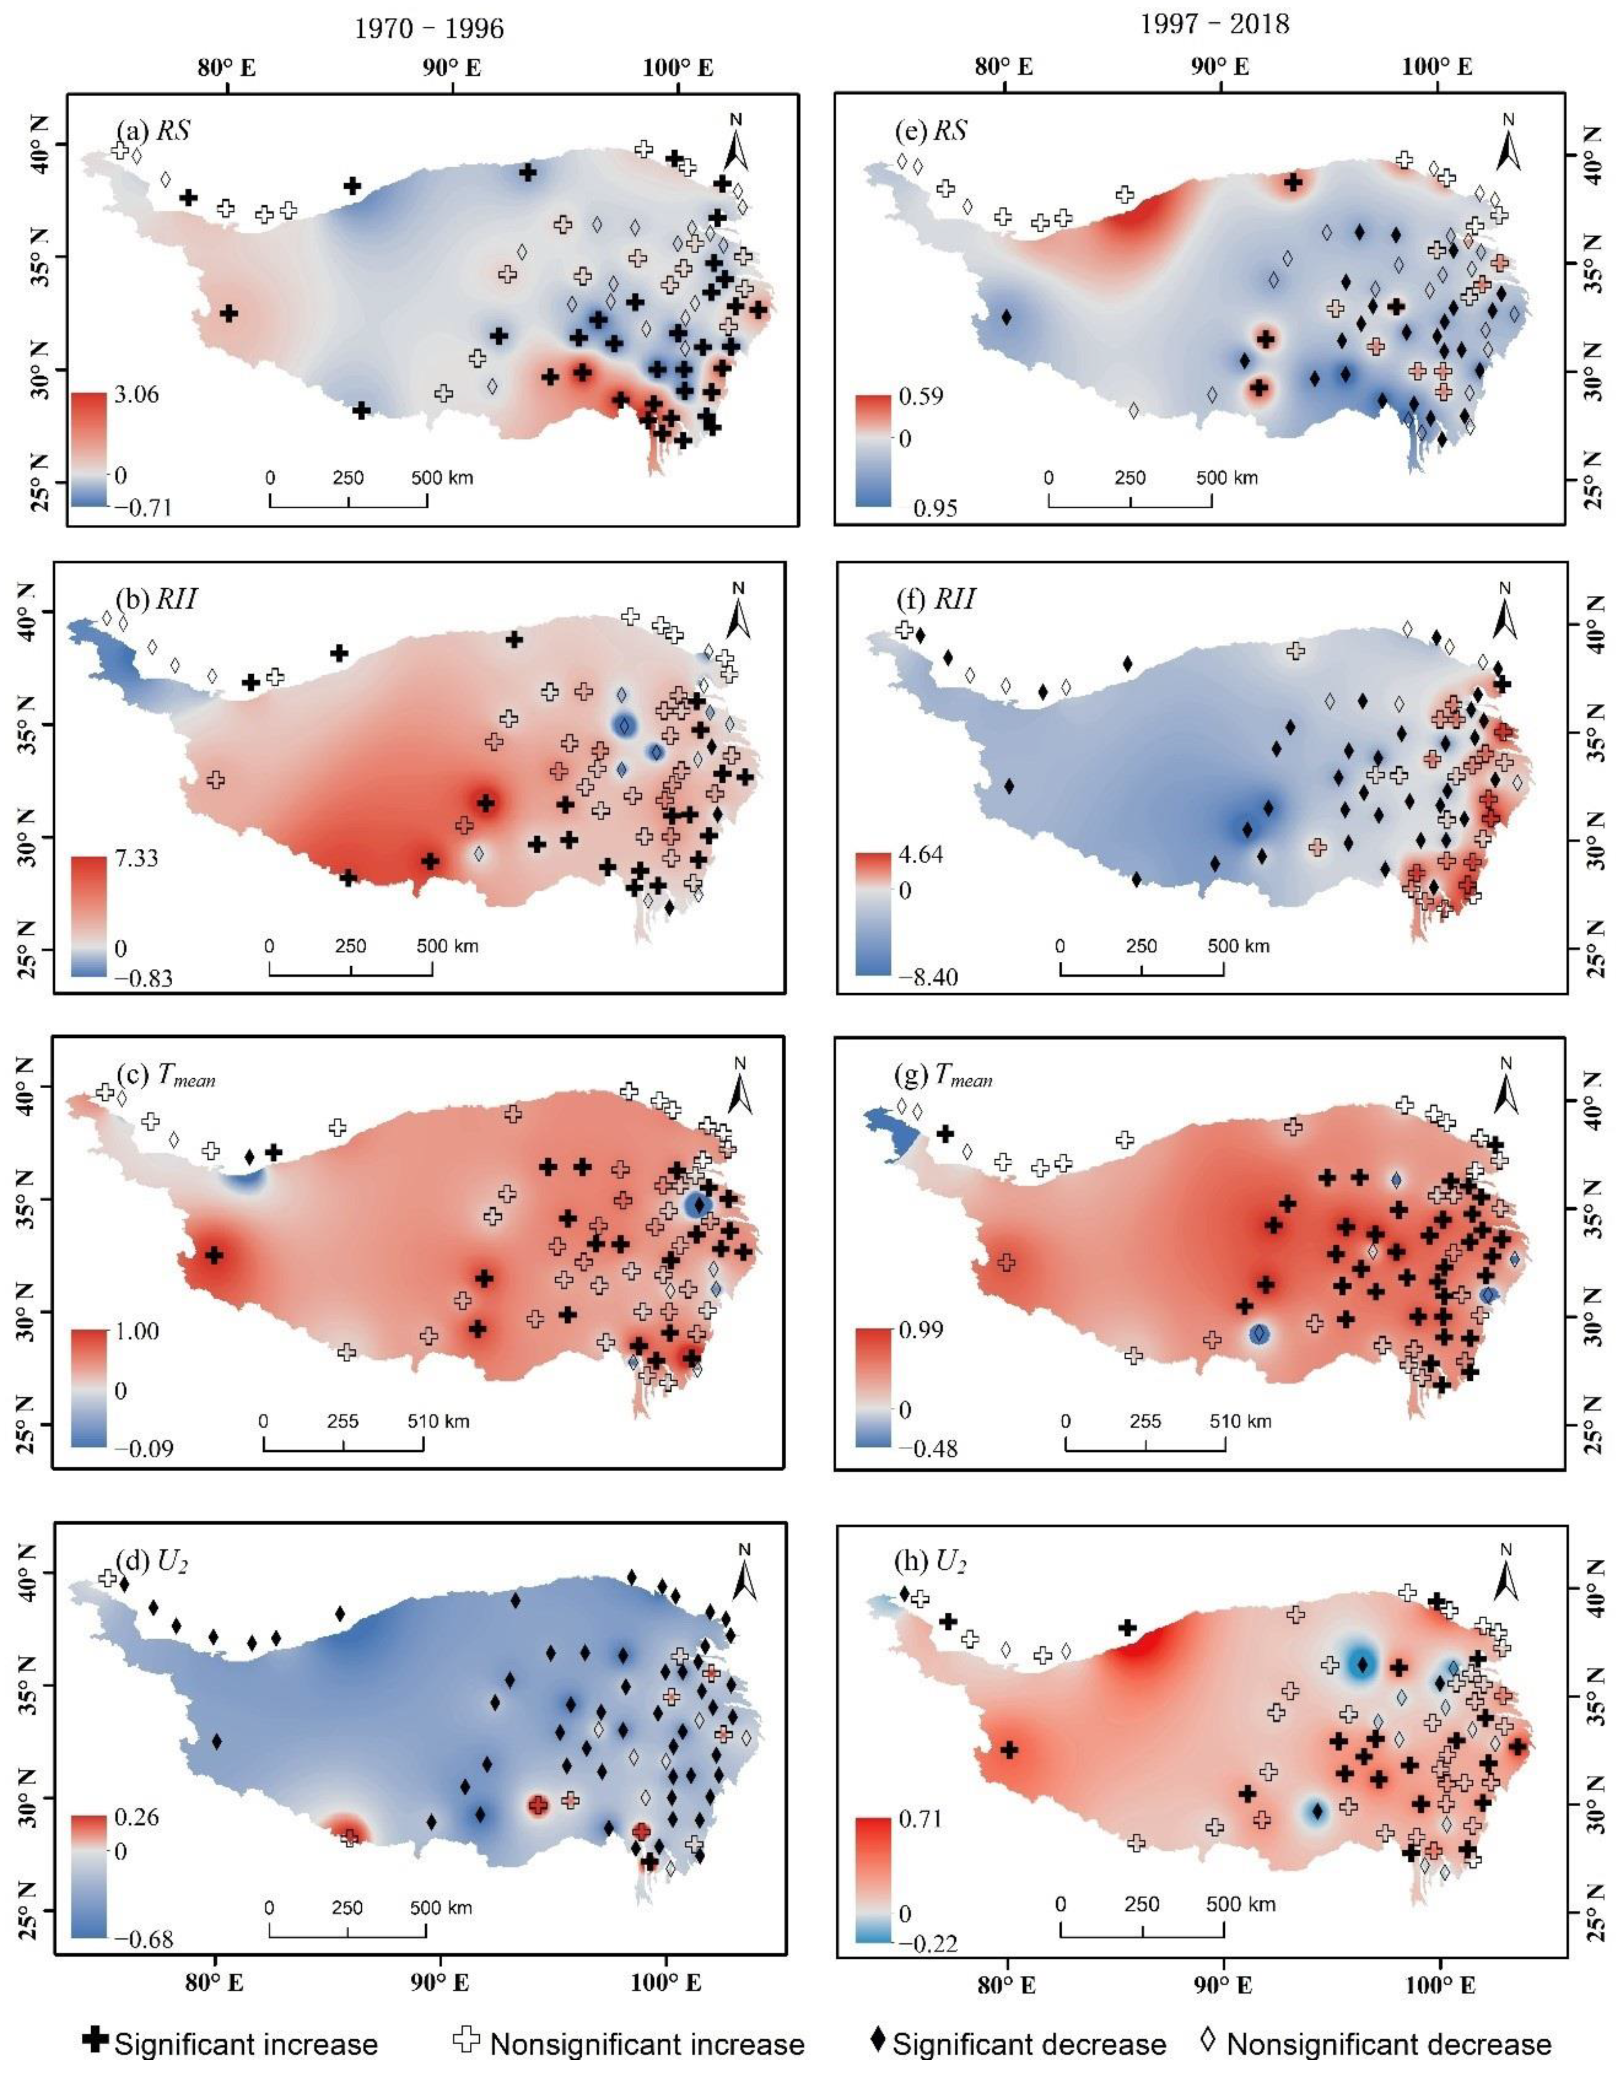
3.2. Spatio-Temporal Variation Characteristics of Climatic Factors

Figure 5 and Table 1 shows the trends of climate variables on the TP from 1970 to 2018. The Tmean increased significantly (α = 0.05) before and after 1997 at the rate of 0.125 and 0.373 °C/decade, respectively. The upward trend was steeper during the latter period than during the former period. RS and RH increased by 0.019 (MJ·m−2·day−1)/decade and 1.68%/decade from 1970 to 1996 and decreased significantly at the rate of −0.163 (MJ·m−2·day−1)/decade and −2.816%/decade after 1997, respectively. The variation of U2 was opposite to the variation of RS and RH. U2 decreased dramatically by 0.294 m/s/decade during the former period but increased significantly by 0.158 m/s/decade during the latter period.
Figure 6 shows the spatial distribution of trends of four climate factors during 1970–1996 and 1997–2018. From 1970 to 1996, the increasing RS distributed partially in the southeast and west of the TP, and the decreasing RS majority distributed in the central area of the TP. From 1997 to 2018, the decreasing RS was found in most stations and the increasing RS distributed in some areas east and north-west of the TP. The increasing RH was found in most stations and the decreasing RH distributed in the north-western areas during 1970–1996, while the decreasing RH was found in most stations and the increasing RH distributed in some areas east of the TP during 1997–2018. Tmean increased across the entire area before and after 1996. From 1970 to 1996, U2 showed a downward trend in most stations, while only a few stations in the eastern part of the plateau showed an increasing trend. However, from 1997 to 2018, U2 of most stations showed an upward trend, and only a few stations decreased.

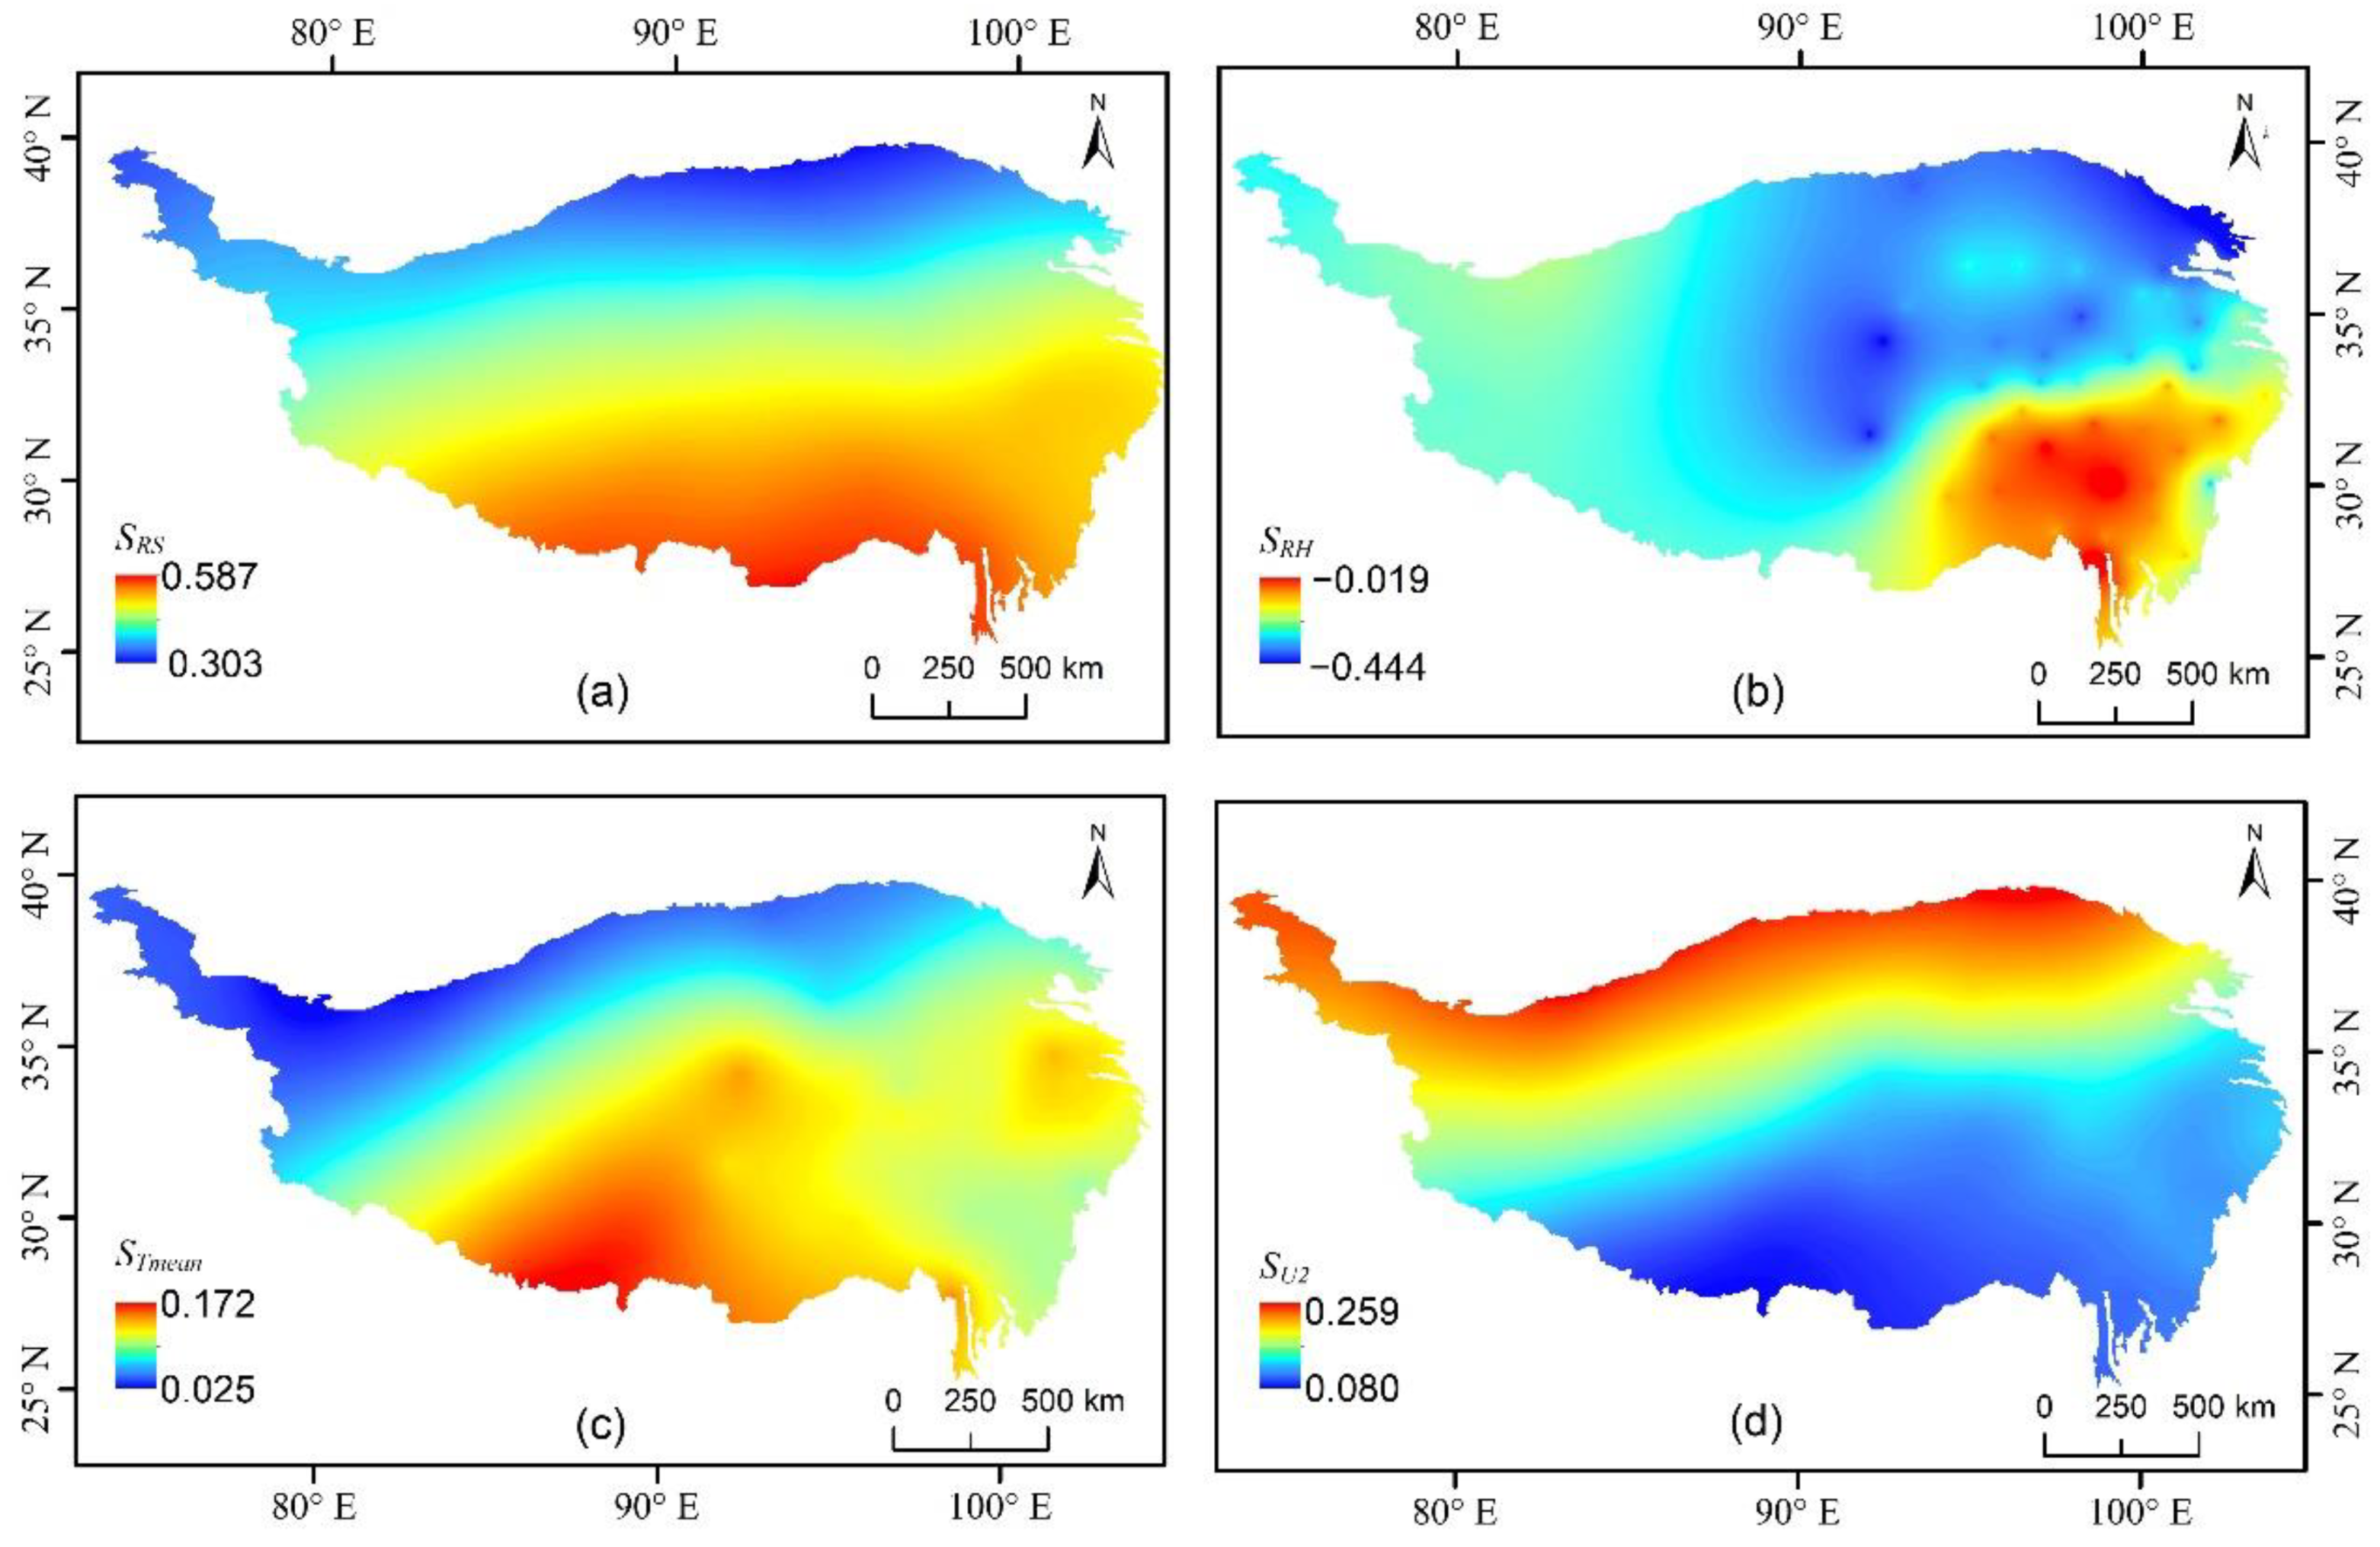
3.3. Spatial Distribution of the Sensitivity Coefficients

Figure 7 shows the spatial distribution of susceptibility coefficients on the TP. The sensitivity coefficient of RS (SRS) ranged from 0.303 to 0.587 and decreased from southeast to northwest on the TP. The sensitivity coefficient of Tmean (STmean) ranged from 0.025 to 0.172, which was similar to SRS. Different from SRS and STmean, the sensitivity coefficient of U2 (SU2) increased progressively from southeast to northwest and varied from 0.080 to 0.259. The sensitivity coefficient of RH (SRH) ranged from −0.444 to −0.019 and the smallest absolute value of the SRH found in the southeast corner of the TP and increases to the north. According to above discussion, the sensitivity of these four factors to the ET0 on the TP was in the order: SRS > SRH > SU2 > STmean.

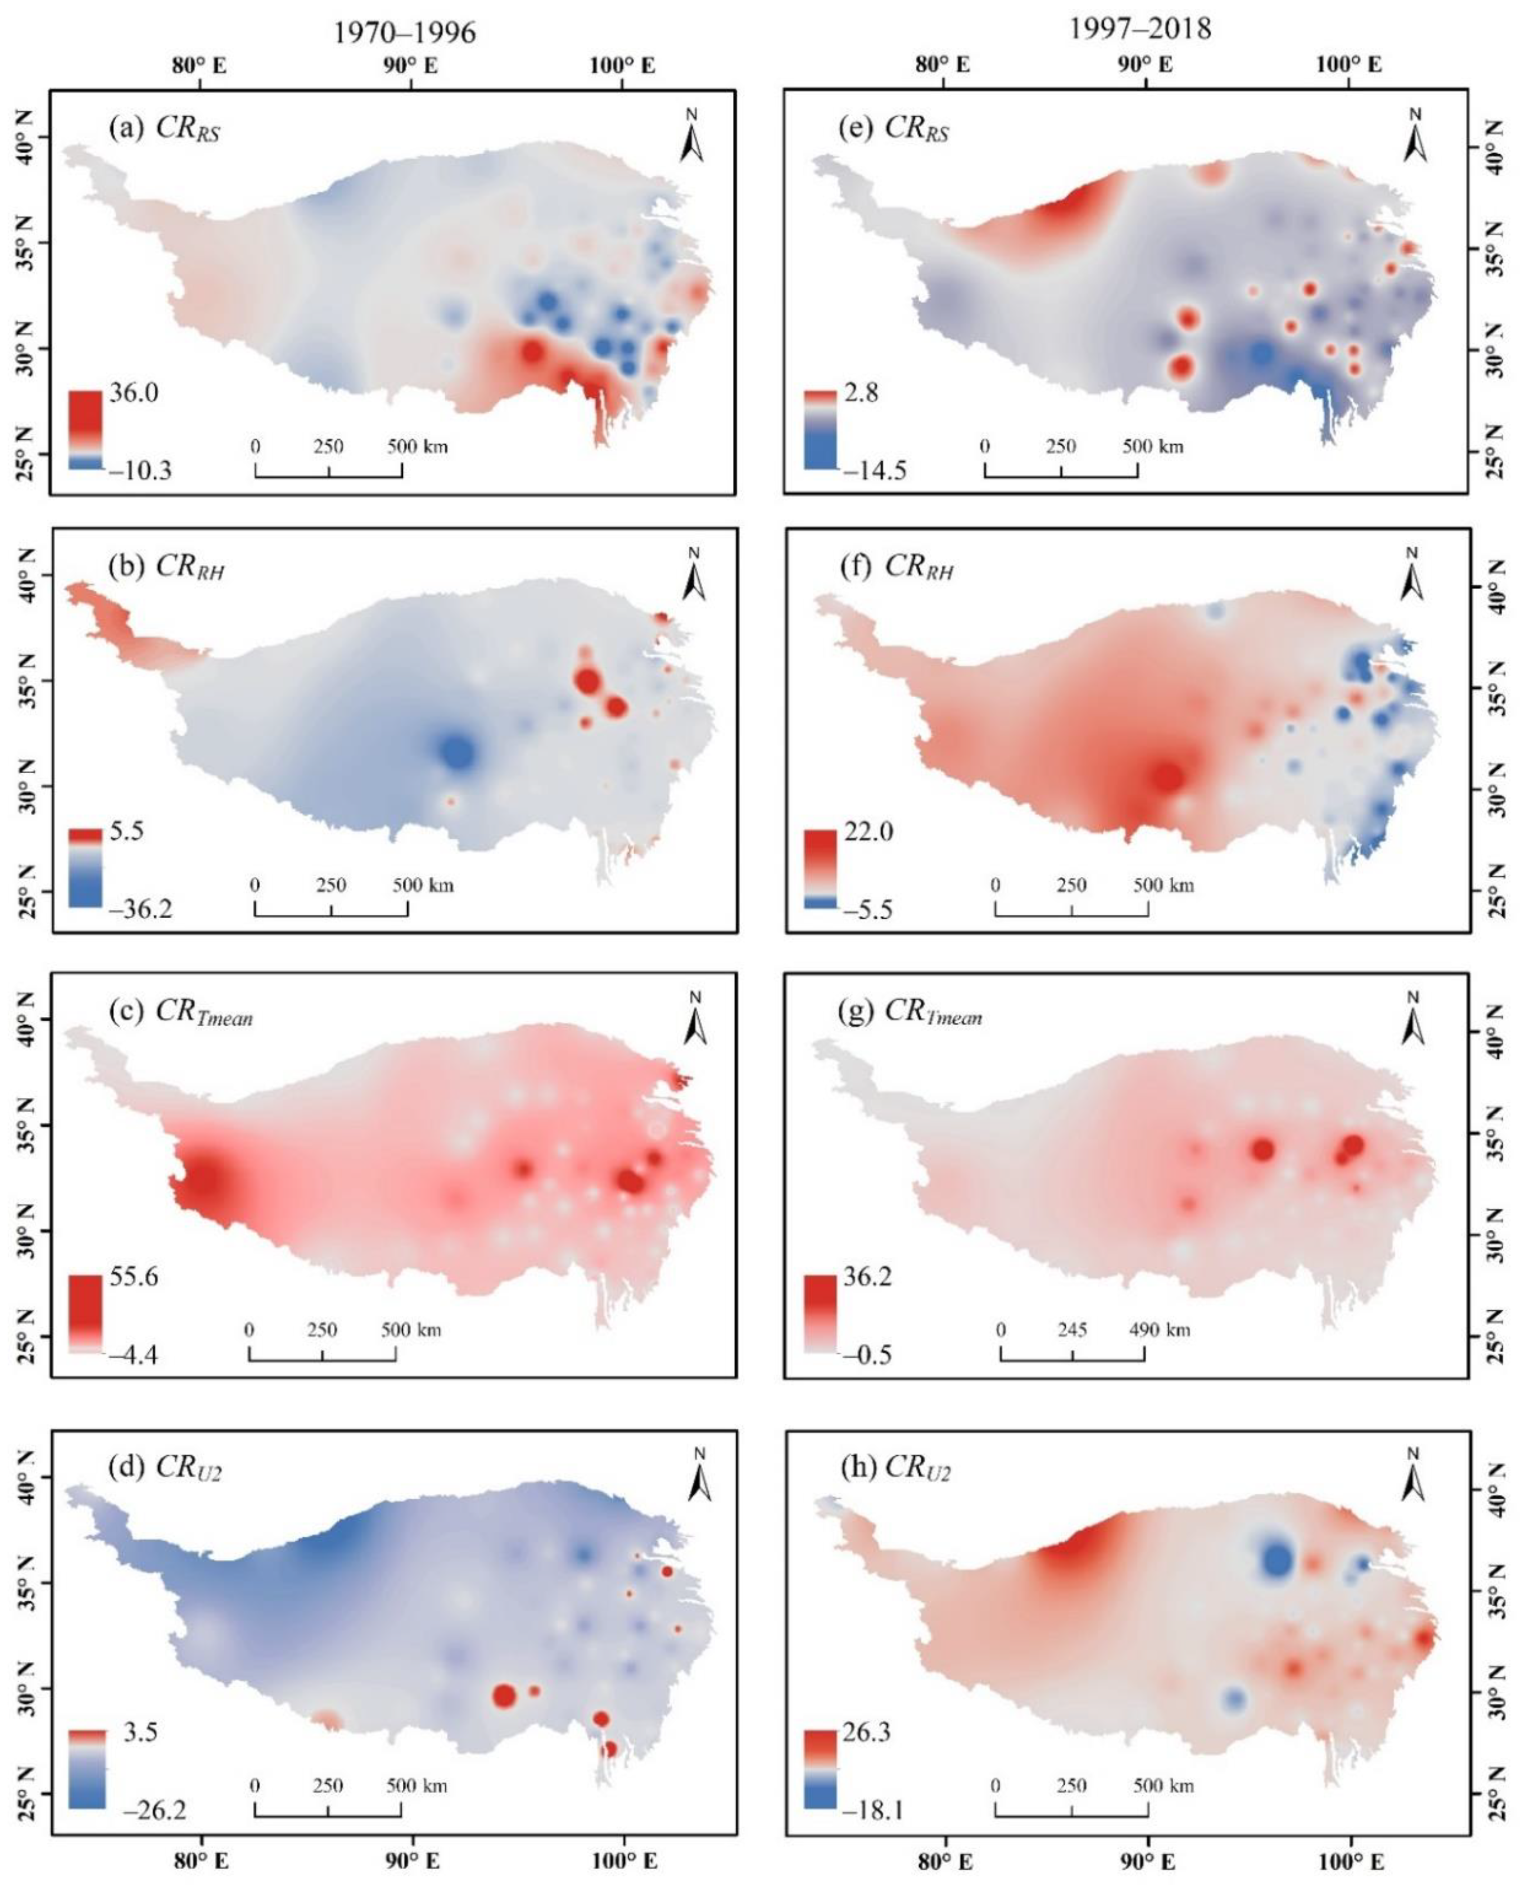
3.4. Dominant Climate Factors of ET0 Change

In order to identify the dominant climate factors affecting ET0, the contribution rate of each climatic factor was calculated using Equation (11). Comparing the ET0 trends caused by the four climate factors (C_ET0) and the ET0 trends calculated by P-M model (LR_ET0), the relative errors were 12.79%, 4.70% and 7.93% during 1970–1996, 1997–2018 and 1970–2018, respectively (Table 2). Therefore, equation (11) was a reasonable method to estimate the contribution rates of the four climatic factors to ET0.
Table 2 shows the contribution rate of the four climate factors to ET0 in different periods. During 1970–1996, U2 was the dominant factor influencing ET0, followed by RH, Tmean and RS. The decrease of U2 and increase of RH caused a −4.41% and −2.43% decrease to ET0, respectively. However, the increases in Tmean and RS led to a 0.80% and 0.10% increase to ET0, respectively. The comprehensive effect of climate factors finally led to a −6.7% decline to ET0. During 1997–2018, the decrease of RH was the main reason causing the increase in ET0 by 3.33%. In addition, the rise of U2 and Tmean also aggravated the increase of ET0 to a certain degree, resulting in the increase of ET0 of 2.34% and 1.58%, respectively. The decrease of RS led to a variation in ET0 of −0.96%. The effects of the climatic condition eventually caused the increase of ET0 by 6.29%. In a word, the decrease of ET0 during 1970 and 1996 was mainly due to the decrease of U2, while the increase of ET0 during 1997 and 2018 was mainly due to the decrease of RH.
Figure 8 gives the spatial distribution of contribution rates of four climatic factors to ET0 during 1970–1996 and 1997–2018. From 1970 to 1996, the contribution rate of RS (CRRS) was positive in the southeast and western TP, and the negative CRRS was found in eastern and central parts of TP. From 1997 to 2018, CRRS was mainly positive and the negative contribution distributed in the northern and central sporadic areas. The contribution rate of RH (CRRH) was negative in most parts of TP and the positive CRRH was only distributed partly in northwest and east before 1997; while, most regions on the TP exhibited a positive CRRH, except some areas of eastern TP after 1997. The distribution of contribution rate of U2 (CRU2) was similar to that of RH. The contribution rate of Tmean (CRTmean) was positive in most parts of TP during both periods.

4. Discussion

According to the analysis of this study, there are significant differences in climate factors between 1970–1996 and 1997–2018 (Figure 5 and Figure 6; Table 1). The spatiotemporal dynamic of the four climate factors in this study is basically consistent with a lot of research on climatic change. Before 1997, the wind speed decreased significantly, but then increased significantly. The weakening of the Asian monsoon system may explicate the decrease of U2 on the TP, while the strengthening of zonal wind may have a significant contribution to the increase of U2 after 1997 [44]. An insignificantly decreasing trend of RS was found during 1970–1996, but a significantly decreasing trend was found during 1997–2018. The solar dimming over the TP is mainly caused by the increase in water vapor and deep cloud cover [3]. RH also decreased significantly after 1997. Most areas of TP belong to the arid region and the amount of water is limited. The rise of air temperature makes the saturated vapor pressure rise, which may be the reason for the decrease in RH [45]. The climatic factors and ET0 have complex mutual feed mechanism and give rise to an abrupt change in ET0 in the meantime.
ET0 decreased significantly before 1997 while increased significantly after 1997 on the TP in this study (Figure 3 and Figure 4; Table 1). The change of ET0 is influenced by climate factors, and the weight of each climate factor is different. The dominant factor causing the decrease of ET0 on the TP was U2 before 1997(Figure 8; Table 2), and this is similar to many studies on the TP. For example, Chen et al. [46] found that wind speed is the dominant meteorological factor affecting the ET0 of the TP. Zhang et al. [26] considered that wind speed caused changes in the ET0 of the TP, especially in the northern part of the TP. Yin et al. [47] have shown that the decrease of wind speed can explain the variation of the potential annual evapotranspiration in the temperate zone of the north of China and the TP. In this study, the dominant factor that caused the increase of ET0 on the TP after 1997 is RH, which is consistent with Wang’s [27] study that relative humidity may be an important factor affecting ET0. However, this is not consistent with the view of Xie Hong [48] that relative humidity is considered to have little effect. This is due to the difference in the research periods and methods.
Some uncertainties remain for the estimation of ET0 in this study. Some of the parameters in the P-M equation are empirical and local. Therefore, regional optimization of parameters is an important means to improve the accuracy of ET0 calculation. Additionally, the number of meteorological stations used in this study is limited and unevenly distributed. The TP has large area and complex natural environment. It is difficult to fully describe the spatiotemporal dynamic of the climatic factors and ET0. More data from different sources and interpolation methods should be introduced in the future.

5. Conclusions

In this study, we analyzed the temporal–spatial trends, transition characteristics of ET0 and identified the main reasons for the change of ET0 in different stages over the TP based on data from 73 weather stations during 1970–2018.The main conclusions are:
  • There is an abrupt point in the TP’s annual ET0 series around 1997. The ET0 decreased remarkably at a rate of −25.9 mm/decade before 1997, while increasing significantly at a speed of 31.1 mm/decade after 1997;
  • Second item: before 1997, Tmean and RH increased significantly while U2 decreased significantly and RS decreased insignificantly. After 1997, Tmean and U2 increased insignificantly, RH and RS decreased significantly;
  • The sensitivity analysis of each climate factor to ET0 indicated the ET0 on the TP is most sensitive to RS, followed by RH, U2 and Tmean;
  • Third item: from 1970 to 1996, U2 was the most important meteorological factor contributing to the decline of ET0, followed by RH, Tmean, and RS. During 1997–2018, the decreasing of RH was the dominant factor causing an increase in ET0. The increase of U2 and Tmean also intensified the increase of ET0 to a certain extent.

Author Contributions

Conceptualization, S.H. and T.Z.; data curation, R.G.; formal analysis, R.G.; funding acquisition, S.H.; methodology, P.B.; resources, T.Z.; visualization, R.Z.; writing—original draft, S.H. and R.G.; writing—review and editing, S.H., T.Z., P.B. and R.Z. All authors have read and agreed to the published version of the manuscript.

Funding

This research was funded by National Natural Science Foundation of China, grant number 41501027, the Beijing Outstanding Young Scientist Program, grant number BJJWZYJH01201910028032.

Institutional Review Board Statement

Not applicable.

Informed Consent Statement

Not applicable.

Data Availability Statement

There are no relevant statements for this research.

Acknowledgments

The authors would like to express their sincere thanks to National Natural Science Foundation of China (41501027) and Beijing Outstanding Young Scientist Program (BJJWZYJH01201910028032) for their valuable support. The authors also would like to thank the peer reviewers for their valuable suggestions and comments on improving this paper.

Conflicts of Interest

The authors declare no conflict of interest.

References

  1. Lu, X.; Zang, C.; Burenina, T. Study on the variation in evapotranspiration in different period of the Genhe River Basin in China. Phys. Chem. Earth 2020, 120, 102902. [Google Scholar] [CrossRef]
  2. Maeda, E.E.; Wiberg, D.A.; Pellikka, P.K.E. Estimating reference evapotranspiration using remote sensing and empirical models in a region with limited ground data availability in Kenya. Appl. Geogr. 2011, 31, 251–258. [Google Scholar] [CrossRef]
  3. Kun, Y.; Baohong, D.; Jun, Q.; Wenjun, T.; Ning, L.; Changgui, L. Can aerosol loading explain the solar dimming over the Tibetan Plateau? Geophys. Res. Lett. 2012, 39. [Google Scholar] [CrossRef] [Green Version]
  4. Boisier, J.P.; de Noblet-Ducoudré, N.; Ciais, P. Historical land-use-induced evapotranspiration changes estimated from present-day observations and reconstructed land-cover maps. Hydrol. Earth Syst. Sci. 2014, 18, 3571–3590. [Google Scholar] [CrossRef] [Green Version]
  5. Wu, H.; Wang, X.; Wang, Y.; Xu, Y.; Han, X. Temporal variations in reference evapotranspiration in Hubei Province, China, from 1960 to 2014. Theor. Appl. Climatol. 2019, 135, 433–448. [Google Scholar] [CrossRef]
  6. Liu, C.; Zhang, D. Temporal and Spatial Change Analysis of the Sensitivity of Potential Evapotranspiration to Meteorological Influencing Factorsin China. Acta Geogr. Sin. 2011, 66, 579–588. [Google Scholar]
  7. Rachid, H.; Tarik, B.; Hayat, L.; Adil, S. Comparative assessment of different reference evapotranspiration models towards a fit calibration for arid and semi-arid areas. J. Arid Environ. 2021, 184, 104318. [Google Scholar]
  8. Zhao, J.; Xia, H.; Yue, Q.; Wang, Z. Spatiotemporal variation in reference evapotranspiration and its contributing climatic factors in China under future scenarios. Int. J. Climatol. 2020, 40, 3813–3831. [Google Scholar] [CrossRef]
  9. Fan, J.; Wu, L.; Zhang, F.; Xiang, Y.; Zheng, J. Climate change effects on reference crop evapotranspiration across different climatic zones of China during 1956–2015. J. Hydrol. 2016, 542, 923–937. [Google Scholar] [CrossRef]
  10. Li, Y.; Wei, X.; Su, H. Quantitative analysis of causes for temporal and spatial variation characteristics and evolution of potential evapotranspiration in Gansu Province during recent 30 years. J. Water Resour. Water Eng. 2015, 26, 219–225. [Google Scholar]
  11. Wang, Z.; Ye, A.; Wang, L.; Liu, K.; Cheng, L. Spatial and temporal characteristics of reference evapotranspiration and its climatic driving factors over China from 1979–2015. Agric. Water Manag. 2019, 213, 1096–1108. [Google Scholar] [CrossRef]
  12. Liu, X.; Zheng, H.; Zhang, M.; Liu, C. Identification of dominant climate factor for pan evaporation trend in the Tibetan Plateau. J. Geogr. Sci. 2011, 21, 594–608. [Google Scholar] [CrossRef]
  13. Deepak, J.; Yagob, D.; Ercan, K.; Vijay, P.S.; Ahmad, F.F. Trends in reference evapotranspiration in the humid region of northeast India. Hydrol. Process. 2012, 26, 421–435. [Google Scholar]
  14. Michael, L.R.; Graham, D.F. Changes in New Zealand pan evaporation since the 1970s. Int. J. Climatol. 2005, 25, 2031–2039. [Google Scholar]
  15. Moonen, A.C.; Ercoli, L.; Mariotti, M.; Masoni, A. Climate change in Italy indicated by agrometeorological indices over 122 years. Agric. For. Meteorol. 2002, 111, 13–27. [Google Scholar] [CrossRef]
  16. Brutsaert, W.; Parlange, M.B. Hydrologic cycle explains the evaporation paradox. Nat. Int. Wkly. J. Sci. 1998, 396, 30. [Google Scholar] [CrossRef]
  17. Han, J.; Wang, J.; Zhao, Y.; Wang, Q.; Zhang, B.; Li, H.; Zhai, J. Spatio-temporal variation of potential evapotranspiration and climatic drivers in the Jing-Jin-Ji region, North China. Agric. For. Meteorol. 2018, 256, 75–83. [Google Scholar] [CrossRef]
  18. Xu, S.; Yu, Z.; Yang, C.; Ji, X.; Zhang, K. Trends in evapotranspiration and their responses to climate change and vegetation greening over the upper reaches of the Yellow River Basin. Agric. For. Meteorol. 2018, 263, 118–129. [Google Scholar] [CrossRef]
  19. Zhang, Q.; Wang, W.; Wang, S.; Zhang, L. Increasing Trend of Pan Evaporation over the Semiarid Loess Plateau under a Warming Climate. J. Appl. Meteorol. Clim. 2016, 55, 2007–2020. [Google Scholar] [CrossRef]
  20. Brij, K.P.; Deepak, K. Identification of trend in long term precipitation and reference evapotranspiration over Narmada river basin (India). Glob. Planet. Chang. 2018, 161, 172–182. [Google Scholar]
  21. Cong, Z.T.; Yang, D.W.; Ni, G.H. Does evaporation paradox exist in China? Hydrol. Earth Syst. Sci. Discuss. 2008, 5, 357–366. [Google Scholar]
  22. Liu, X.; Zhang, D.; Luo, Y.; Liu, C. Spatial and temporal changes in aridity index in northwest China: 1960 to 2010. Theor. Appl. Climatol. 2013, 112, 307–316. [Google Scholar] [CrossRef]
  23. Zhang, S.; Li, X.; Zhao, G.; Huang, Y. Surface energy fluxes and controls of evapotranspiration in three alpine ecosystems of Qinghai Lake watershed, NE Qinghai-Tibet Plateau. Ecohydrology 2016, 9, 267–279. [Google Scholar] [CrossRef]
  24. Duan, A.; Xiao, Z. Does the climate warming hiatus exist over the Tibetan Plateau? Sci. Rep. 2015, 5, 13711. [Google Scholar] [CrossRef]
  25. You, Q.; Kang, S.; Fluegel, W.; Pepin, N.; Yan, Y.; Huang, J. Decreasing wind speed and weakening latitudinal surface pressure gradients in the Tibetan Plateau. Clim. Res. 2010, 42, 57–64. [Google Scholar] [CrossRef] [Green Version]
  26. Zhang, X.; Ren, Y.; Yin, Z.; Lin, Z.; Zheng, D. Spatial and temporal variation patterns of reference evapotranspiration across the Qinghai-Tibetan Plateau during 1971–2004. J. Geophys. Res. 2009, 114, D1505. [Google Scholar] [CrossRef]
  27. Wang, B.; Zhang, X. Reference Evapotranspiration and Its Attribution on the Tibetan Plateau from 1971 to 2014. Arid Zone Res. 2019, 36, 4–14. [Google Scholar]
  28. Jiang, Y.; Wang, P.; Xu, X.; Zhang, J. Dynamics of carbon fluxes with responses to vegetation, meteorological and terrain factors in the south-eastern Tibetan Plateau. Environ. Earth Sci. 2014, 72, 4551–4565. [Google Scholar] [CrossRef]
  29. Cui, M.; Wang, J.; Wang, S.; Yan, H.; Li, Y. Temporal and Spatial Distribution of Evapotranspiration and Its Influencing Factors on Qinghai-Tibet Plateau from 1982 to 2014. J. Resour. Ecol. 2019, 10, 213–224. [Google Scholar]
  30. Allen, R.G.; Pereira, L.S.; Raes, D.; Smith, M. Crop Evapotranspiration: Guidelines for Computing Crop Water Requirements; Food and Agricultural Organization: Rome, Italy, 1998; p. 56. [Google Scholar]
  31. Zheng, H.; Liu, X.; Liu, C.; Dai, X.; Zhu, R. Assessing contributions to panevaporation trends in Haihe River Basin, China. J. Geophys. Res. Atmos. 2009, 114, D24. [Google Scholar] [CrossRef] [Green Version]
  32. Gao, X.; Zhao, Q.; Zhao, X.; Wu, P.; Pan, W.; Gao, X.; Sun, M. Temporal and spatial evolution of the standardized precipitation evapotranspiration index (SPEI) in the Loess Plateau under climate change from 2001 to 2050. Sci. Total Environ. 2017, 595, 191–200. [Google Scholar] [CrossRef]
  33. Robert, M.H.; James, R.S. A Nonparametric Trend Test for Seasonal Data With Serial Dependence. Water Resour. Res. 1984, 20, 727–732. [Google Scholar]
  34. Huang, J.; Liu, F.; Xue, Y.; Sun, S. The spatial and temporal analysis of precipitation concentration and dry spell in Qinghai, northwest China. Stoch. Environ. Res. Risk A 2015, 29, 1403–1411. [Google Scholar] [CrossRef]
  35. Gillard, J. Circular and Linear Regression: Fitting Circles and Lines by Least Squares. J. R. Stat. Soc. Ser. A 2011, 174, 843. [Google Scholar] [CrossRef]
  36. Nalder, I.A.; Wein, R.W. Spatial interpolation of climatic Normals: Test of a new method in the Canadian boreal forest. Agric. For. Meteorol. 1998, 92, 211–225. [Google Scholar] [CrossRef]
  37. Lin, Z.H.; Mo, X.G.; Li, H.X.; Li, H.B. Comparison of three spatial interpolation methods for climate variables in China. Acta Geogr. Sin. 2002, 57, 47–56. [Google Scholar]
  38. Beven, K. A sensitivity analysis of the Penman-Monteith actual evapotranspiration estimates. J. Hydrol. 1979, 44, 169–190. [Google Scholar] [CrossRef]
  39. Liu, X.; Zheng, H.; Liu, C.; Cao, Y. Sensitivity of the Potential Evapotranspiration to Key Climatic Variables in the Haihe River Basin. Resour. Sci. 2009, 31, 1470–1476. [Google Scholar]
  40. Mccuen, R.H. A sensitivity and error analysis Cf procedures used for estimating evaporation. J. Am. Water Resour. Assoc. 1974, 10, 486–497. [Google Scholar] [CrossRef]
  41. Lenhart, T.; Eckhardt, K.; Fohrer, N.; Frede, H.G. Comparison of two different approaches of sensitivity analysis. Phys. Chem. Earth 2002, 27, 645–654. [Google Scholar] [CrossRef]
  42. Yin, Y.; Wu, S.; Dai, E. Determining factors in potential evapotranspiration changes over China in the period 1971–2008. Chin. Sci. Bull. 2010, 55, 3329–3337. [Google Scholar] [CrossRef]
  43. Li, Y.; Liang, K.; Bai, P.; Feng, A.; Liu, L.; Dong, G. The spatiotemporal variation of reference evapotranspiration and the contribution of its climatic factors in the Loess Plateau, China. Environ. Earth Sci. 2016, 75, 364. [Google Scholar] [CrossRef]
  44. Zhang, Z.; Yang, Y.; Zhang, X.; Chen, Z. Wind speed changes and its influencing factors in Southwestern China. Acta Ecol. Sin. 2014, 34, 471–481. [Google Scholar]
  45. Chen, S.; Liu, Y.; Axel, T. Climatic change on the Tibetan Plateau: Potential Evapotranspiration Trends from 1961–2000. Clim. Chang. 2006, 76, 291–319. [Google Scholar]
  46. Xie, X.; You, Q.; Lin, H. Surface relative humidity decreases and its cause over the Qinghai—Tibetan Plateau in recent ten years. Plateau Meteorol. 2018, 37, 642–650. [Google Scholar]
  47. Yin, Y.; Wu, S.; Chen, G.; Dai, E. Attribution analyses of potential evapotranspiration changes in China since the 1960s. Theor. Appl. Climatol. 2010, 101, 19–28. [Google Scholar] [CrossRef]
  48. Xie, H. The Evapotranspiration and Its Response to Climate Change in Tibet Plateau; Lanzhou University: Lanzhou, China, 2012. [Google Scholar]
Figure 1. Location of the study area and the distribution of meteorological stations.
Applsci 11 08013 g001
Figure 2. The relationship between P-M ET0 and the 20 cm pan evaporation.
Applsci 11 08013 g002
Figure 3. Variation of annual ET0 (a) and Cramer’s test results for detecting change in annual ET0 (b) on the TP from 1970 to 2018. (The red points represent the years in which the mutation occurred in the ET0 series.)
Applsci 11 08013 g003
Figure 4. Spatial distribution of ET0 trends on the TP during 1970–1996 (a) and 1997–2018 (b) (mm/10a).
Applsci 11 08013 g004
Figure 5. Annual variation of climatic factors on the TP during 1970–2018. (a) Solar radiation (RS); (b) relative humidity (RH); (c) air temperature (Tmean); (d) wind speed (U2).
Applsci 11 08013 g005
Figure 6. Spatial distribution of climatic factors trends during 1970–1996 (ad) and 1997–2018 (eh); (a,e) RS ((MJ m−2 day−1)/decade); (b,f) RH (%/decade); (c,g) Tmean (°C/decade); (d,h) U2 (m/s/decade).
Applsci 11 08013 g006
Figure 7. Spatial distribution of sensitivity coefficient on the TP during 1970–2018. (a) SRS; (b) SRH.; (c) STmean; (b) SU2.
Applsci 11 08013 g007
Figure 8. Spatial distribution of contribution rates of four climatic factors to ET0 during 1970–1996 (ad) and 1997–2018 (eh) (%); (a,e) CRRS; (b,f) CRRH; (c,g) CRTmean; (d,h) CRU2.
Applsci 11 08013 g008
Table 1. Z value of reference evapotranspiration (ET0), solar radiation (RS), relative humidity (RH), air temperature (Tmean) and wind speed (U2) in different periods.
PeriodRSRHTmeanU2ET0
1970–19960.083.13 *2.54 *−5.50 *−4.84 *
1997–2018−3.63 *−3.63 *2.48 *4.32 *3.80 *
1970–2018−3.59 *−1.086.54 *−5.42 *−1.20
* Statistically significant trends at the 5% significance level.
Table 2. The contribution rate of climate factors to ET0 in different periods (%).
PeriodCRRSCRRHCRTmeanCRU2C_(ET0)LR_(ET0)ε
1970–19960.10−2.430.80−4.41−5.94−6.7012.79
1997–2018−0.963.331.582.346.296.604.70
1970–2018−0.671.043.05−4.29−0.87−0.947.93
Publisher’s Note: MDPI stays neutral with regard to jurisdictional claims in published maps and institutional affiliations.

