
Research and Application of Slag–Nanosilica Stabilizer for Silt Subgrade


School of Civil Engineering and Architecture, Zhejiang Sci-Tech University, Hangzhou 310018, China
*
Author to whom correspondence should be addressed.
Appl. Sci. 2021, 11(17), 8014; https://0-doi-org.brum.beds.ac.uk/10.3390/app11178014
Submission received: 3 July 2021
/
Revised: 18 August 2021
/
Accepted: 26 August 2021
/
Published: 30 August 2021
(This article belongs to the Section Civil Engineering)
Abstract
:With the rapid development of construction and road engineering, the accumulation of silting waste soil is becoming more and more serious. In order to recycle the silt, a new type of stabilizer was developed in this study to improve its mechanical properties and applicability on roads. The optimal ratio of stabilizer components was determined by orthogonal test and grey correlation analysis. The effects of stabilizer on the macroscopic mechanical properties of silt were investigated by unconfined compressive strength (UCS) test and split test. The water stability test and freeze–thaw cycle test were carried out to study the durability and road performance of stabilized soil. Scanning electron microscopy (SEM) and X-ray diffraction (XRD) methods were used to study the effect of the stabilizer on the microstructure and mechanism of silt. The results showed that the optimal mixture ratio of the new type of stabilizer was quicklime: nanosilica: slag = 32:3:65. Adding 10% stabilizer is a reasonable and effective method to strengthen silt, which has the characteristics of high strength and strong durability in the early period. The addition of stabilizer will result in hydration reaction, pozzolanic reaction, and cation exchange on the surface of soil particles with silt, which will enhance the intermolecular force of soil particles, reduce the porosity of soil, and strengthen the connection between soil particles.
1. Introduction
Economic development and urban construction in China’s coastal areas have brought about the accumulation of silting waste soil. According to official statistics, from 1950 to the end of 2015, Zhejiang Province of China excavated 272,800 hm2 of silt [1]. The silt not only occupies a large amount of land resources and causes huge economic losses but also has practical engineering shortcomings, such as high moisture content, poor mechanical properties, and low comprehensive durability [2], which brings potential safety hazards to the construction project and people’s lives. The commonly used methods for treating silt include soil displacement method [3], pile foundation method, structure optimization method [4], ocean dumping [5], etc. However, in the face of the accumulation of large tons of silt, the above methods are not perfect in the implementation process; there are great safety risks, and they are not enough to deal with all the silt. Therefore, the treatment of silt in coastal areas has become a problem that urgently needs to be solved.
The application of stabilizer in soil has a long history [6]. Cement was first used as a stabilizer in the United States in the early 20th century to mix with soil to form road material. In the 1940s, an American engineer grinded shells and mixed them with cement to stabilize soft clay soil, achieving certain results [7]. Since then, comprehensive stabilizer based on cement, lime, lime–lime or cement–lime has been developed [8]. From the 1970s, the research on soil stabilizer began to mature and the classification of stabilizer appeared, which was gradually applied to different fields [9,10]. In recent years, studies on cement-based soil stabilizer have become more significant. For example, Takashi [11] developed EPS, a new soil stabilizer, to excite ordinary Portland cement and stabilize silt in Tokyo, Japan, and found that EPS has good stimulation and economic applicability. Bahabra [12] used cement and lime to stabilize soft clay soil and found the optimal amount of lime through a series of mix ratio design. The test results also effectively showed that cement and lime could significantly improve the mechanical properties of soft clay soil. However, there are serious environmental pollution problems in the production process of ordinary Portland cement, which not only emit a large amount of CO2 but also discharge dust, CO, SO2, fluoride, and other gases into nature in the whole cement production line, causing obvious pollution to the air environment [13,14]. Therefore, it is of great significance to develop a green, environmentally friendly, and economic soil stabilizer [15].
Many scholars have devoted themselves to the research of new economic and environmentally friendly soil stabilizers to make up for the defects of traditional soil stabilizers. Zuckri [16] strengthened soft soil in the Pekan area and used the Eades–Grim pH method to determine the optimal lime content. It was found that 4% lime content could raise the pH value of the soil to 12, and the strength of the stabilized soil could reach a higher level. It was proposed that the treatment of stabilized silt by lime could be used for highway construction. Sharma [17] assessed the potential of using binders to stabilize expansive soil consisting of fly ash and blast furnace slag. It was found that the addition of a small amount of lime could further improve soil properties by increasing the pozzolanic activity of the binder. In addition, mineralogical and morphological studies of stabilized soil samples with optimum binder content showed that the reactions between silt and binder formed hydration particles and gel compounds. Therefore, without considering economic factors, the use of fly ash as binder to stabilize expansive soil is suitable for sustainable construction. According to the research and analysis of Kong [18] and Lv et al. [19], nanosilica can significantly improve the shortcomings of poor cohesion of silt through a series of physical and chemical reactions with silt, making its structure more compact.
Combined with the above studies, a new stabilizer for stabilizing silt, named slag–nanosilica stabilizer (SNS), was developed in this research. The stabilizer is composed of slag, nanosilica, and quicklime. Orthogonal test and grey correlation analysis were used to determine the optimal ratio of each component of stabilizer [20,21] with the aim of evaluating the comprehensive properties of stabilized soil through macroscopic mechanical properties test, road performance test, and microscopic mechanism analysis.
2. Materials
2.1. Soil
It can be seen from Table 1 that the liquid limit wL, plastic limit wP, and plasticity index IP of the silt used in this test were 48.7%, 29.60%, and 19.10, respectively. The optimal moisture content of the silt was 30.12%, and the maximum dry density was 1.76 g·cm−3. The silt belonged to limit clay low liquid with sand (CLS) as classified by the plasticity chart.
2.2. Stabilizer
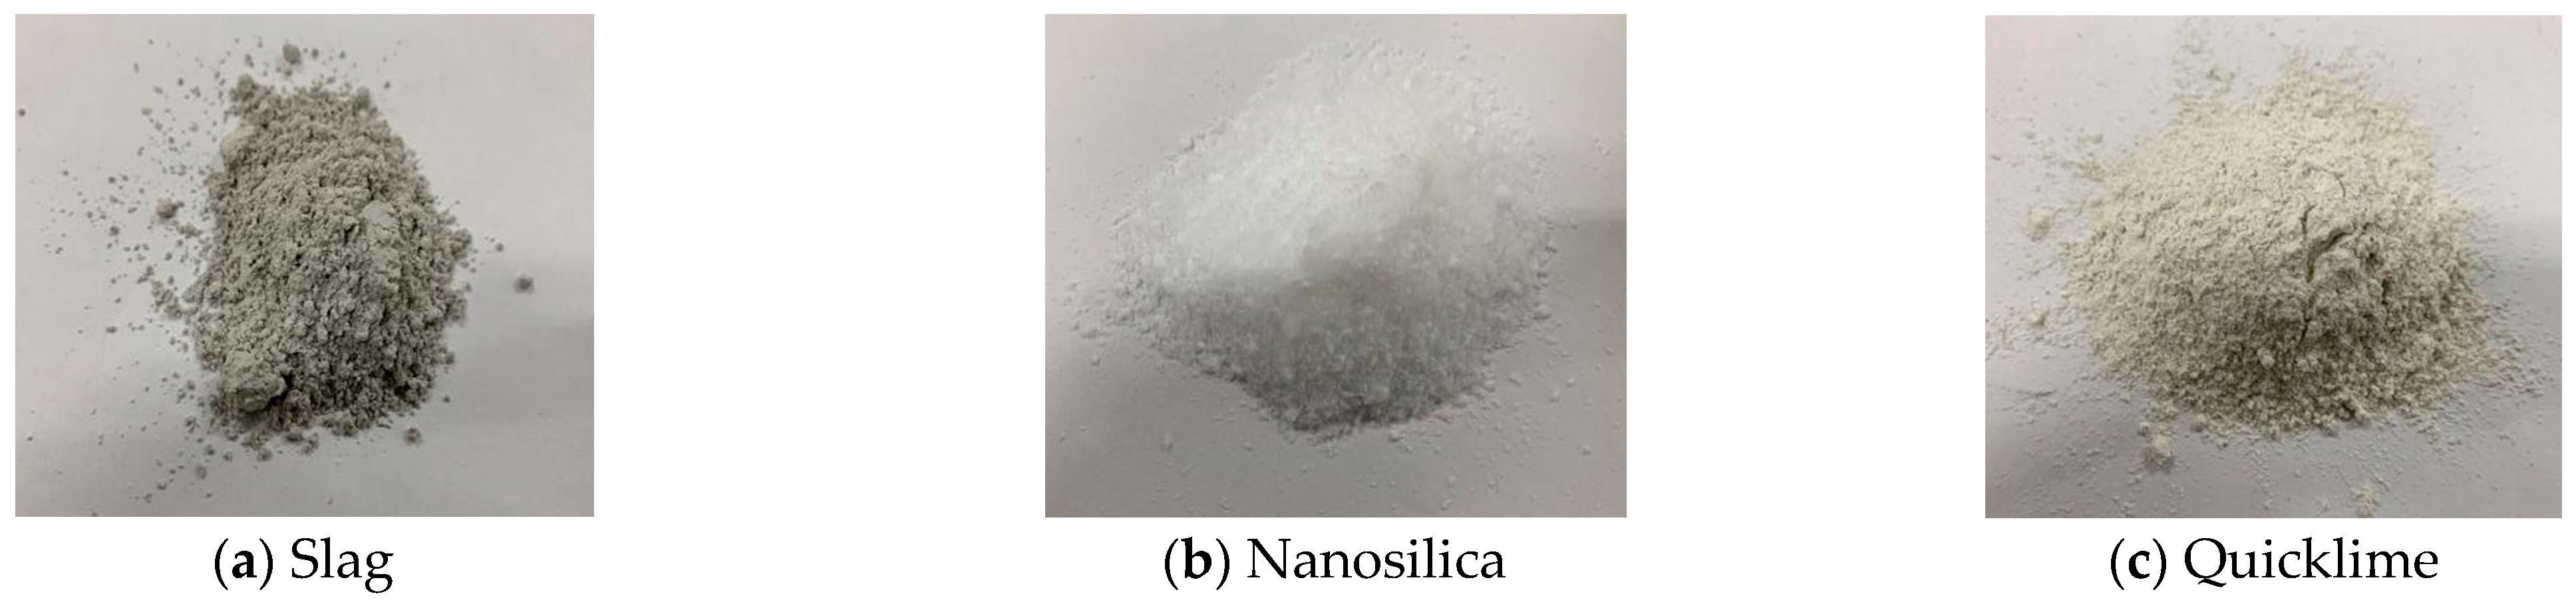
Nanosilica, a new type of nanomaterial, was introduced into the test. At the same time, slag was used to replace the traditional Portland cement with quicklime to promote hydration reaction. Through the mix ratio design, the slag–nanosilica stabilizer (SNS), a new type of green and environmentally friend material, was independently developed.
2.2.1. Engineering Properties of Slag
The density of slag was 2.9 g·cm−3. The main chemical components are given in Table 2.
2.2.2. Engineering Properties of Nanosilica
The appearance and basic parameters of the nanosilica used in this experiment are given in Table 3.
2.2.3. Engineering Properties of Quicklime
The CaO content of the quicklime used in this experiment was 82% and the MgO content was 1.6%, meaning it was high-quality lime.
The new stabilizer components used in the test are given in Figure 1.
2.3. Cement
The P.O.42.5 plain Portland cement was used as the control stabilizer, whose main physical and mechanical properties are given in Table 4.
3. Experimental Methodology
3.1. Compaction Test
The compaction test was performed according to Test Methods of Soils for Highway Engineering (JTG E40-2007) [22] to study the optimal moisture content and maximum dry density of the slag–nanosilica stabilized soil (SNS-S) under different mix ratios, which provided a prerequisite for the calculation of water distribution in subsequent tests.
3.2. Unconfined Compressive Strength (UCS) Test
The UCS test is used to measure the compressive strength of the stabilized soil by applying a certain axial pressure to the center of the stabilized soil under the condition of no lateral constraint, which is the most important reference index for evaluating the physical properties of the soil. The UCS test was performed according to Test Methods of Soils for Highway Engineering (JTG E40-2007) [22] to study the strength characteristics of the silt with different SNS content and to provide the corresponding strength basis for actual engineering construction.
3.3. Split Test
In the overall design process of road surface structure, we should pay attention not only to the compressive strength but also to the tensile strength in the scientific design and the service durability of road surface structure. However, up to now, a direct testing method for tensile strength of soil in the field of stabilized soil has not been established, and its accuracy is difficult to be guaranteed. Therefore, the split test was performed according to Test Methods of Materials Stabilized with Inorganic Binders for Highway Engineering (JTG E51-2009) [23], and the tensile strength of SNS-S was replaced by the measured split strength.
3.4. Water Stability Test
The damage to pavement structure not only comes from the action of external load but also the humidity of the surrounding environment and the higher water content in the subgrade soil, which will cause internal damage to the pavement and subgrade structure. Therefore, the water stability test was performed according to Test Methods of Materials Stabilized with Inorganic Binders for Highway Engineering (JTG E51-2009) [23], and the water stability coefficient was calculated by the UCS of the specimen before and after immersion of 10% SNS-S so as to evaluate the water stability performance of the soil stabilizer.
3.5. Freeze–Thaw Cycle Test
In many northern coastal areas, the large periodic variation of temperature will lead to the periodic variation of pavement structural strength. Therefore, considering the regional applicability of SNS, and according to Test Methods of Materials Stabilized with Inorganic Binders for Highway Engineering (JTG E51-2009) [23], the 10% SNS-S and the cement stabilized soil (CS-S) were put into a cryogenic chamber (−18 °C ± 2 °C) and a thermostatic water tank (20 °C ± 2 °C), respectively, for freeze–thaw cycles by simulating the climatic environment of alternating cold and hot. Finally, their antifreeze indexes were calculated by the loss strength before and after the freeze–thaw cycles [24,25].
3.6. SEM
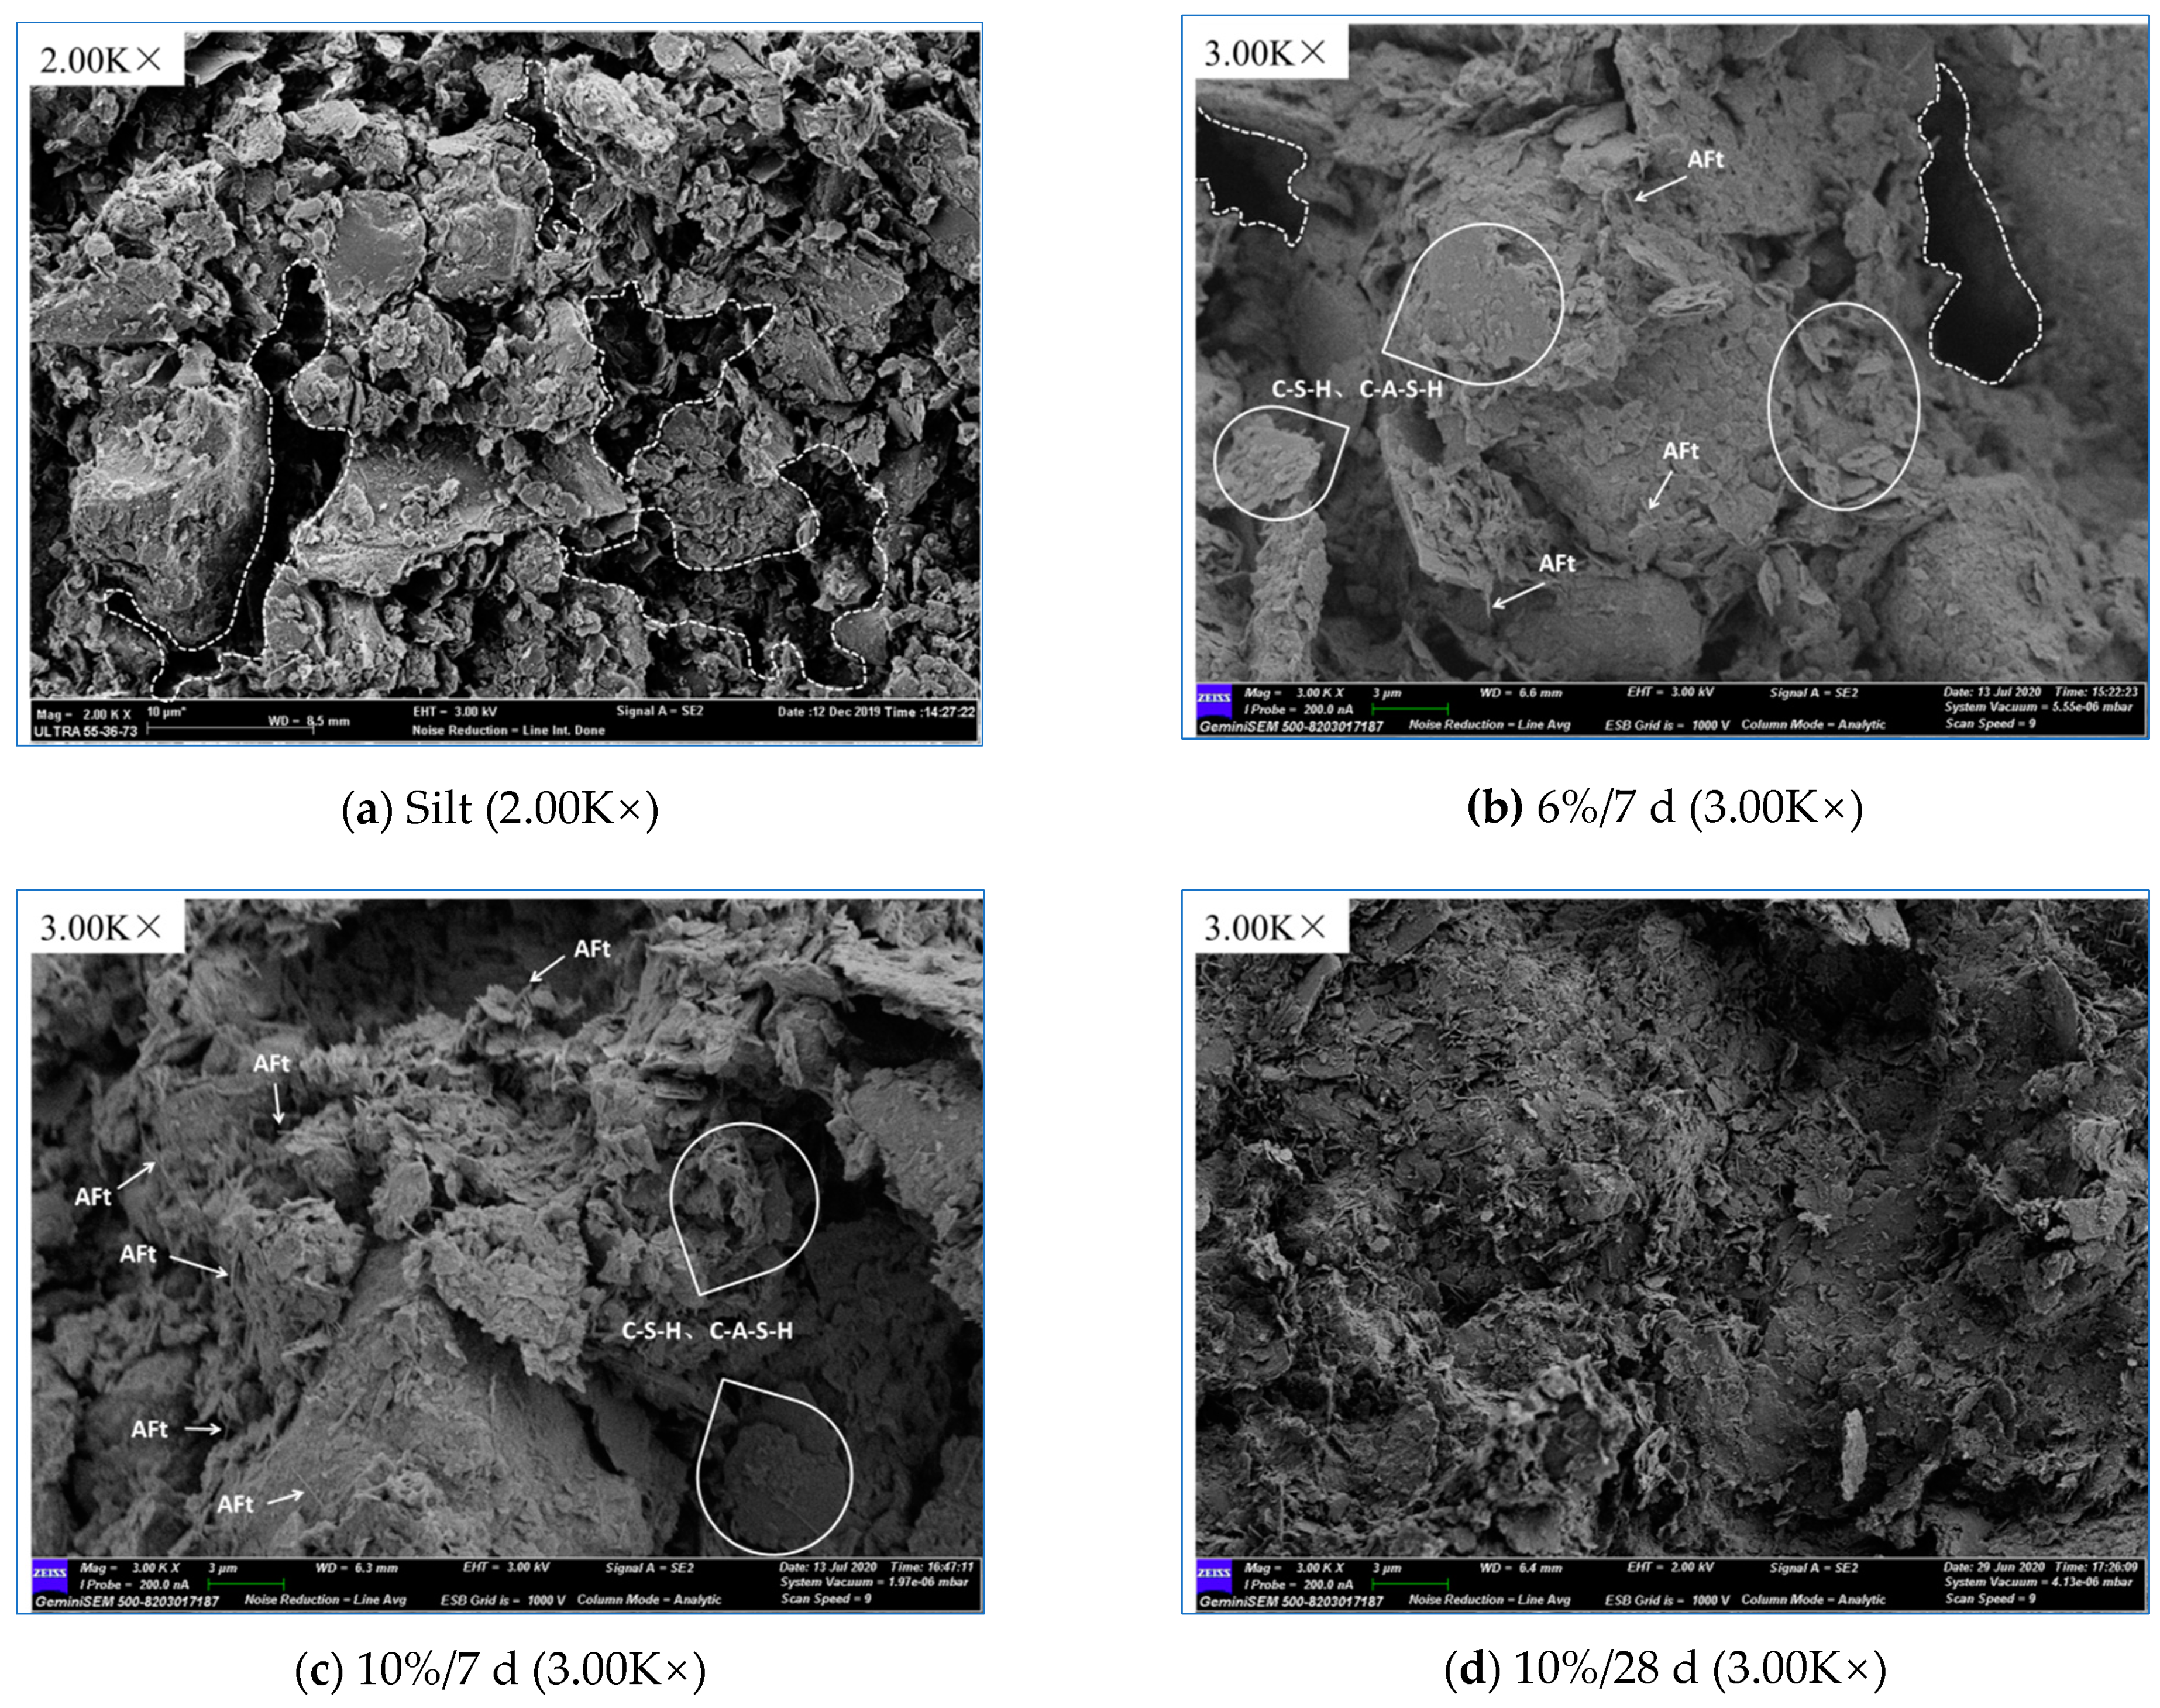
In order to observe changes in the microstructure and gap shape of the silt before and after adding SNS, the SNS-S (6%/7 d, 10%/7 d, 10%/28 d) were crushed and the central parts of 20 × 10 ×5 mm3 edges were taken. A new stabilized soil section was exposed after the test block was broken apart. After placing it in the oven at 50 °C for 12 h, the new section that needed to be observed was gold-plated, and microscopic observation was made [26].
3.7. XRD
X-ray diffraction (XRD) is a commonly used method for qualitative analysis of mineral composition in nature. By comparing the XRD results of stabilized soil, the mineral composition changes to stabilized soil before and after adding SNS and at different ages can be better analyzed. The plain soil and SNS-S (6%/7 d, 6%/28 d, 10%/7 d, and 10%/28 d) were ground and dried for testing, and the diffraction angle of 2θ was set at 5~85°.
4. Results and Discussion
4.1. Stabilizer Mix Ratio Design
4.1.1. Orthogonal Test
In order to determine the effect of each component of SNS on silt, the content of quicklime (A), nanosilica (B), and slag (C) were taken as three factors (A, B, and C) in the orthogonal test, and three levels were set for each factor, as shown in Table 5. The orthogonal test program is given in Table 6.
According to the results given in Table 6, nine types of stabilized soil were prepared to carry out the compaction tests. The compaction tests were used to measure the mixture ratio of stabilized soil under optimum moisture content and maximum dry density, and specimens with the size of φ50 × 50 mm2 were prepared. The formed specimens were cured to the specified age under test setting conditions. UCS tests were then carried out on the stabilized soil of each group, and the final test results were recorded.
4.1.2. Test Results
The test results of the compaction test and UCS test of nine types of stabilized soil are given in Table 7.
In the above table, SCCS is standard curing compressive strength and WCCS is water curing compressive strength.
It can be seen from Table 7 that the addition of SNS-S had no significant effect on the optimum moisture content and maximum dry density of silt. The content of nanosilica in the stabilized soil was small, so the effect on the physical properties of silt was not obvious. Secondly, it takes a long time for the reaction inside the SNS-S, but the compaction tests lasted only 12 h. Therefore, the reaction between the internal stabilizer and the soil was not fully carried out, resulting in a small effect on the test results [27].
4.1.3. Grey Correlation Analysis
In this study, the grey correlation analysis method was used to determine the correlation degree and weight of various factors in the test so as to determine the optimal composition ratio of the stabilized soil. The specific steps were as follows:
- The reference sequence, which is the optimal value of each factor attribute, was determined. For the samples of kth factors, the reference sequence is usually expressed as follows:
The 7 d compressive strength of standard curing, 28 d compressive strength of standard curing, 7 d compressive strength of water bath curing, and 28 d compressive strength of water bath curing were taken as the evaluation criteria for the stabilized soil. Among the four evaluation criteria, the maximum value was the best value, so the results were = 3.12, = 5.25, = 1.52, and = 3.43.
- 2.
- Each factor was quantified without dimension. Because changes in each factor were different, it was necessary to eliminate the dimension of each factor and make it unified. There are many dimensionless quantitative processing methods. In this study, the method of deviation standardization was adopted. The formula is as follows:where and represent the optimal and worst value of the jth factor, respectively. The larger the factor, the better it is to use Equation (2), while the smaller the factor, the better it is to use Equation (3). represents the jth factor value of the ith test group, and represents the dimensionless value of the jth factor of the ith test group.
After dimensionless quantization, the optimal value and the worst value were 1 and 0, respectively. The remaining results are given in Table 8.
- 3.
- To find the correlation coefficient between the reference sequence and the comparison sequence, the degree of difference between the geometric shapes of the curves is called correlation, so the difference value between the curves can be used as a measure of correlation degree. The formula is as follows:where represents the correlation coefficient of the jth factor of the ith test group, and is the resolution coefficient, . The smaller the , the larger the difference between the correlation coefficients and stronger the distinguishing ability. is usually 0.5. represents the dimensionless value of the jth factor of the ith test group. represents the second-order minimum difference of the value of the jth factor of the ith test group after dimensionless quantization. represents the second-order maximum difference of the value of the jth factor of the ith test group after dimensionless quantization. The calculated correlation coefficients are given in Table 9.
- 4.
- The correlation degree was calculated. Because the correlation coefficient represents the correlation degree between the reference sequence and the comparison sequence at each moment, it has more than one number, so it is necessary to take the mean value of the correlation coefficient at each moment. The formula is as follows:where represents the correlation degree of the jth factor, m is the number of test groups, and represents the correlation coefficient of the jth factor of the ith test group. The results were , , , and .
- 5.
- The correlation degree of each factor was treated as dimensionless by means of averaging method, and the formula is as follows:where is the weight of the jth factor, and represents the correlation degree of the jth factor. The results were , , , and 7.
- 6.
- The formula for calculating the comprehensive evaluation value of each test group is as follows:where is the comprehensive evaluation value of the ith test group, n is the number of factors, is the weight of the jth factor, and represents the dimensionless value of the jth factor of the ith test group. The results were , , , , , , , , and .
The comprehensive evaluation value is the comprehensive evaluation of the stabilizing effect of the stabilized soil prepared by each test scheme. The higher the comprehensive evaluation value, the better the stabilizing effect of the stabilized soil. Therefore, group A6 was the optimal group, that is, with quicklime, nanosilica, and slag content of 3%, 0.4%, and 6%, respectively.
4.1.4. Range Analysis of Orthogonal Test
According to the comprehensive evaluation value of grey correlation analysis, the comprehensive evaluation value of each factor and level was calculated, and range analysis was conducted. The results are given in Table 10.
In the above table, ki, whose optimal level of column factor can be judged by size, represents the average value of Ki. R represents the range of Ki of this column factor. The greater the R, the greater the effect of this factor on the test indicators. Therefore, the primary and secondary order of each factor can be determined according to the size of R.
As can be seen from Table 10, among all the influencing factors, the content of quicklime had the greatest influence on stabilized soil, followed by the content of nanosilica, while the content of slag had the least influence. Among all factors, the optimal mix ratio was composed of the level with the highest average comprehensive evaluation value, that is, with quicklime, nanosilica, slag content of 3%, 0.4%, and 5%, respectively. Compared with the optimal mix ratio determined by the grey correlation analysis method, the optimal mix ratio of stabilizer was quicklime (A): nanosilica (B): slag (C) = 32:3:65.
4.2. Laboratory Test Results
4.2.1. Unconfined Compressive Strength Test
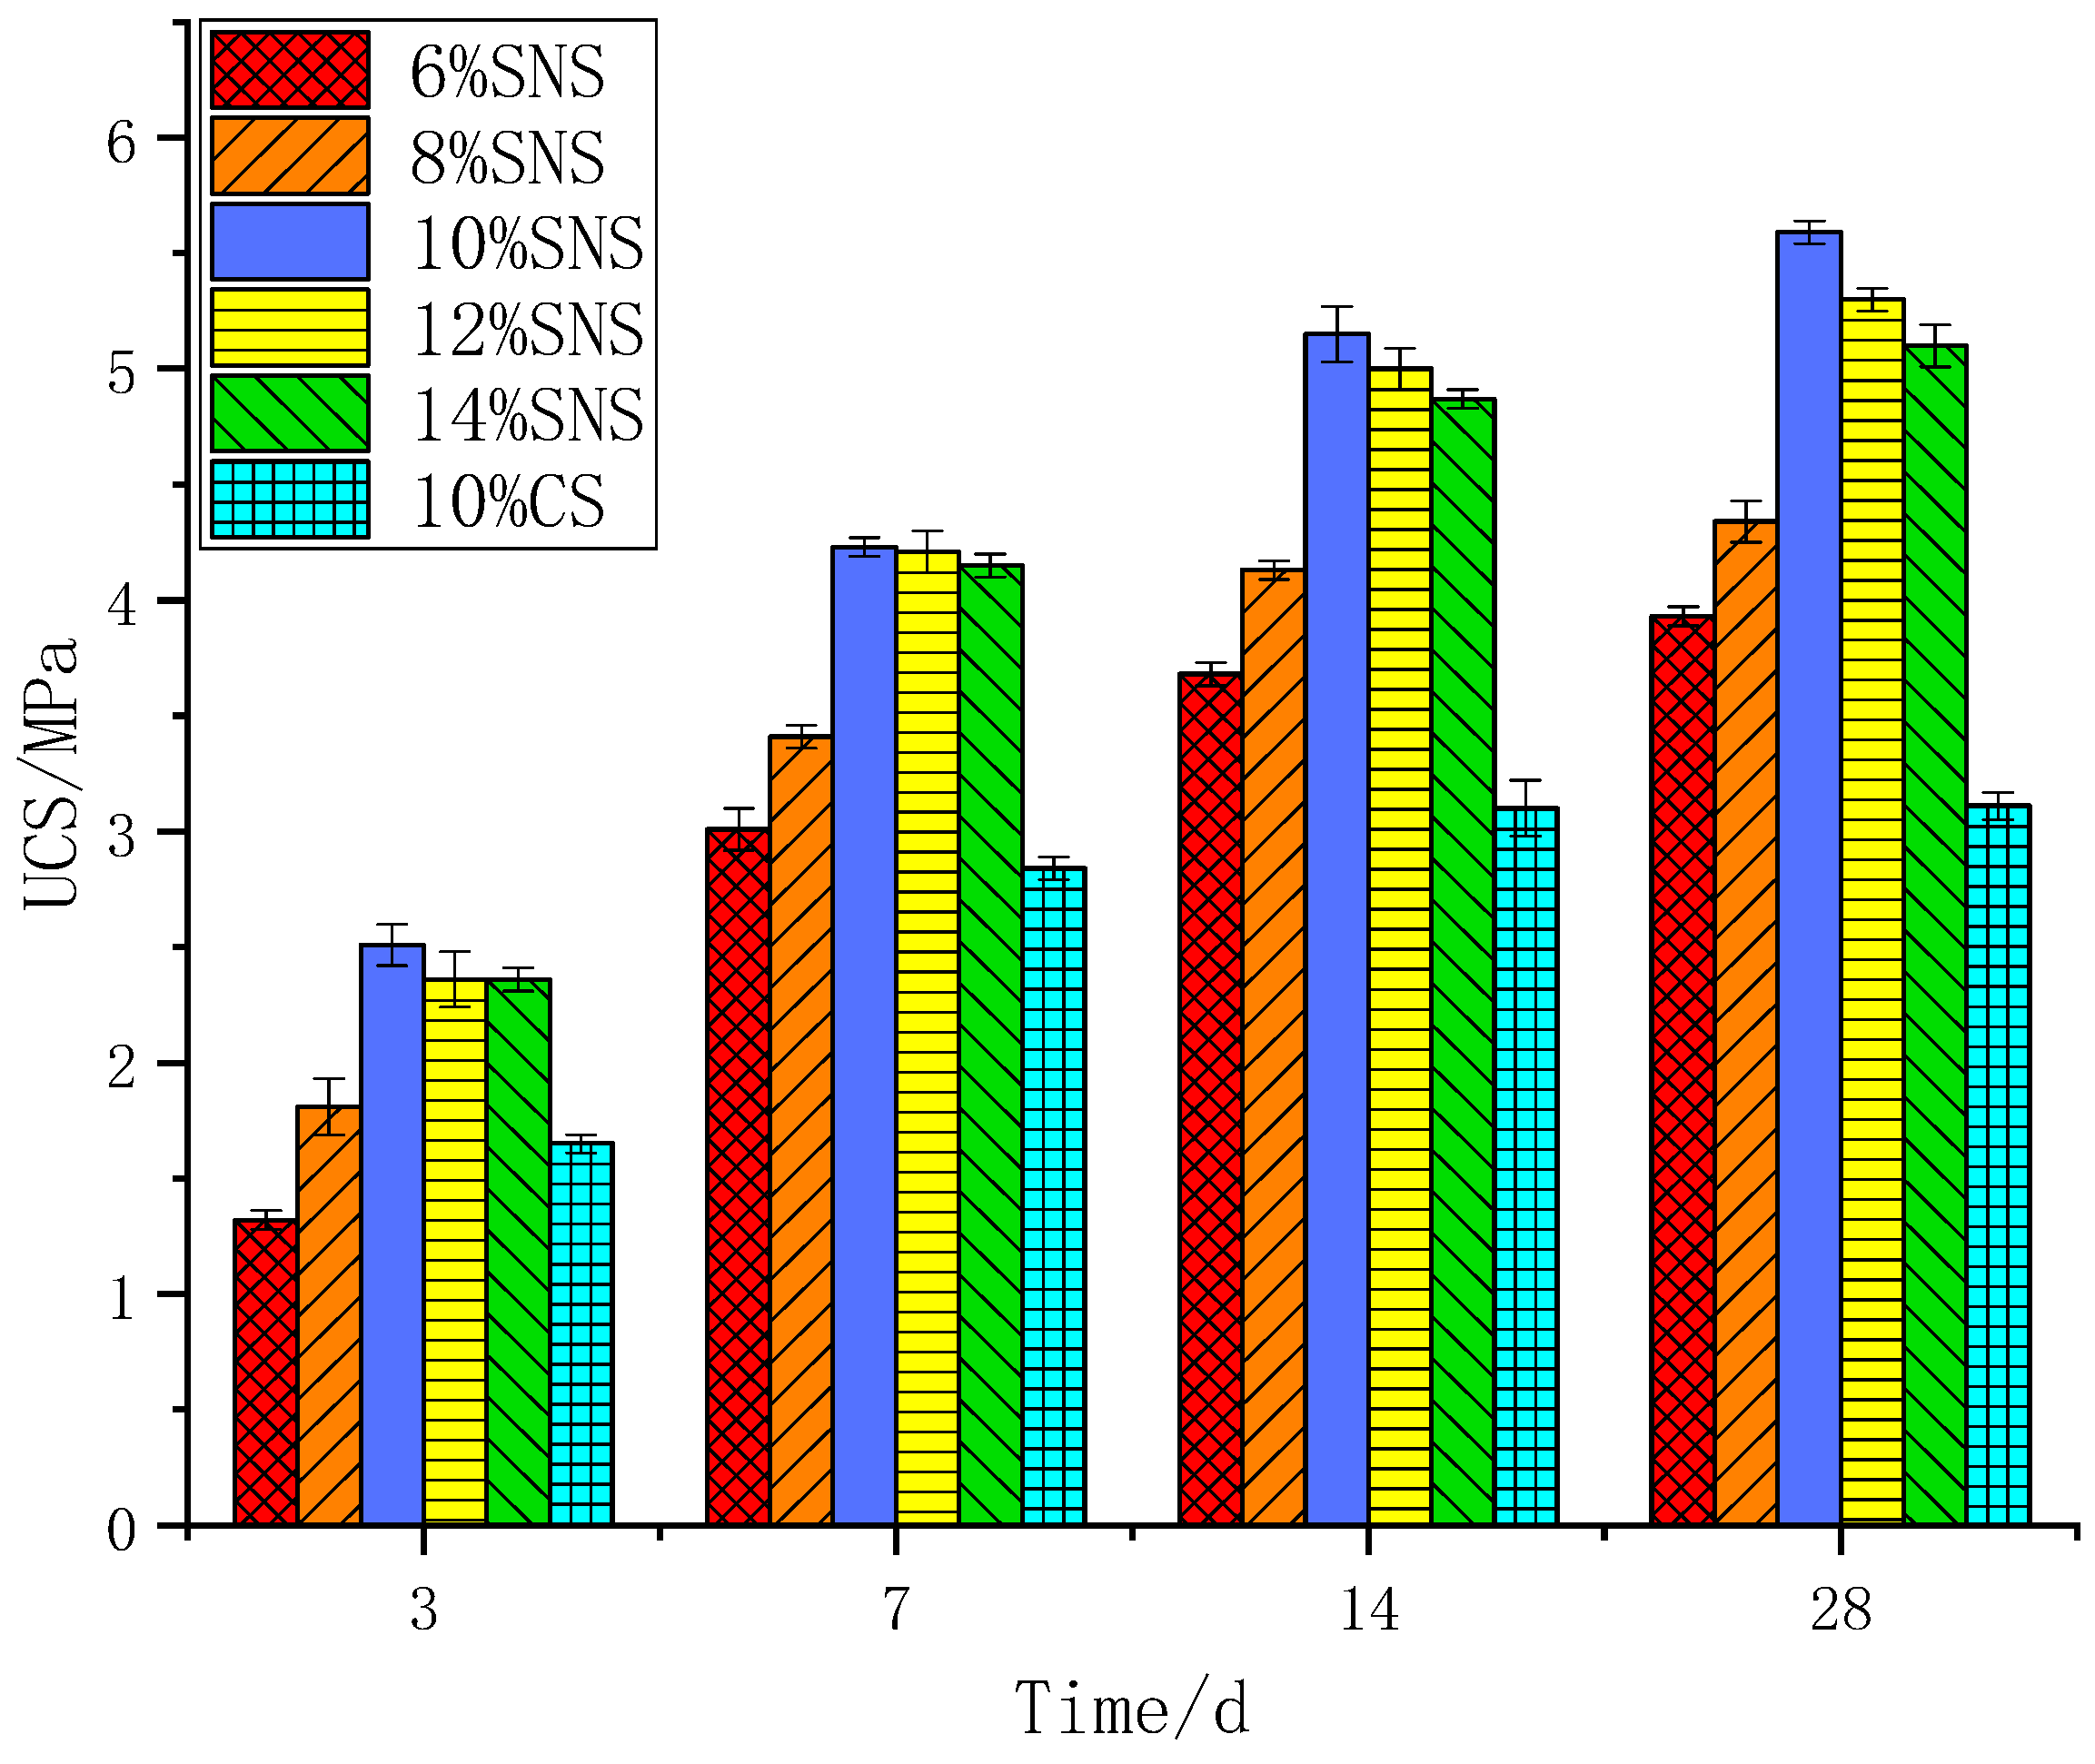
For this test, 6%, 8%, 10%, 12%, and 14% SNS were added, compared with silt addition of 10% CS, to explore the influence of different curing ages and content of SNS on the stabilizing effect of silt.
As can be seen from Figure 2, with increasing curing age of stabilized soil, the UCS of silt increased rapidly at first and then was slowly influenced by SNS. For specimens with standard curing ages of 7 and 28 d, the maximum UCS of SNS-S was 4.21 and 5.59 MPa, respectively, while the UCS of CS-S was only 2.84 and 3.11 MPa, respectively. Therefore, the UCS of SNS-S was about 1.6 times that of CS-S. The UCS of SNS-S increased first and then decreased slowly with the increase in stabilizer content. When the content was 10%, the UCS of SNS-S reached the peak value (5.59 MPa) at 28 d. The strength increases of 3, 7, 14, and 28 d were 68.5%, 21.7%, and 8.5%, respectively. The UCS values of SNS-S were almost all higher than those of CS-S.
According to the analysis, the slag in SNS underwent hydration reaction to generate Ca(OH)2 in the early period of stabilizing. Nanosilica and quicklime in the stabilizer with Ca(OH)2 underwent pozzolanic reaction to generate calcium silicate hydrate (C–S–H) gel, calcium aluminate silicate hydrate (C–A–S–H) gel, and other hydration reaction products, which played a cementing role between soil particles. This was also the main reason for the improvement of the strength characteristics of stabilized soil [28,29,30]. The nanosilica used in this test had smaller particle size and larger specific surface area, so it could more effectively promote the hydration reaction of the slag in the stabilizer and significantly improve the early compressive strength of silt [31]. Appropriate SNS can significantly improve the UCS of silt, but excessive SNS destroys the overall uniformity, leading to excess of hydration reaction products of slag, an increase in gaps between soil particles, a few cracks on the soil surface, and imperfect overall structural development, thereby resulting in the strength of stabilized soil decreasing slowly from the peak value. It can be seen that when the content of SNS was 10%, the improvement on the compressive properties of silt was the most significant.
4.2.2. Split Test
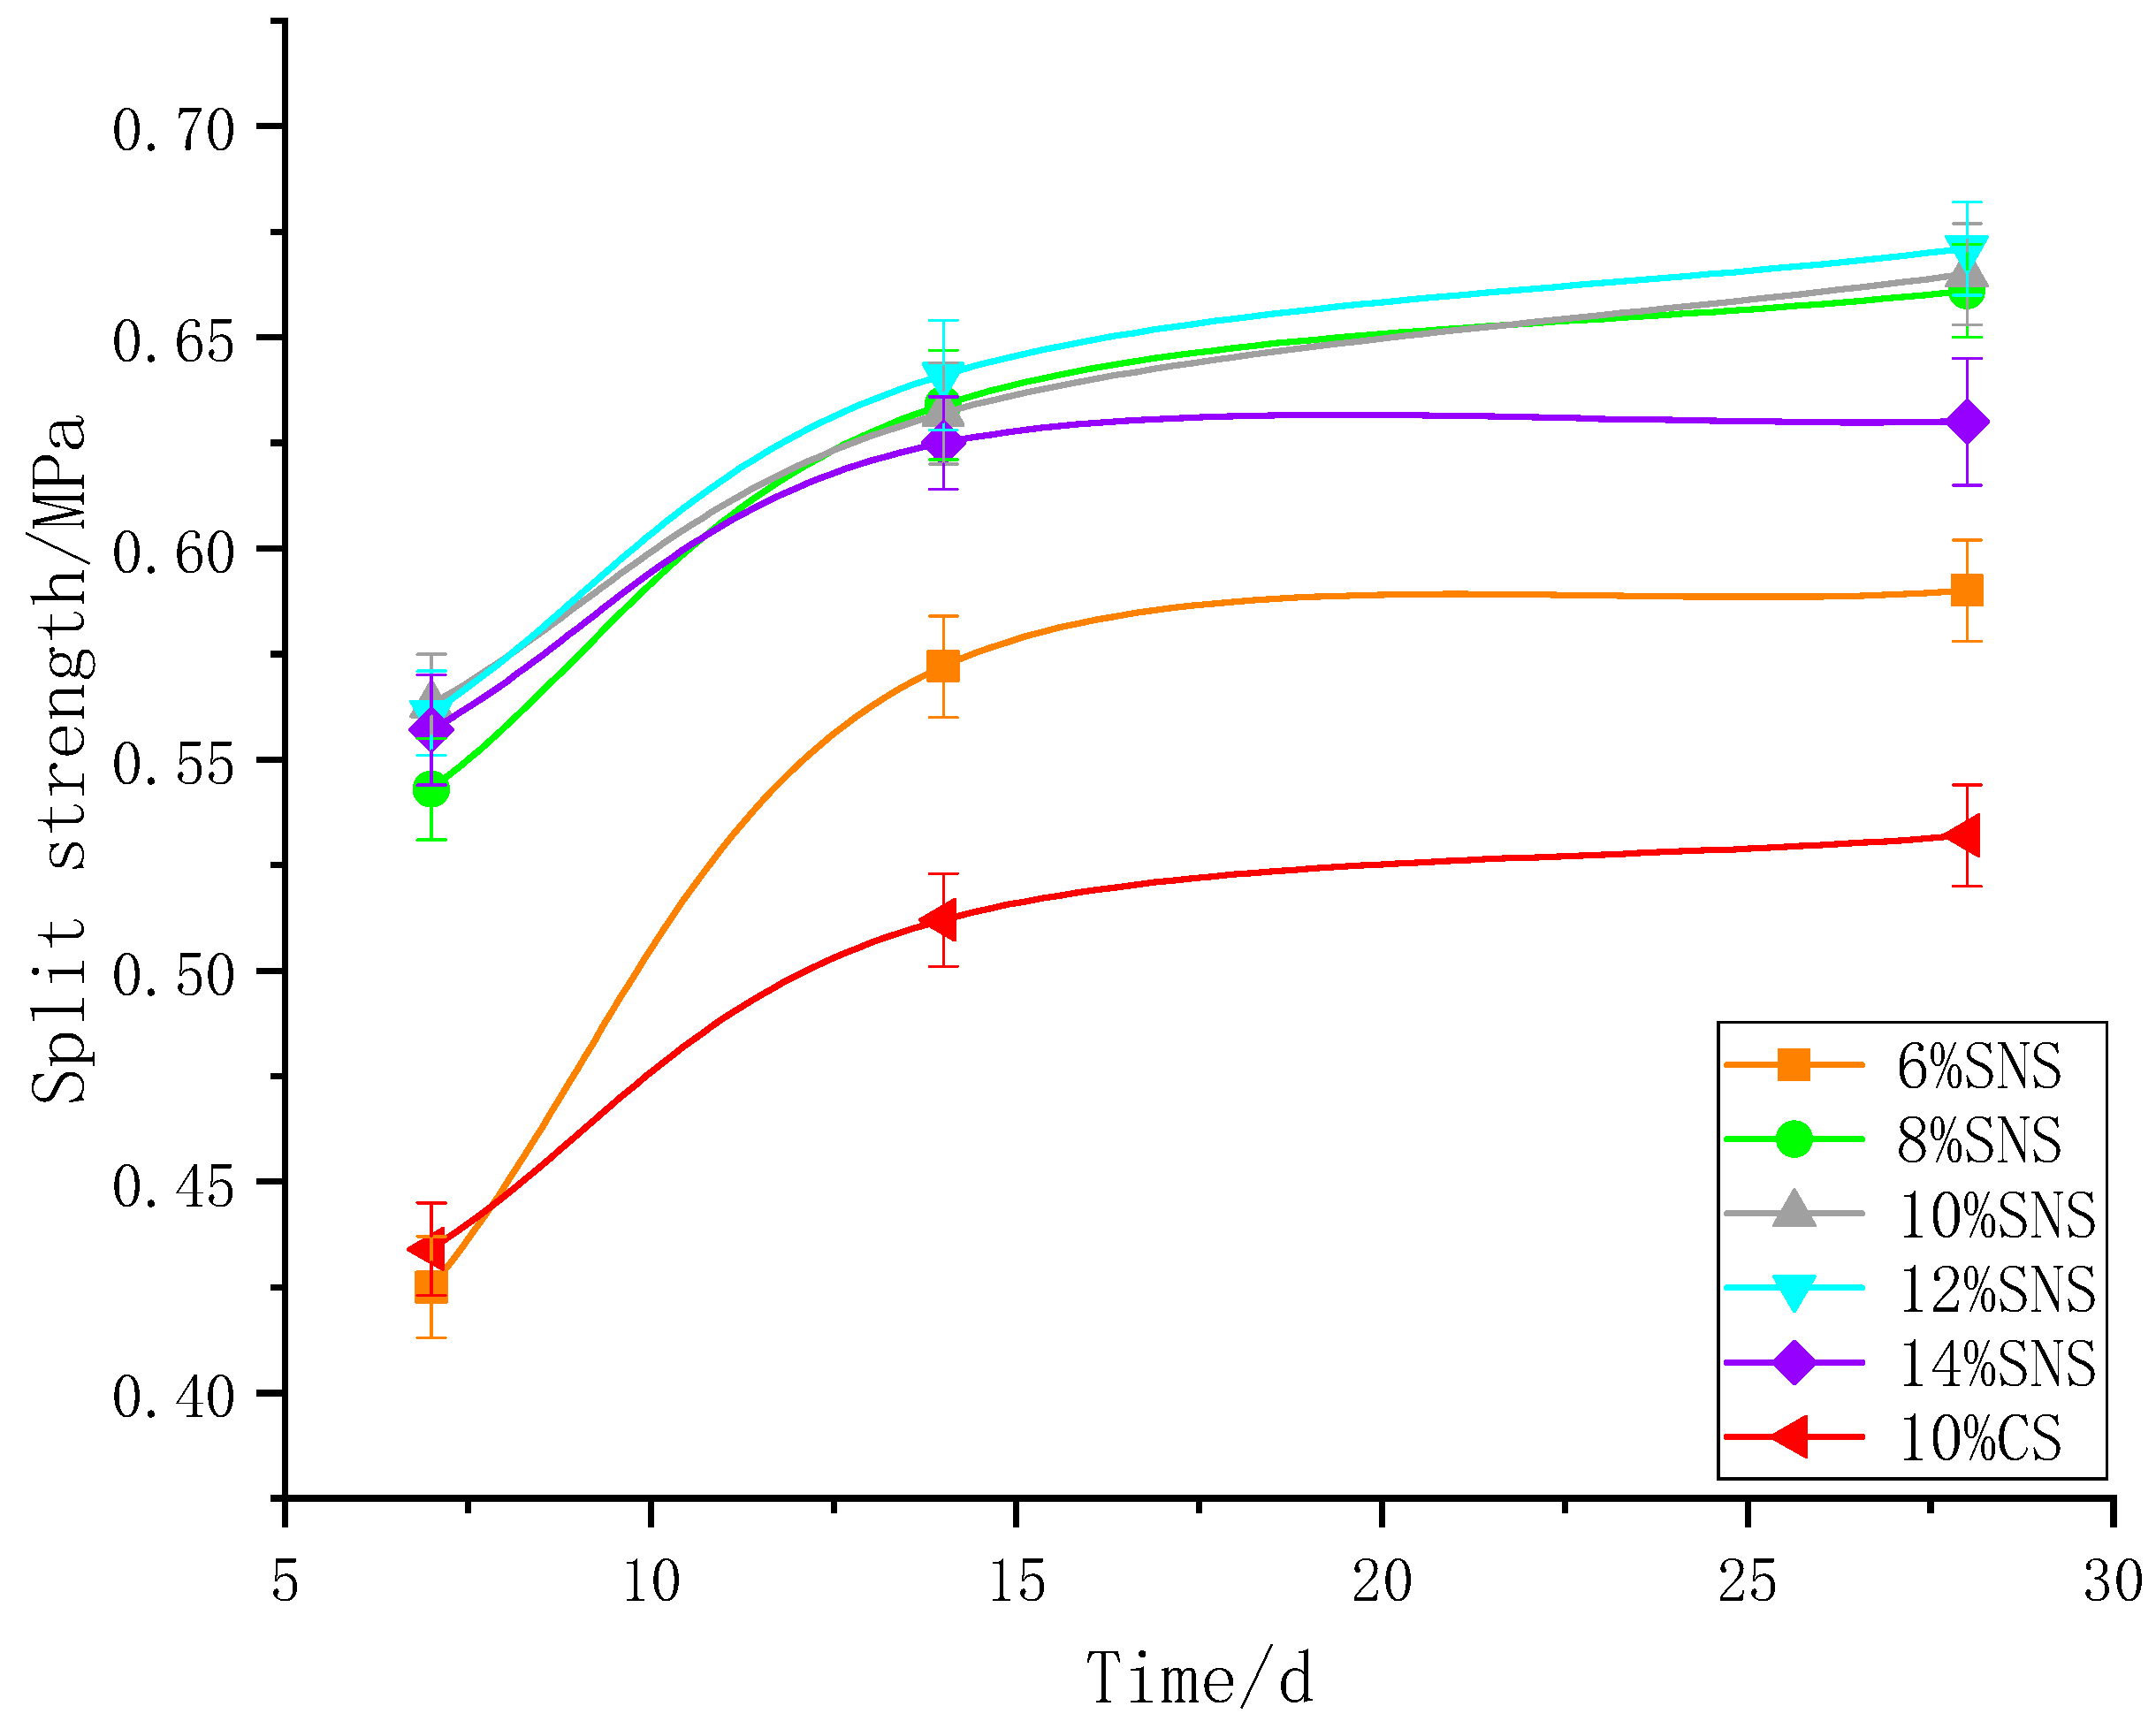
It can be seen from Figure 3 that the split strength of stabilized soil increased rapidly in the early period and gently in the later period with the increase in curing age. In the early period of SNS-S, the growth rate of the split strength was greater than that of CS-S, and when the split strength reached a flat level, the split strength of SNS-S was greater than that of CS-S. Among them, the 28 d split strength of 12% SNS-S was the highest at 0.671 MPa, which was 26.1% higher than that of CS-S. This was followed by the 28 d split strength of 10% SNS-S at 0.665 MPa, which was 25% higher than that of CS-S. Therefore, the addition of SNS instead of CS can effectively improve the shortcomings of low split strength of traditional CS-S [32] and significantly improve the shortcomings of poor cohesion of silt itself so that the structure of stabilized soil is more compact, thus improving the tensile property of SNS-S.
4.2.3. Water Stability Test
It can be seen from Table 11 that the water stability coefficient of SNS-S with the same content was higher than that of CS-S. After water bath curing, the Rc of SNS-S decreased significantly compared with the Rw. With the increase in water bath curing time, the compressive strength of the stabilized soil first decreased and then increased. The Rw of CS-S was 2.84 MPa, and the strength loss rate of CS-S with curing age of 3 d was the highest (28.17%). The water stability coefficient was 0.72, and the Rw of SNS-S was 4.45 MPa. The strength loss rate of SNS-S with curing age of 3 d was the lowest (13.26%), and the water stability coefficient was 0.87. The decreasing rate of the water stability coefficient in the early period of CS-S was larger than that of SNS-S, and the decreasing rate of the water stability coefficient in the later period of SNS-S was slower. With the increase in age, the water stability coefficient in the later period of CS-S and SNS-S gradually increased, and the stabilized soil tended to be stable under the water immersion environment [33].
In the above table, the age refers to the number of days of water bath curing after 6 d standard curing, Rw represents the standard UCS, Rc represents the UCS after water bath curing, Dw represents the strength loss rate, and Kw represents the water stability coefficient.
4.2.4. Freeze–Thaw Cycle Test
Table 12 gives the results of the freeze–thaw cycle test, where Rf represents the UCS after the test, and BDR represents the antifreeze index. As can be seen, under the same number of freeze–thaw cycles, SNS had a certain degree of improvement in the antifreeze performance for silt compared with CS. With the increase in the number of freeze–thaw cycles, the BDR of SNS-S decreased faster than the BDR of CS-S, but the BDR of SNS-S under different number of freeze–thaw cycles was greater than the BDR of CS-S.
Combined with the analysis results of freeze–thaw cycle of stabilized soil by Ke [34], Yang [35], and Ghazavi [36], it can be concluded that due to temperature changes, soil particles will be broken in the process of freeze–thaw cycle, the molecular attraction between soil particles will decrease, and the spacing between soil particles will become larger. The water phase in the soil will also change alternately, and the ice crystal structure will increase continuously, resulting in cracks on the soil surface. The C-S-H gel and C-A-S-H gel generated by hydration reaction and pozzolanic reaction in stabilized soil are destroyed with the increase in freeze–thaw times, which ultimately reflects the decrease of the macroscopic mechanical strength of stabilized soil.
As can be seen from Figure 4a, a few cracks appeared on the surface of SNS-S, and soil particles began to peel off on the surface. As can be seen from Figure 4b, with the increase in the number of freeze–thaw cycles, cracks on the surface of SNS-S increased, and a large number of soil blocks fell off or even formed gaps. This can also better explain the reason why the compressive strength of SNS-S significantly decreased when the number of freeze–thaw cycles of stabilized soil increased from a macro perspective. Due to the continuous freeze–thaw cycles of free water in the gaps, the gaps between the soil were also expanding and decreasing, leading to the formation of penetrating cracks between the gaps, thus leading to the phenomenon of peeling and falling blocks on the surface of the soil.
4.3. Micromechanism of Stabilization
4.3.1. SEM
Figure 5a is the SEM image of the original silt at magnification of 2000 times. It can be clearly seen from the figure that the microstructure of the silt was mainly agglomerated or lamellar, and the existence of flocculating structure and network structure was not observed. The soil surface had irregular shape and uneven distribution, and the structural elements were mainly the point–surface and edge–surface contacts [37]. Many black shadows could be observed, which represented the gaps between the soil particles or between the soil particles and the minerals. These gaps were haphazard and large in area. This was also good indication that there was obviously a lack of effective connection between the soil particles [38]. When the soil encounters water flow, the gaps will be filled with water and the soil particles will be softened, resulting in poor strength characteristics and poor pavement performance of the soil.
It can be seen from Figure 5b that the soil was still dominated by lumpy agglomeration. Compared with Figure 5a, it can be seen that the soil surface became relatively flat, and hydration products were produced. However, there were fewer products, which could not play a good filling role. Therefore, although adding a small amount of SNS improved the compressive strength to a certain extent, the effect of improvement was not obvious.
As can be seen from Figure 5c, with the increase in SNS content, more needle-like ettringite crystals (AFt), C-S-H gel, and C-A-S-H gel were produced [39,40]. This indicates that the hydration reaction in the early period became more sufficient with the increase in the content of SNS, and the hydration products increased significantly. The formation of needle-like crystals and flocculating substances could effectively fill the gaps between soil particles and played a stabilizing role, which made the soil structure more compact. This explains the variation of soil strength with the content of stabilizer. At the same time, as can be observed from Figure 5c, the microstructure of soil in the early period was mainly lamellar. There were a lot of AFt and hexagonal crystal Ca(OH)2 (C–H) on the surface of the soil. Compared with the original soil in Figure 5a, the gaps between soil particles were obviously reduced, and the direct connection mode of soil particles was also changed to the filling type, which improved the stability of the soil.
As can be seen from Figure 5d, with the increase in curing age, the soil microstructure changed from lamellar structure to flocculated structure, and the gaps between soil particles decreased significantly. This indicates that with the increase in curing age, the hydration product C–H fully participated in the formation of C-S-H gel and C-A-S-H gel in the pozzolanic reaction and played the role of cementation and filling. The strength of stabilized soil increased with the increase in curing age, which indicates that flocculated structure can improve the strength of soil better than lamellar structure.
To sum up, the SNS contributes to an obvious improvement in the structure of silt. With the increase in stabilizer content and curing age, the generation of gaps on the surface of the soil decreases significantly and the products of pozzolanic reaction also increases, which can fill and cement the gaps of soil particles and make the soil structure more compact. Figure 5 gives a good microscopic explanation for the obvious increase in strength of silt after adding SNS.
4.3.2. XRD
Figure 6 gives a comparison of the diffraction peaks of plain soil and specimens under different conditions. As can be seen, there were many diffraction peaks of nonsilt minerals, such as quartz and K-feldspar, and silt minerals, such as muscovite, chlorite, and kaolinite, can be seen. Comparing the XRD spectrum lines of silt before and after the addition of stabilizer, it can be seen that the spectrum lines of plain soil were extremely similar to that of stabilized soil at each content and curing age, which indicates that no new diffraction peak was generated after the addition of SNS and that the addition of stabilizer did not result in new minerals. With the increase in SNS content and curing age, it can be observed that the diffraction peak value of quartz (about 26.6°) decreased significantly, which indicates that the quartz (SiO2) in soil was involved in the stabilizing reaction and that the reaction of the stabilizer was better with the increase in SNS content and curing age. Because the C-S-H gel and C-A-S-H gel that were generated were amorphous products, there was no obvious diffraction peak in the spectrum lines. However, there was a corresponding diffuse diffraction peak (about 29°) on the XRD spectrum lines of SNS-S, which indicates that the addition of stabilizer generated hydration gel products. The diffraction peak (about 29.4°) of calcite (CaCO3) can be found by observing the XRD spectrum lines of SNS-S at 6%/28 d, which indicates that the stabilizer with low content had hydration reaction in the early period. Due to the low content of Ca2+, the Ca(OH)2 generated reacted with CO2 to generate more calcite.
The diffraction peaks (about 27.5° and 23.1°) of albite (Na[AlSi3O8]) and K-feldspar (K[AlSi3O8]) in the XRD spectrum lines of plain soil and SNS-S cured for 7 days were observed, and it was found that the corresponding diffraction peak values decreased with the increase in curing age. The ions of Na+ and K+ in the soil get exchanged with Ca2+ in SNS, which reduces the thickness of the double electric layer and increases the molecular attraction between soil particles [6], thus leading to the aggregation and condensation of soil particles, a denser soil structure, and increased strength [41].
5. Conclusions
Through laboratory and field tests, the optimal ratio of the new stabilizer and its stabilizing influence on silt were studied, and the following conclusions can be made:
- Taking slag, quicklime, and nanosilica as the main components of the stabilizer, through orthogonal test and grey correlation analysis, the optimal mix ratio of SNS was finally determined as quicklime: nanosilica: slag = 32:3:65.
- The new stabilizer had gelation and filling effects on silt, and the gelation increased first and then stabilized with the increase in time.
- Compared with traditional cement stabilizers, the new stabilizer could effectively improve the strength, water stability, and antifreeze properties of silt. The optimum content of the new stabilizer was 10%.
To sum up, SNS-S has higher strength property and durability, which can meet the requirements of highway construction. Applying it to silt subgrade can solve the problem of accumulation, which provides reference for future engineering.
Author Contributions
Conceptualization, X.W. and S.Q.; methodology, S.Q.; formal analysis, B.D. and K.C.; investigation, B.D. and S.Q.; writing—original manuscript preparation, S.Q. and K.C.; writing—review and editing, X.W., M.W., J.X., and S.Q. All authors have read and agreed to the published version of the manuscript.
Funding
This research received no external funding.
Institutional Review Board Statement
Not applicable.
Informed Consent Statement
Not applicable.
Data Availability Statement
Conflicts of Interest
The authors declare no conflict of interest.
References
- Gu, F.W.; Zhao, X.; Wu, C.S. Characteristics of Muddy Coastline of Zhejiang Province and Discussion on the Remediation. Ocean Dev. Manag. 2019, 36, 37–40. (In Chinese) [Google Scholar]
- Wojciech, S.; Andrzej, G.; Katarzyna, G.; Emil, S.; Alojzy, S. Resilient Modulus Characterization of Compacted Cohesive Subgrade Soil. Appl. Sci. 2017, 7, 370. [Google Scholar]
- Sung, M.; Lee, C.Y.; Lee, S.Z. Combined mild soil washing and compost-assisted phytoremediation in treatment of silt loams contaminated with copper, nickel, and chromium. J. Hazard. Mater. 2011, 190, 744–754. [Google Scholar] [CrossRef]
- Shi, Y.Q. The common treatment method of silt soil in the foundation of medium and small hydraulic structure. Shanxi Water Res. 2005, 4, 64. (In Chinese) [Google Scholar]
- He, J.; Shi, X.K.; Li, Z.X. Strength properties of dredged silt at high water content treated with sodium silicate, soda residue and ground granulated blastfurnace slag. J. Eng. Geol. 2019, 27, 729–736. (In Chinese) [Google Scholar]
- Zhu, Z.D.; Liu, S.Y. Utilization of a new soil stabilizer for silt subgrade. Eng. Geol. 2008, 97, 192–198. [Google Scholar] [CrossRef]
- Fan, H.P. Study on the Stabilized Soil with Stabilizer as Road Base. Ph.D. Thesis, Chang’an University, Xi’an, China, 2017. (In Chinese). [Google Scholar]
- Chen, S.; Wang, Q.; Yue, Y.L. Preparation and properties of high performance soil curing agent. Bull. Chin. Ceram. Soc. 2006, 1, 109–113. (In Chinese) [Google Scholar]
- Shen, F.; Cao, J.; Cao, H. Development status and prospect of soil curing agent. Min. Explor. 2008, 12, 62–66. [Google Scholar]
- Nadav, H.; Itzhak, K. A Clay-Based Geopolymer in Loess Soil Stabilization. Appl. Sci. 2020, 10, 2608. [Google Scholar]
- Tsuchida, T.; Porbaha, A.; Yamane, N. Development of a Geomaterial from Dredged Bay Mud. J. Mater. Civ. Eng. 2001, 13, 152–160. [Google Scholar] [CrossRef]
- AI-Amoudi, O.S.B. Characterization and Chemical Stabilization of Al-Qurayyah Sabkha Soil. J. Mater. Civ. Eng. 2002, 14, 478–484. [Google Scholar] [CrossRef]
- Yi, Y.L.; Li, C.; Sun, J. Test on alkali-activated ground granulated blast-furnace slag (GGBS) for Lianyungang soft soil stabilization. Chin. J. Rock Mech. Eng. 2013, 30, 820–1826. (In Chinese) [Google Scholar]
- Zhang, G.Z. Carbon dioxide emission reduction potential analysis in cement production process. Sichuan Cem. 2016, 2, 5. (In Chinese) [Google Scholar]
- Fatin, A.K.; Haslinda, N.; Bujang, K.H.; Vivi, A. Improvement of Marine Clay Soil Using Lime and Alkaline Activation Stabilized with Inclusion of Treated Coir Fibre. Appl. Sci. 2020, 10, 2129. [Google Scholar]
- Zukri, A. Pekan Soft Clay Treated with Hydrated Lime as a Method of Soil Stabilizer. Procedia Eng. 2013, 53, 37–41. [Google Scholar] [CrossRef] [Green Version]
- Sharma, A.K.; Sivapullaiah, P.V. Ground granulated blast furnace slag amended fly ash as an expansive soil stabilizer. Soils Found. 2016, 56, 205–212. [Google Scholar] [CrossRef]
- Kong, R. Study on mechanical properties and structural characteristics of nano-SiO2 stabilized loess. Lanzhou Univ. 2016, 56, 13–14. (In Chinese) [Google Scholar]
- Lv, Z.L.; Luo, Y.; Ma, B.G.; Tan, H.B.; Liu, X.H.; Chen, P.; Zhang, T. Effect of nano-silica on chloride immobilization capacity of cement-fly ash system. Bull. Chin. Ceram. Soc. 2019, 38, 1997–2003. (In Chinese) [Google Scholar]
- Xia, X.; Sun, Y.; Wu, K.; Jiang, Q. Optimization of a straw ring-die briquetting process combined analytic hierarchy process and grey correlation analysis method. Fuel Process. Technol. 2016, 152, 303–309. [Google Scholar] [CrossRef]
- Li, S.; Li, Y.; Shi, J.; Zhao, T.; Yang, J. Optimizing the formulation of external-soil spray seeding with sludge using the orthogonal test method for slope ecological protection. Ecol. Eng. 2017, 102, 527–535. [Google Scholar] [CrossRef]
- IHMCC (Institute of Highway of the Ministry of Communications, China). Test Methods of Soils for Highway Engineering (JTG E40-2007); People’s Communications Press: Beijing, China, 2007. (In Chinese) [Google Scholar]
- IHMCC (Institute of Highway of the Ministry of Communications, China). Test Methods of Materials Stabilized with Inorganic Binders for Highway Engineering (JTG E51-2009); People’s Communications Press: Beijing, China, 2009. (In Chinese) [Google Scholar]
- Peng, W.; Wang, Q.; Liu, Y.F.; Sun, X.H.; Chen, Y.T.; Han, M.X. The Influence of Freeze-Thaw Cycles on the Mechanical Properties and Parameters of the Duncan-Chang Constitutive Model of Remolded Saline Soil in Nong’an County, Jilin Province, Northeastern China. Appl. Sci. 2019, 9, 4941. [Google Scholar] [CrossRef] [Green Version]
- Liu, H.B.; Sun, S.; Wang, L.X.; Zhang, Y.L.; Wang, J.; Luo, G.B.; Han, L.L. Microscopic Mechanism of the Macroscopic Mechanical Properties of Cement Modified Subgrade Silty Soil Subjected to Freeze-Thaw Cycles. Appl. Sci. 2020, 10, 2182. [Google Scholar] [CrossRef] [Green Version]
- Lan, W.; Roy, A.; Seals, R.K.; Byerly, Z. Suppression of Sulfate Attack on a Stabilized Soil. J. Am. Ceram. Soc. 2010, 88, 1600–1606. [Google Scholar]
- Powałka, M.; Bulin’Ski, J. Effect of compacting soil on changes in its strength. Chem. Eng. J. 2014, 262, 364–371. [Google Scholar]
- Wang, Z.Y.; Yang, J.S.; Wang, X.H. Experimental study of micro-structural mechanisms of waste residue of EPB stabilized by ZY-1 agent. J. Railw. Sci. Eng. 2020, 17, 2075–2082. (In Chinese) [Google Scholar]
- Zhu, Z.; Pu, S.; Zhang, J.; Wan, Y.; Song, W.; Wang, H. Water resistance and compressibility of silt solidified with lime and fly-ash mixtures. Environ. Earth Sci. 2021, 80, 103. [Google Scholar] [CrossRef]
- Zhang, X.; Zhu, Z. Microscopic Mechanism of Cement Improving the Strength of Lime-Fly Ash-Stabilized Yellow River Alluvial Silt. Adv. Civ. Eng. 2020, 2020, 9649280. [Google Scholar]
- Lin, D.F.; Luo, H.L.; Darn-Horng, H. Enhancing soft subgrade soil with a sewage sludge ash/cement mixture and nano-silicon dioxide. Environ. Earth Sci. 2016, 75, 619. [Google Scholar] [CrossRef]
- Pu, S.; Zhu, Z.; Song, W.; Wan, Y.; Wang, H.; Song, S.; Zhang, J. Mechanical and Microscopic Properties of Cement Stabilized Silt. KSCE J. Civ. Eng. 2020, 24, 2333–2344. [Google Scholar] [CrossRef]
- Wang, Y.; Zhang, H.; Zhang, Z. Experimental Study on Mechanics and Water Stability of High Liquid Limit Soil Stabilized by Compound Stabilizer: A Sustainable Construction Perspective. Sustainability 2021, 13, 5681. [Google Scholar] [CrossRef]
- Ke, R.; Wang, H.X.; Tan, Y.Z.; Wu, J.; Huang, L.B. Effect of freeze-thaw cycle on mechanical properties of solidified silt. J. Yangtze River Sci. Res. Inst. 2019, 36, 136–139. (In Chinese) [Google Scholar]
- Yang, Z.P.; Li, D.H.; Deng, R.F.; Tian, X.; Ren, S. An experimental study for influence of freeze-thaw cycles on strength and pore characteristics of solidified lead-contaminated soil. J. Eng. Geol. 2019, 27, 539–549. (In Chinese) [Google Scholar]
- Ghazavi, M.; Roustaie, M. The influence of freeze-thaw cycles on the unconfined compressive strength of fiber-reinforced clay. Cold Reg. Sci. Technol. 2010, 61, 125–131. [Google Scholar] [CrossRef]
- Yang, Q.; Luo, X.H.; Qiu, X.; Wu, J.H. Analysis of microstructure characteristics and stabilization mechanism of ionic soil stabilizer treated clay. J. Highw. Transport. Res. Dev. 2015, 32, 33–40. (In Chinese) [Google Scholar]
- Ge, S.; Zang, J.; Wang, Y.; Zheng, L.; Xie, X. Combined stabilization/solidification and electroosmosis treatments for dredged marine silt. Mar. Georesour. Geotec. 2020, 6, 1–10. [Google Scholar] [CrossRef]
- Yi, Y.L.; Qing, X.W.; Zhuang, Y.; Liu, S.Y.; Du, G.Y. Utilization of GGBS in stabilization of soft soils and its mechanism. Chin. J. Geotech. Eng. 2013, 35, 829–833. (In Chinese) [Google Scholar]
- Yu, B.W.; Du, Y.J.; Liu, C.Y.; Bo, Y.L. Study of durability of reactive magnesia-activated ground granulated blast-furnace slag stabilized soil attacked by sulfate sodium solution. Rock Soil Mech. 2015, 36, 64–72. (In Chinese) [Google Scholar]
- Liang, S.; Dai, J.; Niu, J.; Wang, M.; Wang, L.; Dong, J. Solidification of additives for zinc-contaminated silt. Adv. Mech. Eng. 2018, 10, 168781401878923. [Google Scholar] [CrossRef] [Green Version]
Figure 1.
Specimen of stabilizer components.

Figure 2.
Change of unconfined compressive strength with time.

Figure 3.
Change of split strength with time.

Figure 4.
The damage shape of SNS-S after freeze–thaw cycle test.

Figure 5.
SEM photomicrographs of soil and SNS-S.

Figure 6.
XRD results.


Table 1.
Basic physical properties of silt.
| Soil Sample | w/% | ρ/(g·cm−3) | wL/% | wP/% | IP/% | Classification |
|---|---|---|---|---|---|---|
| Silt | 30.12 | 1.76 | 48.70 | 29.60 | 19.10 | CLS |
Table 2.
Main components of slag.
| Composition | CaO | SiO2 | Fe2O3 | Al2O3 | SO3 | MgO | LOI |
|---|---|---|---|---|---|---|---|
| Content/% | 36.00 | 34.35 | 2.03 | 15.60 | 1.01 | 7.02 | 1.07 |
LOI: loss on ignition.
Table 3.
Basic parameters of nanosilica.
| Appearance | Particle Size/nm | SW/(m2·g−1) | PH Value | Si Content/% |
|---|---|---|---|---|
| White powder | 15 | 250 | 5.7 | 99.8 |
Table 4.
Physical and mechanical properties of P.O.42.5 plain Portland cement.
| Stability | 3 d Strength/MPa | 7 d Strength/MPa | Setting Time/min | SW | |||
|---|---|---|---|---|---|---|---|
| Compressive | Flexural | Compressive | Flexural | Initial Set | Final Set | /(m2·kg−1) | |
| Qualified | 28.8 | 5.9 | 54.2 | 8.6 | 180 | 235 | 355 |
Table 5.
Factor level table.
| Level | Factor | ||
|---|---|---|---|
| Quicklime Content A/% | Nanosilica Content B/% | Slag Content C/% | |
| 1 | 2 | 0.2 | 4 |
| 2 | 3 | 0.3 | 5 |
| 3 | 4 | 0.4 | 6 |
Table 6.
Orthogonal test program.
| Test No. | Quicklime Content A/% | Nanosilica Content B/% | Vacant Column | Slag Content C/% |
|---|---|---|---|---|
| A1 | 2 (1) | 0.2 (1) | 0 (1) | 4 (1) |
| A2 | 2 (1) | 0.3 (2) | 0 (2) | 6 (3) |
| A3 | 2 (1) | 0.4 (3) | 0 (3) | 5 (2) |
| A4 | 3 (2) | 0.2 (1) | 0 (2) | 5 (2) |
| A5 | 3 (2) | 0.3 (2) | 0 (3) | 4 (1) |
| A6 | 3 (2) | 0.4 (3) | 0 (1) | 6 (3) |
| A7 | 4 (3) | 0.2 (1) | 0 (3) | 6 (3) |
| A8 | 4 (3) | 0.3 (2) | 0 (1) | 5 (2) |
| A9 | 4 (3) | 0.4 (3) | 0 (2) | 4 (1) |
Table 7.
Compaction test and UCS test results.
| Test No. | Optimal Moisture Content /% | Maximum Dry Density /(g·cm−3) | 7 d SCCS/MPa | 28 d SCCS/MPa | 7 d WCCS/MPa | 28 d WCCS/MPa |
|---|---|---|---|---|---|---|
| A1 | 30.37 | 1.61 | 1.85 | 3.40 | 0.52 | 1.81 |
| A2 | 29.73 | 1.64 | 2.28 | 3.88 | 0.64 | 2.49 |
| A3 | 31.85 | 1.63 | 2.13 | 3.77 | 0.80 | 2.58 |
| A4 | 30.12 | 1.65 | 2.31 | 4.15 | 1.24 | 2.16 |
| A5 | 30.41 | 1.64 | 2.48 | 4.86 | 1.33 | 2.24 |
| A6 | 30.25 | 1.71 | 2.72 | 5.25 | 1.52 | 3.43 |
| A7 | 30.67 | 1.75 | 3.12 | 4.60 | 0.84 | 2.89 |
| A8 | 30.84 | 1.72 | 3.05 | 4.39 | 0.85 | 2.58 |
| A9 | 30.77 | 1.70 | 2.87 | 4.32 | 1.19 | 2.84 |
Table 8.
Grey system normalization results.
| 1.000 0 | 1.000 0 | 1.000 0 | 1.000 0 | |
|---|---|---|---|---|
| 0.000 0 | 0.000 0 | 0.000 0 | 0.000 0 | |
| 0.338 6 | 0.259 5 | 0.120 0 | 0.419 8 | |
| 0.220 5 | 0.200 0 | 0.280 0 | 0.475 3 | |
| 0.362 2 | 0.405 4 | 0.720 0 | 0.216 0 | |
| 0.496 1 | 0.789 2 | 0.810 0 | 0.265 4 | |
| 0.685 0 | 1.000 0 | 1.000 0 | 1.000 0 | |
| 1.000 0 | 0.648 6 | 0.320 0 | 0.666 7 | |
| 0.944 9 | 0.535 1 | 0.330 0 | 0.475 3 | |
| 0.803 1 | 0.497 3 | 0.670 0 | 0.635 8 |
Table 9.
Correlation coefficient calculation results.
| No. | ||||
|---|---|---|---|---|
| 0.3333 | 0.3333 | 0.3333 | 0.3333 | |
| 0.4305 | 0.4031 | 0.3623 | 0.4629 | |
| 0.3908 | 0.3846 | 0.4098 | 0.4880 | |
| 0.4394 | 0.4568 | 0.6410 | 0.3894 | |
| 0.4980 | 0.7034 | 0.7246 | 0.4050 | |
| 0.6135 | 1.0000 | 1.0000 | 1.0000 | |
| 1.0000 | 0.5873 | 0.4237 | 0.6000 | |
| 0.9007 | 0.5182 | 0.4274 | 0.4880 | |
| 0.7175 | 0.4987 | 0.6024 | 0.5786 |
Table 10.
Range analysis of orthogonal test results.
| Test No. | Quicklime Content A/% | Nanosilica Content B/% | Vacant Column | Slag Content C/% |
|---|---|---|---|---|
| A1 | 2 (1) | 0.2 (1) | 0 (1) | 4 (1) |
| A2 | 2 (1) | 0.3 (2) | 0 (2) | 6 (3) |
| A3 | 2 (1) | 0.4 (3) | 0 (3) | 5 (2) |
| A4 | 3 (2) | 0.2 (1) | 0 (2) | 5 (2) |
| A5 | 3 (2) | 0.3 (2) | 0 (3) | 4 (1) |
| A6 | 3 (2) | 0.4 (3) | 0 (1) | 6 (3) |
| A7 | 4 (3) | 0.2 (1) | 0 (3) | 6 (3) |
| A8 | 4 (3) | 0.3 (2) | 0 (1) | 5 (2) |
| A9 | 4 (3) | 0.4 (3) | 0 (2) | 4 (1) |
| k1 | 0.190 | 0.367 | 0.500 | 0.417 |
| k2 | 0.647 | 0.483 | 0.457 | 0.623 |
| k3 | 0.637 | 0.623 | 0.517 | 0.433 |
| R | 0.457 | 0.256 | 0.060 | 0.206 |
Table 11.
Water stability test results.
| Type of Stabilizer | Time/d | Rw/MPa | Rc/MPa | Dw/% | Kw |
|---|---|---|---|---|---|
| SNS | 1 | 4.45 | 3.78 | 15.73% | 0.84 |
| 3 | 3.65 | 17.98% | 0.82 | ||
| 7 | 3.86 | 13.26% | 0.87 | ||
| CS | 1 | 2.84 | 2.17 | 23.59% | 0.77 |
| 3 | 2.04 | 28.17% | 0.72 | ||
| 7 | 2.07 | 27.11% | 0.73 |
Table 12.
Freeze–thaw cycle test results.
| Type of Stabilizer | Cycles/Times | Rw/MPa | Rf/MPa | BDR/% |
|---|---|---|---|---|
| SNS | 1 | 4.58 | 3.83 | 83.62 |
| 5 | 3.50 | 76.42 | ||
| CS | 1 | 3.05 | 2.31 | 75.74 |
| 5 | 2.21 | 72.46 |
Publisher’s Note: MDPI stays neutral with regard to jurisdictional claims in published maps and institutional affiliations. |
© 2021 by the authors. Licensee MDPI, Basel, Switzerland. This article is an open access article distributed under the terms and conditions of the Creative Commons Attribution (CC BY) license (https://creativecommons.org/licenses/by/4.0/).
Share and Cite
MDPI and ACS Style
Wang, X.; Qi, S.; Dong, B.; Chen, K.; Wang, M.; Xu, J. Research and Application of Slag–Nanosilica Stabilizer for Silt Subgrade. Appl. Sci. 2021, 11, 8014. https://0-doi-org.brum.beds.ac.uk/10.3390/app11178014
AMA Style
Wang X, Qi S, Dong B, Chen K, Wang M, Xu J. Research and Application of Slag–Nanosilica Stabilizer for Silt Subgrade. Applied Sciences. 2021; 11(17):8014. https://0-doi-org.brum.beds.ac.uk/10.3390/app11178014
Chicago/Turabian StyleWang, Xiushan, Shunxin Qi, Bowen Dong, Keyu Chen, Mingjie Wang, and Jingyi Xu. 2021. "Research and Application of Slag–Nanosilica Stabilizer for Silt Subgrade" Applied Sciences 11, no. 17: 8014. https://0-doi-org.brum.beds.ac.uk/10.3390/app11178014
Note that from the first issue of 2016, this journal uses article numbers instead of page numbers. See further details here.