Article

Educational Organization’s Security Level Estimation Model

by
Simona Ramanauskaitė
1,*,
Neringa Urbonaitė
2,
Šarūnas Grigaliūnas
3,
Saulius Preidys
4,
Vaidotas Trinkūnas
5 and
Algimantas Venčkauskas
3
1
Department of Information Technologies, Vilnius Gediminas Technical University, Sauletekio al. 11, LT-10223 Vilnius, Lithuania
2
Institute of Data Science and Digital Technologies, Vilnius University, Akademijos g. 4, LT-08412 Vilnius, Lithuania
3
Department of Computer Sciences, Kaunas University of Technology, Studentų g. 50-213, LT-10223 Kaunas, Lithuania
4
Department of Information and Knowledge Management, Vilnius University, Saulėtekio al. 9, LT-10223 Vilnius, Lithuania
5
Department of Construction Economics and Property Management, Vilnius Gediminas Technical University, Sauletekio al. 11, LT-10223 Vilnius, Lithuania
*
Author to whom correspondence should be addressed.
Submission received: 2 August 2021 / Revised: 26 August 2021 / Accepted: 28 August 2021 / Published: 31 August 2021
(This article belongs to the Special Issue Advanced Technologies in Data and Information Security)

Abstract

:
During the pandemic, distance learning gained its necessity. Most schools and universities were forced to use e-learning tools. The fast transition to distance learning increased the digitalization of the educational system and influenced the increase of security incident numbers as there was no time to estimate the security level change by incorporating new e-learning systems. Notably, preparation for distance learning was accompanied by several limitations: lack of time, lack of resources to manage the information technologies and systems, lack of knowledge on information security management, and security level modeling. In this paper, we propose a security level estimation model for educational organizations. This model takes into account distance learning specifics and allows quantitative estimation of an organization’s security level. It is based on 49 criteria values, structured into an AHP (Analytic Hierarchy Process) tree, and arranged to final security level metric by incorporating experts’ opinion-based criteria importance coefficients. The research proposed a criteria tree and obtained experts’ opinions lead to educational organization security level evaluation model, resulting in one quantitative metric. It can be used to model different situations and find the better alternative in case of security level, without external security experts usage. Use case analysis results and their similarity to security experts’ evaluation are presented in this paper as validation of the proposed model. It confirms the model meets experts-based information security level ranking, therefore, can be used for simpler security modeling in educational organizations.

1. Introduction

The increasing popularity of information technologies brings new features to its users, however, at the same time additional cybersecurity risks appear. The report published by Skybox Security in 2021 shows that the vulnerabilities and threats on the Internet have increased 106% from 2019 to 2020 [1]. This is partly related to the COVID-19 pandemic and global quarantine when most of the daily activities moved to cyberspace. The transition had to be performed quickly, therefore, in some cases, not enough attention was dedicated to the security issues.
One of the areas significantly changed during the pandemic is education. The education process was transformed into e-learning. The fast changes in the pandemic situation did not allow long preparation; therefore, the transition from traditional to e-learning mostly was conducted by experimenting, rather than deeply analyzing the situation and the possible security risks to the educational organization and its user. However, security management in educational organizations is related not only to the pandemic—most of the education organizations have not enough resources and/or knowledge to evaluate the security risks and manage them. The lack of security experts or/and their attention in education organizations lead to the need for security level estimation models adapted to non-security expert usage. The model would allow estimation on how the security level would change by incorporating new systems into the learning process, defining its availability, how organization security and its information technology infrastructure management policies might affect the security level, etc. Existing security risk evaluation solutions are mostly based on an expert’s opinion and analysis of the specific situation and are, therefore, a time, resource, and knowledge consuming task.
Therefore, the paper aims to simplify the security level estimation process for education organizations by presenting a quantitative security level estimation model. Our supposition is that the model usage requires no security experts’ knowledge and actions in educational organization security level estimation while it provides a quantitative security level score, similar to experts’ security level evaluation results. The obtained score could be used for the organization’s security level modeling, comparison of several alternative situations in the sense of security level assurance. Therefore, a simpler modeling of security level in an educational organization would lead to better situation understanding and a security level increase.
The educational organization specifics are the variety of stakeholders (employees, students of different ages, students’ parents), dedicated purpose information systems usage (learning material and knowledge evaluation tools, communication systems), orientation on two-directional services (teachers provide a teaching service, not based on students order but existing governmental requirements, while the students are obliged to demonstrate learning results to the teacher) and other. Existing security risk evaluation methods can be used to assess the educational organization security level; however, all these specifics must be taken into account. Therefore, a deep and time-consuming analysis must be performed and the final decision must be taken by a security management expert. By using the proposed model, the security level estimation would not require security risk evaluation expertise as the criteria importance coefficients are obtained in this research; therefore, even information technology knowledge would be enough to model and investigate possible security levels. It would require model input data gathering, while the security level metric would be provided as an output with no need to evaluate security risk or impact to the organization.
To achieve the aim, the paper overviews the related works in Section 2 for the reveal of existing models and possible implementation solutions. The model, based on a multi-criteria decision-making method, is proposed in Section 3. The section provides the 49 quantitative criteria, constructed to the AHP (Analytic Hierarchy Process) tree, its normalization methodology, and estimated criteria importance. The criteria importance was estimated by using four security management experts who, therefore, provide valuable insights on which criteria are the most important. The model validation by comparing model-based alternative ranking with expert-based ranking is presented in Section 4. The paper is summarized with conclusions and future work.

2. Related Works

Information security level is usually expressed as a security risk. The risk is measured as a “combination of the likelihood of an event and its consequence” [2]. Risk assessment is very dependent on the area; therefore, specific solutions are proposed not just for the security area, but for some specific situations as well.

2.1. Information Security Risk Assessment

One of the first security risk measurement guides was presented in 1975 and accented the need to take into account “The damage which can result from an event of an unfavorable nature” and “The likelihood of such an event occurring” [3]. The same two key factors are used today to evaluate security risks. However, different views on risk and its management exist. The initial ones were mostly based on military analogy [4]—how to survive possible attacks. The evolving information management area changed, as did the risk management—the risk view was formed by liberalism [5], constructivism [6] ideas. The existing different views on risk concepts are mainly classified as technical and subjective by C. Christensen [7]. The technical view is mostly related to an objective property of activity and measured as the likelihood and impact (harm) to the organization. In most cases, a risk matrix is used to define the security level based on the intersection of those two. Meanwhile, the subjective view is oriented on the incorporation of social, institutional, cultural, and other factors to the risk understanding.
Despite the risk concept understanding that might vary, the process of information security risk management is complex as well and mostly consists of risk identification, estimation, and evaluation [8]. Those three stages have smaller steps to be executed to obtain an accurate view of situation security risks. Because of the complexity of Information Security Risk Assessment (ISRA), multiple frameworks exist: CRAMM [9], CORAS [10], OCTAVE [11], ISO/IEC 27005:2011 [12], NIST SP 800-30 [13], etc. Those are dedicated to present a methodology for security risk assessment and management. However, Gaute Wangen’s research indicates that the completeness of ISRA frameworks varies; therefore, clear guidance is needed to understand which framework is more suitable for some specific situation or organization [14]. As well, the ISRA frameworks are mostly oriented on risk management process and provide general principles. Meanwhile, a quantitative presentation of security risk is mostly provided by an expert’s evaluation or some quantitative methods.

2.2. Security Risk and/or Security Level Quantitative Estimation Methods

A Common Vulnerability Scoring System (CVSS) [15] is one of the data sources for quantitative security risk measurement. It provides access vector, attack complexity, privilege necessity, impact, temporal and environment metrics, qualitative rating scale, and other data for stored security vulnerabilities. Therefore, this data can be incorporated for security risk quantitative measurement. For example, Siv HildeHoumb et al. [16] use CVSS as a source to estimate the frequency and impact of vulnerabilities. Meanwhile, HyunChul Joh and Yashwant K. Malaiya [17] use CVSS metrics and additionally take into account vulnerability lifecycle to measure the risk. Multiple authors incorporate CVSS data to express security risk levels [18,19,20]. However, those methods are oriented on the target of interest—one specific system, device, etc. To achieve higher accuracy, the complexity and interconnection must be taken into account.
One example of interconnection incorporation in information security risk measurement is information security management controls [21]. This is necessary when multiple controls must be applied to the same situation and a balance between them must be achieved.
Another way to present the interconnectivity is the usage of attack trees or graphs. This approach is very popular to present dependencies between elements [22,23,24,25,26,27]. Since the attack path analysis via an attack tree or graph security risk assessment can incorporate an analysis of consequences as well to investigate the relationship between different threats. However, the usage of attack trees or graphs in situations with multiple elements becomes very complex and time-consuming.
Most advanced and difficult risk assessment models utilize statistical modeling techniques that incorporate machine learning algorithms and long–short term dependencies. Machine learning algorithms allow deeper data analysis compared to other security systems [28]. Further, data analysis, simulation, and traffic monitoring become one of the ways to detect anomalies. Theoretically, local and wide area network traffic follow the asymptotic self-similarity model. Consequently, self-similarity, long–short term dependencies, and autocorrelation can be measured by estimating the Hurst parameter [29]. As authors discuss [30], these approaches can improve the detection ability of vulnerability effectively. However, its application requires statistically sufficient data.
Other directions to simplify the security risk assessment and maintain the analyzed area complexity are fuzzy logic and multi-criteria decision-making solutions. Fuzzy logic helps to solve the problem of value assignment to some security or property level [31,32]; however, fuzzy cognitive maps can be used to present the interconnectivity of the situation [33]. Meanwhile, multi-criteria decision-making solutions solve the problem of quantitative metrics, composed of multiple criteria [34,35,36]. While most information security risk assessments require security expert’s interpretation, the multi-criteria decision making usually is based on weighting some criteria; therefore, together with data gathering solutions, it can be used by non-experts in the security area.

2.3. Education Organization Security Risk Assessment

Security risk management and assessment are very closely related to some specific areas. Therefore, a security risk assessment model exists for specifically Internet of Things systems [37], cloud computing environments [38], nuclear, SCADA systems [39,40], and other areas. Therefore, it is important to develop education organization’s security risk assessment models as well.
In a search of education or e-learning organization security risk assessment Web of Knowledge, Google Scholar, Scopus, ACM Digital Library, EBSCO Publishing, IEEE Xplore, Springer LINK, Taylor & Francis scientific journal databases were analyzed. A graph of analyzed keywords of papers is presented in Figure 1.
The keyword bubble size indicated the occurrence of the keyword and illustrates the key keywords are concentrated on “online learning”, “cybersecurity”, and “COVID-19”. Meanwhile, the keyword “risk assessment” is assigned to the same cluster as “COVID-19”, while the keyword “probabilistic risk assessment” belongs to the “cybersecurity” cluster. This indicates that the education organization security risk assessment is not that popular and has no clear belonging to the cybersecurity area or more general topics.
The analysis of existing papers on the topic of education organization and security risk assessment revealed a lack of security risk assessment models dedicated to an educational organization. Most related papers are related to some IT environments in the education organization. For instance, authors Umesh Kumar Singh and Chanchala Joshi propose a model for the university computing environment [41,42]. The solution provides external and internal scanning and based on existing tools presents some metrics for the environment security risk assessment. However, no universal model, oriented to any education institution and including both security-management related security risks, not just hardware/software related, are provided in this paper. Papers by Igor V. Anikin [43], Umesh Kumar Singh et al. [44] are oriented on some specific area of education institution and present the security risk assessment results rather than education organization dedicated security risk assessment model.
Another direction on security risk assessment, related to education organizations, is the risk assessment of e-learning systems. For example, Najwa Hayaati Mohd Alwi and Ip-Shing Fan define criteria for estimating the information security threats in an e-learning environment [45], Aditya Khamparia and Babita Pandey model security threats by using Petri nets [46], Zainal Fikri Zamzuri et al. analyses the threats to e-learning system assets [47].
We have not succeeded to find a security risk assessment model, which would take into account the security of the organization as a whole, not separate elements of it, and would present one quantitative metric, defining the security level of the education organization. Therefore, the paper presents a new, multi-criteria decision-based model (MCDM), dedicated to educational organization security level estimation. The idea of MCDM usage in the security area is not new; however, it was not used for educational organization security level estimation. There were no security level quantitative models dedicated to educational organization security level estimation at all. The paper presents a constructed MCDM criteria list, its values normalization methods, experts’ opinion-based criteria importance coefficients.

3. Proposed Security Level Estimation Model

To simplify the evaluation of education organization security level, a quantitative model would allow the possibility of modeling different situations and comparing them, analyzing the impact of some security influencing factors. At the same time, the model application would be more accessible in case of automated or at least no specific security knowledge requiring data gathering about the organization. Considering that fully automated solutions cannot provide data on the organization’s security policies and processes, a manual data presentation about the organization is selected. By adopting the model to use discrete input values, which evaluation does not require specific security knowledge, even small organizations, which has no security specialists in it will be able to model organizations security level situations.
A multi-criteria decision-making approach is used for the security level estimation model to assure all the mentioned features will be taken into account. The base principle of MCDM usage in the model is presented in Figure 2. Model developers estimate the set of criteria, which define the education organization security level and can be discretely evaluated. The criteria are selected to reflect both organization security and safety, i.e., third parties related risks as well as individual, employee impact to the organization. Then, to evaluate the importance of each criterion, security experts execute a pair-wise comparison between criteria. This kind of comparison allows an estimation of expert’s opinion consistency ratio. Therefore, only data of security experts with a consistent opinion are used for criteria importance estimation.
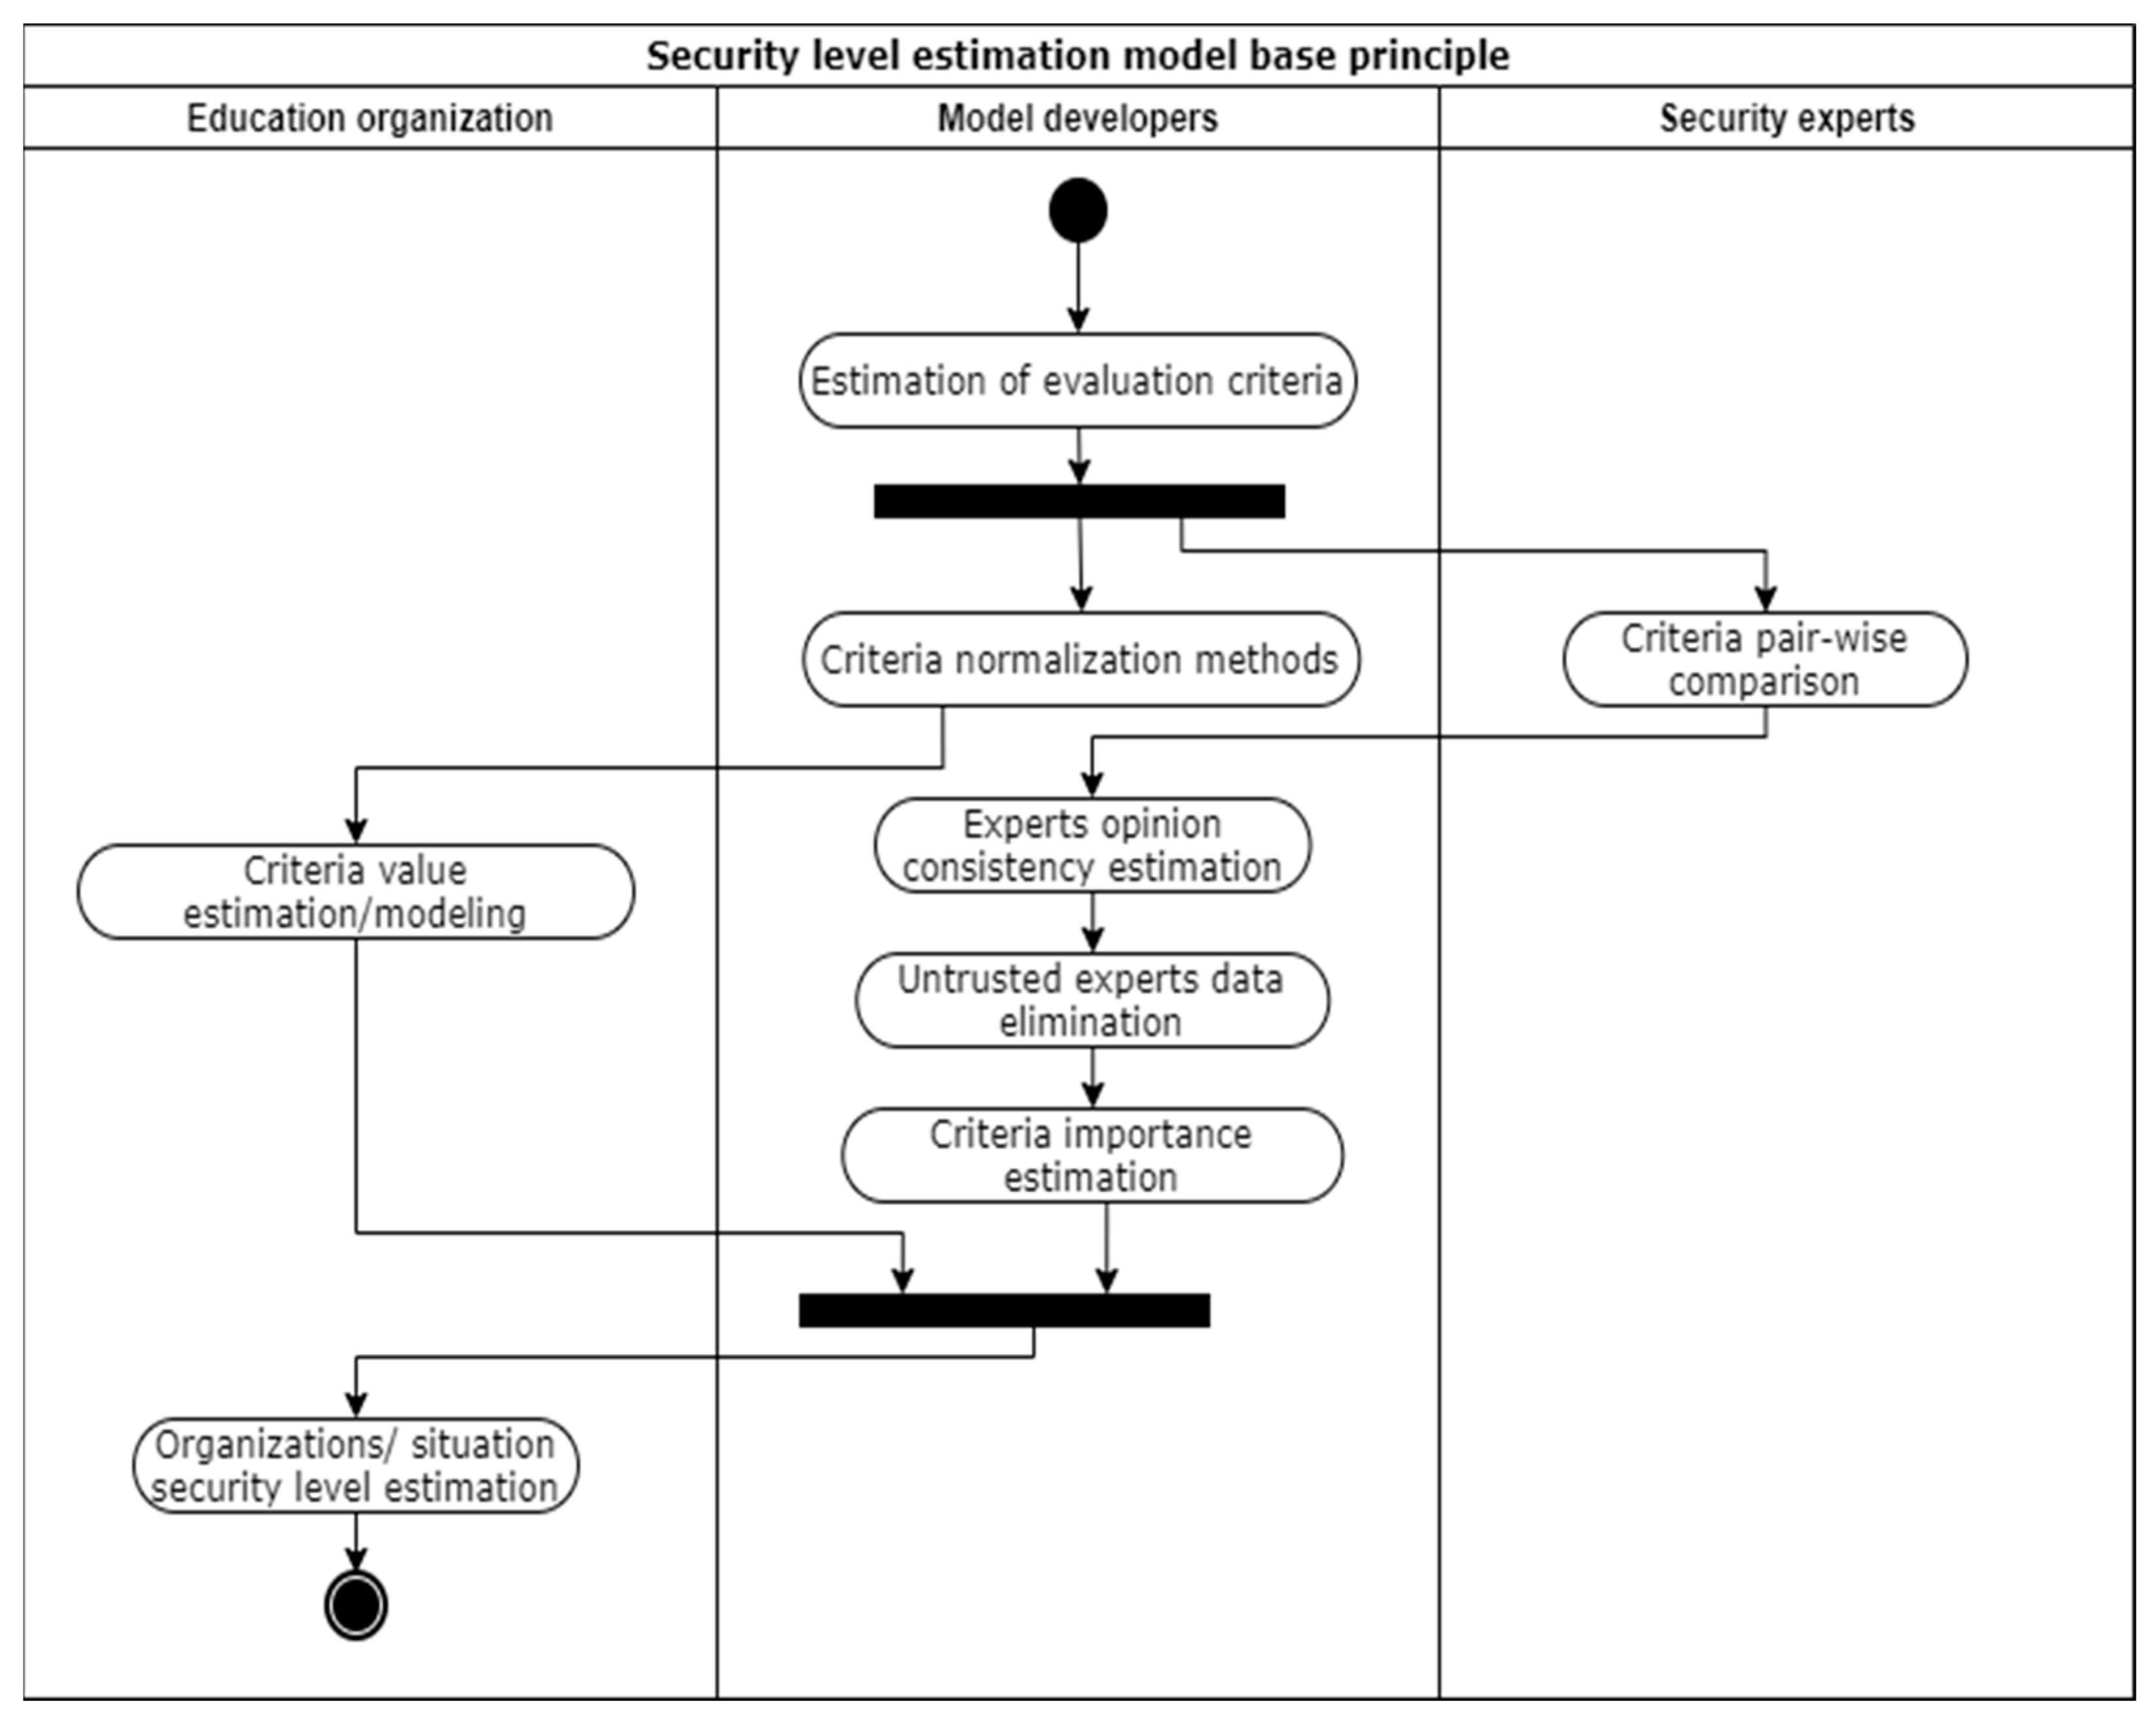
The security experts do not analyze the organization’s data, they only define the importance of each criterion. Therefore, the education organization might provide the criteria values, describing the organization’s current or modeled situation, without the use of security experts, as the criteria values are discrete and require no security level interpretation. By using criteria importance coefficients (estimated by security experts opinion), education organization data (provided by the organization), and criteria normalization methods (defined by model developers), the organization’s security level is calculated.

3.1. Design of Education Organization Security Level Estimation Criteria Set

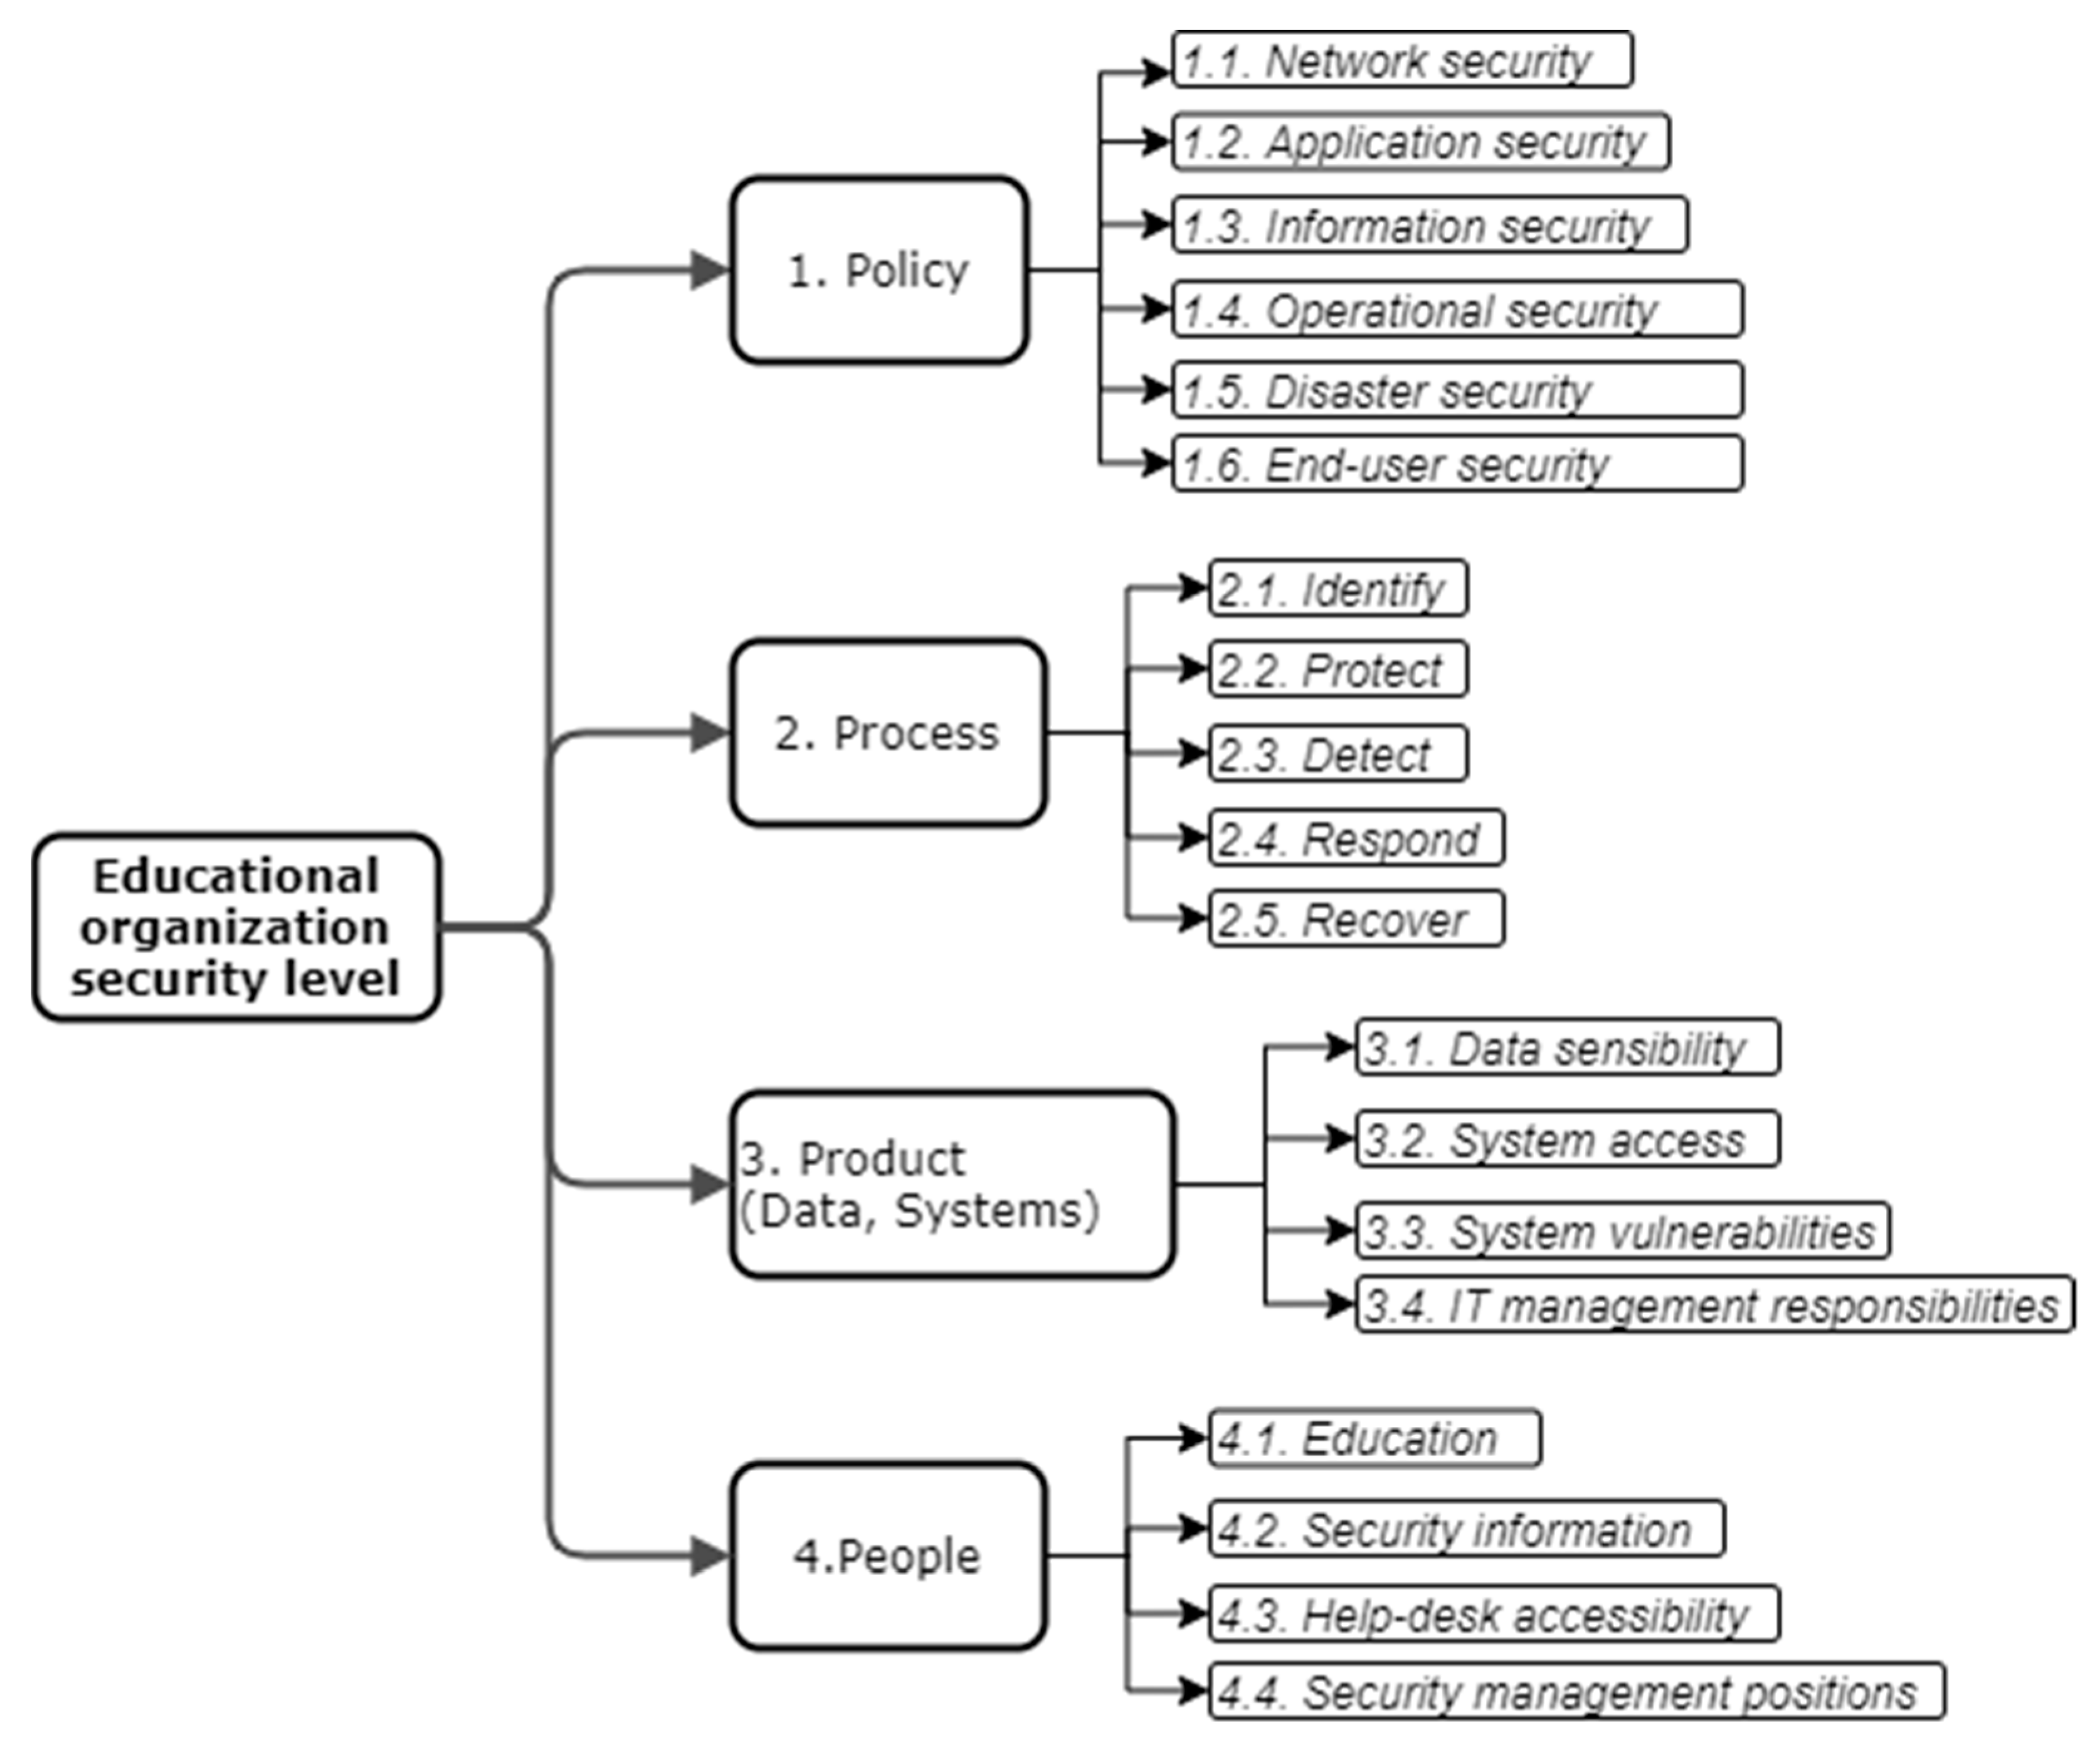
The four P’s of security [48] define the policies, processes, people, and products as base pillars to build a comprehensive security strategy. The same four elements are needed for education organizations to assure their security level. Therefore, (1) security policies, (2) security processes, (3) people security awareness, and (4) processed data or/and used systems are the main four criteria for security level estimation (see Figure 3).
These four criteria are compound, and it would be difficult to evaluate its discrete values without the usage of security experts or automated tools. Therefore, the four criteria are divided into smaller ones leading to the usage of the AHP [49]. Based on the AHP, each criterion should be divided into smaller ones, while the criteria will be evaluable or undividable further.
Based on Kaspersky [50], cybersecurity consists of several categories: network security, application security, information security, operational security, disaster recovery, end-user education. Based on these categories we define the security policy as a combination of policies of each of these categories: (1.1) network security policy, (1.2) application security policy, (1.3) information security policy, (1.4) operational security policy, (1.5) disaster recovery policy, (1.6) stakeholder security training policy. The education organization should have all these policies and it is important to achieve the highest maturity level possible. Stating security policies do not give the desired effect if it is not repeated, clearly defined, managed, and optimized for the specific organization. As the requirements for education organization requirements might vary, it is too difficult to state what exactly should be reflected in the security policies; therefore, the model uses a security policy maturity level as value for each of these criteria.
The same idea of maturity level applies to security processes—it is important to optimize security processes to increase the security level. However, security processes might present different stages of security management; therefore, the criteria security processes are divided into more specific ones. The sub-criteria are defined based on five security functions, presented by the NIST [51]: (2.1) identify, (2.2) protect, (2.3) detect, (2.4) respond, (2.5) recover.
The latest trends confirm the weakest link in enterprise security is humans [
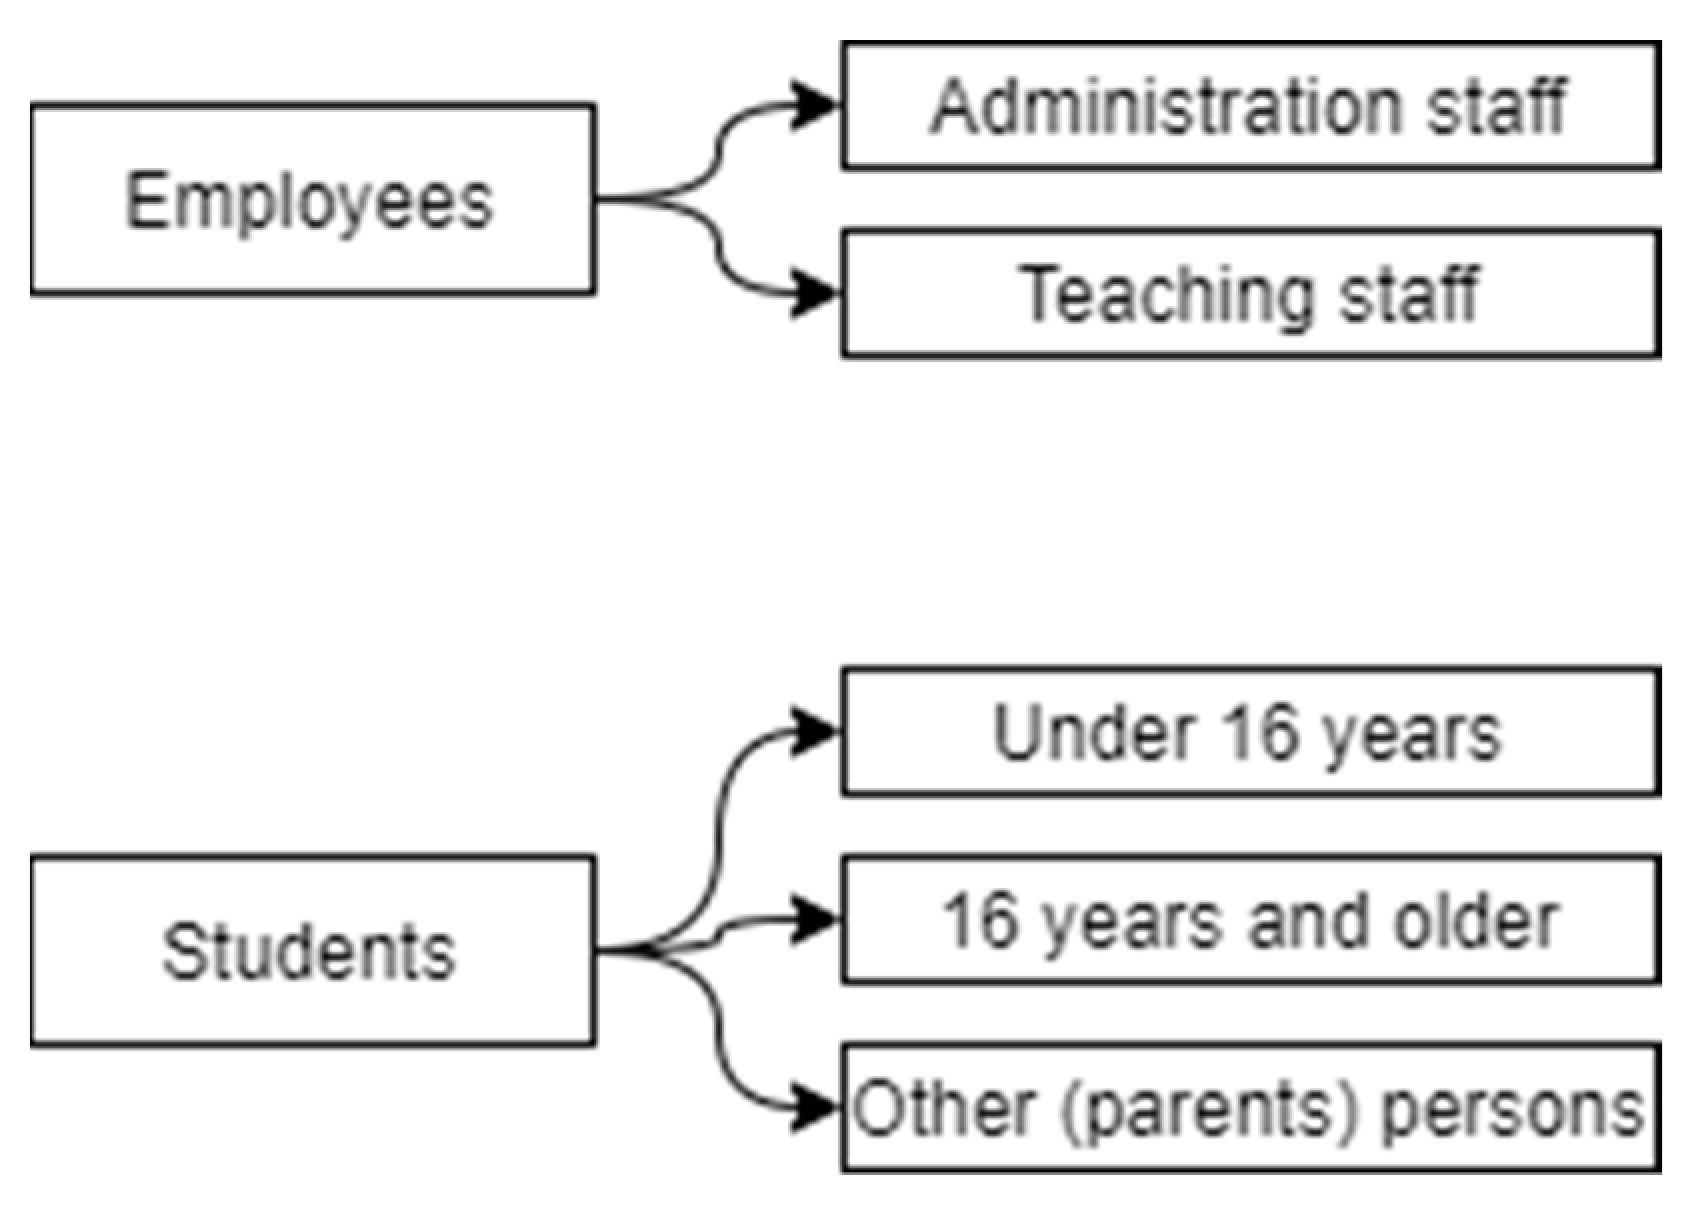
52]. Because of this trend, it is not enough to have a stakeholder security training policy; therefore, the model should include data on how qualified in the security area are the stakeholders. Therefore, the criteria people security awareness is divided into four sub-criteria: (3.1) existence of positions, responsible for security in the organization, (3.2) existence of systemic security training, (3.3) existence of security-related information sharing, (3.4) existence of help-desk service, for security incident or problem reporting. The 3.1 criteria are not divided into smaller ones, while the rest three criteria are divided into subcategories, representing two different stakeholders groups: employees and students. These groups have even deeper categories, where employees are divided into (a) administration and (b) teaching staff (see Figure 4). While students are divided taking into account the General Data Protection Regulation (GDPR) [53], where people under 16 years old are assigned to more sensitive groups. Therefore, we have three sub-categories for students: (c) students under 16 years, (d) 16 years and older students, (e) student-related persons (parents, trustees, etc.). Therefore, for these five categories criteria to state whether security training is executed at least once a year, whether this group at least once a year obtains security-related information (statistics, threads, tendencies, etc.), and whether the group can report a security issue or incident to the help-desk.
Processed data or/and used systems are the most technical top-level criteria. To reflect the data and system security, four sub-criteria are used: (4.1) data sensibility, (4.2) system access, (4.3) system vulnerabilities, (4.4) information technology management responsibility.
Data sensibility presents what kind of sensitive data are stored in the organization and its systems. There are the same five user groups (a–e) to present students’ and employee’s data (see Figure 4). As well, there is another category—organization data, which is divided into: (f) organization financial data, (g) organization internal documents, (h) other organization data. For all these (a–h) categories, the education organization should state what the data sensibility is. For sensibility evaluation, three categories are used, estimated by the GDPR: no data are stored, stored data are insensitive (no secret or personal information or it is anonymized and untraceable), sensitive or personal, private data are stored (data related to persons private data, health records, private organizations data, etc.). If at least one person, file, or system is more sensitive, the whole group should be treated at this sensibility level.
System access defines how difficult it would be to access it for the attacker. The evaluation should state whether the system is not used at all; whether it is accessible in the local network only, whether the system is globally accessible. Naturally, the access level depends on system purpose. Therefore, the values should be presented for different type/purpose systems: (4.2.1) representative website, (4.2.2) systems, used in a learning process (those are divided into e-learning systems and communication systems), (4.2.3) employee used systems (those are divided into information technology management systems and systems, used for organization process management). As multiple systems might exist in the same category, the value is assigned based on the highest availability level. For instance, if at least one e-learning system is publicly available and all the rest are available in the local network, the value “public” will be assigned to all the groups.
For security level estimation, a whole set of education organization used systems have to be overviewed to present system accessibility values. At the same time, the security vulnerability (weakness, flaw, or error, which can be exploited by third parties) of all those systems should be evaluated. The number and score of existing security vulnerabilities define the possible attack vectors, difficulty to exploit it. The model takes into account publicly and locally available systems as groups, not each system individually. Therefore, for those two groups of systems, it is important to present the score of the vulnerability and number of vulnerabilities in the group. The score reflects how critical the vulnerability is, while the number of vulnerabilities defines the variety of different attack vectors against the system. Consequently, the discrete values of these criteria, the maximum score of CVSS v3.0 value [54], should be estimated for each system (corresponding to the publicly or locally accessible group) vulnerabilities as well as the total number of vulnerabilities in this group.
As system vulnerability criteria do not consider hardware-related vulnerabilities, the information technology management responsibility criteria represent this area. Depending on the size of the organization and information technology management model, the organization might be an owner of the information technology devices/systems, controller, or processor [53]. Those three values should be used to reflect the management responsibility. However, it should be assigned to all of these categories rather than one value for all information technology landscapes: (4.4.1) network, (4.4.2) computer devices, (4.4.3) employees used systems, (4.4.4) students used systems, (4.4.5) other systems.
The proposed model is not specific to educational organization type as it includes all criteria, which are important to any type of educational organization. An exception might be very specific educational organizations, which for example include additional information technology equipment and systems, highly related to security issues, crowd opinion managed organizations, etc. Meanwhile, in the model, the different education organization types will be included by criteria values. For example, some types of educational organizations will not have some type of users, systems, etc. The criteria value absence will indicate it is not relevant, does not exist in the organization, and the organization security level changes adequately. The absence of some systems and user types will increase the security level, meanwhile, the absence of some security policies will decrease the security level, as the security management should be executed in any organization, despite its type.
All these criteria form a criteria tree, composed of four top-level criteria, up to four criteria levels for each criterion, in total 49 criteria for evaluation. The criteria set is presented in Appendix A Table A1.

3.2. Criteria Value Normalization Methods

In multi-criteria decision making, all criteria values must be normalized. Therefore, methods to convert each criteria value to a numerical value in the range [0, 1] must be presented. For all policy and process sub-criteria, a maturity level is used as a value. The maturity level allows estimation of how optimized the policy and processes are. Especially it is important when talking about modernization, development, pandemics permutations when a clear change management plan and risk society must be developed in the organization. Maturity level allows not going into very specific details of the organization; however, provides the main level or policy and process quality in the organization. It might have one of six values (five levels and one value to indicate there are no policies for this area). The normalized numeric values for each possible value are presented in Table 1. There each value has assigned numeric value proportionally from 0 to 1.
All sub-criteria of criteria “people security awareness” use binary values—whether it is or not. Therefore, very straightforward normalization method is used (1)—value 1 is assigned if the value is true, and 0 is assigned if the value is false.
n v x i = 1 ,     x = t r u e   0 ,     x = f a l s e
where nv(x) is normalized value for value xi of criteria i.
The widest variety of normalization methods is needed for criteria “processed data or/and used systems”. In most cases, values are categorized and must be converted into numeric values. The tables for criteria value transformation to normalized value are presented in Table 2, Table 3 and Table 4. Each one is generated with the same method—all values are listed and proportional values from 0 to 1 are assigned to each of the possible criteria values.
System vulnerability estimation is based on analysis of existing vulnerabilities or used systems. The vulnerability score in NVD varies from 0.0 to 10.0; therefore, the normalized value should be calculated as the proportion between the maximum vulnerability score of used systems and 10 (2). Therefore, all used systems should be scanned for vulnerabilities and the maximum SVSS score should be found from the possible ones.
n v x = 1 m a x m a x c v s s i j i x 10
where nv(x) is the normalized value for vulnerability maximum score for group x, x(i) is the i-th system in group x, cvssi(j) is the j-th common vulnerability scoring system v3.0 score for system i.
The number of vulnerabilities has no precise range. Therefore, the normalized value for criteria, based on the number of vulnerabilities are calculated as the relative frequency of vulnerabilities between analyzed alternatives (3). To obtain the normalized value nv the number of vulnerabilities for each system must be presented for all alternatives. Then the number of vulnerabilities in the current alternative is divided by the maximum number of vulnerabilities in all analyzed alternatives.
n v x ,   a = 1 v c i x ,   a m a x v c i x ,   j
where nv(x, a) is the normalized value for vulnerability number for alternative a and group x, vci(x, a) is a count of vulnerabilities for system i(x, a), analyzed in group x for alternative a, vci(x, j) is a count of vulnerabilities for system i(x, j), analyzed in group x for the j-th alternative of all analyzed alternatives.
This normalization method impacts the recalculation of all normalized vulnerability number values when the additional alternative is added or some of them are eliminated. At the same time, it limits the method’s possibility to present a global rather than relative security level, as the question of maximum vulnerability number is open all the time.

3.3. Criteria Importance Estimation

While possible criteria values are estimated and normalized based on some theoretical or logical background, the estimation of criteria importance has an empirical background. To estimate the criteria importance four security management experts were involved (E1, E2, E3, and E4). All four experts defended their Ph.D. thesis in the field of information security management within the last 5 years. Currently, they all work in an industry, in positions, related to security and/or its risk management.
Based on T. L. Saaty and M. S. Özdemir [55], one judge/expert is enough when the AHP method is used. However, to estimate the experts’ opinion similarity to a wider range of security risk experts, all known security risk management experts were incorporated into this process. Because of time constraints and expert needed competence requirements, only four experts were selected. The requirements were to have a Ph.D. degree in a topic related to security management and to work in a security management-related position at the moment. Therefore, Ph.D. defense history in Lithuania during the last 10 years was analyzed. Suitable candidates were contacted and invited to participate in the research. Data on experts’ work experience were gathered as well to identify possible relations between the experts. Two experts appeared to be working in the same company, however, they are responsible for different responsibilities and there is no subordination between them (they work in different departments).
One of the experts provided two rather than one opinion on criteria importance. The need for two different sets was explained by the fact that higher education and secondary school education institutions have different experiences, therefore, different aspects of security areas are important. This position is questionable; however, two different sets of criteria importance (noted E1a and E1b, where E1a labels higher education situation and E1b—secondary school case) were added to analyze in further steps.
All experts filled the provided survey form, where each criterion was compared pair-wise. Based on the calculation, the criteria importance coefficients were calculated. Close to the calculated criteria importance coefficients (see Table A1 in Appendix A), the consistency ratio (CR) values were calculated to evaluate the experts’ opinion consistency within the pair-wise comparison (see Table 5). The CR value lower than 0.10 is usually assumed as consistent. While higher values indicate some mismatch in experts pair-wise comparison.
The analysis of CR values indicated the expert E1 has a very inconsistent opinion, especially in the case of higher education institutions (average value is 0.15, while standard deviation is 0.35). Meanwhile, the rest three experts’ CR values with 95% confidentiality do not reach a CR value greater than 0.11 (average CR value plus 2 standard deviation values).
Despite the fact that the expert’s E1 opinions are not as consistent as the opinions of other experts, the correlation between criteria coefficients is high between each pair of experts (see Table 6). There is some difference between expert E1 and other experts, while between all experts the correlation is significant (the lowest p value is equal to 0.000455).
The correlation between E2 and E4 is especially high; however, it can be influenced by the fact those two experts work in the same company while all other experts work in different companies. Therefore, some collaboration or transparent experience in the company might influence the high correlation of these two opinions.
To aggregate the opinion of participated security management experts opinion to further model the average criteria importance coefficient of experts E2, E3 and E4 will be used.

4. Validation of Proposed Model

To validate the proposed security level estimation in education organizations, five alternative situations were analyzed. Security level scores were calculated for these five situations and compared with the ranking or score of the same four experts.

4.1. Description of Analyzed Education Organizations

Five examples of educational institutions were selected from Lithuania to generate five different alternatives for the model validation. The summary of alternatives data is presented in Appendix A, Table A2. The organizations were selected randomly by finding persons who work in the organization as information technology or security specialist or provides information technology infrastructure management services and can share needed data on the organization. Those persons were asked to fill in the organization definition form where all 49 criteria were listed. The short profiles of the alternatives are the following:
  • Alternative A1—higher education institution, technical university, which main security management concentration is on security policy and process formalization, most of IT infrastructure is owned, the university does not store or provide access to students under 16-years old or other persons, related to students.
  • Alternative A2—secondary school, where policies and security processes are mostly in initial maturity level, has no internal management systems, IT management is mixed between owned devices and managed or used other infrastructure, therefore, has no IT security management positions, all students are under 16 years all.
  • Alternative A3—the special education school for students, which is very similar to alternative A2, however, has a higher level of security policy and process maturity level, IT security management position, and a broader range of personal data and system access as students under 16 years old are its main customers.
  • Alternative A4—college, where security policy and processes are in the same maturity level as in alternative A3, however, this institution has no IT security management position and provides security training and help-desk services for its teaching staff.
  • Alternative A5—higher education institution, technical university, where students under 16 years old are attending, therefore, their personal data and access to all needed system are assured, all IT infrastructure is owned by the university.
Each of the alternatives represents real examples; however, they are anonymized in this paper. Meanwhile, experts had no description for any of the alternatives to avoid some pre-judgment.

4.2. Model Result Comparison to Experts Opinion

Security management experts were asked to analyze data (values of all criteria) of all five alternatives and provide security level scores on a 100-point scale. The comparison of the model calculated value and experts provided score is presented in Figure 5.
The results demonstrate there exists a linear relationship between the calculated model score and the experts provided score. It is noticeable that expert E1 uses a very low level of security rating as the values vary from 2.5 to 10.8 percent. This is an averagely 10 times lower score in comparison to the model. However, this tendency is noticeable for this expert only. The scores provided by the other three experts are higher in comparison to the model calculated scores (on average the score of experts E2, E3, and E4 are 40% higher than the model calculated score). This demonstrates the model is not accurate in security level score accuracy. However, the precision tendency demonstrates the high-level correlation between the modeled score and experts’ provided scores (see Table 7).
In modeling, the security level score is not as important as ranking between analyzed alternatives. Therefore, based on the security level score, all alternatives were ranked from the one with the highest security score (rank 1) to the one with the lowest security score (rank 5) too. The results of Spearman’s rank correlation in the previous table demonstrate that all experts (except E1) provided ranks are highly correlated to scores, obtained from proposed model security level scores (the values are 0.5 and above). Meanwhile, if a plain sum of normalized criteria values would be added, the score and ranking of alternatives would reveal lower correlations to experts’ ranking. This demonstrates that the criteria importance coefficients allow a more accurate security level estimation and alternative ranking. The ranking results are visualized in Figure 6 as well.

5. Conclusions and Future Work

The executed systematic literature analysis revealed that each area has its own security risk estimation specifics. Therefore, general risk assessment models require security and area knowledge. Meanwhile, existing educational organization-related security risk evaluation models are oriented to technical aspects and do not pay attention to security management. Therefore, overall, an educational organization security model would be useful to simplify the security modeling.
The gathering of experts’ opinions on educational organization security criteria importance revealed that some inconsistency might appear when a big number of criteria must be applied. Human experts are not always capable to take into account all factors and consistently present their relative importance. Therefore, to obtain more accurate experts’ opinion, some additional experts’ evaluations or result validation must be executed. In this research, the opinion of one out of four experts was discarded as its opinion consistency rate was out of the recommended level.
The proposed educational organization security level estimation model is suitable to rank several alternatives. The model calculated ranking highly correlates with trusted expert’s opinions (Pearson’s correlation coefficient is about 0.9). However, the model’s presented security level score is not very precise. This is influenced by the fact the experts do not have a consistent security risk scale as well; therefore, each expert is basing on his or her personal experience.
The proposed security level estimation model does not require security expert’s actions for its application, as only discrete values, defining the educational organization situation is needed as input. Security experts’ opinions on educational organization security level estimation criteria importance help to increase the security level score correlation of the experts’ opinion in comparison to the plain sum of all normalized criteria values. However, it is conducted once, as part of model development. Therefore, educational organizations can use the proposed model with no help from a security expert.
The further steps for educational organization security risk modeling could be the design of a tool for automated data gathering and logging. The tool would simplify an educational organization’s work to estimate the current values or log them more simply. At the same time, it would log statistical data. The data could be used for the design and implementation of more accurate and precise security risk level estimation.

Author Contributions

Conceptualization, S.R. and Š.G.; methodology, S.R.; software, S.R. and S.P.; validation, S.R., Š.G. and V.T.; formal analysis, N.U. and S.R.; investigation, S.R. and N.U.; data curation, S.R.; writing—original draft preparation, S.R. and N.U.; writing—review and editing, Š.G., S.P., V.T. and A.V.; visualization, N.U. and S.R.; supervision, S.R.; project administration, A.V., V.T. and S.P. All authors have read and agreed to the published version of the manuscript.

Funding

This paper is supported in part by the Lithuanian Research Council financed project “Model of distance working and learning organization and recommendations for extreme and transition period” (EKSTRE) (1 June 2020–31 December 2020). Grant Agreement S-COV-20-20.

Institutional Review Board Statement

Not applicable.

Informed Consent Statement

Not applicable.

Data Availability Statement

The main data are presented in the paper, while the full data should be requested from the corresponding author.

Conflicts of Interest

The authors declare no conflict of interest.

Appendix A

Table A1. The AHP criteria tree and calculated experts criteria importance coefficients.
CriteriaE1aE1bE2E3E4Average of E2, E3, and E4
1. Policy0.2570.0340.4230.5430.3830.450
1.1. Network security0.0910.0290.2980.2240.2760.266
1.2. Application security0.0510.0930.0950.0630.1030.087
1.3. Information security0.1290.0500.2300.1390.2360.202
1.4. Operational security0.1310.0670.1490.3010.1490.200
1.5. Disaster recovery0.4460.5570.0810.0630.0830.076
1.6. End-user education0.1520.2040.1480.2100.1530.170
2. Process0.0840.6350.0610.1060.0770.081
2.1. Identify0.1090.1070.0960.1940.1130.134
2.2. Protect0.1770.0620.2330.2330.2230.230
2.3. Detect0.3000.5190.3050.2130.3080.275
2.4. Respond0.1850.0560.0610.0520.0470.053
2.5. Recover0.2280.2550.3050.3080.3080.307
3. Product (Data, Systems)0.6260.2400.4230.2080.4190.350
3.1. Data sensibility0.5140.5140.5480.5630.5600.557
3.1.1. Employees personal data0.5840.5840.1580.3330.2020.231
3.1.1.1. Administration staff0.5000.5000.5000.5000.5000.500
3.1.1.2. Teaching staff0.5000.5000.5000.5000.5000.500
3.1.2. Students personal data0.1350.1350.7660.3330.7010.600
3.1.2.1. Students under 16 years old0.8180.8180.7310.7140.6370.694
3.1.2.2. Students 16 years old or older0.0910.0910.1880.1430.2580.196
3.1.2.3. Other persons (parents) data0.0910.0910.0810.1430.1050.110
3.1.3. Other organizations data0.2810.2810.0760.3330.0970.169
3.1.3.1. Financial data0.3330.3330.3330.3330.3330.333
3.1.3.2. Internal documents0.3330.3330.3330.3330.3330.333
3.1.3.3. Other data0.3330.3330.3330.3330.3330.333
3.2. System access0.0290.0290.0910.0880.0690.083
3.2.1. Representative, public systems0.0910.0910.0670.0910.0910.083
3.2.2. Distance learning systems0.8180.8180.4670.4550.4550.459
3.2.2.1. E-learning systems0.5000.5000.8330.8750.8330.847
3.2.2.2. Communication systems0.5000.5000.1670.1250.1670.153
3.2.3. Employees used systems0.0910.0910.4670.4550.4550.459
3.2.3.1. IT support systems0.1000.1000.8330.8750.8330.847
3.2.3.2. Organization management systems0.9000.9000.1670.1250.1670.153
3.3. System vulnerabilities0.2960.2960.3060.2060.2940.269
3.3.1. Publicly available systems0.1250.8750.7500.5000.8330.694
3.3.1.1. MAX score CCSS v3.10.8750.8750.8330.8330.8330.833
3.3.1.2. Number of vulnerabilities0.1250.1250.1670.1670.1670.167
3.3.2. Internally available systems0.8750.1250.2500.5000.1670.306
3.3.2.1. MAX score CCSS v3.10.8750.8750.8330.8330.7500.805
3.3.2.2. Number of vulnerabilities0.1250.1250.1670.1670.2500.195
3.4. IT management responsibilities0.1610.1610.0550.1430.0770.092
3.4.1. Network0.4690.4690.5330.1830.6010.439
3.4.2. Devices0.0420.0420.0490.0550.0380.047
3.4.3. Employees systems0.2750.2750.2350.3650.2080.269
3.4.4. Students systems0.0750.0750.1410.3460.1150.201
3.4.5. Other systems0.1390.1390.0410.0510.0380.043
4. People0.0330.0910.0930.1440.1200.119
4.1. Education0.2370.2370.2200.2040.2340.219
4.1.1. Employees education0.8750.8750.7500.5000.7500.667
4.1.1.1. Administration staff0.7500.5000.5000.5000.5000.500
4.1.1.2. Teaching staff0.2500.5000.5000.5000.5000.500
4.1.2. Students education0.1250.1250.2500.5000.2500.333
4.1.2.1. Students under 16 years old0.1430.1430.6370.4290.4550.507
4.1.2.2. Students 16 years old or older0.1430.1430.2580.4290.4550.381
4.1.2.3. Other persons (parents) data0.7140.7140.1050.1430.0910.113
4.2. Security information0.0810.0810.0520.0450.0470.048
4.2.1. Information for employees0.8750.5000.7500.7500.5000.667
4.2.1.1. Administration staff0.5000.5000.5000.5000.5000.500
4.2.1.2. Teaching staff0.5000.5000.5000.5000.5000.500
4.2.2. Information for students0.1250.5000.2500.2500.5000.333
4.2.2.1. Students under 16 years old0.1430.1430.3330.1430.3330.270
4.2.2.2. Students 16 years old or older0.1430.1430.3330.4290.3330.365
4.2.2.3. Other persons (parents) data0.7140.7140.3330.4290.3330.365
4.3. Help-desk accessibility0.0370.0370.1090.2710.1480.176
4.3.1. Availability for employees0.8750.5000.7500.5000.7500.667
4.3.1.1. Administration staff0.5000.5000.5000.5000.5000.500
4.3.1.2. Teaching staff0.5000.5000.5000.5000.5000.500
4.3.2. Availability for students0.1250.5000.2500.5000.2500.333
4.3.2.1. Students under 16 years old0.1430.1430.3330.3190.3330.328
4.3.2.2. Students 16 years old or older0.1430.1430.3330.4600.3330.375
4.3.2.3. Other persons (parents) data0.7140.7140.3330.2210.3330.296
4.4. Security management positions0.6450.6450.6190.4790.5720.557
Table A2. Summary of normalized criteria values for all five alternatives.
Measured CriteriaA1A2A3A4A5
1.1. Network security0.60.40.40.40.6
1.2. Application security0.60.20.40.40.4
1.3. Information security0.80.40.60.60.8
1.4. Operational security10.20.40.40.6
1.5. Disaster recovery0.20.20.20.20.8
1.6. End-user education0.80.40.60.60.4
2.1. Identify0.60.20.60.40.4
2.2. Protect0.80.20.40.40.8
2.3. Detect0.80.20.40.40.6
2.4. Respond10.40.40.40.6
2.5. Recover0.80.20.20.40.6
3.1.1.1. Administration staff00000
3.1.1.2. Teaching staff010.510
3.1.2.1. Students under 16 years old11000
3.1.2.2. Students 16 years old or older0010.50
3.1.2.3. Other persons (parents) data00.50.50.50.5
3.1.3.1. Financial data0.50.50.500
3.1.3.2. Internal documents0.500.50.50
3.1.3.3. Other data100.500
3.2.1. Representative, public systems00000
3.2.2.1. E-learning systems00000
3.2.2.2. Communication systems00000
3.2.3.1. IT support systems0.7510.750.750.75
3.2.3.2. Organization management systems0.7510.750.750.75
3.3.1.1. MAX score CCSS v3.10.150.010.010.080.02
3.3.1.2. Number of vulnerabilities00.86670.81450.83770.2449
3.3.2.1. MAX score CCSS v3.10.010000.02
3.3.2.2. Number of vulnerabilities0.62170.71050.36840.31580
3.4.1. Network00.660.660.660
3.4.2. Devices00000
3.4.3. Employees systems00.330.330.330
3.4.4. Students systems010.660.660
3.4.5. Other systems0.330.330.330.330
4.1.1.1. Administration staff11111
4.1.1.2. Teaching staff10101
4.1.2.1. Students under 16 years old01000
4.1.2.2. Students 16 years old or older10110
4.1.2.3. Other persons (parents) data01000
4.2.1.1. Administration staff11111
4.2.1.2. Teaching staff10111
4.2.2.1. Students under 16 years old01001
4.2.2.2. Students 16 years old or older10111
4.2.2.3. Other persons (parents) data01000
4.3.1.1. Administration staff11111
4.3.1.2. Teaching staff10101
4.3.2.1. Students under 16 years old01001
4.3.2.2. Students 16 years old or older10111
4.3.2.3. Other persons (parents) data01000
4.4. Security management positions10101

References

  1. SkyBox Security. New Skybox Security Research Discovers 106% Increase in New Malware. Available online: https://www.skyboxsecurity.com/news/threat-report-2021/ (accessed on 23 July 2021).
  2. ISO/TR31004:2013. Risk Management—Guidance for the Implementation of ISO 31000. International Standards Organization (ISO): Switzerland. Available online: https://www.iso.org/standard/56610.html (accessed on 23 July 2021).
  3. Reed, S.K. Automatic Data Processing Risk Analysis; National Bureau of Standards: Washington, DC, USA, 1977.
  4. Waltz, K.N. Theory of International Politics; Waveland Press: Long Grove, IL, USA, 2010. [Google Scholar]
  5. Moravcsik, A. Taking preferences seriously: A liberal theory of international politics. Int. Organ. 1997, 51, 513–553. [Google Scholar] [CrossRef]
  6. Katzenstein, M.F. The Culture of National Security: Norms and Identity in World Politics; Columbia University Press: New York, NY, USA, 1996. [Google Scholar]
  7. Christensen, C. Risk and school science education. Stud. Sci. Educ. 2009, 45, 205–223. [Google Scholar] [CrossRef] [Green Version]
  8. Wangen, G.; Hallstensen, C.; Snekkenes, E. A framework for estimating information security risk assessment method completeness. Int. J. Inf. Secur. 2018, 17, 681–699. [Google Scholar] [CrossRef] [Green Version]
  9. Yazar, Z. A Qualitative Risk Analysis and Management Tool–CRAMM.; SANS Information Security White Papers. 2021. Available online: https://sansorg.egnyte.com/dl/EVhEaxZS8S (accessed on 23 July 2021).
  10. Den Braber, F.; Hogganvik, I.; Lund, M.S.; Stølen, K.; Vraalsen, F. Model-based security analysis in seven steps—A guided tour to the CORAS method. BT Technol. J. 2007, 25, 101–117. [Google Scholar] [CrossRef]
  11. Alberts, C.; Dorofee, A.; Stevens, J.; Woody, C. Introduction to the OCTAVE Approach; Carnegie-Mellon Univ. Pittsburgh Pa Software Engineering Inst.: Pittsburgh, PA, USA, 2003. [Google Scholar]
  12. ISO/IEC 27005:2011. Information Technology—Security Techniques—Information Security Risk Management; International Standards Organization (ISO): Geneva, Switzerland, 2011; Available online: https://www.iso.org/standard/56742.html (accessed on 23 July 2021).
  13. National Institute of Standards and Technology. Guide for Conducting Risk Assessments; Information Security: Gaithersburg, MD, USA, 2012. [Google Scholar]
  14. Wangen, G. Information security risk assessment: A method comparison. Computer 2017, 50, 52–61. [Google Scholar] [CrossRef] [Green Version]
  15. Common Vulnerability Scoring System v3.0: User Guide. FIRST.Org Inc. Available online: https://www.first.org/cvss/v3.0/cvss-v30-user_guide_v1.6.pdf (accessed on 23 July 2021).
  16. Houmb, S.H.; Franqueira, V.N.; Engum, E.A. Quantifying security risk level from CVSS estimates of frequency and impact. J. Syst. Softw. 2010, 83, 1622–1634. [Google Scholar] [CrossRef]
  17. Joh, H.; Malaiya, Y.K. Defining and assessing quantitative security risk measures using vulnerability lifecycle and cvss metrics. In Proceedings of the 2011 International Conference on Security and Management (SAM’11), Las Vegas, NV, USA, 18–21 July 2011; Volume 1, pp. 10–16. [Google Scholar]
  18. Aksu, M.U.; Dilek, M.H.; Tatlı, E.İ.; Bicakci, K.; Dirik, H.I.; Demirezen, M.U.; Aykır, T. A quantitative CVSS-based cyber security risk assessment methodology for IT systems. In Proceedings of the 2017 International Carnahan Conference on Security Technology (ICCST), Madrid, Spain, 23–26 October 2017; pp. 1–8. [Google Scholar]
  19. Doynikova, E.; Kotenko, I. CVSS-based probabilistic risk assessment for cyber situational awareness and countermeasure selection. In Proceedings of the 2017 25th Euromicro International Conference on Parallel, Distributed and Network-based Processing (PDP), St. Petersburg, Russia, 6–8 March 2017; pp. 346–353. [Google Scholar]
  20. Houmb, S.H.; Franqueira, V.N. Estimating ToE risk level using CVSS. In Proceedings of the 2009 International Conference on Availability, Reliability and Security, Fukuoka, Japan, 16–19 March 2009; pp. 718–725. [Google Scholar]
  21. Lo, C.C.; Chen, W.J. A hybrid information security risk assessment procedure considering interdependences between controls. Expert Syst. Appl. 2012, 39, 247–257. [Google Scholar] [CrossRef]
  22. Poolsappasit, N.; Dewri, R.; Ray, I. Dynamic security risk management using bayesian attack graphs. IEEE Trans. Dependable Secur. Comput. 2011, 9, 61–74. [Google Scholar] [CrossRef]
  23. Swiler, L.P.; Phillips, C.; Ellis, D.; Chakerian, S. Computer-attack graph generation tool. In Proceedings of the DARPA Information Survivability Conference and Exposition II—DISCEX’01, Anaheim, CA, USA, 12–14 June 2001; Volume 2, pp. 307–321. [Google Scholar]
  24. Sheyner, O.; Haines, J.; Jha, S.; Lippmann, R.; Wing, J.M. Automated generation and analysis of attack graphs. In Proceedings of the 2002 IEEE Symposium on Security and Privacy, Berkeley, CA, USA, 12–15 May 2002; pp. 273–284. [Google Scholar]
  25. Yang, S.; Chen, W.; Zhang, X.; Liang, C.; Wang, H.; Cui, W. A graph-based model for transmission network vulnerability analysis. IEEE Syst. J. 2019, 14, 1447–1456. [Google Scholar] [CrossRef]
  26. Ritchey, R.W.; Ammann, P. Using model checking to analyze network vulnerabilities. In Proceedings of the 2000 IEEE Symposium on Security and Privacy—S&P 2000, Berkeley, CA, USA, 14–17 May 2000; pp. 156–165. [Google Scholar]
  27. Ammann, P.; Pamula, J.; Ritchey, R.; Street, J. A host-based approach to network attack chaining analysis. In Proceedings of the 21st Annual Computer Security Applications Conference (ACSAC’05), Tucson, AZ, USA, 5–9 December 2005; p. 10. [Google Scholar]
  28. Kilincer, I.F.; Ertam, F.; Sengur, A. Machine learning methods for cyber security intrusion detection: Datasets and comparative study. Comput. Netw. 2021, 188, 107840. [Google Scholar] [CrossRef]
  29. Deka, R.K.; Bhattacharyya, D.K. Self-similarity based DDoS attack detection using Hurst parameter. Secur. Commun. Netw. 2016, 9, 4468–4481. [Google Scholar] [CrossRef]
  30. Yan, R.; Wang, Y. Hurst parameter for security evaluation of LAN traffic. Inf. Technol. J. 2012, 11, 269. [Google Scholar] [CrossRef]
  31. Bajpai, S.; Sachdeva, A.; Gupta, J.P. Security risk assessment: Applying the concepts of fuzzy logic. J. Hazard. Mater. 2010, 173, 258–264. [Google Scholar] [CrossRef]
  32. Fu, Y.; Wu, X.P.; Ye, Q.; Peng, X. An approach for information systems security risk assessment on fuzzy set and entropy-weight. Acta Electron. Sin. 2010, 38, 1489–1494. [Google Scholar]
  33. Szwed, P.; Skrzyński, P. A new lightweight method for security risk assessment based on fuzzy cognitive maps. Int. J. Appl. Math. Comput. Sci. 2014, 24, 213–225. [Google Scholar] [CrossRef] [Green Version]
  34. Erdoğan, M.; Karaşan, A.; Kaya, İ.; Budak, A.; Çolak, M. A Fuzzy Based MCDM Methodology for Risk Evaluation of Cyber Security Technologies. In Proceedings of the International Conference on Intelligent and Fuzzy Systems, Istanbul, Turkey, 23–25 July 2019; Springer: Cham, Switzerland, 2019; pp. 1042–1049. [Google Scholar]
  35. Turskis, Z.; Goranin, N.; Nurusheva, A.; Boranbayev, S. Information security risk assessment in critical infrastructure: A hybrid MCDM approach. Informatica 2019, 30, 187–211. [Google Scholar] [CrossRef]
  36. Xu, N.; Zhao, D.M. The research of information security risk assessment method based on AHP. In Advanced Materials Research; Trans Tech Publications Ltd.: Freienbach, Switzerland, 2011; Volume 187, pp. 575–580. [Google Scholar]
  37. Nurse, J.R.; Creese, S.; De Roure, D. Security risk assessment in Internet of Things systems. IT Prof. 2017, 19, 20–26. [Google Scholar] [CrossRef]
  38. Albakri, S.H.; Shanmugam, B.; Samy, G.N.; Idris, N.B.; Ahmed, A. Security risk assessment framework for cloud computing environments. Secur. Commun. Netw. 2014, 7, 2114–2124. [Google Scholar] [CrossRef]
  39. Shin, J.; Son, H.; Heo, G. Cyber security risk evaluation of a nuclear I&C using BN and ET. Nucl. Eng. Technol. 2017, 49, 517–524. [Google Scholar]
  40. Cherdantseva, Y.; Burnap, P.; Blyth, A.; Eden, P.; Jones, K.; Soulsby, H.; Stoddart, K. A review of cyber security risk assessment methods for SCADA systems. Comput. Secur. 2016, 56, 1–27. [Google Scholar] [CrossRef] [Green Version]
  41. Singh, U.K.; Joshi, C. Information Security Risk Management Framework for University Computing Environment. Int. J. Netw. Secur. 2017, 19, 742–751. [Google Scholar]
  42. Joshi, C.; Singh, U.K. Information security risks management framework–A step towards mitigating security risks in university network. J. Inf. Secur. Appl. 2017, 35, 128–137. [Google Scholar] [CrossRef]
  43. Anikin, I.V. Information security risks assessment in telecommunication network of the university. In Proceedings of the 2016 Dynamics of Systems, Mechanisms and Machines (Dynamics), Omsk, Russia, 15–17 November 2016; pp. 1–4. [Google Scholar]
  44. Singh, U.K.; Joshi, C.; Gaud, N. Measurement of security dangers in university network. Int. J. Comput. Appl. 2016, 155, 6–10. [Google Scholar]
  45. Alwi, N.H.; Fan, I.S. Information security threats analysis for e-learning. In Proceedings of the International Conference on Technology Enhanced Learning, Athens, Greece, 19–21 May 2010; Springer: Berlin/Heidelberg, Germany, 2010; pp. 285–291. [Google Scholar]
  46. Khamparia, A.; Pandey, B. Threat driven modeling framework using petri nets for e-learning system. SpringerPlus 2016, 5, 446. [Google Scholar] [CrossRef] [PubMed] [Green Version]
  47. Zamzuri, Z.F.; Manaf, M.; Ahmad, A.; Yunus, Y. Computer security threats towards the e-learning system assets. In Proceedings of the International Conference on Software Engineering and Computer Systems, Pahang, Malaysia, 27–29 June 2011; Springer: Berlin/Heidelberg, Germany, 2011; pp. 335–345. [Google Scholar]
  48. ChannelNomics. 4 P’s of Security. Available online: https://channelnomics.com/2112-channel-dictionary/4-ps-of-security/ (accessed on 23 July 2021).
  49. Saaty, T.L. Decision-making with the AHP: Why is the principal eigenvector necessary. Eur. J. Oper. Res. 2003, 145, 85–91. [Google Scholar] [CrossRef]
  50. Kaspersky. What is Cyber Security? Available online: https://www.kaspersky.com/resource-center/definitions/what-is-cyber-security (accessed on 23 July 2021).
  51. NIST. The Five Functions. Available online: https://www.nist.gov/cyberframework/online-learning/five-functions (accessed on 23 July 2021).
  52. Excellium. Excellium Services Newsletter: Humans Are the Weakest Link in the Information Security Chain. Available online: https://excellium-services.com/2020/08/03/humans-are-the-weakest-link-in-the-information-security-chain/ (accessed on 23 July 2021).
  53. Regulation (EU) 2016/679 of the European Parliament and of the Council of 27 April 2016 on the Protection of Natural Persons with Regard to the Processing of Personal Data and on the Free Movement of Such Data, and Repealing Directive 95/46/EC (General Data Protection Regulation). Available online: https://eur-lex.europa.eu/eli/reg/2016/679/oj (accessed on 23 July 2021).
  54. NIST. CVSS: Vulnerability Metrics. Available online: https://nvd.nist.gov/vuln-metrics/cvss (accessed on 23 July 2021).
  55. Saaty, T.L.; Özdemir, M.S. How many judges should there be in a group? Ann. Data Sci. 2014, 1, 359–368. [Google Scholar] [CrossRef] [Green Version]
Figure 1. Keyword connection between the analyzed papers in search of an education organization security risk assessment model.
Applsci 11 08061 g001
Figure 2. Principle schema of education organization security level estimation model.
Applsci 11 08061 g002
Figure 3. The constructed criteria tree structure (only two levels of criteria are shown).
Applsci 11 08061 g003
Figure 4. The five user groups divided into two more abstract classes.
Applsci 11 08061 g004
Figure 5. Experts score relation to model calculated security score.
Applsci 11 08061 g005
Figure 6. Security level ranking for each alternative, evaluate by the proposed model, experts, and plain sum of criteria.
Applsci 11 08061 g006
Table 1. Criteria value association to normalized value for sub-criteria of policy and process top-level criteria.
Criteria ValueDescriptionNormalized Value
No policy/process existsThere is no such policy/process in the organization.0.0
Maturity level: initialChaotic, poorly controlled, reactive.0.2
Maturity level: managedPlanned, performed, measured, and controlled, but still reactive.0.4
Maturity level: definedWell-characterized and understood, are described in standards, procedures, tools, and methods are proactive0.6
Maturity level: quantitatively managedQuantitative objectives for quality and performance are established and used as criteria.0.8
Maturity level: optimizingQuantitative improvement objectives are established, continually revised to reflect changing objectives, and used as criteria in managing improvement.1.0
Table 2. Criteria value association to normalized value for sub-criteria data sensibility.
Criteria ValueDescriptionNormalized Value
No data are storedNo data are stored or used in the analyzed category.1.0
Stored data are insensibleNo secret or personal information is stored or used, as only insensitive data are stored or used (sensitive data are anonymized and untraceable).0.5
Sensitive, personal, private data are storedData related to persons’ private data, health records, private organizations data, or other sensitive data are stored or used.0.0
Table 3. Criteria value association to normalized value for sub-criteria system access.
Criteria ValueDescriptionNormalized Value
Globally publicly availableSystem available on the Internet and is indexed by search engines.0.00
Secretly publicly availableThe system is available on the Internet, but is not available for indexing, uses an IP address rather than the domain name.0.25
Only locally availableThe system is available in a local network only.0.50
Locally available via VPNThe system is available by using a virtual private network only.0.75
Not availableThe system is turned off or has not been accessed in the network.1.00
Table 4. Criteria value association to normalized value for sub-criteria information technology management responsibility.
Criteria ValueDescriptionNormalized Value
OwnerThe organization owns the infrastructure/system and is fully responsible for it.0.00
ControllerThe organization has all management rights of the infrastructure/system but does not own it.0.33
ProcessorThe organization has limited usage rights, without the ability to fully manage it.0.66
Not usedThe infrastructure/system is not used in the organization.1.00
Table 5. Consistency ratio (CR) values for each expert.
Parent CriteriaE1aE1bE2E3E4
Root0.350.310.080.130.08
10.180.230.110.090.10
21.670.500.070.040.07
30.520.520.100.110.04
3.10.310.310.080.000.08
3.1.10.000.000.000.000.00
3.1.20.000.000.040.000.02
3.1.30.000.000.000.000.00
3.20.000.000.000.000.00
3.2.20.000.000.000.000.00
3.2.30.000.000.000.000.00
3.30.000.000.000.000.00
3.3.10.000.000.000.000.00
3.3.20.000.000.000.000.00
3.40.350.350.110.040.13
40.250.250.070.110.12
4.10.000.000.000.000.00
4.1.10.000.000.000.000.00
4.1.20.000.000.020.000.00
4.20.000.000.000.000.00
4.2.10.000.000.000.000.00
4.2.20.000.000.000.000.00
4.30.000.000.000.000.00
4.3.10.000.000.000.000.00
4.3.20.000.000.000.080.00
Table 6. Pearson’s correlation coefficients between each experts’ calculated criteria importance values.
E1aE1bE2E3E4
E1a1.0000.7710.5220.4790.463
E1b 1.0000.4990.4180.514
E2 1.0000.8380.967
E3 1.0000.802
E4 1.000
Table 7. Correlation between model results and experts’ opinions.
SituationExpertPearson’s CorrelationSpearman’s Rank Correlation
Model resultsE10.2180.500
E20.8901.000
E30.9150.800
E40.9740.950
Plain sum of normalized criteria valuesE1−0.2240.000
E20.5550.500
E30.8390.900
E40.7650.707
Publisher’s Note: MDPI stays neutral with regard to jurisdictional claims in published maps and institutional affiliations.

