
A Study on Building a “Real-Time Vehicle Accident and Road Obstacle Notification Model” Using AI CCTV


1
Department of Information and Communication Engineering, Hankuk University of Foreign Studies, Yongin 17035, Korea
2
Artificial Intelligence Education, Hankuk University of Foreign Studies, Yongin 17035, Korea
*
Author to whom correspondence should be addressed.
Appl. Sci. 2021, 11(17), 8210; https://0-doi-org.brum.beds.ac.uk/10.3390/app11178210
Submission received: 19 July 2021
/
Revised: 14 August 2021
/
Accepted: 27 August 2021
/
Published: 3 September 2021
(This article belongs to the Collection The Development and Application of Fuzzy Logic)
Abstract
:This research produced a model that detects abnormal phenomena on the road, based on deep learning, and proposes a service that can prevent accidents because of other cars and traffic congestion. After extracting accident images based on traffic accident video data by using FFmpeg for model production, car collision types are classified, and only the head-on collision types are processed by using the deep learning object-detection algorithm YOLO (You Only Look Once). Using the car accident detection model that we built and the provided road obstacle-detection model, we programmed, for when the model detects abnormalities on the road, warning notification and photos that captures the accidents or obstacles, which are then transferred to the application. The proposed service was verified through application notification simulations and virtual experiments using CCTVs in Daegu, Busan, and Gwangju. By providing services, the goal is to improve traffic safety and achieve the development of a self-driving vehicle sector. As a future research direction, it is suggested that an efficient CCTV control system be introduced for the transportation environment.
1. Introduction
This study implements a system that prevents the occurrence of secondary traffic accidents and traffic jams by detecting abnormalities on roads, such as car accidents and obstacles, through AI (artificial intelligence) and CCTV (closed-circuit television), and delivering information related to the accidents. A secondary traffic accident here refers to an accident caused by a driver staying in or getting off the vehicle and colliding with a subsequent vehicle while stopping due to a vehicle failure or a prior accident. In order to distinguish between the first and subsequent accidents, this study would say that the first accident was the first traffic accident and that the secondary accident followed. The number of car users and car accident rates are increasing every year. Secondary accidents occur when the drivers of a vehicle do not evacuate completely after the first car accident or when the drivers of follow-up vehicles do not pay enough attention or they lack caution. Secondary accidents are often caused by hitting a vehicle that has stopped, the death rate of which is about five times higher than first car accidents [1]. To prevent secondary accidents from occurring, it is required to notify the situation to the following vehicles through emergency lights and to avoid going into safe zones. However, it is difficult to prevent secondary accidents because of unpredictable situations, such as drivers’ injuries and a lack of attention paid to rear cameras. Moreover, there are rocks that cause accidents as obstacles. This is why drivers can not be aware of obstacles on the road in advance, so car accidents happen easily.
As a precaution, it is proposed to use deep learning to convey information about traffic accidents and road obstacles to users, which makes them recognize accidents before they arrive at the locations of accidents on the road with abnormalities. Secondary accidents and blocks on roads frequently cause traffic congestion. If an accident happened and a road is blocked or narrowed, it causes traffic congestion. Figure 1 shows an annual traffic congestion cost graph of Korea. Through the graphs showing traffic congestion, we can recognize that the situation is getting worse and that traffic congestion cost is increasing [2]. Traffic congestion costs mentioned here include the costs used to solve traffic accidents and the costs of environmental pollution caused by the congestion of many vehicles on the road. As such, secondary traffic accidents create problems in various ways, and we want to solve this problem with deep learning.
Deep learning has the advantage of deriving the answer to problems without any intervention by humans, and it is being used exponentially in fusion industries, such as the automobile industry and the financial industry. Among deep learning technologies, there is object-detection technology. Object-detection is a computer technology related to computer vision and image processing that handles the detection of instances of a specific class of semantic objects in photos and videos. Using object-detection technology, we hope to solve traffic congestion and traffic accidents. CCTV is developing into AI CCTV with more advanced functions by adding recognition technology based on deep learning, while maintaining its original capabilities that monitor and capture something. Looking into previous studies that analyzed CCTV videos by deep learning, there was a study that analyzed a traffic situation through the estimation of vehicle type, vehicle traffic volume, and vehicle traffic speed by utilizing Faster R-CNN in CCTV for traffic control [3]; a study that estimated traffic volume by using stereo CCTV that detects vehicles in real-time in the left and right CCTV video [4]; a study that predicted the degree of danger according to vehicle speed by detecting vehicles approaching a crosswalk through the Nvidia Jetson Nano-class Edge device [5]; and a study that identified accidents on the water by analyzing data from the region in which many accidents occur and identifying objects by whether or not objects disappeared [6].
The purpose of the development of video analysis of AI CCTV is to detect vehicles, calculate traffic volume, and prevent accidents on the water. The research about AI CCTV has been conducted actively, but there is little related research on traffic accidents. One study related to traffic, which is precedent research, is also the study using data about vehicle speed. In the precedent studies, using R-CNN gives high accuracy, but it is insufficient to deal with traffic accidents on the road in real-time. This is because R-CNN requires a lot of learning time and GPU calculation capacity due to learning progressing in several stages for real-time processing. YOLO is capable of real-time object detection that can handle larger amounts of images while having accuracy close to R-CNN, rather than seeking higher accuracy than existing models. This study has advantages due to using YOLO, which is characterized by its simple processing and extremely fast speed, because it is important to quickly detect accidents in real-time. Therefore, the goal of this study is to research a service that can detect abnormal situations on the roads without any additional devices through a model using YOLO and then convey information on the situation through notifications within seconds, which contributes to preventing secondary accidents and creating a safe traffic environment.
Through the production of a deep learning-based model that can detect abnormal situations on the roads, a real-time notification application that can prevent secondary accidents, called DRAS (detecting road abnormal situations), was produced by implementing AI CCTV. Figure 2 shows that AI CCTV detects abnormal situations on roads and then conveys information to the users via FCM (Firebase Cloud Messaging). After detection, AI CCTV in Figure 2 delivers accident and location information within a 5 km radius and FCM (Firebase Cloud Messaging) to the user within 5 s as a web application. We expect positive effects from this service that can reduce secondary accidents and damage from obstacles on roads and prepare for traffic congestion through rapid information transmission.
A comparison between DRAS and similar products is presented in Table 1. BATON SOS detects an accident using a 9-axis detection sensor attached through separate hardware rather than a web application, and users can notify undetectable accidents by pressing the button manually. If the users realize it is wrong after detection, its function has been developed to contact 911 or insurance companies after 30 s as a grace period [7]. Unlike BATON SOS, Mapper’s ATLAN navigation does not need individual hardware. However, to detect accidents and check for accidents by using VDS, workers from the traffic situation room check the CCTV and notification is sent.
However, DRAS detects abnormalities in real-time CCTV videos by using deep learning and delivers warning notifications and accident information to users within 5 km. It was confirmed that the information was transmitted to the user within 5 s by conducting a hypothetical experiment by selecting the location of the three regions. Detection and information transmission are fast, and users who received notifications can be aware of accidents and then prepare for traffic congestion and accidents, which helps traffic institutions to monitor lots of CCTV with fewer workers.
2. Materials and Methods
AI CCTV DRAS was developed through artificial intelligence technology, an object-detection technology through CCTV images using deep learning. Deep learning uses a learning model that mimics the decision-making process that occurs in the human brain, receives raw data directly, analyzes it by itself, and then provides an answer [8].
2.1. Development Specification
Information about the software development used in this implementation is presented in Table 2. Darknet, used for image processing in deep learning, is an open-source neural network framework written in C and CUDA that supports the calculation of CPU and GPU computation and is a fast and accurate neural network framework for real-time object detection [9]. FCM is a free cross-platform messaging solution. The Admin FCM API supports the process of back-end authentication, sending a message, and the management of subject subscriptions. It allows sending a message to each individual device or sending messages to subjects and one or more matching conditional statements [10].
2.2. Method
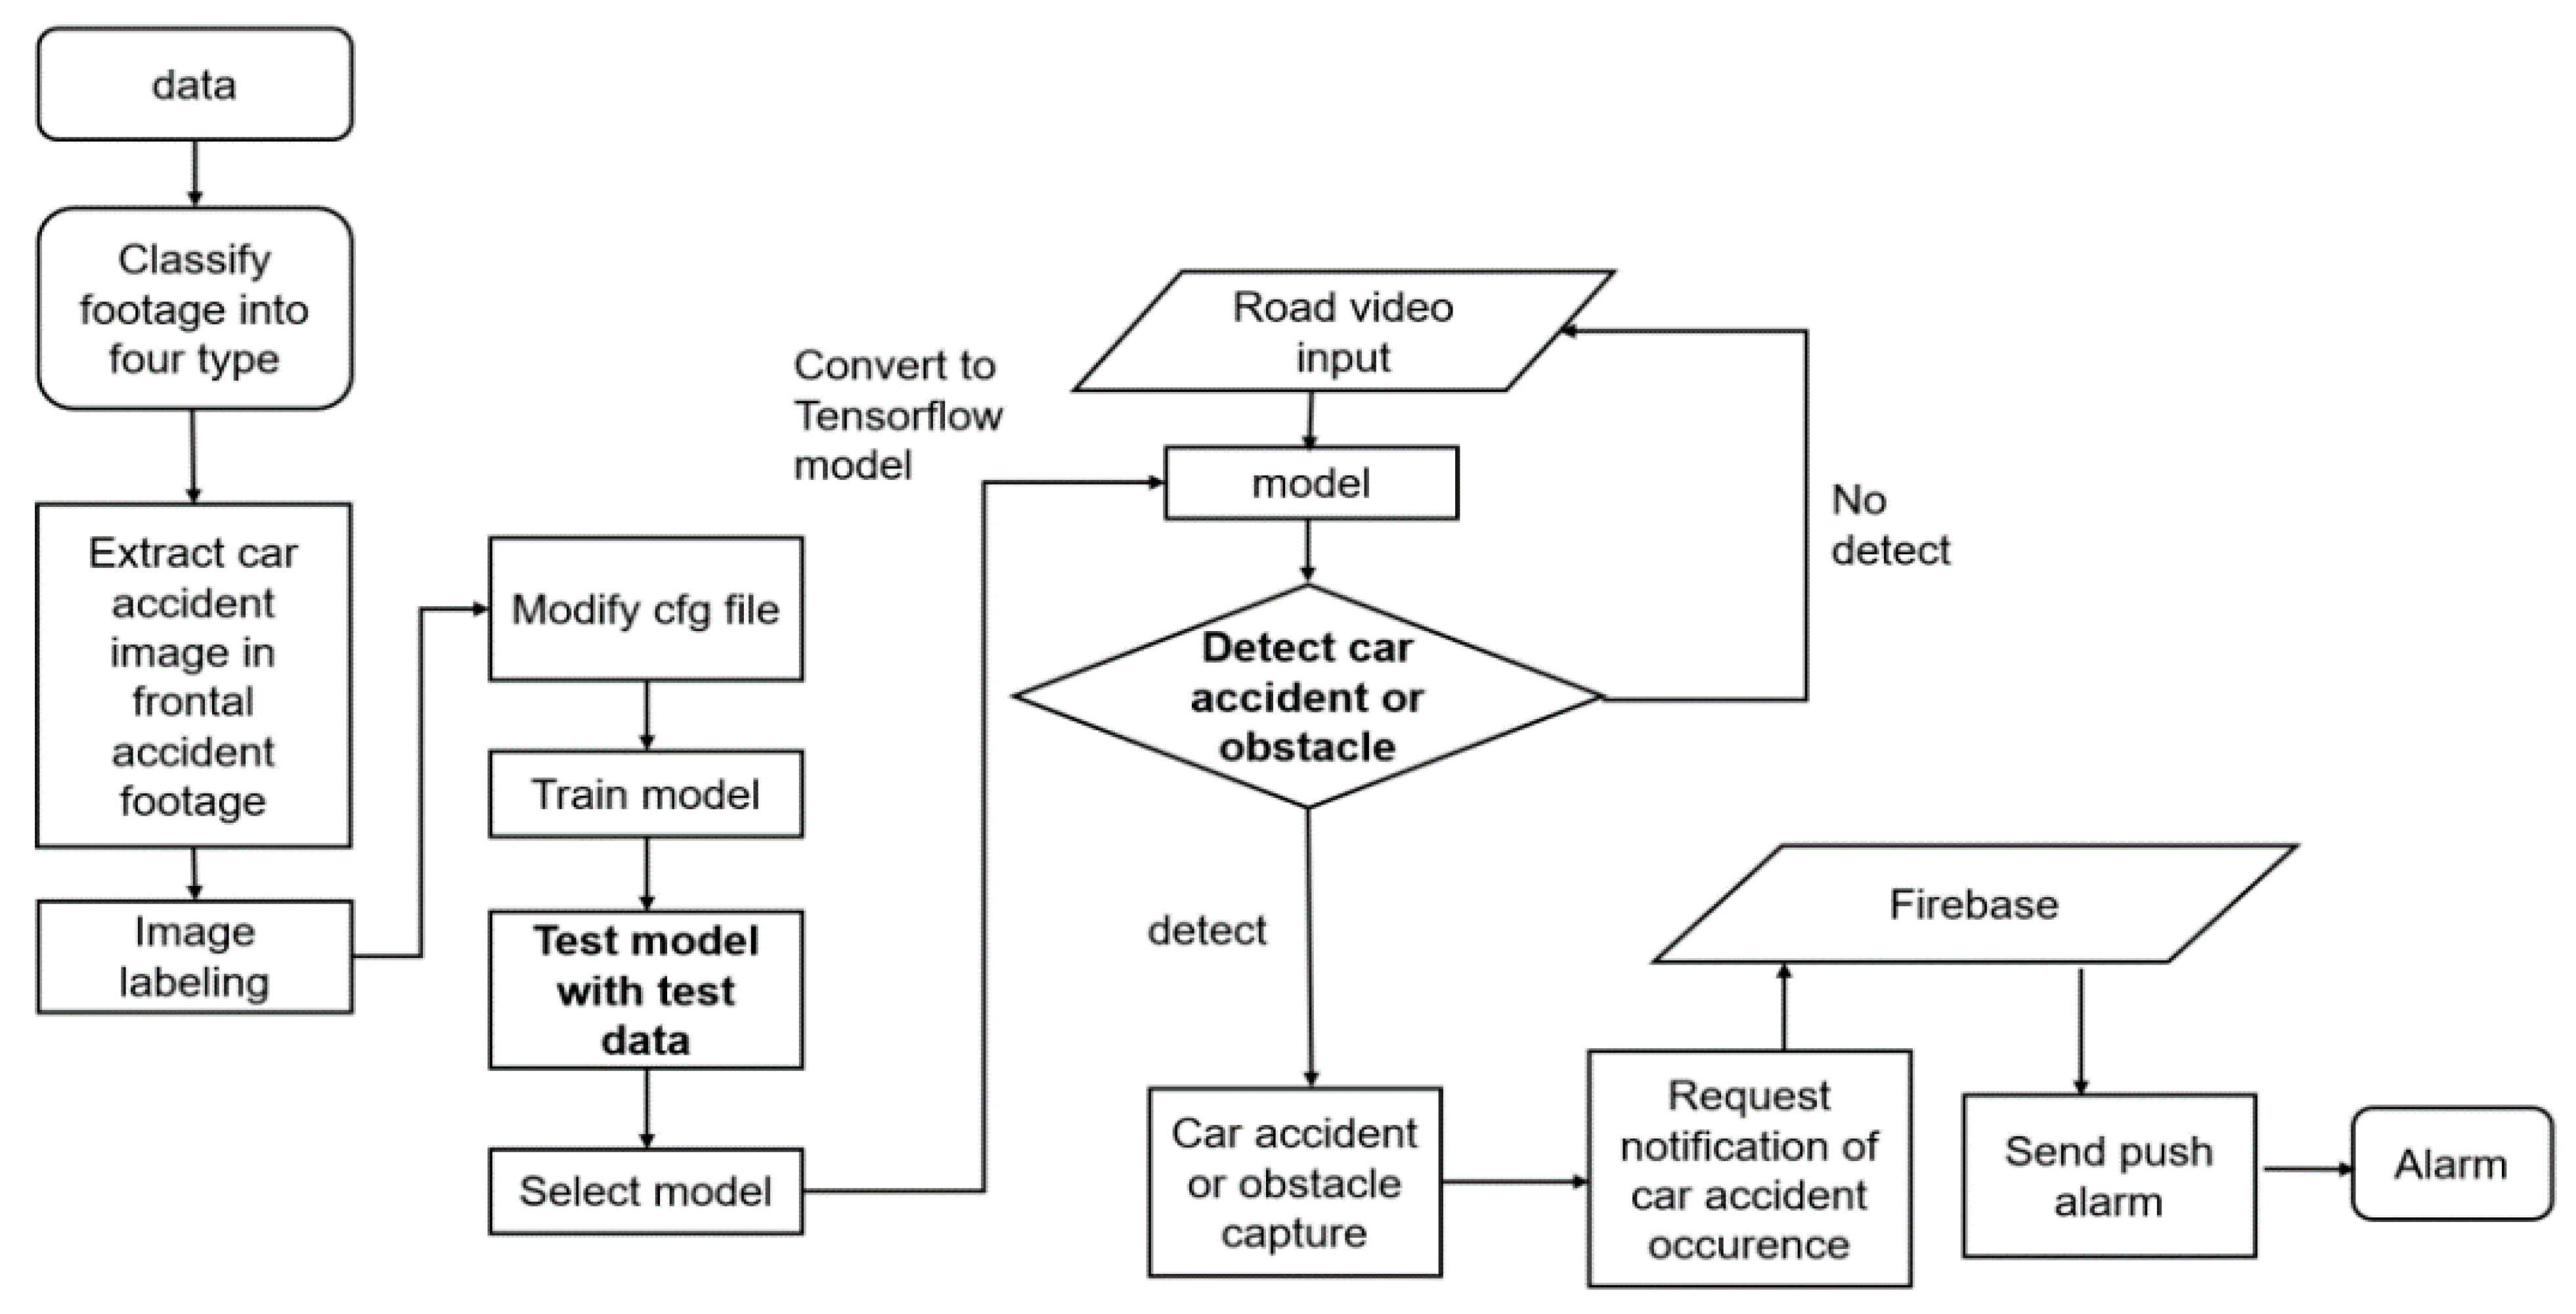
Figure 3 shows how the model was created and how AI CCTV worked. DRAS can detect traffic accidents on the road and blockages, such as stones on the road, and alert app users. The hardware configuration for real-time vehicle accidents and model learning of the road obstacle notification system DRAS is Intel i7-9750H 2.60 GHz, 16 GB RAM, and GeForce RTX 2060. For model learning, the software uses the deep learning framework Darknet.
Through the Daily Blockchain company, 1200 black boxes and CCTVs were provided with video footage of accidents in Korea and abroad. To extract frames from these images, FFmpeg was used to capture multiple moments of vehicle accidents in the image. Because each car accident had a different area of collision or reason for the accident, classification was needed according to the picture of the car accident. There were four categories of collision: head-on collision, rear-end collision, side collision, and collision after rotation alone. Among them, the image quality of the images related to the frontal collision of the front part of the car was high, and the number of data was high. Therefore, 700 images related to head-on collision were collected. The training data were set as 600 photos, and the test data were set as 100 photos. Nevertheless, there was not a lot of photo data from head-on collisions. Therefore, the number of images was increased using image rotation. It was incremented by more than 2000 images through a rotation of 90 degrees and 180 degrees.
After that, image labeling was carried out using a car accident that occurred in a head-on collision as an object. I have labeled only the car crash, so I have been working on it for four hours. The class was set to one as ‘car_accident’, and the weights were determined to have a mAP (mean average precision) of 82.36% based on an IoU (intersection over union) threshold of 50%. Because it is trained through the YOLOV3 model, it was conducted through the pre-learning model of Darknet53. It took about 5 h to train the YOLO model. The YOLOV3 custom weights file learned through the Darknet framework was converted into a TensorFlow model. The converted model was set up to save the photo after assuming that a traffic accident occurred when the core reached 0.7 or higher in detect_video.py. However, saving pictures with 0.7 or higher scores per frame increases the data to be transferred, so only images with 0.7 or higher scores per 40 frames are implemented. The model learned is uploaded on Flask and Django servers. With CCTV test images implemented on servers, it sends warning notifications via FCM and POST upon the detection of obstacles and accidents. Through this, it displays a notification window on the Web application around the location of the accidents with a message for caution about the accidents and a frame about the detected situation.
The model implements the new object-detection algorithm by using YOLO. YOLO is a deep neural network designed to perform object detection, which can obtain information about the type and location of objects with a single look at the image. An object-detection algorithm is used in this process to compute the object probabilities about several bounding boxes presented in a single network. The object-detection algorithms have been divided into region proposal and classification, but YOLO can skip the region proposal and can perform object detection at once. YOLO predicts bounding box and class probability with only one calculation of a single neural network for the entire image. A bounding box refers to a rectangular box wrapped around an object to indicate the location of the object. Class probability refers to the probability that an object surrounded by a bounding box corresponds to a class [11]. Therefore, it shows significantly accurate prediction by maintaining the fast speed of prediction in real-time. With regard to accuracy, it is not the best, but it is also suitable for real-time object-detection models, considering the advantages of being very fast in inference. Because of these advantages, it can quickly detect traffic accidents that occur suddenly in AI CCTV with a simple process. R-CNN is highly accurate but is not suitable for detecting objects in real-time. Therefore, we use YOLO instead of R-CNN because it can detect sudden accidents in real-time and because it also has good accuracy.
The YOLO model divides the image into an grid cell. Each grid cell predicts a bounding box and then expresses how many as B and predicts the confidence score for the bounding box. Each bounding box is represented by and is the bounding box’s center point of the coordinates, and and are the width and height, respectively. By using this, it derives a confidence score, which represents the reliability of the following boxes. The confidence score and confidence mentioned above are the same. The confidence score indicates how reliable and accurate the bounding box is that the bounding box contains objects. The confidence score is defined as shown in Equation (1). Here, IOU stands for intersection over union and refers to the ratio of the intersection area to the sum area of the object’s actual bounding box and predicted bounding box [12]. If there is no object in the grid cell, . Therefore, the confidence score is also zero. Ideally, it is predicted that there is an object in the grid cell, i.e., .
Each grid cell predicts C, which means conditional class probabilities. The conditional class probabilities can be calculated by Equation (2). C is the conditional probability of what class the object is under the condition that it is in a grid cell. Regardless of how many bounding boxes exist in a grid cell, only one class of probability values are obtained in one grid cell [12].
This equation multiplies the probability that the object is located on the grid, the predicted box, and IoU, which represents the overlapping area with the ground truth box as a ratio, and computes the probability of the corresponding class for C classes for each grid. Applying the value to all B bounding boxes for index and lining up the vectors applied to the S × S index again, the probability value from the entire bounding box for each class can be derived in Equation (3). In this case, the bounding box assigned to the same object is drawn over the corresponding class because it is a method of calculating the maximum value from the vector through non-maximum-suppression (NMS) [12].
YOLO’s loss is based on sum-squared error (SSE). Therefore, you must optimize the sum-squared error (SSE) of the final output. The reason for using SSE is that it is easy for SSE to optimize, but optimizing SSE does not perfectly align with increasing mean average precision (mAP). YOLO’s loss includes localization loss, which is the loss of how well the bounding box was predicted, and classification loss, which is the loss of how well the class was predicted. It is not a good idea to keep the same weight of localization loss and classification loss, but the way SSE is optimized treats both losses as having the same weight. Another problem is that most grid cells in the image do not have objects, because the background area is larger than the foreground area. If there is no object in the grid cell, it has a . As a result, most grid cells are forced to learn to become . This leads to an imbalance in the model. To improve this, we increased the weight of the loss for the bounding box coordinate when the object exists, and we decreased the weight for the bounding box’s confidence loss when the object does not exist. This means increasing the weight of localization loss between localization loss and classification loss, and increasing the weight of the confidence loss of the grid cell when the object exists rather than the confidence loss of the grid cell without the object. To do this, we used two parameters is a balancing parameter for the loss of coordinates and for balance with other losses. is a balancing parameter for balancing between a box with an object and a box without an object [12]. We set .
SSE has another problem. SSE calculates loss with the same weight for both large bounding boxes and small bounding boxes. However, a small bounding box is more sensitive to smaller positional changes than a large bounding box. This is because the bounding box that surrounds the small object is out of the small object with just a little movement. To improve this, a square root was taken for the width and height of the bounding box. This is because, as the width and height increase, the rate of increase decreases, which reduces the weight for loss. YOLO predicts multiple bounding boxes per grid cell. During the training phase, one bounding box predictor must be responsible for one object. That is, you must match one bounding box per object. Therefore, you must select only one of several bounding boxes. To do this, the one with the largest IOU must be selected, with the ground-truth bounding box surrounding the actual object among the bounding boxes predicted. The largest IOU with ground-truth bounding box means the best wrapping of objects. This trained bounding box predictor is good at predicting specific sizes, aspect ratios, and classes of objects [12].
Equation (4) is a loss function that can be used for network learning [12]. means that an object exists within the grid cell . This value is 1 if the object exists, and 0 if it does not exist. indicates whether the th bounding box predictor of grid cell is used. The first term in Equation (4) calculates the loss of x and y for bounding box predictor of grid cell i where the object exists. The second term in Equation (4) calculates the loss of and for grid cell where the object exists. Small bounding boxes are more sensitive to smaller positional changes than large bounding boxes. The bounding box that surrounds the large object still wraps around the large object well, but the bounding box that surrounds the small object moves away from the small object. To improve this, a square root is calculated for the width and height of the bounding box. This is because taking a square root for width and height decreases the increase rate as the width and height increases, reducing the weight on loss. The third term of Equation (4) calculates the loss of the confidence score for the bounding box predictor of the grid cell where the object exists (). The fourth term of Equation (4) calculates the loss of the confidence score for the bounding box predictor of the grid cell i where the object does not exist (= 0). The last term in Equation (4) calculates the loss of conditional class probability for grid cell where the object exists [12]. ( if class c is correct, otherwise: ).
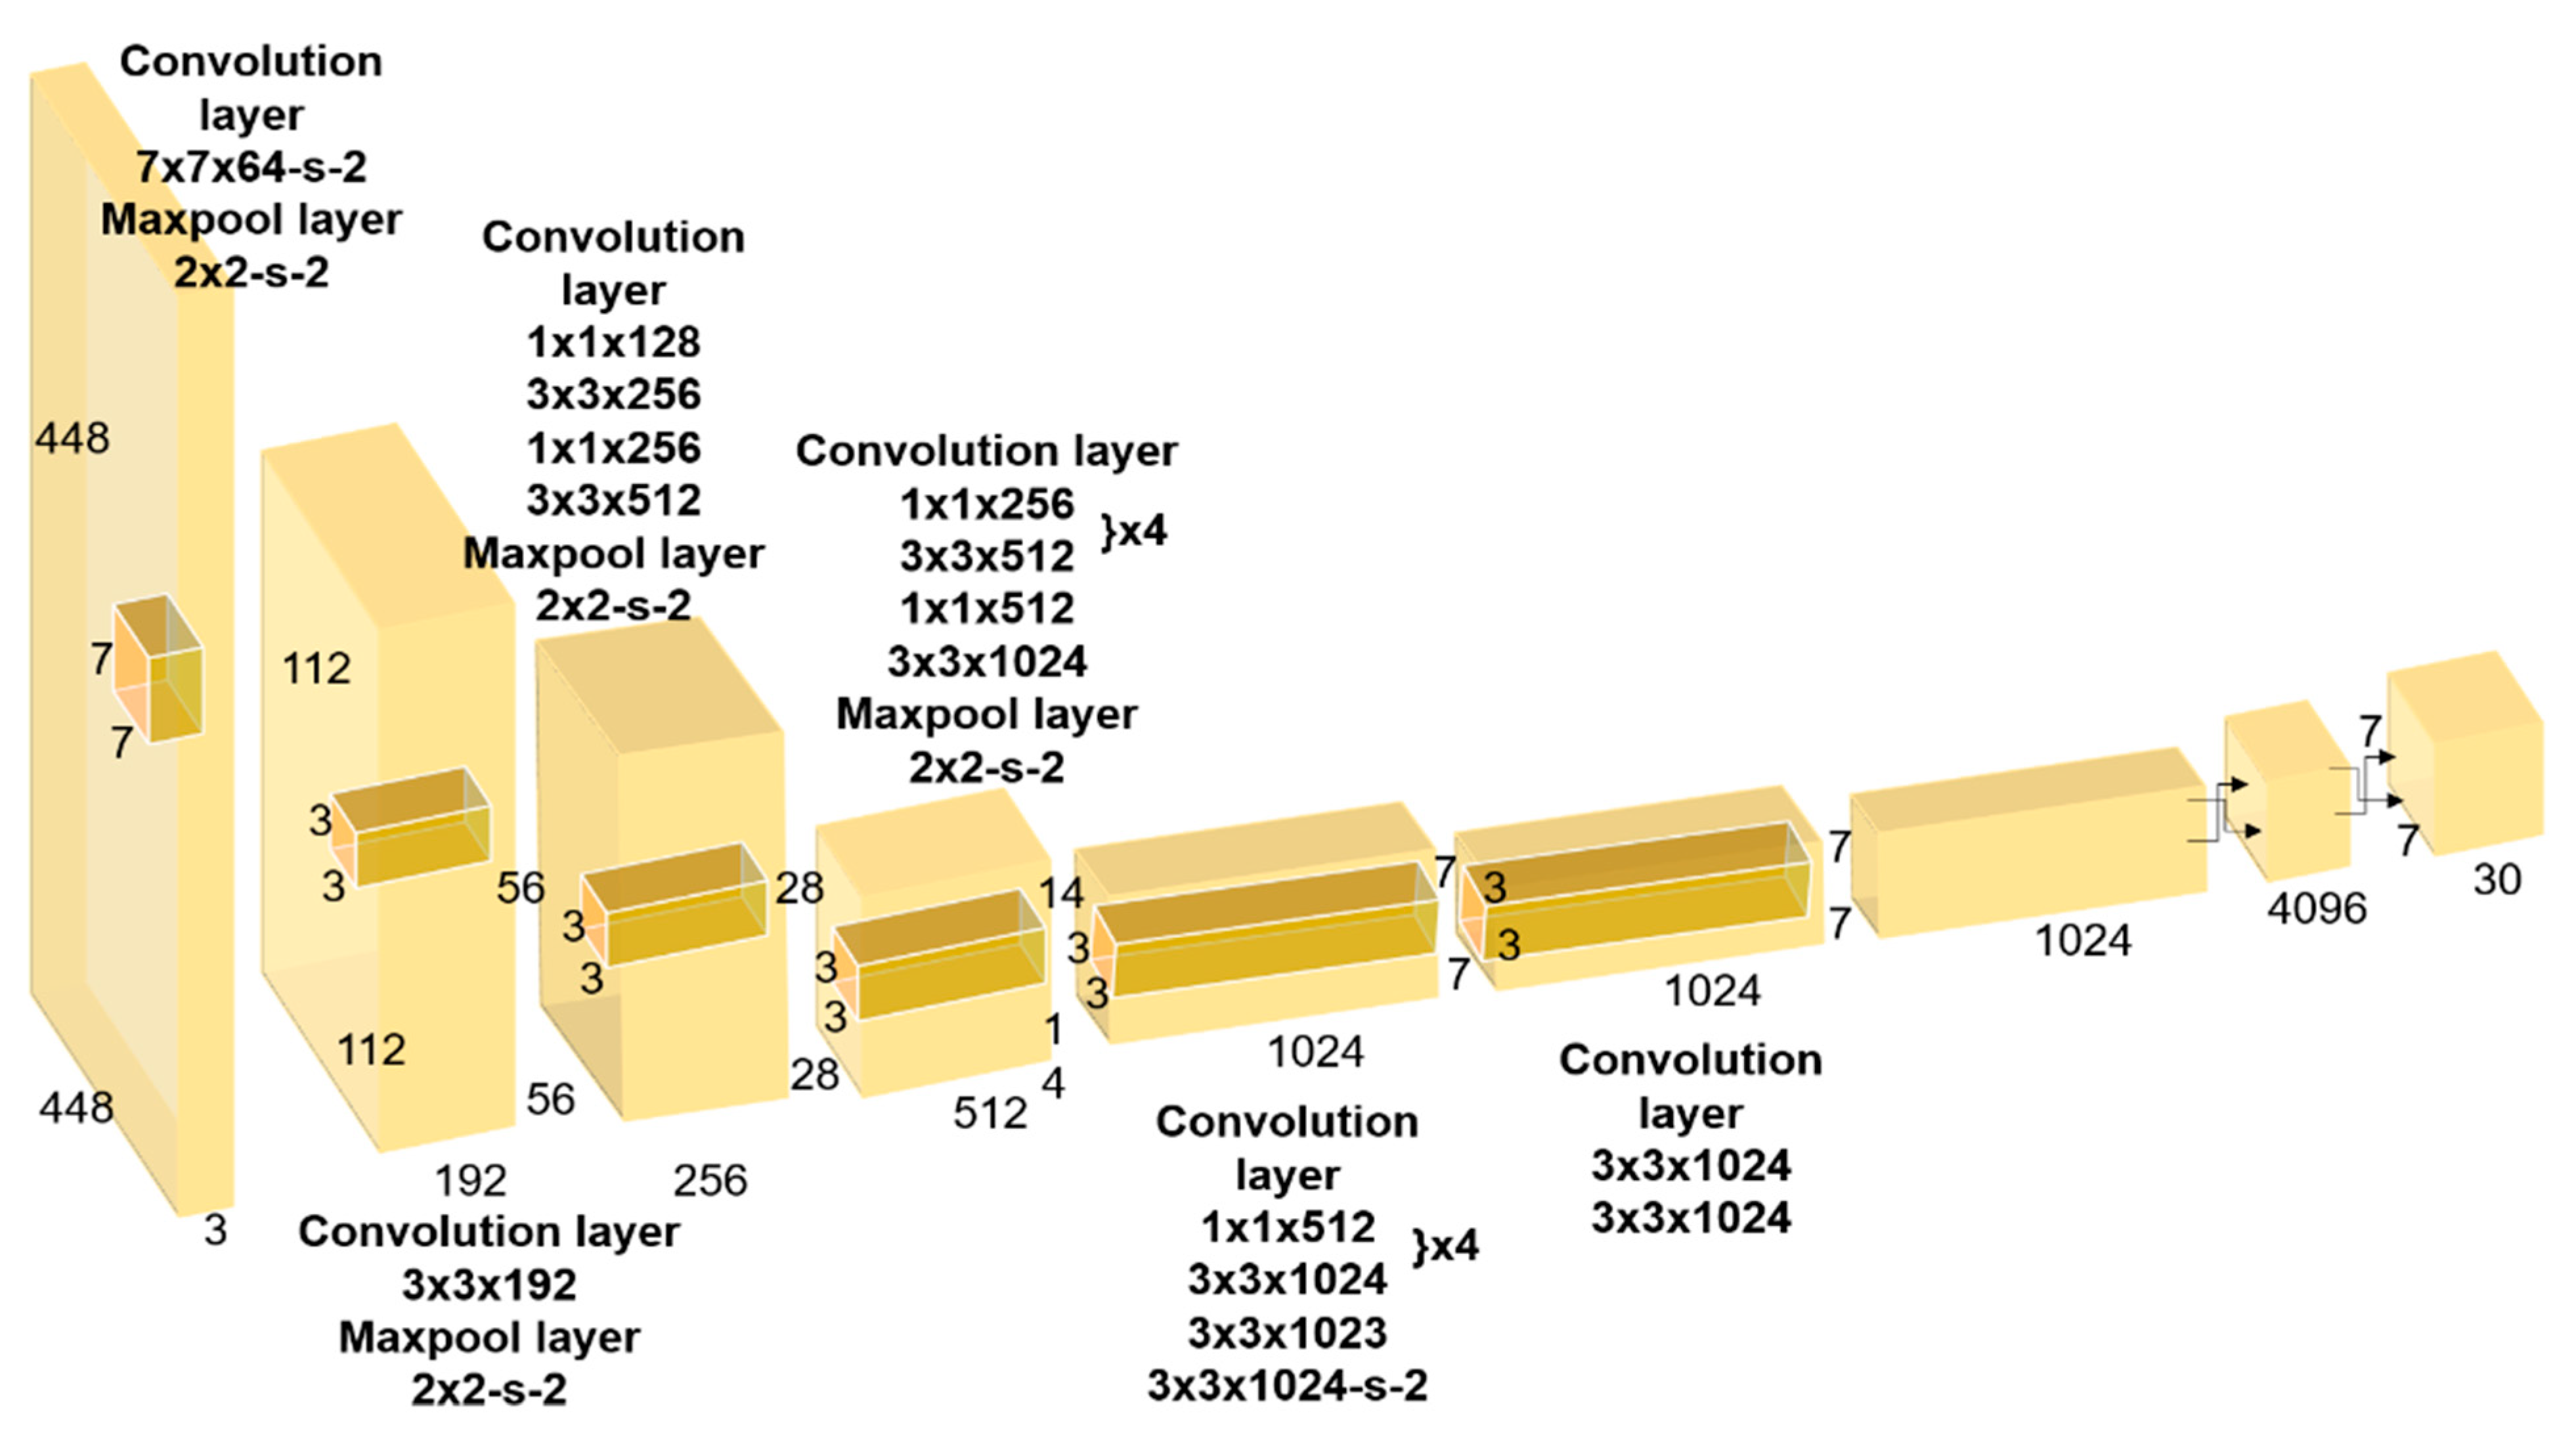
The YOLO model is designed in one conventional neural network (CNN) structure, as shown in Figure 4. The YOLO model was modeled on the Pascal VOC dataset. The front end of this CNN is a convolutional layer, followed by a fully connected layer. The convolutional layer extracts feature from the image, and the fully connected layer predicts class probabilities and bounding box coordinates. The YOLO neural network structure is derived from GoogLeNet, which is used for image classification. YOLO consists of a total of 24 convolutional layers and two fully connected layers. Instead of GoogLeNet’s reception structure, YOLO used a combination of a reduction layer and a 3 × 3 convolution layer. The combination of a reduction layer and a convolutional layer is said to replace the reception structure [12]. The overall structure of the YOLO model is as follows: the final output of this model is the prediction tensors of .
YOLOV3 is almost similar to YOLOV2, but there are some differences. YOLOV3 changed its backbone architecture from Darknet-19 to Darknet-53. Darknet-53 adds even more layers to Darknet-19 by applying the proposed skip connection concept from ResNet. Table 3 shows that Darknet-53 has a high FPS, although its accuracy does not differ much from that of ResNet-101 and ResNet-152. YOLOV3 applies binary classification using a sigmoid for each class without using softmax for class prediction. YOLOV3 runs much faster when compared to other object detection model with similar performance. Figure 5 presents the results for the IoU threshold 0.5 criteria. To evaluate the performance of the detector on the COCO dataset, based on MS COCO mAP (mean average precision), RetinaNet is 40.8 and YOLOV3 is 33.0; that is, the result is lower in YOLOV3 [13]. Table 4 shows the average precision (AP) of detecting small, medium, and large images using various algorithms and backbones. The higher the AP, the more accurate it is for that variable. As shown in Table 4, YOLOV3 is 57.9 and RetinaNet 61.1 based on Pascal VOC mAP (average precision: 0.5); that is, it can be seen that the speed of YOLOV3 is faster [13].
In DRAS, YOLOV3 was used for the purpose of detecting accidents and sudden obstacles on the road that occurred between vehicles running at high speed in CCTV images. When the CCTV test video is carried out on the Flask or Django server through the converted model, it detects a traffic accident or detects an obstacle.
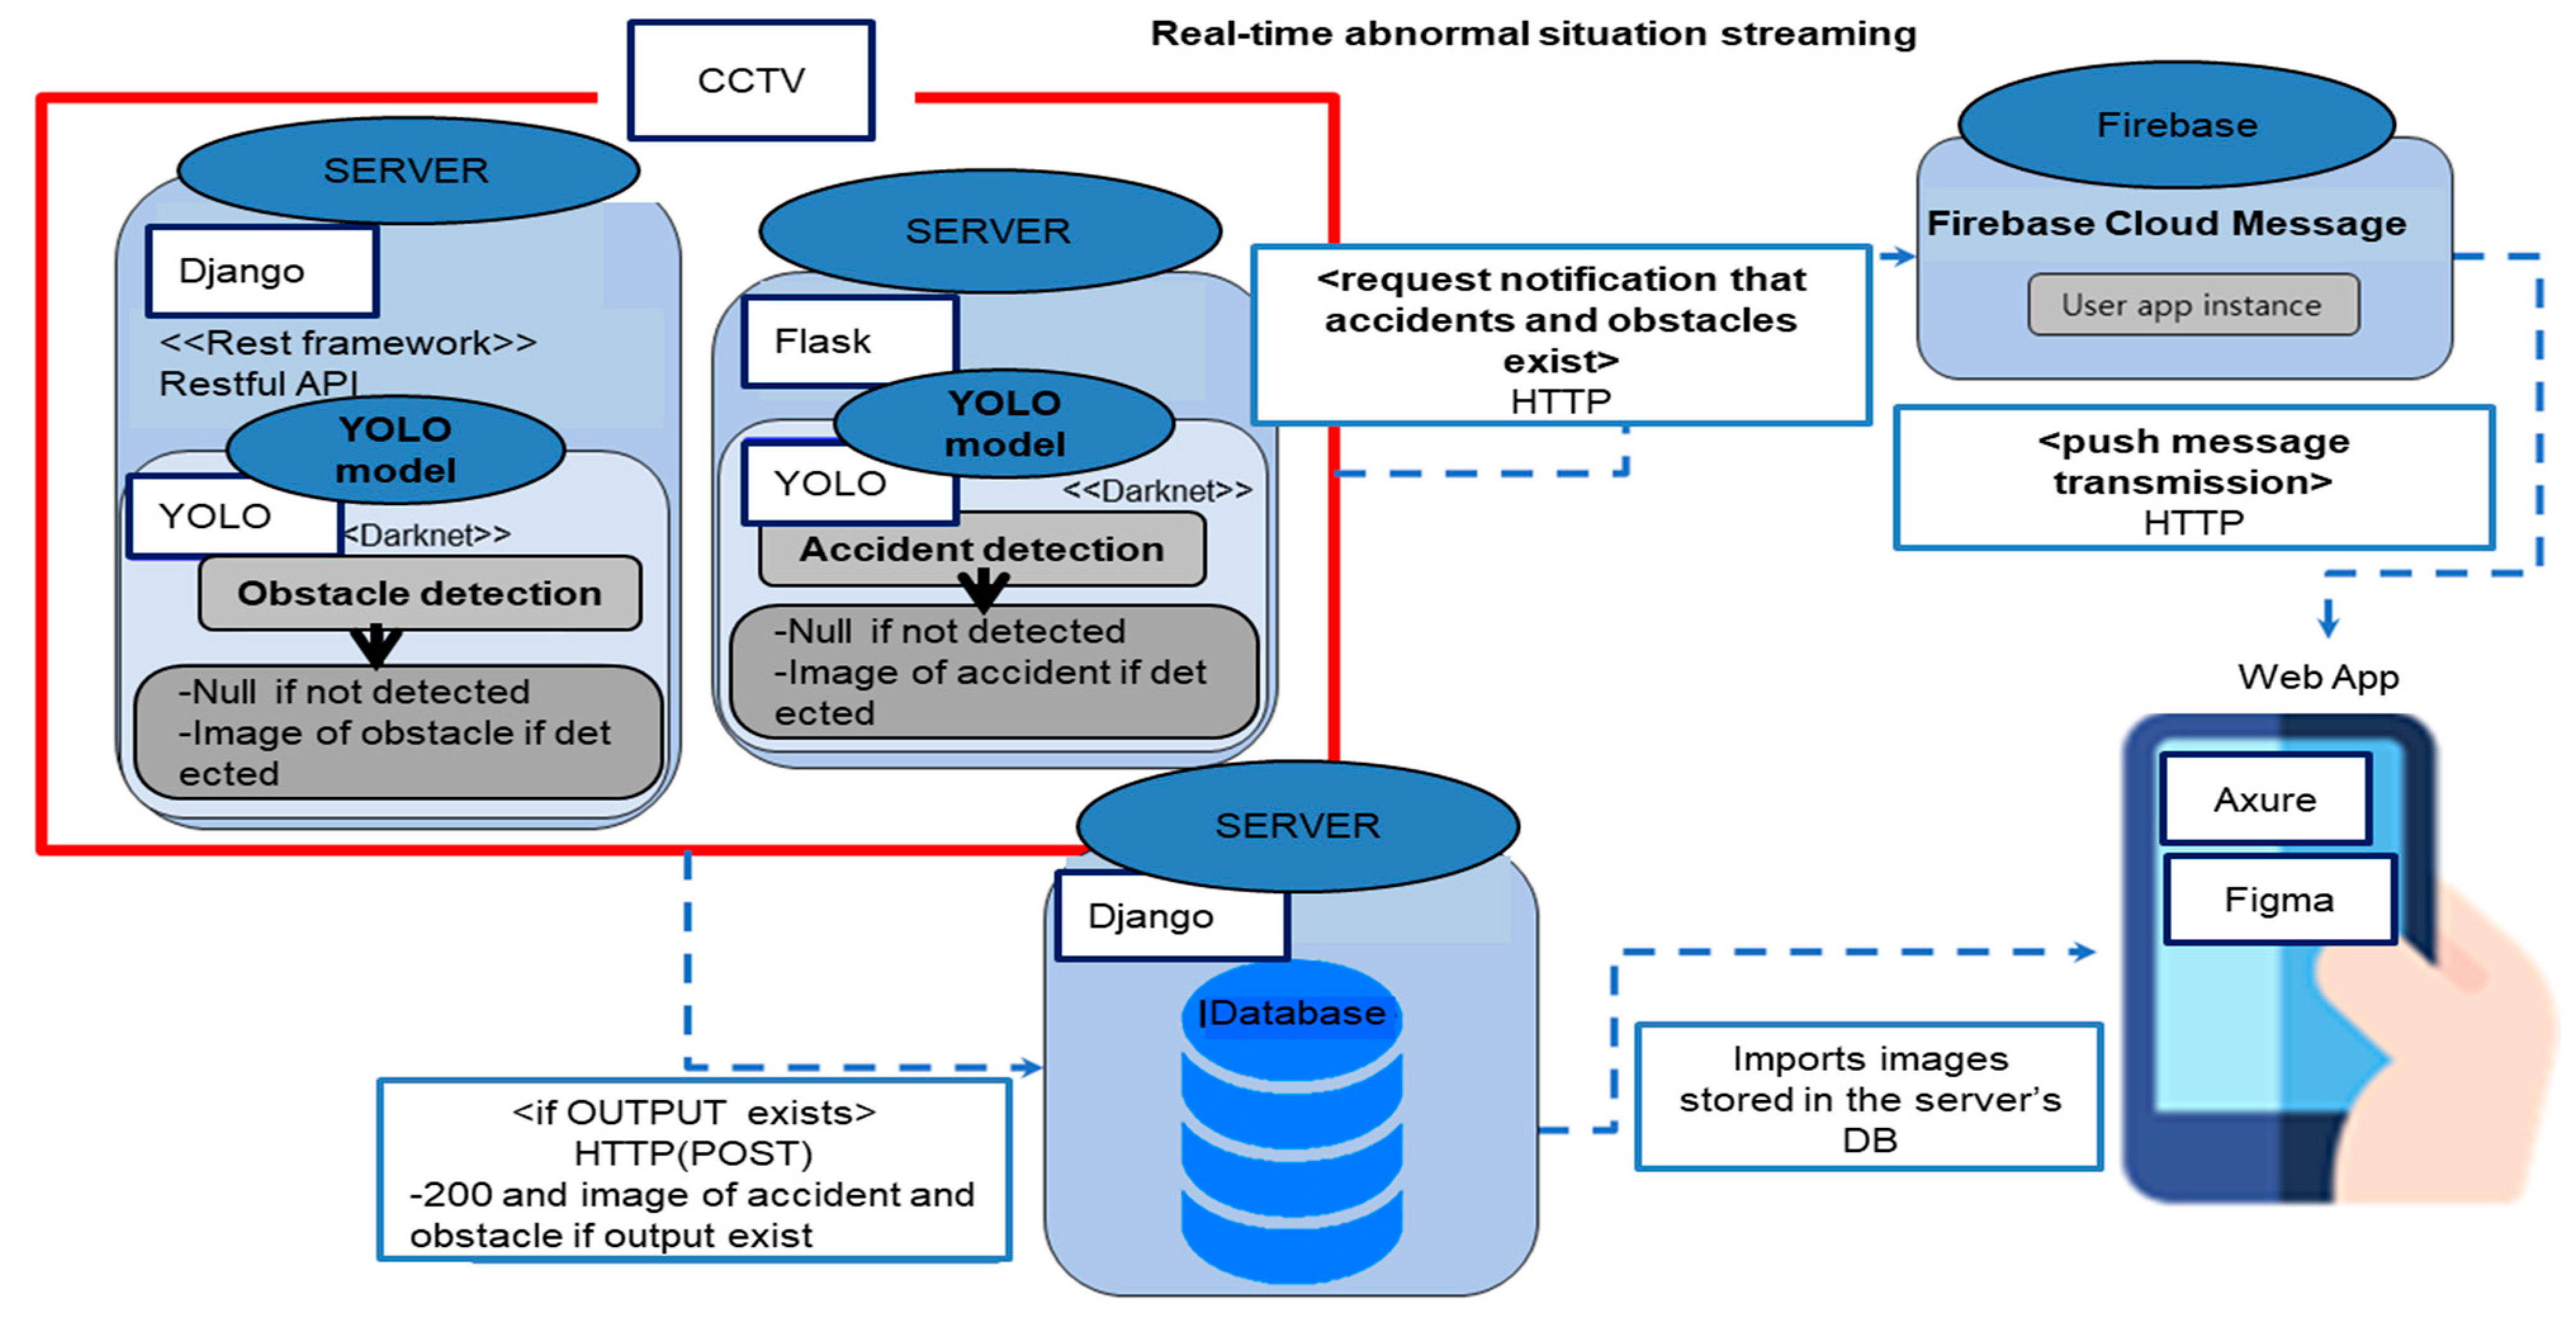
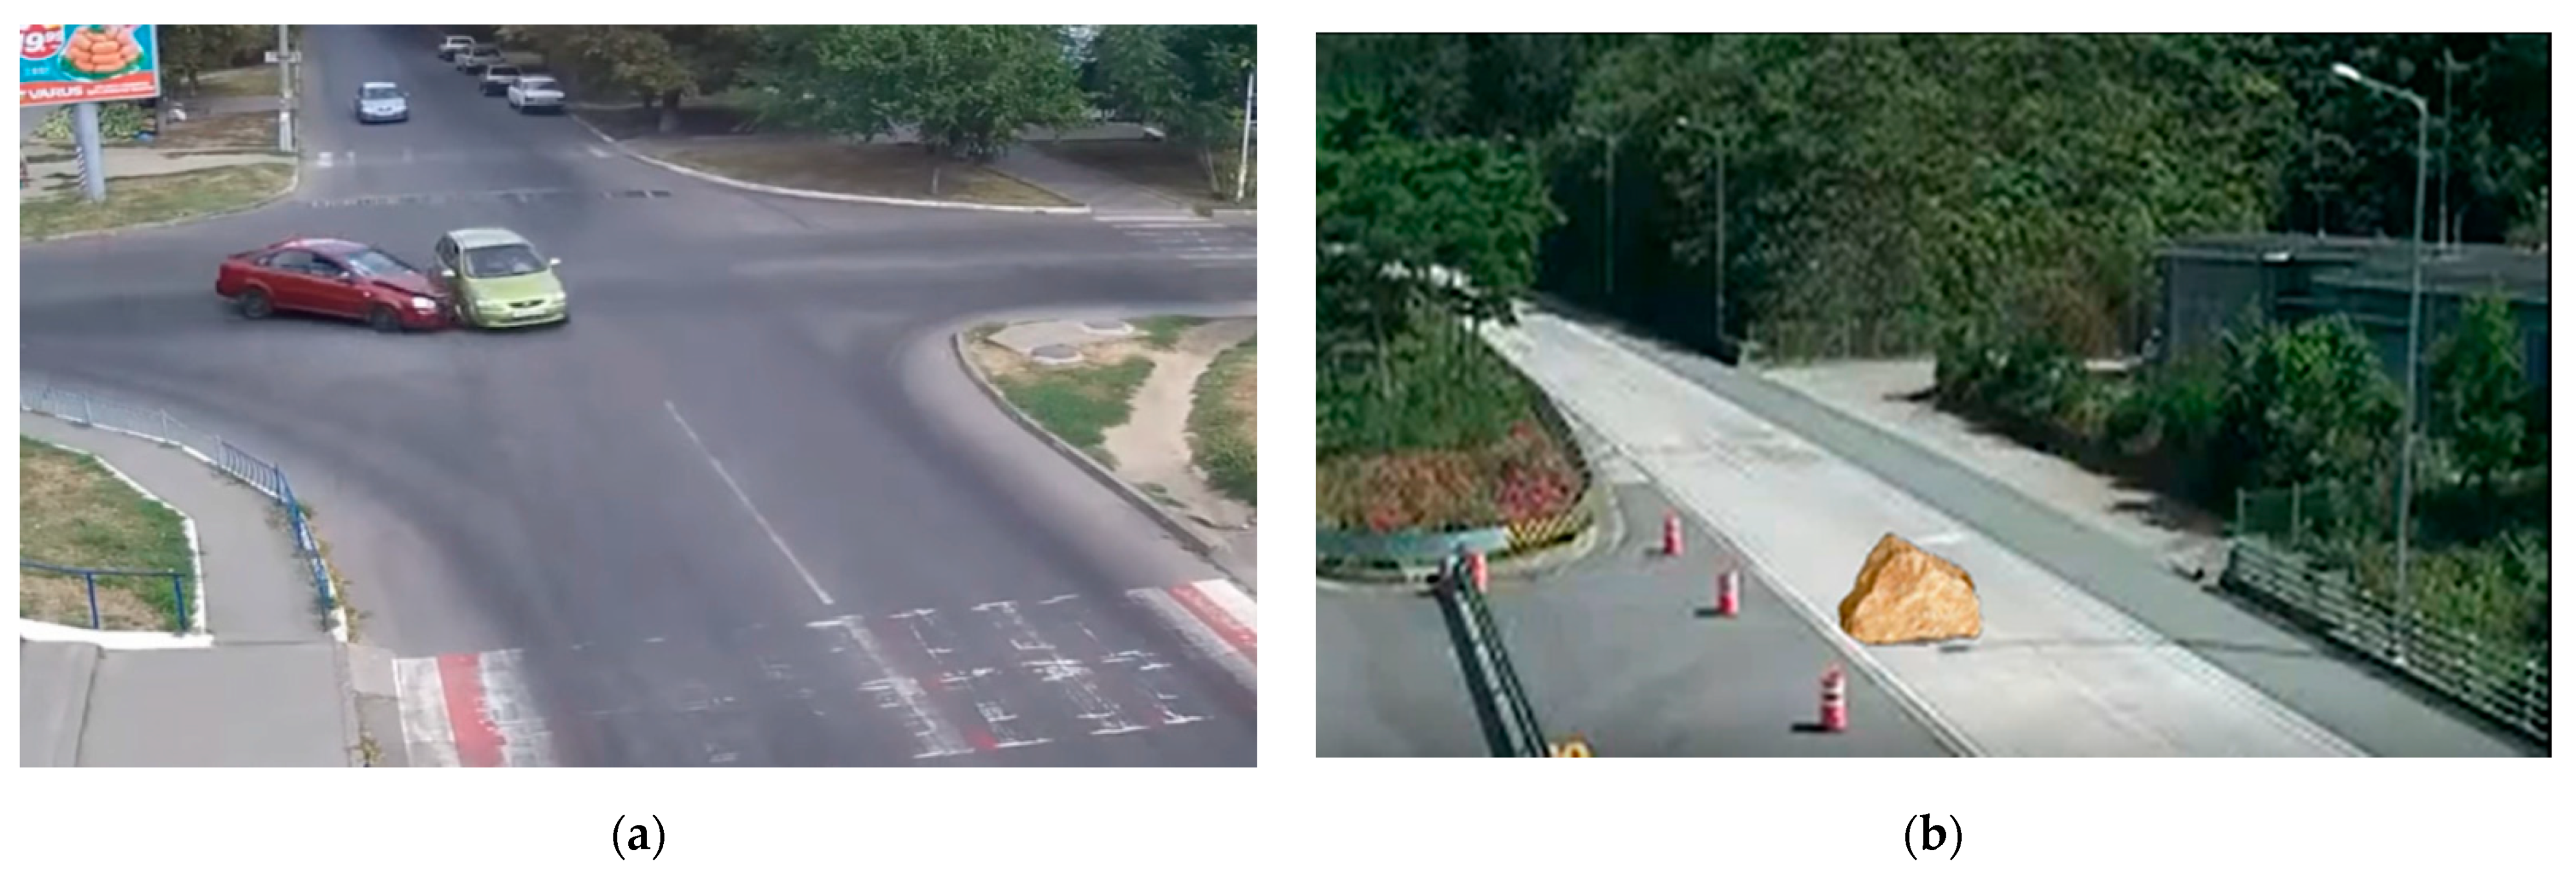
The architecture of the whole system in this study is presented in Figure 6. In Figure 6, the server consists of three parts. The server consists of a Flask server that stores the model produced through the model training process, a Django server that detects obstacles on the road, and a Django server that stores images detected as abnormalities. Because it is important to transmit information as quickly as possible during communication, FCM is used to transmit anomaly data. Because FCM puts a cloud messaging server in the middle, it has the advantage that users can send and receive messages quickly in real-time even with a low battery and weak network. However, since FCM makes it difficult to transmit images, HTTP is used to transmit abnormal images. Moreover, Web application uses Figma to create screen components and brings the components to Axure to implement screens and actions. Figure 7 shows the results of detecting anomalies. In this figure, a square box represents an anomaly object. Figure 7a shows a traffic accident using a traffic accident detection model, and Figure 7b shows an obstacle on the road using an obstacle-detection model on the road.
In Flask and Django servers where the abnormality-detection model exists, CCTV images are executed in real time, and when abnormalities are detected as shown in Figure 6, information related to abnormalities is transmitted to the web application.
The detected image is sent to another Django server through HTTP communication. The server that receives the image distributes the image into PythonAnywhere. After the image is delivered, it is set to store the image and information related to the image in the database.
Figure 8 shows the screen of the created web application. To explain the operation sequence of the web application, enter the DRAS site and Figure 8a is the first screen. If you click ‘Find Paths’ here, a window for inputting the starting point and destination appears on the right, as shown in Figure 8b. If you input the starting point and destination and press enter, you can see a screen like Figure 8c. If the red CCTV is visible on the Figure 8c screen, this means that an anomaly has been detected in this CCTV. So, if you click this CCTV, the detected anomaly image is displayed.
The range that can receive anomalies from the user viewing the screen as shown in Figure 8a is set within 5 km from the current user’s location. The reason is that because the road is connected to other roads, it is easy to be affected by the surrounding traffic conditions. Therefore, 5 km is a set range that can be affected by traffic conditions. Therefore, the user who receives an anomaly notification is on the optimal route centered on the location where the anomaly occurred or is within 5 km of the accident.
The geocoding of the Google map API is used to return latitude and longitude. As shown in Figure 8a, the ‘onSuccessGeolocation function’, a built-in function of the program, is called periodically when using GPS on the initial screen, so that the user’s changing location is directed to the center. On this screen, 5 km from the current location is marked with a red circle to indicate the coming range of the notification. If the ‘Find Path’ button is pressed like in Figure 8b, the screen is divided into left and right sides as shown in Figure 8c. The left screen of Figure 8c is marked with the origin and destination and black CCTV through the use of the Naver Map API. The position of each mark is based on the latitude and longitude returned when entering the route. The screen on the right of Figure 8c shows the shortest route from the departure to the destination entered using the URL of the Kakao Directions Service.
When receiving FCM, the built-in function ‘messaging.onMessage function’ is called. The abnormalities type is separated from the data received through FCM, and the notification window is configured. The image in the notification window is imported from the DB (database) of the Django server in which the image is stored. When the origin and destination are not entered on the screen, a notification window appears for 4 s. If the origin and destination are entered, a notification appears when the CCTV latitude and longitude values transmitted in the virtual box based on the longitude and latitude of the two locations are included in the box. In the initial screen, considering that 1 degree of latitude and longitude is 111 km, 0.05 is set to about 5 km, and if the calculated value of the current location and the CCTV location is less than 0.05, a notification is displayed. After the notification window appears, the CCTV image for the notification that appears changes from black to red. Changing the color of the CCTV image is to make it possible to know which CCTV has detected abnormalities at any moment. When the user presses the CCTV changed to red, the ’naver.maps.Event.addListener’ function of the built-in function is activated. The event add Listener function is activated, so information on the abnormality can be seen again as shown in Figure 8d.
3. Results
3.1. Experiments
3.1.1. Experiments on Accident and Obstacle Notification According to People Using Different Routes and Location of CCTV
DRAS provides warning notifications about car accidents or obstacles to users located within 5 km of the location of the vehicle accident or obstruction. A hypothetical experiment was conducted to determine where the user is located and how to receive warning notifications depending on the location of the AI CCTV. Figure 9 shows some real Seoul maps of Korea used in this experiment. The map shows the origin, destination location and CCTV location used in the experiment. The red icon indicates Seoul City Hall, the yellow icon indicates the Seoul Express Bus Terminal, the green icon indicates Hongdae Station, and the blue icon indicates Dongjak Station. Among the two CCTV marks, the one on the left represents the CCTV at the southern end of Banpo Bridge, and the one on the right represents the CCTV at the northern end of the Han River Bridge. In a hypothetical experiment, it is assumed that virtual AI CCTVs are located at the northern end of Han River Bridge and the southern end of Banpo Bridge. The AI CCTV location determined in the experiment was determined by referring to the actual CCTV location. It was assumed that traffic accidents on the northern end of the Han River Bridge and the detection of obstacles on the southern end of Banpo Bridge would occur at the same time.
Figure 10a is a photograph of a car accident at the northern end of the Han River Bridge, and Figure 10b is a picture of an obstacle at the southern end of the Banpo Bridge on the road.
If an abnormality occurs at the northern end of the Han River Bridge or at the southern end of Banpo Bridge, the web application will be notified. Figure 11 shows a notification window in which abnormalities will occur. Figure 11a is a warning notification window that appears when an abnormality occurs at the northern end of the Han River Bridge, and Figure 11b is a warning notification window that appears when an abnormality occurs at the southern end of Banpo Bridge.
The small red car in Figure 12 represents the user’s location, and the square and the circle on the map represents an area smaller than 5 km. Also, areas with car accidents and obstruction photos indicate warning notifications.
Figure 12a assumes that the user sets the route from Dongjak Station to Hongik University Station and receives an alarm after departing. The user is located within 5 km of the northern end of the Han River Bridge and 5 km from the southern end of Banpo Bridge. Therefore, the user in Figure 12a receives a warning notification about a car accident detected by AI CCTV for the northern end of the Han River Bridge.
Figure 12b assumes that the user sets the route from the Seoul Express Terminal to the Seoul City Hall and receives the alarm after departing. The user is located within 5 km of the southern end of Banpo Bridge and 5 km away from the northern end of the Han River Bridge. Therefore, the user in Figure 12b can see that they receive a warning notification about detected obstacles from AI CCTV for the southern end of Banpo Bridge.
Figure 12c assumes that the user sets the route from the Seoul Express Terminal to the Hongik University Station and receives the alarm after departing. The user is located within 5 km of the southern end of Banpo Bridge and within 5 km of the northern end of the Han River Bridge. Therefore, the user in Figure 12c can see that they receive both warnings about obstacles detected by AI CCTV at the southern end of Banpo Bridge and warnings about car accidents detected by AI CCTV at the northern end of Han River Bridge.
Figure 12d assumes that the user is located at Gangnam Station without setting a route. The user is located within 5 km of the southern end of Banpo Bridge and 5 km away from the northern end of the Han River Bridge. Therefore, the user in Figure 11b only receives a warning notification about obstacles detected by AI CCTV for the southern end of Banpo Bridge.
Under hypothetical circumstances, obstacles found at the southern end of Banpo Bridge can be notified of warnings to users within 5 km of the southern end of Banpo Bridge and to users within 5 km of the northern end of the Han River Bridge. This virtual experiment shows that DRAS sends warning notifications to users about car accidents or obstacles detected by AI CCTV within 5 km of the user’s location or the route set by the user. The notification window displayed shows a picture about car accidents and obstacles and CCTV information.
Moreover, it can be recognized that the color has changed black to red throughout the mark of the AI CCTV where abnormalities have occurred. In Figure 12d, assuming that the current user is located in Gangnam Station, the red circle corresponds to a range of 5 km. For this reason, it can be seen from Figure 12d that only the notification of the obstacle is displayed.
3.1.2. Experiments on Notification of Accidents by Major Cities in Korea
After selecting three regions (Daegu, Gwangju, and Busan), CCTV in the area was checked, and one CCTV was selected for each region, assuming that it was AI CCTV and conducting a hypothetical experiment. A virtual experiment was conducted on the assumption that each AI CCTV had an accident in a position that could be detected. In addition, the user’s location in each region was set within 5 km of the AI CCTV location.
Figure 13a–c are pictures of abnormalities detected by CCTV at the Gundeulbawi Intersection in Daegu, Gwangcheon Bridge 1 in Gwangju, and CCTV on the Jurye ramp overpass in Busan. Assuming that the CCTV in the Daegu area is located at the Gundeulbawi Intersection and that the user is in a virtual location called Daebong Intersection, we make an assumption about the occurrence of a traffic accident at the Gundeulbawi Intersection CCTV. Daegu ranked first in the nation for the rate of traffic accidents in 2020, and the road with the most traffic accidents is the ‘Shincheon-daero’ road. Reverse driving accidents often occur, because the road is narrow and difficult to drive in [14]. The width of the road is rather narrow, and most of the roads are 4–6 lanes. There are many things that have not been managed smoothly, such as CCTV shaking, part of the CCTV screen being obscured by streetlights or other objects, or being affected by weather conditions such as sunlight. Because of these, CCTV, which is difficult to identify objects, is often observed, and the resolution is very poor.
We assumed that the accident corresponding to the Gwangju area occurred at Gwangcheon Bridge 1 and that the user is located in the Gwangju National Museum. Gwangcheon Bridge 1 is included within 5 km from the user’s location. A traffic accident video detected by AI CCTV is one of the test videos and shows the front part of the vehicle crashing. For that reason, CCTV detects an accident that occurred at Gwangcheon Bridge 1, and accident information and photos are transmitted to the user. On CCTV in Gwangju, a car accident occurred in the middle of the CCTV screen, making it easy to detect the accident. The vehicle is clearly visible, and there are no objects obstructing the view in CCTV. This helps to make object recognition easier. CCTV in Gwangju monitored a narrow area with CCTV, making it easy to detect accidents. However, if CCTV can see a large area at once, the size of the vehicle looks small, and the accident is not clearly visible, so it is not easy to detect the accident. In addition, there are cases where vehicles and roads are obscured by high-voltage lines and electric wires on CCTV showing a wide road, and there are places where resolution needs to be improved.
We assumed that the accident in Busan occurred on the Jurye ramp overpass, and the user is located on Dong-Eui University Gaya campus. Since the Jurye ramp overpass is included within 5 km of the user’s location, information and photos about the accident that occurred at the location are transmitted to the user. CCTVs in Busan are characterized by being located on roads where roads, tunnel road networks, hillside roads, and multi-lane roads intersect up to the sea as Gwangan Road [15]. Moreover, there are many cars on the road that suddenly change lanes, so it is not easy for drivers to drive because car accidents occur often. Although there are places where there is a big difference in resolution between CCTVs, the overall CCTVs’ resolution is high. CCTV located on bridges and tunnels provides images that can easily detect vehicle accidents because the viewing angle is narrow. However, since CCTVs installed on multi-lane roads like the Yeonsan intersection have a wide angle of view, it is possible to detect an accident only by enlarging the CCTV image.
As a result of carrying out an experiment using CCTV in Daegu, Busan, and Gwangju, it was found that the accuracy of vehicle accident detection results increased in CCTVs with high resolution and a narrow angle of view. If the resolution of CCTV is low, the condition of CCTV is unstable, or the viewing angle of CCTV is wide, the accuracy of AI CCTV’s accident detection decreases. The model studied in this way proved through an experiment that the service is possible even in real road conditions. This study developed a vehicle accident detection model by learning only frontal collision type traffic accidents using YOLOV3. After that, it was developed so that a notification is sent to the application when detecting abnormalities by connecting it to the server, together with the obstacle model on the road provided in advance. When an abnormality is detected using the vehicle accident detection model created on the server, the notification that appears in the application sends information about abnormalities to FCM, and images of abnormalities to HTTP post within 5 s. In addition, when abnormalities are detected in CCTV that are related to the route or within 5 km of the current location in the initial web application state, a notification is displayed for 4 s. When a notification is sent to the application, the color of the corresponding CCTV changes from black to red, and after the notification disappears, if you click the red CCTV to view the notification image, you can view the image again.
4. Discussion
In the traffic field, CCTV is installed to control traffic and collect traffic information. Experiments on virtual traffic accidents were conducted through CCTVs in each region. In Daegu, Gwangju, and Busan, CCTVs were installed in areas with frequent traffic accidents, but the resolution of the CCTV images was low. In one CCTV, the angle of view was often wide, so the vehicle was observed to be small. When applying DARS to actual road conditions, it is intended to suggest the direction and construction method for future research.
One of the objectives for this study is to improve the resolution of CCTV to identify abnormalities. In addition, on multi-lane roads, by increasing the number of CCTVs, an environment suitable for accurately detecting abnormalities can be provided by dividing the road with a wide angle of view and observing it. For the purpose of improving the quality of the deep learning model, it is necessary to devise a method for using real-world data as AI CCTV learning data. In addition, it is necessary to increase the accuracy of the model by learning the actual CCTV traffic data in Korea as an additional matter. It is possible to implement a more advanced system by using AI CCTV to know real-time abnormal situations on the road with a small number of people using AI CCTV rather than just acquiring simple traffic situation information through traffic CCTV.
First, the AI CCTV in this study is linked with national institutions, such as the Road Traffic Authority, the police, and the CCTV-integrated control center, and can control CCTVs nationwide with a minimum of manpower. According to the standards of the Ministry of Public Administration and Security, the proper number of monitors per control agent is 50, but the actual number of CCTV monitors per person is 272.88, which exceeds the appropriate standard [16]. By complementing the existing system, an effective control system can be built in case people cannot recognize everything. In addition, the police and the Road Traffic Authority can quickly identify the scene, saving lives and enabling smooth road management.
Second, GPS can improve accuracy and reliability. It is possible to quickly update information on places where secondary accidents and traffic congestion are likely to occur, so it is possible to use the shortest route by collecting information in real-time when identifying a route using GPS.
Third, autonomous vehicles can prevent secondary accidents through AI CCTV and prepare for traffic congestion in advance. Through the situation data with abnormalities, it is possible to grasp the environment around the road, the types of accidents that occur frequently by local road, etc., and it is possible to efficiently obtain the data necessary for the improvement of the traffic environment. Therefore, it is expected that it will greatly contribute to the development of the local community through the improvement of the safety of autonomous vehicles and local data.
5. Conclusions
This study builds a model that detects abnormalities on the road based on deep learning and implements an application that sends a notification to notify users of the abnormalities detected in CCTV. By sending a warning notification that an abnormality has occurred within 5 s to a user within a 5 km radius of the location where the abnormality occurred, the user can quickly obtain information. The study included the function of delivering photos about abnormal situations to users. In this process, the driver or passenger’s face and vehicle number may be leaked, because photos are stored and sent to users in the event of a traffic accident. In order to prevent personal information leakage, it is necessary to develop a blurring technology that can protect personal information by covering people’s faces and car numbers. In the case of detection through AI CCTV, in order to remove the weather and the disturbing factors in the surrounding environment, before the image is analyzed in AI CCTV, it is necessary to apply technology to improve image quality or background modeling-related technology to make it more accurate. Furthermore, it is necessary to study how to produce a more accurate model through the process of collecting a large amount of data on the CCTV shooting angle at the time of the accident, the type of accident, and the fire.
Through DRAS, users can obtain information faster than the current navigation so they can choose alternate paths or avoid accidents that already occurred or obstacles already discovered, which prevents traffic congestion and secondary accidents. It can also be combined with the field of navigation and autonomous vehicles to guide users to safe and fast routines and to contribute to the development of traffic sectors through the fast response to accidents and efficient road management by being connected with transportation institutions.
Author Contributions
Conceptualization, C.L., H.K., S.O. and I.D.; methodology, C.L., H.K., S.O. and I.D.; software, C.L. and H.K.; validation, C.L. and H.K.; formal analysis, C.L., H.K., S.O. and I.D.; investigation, C.L. and H.K.; resources, C.L., H.K., S.O. and I.D.; data curation, C.L. and H.K.; writing—original draft preparation, C.L., H.K., S.O. and I.D.; writing—review and editing, S.O. and I.D.; visualization, C.L. and H.K.; supervision, S.O. and I.D.; project administration, S.O. and I.D.; funding acquisition, I.D. All authors have read and agreed to the published version of the manuscript.
Funding
This research was supported by Hankuk University of Foreign Studies Research Fund of 2021. Also, This research was supported by the MIST (Ministry of Science, ICT), Korea, under the National Program for Excellence in SW), supervised by the IITP (Institute of Information & Communications Technology Planing & Evaluation) in 2021 (2019-0-01816).
Conflicts of Interest
The authors declare no conflict of interest.
References
- Yonhap News Agency. Available online: https://www.yna.co.kr/view/AKR20161216046700061 (accessed on 24 November 2020).
- Government Monitoring Indicators. Available online: https://www.index.go.kr/potal/main/EachDtlPageDetail.do?idx_cd=1248 (accessed on 24 November 2020).
- Kim, J.-H.; Choi, D.-H. Implementation of a Vehicle Traffic and Speed Estimation System Using Faster R-CNN. J. Korean Inst. Commun. Inf. Sci. 2019, 44, 1754–1758. [Google Scholar] [CrossRef]
- Seo, H.D.; Kim, E.M. Estimation of Traffic Volume Using Deep Learning in Stereo CCTV Image. Korea Soc. Surv. Geod. Photogramm. Cartogr. 2020, 38, 269–279. [Google Scholar]
- Jang, S.; Cho, H.; Jeong, J. Design and Implementation of A Smart Crosswalk System based on Vehicle Detection and Speed Estimation using Deep Learning on Edge Devices. J. Korea Inst. Inf. Commun. Eng. 2020, 24, 467–473. [Google Scholar]
- Song, H.; Choi, I.K.; Ko, M.S.; Lee, D.S. Life protection system development using CCTV video analysis on Deep learning. J. Soc. Disaster Inf. 2017, 2017, 327–328. [Google Scholar]
- Batonsos. Available online: https://batonsos.com/productinfo/product.html (accessed on 6 February 2021).
- Kim, D.-h. What Is the Difference between Machine Learning and Deep Learning? Coding World News. Available online: https://www.codingworldnews.com/article/view/2224 (accessed on 22 February 2021).
- Redmon, J.C. Available online: https://pjreddie.com/darknet/ (accessed on 6 February 2021).
- Firebase. Available online: https://firebase.google.com/docs/cloud-messaging?hl=ko (accessed on 6 February 2021).
- Lee, Y.H.; Kim, Y. Comparison of CNN and YOLO for Object Detection. J. Semicond. Disp. Technol. 2020, 19, 85–92. [Google Scholar]
- Redmon, J.; Divvala, S.; Girshick, R.; Farhadi, A. You only look once: Unified, real-time object detection. In Proceedings of the 29th IEEE Conference on Computer Vision and Pattern Recognition, Las Vegas, NV, USA, 7–30 June 2016; IEEE: New York, NY, USA, 2016; pp. 779–788. [Google Scholar]
- Redmon, J.; Farhadi, A. YOLOv3: An Incremental Improvement; University of Washington: Washington, DC, USA, 2018; pp. 1–4. [Google Scholar]
- Lee, Y.J. ‘Shincheon-Daero of Fear’ Repeated Reverse Run, There Was a Reason. YTN. Available online: https://www.ytn.co.kr/_ln/0115_201901070043258624 (accessed on 7 January 2019).
- Lim, S. Why Are the Roads in Busan Complicated? Dau Media Center: Fort Belvoir, VA, USA; Available online: http://dongan.dau.ac.kr/news/articleView.html?idxno=3439 (accessed on 10 February 2021).
- Walton, M.; Zhang, Z.; Boyles, S.; Caldas, C.; Barnes, W. Developing A Real-time Freeway Incident Detection Model Using Machine Learning Techniques, Real-Time, Field Data, Machine Learning, and Incident Duration; University of Texas at Austin: Austin, TX, USA, 2016; pp. 1–2. [Google Scholar]
Figure 1.
Traffic congestion costs by year.

Figure 2.
Service overview.

Figure 3.
Flow chart about the detection model and the DRAS alarm system.

Figure 4.
YOLO Network.

Figure 5.
YOLOV3 performance comparison.

Figure 6.
System Architecture.

Figure 7.
(a) An image of a traffic accident detected; (b) an image of an obstacle located on the road detected.
Figure 7.
(a) An image of a traffic accident detected; (b) an image of an obstacle located on the road detected.

Figure 8.
(a) Web Application Startup Web Page; (b) Web page when ’Find Paths’ is pressed; (c) Web page when path is entered; (d) Web page when CCTV mark is pressed.
Figure 8.
(a) Web Application Startup Web Page; (b) Web page when ’Find Paths’ is pressed; (c) Web page when path is entered; (d) Web page when CCTV mark is pressed.

Figure 9.
Example of a map used in an experiment.

Figure 10.
(a) image of car accident; (b) image of obstacles on the road.

Figure 11.
(a) CCTV notification window at the northern end of Han River Bridge; (b) CCTV notification window at the southern end of Banpo Bridge.
Figure 11.
(a) CCTV notification window at the northern end of Han River Bridge; (b) CCTV notification window at the southern end of Banpo Bridge.

Figure 12.
(a) The route from Dongjak Station to Hongik University Station; (b) the route from Seoul Express Bus Terminal to Seoul City Hall; (c) the route from Seoul Express Bus Terminal to Hongik University Station; (d) an image that shows that the user located at Gangnam Station has received a notification.

Figure 13.
(a) Accident detected by CCTV at the Gundeulbawi Intersection in Daegu; (b) accident detected at Gwangcheon Bridge 1 in Gwangju; (c) accident detected on the Busan Jurye Ramp Overpass.
Figure 13.
(a) Accident detected by CCTV at the Gundeulbawi Intersection in Daegu; (b) accident detected at Gwangcheon Bridge 1 in Gwangju; (c) accident detected on the Busan Jurye Ramp Overpass.


Table 1.
Existing product comparison table.
| BATON SOS | Mapper’s ATLAN | DRAS | |
|---|---|---|---|
| Do you need manpower to detect an accident? | O | O | X |
| The 9-axis detection sensor judges the presence or absence of an accident or receives a report when you press the button 3 times. | When detected by VDS (vehicle detection system), a notification is sent to the traffic control room operator to confirm the actual accident via CCTV. | It is possible to detect traffic accidents using a traffic accident detection model using deep learning through CCTV without human power. | |
| Does it go through the control center to send an alarm? | O | O | X |
| Priority notification to 911 or emergency dispatch insurance company after detection. | The collected information is transmitted in real-time from the Korea Highway Corporation Transportation Center and it is checked whether there was an accident through CCTV. | If an abnormality is detected on the road, notifications are sent directly to the user application using the FCM without the control center. | |
| Do you need individual hardware? | O | X | X |
| Hardware for connecting to a cigar jack or USB port. | Mobile phone application or car navigation. | We only need mobile phone applications without extra hardware. | |
| Does it take more than 1 min for the alarm to be sent after detection? | X | X | X |
| Report to 911 or emergency dispatch insurance company after a 30 s grace period after the detection of a shock. | Up to 1 min | If an anomaly is detected on the road, a notification will be sent to the application in at least 5 seconds. |
Table 2.
Development terms.
| Category | Items |
|---|---|
| Image acquisition and analysis | OpenCV, FFmpeg |
| Deep learning (image processing) | YOLOV3, DarkNet |
| Server-client | HTTPRequest, FCM |
| Server | Django, Flask |
| UI/UX | Figma, Axure |
| API | Web app, Naver Map API, Google Map API |
| Web hosting | PythonAnywhere |
| Programming language | Python, HTML, Javascript |
Table 3.
Comparison of backbones.
| Backbone | Top-1 | Top-5 | Bn Ops | BFLOP/s | FPS |
|---|---|---|---|---|---|
| Darknet-19 | 74.1 | 91.8 | 7.29 | 1246 | 171 |
| ResNet-101 | 77.1 | 93.7 | 19.7 | 1039 | 53 |
| ResNet-152 | 77.6 | 93.8 | 29.4 | 1090 | 37 |
| Darknet-53 | 77.2 | 93.8 | 18.7 | 1457 | 78 |
Table 4.
One-stage methods and two-stage methods AP.
| Backbone | AP | AP50 | AP75 | APS | APM | APL | |
|---|---|---|---|---|---|---|---|
| Two-Stage Methods | |||||||
| Faster R-CNN+++ | ResNet-101-C4 | 34.9 | 55.7 | 37.4 | 15.6 | 38.7 | 50.9 |
| Faster R-CNN w FPN | ResNet-101-FPN | 36.2 | 59.1 | 39.0 | 18.2 | 39.0 | 48.2 |
| Faster R-CNN by G-RMI | Inception- ResNet-v2 | 34.7 | 55.5 | 36.7 | 13.5 | 38.1 | 25.0 |
| Faster R-CNN w RDM | Inception- ResNet-v2-TDM | 36.8 | 57.7 | 39.2 | 16.2 | 39.8 | 52.1 |
| One-Stage Methods | |||||||
| YOLOV2 | DarkNet-19 | 21.6 | 44.0 | 19.2 | 5.0 | 22.4 | 35.5 |
| SSd513 | ResNet-101-SSD | 31.2 | 50.4 | 33.3 | 10.2 | 34.5 | 49.8 |
| DSSD513 | ResNet-101-DSSD | 33.2 | 53.3 | 35.2 | 13.0 | 35.4 | 51.1 |
| RetinaNet | ResNet-101-FPN | 39.1 | 59.1 | 42.3 | 21.8 | 42.7 | 50.2 |
| RetinaNet | ResNeXt-101-FPN | 40.8 | 61.1 | 44.1 | 24.1 | 44.2 | 51.2 |
| YOLOV3 608 608 | Darknet-53 | 33.0 | 57.9 | 34.4 | 18.3 | 35.4 | 41.9 |
Publisher’s Note: MDPI stays neutral with regard to jurisdictional claims in published maps and institutional affiliations. |
© 2021 by the authors. Licensee MDPI, Basel, Switzerland. This article is an open access article distributed under the terms and conditions of the Creative Commons Attribution (CC BY) license (https://creativecommons.org/licenses/by/4.0/).
Share and Cite
MDPI and ACS Style
Lee, C.; Kim, H.; Oh, S.; Doo, I. A Study on Building a “Real-Time Vehicle Accident and Road Obstacle Notification Model” Using AI CCTV. Appl. Sci. 2021, 11, 8210. https://0-doi-org.brum.beds.ac.uk/10.3390/app11178210
AMA Style
Lee C, Kim H, Oh S, Doo I. A Study on Building a “Real-Time Vehicle Accident and Road Obstacle Notification Model” Using AI CCTV. Applied Sciences. 2021; 11(17):8210. https://0-doi-org.brum.beds.ac.uk/10.3390/app11178210
Chicago/Turabian StyleLee, Chaeyoung, Hyomin Kim, Sejong Oh, and Illchul Doo. 2021. "A Study on Building a “Real-Time Vehicle Accident and Road Obstacle Notification Model” Using AI CCTV" Applied Sciences 11, no. 17: 8210. https://0-doi-org.brum.beds.ac.uk/10.3390/app11178210
Note that from the first issue of 2016, this journal uses article numbers instead of page numbers. See further details here.