
Assessment of Partial Discharges in the Air by Application of Corona Camera


Faculty of Electrical Engineering, Automatic Control and Informatics, Opole University of Technology, Proszkowska 76, 45-758 Opole, Poland
*
Author to whom correspondence should be addressed.
Appl. Sci. 2021, 11(18), 8595; https://0-doi-org.brum.beds.ac.uk/10.3390/app11188595
Submission received: 9 August 2021
/
Revised: 8 September 2021
/
Accepted: 14 September 2021
/
Published: 16 September 2021
(This article belongs to the Special Issue Applications and Protections of High Voltage Power)
Abstract
:This paper reports the results of the analysis of measurements involving partial discharges (PD) occurring in the air using a corona camera (UV camera). The measurements were carried out in laboratory conditions and applied two electrode systems: needle–needle and needle–plate, in order to obtain various electric field distributions. The measurements of PDs, including a variety of alternatives, were carried out using a portable UV camera, taking into account the impact of the camera gain parameter and its distance from the PD sources. As a result, some important regularities and characteristics were identified that could significantly affect the ability to assess PDs by application of UV camera measurements. In addition, the results obtained can be employed for non-invasive diagnostic measurements performed on working power equipment and may be useful in further work on standardizing the result interpretation method obtained from measurements using a UV camera.
1. Introduction
The detection, measurement and location of partial discharges (PD) without interfering in the normal operation of high voltage power equipment provides considerable diagnostic opportunities. This applies particularly to the assessment of their insulation systems’ performance. Early detection and analysis of PDs offers an early identification of faults that have developed in insulation systems [1,2,3].
The use of specific diagnostic methods for PD detection depends on whether there are discharges occurring inside the insulation or discharges occurring in the air or on the surface of the insulation systems [4,5,6,7,8]. For detection and measurement purposes involving internal PDs, electrical methods are appropriate, consisting mainly of measuring their apparent charge Qp [9,10]. The acoustic method is also used, based on the measurement of the acoustic signal generated by the PDs [11,12,13,14] and the chromatographic method (DGA) that is applied to identify by-products of insulation failure resulting from the effects of PDs [15,16,17,18]. These methods are mainly used for diagnostics of faults found in the isolation of large power transformers and high voltage cables.
The second group of PDs involves examples that occur in the air or on the surfaces of solid dielectrics in the gas environment. Examples of installations that may have this type of PD include power line insulators and numerous spark gaps installed in power stations. In the insulation systems of these devices, there is always a non-uniform distribution of the electric field, which in turn is related to the occurrence of PDs [19]. This issue also applies in power circuits such as power modules [20].
Research is also being conducted into a method of estimating the level of PDs on the basis of radiometric measurements and linking the emitted power to the intensity of registered PDs [21]. Appropriate algorithms for locating PD sources based on analysis of the received signal strength are also being developed [22].
The classic parameters characterizing PDs include their characteristic voltages: corona voltage Vo, sparking voltage Vs. and breakdown voltage Vb. However, the visual and acoustic methods of determining these voltages are inaccurate, as they depend on a variety of external factors; therefore, they can be applied only for approximate technical evaluation of diagnosed insulation systems [23].
Use of a UV camera is increasingly important in monitoring various types of environmental parameters, e.g., in atmospheric science, volcanology and surface smoothness measurements [24,25,26]. Dual-band imaging in visible light and UV range can also detect and locate corona discharge sites [27]. For these reasons, UV cameras are increasingly being employed in the diagnostics of air insulation systems for the precise and objective determination of these voltages. In the literature, they are also referred to as corona cameras [28,29,30]. They can be employed for the detection of PDs occurring in high-voltage elements of power equipment throughout their normal operation. UV cameras also allow the assessment of the levels of PDs expressed in terms of the registered count of UV impulses.
Additionally, mobile solutions with a UV camera for the inspection of power lines, which are based on unmanned aerial vehicles (UAVs), are already being developed and implemented [31,32].
Unfortunately, the number of UV impulses registered in this way, which characterize the PDs, depends not only on the intensity of discharges but also on external conditions. The list of them includes:
- adopted level of signal gain set on a camera,
- distance between the camera and source of partial discharge.
The identification of the impact of these factors on the recorded values of UV emissions forms is the subject area discussed in this paper.
2. Measurement System, Characteristics of UV Cameras, Measurement Range
Measurements were conducted in the Laboratory of High Voltages using a standard high voltage cell. The experimental system comprised a control panel and a single-phase test transformer with an upper voltage of 110 kV. The test transformer also included a protective resistor. PDs were generated on prepared spark gaps, which consisted of a system of two electrodes. Spark gap was supplied with alternating voltage (AC). The voltage supplying the spark gap was measured on the high voltage side using an electrostatic voltmeter. All measurements were taken and recorded in daylight, without obscuring the area of the laboratory.
The UV DayCor Superb UV camera was applied for the measurement and registration of ultraviolet radiation originating from the formed PDs (Figure 1). The camera was installed on a tripod. Its distance from the source was controlled in accordance with the adopted course of the measurement schedule.
This camera can be employed for monitoring of PDs found on insulators, in intermediate, high and ultra-high voltage power lines. The measurement principle is based on the use of the count of total of impulses generated by light detectors. The camera has built-in detectors that register photons within two radiation ranges: UV (250–280) nm and in the visible light range (380–780) nm. The camera counts the number of photons emitted by PDs and as a result displays the average value of the number of counts over a period of about 5 s. The gain parameter can be adjusted from 0 to 250 with gradation in steps of 10. The camera software carries out an overlap of the count with the number of photons in the UV radiation range on the photograph with the image of the source of PDs. The photo is taken using a standard CCD matrix that is sensitive to visible light. After merging both images, a precise image with the intensity of PDs is created that is visible on the examined sources of PDs. The second part of the image takes the form of a photograph with the examined object in the daylight. The camera lens and optical filter used in the camera are optimized to visualize the effect of PDs, along with the surrounding background in the visible light.
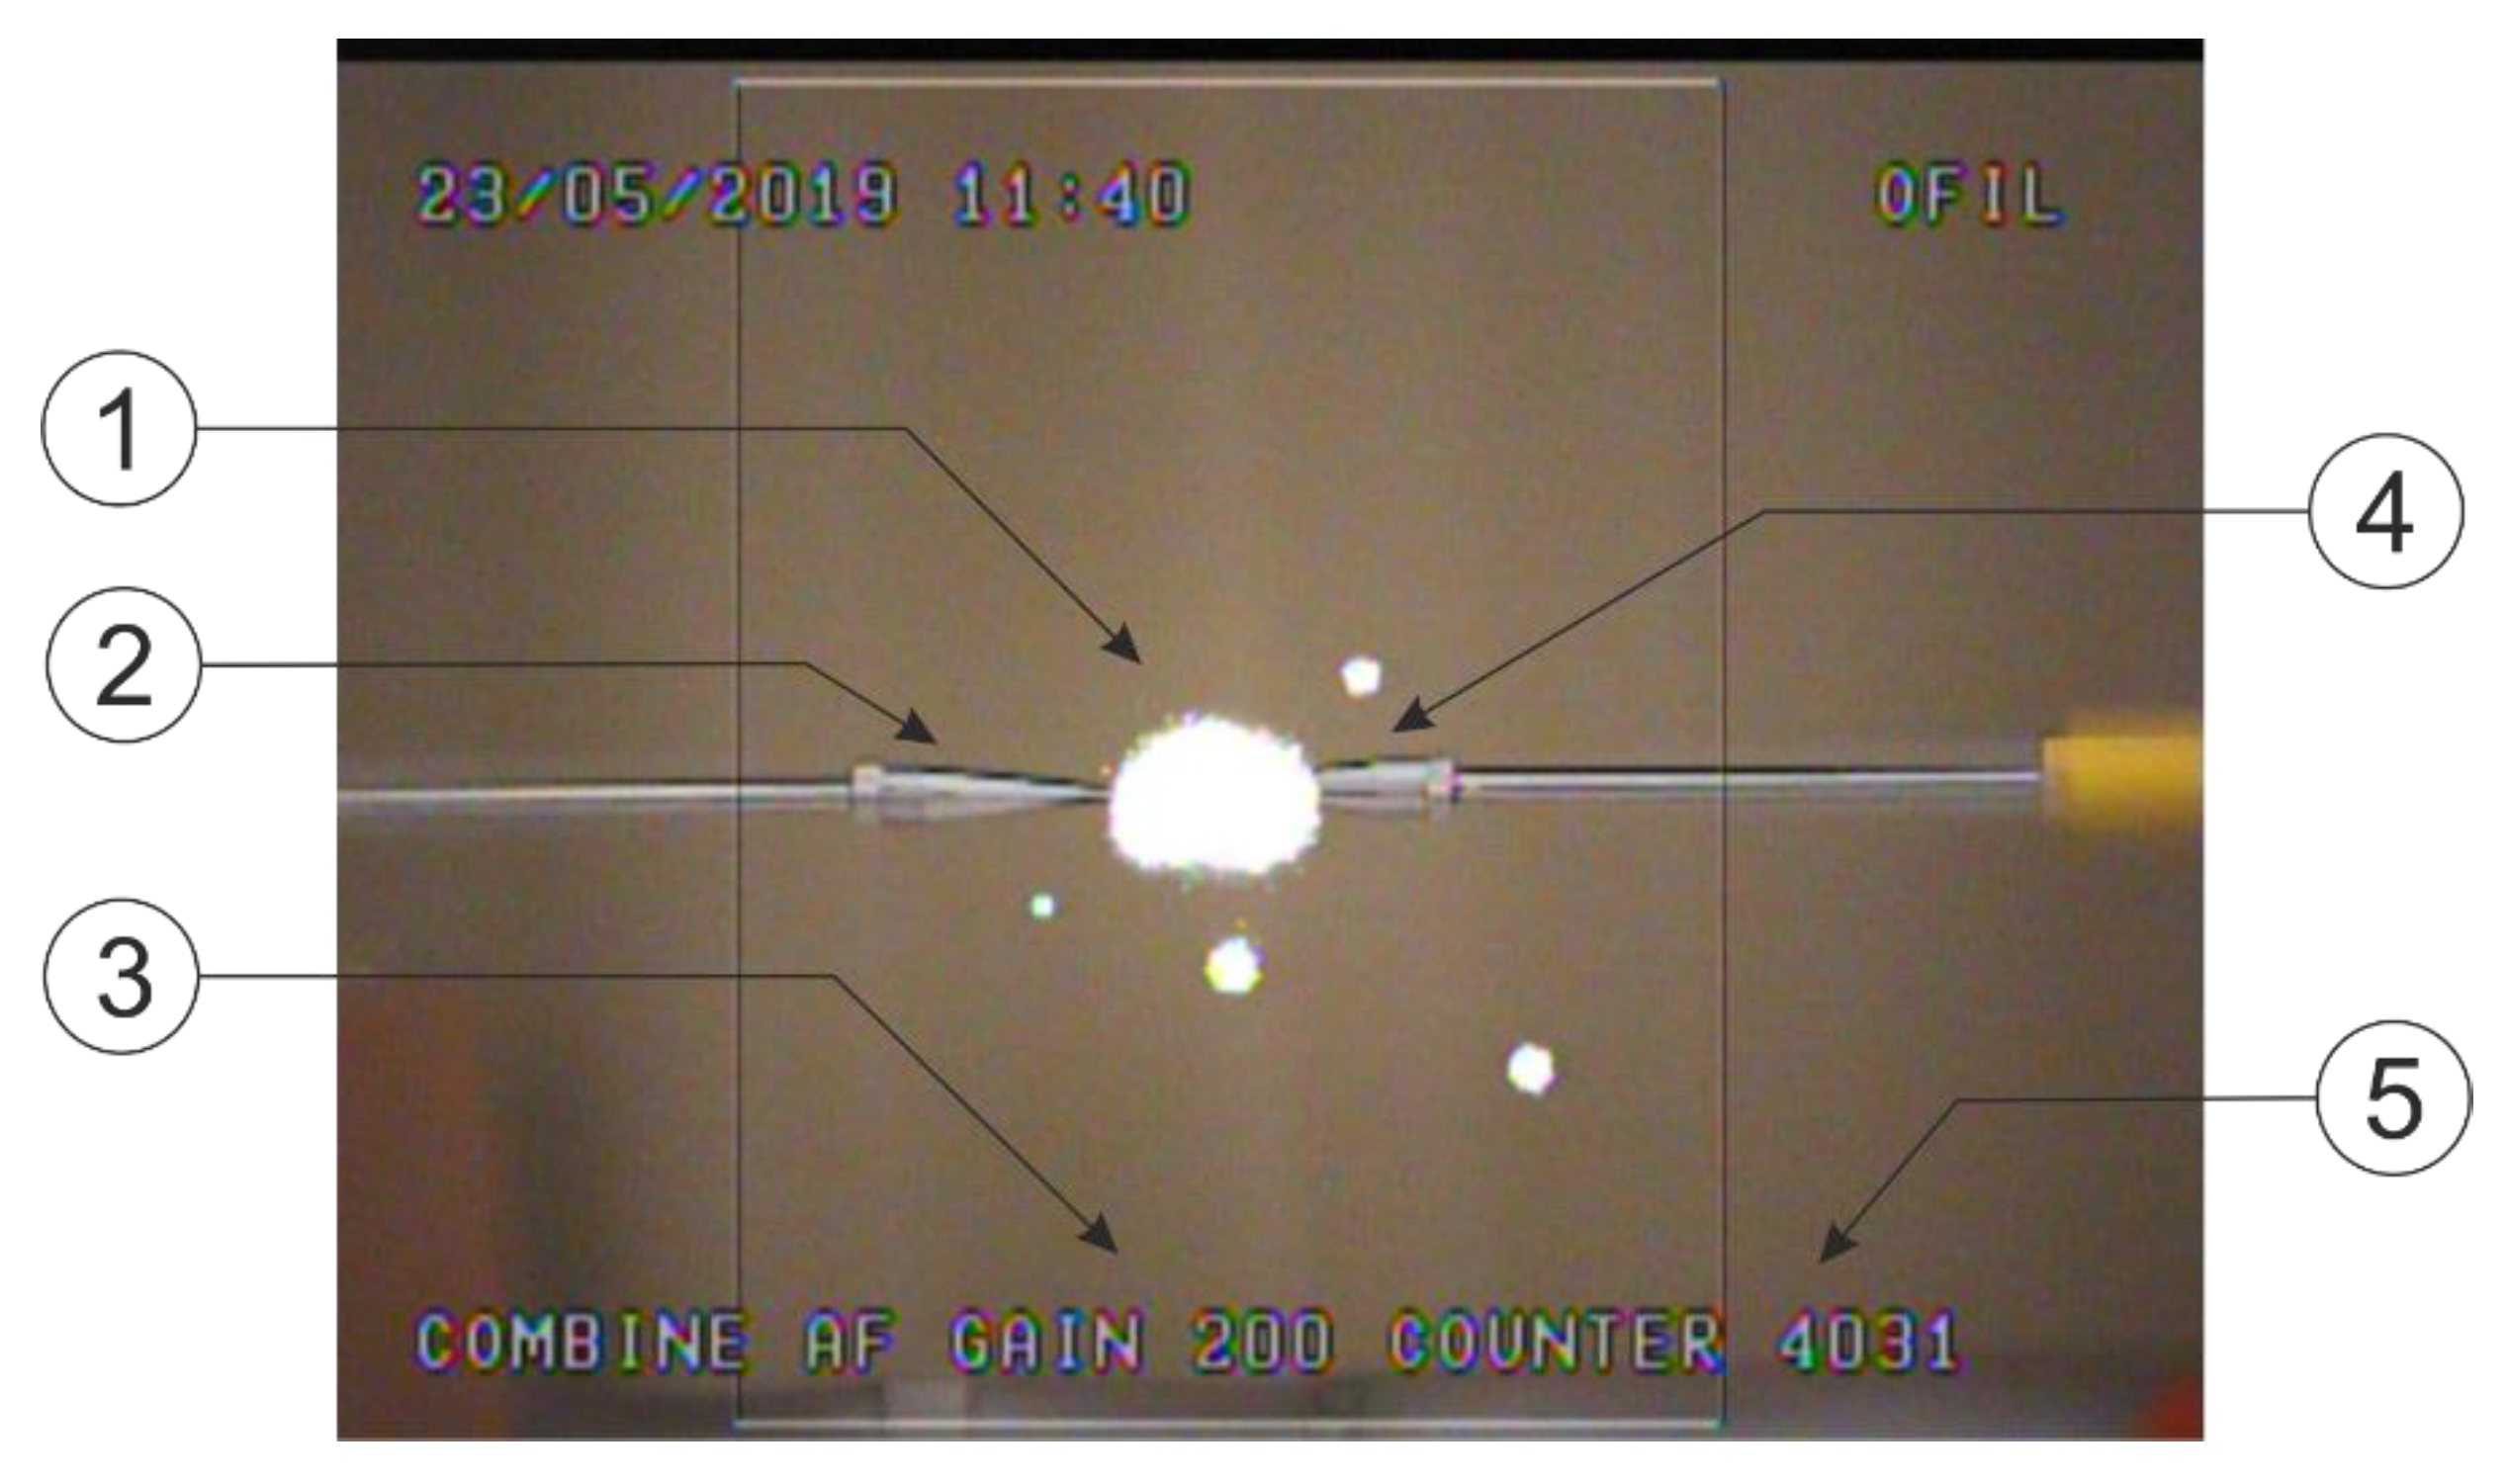
The images of phenomena occurring during measurements are displayed online on a color LCD screen, following by recording them and a subsequent analysis carried out in order to interpret the phenomena. Figure 2 shows a photo of the camera screen with the recorded image of signals generated on the basis of the emission spectra of PDs. The signals originate from the PDs generated in the needle—needle spark gap.
Table 1 contains a summary of the principal technical parameters of the DayCor Superb camera that were applied throughout the measurements.
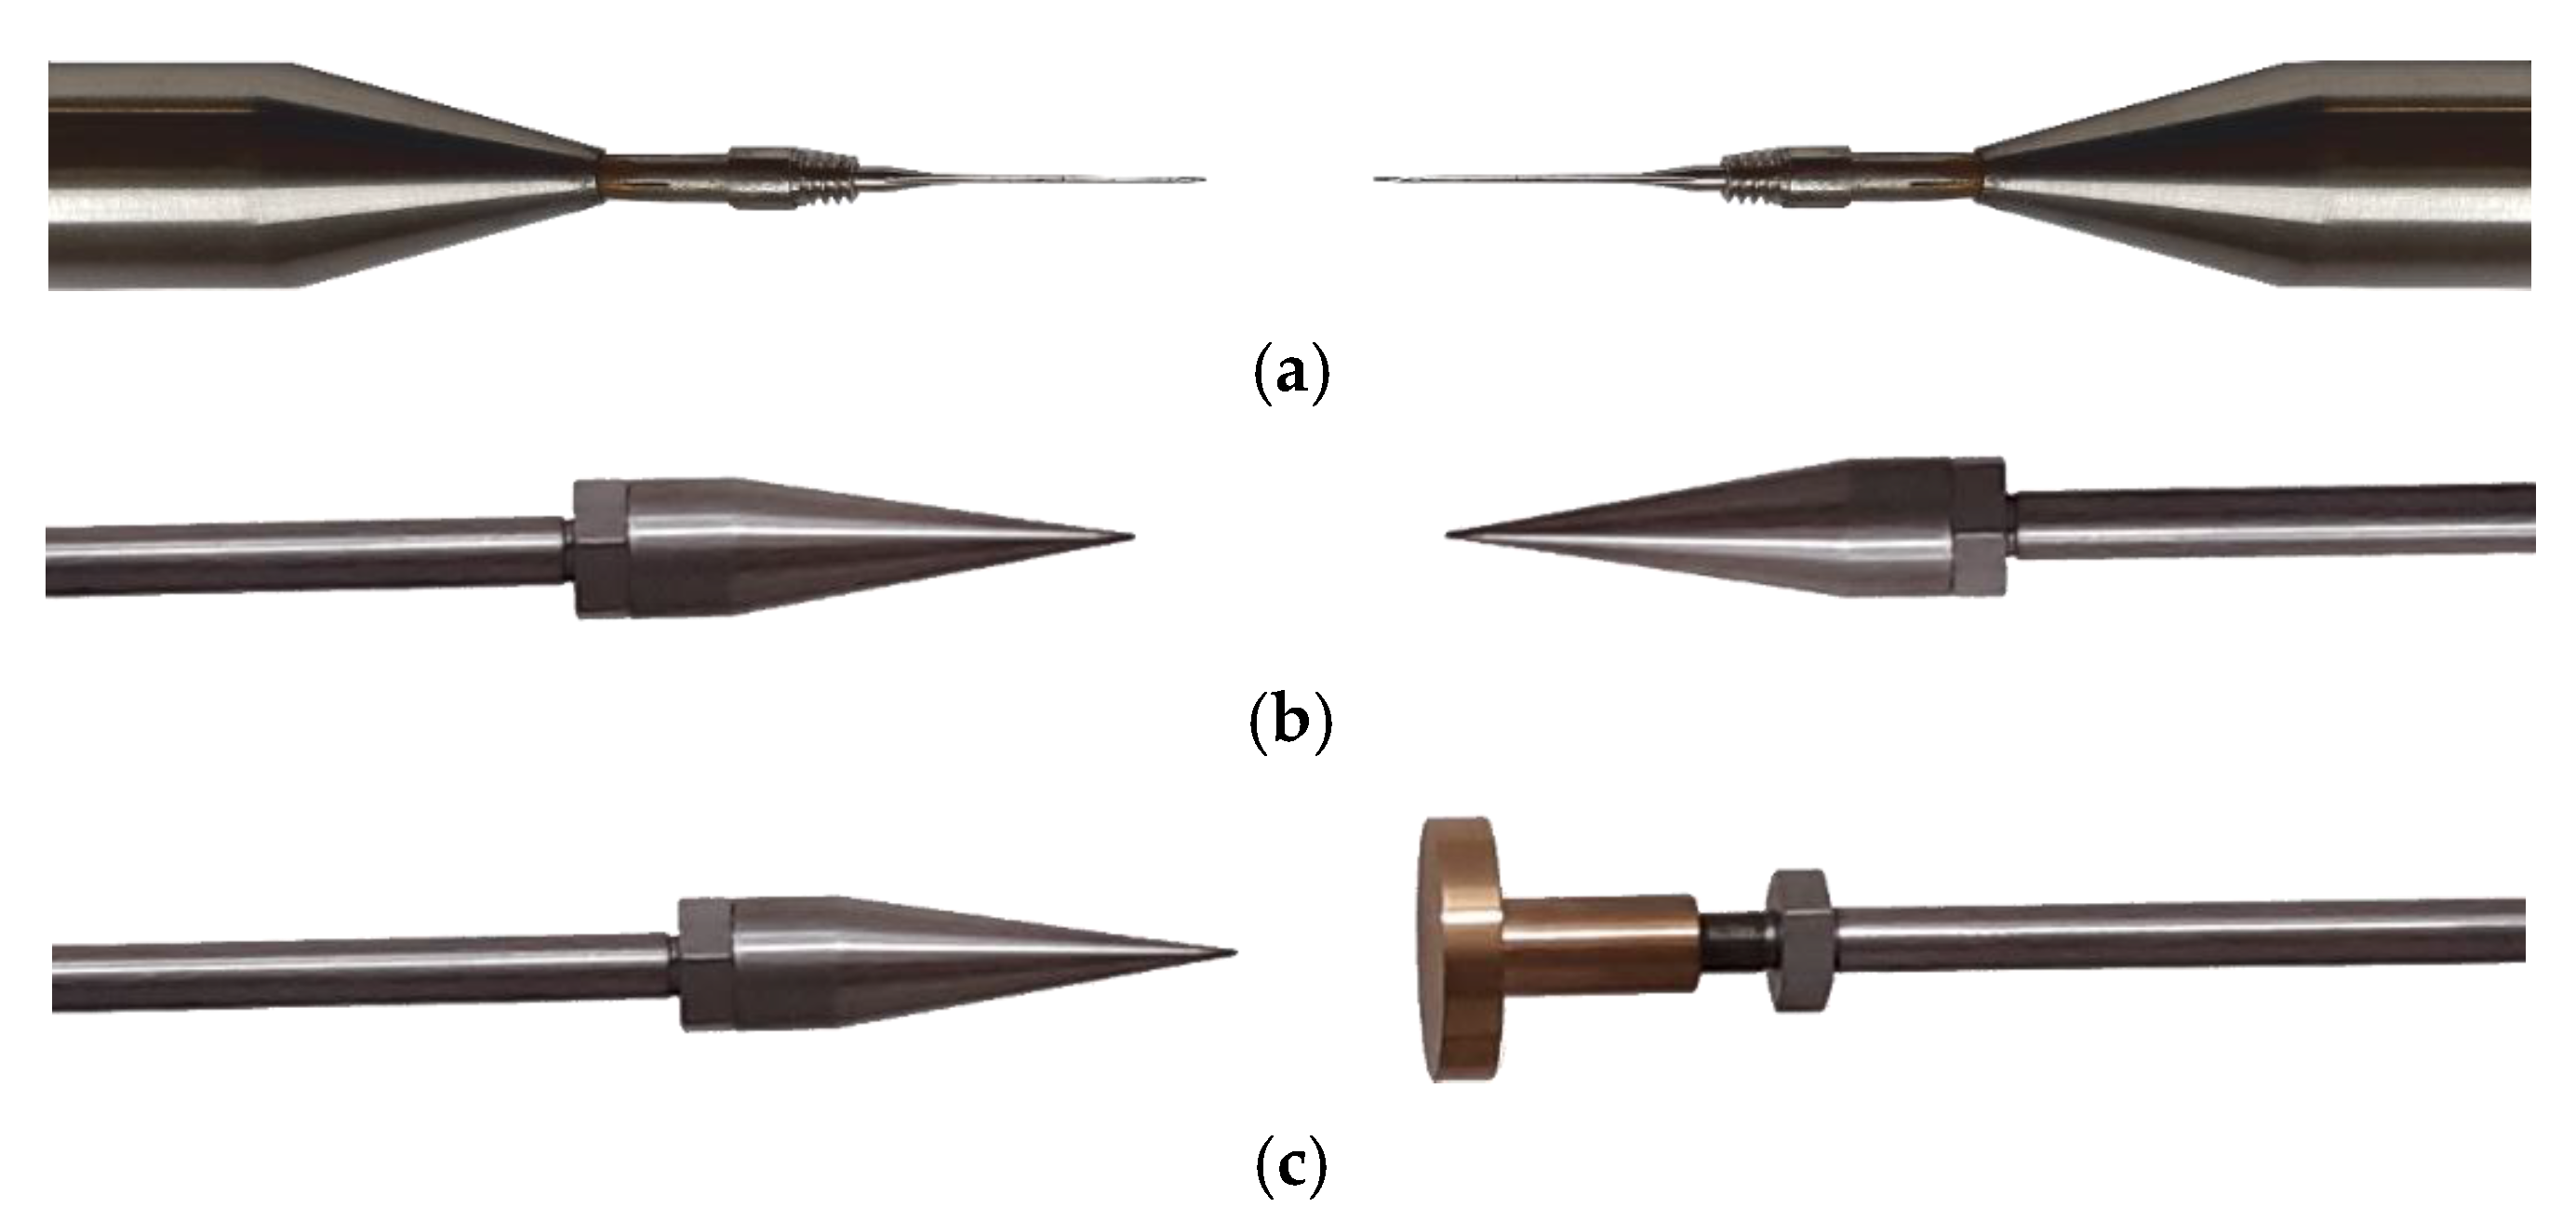
The measurements involved emission spectra of PDs generated in two types of spark gaps: needle–needle and needle–plate. Three types of thin electrodes with the diameters of 0.23 mm, 0.40 mm and 0.50 mm and a spark gap with conical electrodes with a needle angle of α = 20° were applied in the needle spark gaps. The electrode systems adopted for the study generate non-uniform distribution of the electric field. Needle–needle electrode systems can be adopted as a point fault model and a needle–plate system can model a point fault with a grounded surface (e.g., in the case of a high voltage device).
The measurements involved three types of tests. The first was concerned with the measurement of the number of UV impulses emitted as PDs, and generated in the needle –needle system, as a function of PD generation voltage. For these purposes, thin needle spark gaps with three diameters were applied (Figure 3a) in the measurements: 0.23 mm, 0.40 mm and 0.50 mm.
The second type of measurement involved the determination of the effect of camera gain factor, distance between the camera and the source of PDs and the voltage value of the spark gap on the magnitude of the signals emitted by UV radiation originating from and generated in the needle spark gap with cone electrodes, for an angle of α = 20° (Figure 3b).
The third type of measurements was performed for PDs generated in the conical nee-dle (α = 20°)–plate spark gap (Figure 3c). The purpose of this experiment involved the determination of the effect of camera gain, distance of the camera from the PD’s source and the supply voltage of such a spark gap on the value of the signals emitted as UV radiation originating from PDs.
3. Results of Measurements of Number of UV Impulses Generated by PDs in Needle Spark Gaps in the Function of the Generation Voltage
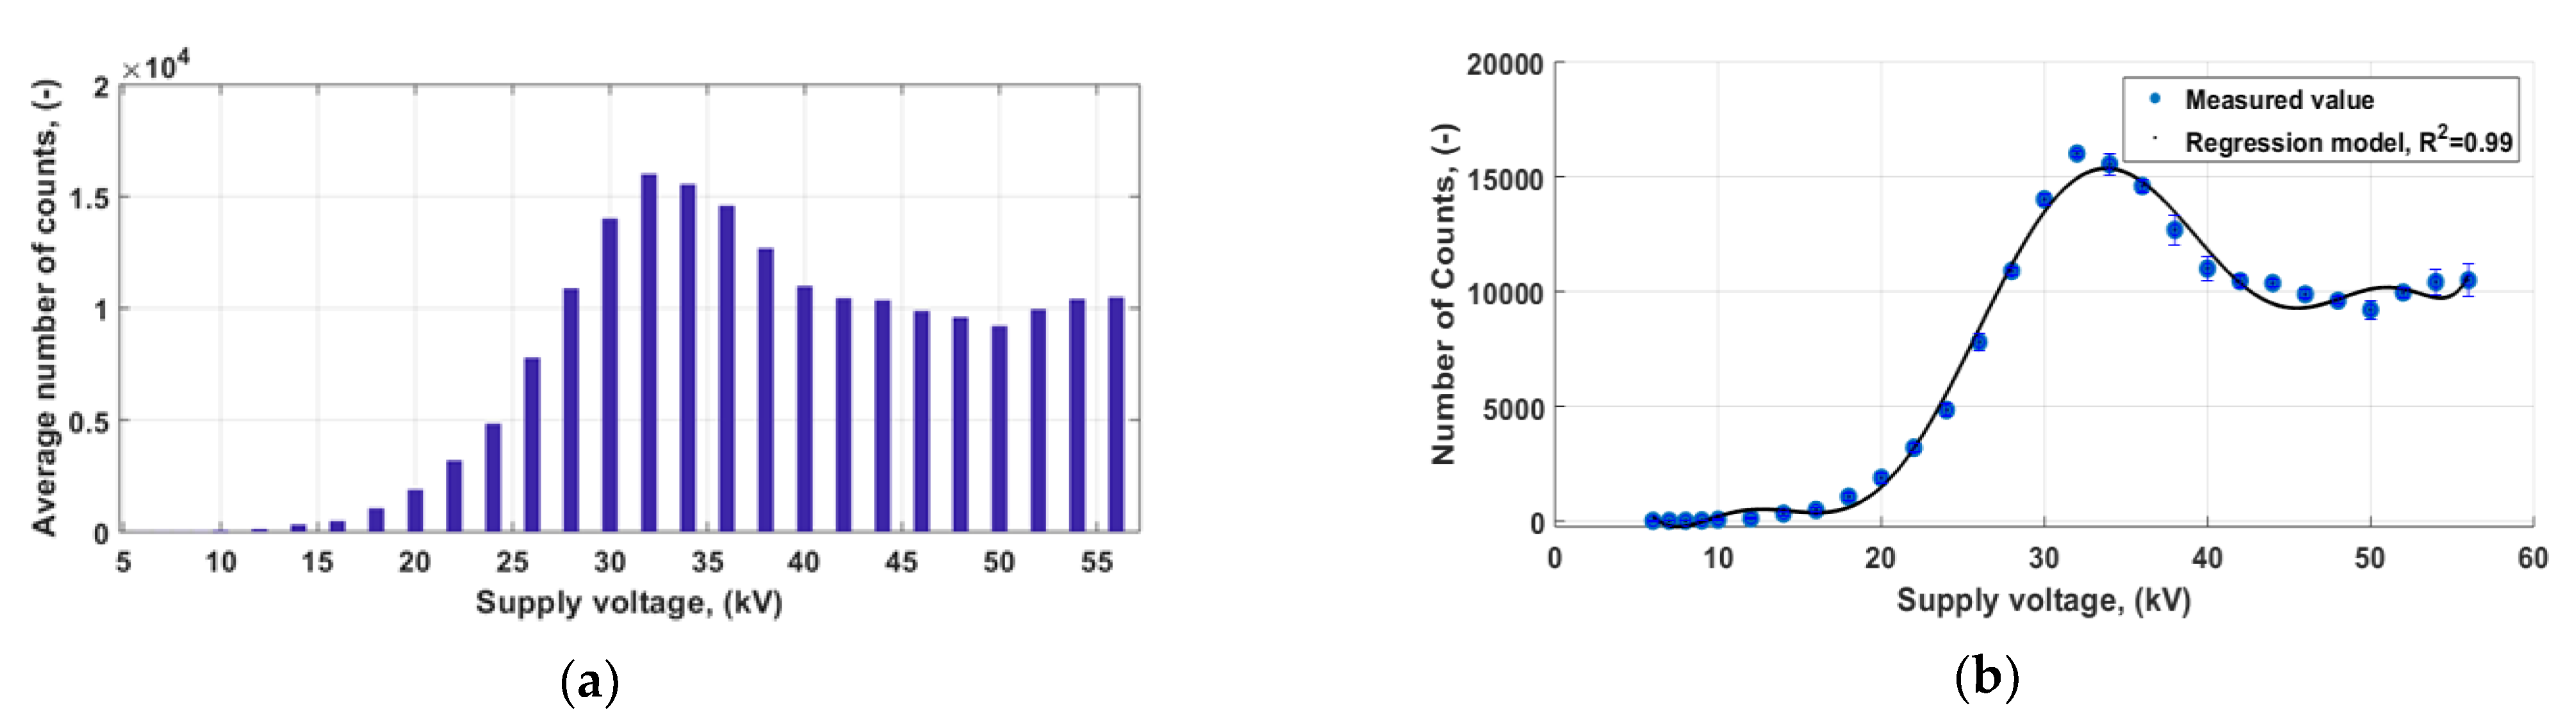
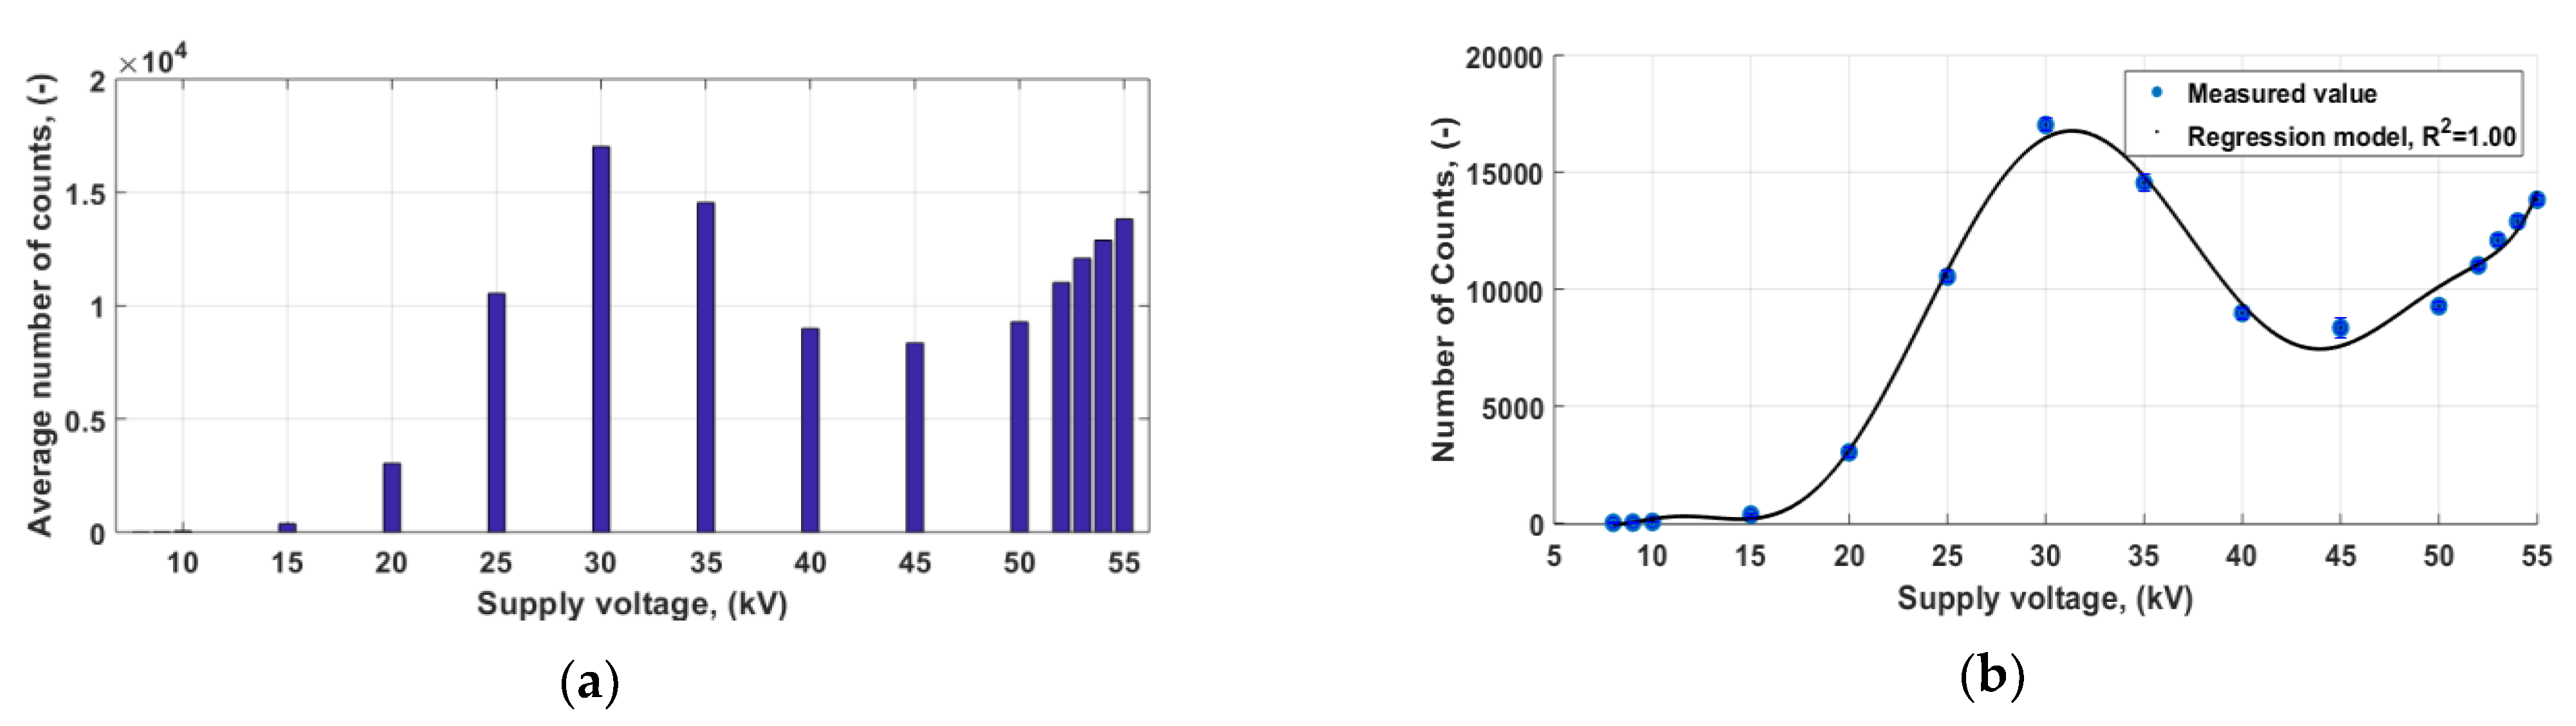
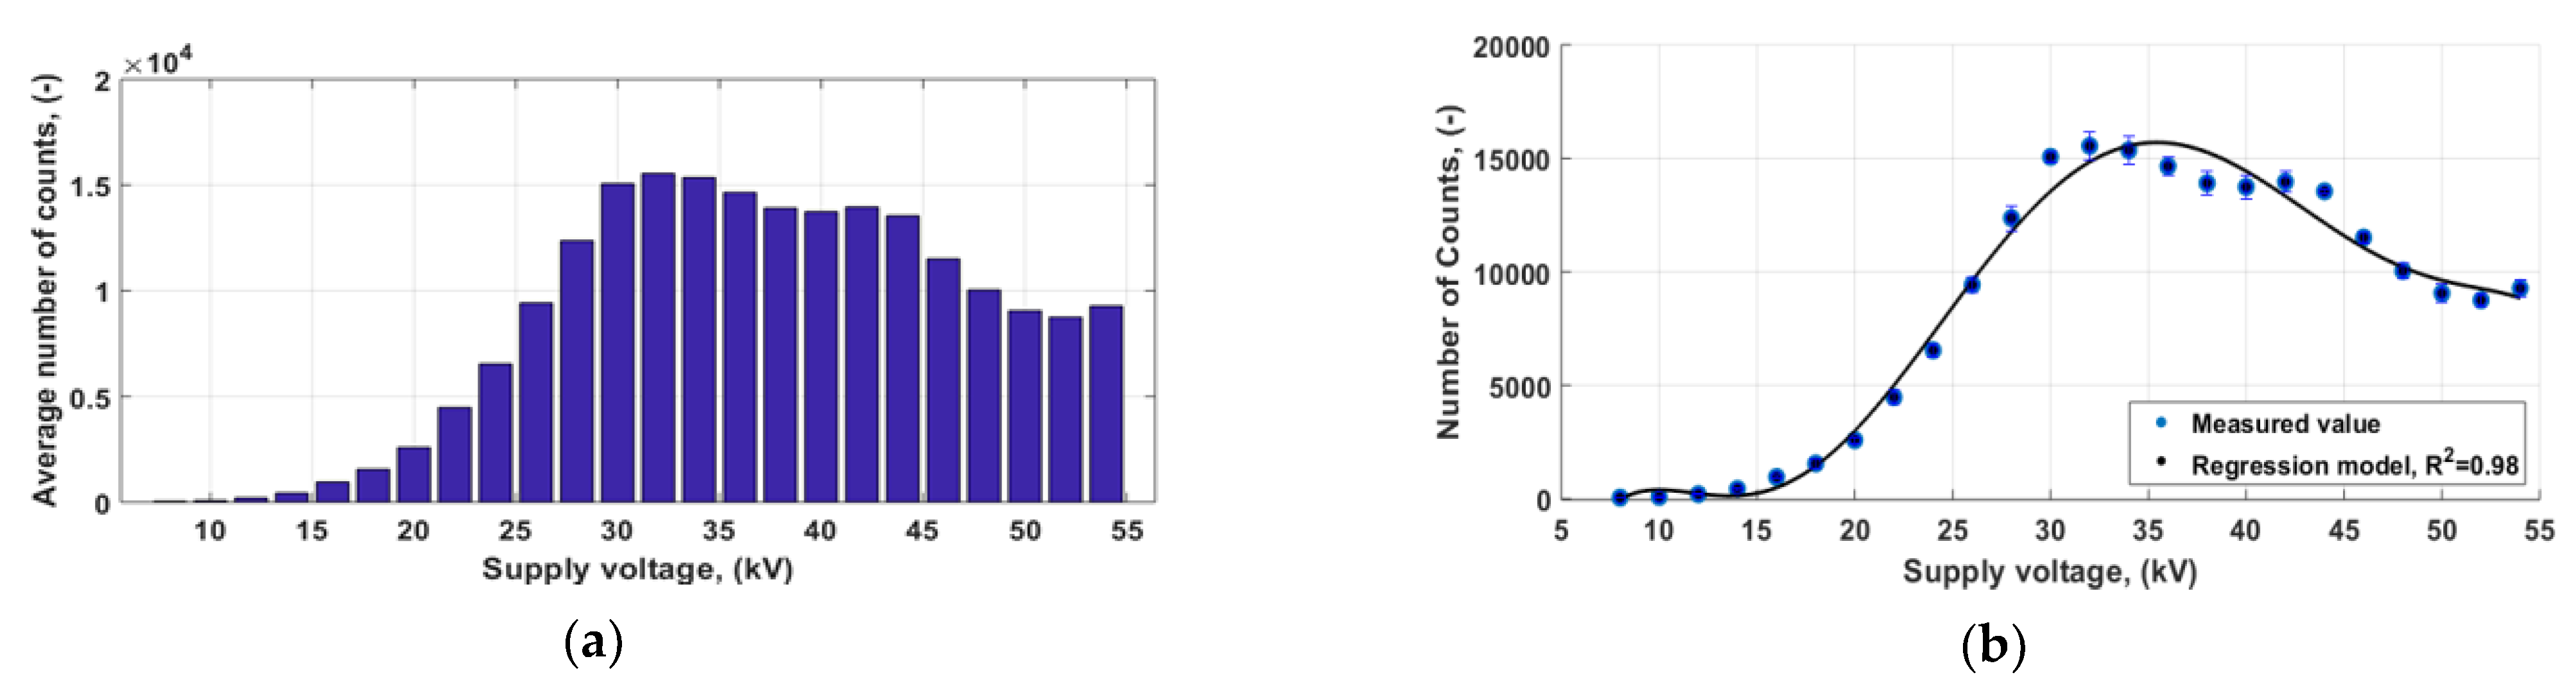
Figure 4, Figure 5 and Figure 6 demonstrate the characteristics of the mean distribution represented by the number of counts of UV impulses originating from PDs as a function of voltage delivered to the needle electrodes. Needle spark gaps with three diameters of 0.23 mm, 0.40 mm and 0.50 mm were applied for the purposes of PD generation. In each of the spark gaps, the distance between the electrodes was constant during measurements and was equal to 8 cm. The values of the breakdown voltage Vb in the spark gap were equal to 65.98 kV, 58.75 kV and 60.29 kV, respectively. The value of the generation voltage of PDs was varied stepwise by increments of 5 kV, in the range of values from 5 kV to 55 kV. The distance between the camera and the source of PDs was constant and maintained at 160 cm, the camera gain was also constant and equal to 100.
For better interpretation of the presented characteristics with the obtained results, a trend model marked as the fit curve was used. This model was determined using typical interpolation techniques available in the MATLAB environment (smoothing spline interpolation method).
4. Effect of Camera Gain and Distance from the PD Source and Generation Voltage on the Registered Count of UV Impulses Determined for Needle Spark Gap
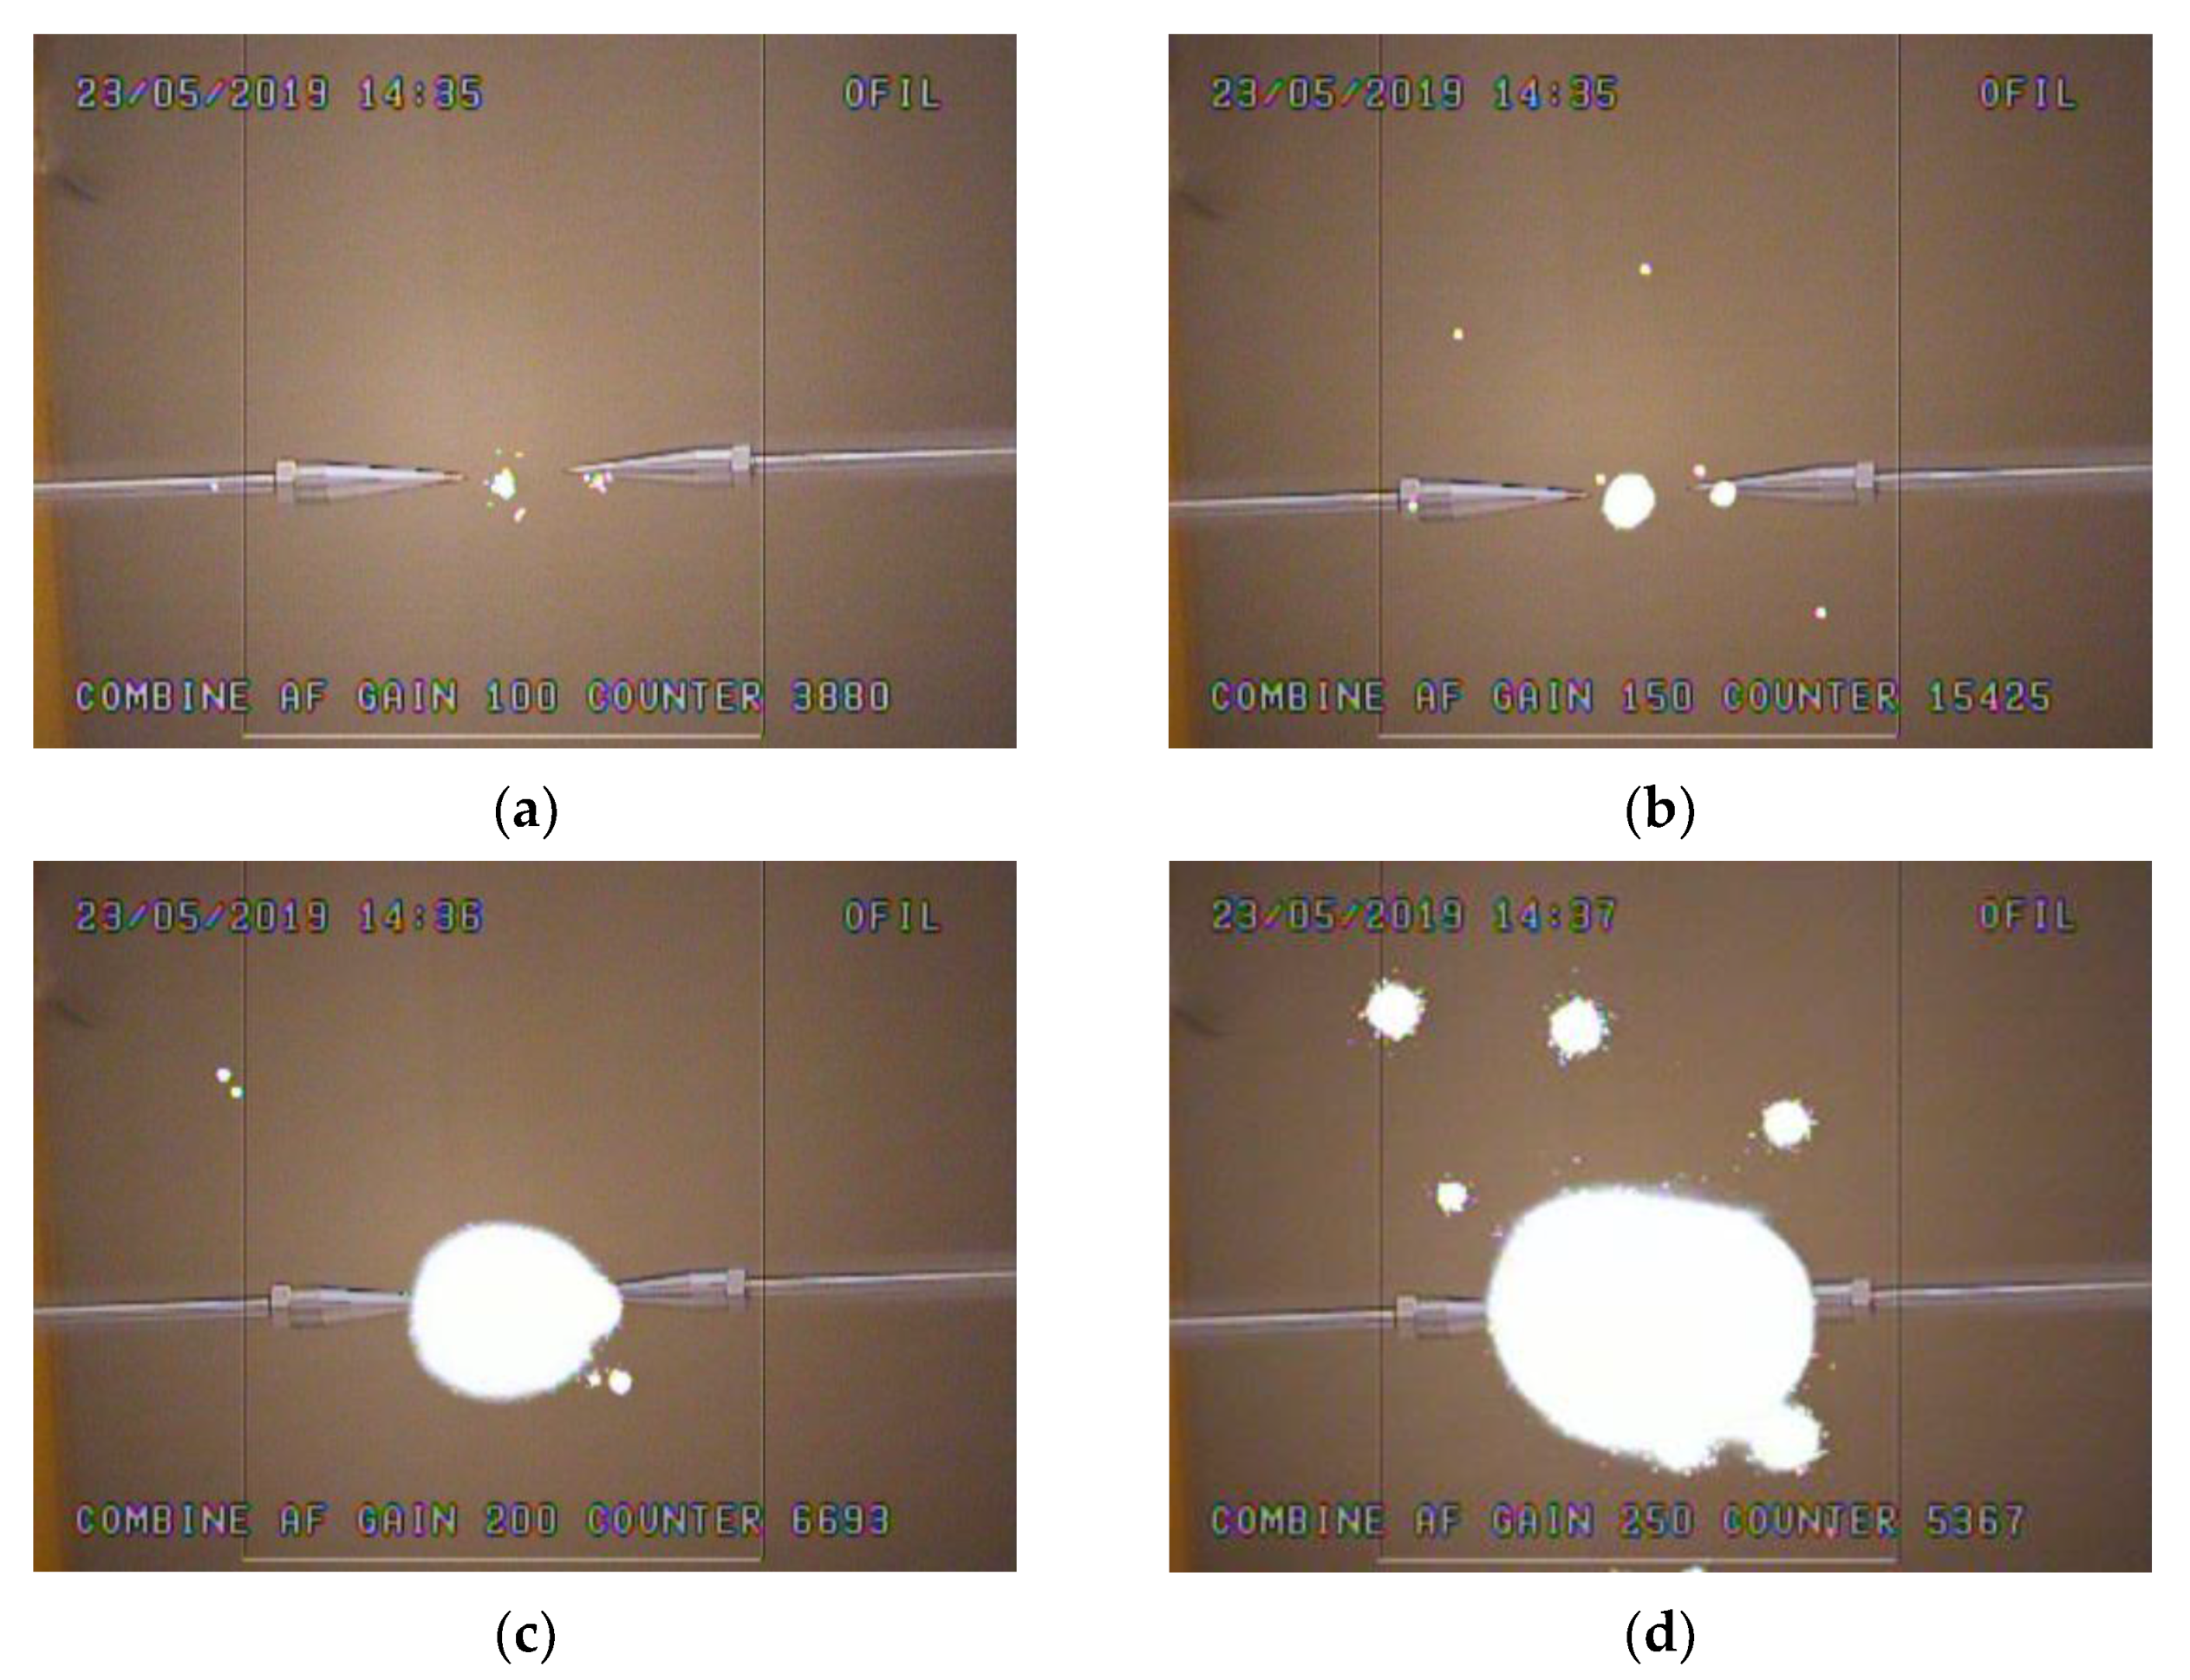
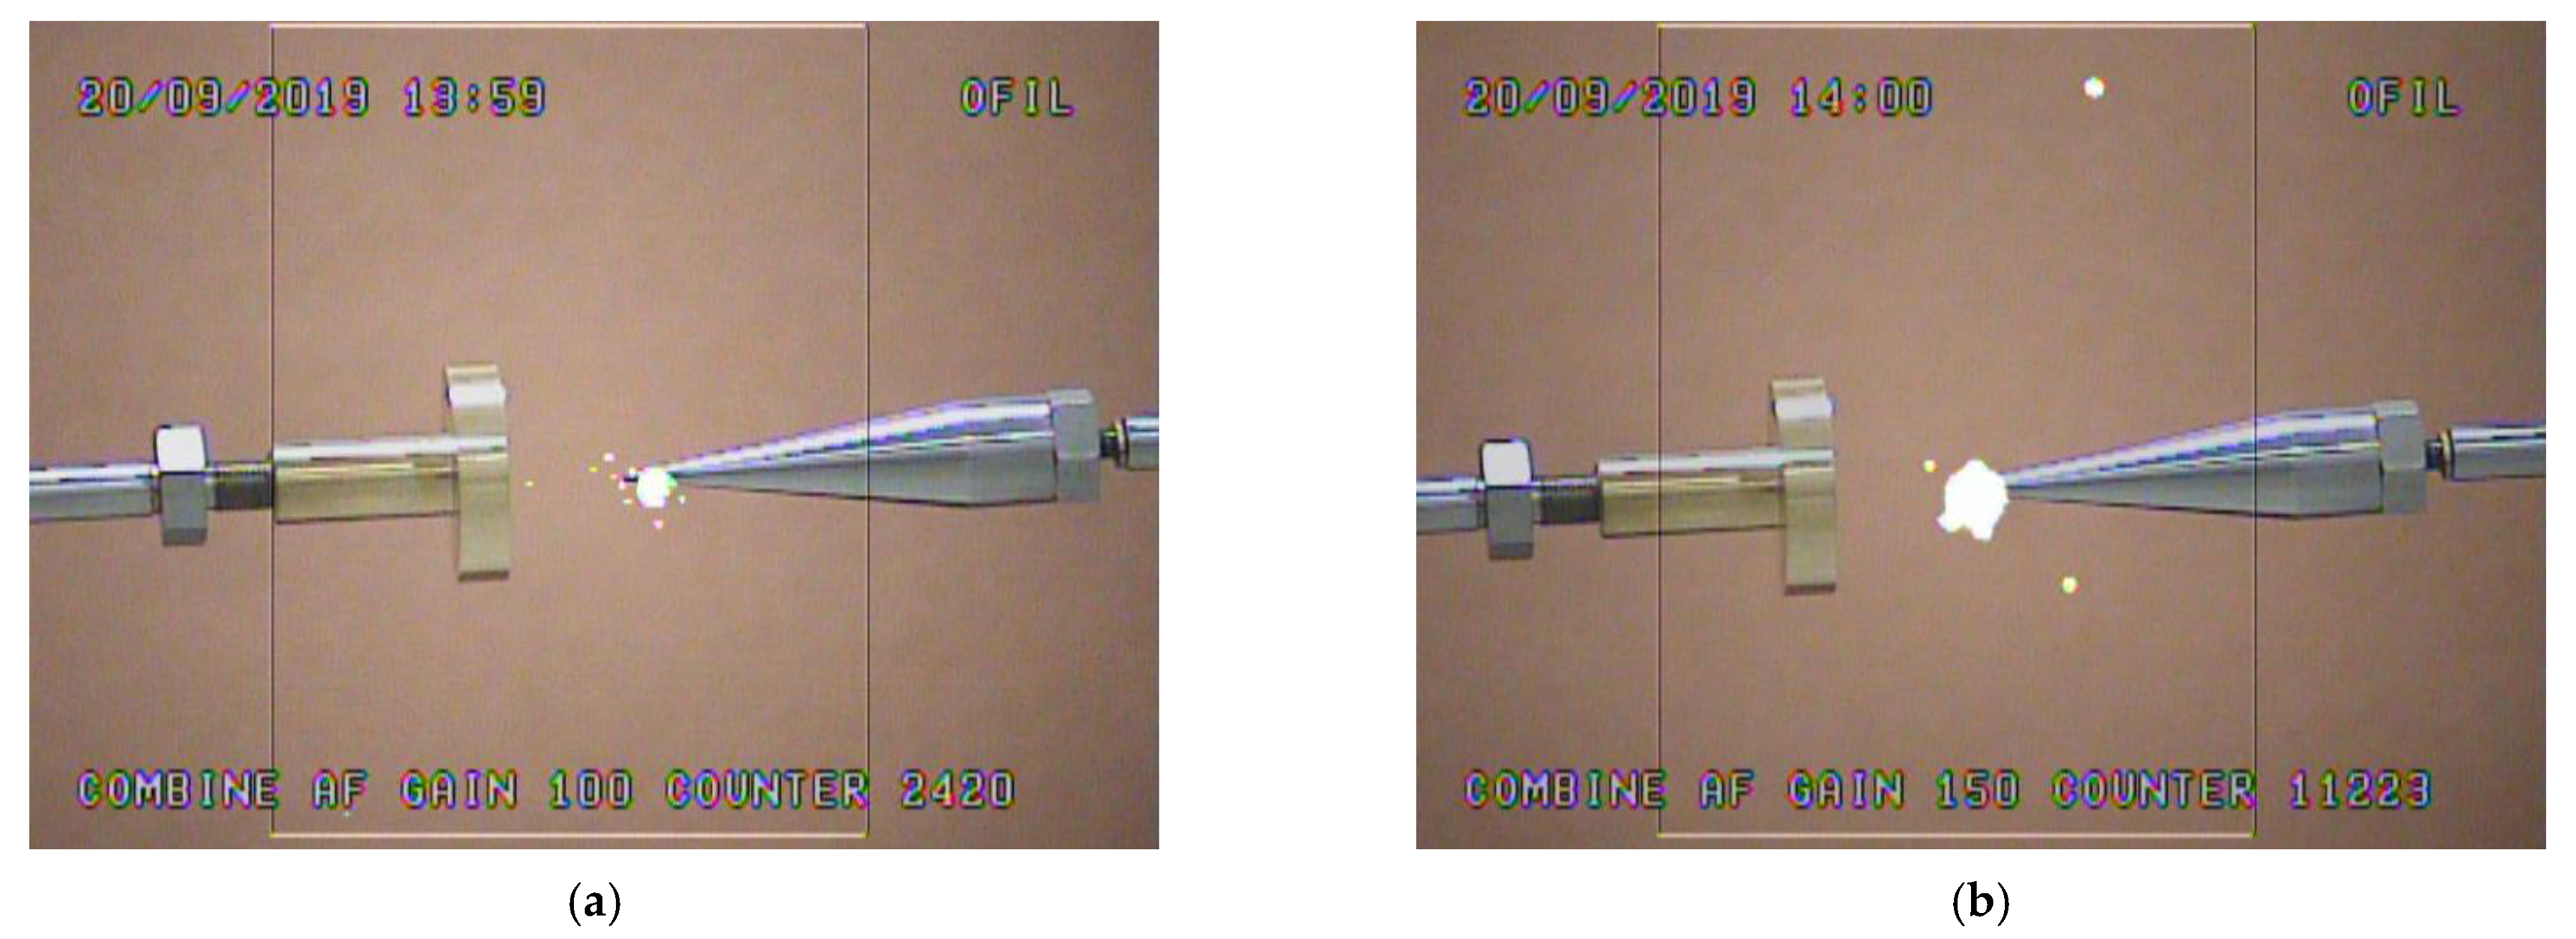
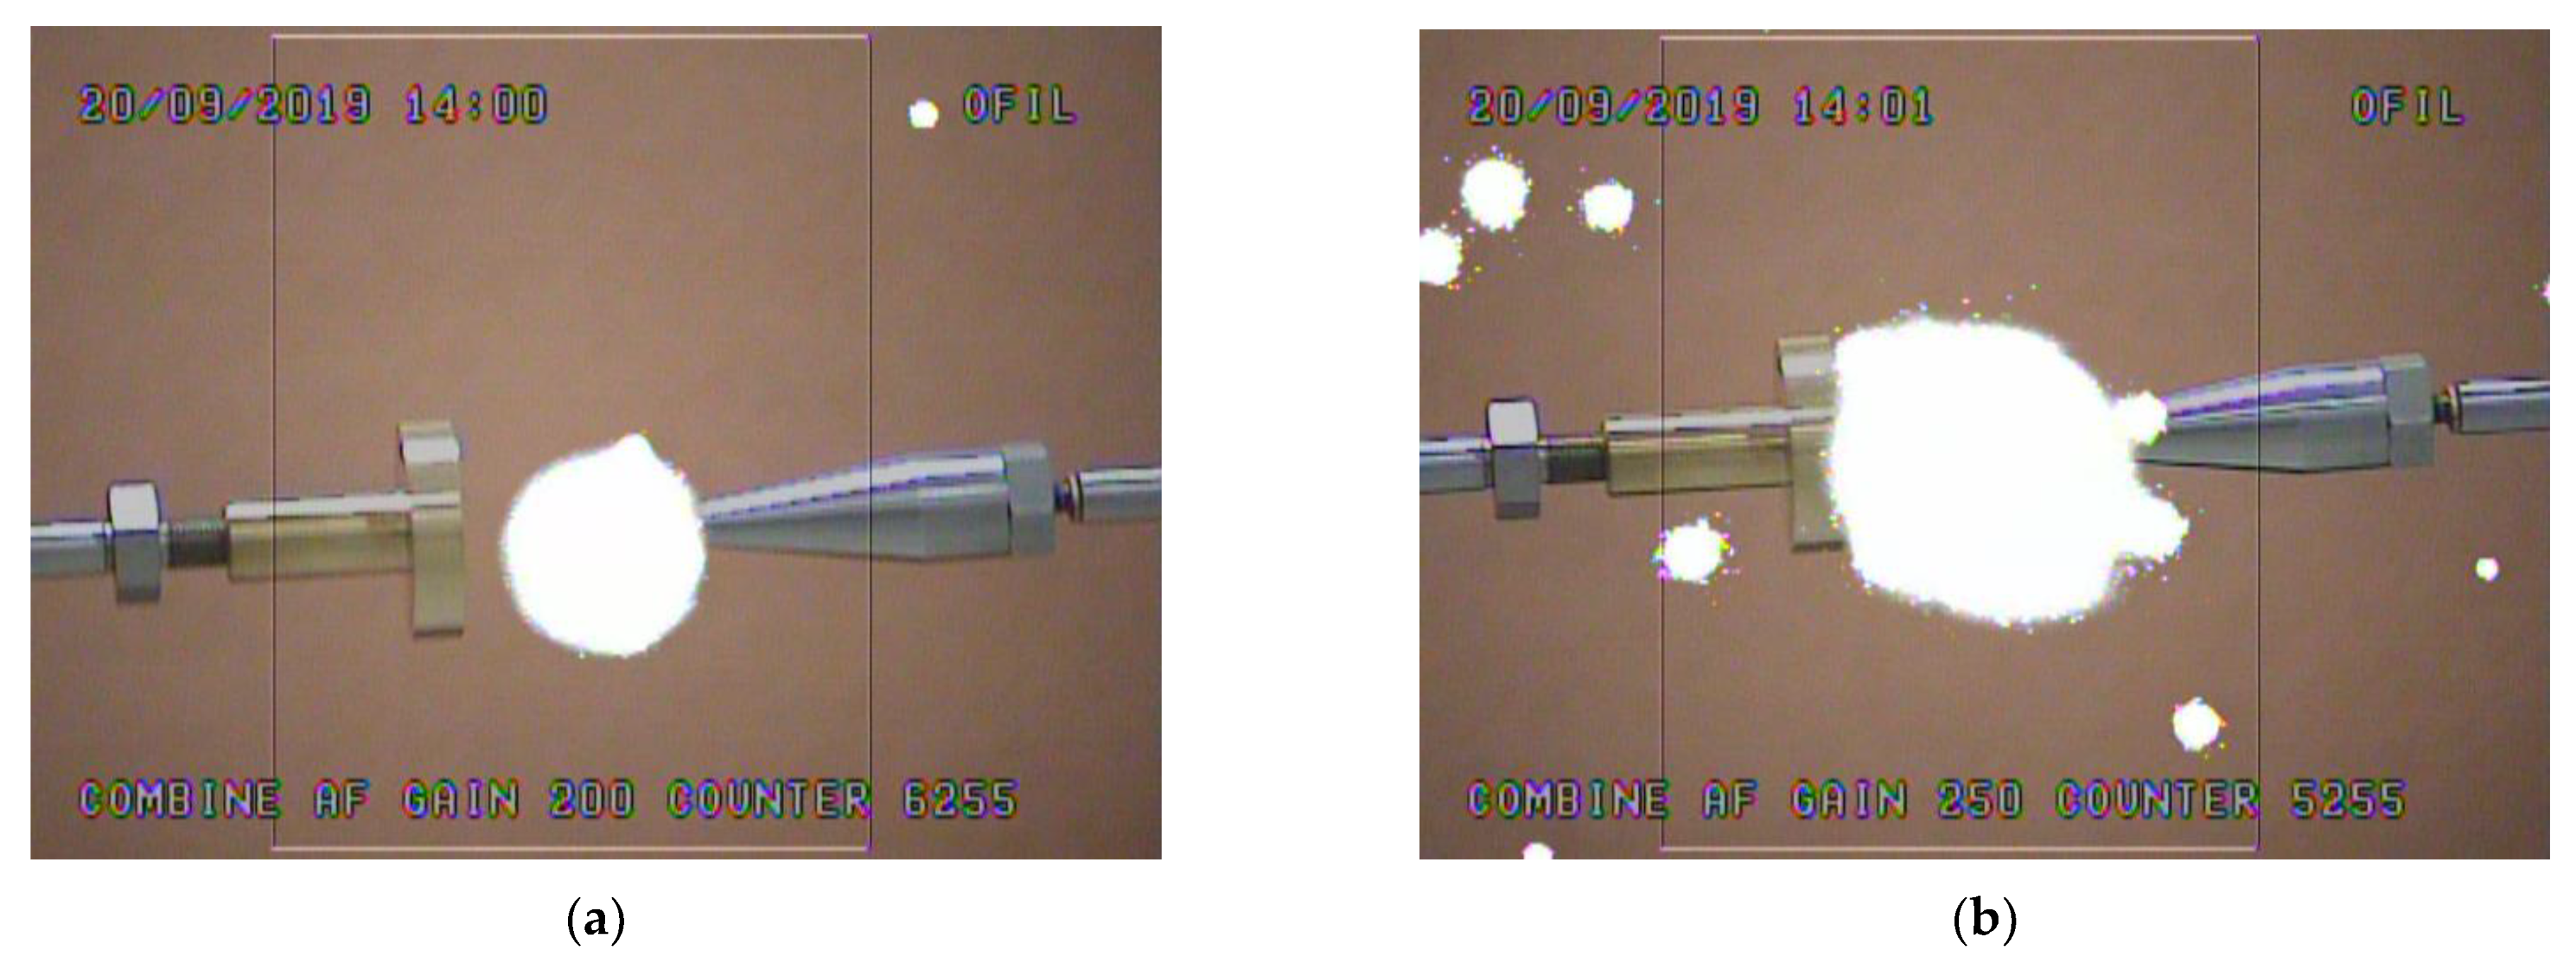
With the purpose of determining the effect of the distance between the camera and the PD’s source on the registered count of UV impulses resulting from PDs, the characteristics were established with regard to this relation. The recording of these dependencies was performed for five different camera gains and for four values of PD generation. Example results of PD measurements with UV camera, generated on a needle–needle spark gap, are presented in Figure 7. PDs were generated in a conical spark gap with a needle angle of 20°. The measurements were performed for two distances between the electrodes in the spark gap: 2 cm and 4 cm. The results are presented in Figure 8.
5. Effect of Gain Parameter, Distance between Camera and PD Source and PD Generation Voltage on the Registered Count of UV Impulses
For the purposes of verifying the results gained in the needle electrode systems, simi-lar measurements were performed and involve the generation of PDs in the needle–plate spark gap. Example results of PD measurements with UV camera generated on a needle–plate spark gap are presented in Figure 11 and Figure 12. The results presented below demonstrate the effect of the gain parameter, the distance of the camera from the PD source and the value of generation voltage on the registered count of UV impulses. Figure 13 presents the results recorded in the spark gap, in which the distance between the blade and the plate was equal to 3 cm and PDs were generated at 24 kV. Figure 14 contains the results obtained in this spark gap, but at a distance between the electrodes of 3 cm and a PD generation voltage of 31 kV. Figure 15 contains the results recorded in the same system, but for a distance between the electrodes equal to 3 cm and a voltage equal to 38 kV.
6. Results and Discussion
The results of measurements of UV emission spectra generated by PDs in the air, occurring in electrode systems with a non-uniform distribution of the electric field discussed in this paper, clearly demonstrate the applicability of the camera technique for detection and measurement of partial discharges. The more important results are discussed below:
- (1)
- The results presented in Figure 4, Figure 5 and Figure 6 demonstrate the dependence of the counts of UV emission impulses originating from PDs on the value of the voltage used to generate them. All waveforms are non-linear. Initially, they increase exponentially, at 32 kV (i.e., 52% of the breakdown voltage Vb), until they assume a maximum value (1.8 × 10⁴ impulses), followed by a linear decrease to 45 kV (73% Vb), for which the number of registered pulses is equal to 1 × 10⁴. This may indicate that at a voltage of 32 kV there is the highest ionization energy. With a further increase in the value of PDs’ generation voltage, the emission of UV pulses increases linearly, reaching a voltage of 1.1 × 10⁴ at 55 kV (92% Vb). This dependence between the UV emission and the voltage of PD generation applies regardless of the diameter of the electrode needles (and, consequently, also regardless of the radius of their needle), between which PDs are generated. This analysis showed that the change in the thickness of the spark gap does not significantly affect the counts recorded by the UV camera, therefore only models (b) and (c) from Figure 3 were used for detailed analysis. The registered UV emission waveforms in the function of PD generation voltage provide interesting input since they are clearly different from those that were recorded in the visible light spectrum. According to the present authors, the explanation of these phenomena should be sought in the analysis of physical mechanisms responsible for the formation and development of PDs occurring in electric fields with non-uniform distribution. Recorded waveforms clearly indicate that the energy transformations associated with air ionization in the UV spectrum and in the visible light spectrum are different. The decrease in the number of counts observed in Figure 4, Figure 5 and Figure 6 is associated with the ionization process, where after reaching a certain level of saturation, part of the ionization energy begins to be transferred in another form, including kinetic energy and in the form of radiation. This phenomenon is most often already visible to the naked eye (in appropriate conditions, of course) as a bright glow. The gas dielectric (in this case, air) is locally ionized and the ionization energy share decreases despite the voltage increase. A UV camera detector that works in the wavelength range from 240 nm to 280 nm is able to register this phenomenon. A further explanation of these differences requires further research and analysis.
- (2)
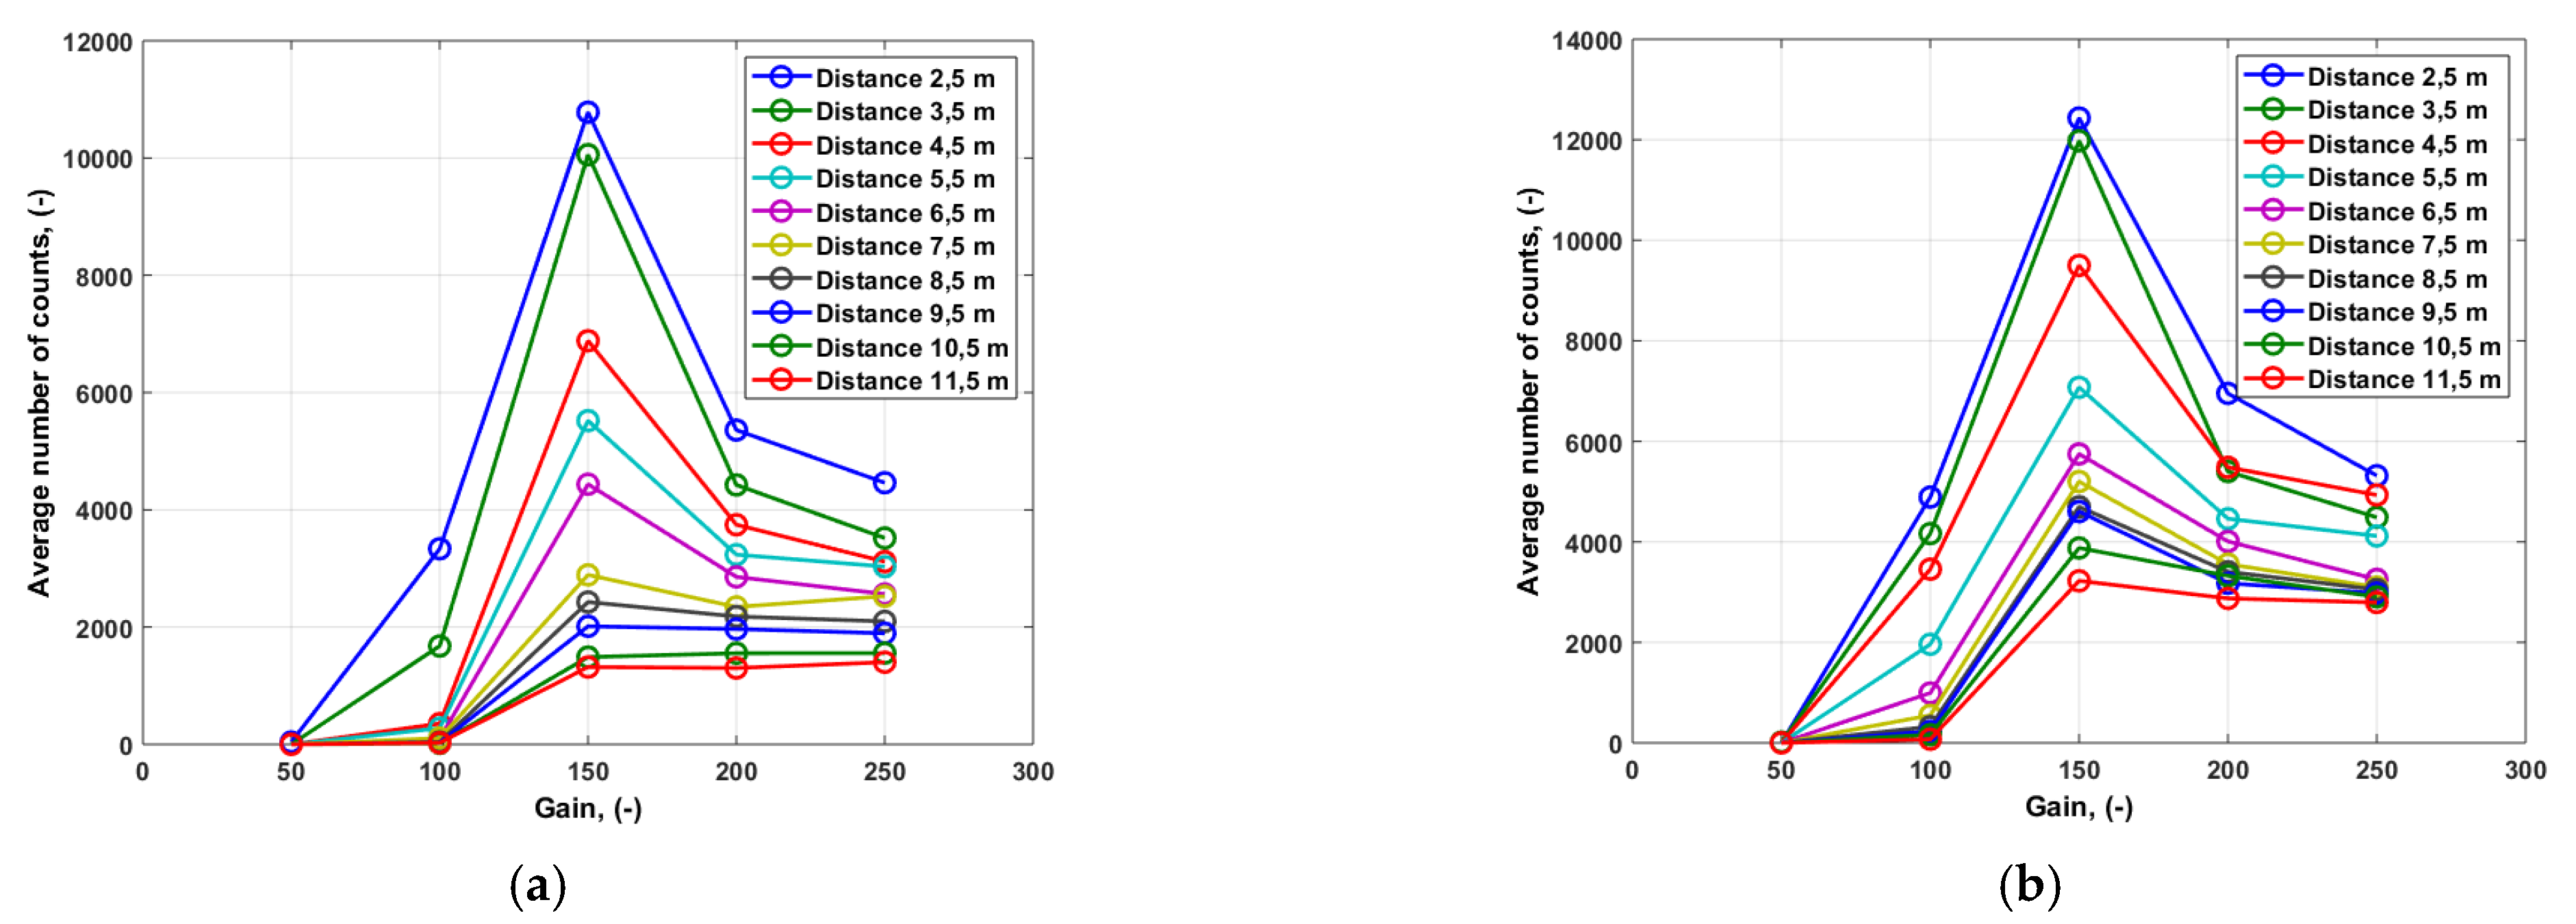
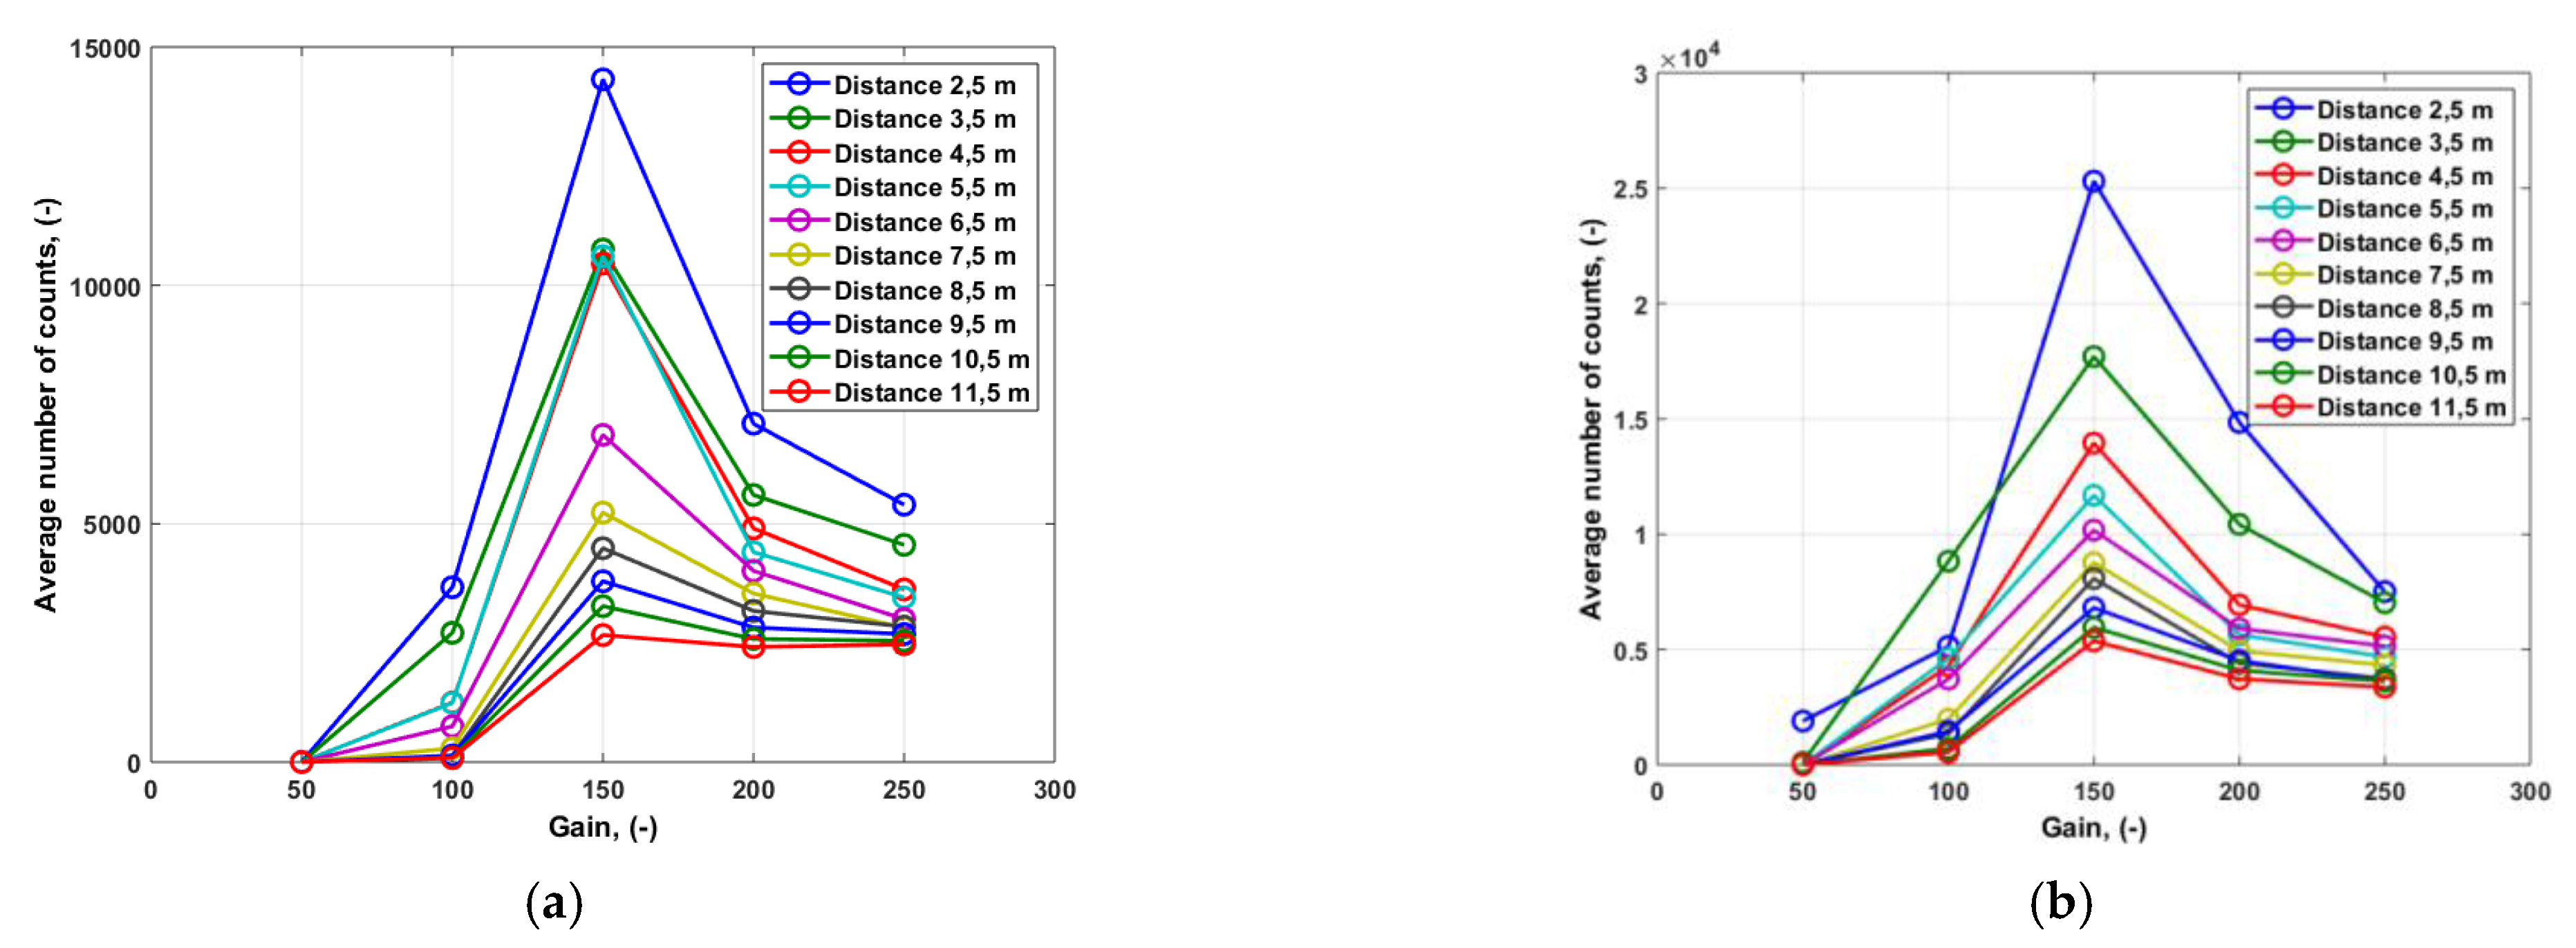
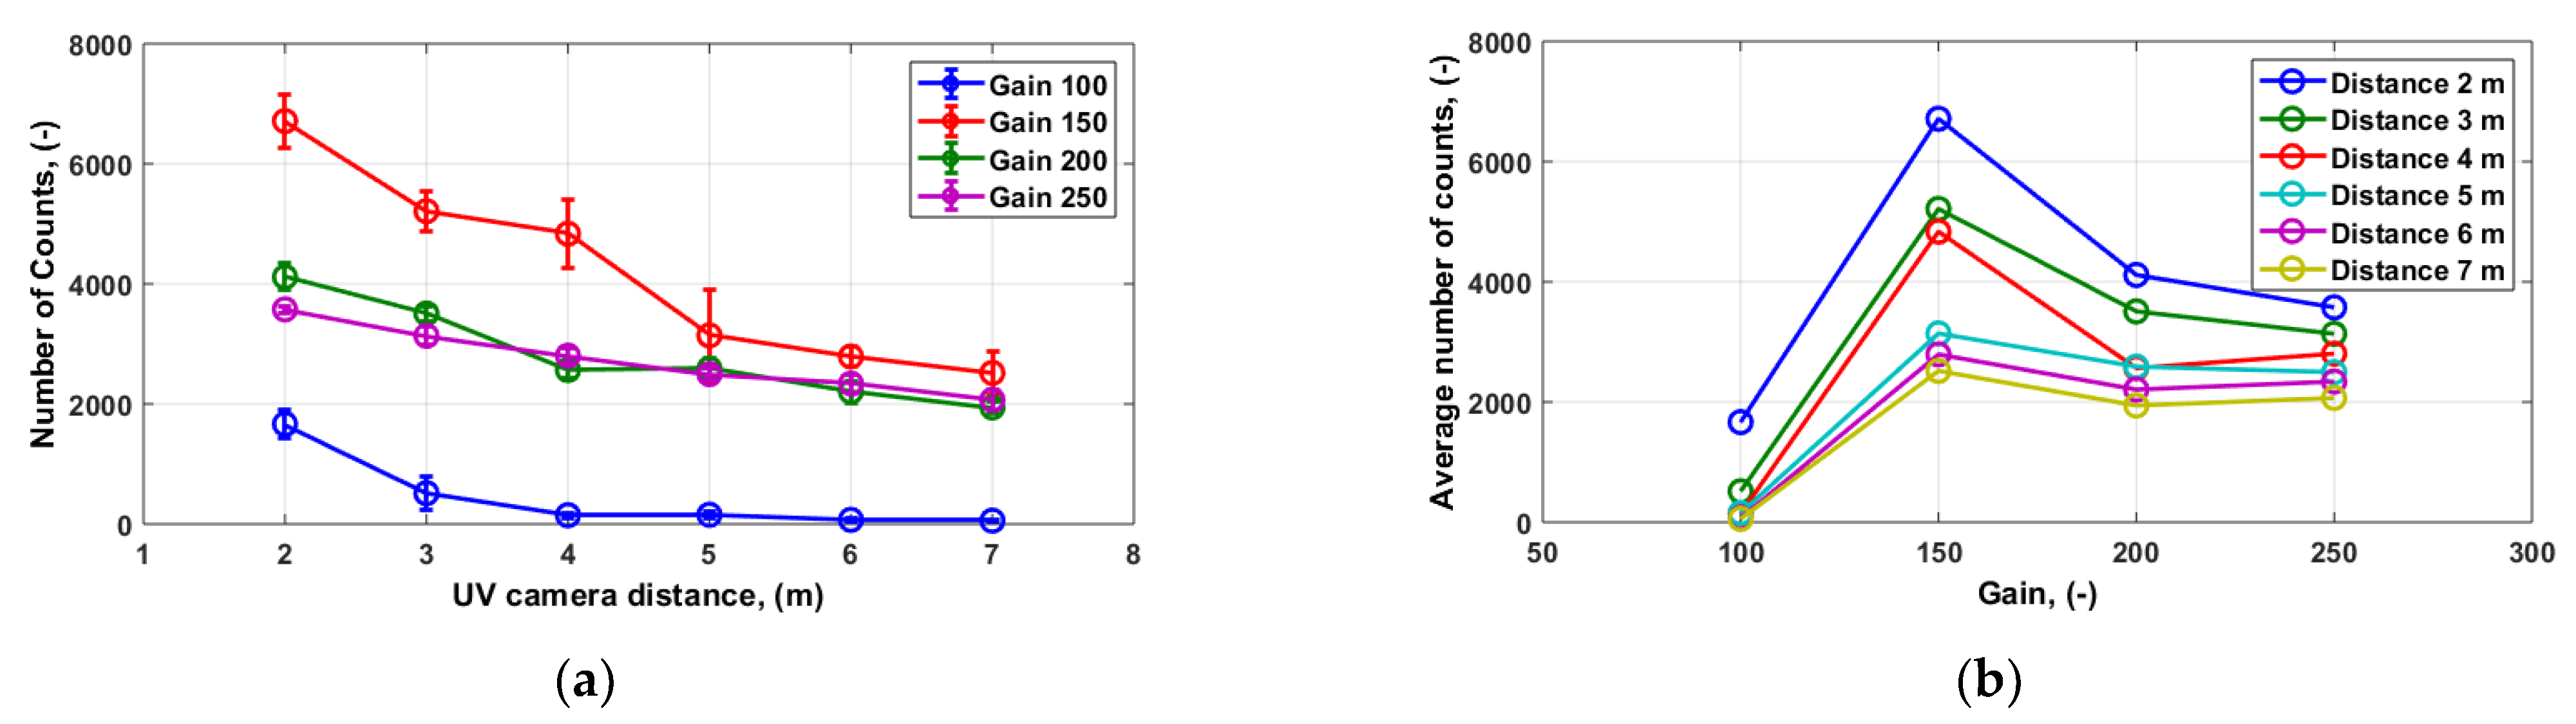
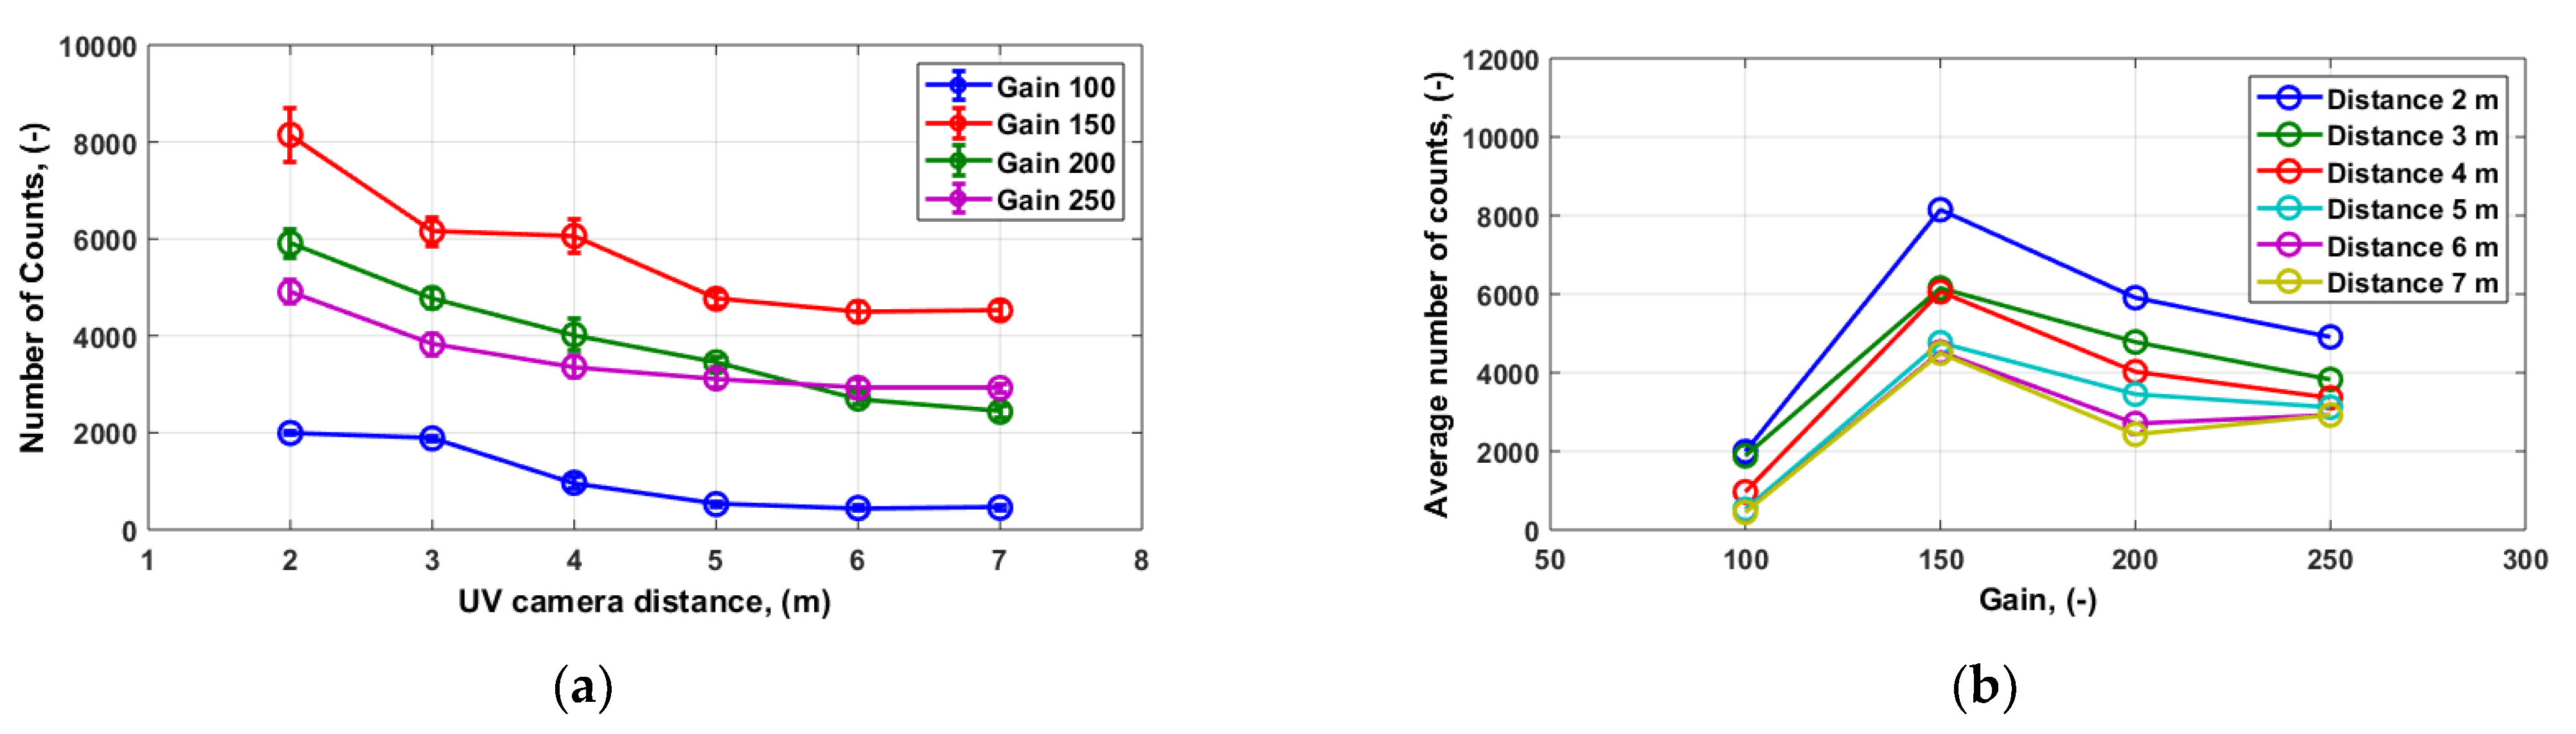
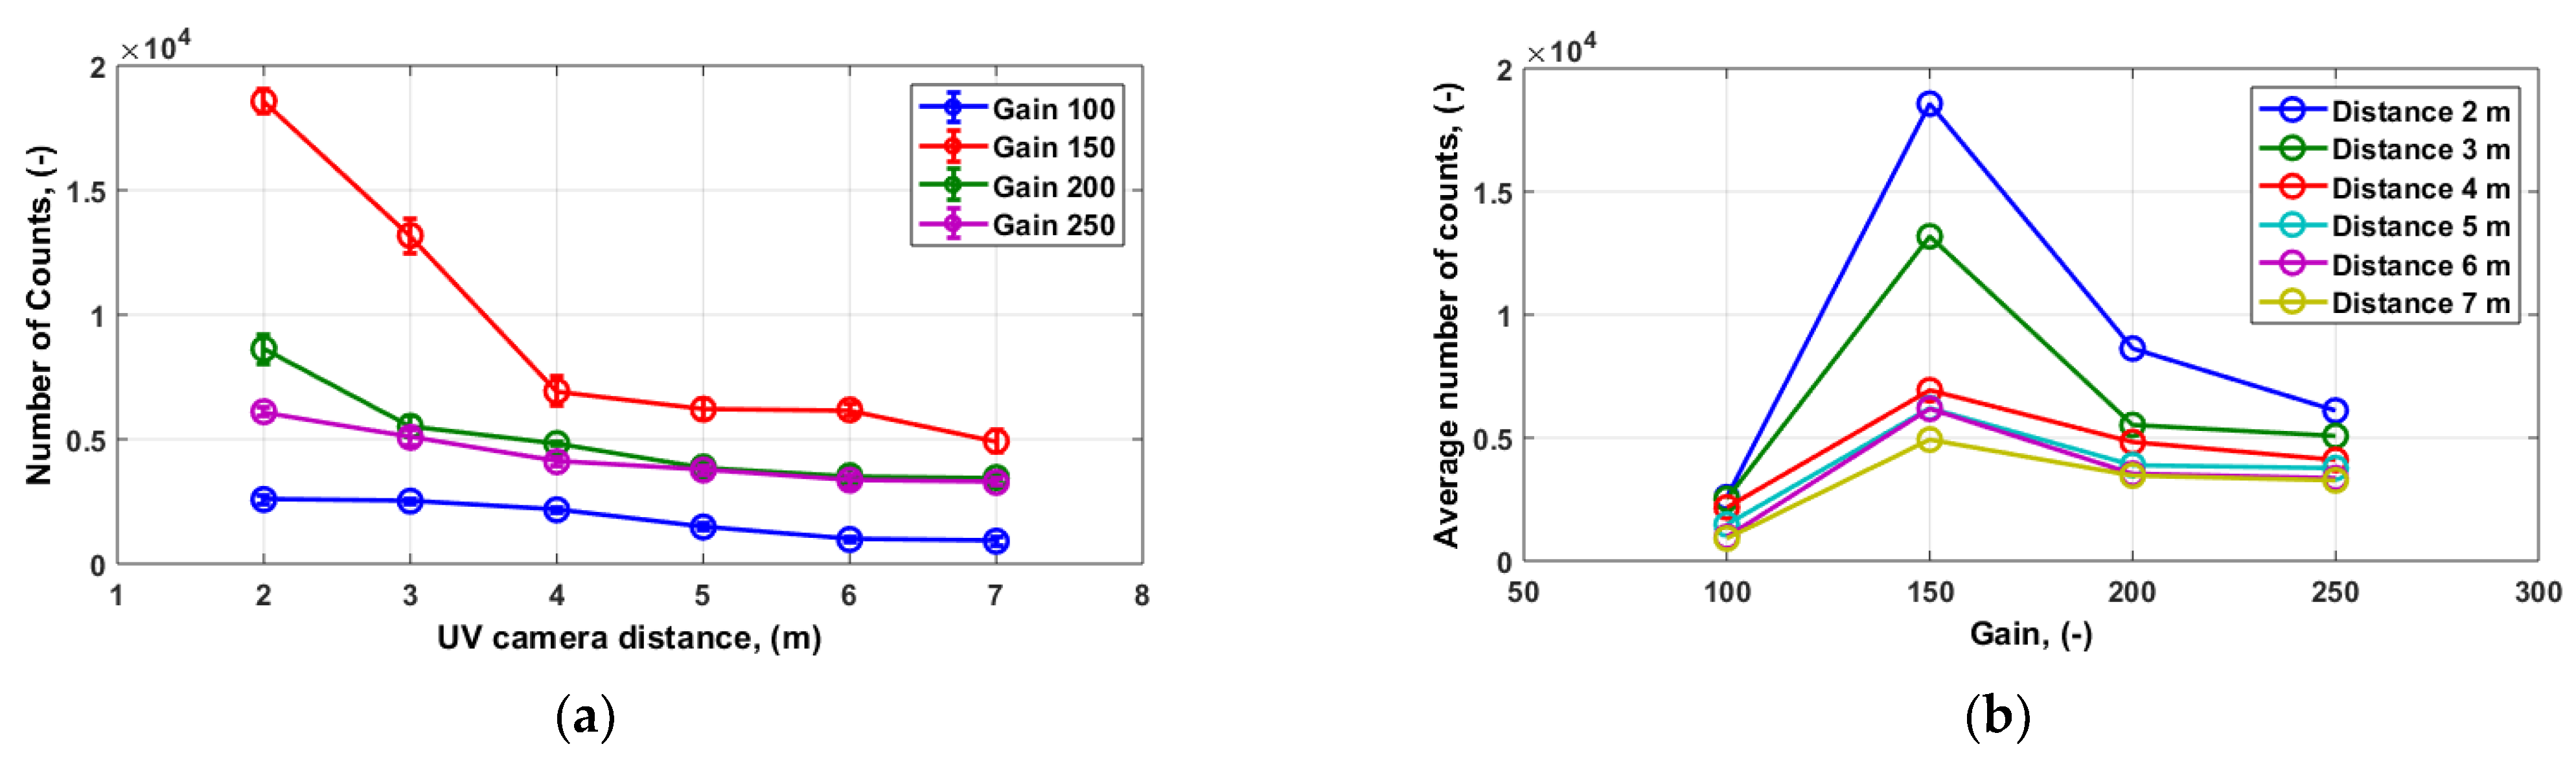
- Figure 8 presents the effect of the camera’s distance from the PD’s source generated in the needle system on the registered UV emission. In the spark gap, where the distance between the blade electrodes was equal to 2 cm and its breakdown voltage was 26.5 kV, PDs were generated for two voltage values: 13 kV and 15 kV (49% Vb and 56.7% Vb, respectively). The results given in Figure 8a,b clearly confirm the significant effect of the camera’s distance from the source of PDs on the value of the recorded count of UV impulses. For example, for a distance of 2 cm the number is 10.900 impulses, and for a distance of 11 m the total impulses are 1700 (for a camera gain of 150). For signals generated in this spark gap at a distance of 3 cm, the respective numbers are 12,400 and 3300 impulses. This type of dependence between the number of registered UV emission pulses and the distance of the UV camera from the source of PDs is confirmed by all curves presented in Figure 7b and Figure 8a, regardless of the value of the adopted camera gain.
- (3)
- The results given in Figure 9 and Figure 10 can be applied to determine the effect of camera gain values on the count of UV impulses. The results presented in these graphs were obtained in the same metrological conditions as the previous cases (Figure 8). All curves presented in Figure 9 and Figure 10 clearly demonstrate that the highest numbers of UV impulses are recorded for the camera gain of 150. This conclusion is confirmed by all curves obtained for different distances of the camera from the source of PDs. It is understood that the number of recorded UV impulses is the highest for the shortest distance between the camera and the source of PDs.
- (4)
- The results given in Figure 13, Figure 14 and Figure 15 serve the purposes of verifying results gained previously (Figure 8, Figure 9 and Figure 10). These results were obtained in a different electrode system with non-uniform field distribution (needle–plate), in which the magnitude of the electric field was lower. The analysis of the results (Figure 13a, Figure 14a and Figure 15a) leads to the conclusion that the assumption of the camera gain value of 150 in this system forms the most suitable option and confirms the results and conclusions relating to the needle–needle system. It can even be said that the curves obtained in this system confirm this conclusion more clearly. This is particularly confirmed by the curves derived for the smallest distance (2 m) from the source of PDs to the camera. Based on the obtained results, it is possible to apply the optimal gain to the analysis of other geometric shapes of electrodes that generate non-uniform distribution of the electric field. The results presented in Figure 13b, Figure 14b and Figure 15b present the effect of the distance between the camera and the source of PDs on the registered count of UV impulses. The results relate to changes in distance in the range of 2 m to 7 m. It can be estimated that the number of UV impulses recorded for a 2 m distance from the camera to PD source is about 2 to 2.5 times greater than that recorded for a distance of 7 m. Trends in curve changes are presented in Figure 13b, Figure 14b and Figure 15b and are fully consistent with the results reported in previous studies (Figure 8).
- (5)
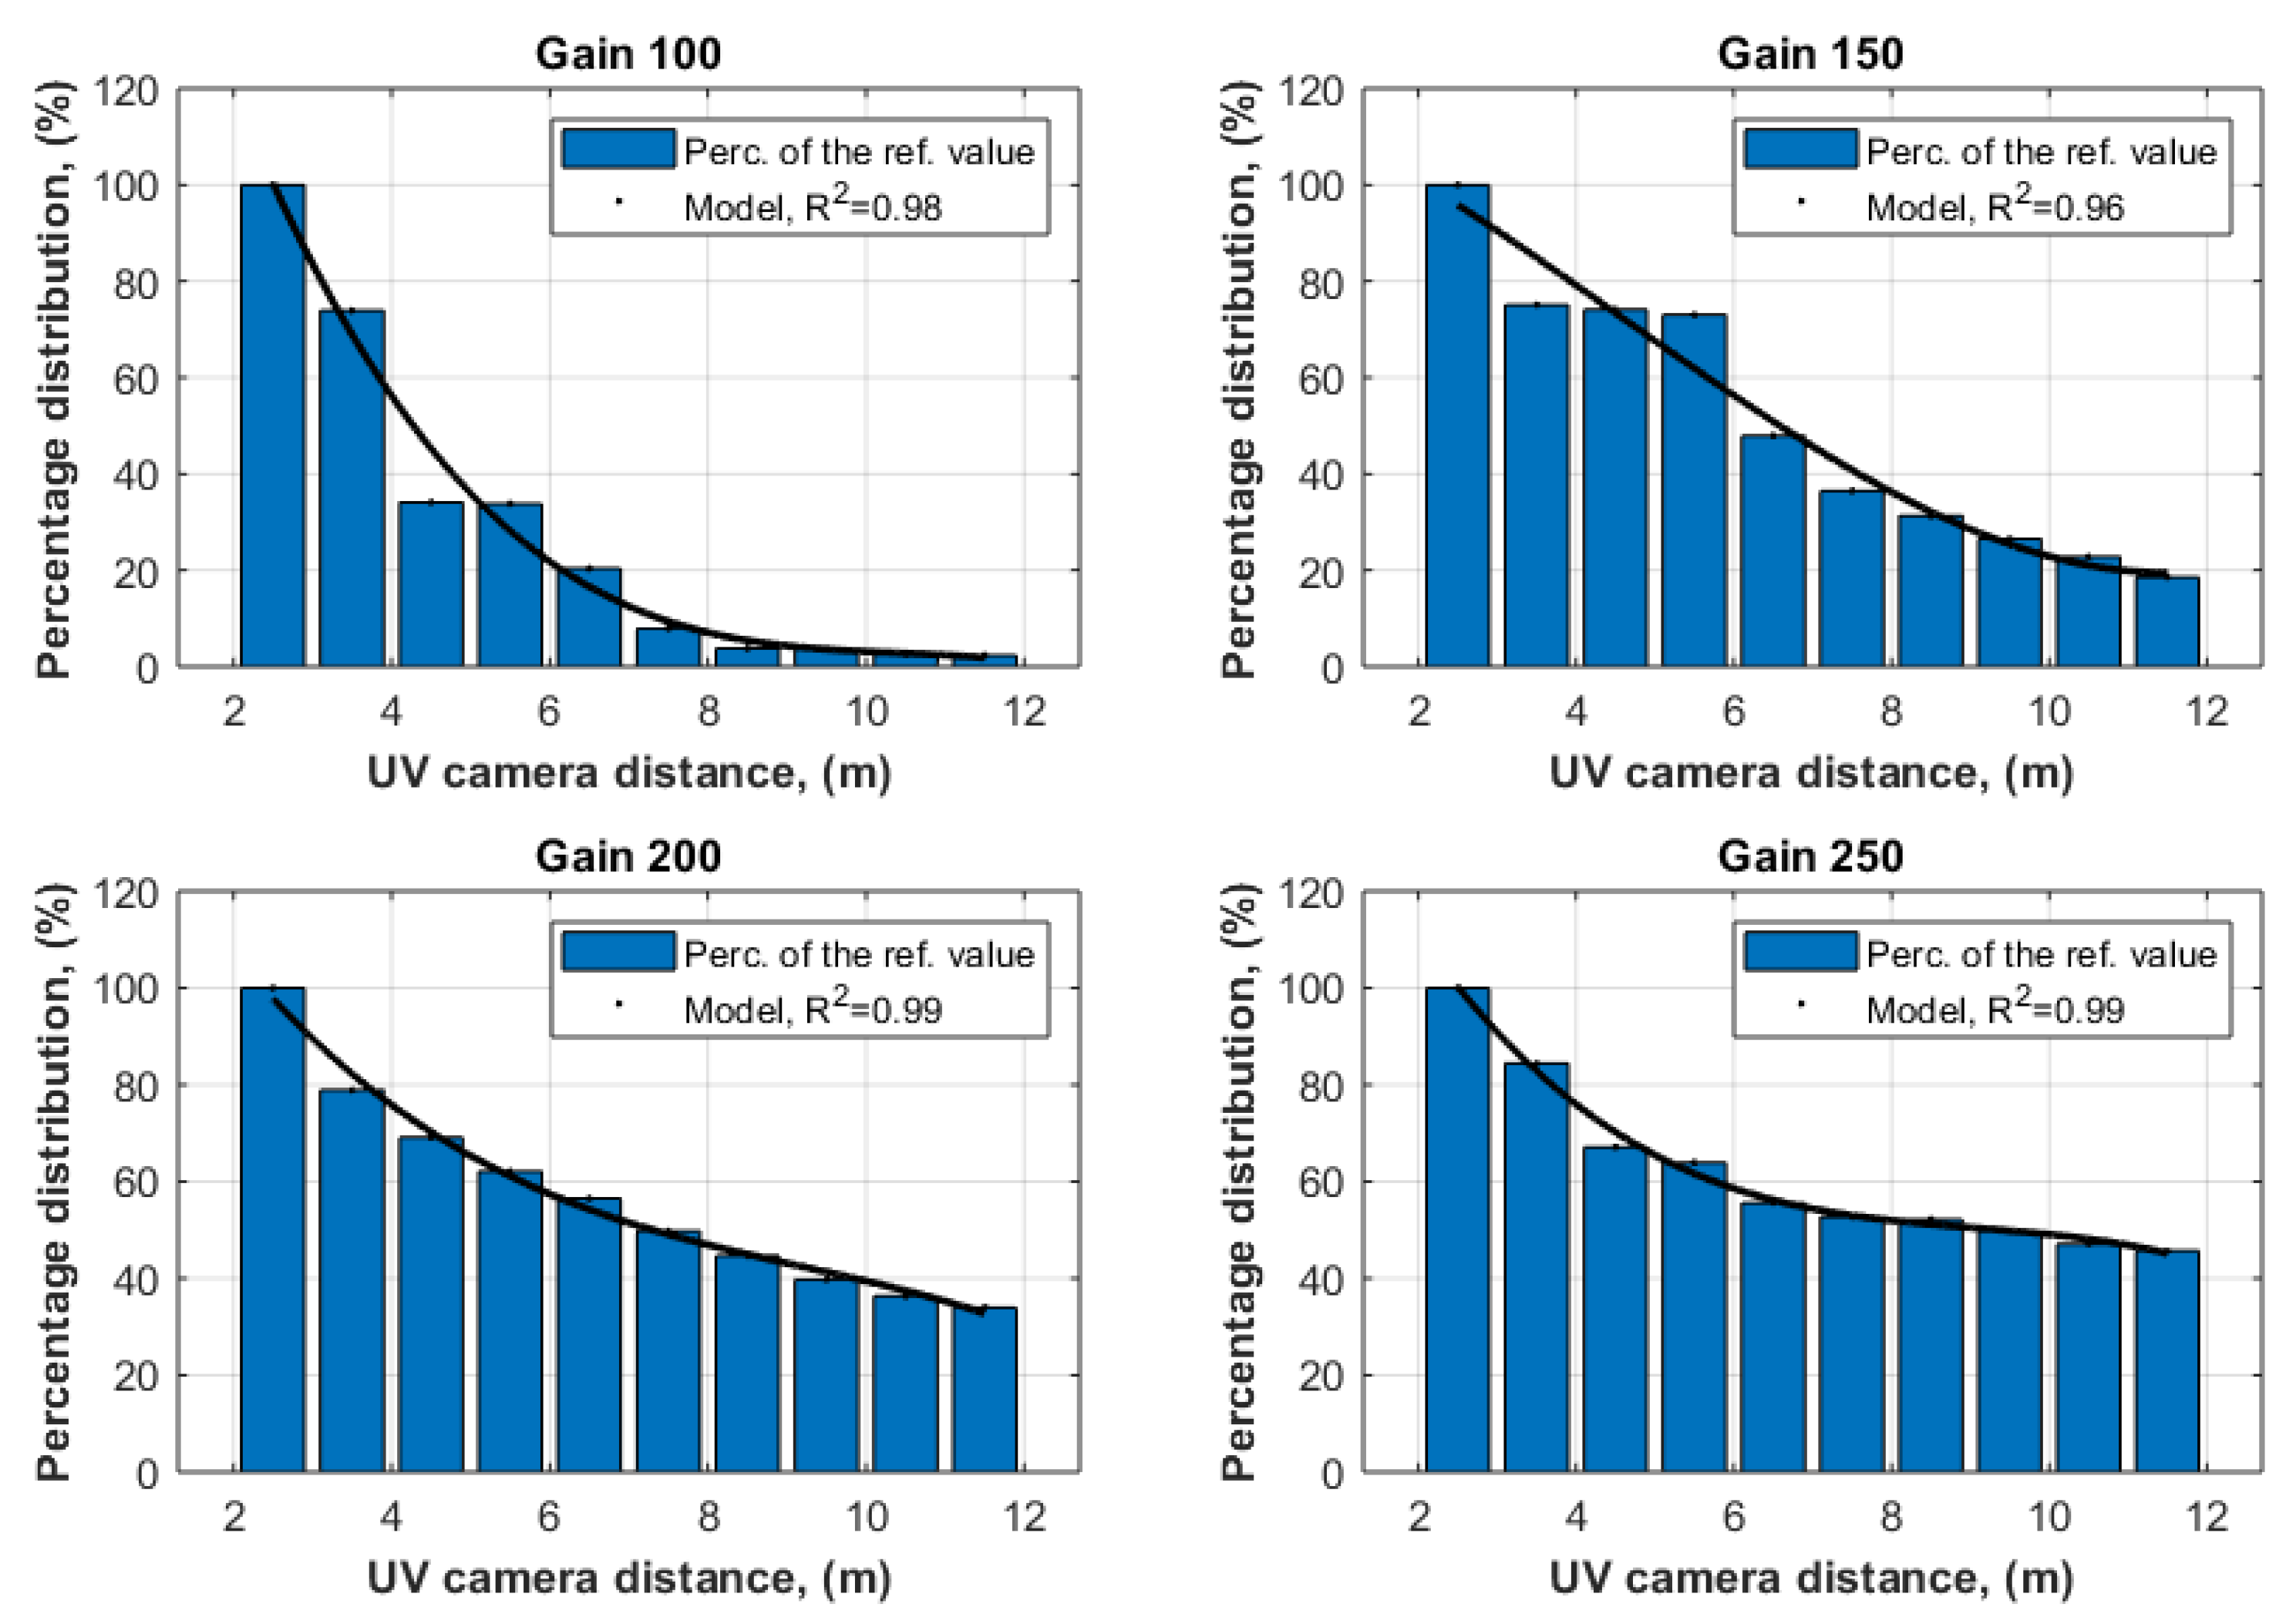
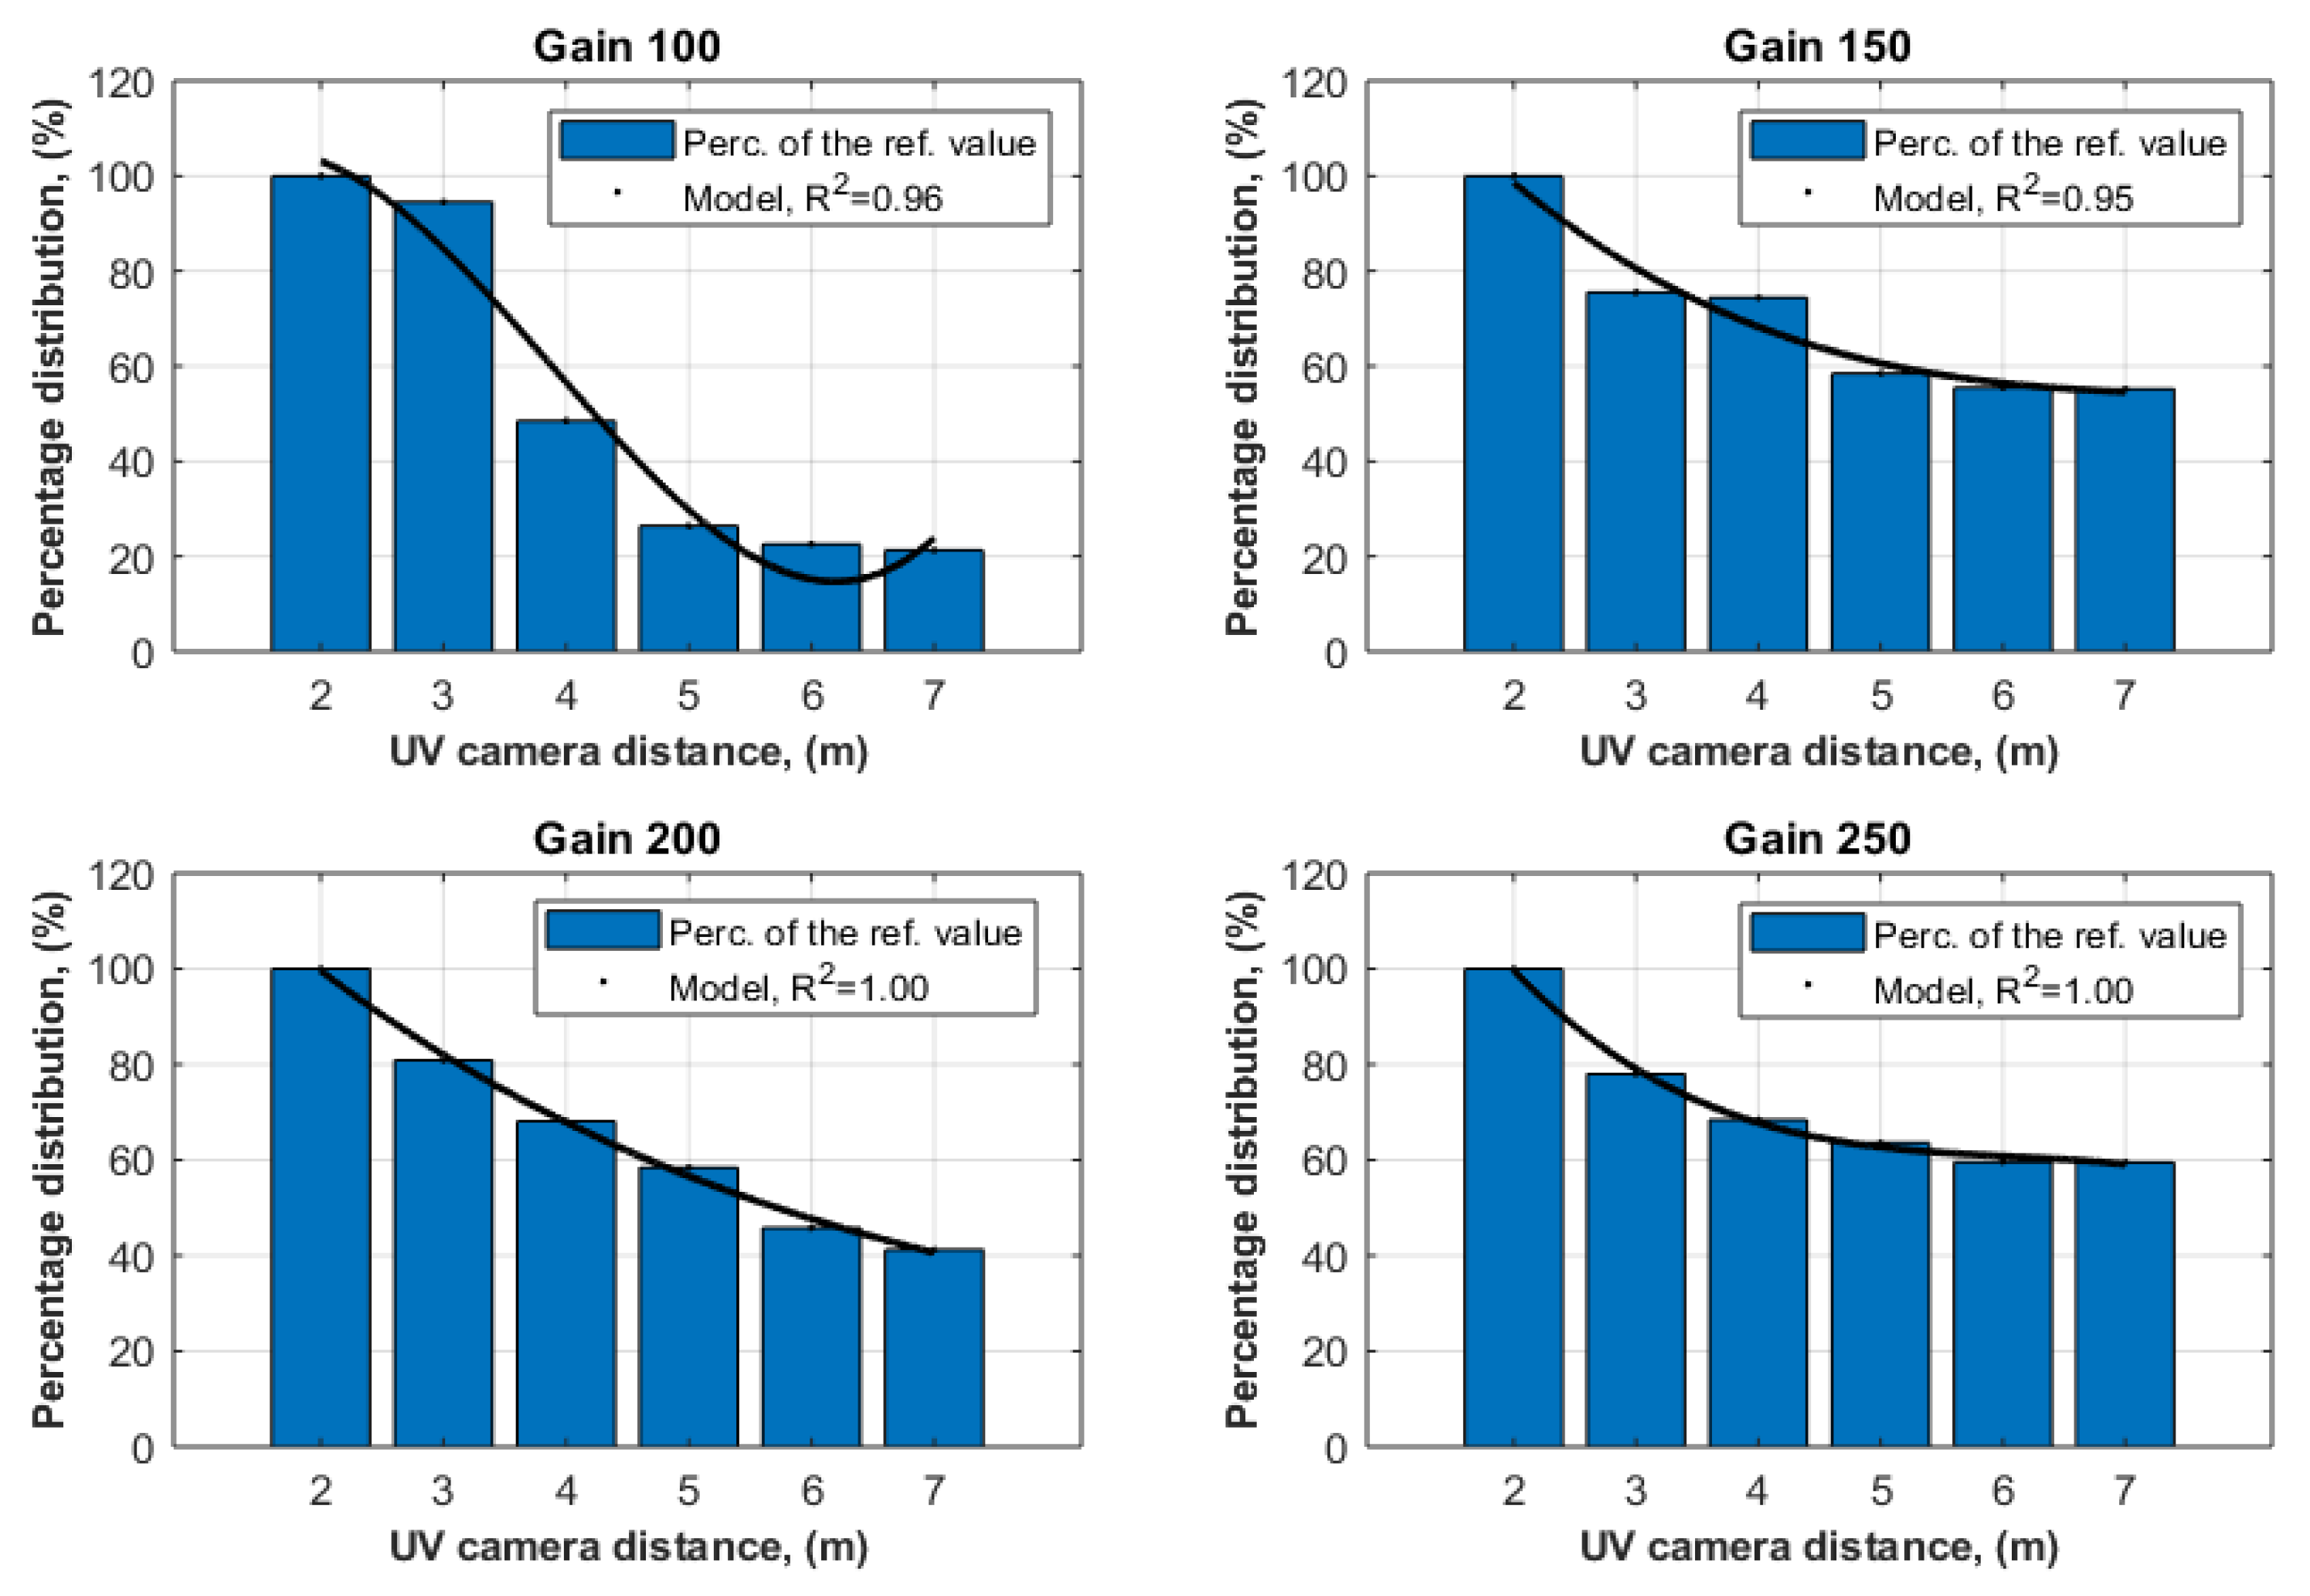
- An analysis was performed with regard to the distribution of mean values of the number of counts with the purpose of determining the optimal gain values in percentage points (Figure 16 and Figure 17). The closest distance between the camera and the PD’s generation source was adopted as the reference value, which was 2.5 m for the needle–needle gaps and 2.0 m for the needle–plate gaps. This distance was determined due to the need to safely locate the UV camera in relation to the tested systems applied for the generation of PDs.
- (6)
- On the basis of the analysis of the resulting characteristics, we can conclude that the most favorable distribution was obtained for the gain values equal to 200 and 250 (Figure 16 and Figure 17). According to the authors, the optimal gain will be 200, as it is characterized by an exponentially declining model. This situation occurs in both tested systems (needle–needle gaps and needle–plate gaps), where the coefficient of determination (R-squared) for the model is 0.99 and 1.00, respectively.
Author Contributions
J.S. and M.K. contributed equally to this work and all of its stages and elements. All authors have read and agreed to the published version of the manuscript.
Funding
This research received no external funding.
Data Availability Statement
Not applicable.
Conflicts of Interest
The authors declare no conflict of interest.
References
- Kunicki, M.; Cichon, A.; Borucki, S. Measurements on partial discharge in on-site operating power transformer: A case study. IET Gener. Transm. Distrib. 2018, 12, 2487–2495. [Google Scholar] [CrossRef]
- Mukhtaruddin, A.; Isa, M.; Noor, M.M.; Adzman, M.R.; Ain, M.F. Review of UHF detection of partial discharge experimentation in oil-filled power transformer: Objectives, methodologies and results. AIP Conf. Proc. 2018, 2013. [Google Scholar] [CrossRef]
- Meitei, S.N.; Borah, K.; Chatterjee, S. Modelling of Acoustic Wave Propagation Due to Partial Discharge and Its Detection and Localization in an Oil-Filled Distribution Transformer. Frequenz 2020, 74, 73–81. [Google Scholar] [CrossRef]
- Mishra, D.K.; Dhara, S.; Koley, C.; Roy, N.K.; Chakravorti, S. Self-organizing feature map based unsupervised technique for detection of partial discharge sources inside electrical substations. Meas. J. Int. Meas. Confed. 2019, 147, 106818. [Google Scholar] [CrossRef]
- Xizi, Z.; Li, C.; Zheng, S.; Ji, H.; Lu, Q.; Wang, Z. Research of a loop-type sensor embedded in an insulator in 252kV GIS for partial discharge measurement. In Proceedings of the 8th International Conference on Mechanical and Intelligent Manufacturing Technologies, Cape Town, South Africa, 3–6 February 2017. [Google Scholar]
- Cichoń, A.; Borucki, S.; Wotzka, D. Modeling of acoustic emission signals generated in on load tap changer. Acta Phys. Pol. A 2014, 125, 1396–1399. [Google Scholar] [CrossRef]
- Nagi, Ł.; Kozioł, M.; Kunicki, M.; Wotzka, D. Using a scintillation detector to detect partial discharges. Sensors 2019, 19, 4936. [Google Scholar] [CrossRef] [PubMed] [Green Version]
- Kunicki, M.; Cichoń, A.; Nagi, Ł. Statistics based method for partial discharge identification in oil paper insulation systems. Electr. Power Syst. Res. 2018, 163, 559–571. [Google Scholar] [CrossRef]
- Przybyłek, P.; Morańda, H.; Mościcka-Grzesiak, H.; Kownacki, I.; Zawisz, R. Drying distribution transformer’s insulation by means of liquid medium. Prz. Elektrotechniczny 2018, 94, 18–21. [Google Scholar]
- Wotzka, D.; Koziol, M.; Nagi, L.; Urbaniec, I. Experimental analysis of acoustic emission signals emitted by surface partial discharges in various dielectric liquids. In Proceedings of the 2018 IEEE 2nd International Conference on Dielectrics, Budapest, Hungary, 1–5 July 2018. [Google Scholar]
- Bachowicz, A.; Boczar, T.; Wotzka, D. Application of a mobile system in diagnostics of power capacitors using the acoustic emission method. Insight Non-Destructive Test. Cond. Monit. 2016, 58, 94–100. [Google Scholar]
- Witos, F.; Opilski, Z.; Szerszeń, G.; Setkiewicz, M. The 8AE-PD computer measurement system for registration and analysis of acoustic emission signals generated by partial discharges in oil power transformers. Metrol. Meas. Syst. 2019, 26, 403–418. [Google Scholar]
- Piotrowski, T. Weryfikacja skuteczności rozpoznawania defektów transformatorów olejowych przez wybrane metody DGA. Pomiary Autom. Kontrola 2013, 59, 129–132. [Google Scholar]
- Wotzka, D. Influence of Frequency and Distance on Acoustic Emission Velocity Propagating in Various Dielectrics. Appl. Sci. 2020, 10, 3305. [Google Scholar] [CrossRef]
- Nemeth, B.; Laboncz, S.; Kiss, I. Condition monitoring of power transformers using DGA and Fuzzy logic. In Proceedings of the 2009 IEEE Electrical Insulation Conference, Montreal, QC, Canada, 31 May–3 June 2009; pp. 373–376. [Google Scholar]
- Cruz, V.G.M.; Costa, A.L.H.; Paredes, M.L.L. Development and evaluation of a new DGA diagnostic method based on thermodynamics fundamentals. IEEE Trans. Dielectr. Electr. Insul. 2015, 22, 888–894. [Google Scholar] [CrossRef]
- Perrier, C.; Marugan, M.; Beroual, A. DGA comparison between ester and mineral oils. IEEE Trans. Dielectr. Electr. Insul. 2012, 19, 1609–1614. [Google Scholar] [CrossRef]
- Dincer, S.; Duzkaya, H.; Tezcan, S.S.; Dincer, M.S. Analysis of Insulation and Environmental Properties of Decomposition Products in SF6-N2 Mixtures in the Presence of H2O. In Proceedings of the 2019 IEEE International Conference on Environment and Electrical Engineering and 2019 IEEE Industrial and Commercial Power Systems Europe, EEEIC/I and CPS Europe, Genova, Italy, 10–14 June 2019. [Google Scholar]
- Czerwonka, J.; Kozioł, M.; Skubis, J. Wpływ geometrii elektrod ostrzowych na wytrzymałość powietrza w polu niejednostajnym. Przegląd Elektrotechniczny 2018, 94, 152–155. [Google Scholar] [CrossRef]
- Scognamillo, C.; Catalano, A.P.; Lasserre, P.; Duchesne, C.; d’Alessandro, V.; Castellazzi, A. Combined experimental-FEM investigation of electrical ruggedness in double-sided cooled power modules. Microelectron. Reliab. 2020, 114, 113742. [Google Scholar] [CrossRef]
- Jaber, A.; Lazaridis, P.; Zhang, Y.; Saeed, B.; Khan, U.; Upton, D.; Ahmed, H.; Mather, P.; Vieira, M.F.Q.; Atkinson, R.; et al. Assessment of absolute partial discharge intensity from a free-space radiometric measurement. IEEE 2016, 1011–1014. [Google Scholar] [CrossRef] [Green Version]
- Khan, U.F.; Lazaridis, P.I.; Mohamed, H.; Albarracín, R.; Zaharis, Z.D.; Atkinson, R.C.; Tachtatzis, C.; Glover, I.A. An Efficient Algorithm for Partial Discharge Localization in High-Voltage Systems Using Received Signal Strength. Sensors 2018, 18, 4000. [Google Scholar] [CrossRef] [Green Version]
- Kozioł, M.; Nagi, Ł.; Kunicki, M.; Urbaniec, I. Radiation in the Optical and UHF Range Emitted by Partial Discharges. Energies 2019, 12, 4334. [Google Scholar] [CrossRef] [Green Version]
- Wilkes, T.C.; McGonigle, A.J.S.; Pering, T.D.; Taggart, A.J.; White, B.S.; Bryant, R.G.; Willmott, J.R. Ultraviolet imaging with low cost smartphone sensors: Development and application of a raspberry pi-based UV camera. Sensors 2016, 16, 1649. [Google Scholar] [CrossRef] [Green Version]
- Donne, D.D.; Aiuppa, A.; Bitetto, M.; D’Aleo, R.; Coltelli, M.; Coppola, D.; Pecora, E.; Ripepe, M.; Tamburello, G. Changes in SO2 Flux regime at mt. etna captured by automatically processed ultraviolet camera data. Remote Sens. 2019, 11, 1201. [Google Scholar] [CrossRef] [Green Version]
- Osorio, M.; Casaballe, N.; Belsterli, G.; Barreto, M.; Gómez, Á.; Ferrari, J.A.; Frins, E. Plume segmentation from UV camera images for SO2 emission rate quantification on cloud days. Remote Sens. 2017, 9, 517. [Google Scholar] [CrossRef] [Green Version]
- Chen, T.; Yuan, S.; Li, J.; Xing, S.; Zhang, H.; Dong, Y.; Chen, L.; Liu, P.; Jiao, G. Image registration for a UV–Visible dual-band imaging system. Opt. Lasers Eng. 2018, 105, 209–218. [Google Scholar] [CrossRef]
- Frącz, P.; Urbaniec, I. Application of UV camera for PD detection on long rod HV insulator. Meas. Autom. Monit. 2015, 3, 64–67. [Google Scholar]
- Maistry, N.; Schutz, R.; Cox, E. The Quantification of Corona Discharges on High Voltage Electrical Equipment in the UV Spectrum using a Corona Camera. In Proceedings of the 2018 International Conference on Diagnostics in Electrical Engineering (Diagnostika), Parkhotel, Pilsen, 4–7 September 2018; pp. 1–4. [Google Scholar]
- Moore, A.J.; Schubert, M.; Rymer, N. Technologies and Operations for High Voltage Corona Detection with UAVs. In Proceedings of the 2018 IEEE Power & Energy Society General Meeting (PESGM), Portland, OR, USA, 5–10 August 2018; pp. 1–5. [Google Scholar]
- Kim, S.; Kim, D.; Jeong, S.; Ham, J.W.; Lee, J.K.; Oh, K.Y. Fault Diagnosis of Power Transmission Lines Using a UAV-Mounted Smart Inspection System. IEEE Access 2020, 8, 149999–150009. [Google Scholar] [CrossRef]
- Constantin, A.; Dinculescu, R.-N. UAV development and impact in the power system. In Proceedings of the 8th International Conference on Modern Power Systems (MPS), Cluj-Napoca, Cluj, Romania, 21–23 May 2019; pp. 1–5. [Google Scholar]
Figure 1.
Diagram of the measuring system.

Figure 2.
Image from camera screen with emission spectra signals originating from PDs: space of PD’s formation (1); high voltage electrode (2); gain parameter (3); grounded electrode (4); number of counts (5).
Figure 2.
Image from camera screen with emission spectra signals originating from PDs: space of PD’s formation (1); high voltage electrode (2); gain parameter (3); grounded electrode (4); number of counts (5).

Figure 3.
Needle–needle spark gap with thin needle (a), needle–needle spark gap with conical electrodes with a needle angle of α = 20° (b), needle–plate spark gap (c).
Figure 3.
Needle–needle spark gap with thin needle (a), needle–needle spark gap with conical electrodes with a needle angle of α = 20° (b), needle–plate spark gap (c).

Figure 4.
Mean value of registered count of impulses within UV radiation range in the needle spark gap with the diameter of 0.23 mm (a); trend line representing the variations in the number of impulse counts in the function of the PD generation voltage (b).
Figure 4.
Mean value of registered count of impulses within UV radiation range in the needle spark gap with the diameter of 0.23 mm (a); trend line representing the variations in the number of impulse counts in the function of the PD generation voltage (b).

Figure 5.
Mean value of registered count of impulses within UV radiation range in the needle spark gap with the diameter of 0.40 mm (a); trend line representing the variations in the number of impulse counts in the function of the PD generation voltage (b).
Figure 5.
Mean value of registered count of impulses within UV radiation range in the needle spark gap with the diameter of 0.40 mm (a); trend line representing the variations in the number of impulse counts in the function of the PD generation voltage (b).

Figure 6.
Mean value of registered count of impulses within UV radiation range in the needle spark gap with the diameter of 0.50 mm (a); trend line representing the variations in the number of impulse counts in the function of the PD generation voltage (b).
Figure 6.
Mean value of registered count of impulses within UV radiation range in the needle spark gap with the diameter of 0.50 mm (a); trend line representing the variations in the number of impulse counts in the function of the PD generation voltage (b).

Figure 7.
Example results of PD measurements with UV camera, generated on a needle–needle spark gap for the following gain (G) parameters: G = 100 (a), G = 150 (b).,G = 200 (c), G = 250 (d).
Figure 7.
Example results of PD measurements with UV camera, generated on a needle–needle spark gap for the following gain (G) parameters: G = 100 (a), G = 150 (b).,G = 200 (c), G = 250 (d).

Figure 8.
Relation between the number of counts of UV impulses and UV camera gain and their distance from the source of PD generation for the following electrode systems: PD generation voltage U = 13 kV, distance between needle electrodes 2 cm (a); PD generation voltage U = 15 kV, distance between needle electrodes 2 cm (b); PD generation voltage U = 24.2 kV, distance between needle electrodes 4 cm (c); PD generation voltage U = 27.4 kV, distance between needle electrodes 4 cm (d).

Figure 9.
Relation between the number of counts of UV impulses and the parameter representing camera gain for various conditions of PD generation: PD generation voltage U = 13.0 kV, distance between electrodes d = 2.0 cm (a); PD generation voltage U = 15.0 kV, distance between electrodes d = 2.0 cm (b).

Figure 10.
Relation between the number of counts of UV impulses and the parameter representing camera gain for various conditions of PD generation: PD generation voltage U = 24.2 kV, distance between electrodes d = 4.0 cm (a); PD generation voltage U = 27.4 kV, distance between electrodes d = 4.0 cm (b).

Figure 11.
Example results of PD measurements with UV camera, generated on a needle–plate spark gap for the following gain parameters: G = 100 (a), G = 150 (b).
Figure 11.
Example results of PD measurements with UV camera, generated on a needle–plate spark gap for the following gain parameters: G = 100 (a), G = 150 (b).

Figure 12.
Example results of PD measurements with UV camera, generated on a needle–plate spark gap for the following gain parameters: G = 200 (a), G = 250 (b).
Figure 12.
Example results of PD measurements with UV camera, generated on a needle–plate spark gap for the following gain parameters: G = 200 (a), G = 250 (b).

Figure 13.
Characteristics of the dependence between the count of UV impulses and distance from the camera to the source of PDs for different values of camera gain parameter (a) and comparative characteristics of the dependence of the counts of UV impulses on the camera gain value for different distances from the camera to the PD’s source (b). PD generation voltage U = 24 kV, for a distance between electrodes of 3 cm.

Figure 14.
Characteristics of the dependence between the count of UV impulses and distance from the camera to the source of PDs for different values of camera gain parameter (a) and comparative characteristics of the dependence of the counts of UV impulses on the camera gain value for different distances from the camera to the PD’s source (b). PD generation voltage U = 31 kV, for a distance between electrodes of 3 cm.

Figure 15.
Characteristics of the dependence between the count of UV impulses and distance from the camera to the source of PDs for different values of camera gain parameter (a) and comparative characteristics of the dependence of the counts of UV impulses on the camera gain value for different distances from the camera to the PD’s source (b). PD generation voltage U = 38 kV, for a distance between electrodes of 3 cm.

Figure 16.
Percent distribution of mean values of counts determined for specific distance from the UV camera for the needle–needle system, distance between electrodes d = 4 cm.
Figure 16.
Percent distribution of mean values of counts determined for specific distance from the UV camera for the needle–needle system, distance between electrodes d = 4 cm.

Figure 17.
Percent distribution of mean values of counts determined for specific distance from the UV camera for the needle–plate system, distance between electrodes d = 4 cm.
Figure 17.
Percent distribution of mean values of counts determined for specific distance from the UV camera for the needle–plate system, distance between electrodes d = 4 cm.


Table 1.
Summary of technical parameters of the DayCor Superb camera.
| Parameter | Value | Unit |
|---|---|---|
| UV spectral range | 250–280 | nm |
| Visible light range | 380–780 | nm |
| Sensitivity within UV range | 3 × 10⁻¹⁸ | W/cm2 |
| Minimum sensitivity of illumination | 1 | Lux |
| Matrix | 640 × 480 | Pixels |
| Lowest detectable PDs | 1.5 (for a distance of 8m) | pC |
| Presentation of UV image/visible light | Solid angle with accuracy greater than 1 | miliradian |
| Operating modes | Visible/UV/combined | - |
| Operating and storage temperatures | −20… +55 | °C |
“-” dimensionless unit.
Publisher’s Note: MDPI stays neutral with regard to jurisdictional claims in published maps and institutional affiliations. |
© 2021 by the authors. Licensee MDPI, Basel, Switzerland. This article is an open access article distributed under the terms and conditions of the Creative Commons Attribution (CC BY) license (https://creativecommons.org/licenses/by/4.0/).
Share and Cite
MDPI and ACS Style
Skubis, J.; Kozioł, M. Assessment of Partial Discharges in the Air by Application of Corona Camera. Appl. Sci. 2021, 11, 8595. https://0-doi-org.brum.beds.ac.uk/10.3390/app11188595
AMA Style
Skubis J, Kozioł M. Assessment of Partial Discharges in the Air by Application of Corona Camera. Applied Sciences. 2021; 11(18):8595. https://0-doi-org.brum.beds.ac.uk/10.3390/app11188595
Chicago/Turabian StyleSkubis, Jerzy, and Michał Kozioł. 2021. "Assessment of Partial Discharges in the Air by Application of Corona Camera" Applied Sciences 11, no. 18: 8595. https://0-doi-org.brum.beds.ac.uk/10.3390/app11188595
Note that from the first issue of 2016, this journal uses article numbers instead of page numbers. See further details here.