Article

Prediction and Remediation of Groundwater Pollution in a Dynamic and Complex Hydrologic Environment of an Illegal Waste Dumping Site

Department of Environmental Studies for Advanced Society, Graduate School of Environmental Studies, Tohoku University, Sendai 9808579, Japan
*
Author to whom correspondence should be addressed.
Submission received: 10 September 2021 / Revised: 27 September 2021 / Accepted: 30 September 2021 / Published: 4 October 2021

Abstract

:
The characteristics of groundwater pollution caused by illegal waste dumping and methods for predicting and remediating it are still poorly understood. Serious 1,4-dioxane groundwater pollution—which has multiple sources—has been occurring at an illegal waste dumping site in the Tohoku region of Japan. So far, anti-pollution countermeasures have been taken including the installation of an impermeable wall and the excavation of soils and waste as well as the monitoring of contamination concentrations. The objective of this numerical study was to clarify the possibility of predicting pollutant transport in such dynamic and complex hydrologic environments, and to investigate the characteristics of pollutant transport under both naturally occurring and artificially induced groundwater flow (i.e., pumping for remediation). We first tried to reproduce the changes in 1,4-dioxane concentrations in groundwater observed in monitoring wells using a quasi-3D flow and transport simulation considering the multiple sources and spatiotemporal changes in hydrologic conditions. Consequently, we were able to reproduce the long-term trends of concentration changes in each monitoring well. With the predicted pollutant distribution, we conducted simulations for remediation such as pollutant removal using pumping wells. The results of the prediction and remediation simulations revealed the highly complex nature of 1,4-dioxane transport in the dumping site under both naturally occurring and artificially induced groundwater flows. The present study suggests possibilities for the prediction and remediation of pollution at illegal waste dumping sites, but further extensive studies are encouraged for better prediction and remediation.

1. Introduction

Many areas around the world still rely heavily on groundwater for daily water consumption. Thus, the maintenance of a suitable groundwater quality is crucial [1,2,3,4,5]. During the 2000s, however, various human activities significantly impacted groundwater quality and availability through various forms of pollution [4], with landfills, mines, and industrial plants being some of the main sources of groundwater pollutants [6,7]. The most common pollutants include heavy metals, non-aqueous phase liquids (NAPLs), and volatile organic compounds (VOCs) [8,9]. These pollutants are hazardous chemicals that can potentially negatively impact human health. Unfortunately, pollution from illegal waste dumping sites also occurs, causing serious health and environmental problems [10,11]. Previous studies have demonstrated that the respiratory exposure of VOCs via the inhalation route is associated with the risk of specific diseases [12]. However, the characteristics of pollution caused by illegal waste dumping as well as ways of predicting and addressing the problem are still poorly understood. This limited understanding is due to the dynamic and highly complex nature of pollution caused by illegal waste dumping, and the complexity originates from multiple pollution sources and the artificially induced pollution-prevention changes (e.g., excavation and pumping) in hydrologic environments.
At illegal waste dumping sites, pollutants leak from the waste to the groundwater over a long period of time. At the time of discovery, the distribution of contamination may be widespread, requiring countermeasures such as monitoring and remediation, which generally require considerable time and expense [13,14,15]. Consequently, it would be desirable to understand the characteristics of pollutant transport and to predict it in dynamic and complex hydrologic environments in illegal waste dumping sites [16]. For this purpose, simulations of pollutant transport in the presence of groundwater flow require consideration of the characteristic history of the illegal waste dumping site in addition to the conventionally considered subsurface flow and transport properties [17,18]. However, such simulations have not been conducted yet.
In the prefecture of the Tohoku region, Japan, an illegal dumping site was discovered in 1990, with various countermeasures having been implemented to date (2021) due to the existence of 1,4-dioxane groundwater pollution—a regulated substance (groundwater standard: ≤0.05 mg/L) [19,20,21,22,23]. At this site, multiple pollutant sources have been expected based on data from monitoring wells, and multiple countermeasures (e.g., the installation of impermeable walls) that potentially impact the hydrologic environment have been implemented. 1,4-Dioxane is highly miscible with water, and its biodegradation and adsorption to soil may be neglected [24,25,26], making this site suitable for fundamental studies on pollutant transport in the dynamic and complex hydrologic environments of illegal waste dumping sites. In this context, the objective of this study was to clarify the possibility of numerically predicting pollutant transport in the dynamic and complex hydrologic environments at this site in Japan, and to investigate the characteristics of pollutant transport under both naturally occurring and artificially induced groundwater flow using various countermeasures including remediation with pumping.

2. Materials and Methods

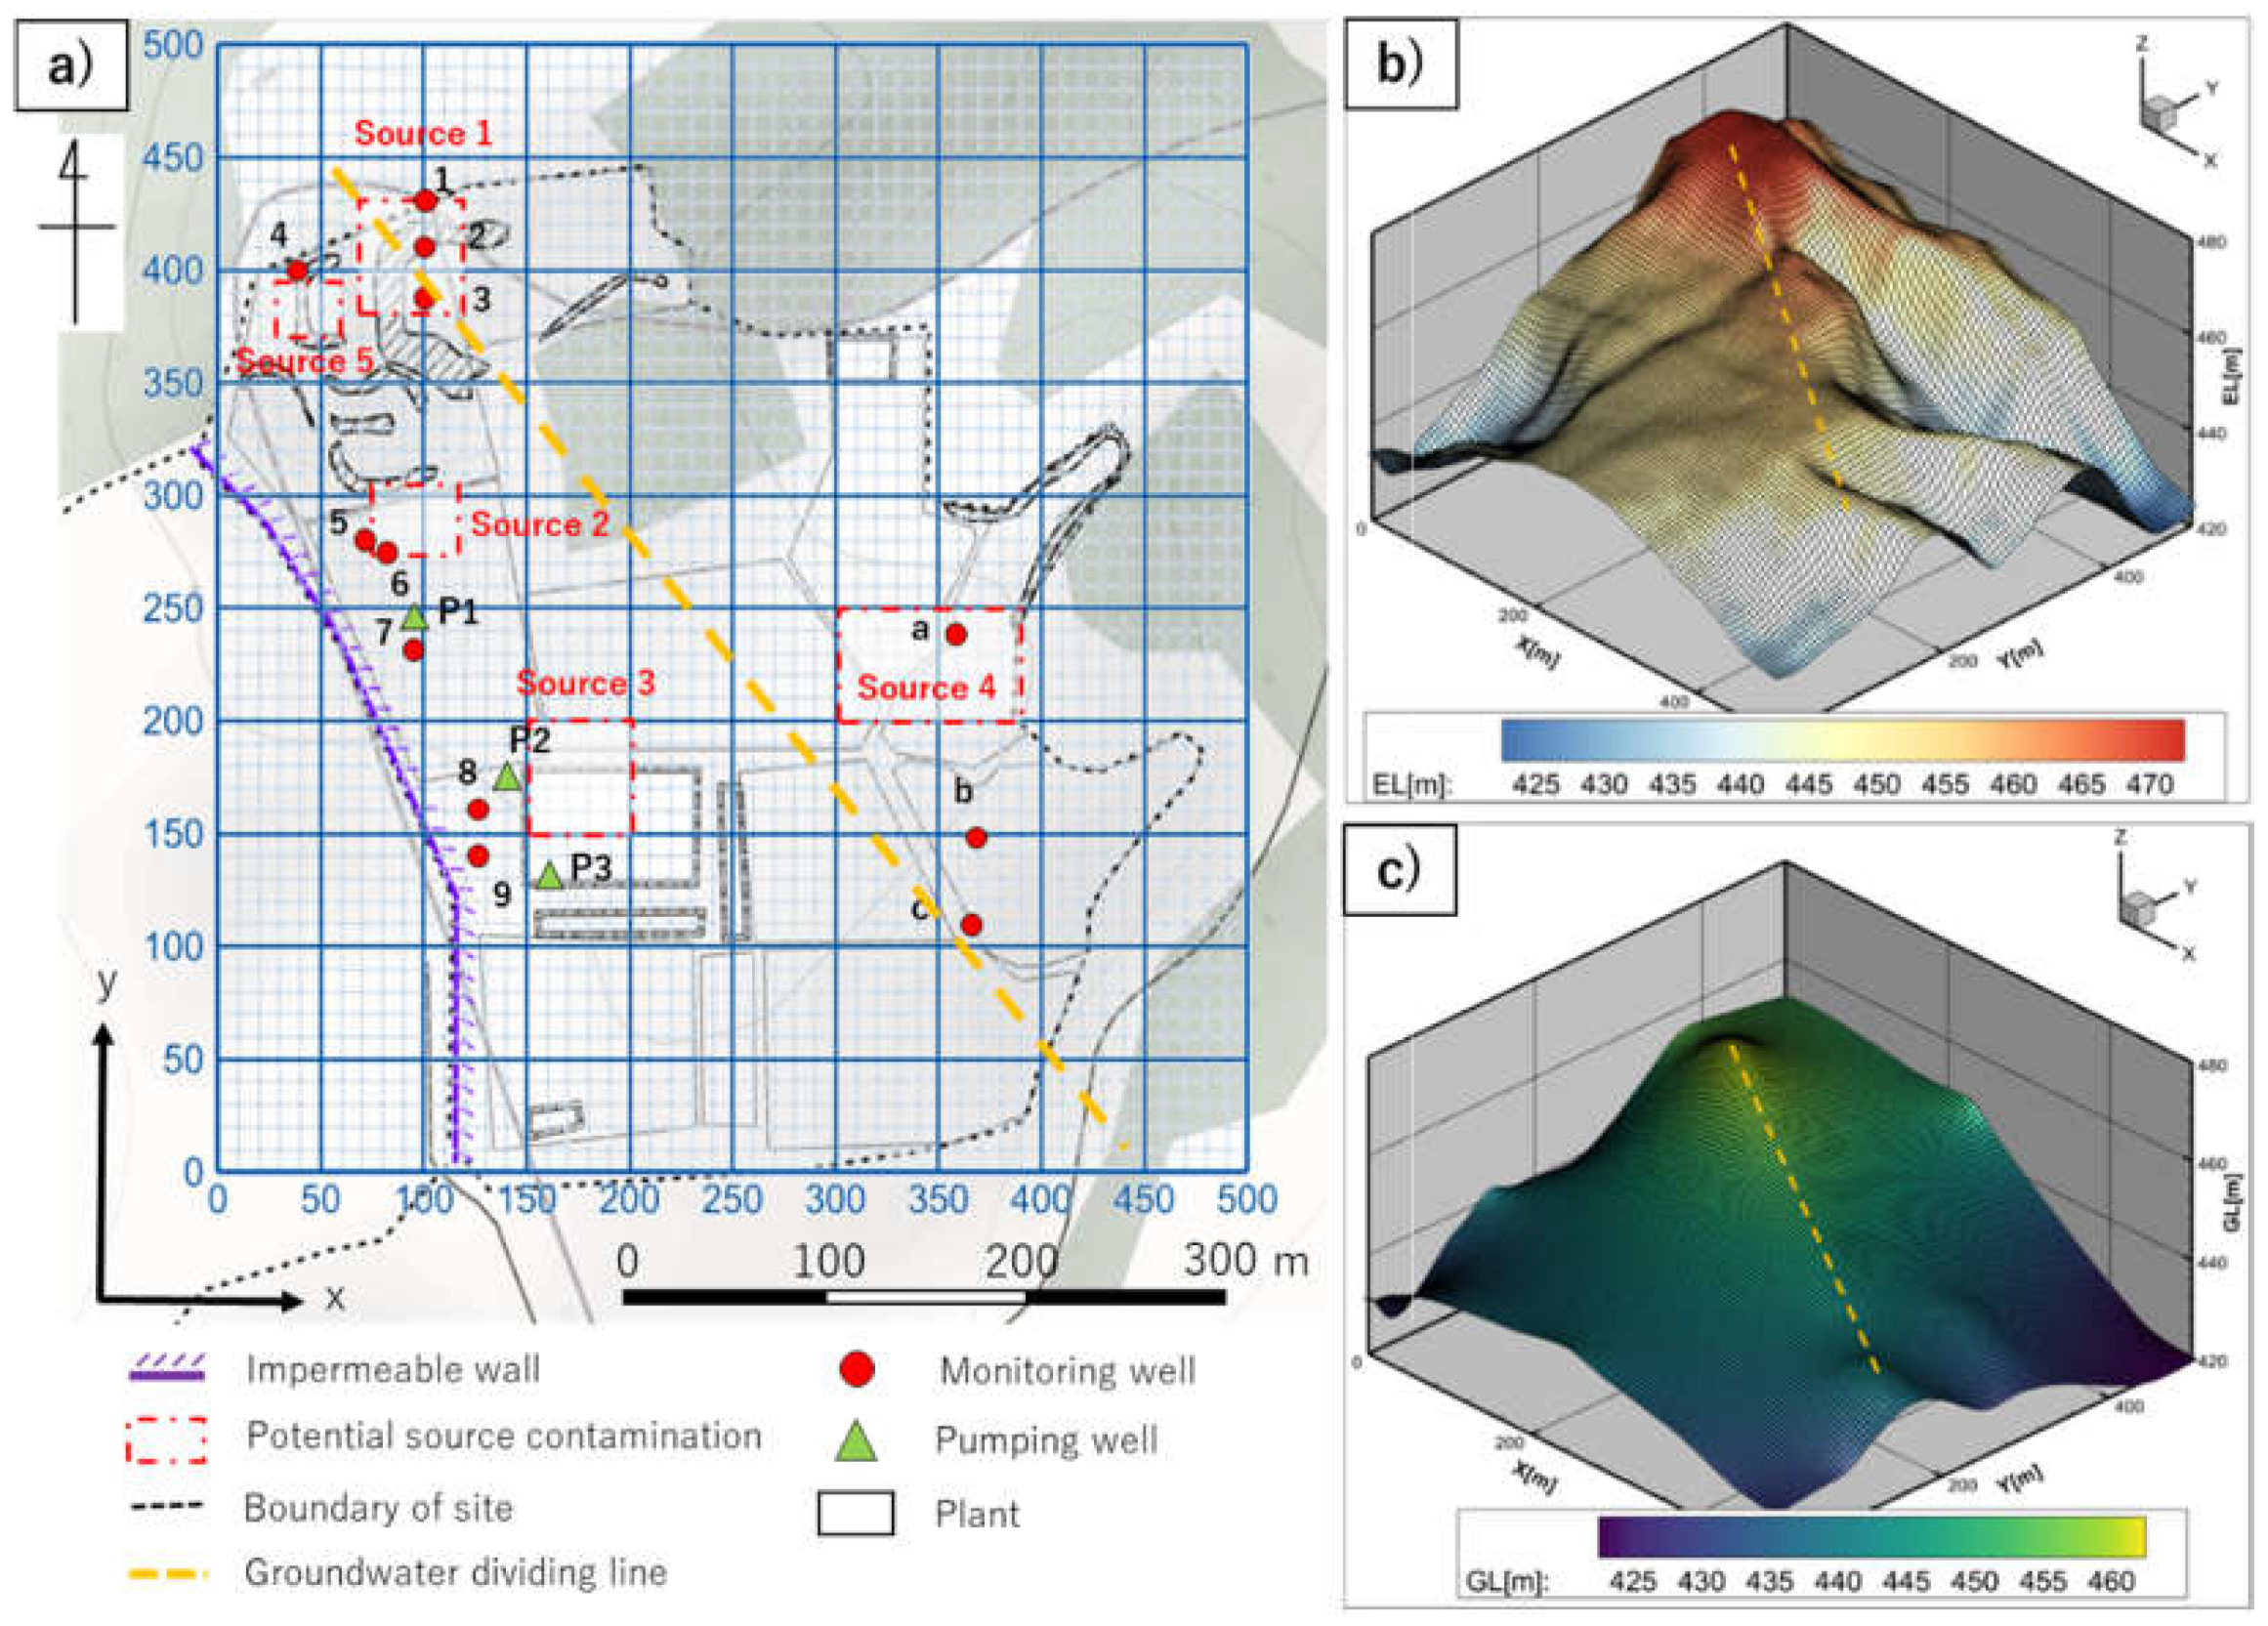
2.1. Site Information

History of Site Modification and Monitoring 1,4-dioxane
The illegal waste dumping site is located in the Tohoku region of Japan, Figure 1 shows a map of the site. The site covers an area of approximately 0.16 square kilometers and has illegally collected and buried industrial waste for decades. Approximately 270,000 m3 of waste has been dumped at this site including incinerator ash, sludge, and refuse-derived fuel materials, which has caused the spread of serious contaminants in both the soil and groundwater.
Table 1 shows the history of the illegal waste dumping. A company started illegally dumping waste in the 1990s, and when the local government in one of Japan’s prefectures discovered this, they immediately conducted a site survey. The prefectural government conducted an initial field survey in 2000, and for 10 years (from 2004 to 2014), it conducted additional surveys, observed groundwater contamination, and cleaned up the buried waste. To prevent groundwater from the waste burial site in one prefecture from contaminating the neighboring prefecture, a barrier wall (i.e., impermeable wall) was installed along the prefectural border (between 2005 and 2007). In 2009, the municipality implemented a groundwater treatment plant, installing pumping wells along the barrier wall in 2010. Moreover, the municipality monitored and documented 1,4-dioxane contamination from 2013 to 2020, as 1,4-dioxane had been detected in monitoring wells installed on the site.
This study focused on an area of 500 × 500 m for this site, as shown in Figure 1. For this area, the elevation and groundwater levels were obtained from a Geological Information System (GIS) and site investigation data [27]. There is a groundwater divide in this area, which divides groundwater flow into two major directions. The groundwater level was used to determine the flow potential in the governing equations for subsurface flows as described below.

2.2. Flow and Transport Simulation

2.2.1. Governing Equation

In this study, the aquifer was assumed to be a single layer with a thickness of 5 m because it was difficult to obtain a detailed geological cross section of the aquifer. The flow in the aquifer was modeled as a 2D two-phase flow of water and non-aqueous phase liquid (NAPL) in the x-y coordinates, where NAPL is 1,4-dioxane [27]. However, the flow potential of the model takes into account the groundwater level (i.e., difference between land surface elevation and depth to water). As a result, the model is a quasi 3D model. The governing equations for the flows for NAPL and groundwater with/without dissolved NAPL and the advection-diffusion equation for NAPL in water are respectively represented by Equations (1)–(3), as follows.
x ( K k r o μ o ρ o x Φ o ) + y ( K k r o μ o ρ o y Φ o ) = ( ρ o S o ) t
x ( K k r w μ w ρ w x Φ w ) + y ( K k r w μ w ρ w y Φ w ) = ( ρ w S w ) t
x ( x o c w , k K k r w μ w ρ w x Φ w ) + y ( x o c w , k K k r w μ w ρ w y Φ w ) + x [ D o c w , k x ( x o c w , k φ ρ w S w ) ] + y [ D o c w , k y ( x o c w , k φ ρ w S w ) ] = ( x o c w , k φ ρ w S w ) t
where K is the absolute permeability (m2); kro is the relative permeability for NAPL (fraction) [28,29,30]; krw is the relative permeability for water (fraction) [28,29,30]; μo is the NAPL viscosity (Pa·s); μw is the water viscosity (Pa·s); ρo is the molar density of NAPL (mol/m3); ρw is the molar density of water (mol/m3); Φo is the flow potential of NAPL (Pa); Φw is the flow potential of water (Pa); So is the NAPL saturation (fraction); Sw is the water saturation (fraction); φ is the porosity (fraction); Docw,k is the diffusion coefficient (m2/s); xocw,k is the concertation of NAPL dissolved in water (fraction); and t is time (s). The parameter values used in this study are listed in Table 2. The parameter values for the groundwater layer were set by assuming a clay soil, and the parameter values for 1,4-dioxane were acquired from a database [31,32,33]. Note that the biodegradation and adsorption to soil for 1,4-dioxane were neglected based on the chemical properties of 1,4-dioxane [34].
These governing equations were solved using the finite difference method by applying the implicit pressure explicit saturation solution method [36] for implicit solutions for pressure and explicit solutions for saturation and concentration. To solve the governing equations, the 500 × 500 m area shown in Figure 1 was divided into a 5 × 5 m grid, and a hydrologically opened boundary condition was applied for each 500 m side and a constant flow-rate boundary for each pumping well. The water level was kept constant at the hydrologically opened boundaries. No detailed geological data were available for the sites targeted in this study. Therefore, the layer was assumed to be a single layer with the parameters used in Table 2.

2.2.2. Prediction and Remediation Simulations

The prediction simulation computed the evolution of the groundwater flow and the concentration of 1,4-dioxane from their initial conditions based on the history of the illegal waste dumping site (Table 1). The initial groundwater flow was determined based on the distribution of the groundwater level (GL) (Figure 1). The initial concentrations of 1,4-dioxane for the assumed contamination source areas 1–5, shown in Figure 1, were obtained by applying a constant annual input rate of 1,4-dioxane from the waste/contaminated soils for each grid within each source area, whereas the initial concentration was set to zero for the other locations. The input rate was set to zero to simulate the removal of waste/contaminated soils after excavation. The total input volume of 1,4-dioxane for each area is listed in Table 3, which indicates that Source 1 is where the largest amount of 1,4-dioxane was discarded. To simulate the permeability changes due to the installation of the impermeable wall, the absolute permeability at the corresponding location after the wall installation was changed to 1.00 × 10⁻¹⁵ m2. Additionally, when monitoring wells were added, the corresponding grids were changed to a constant flow-rate boundary at a prescribed discharge rate (pumping rate). More specifically, the pumping rates were 10 m3/day for pumping well 1, 31 m3/day for pumping well 2, and 23 m3/day for pumping well 3, respectively [37].
In the remediation simulation, the 40-year evolution of groundwater flow and the concentrations of 1,4-dioxane from the final conditions in the prediction simulation were computed. We conducted two types of remediation simulations considering passive and active treatments with pumping [37,38]. The concentration of 1,4-dioxane in the studied area was expected to decrease during the passive and active treatments due to dilution and removal, respectively, by naturally occurring and pumping-induced groundwater. In the remediation simulation with active treatment, in addition to preexisting pumping wells 1–3, the monitoring wells were used as new pumping wells at a constant pumping rate of 250 m3/day. Table 4 summarizes the pumping rates of each well.

3. Results and Discussion

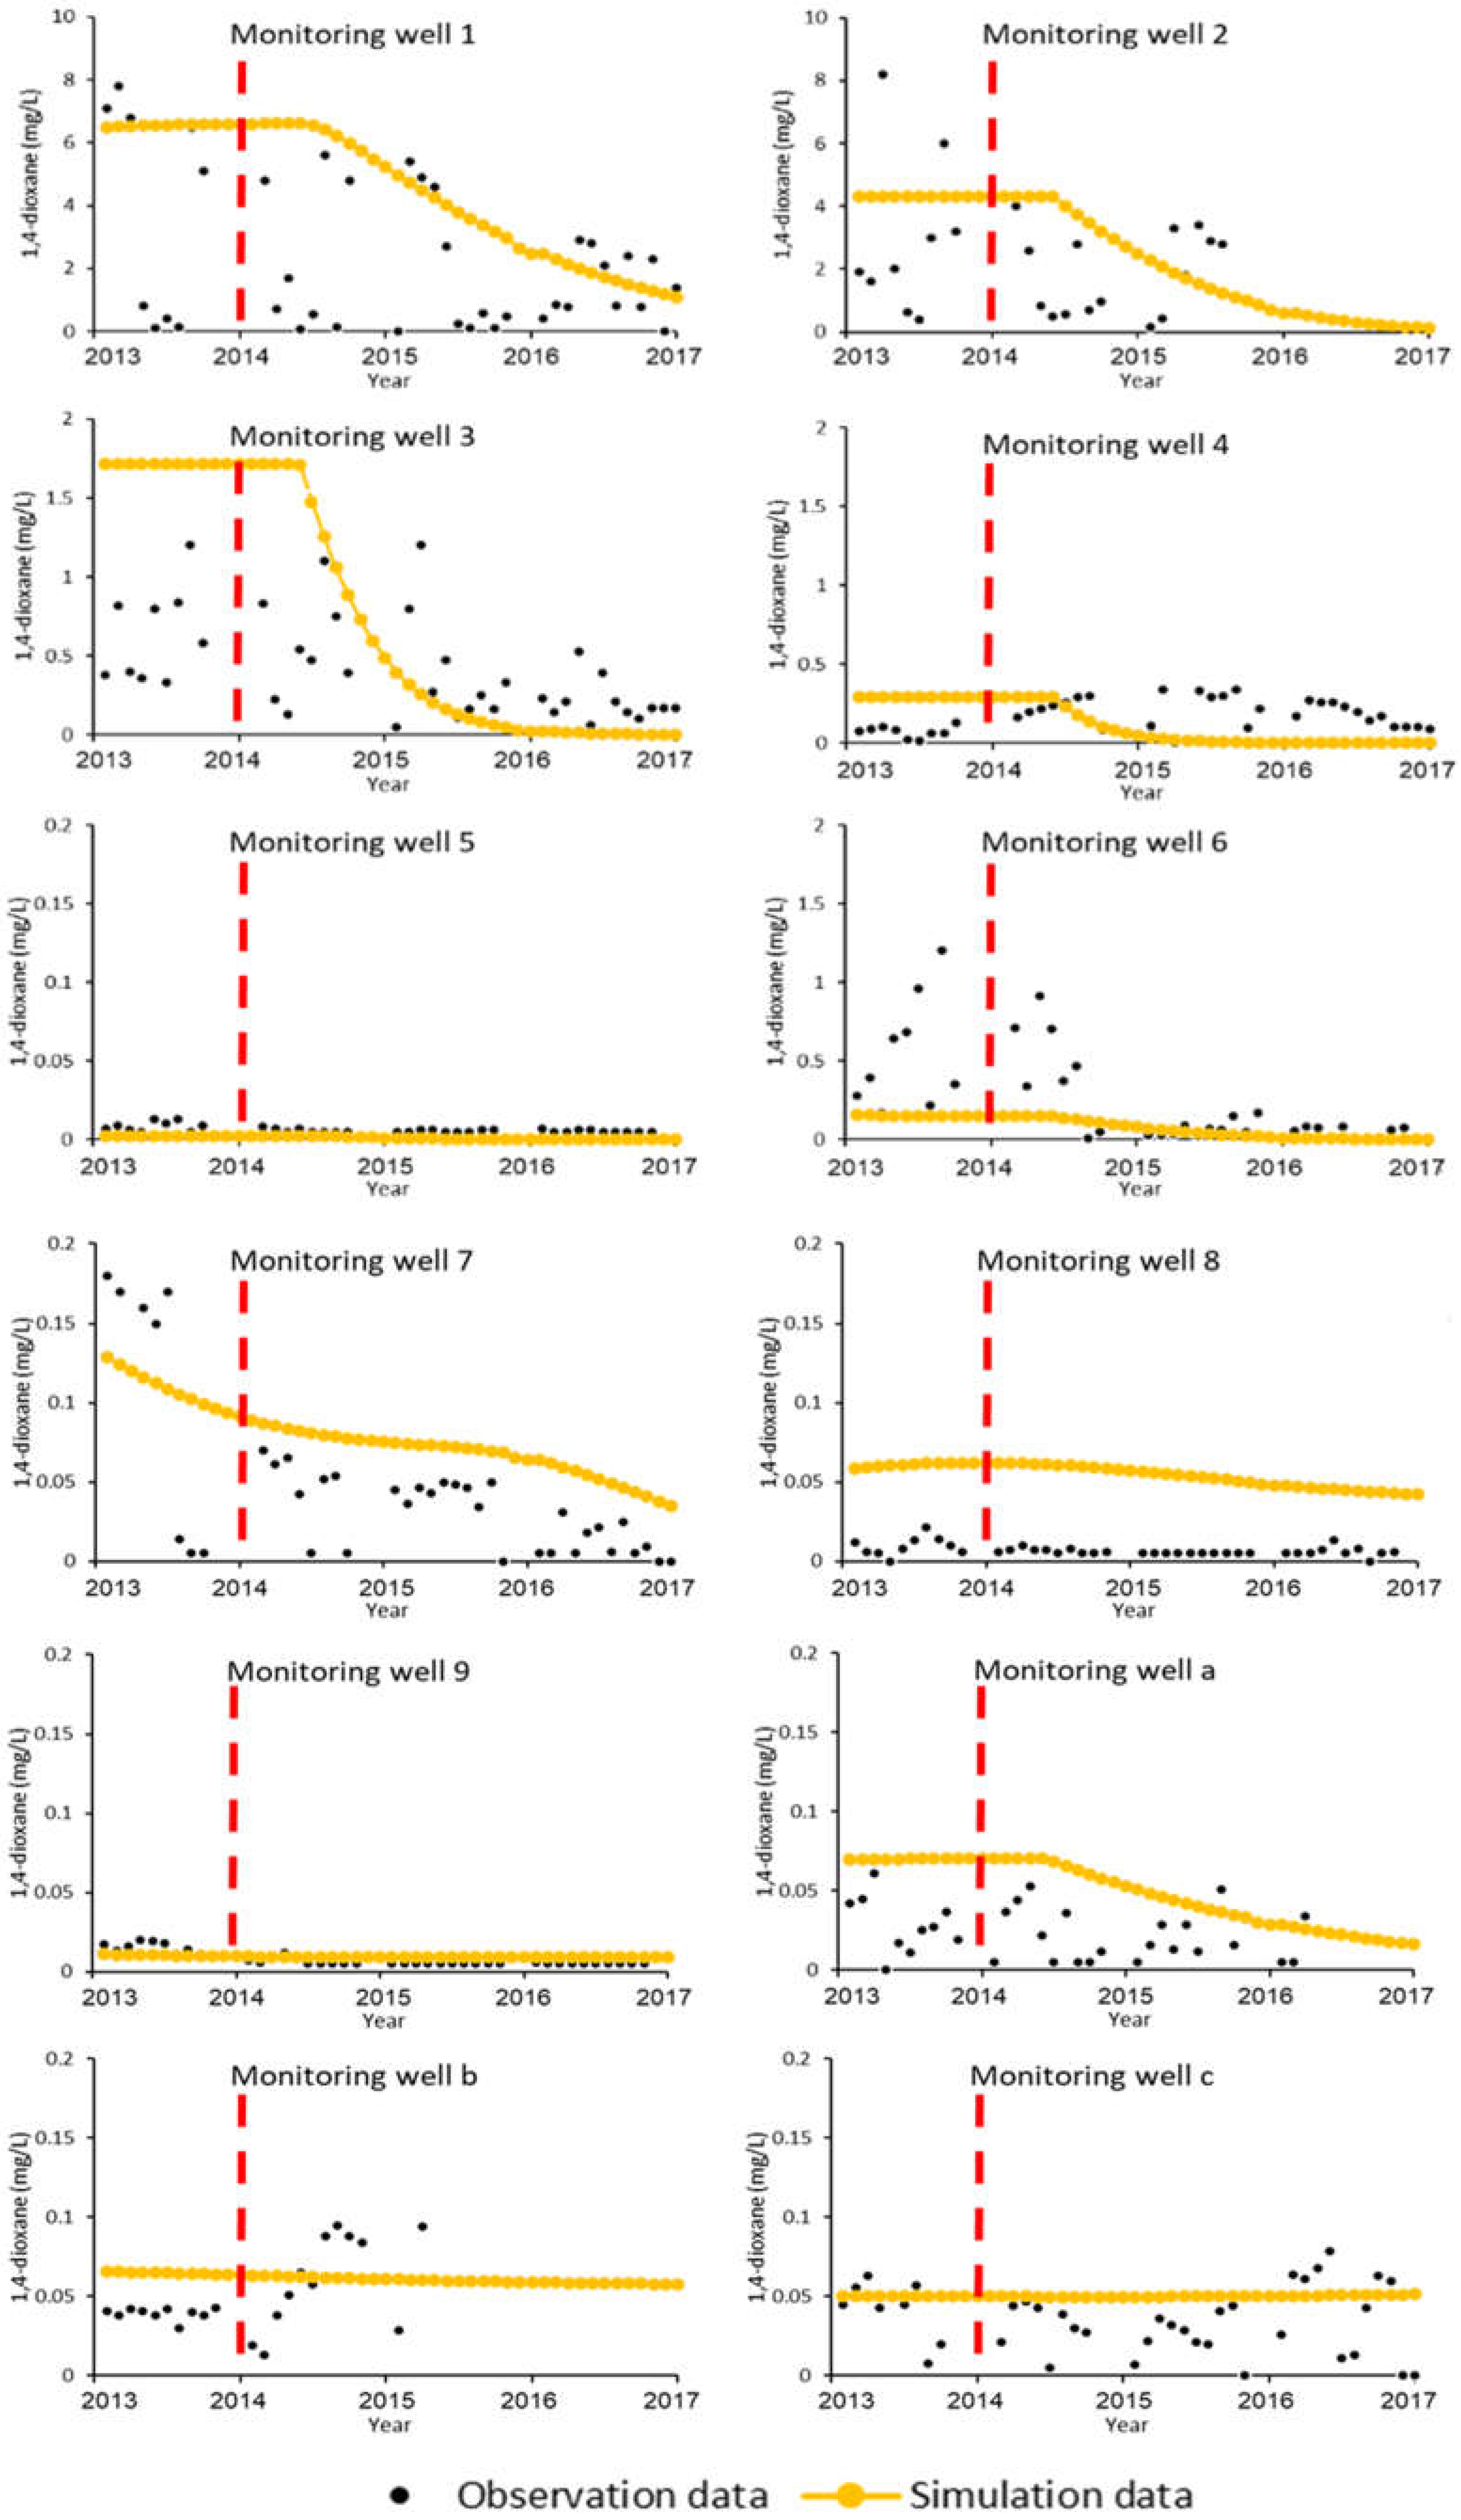
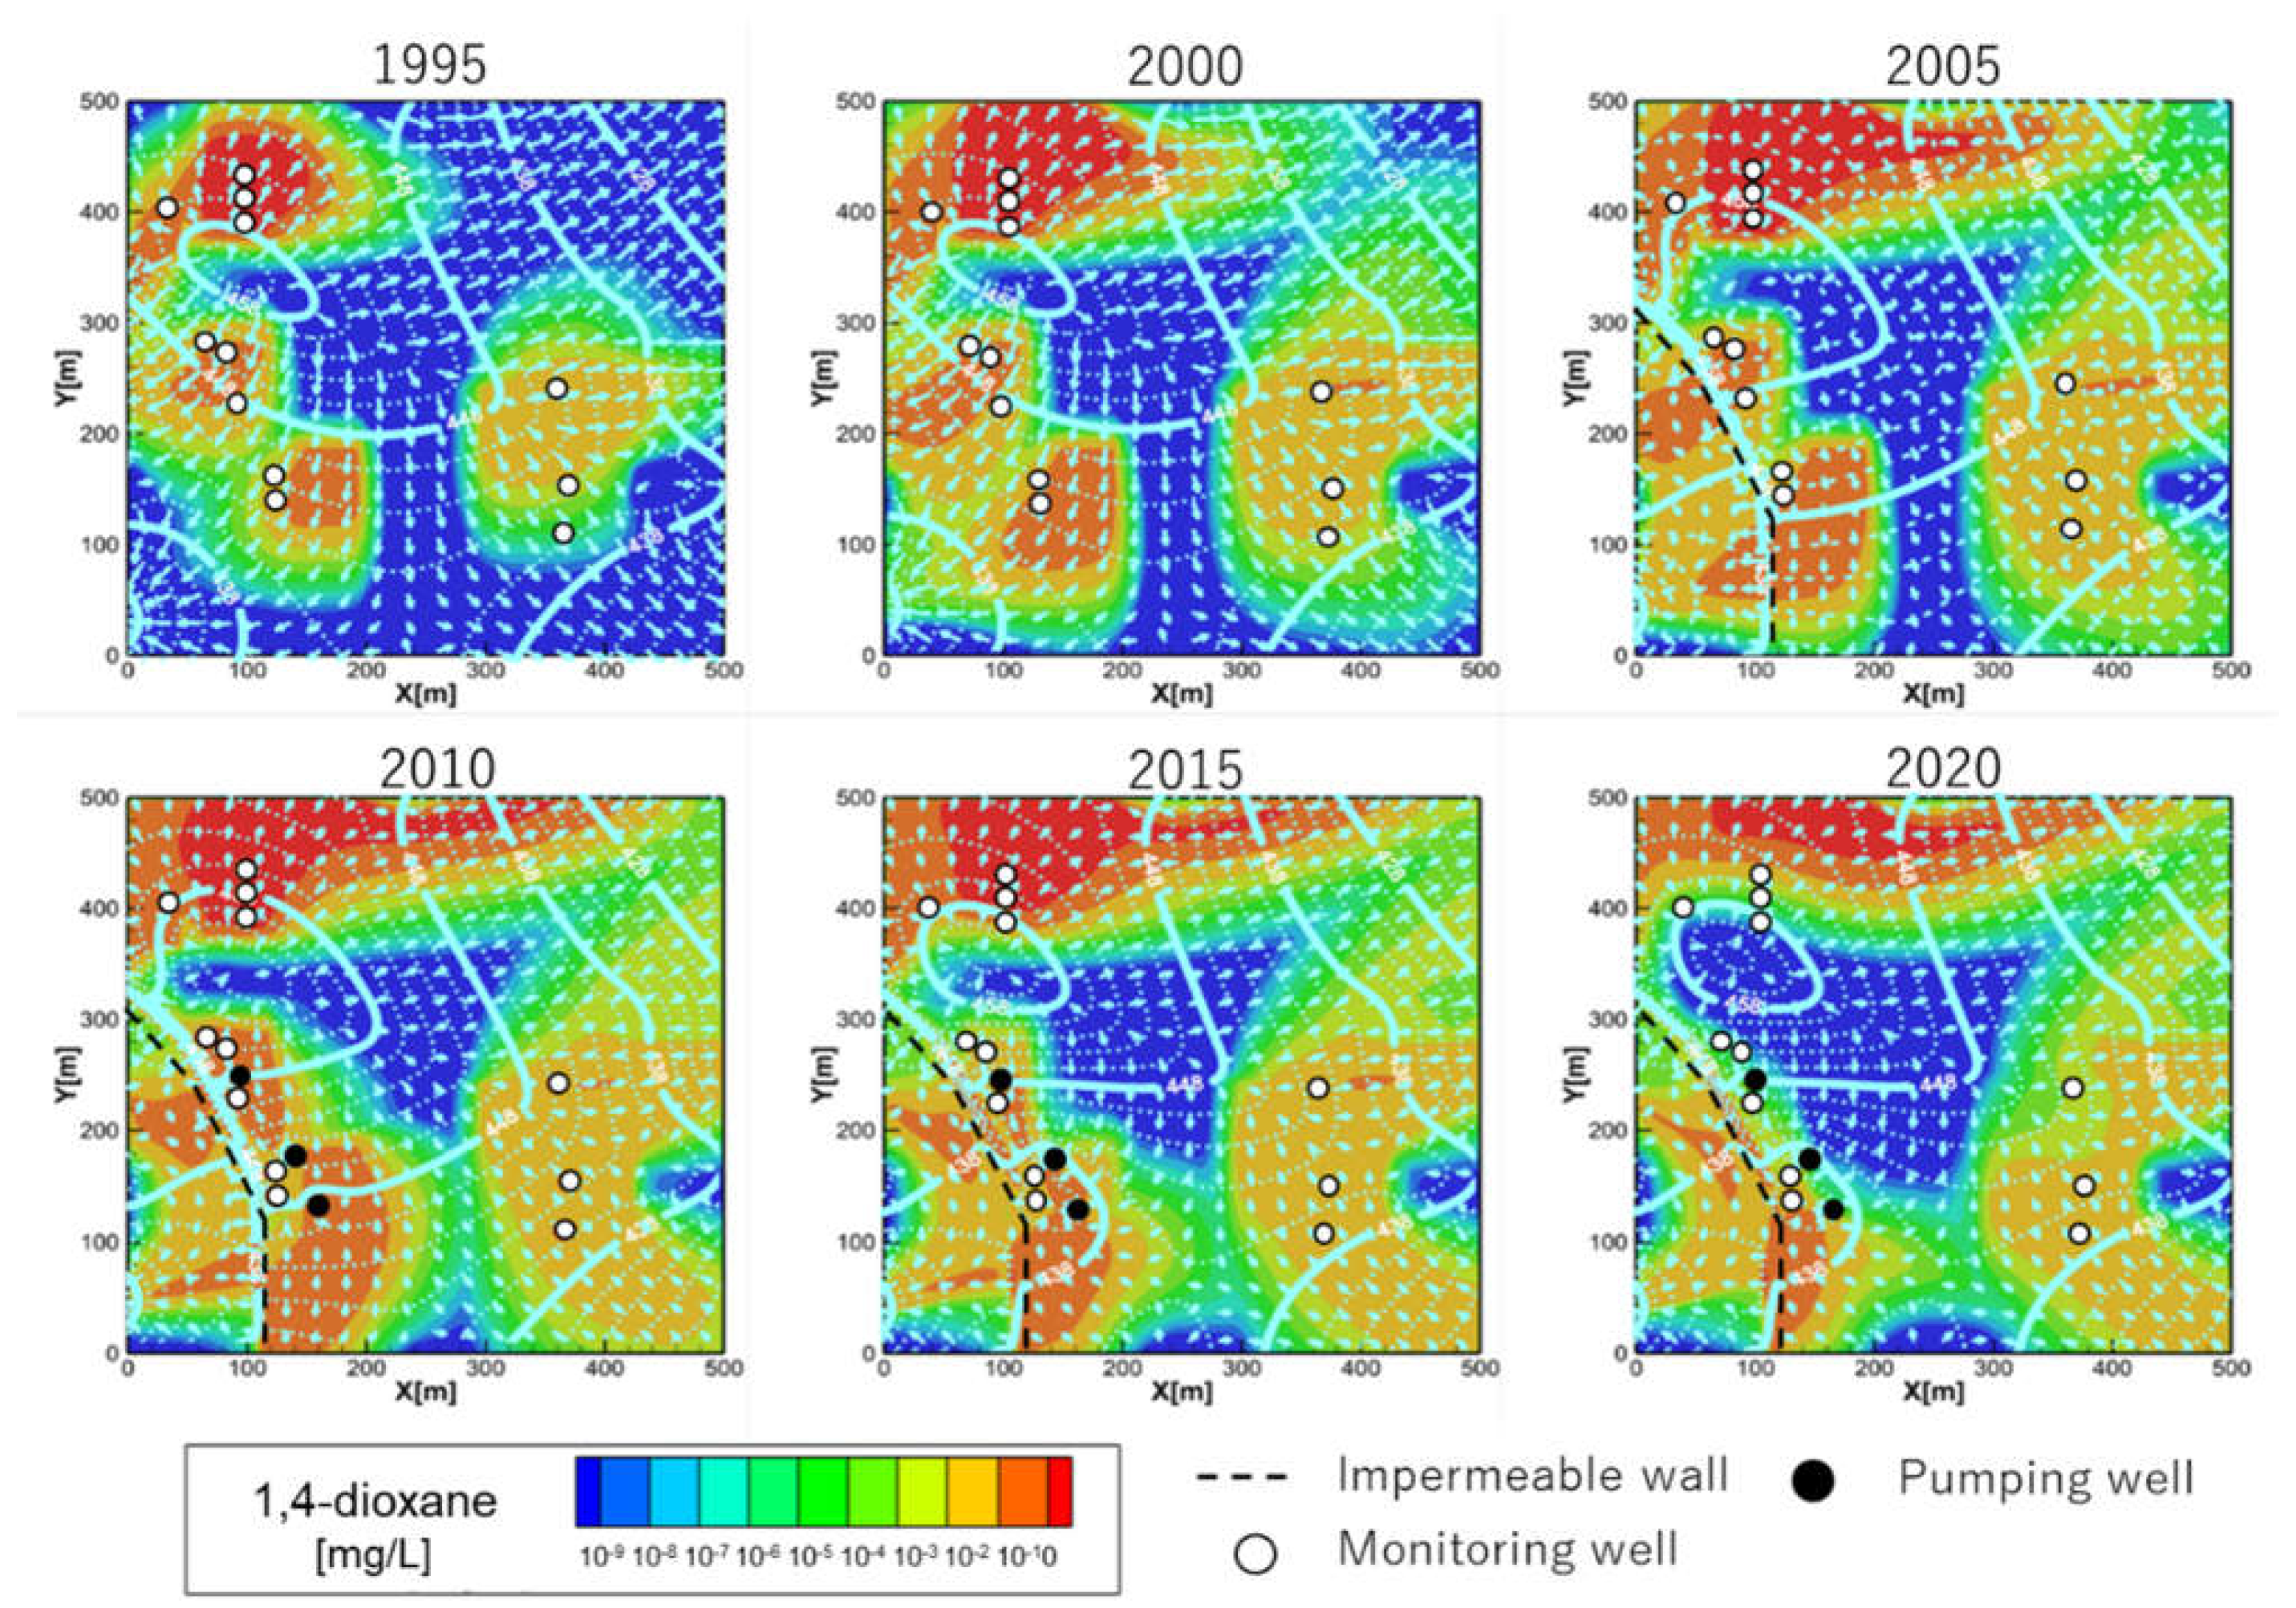
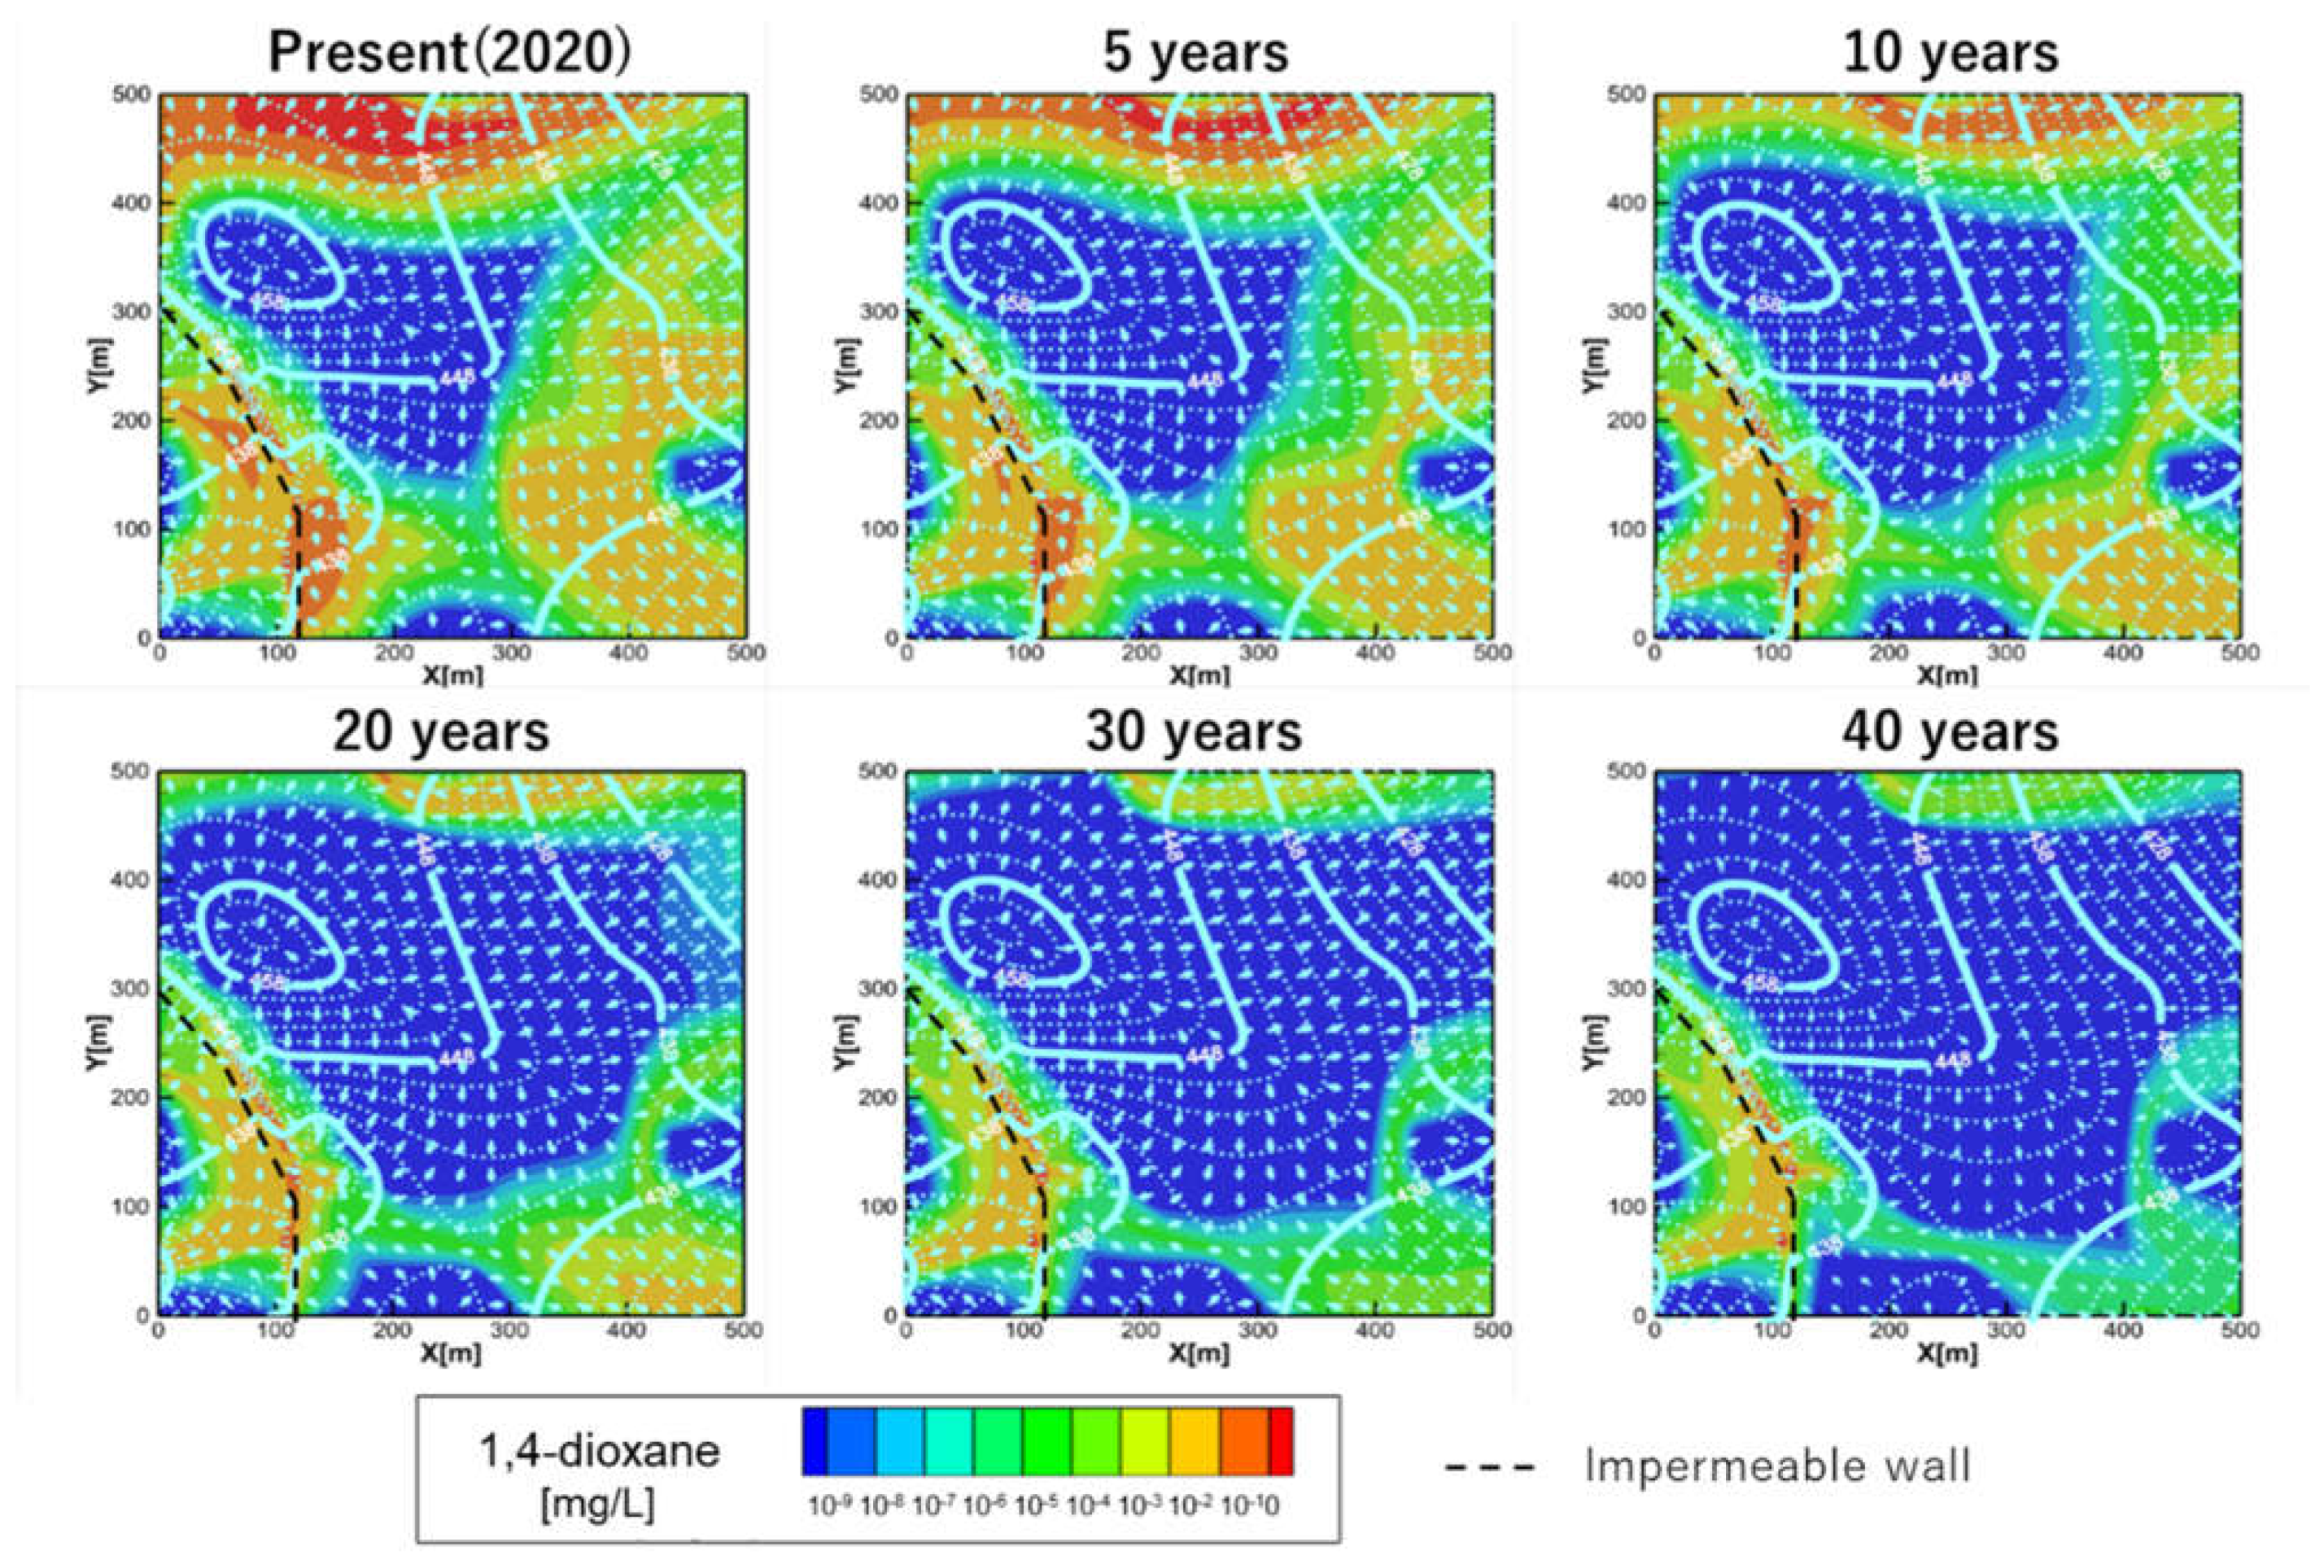
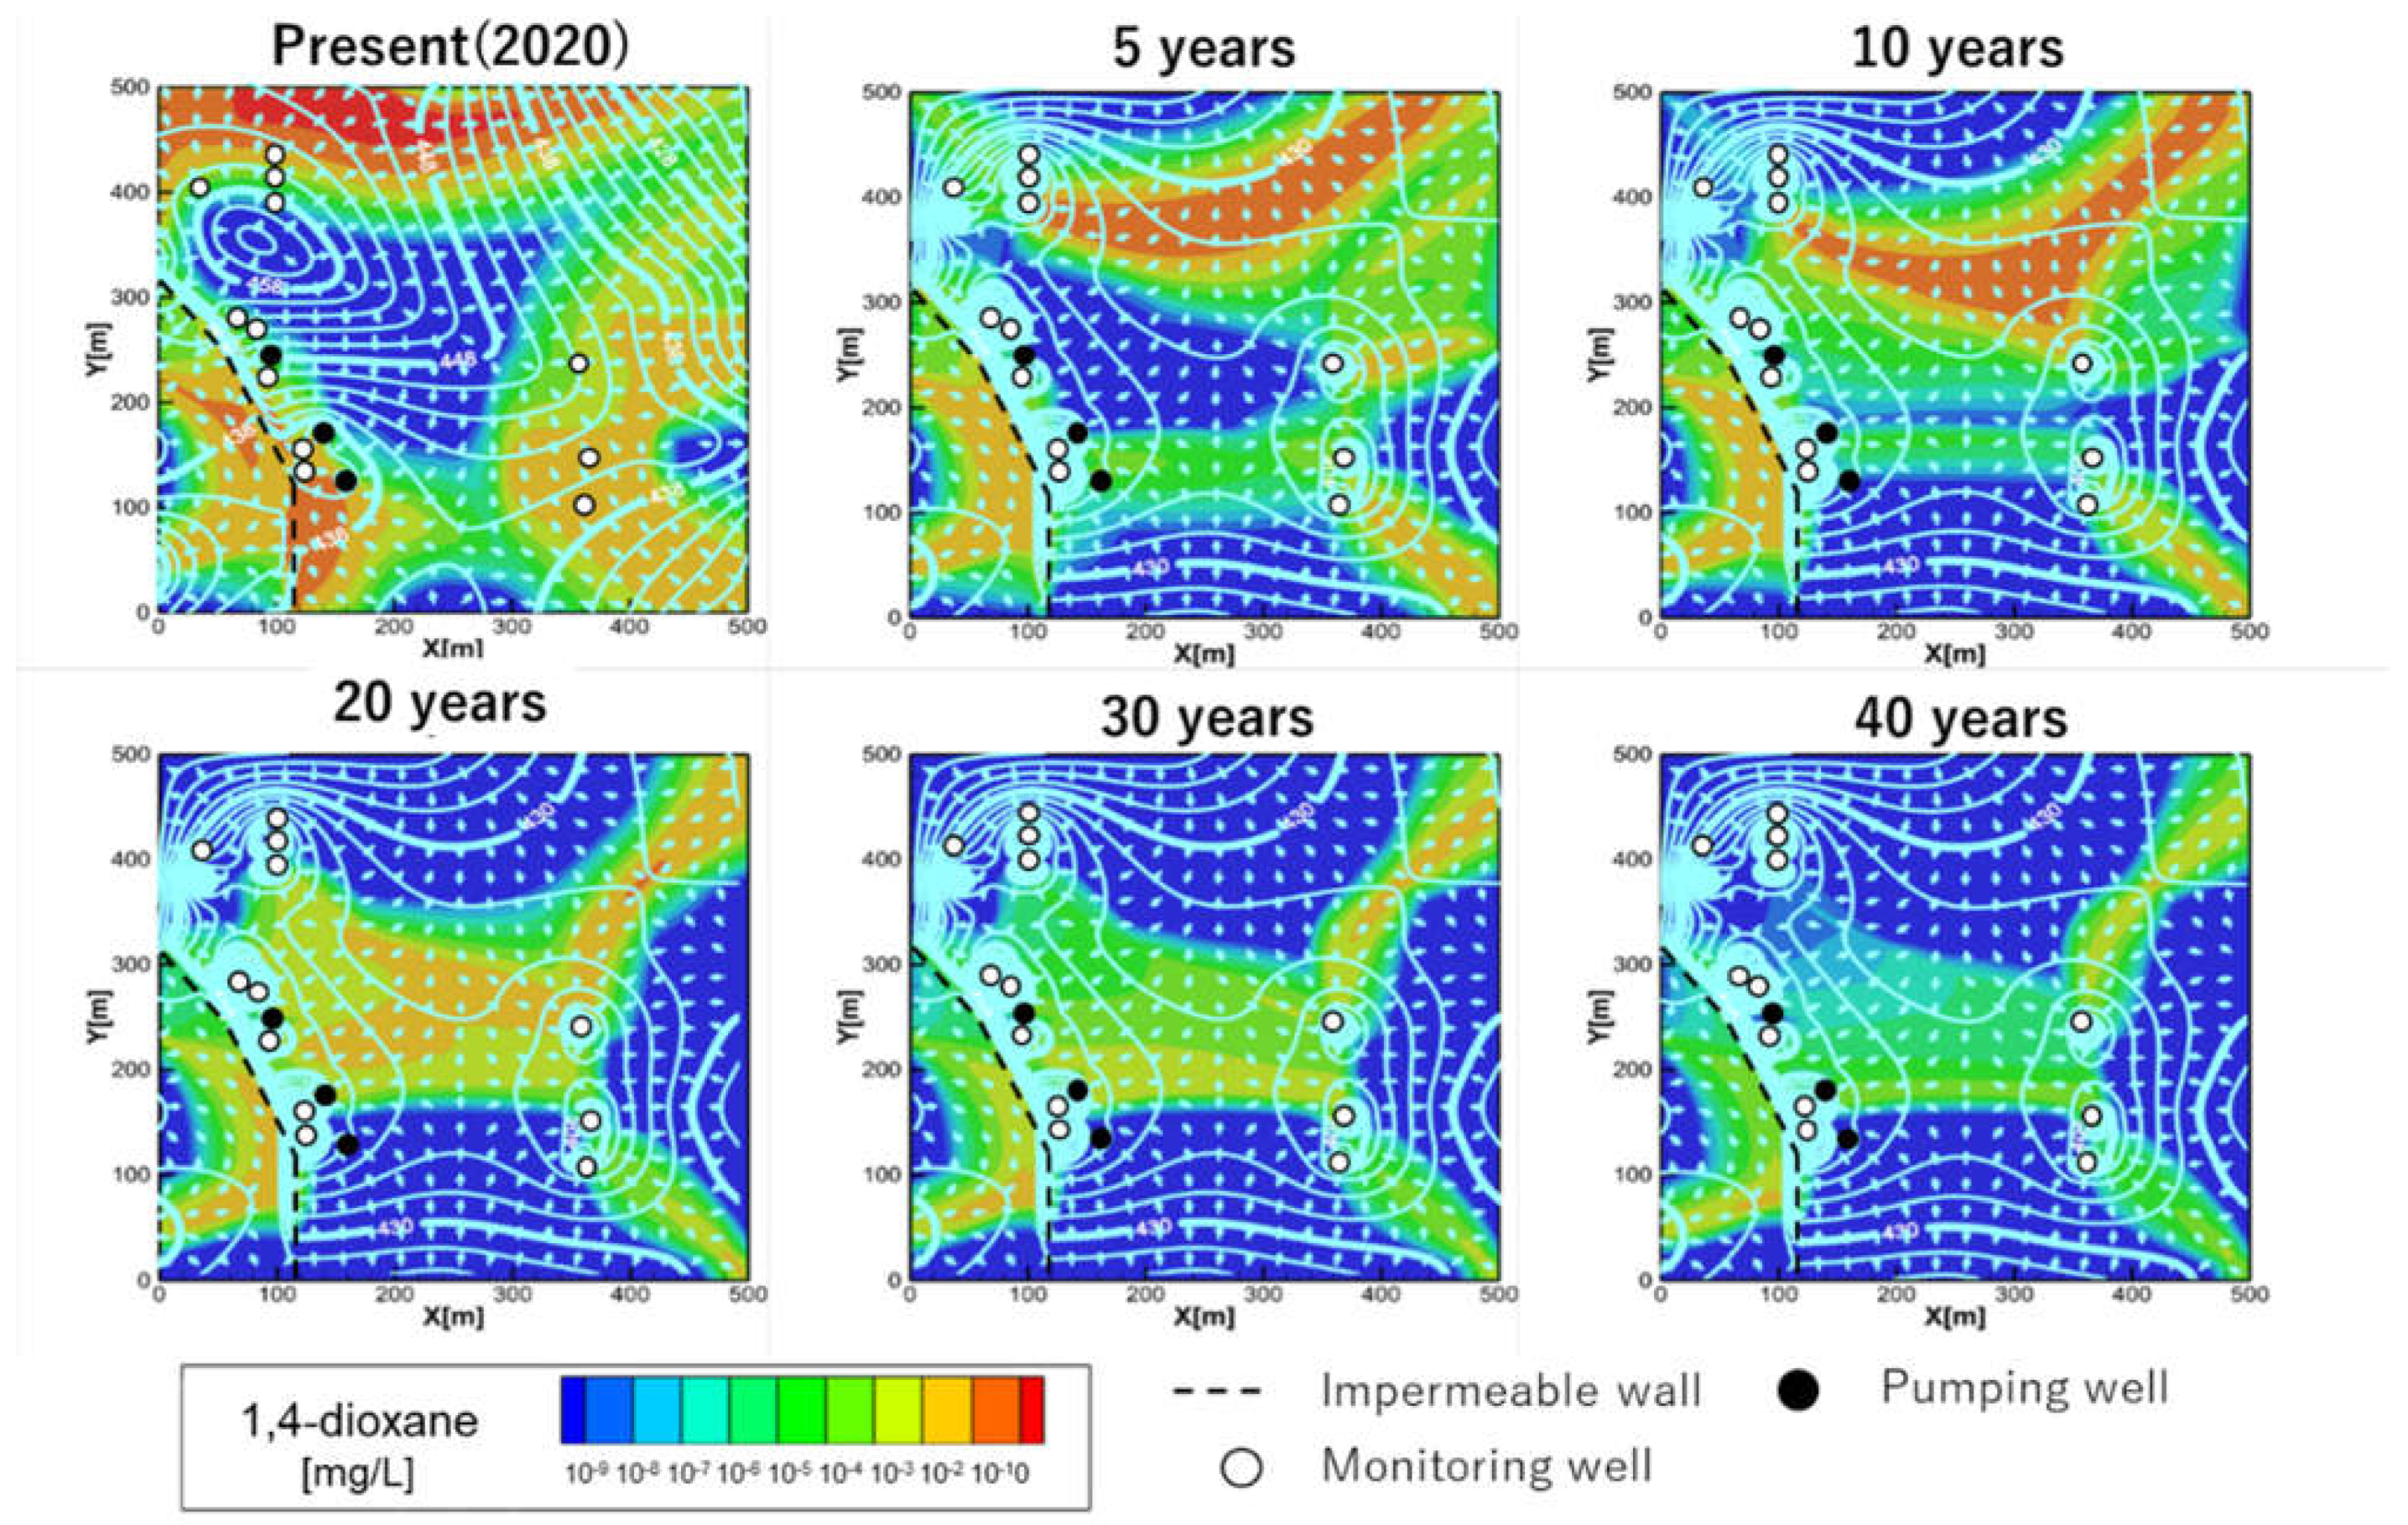
3.1. Reproduction of Concentration of 1,4-Dioxane Groundwater Pollution in Monitoring Well and Distribution Prediction

A comparison between the reproduced 1,4-dioxane concentrations in each monitoring well using a model that considered groundwater flow (Figure 1) and the field monitoring data is shown in Figure 2. Between 2013 and 2017 (4 years), the reproduced data and monitoring data for all monitoring wells generally exhibited good fitting results. In 2013, both reproduced data and observed data showed relatively higher 1,4-dioxane concentrations in monitoring wells 1, 2, and 3 for Source 1, and monitoring well 6 for Source 2 than in the other wells. Significant decreases in 1,4-dioxane concentration were observed from 2014, when the excavation was completed. The good fitting results suggest that predicting the 1,4-dioxane concentrations by considering groundwater flow is possible due to its water-soluble characteristics.
It should be noted that in terms of short periods of time such as each year, the reproduced 1,4-dioxane concentration did not fit well with the monitoring data. All monitoring wells, especially monitoring wells 1, 2, and 3, demonstrated highly fluctuating 1,4-dioxane concentrations each year. These fluctuations may be related to the complex geological structure of the site and dynamic environment such as seasonal rainfall or artificial activities, for example, pumping wells, impermeable walls, and excavation work, which may have increased the complexity of the groundwater environments. However, the difference between the monitoring data and reproduced data over short periods does not influence their consistency in long-term trends; therefore, this model can be used to predict 1,4-dioxane concentrations and distribution.
Using the reproduced 1,4-dioxane concentrations shown in Figure 2, the distribution of 1,4-dioxane in the groundwater of the study area over 25 years (1995–2020) is shown in Figure 3. The GL changes over time are also illustrated in the figure (light blue). In 1995 and 2000, the flow of groundwater containing pollutants was generally divided into two directions depending on the groundwater divide (northwest to southeast) of this dumping site area.
From 2005, an impermeable wall was constructed along the border between the two prefectures to stop the movement of groundwater as well as the pollutants within it. As a result, the groundwater contours shown in Figure 4 overlapped along the impermeable wall, and the flow direction near this area changed from north to south. As expected, 1,4-dioxane was trapped on the east side of the impermeable wall to some extent.
In 2010, three pumping wells were installed near the impermeable wall at the waste dumping site for groundwater treatment. This action again increased the complexity of groundwater flow and groundwater levels. The groundwater near the pumping wells started to flow toward the wells, and the groundwater levels near the pumping wells declined. These changes imply accelerated groundwater flow and the transportation of pollutants in the groundwater. Interestingly, an obvious accumulation of 1,4-dioxane, along with the impermeable wall, was observed as a result of these artificial activities, that is, the impermeable wall and pumping well installments.

3.2. Evaluation of Different Methods for Groundwater Treatment

Based on the simulated current distribution of 1,4-dioxane in groundwater at the study site, two possible treatment methods, that is, passive and active treatments, were proposed and evaluated.
Passive treatment refers to the natural attenuation of 1,4-dioxane in groundwater. The simulation results of the distribution of 1,4-dioxane in the study site under natural attenuation over the next 40 years (2020–2060) are shown in Figure 4. The hydraulic environment of this site is relatively stable because no artificial activities have been conducted. Figure 4 suggests that as time passes, 1,4-dioxane moves with the groundwater flows, its concentration gradually decreasing. After 10 years of natural attenuation, most areas of the dumping site have 1,4-dioxane concentrations ≤10−3 mg/L, with very few areas in the range of 10−3–10−1 mg/L. The concentration of 1,4-dioxane is relatively high near the impermeable wall, even after 40 years of natural attenuation, which may be attributed to the stagnation of groundwater flow near this area.
With the active treatment method, groundwater pumping, followed by treatment technologies, is applied. It is recommended to pump water through the monitoring wells, which are more widely installed than the current pumping wells—monitoring wells 7, 8, and 9 are close to the impermeable wall, which has an accumulation od 1,4-dioxane. A constant pumping rate of 250 m3/day is suggested.
The distribution of 1,4-dioxane under active treatment is shown in Figure 5. The groundwater levels and groundwater directions near the monitoring wells and the impermeable wall were significantly influenced by groundwater pumping actions. These changes make the groundwater more dynamic and the groundwater environment becomes more complex, which also influences the movement of 1,4-dioxane. The northern areas with relatively high 1,4-dioxane concentrations (10−2–10−1 mg/L) were quickly remediated within five years, with the 1,4-dioxane concentration decreasing to <10−3 mg/L. After 30 years of active treatment, the 1,4-dioxane concentration in the groundwater in most areas of the site was ≤10−3 mg/L, and did not accumulate near the impermeable wall.
Comparing the simulation results of 1,4-dioxane distribution in the groundwater shown in Figure 4 and Figure 5, a wider 1,4-dioxane distribution may occur in the case of the active treatment (e.g., after 30 years of treatment). It has been proposed that the pumping actions during active treatment may result in a more dynamic groundwater flow than during passive treatment, which promotes 1,4-dioxane transport to areas where it would otherwise be difficult to reach. This phenomenon was unanticipated and would influence the groundwater treatment efficiency; therefore, when designing pumping well locations, both the natural hydraulic environment and artificially induced groundwater flows should be taken into consideration. Finally, we suggest further research to study better prediction models and remediation strategies for groundwater pollution based on the findings of the present study.

4. Conclusions

The objective of this study was to clarify the possibility of numerically predicting pollutant transport in a dynamic and complex hydrologic environment and to investigate the characteristics of pollutant transport under both naturally and artificially induced groundwater flows. We attempted to reproduce the changes in 1,4-dioxane concentrations in groundwater observed in the monitoring wells using a quasi-3D flow and transport simulation that considered the multiple sources and spatiotemporal changes in hydraulic conditions.
The reproduced data and monitoring data (over a period of five years) for all monitoring wells generally exhibited good fitting results, suggesting that it is possible to predict the 1,4-dioxane concentration by considering groundwater flow. From the distribution of 1,4-dioxane, an obvious accumulation of 1,4-dioxane along with the impermeable wall was observed in these artificial activities, impermeable walls, and pumping well installments.
Passive treatment suggested that 1,4-dioxane moves with groundwater flows, and its concentration gradually decreases over time. The concentration of 1,4-dioxane was relatively high near the impermeable wall. With active treatment, the 1,4-dioxane concentration in the groundwater in most areas was ≤10−3 mg/L, and no longer accumulated near the impermeable wall. It is understood that the pumping actions during active treatment may result in a more dynamic groundwater flow than during passive treatment, promoting 1,4-dioxane transport to areas where it would otherwise be difficult to reach.
The study suggests the potential for the prediction and remediation of pollution at illegal waste dumping sites. However, further extensive studies on the complex geological structure of illegal waste dumping sites, dynamic seasonal rainfall, and groundwater changes are encouraged. In order to evaluate such complex environments, it is essential to improve prediction accuracy using more advanced models [39] and to analyze detailed field data.

Author Contributions

Conceptualization, T.P. and K.N.; Methodology, T.P. and K.N.; Software, T.P.; Validation, T.P.; Formal analysis, T.P.; Investigation, T.P.; Resources, T.P.; Data curation, T.P. and K.N.; Writing—original draft preparation, K.N. and T.P.; Writing—review and editing, N.W., J.W. and T.K.; Visualization, T.P.; Supervision, T.K.; Project administration, T.P. and K.N.; Funding acquisition, T.K. All authors have read and agreed to the published version of the manuscript.

Funding

This research was supported by DOWA Holdings funding and GP-RSS International join graduate program of Tohoku University, and the authors acknowledge the academic support of Prof. Toshikazu Shiratori at Tohoku University.

Institutional Review Board Statement

Not applicable.

Informed Consent Statement

Not applicable.

Data Availability Statement

The original contributions presented in the study are included in the article, and further inquiries can be directed to the corresponding author.

Acknowledgments

This research was supported by the International Join Graduate Program in Resilience and Safety Studies, Tohoku University, Japan.

Conflicts of Interest

The authors declare no conflict of interest.

References

  1. Dieter, C.A.; Maupin, M.A.; Caldwell, R.R.; Harris, M.A.; Ivahnenko, T.I.; Lovelace, J.K.; Barber, N.L.; Linsey, K.S. Estimated use of water in the United States in 2015. U.S. Geol. Surv. Circ. 2018, 1441, 65. [Google Scholar]
  2. World Water Assessment Programme. The United Nations World Water Development Report 3: Water in a Changing World; UNESCO: Paris, France; Earthscan: London, UK, 2009. [Google Scholar]
  3. Zhao, Z. A Global Assessment of Nitrate Contamination in Groundwater; Report IGRAC: Westvest, The Netherlands, 2015. [Google Scholar]
  4. USGS. Groundwater Quality. Available online: https://www.usgs.gov/special-topic/water-science-school/science/groundwater-quality?qt-science_center_objects=0#qt-science_center_objects (accessed on 2 August 2021).
  5. Siebert, S.; Burke, J.; Faures, J.M.; Frenken, K.; Hoogeveen, J.; Doll, P.; Portmann, F.T. Groundwater use for irrigation-a global inventory. Hydrol. Earth Syst. Sci. Discuss. 2010, 14, 3977–4021. [Google Scholar]
  6. Naveen, B.P.; Sumalatha, J.; Malik, R.K. A study on contamination of ground and surface water bodies by leachate leakage from a landfill in Bangalore, India. Geo-Engineering 2018, 9, 27. [Google Scholar] [CrossRef]
  7. Almasri, M.N. Nitrate contamination of groundwater: A conceptual management framework. Environ. Impact Assess. Rev. 2007, 27, 220–242. [Google Scholar] [CrossRef]
  8. Paz, D.H.F.; Lafayette, K.P.V.; de Holanda, M.J.O.; do Sobral, M.C.M.; de Costa, L.A.R.C. Assessment of environmental impact risks arising from the illegal dumping of construction waste in Brazil. Environ. Dev. Sustain. 2020, 22, 2289–2304. [Google Scholar] [CrossRef]
  9. Liu, Y.; Kong, F.; Santibanez Gonzalez, E.D.R. Dumping, waste management and ecological security: Evidence from England. J. Clean. Prod. 2016, 167, 1425–1437. [Google Scholar] [CrossRef]
  10. Mazza, A.; Piscitelli, P.; Neglia, C.; Rosa, G.D.; Iannuzzi, L. Illegal Dumping of Toxic Waste and Its Effect on Human Health in Campania, Italy. Int. J. Environ. Res. Public Health 2015, 12, 6818–6831. [Google Scholar] [CrossRef] [PubMed] [Green Version]
  11. Santos, A.C.; Mendes, P.; Teixeiro, M.R. Social life cycle analysis as a tool for sustainable management of illegal waste dumping in municipal services. J. Clean. Prod. 2019, 210, 1141–1149. [Google Scholar] [CrossRef]
  12. Yang, Y.; Luo, H.; Liu, R.; Li, G.; Yu, Y.; An, T. The exposure risk of typical VOCs to the human beings via inhalation based on the respiratory deposition rates by proton transfer reaction-time of flight-mass spectrometer. Ecotoxicol. Environ. Saf. 2020, 197, 110615. [Google Scholar] [CrossRef] [PubMed]
  13. Du, L.; Xu, H.; Zuo, J. Status Quo of Illegal dumping research: Way forward. J. Environ. Manag. 2021, 290, 112601. [Google Scholar] [CrossRef]
  14. Carriero, G.; Neri, L.; Famulari, D.; Lonardo, S.D.; Piscitelli, D.; Manco, A.; Esposito, A.; Chirico, A.; Facini, O.; Finardi, S.; et al. Composition and emission of VOCs from biogas produced by illegally managed waste landfill in Giugliano (Campania, Italy) and potential impact on the local population. Sci. Total Environ. 2018, 640–641, 377–386. [Google Scholar] [CrossRef]
  15. Vitali, M.; Castellani, F.; Fragassi, G.; Mascitelli, A.; Martellucci, C.; Dilitti, G.; Scamosci, E.; Astolfi, M.L.; Fabiani, L.; Mastrantonio, R.; et al. Environment status of an Italian site highly polluted by illegal dumping of industrial waste: The situation 15 years after the judicial intervention. Sci. Total Environ. 2021, 762, 144100. [Google Scholar] [CrossRef]
  16. Qi, S.; Luo, J.; O’Connor, D.; Cao, X.; Hou, D. Influence of groundwater table fluctuation on the non-equilibrium transport of volatile organic contaminants in the vadose zone. J. Hydrol. 2020, 580, 124353. [Google Scholar] [CrossRef]
  17. Shi, X.; Ren, B. Predict three-dimensional soil manganese transport by HYDRUS-1D and spatial interpolation in Xiangtan manganese mine. J. Clean. Prod. 2021, 292, 125879. [Google Scholar] [CrossRef]
  18. Oliveira, L.A.; Honorio, M.J.; Grecco, K.L.; Tornisielo, V.L.; Woodbury, B.L. Atrazine movement in corn cultivated soil using HYDRUS-2D: A comparison between real and simulated data. J. Environ. Manag. 2019, 248, 109311. [Google Scholar] [CrossRef]
  19. Iwate Prefecture, Record of Lllegal Dumping on the Border between Lwate and Aomori Prefectures. Available online: http://www2.pref.iwate.jp/~hp0315/haikibutu/kenkyo_archive/dioxane.html (accessed on 10 October 2020).
  20. Baraias-Rodriguez, F.J.; Murdoch, L.C.; Falta, R.W.; Freedman, D.L. Simulation of site biodegradation of 1,4-dioxane under metabolic and co-metabolic conditions. J. Contam. Hydrol. 2019, 223, 103464. [Google Scholar] [CrossRef] [PubMed]
  21. Milavec, J.; Tick, G.J.; Brusseau, M.L.; Carroll, K.C. 1,4-Dioxane co-solvency impacts on trichloroethene dissolution and sorption. Environ. Pollut. 2019, 252, 777–783. [Google Scholar] [CrossRef] [PubMed]
  22. U.S. EPA. Integrated Risk Information System (IRIS) on 1,4-Dioxane. 2013. Available online: https://iris.epa.gov/static/pdfs/0326_summary.pdf (accessed on 1 October 2021).
  23. IARCIARC. Re-Evaluation of Some Organic Chemicals, Hydrazine, and Hydrogen Peroxide; IARC: Lyon, France, 1999. [Google Scholar]
  24. Song, K.; Ren, X.; Mohamed, A.K.; Liu, J.; Wang, F. Research on drinking-groundwater source safety management based on numerical simulation. Sci. Rep. 2020, 10, 15481. [Google Scholar] [CrossRef] [PubMed]
  25. Ozel, H.U.; Gemici, B.T.; Gemici, E.; Ozel, H.B.; Cetin, M.; Sevik, H. Application of artificial neural networks to predict heavy metal contamination in the Bartin River. Environ Sci. Pollut. Res. 2020, 27, 42495–42512. [Google Scholar] [CrossRef]
  26. Cheng, Y.; Zhu, J. Significance of mass –concentration relation on the contaminant source depletion in the nonaqueous phase liquid (NAPL) contaminated zone. Transp. Porous Media 2021, 137, 399–416. [Google Scholar] [CrossRef]
  27. Sakamoto, Y.; Yasutaka, T.; Shirakawa, T.; Yamamura, M. Reproduction of latest contamination status through history matching for soil and groundwater contamination due to hexavalent chromium and risk assessment based on long-term prediction. Proc. Civil Eng. Soc. G (Environ.) 2017, 73, 81–100. [Google Scholar]
  28. Bayer, P.; Finkel, M. Life cycle assessment of active and passive groundwater remediation technologies. J. Contam. Hydrol. 2006, 83, 171–199. [Google Scholar] [CrossRef]
  29. Sakamoto, Y.; Nishiwaki, J.; Hara, J.; Kawabe, Y.; Sugai, Y.; Komai, T. Development of geo-environment risk assessment system on soil contamination due to mineral oil –numerical analysis for transport phenomena of oil in soil and groundwater and quantitative evaluation of risk level due to multi-component. Proc. JSCE G (Environ.) 2010, 66, 159–178. [Google Scholar] [CrossRef]
  30. Sakamoto, Y.; Nishiwaki, J.; Hara, J.; Kawabe, Y.; Sugai, Y.; Komai, T. Development of multi-phase and multi-component flow model with reaction in porous media for risk assessment on soil contamination due to mineral oil. Proc. JSCE G (Environ.) 2011, 67, 78–92. [Google Scholar] [CrossRef] [Green Version]
  31. US EPA. Technical Fact Sheet of 1,4-Dioxane. 2017. Available online: https://www.epa.gov/sites/default/files/2014-03/documents/ffrro_factsheet_contaminant_14-dioxane_january2014_final.pdf (accessed on 2 August 2021).
  32. US EPA (Environmental Protection Agency). Alternative Disinfectants and Oxidants Guidance Manual; US EPA (Environmental Protection Agency) Office of Water (4607): Washington, DC, USA, 1999.
  33. International Agency for Research on Cancer (ICRC): Reevaluation of Some Organic Chemicals, Hydrazine and Hydrogen Peroxide; World Health Organization: Lyon, France, 1999.
  34. Nakamura, K.; Ito, H.; Kawabe, Y.; Komai, T. Study on partitioning and distribution in soil-water phases for 1,4-dioxane in geo-environment. Proc. JSCE G (Environ.) 2018, 74, 59–66. [Google Scholar] [CrossRef]
  35. Iguro, C.; Furuichi, T.; Ishii, K.; Kim, S. Prediction of 1,4-dioxane dispersion based on change in groundwater flow after remedial measures by three-dimensional numerical simulation: Toward a permanent measure for Aomori-Iwate Illegal dumping site. Proc. JSCE G (Environ.) 2012, 68, II_265–II_272. [Google Scholar]
  36. Trumm, D. Selection of active and passive treatment systems for AMD—flow charts for New Zealand conditions. New Zealand J. Geol. Geophys. 2010, 53, 195–210. [Google Scholar] [CrossRef]
  37. Kewen, L.; Horne, R.N. Comparison of methods to calculate relative permeability from capillary pressure in consolidated water-wet porous media. Water Resour. Res. 2006, 42, W06405. [Google Scholar] [CrossRef] [Green Version]
  38. Akamine, K.; Tanaka, S.; Arihara, N. A streamline-based 3-Phase equilibrium compositional model with adaptive implicit method. J. Jpn. Assoc. Pet. Technol. 2009, 74, 211–224. [Google Scholar] [CrossRef]
  39. Iordache, A.; Iordache, M.; Sandru, C.; Voica, C.; Stegarus, D.; Zgavarogea, R.; Ionete, R.E.; Cotorcea(Ticu), S.; Miricioiu, M.G. A Fugacity Based Model for the Assessment of Pollutant Dynamic Evolution of VOCS and BTEX in the Olt River Basin (Romania). Revista de Chimie (Rev. Chim.) 2019, 70, 3456–3463. [Google Scholar] [CrossRef]
Figure 1. Map of an illegal waste dumping site. The blue grid means the calculated area. (a) Site map and simulation area. (b) Distribution of elevation level (EL) from a GIS. (c) Distribution of the groundwater level (GL). The EL and GL is the distance from the sea surface.
Applsci 11 09229 g001
Figure 2. Comparison between the simulation results and observed data of 1,4-dioxane [26]. Red line means the excavation removal completed at the site (2014).
Applsci 11 09229 g002
Figure 3. Distribution of groundwater pollution of 1,4-dioxane in the site over time (1995–2020). Contour lines indicate groundwater levels and vectors indicate flow directions. The color of the legend indicates the concentration of 1,4-dioxane.
Applsci 11 09229 g003
Figure 4. 1,4-Dioxane concentrations in groundwater by passive treatment over time. Contour lines indicate groundwater levels and vectors indicate flow directions. The color of the legend indicates the concentration of 1,4-dioxane.
Applsci 11 09229 g004
Figure 5. 1,4-Dioxane concentrations in groundwater by active treatment over time. Contour lines indicate groundwater levels and vectors indicate flow directions. The color of the legend indicates the concentration of 1,4-dioxane.
Applsci 11 09229 g005
Table 1. History of site modifications (well installation and monitoring period).
YearEvents
1990Started illegally dumping industrial waste
2000Started removing waste
2005–2007Installed impermeable wall
2009Implemented a groundwater treatment plant
2010Installed pumping well
2013Started monitoring of 1,4-dioxine
(Under survey (2021))
2014Finished removing waste
Table 2. Basic 1,4-dioxane information and geotechnical information from the site.
SymbolParameterUnitInput ValuesReference
KPermeabilitym21.4 × 10−12[35]
φPorosity-0.3
μ0Viscosity of 1,4-dioxanePa·s1.31
μwViscosity of waterPa·s1.138
ρ0Molar density of 1,4-dioxanekmol/m318.36
ρwMolar density of waterkmol/m317.83
Docw,kMolecular diffusion coefficientm/s1.0 × 10−9
Table 3. Assumed sources of contamination at the site.
NamePollution Area [m2]Amount of Source [kg]
Source 12500600
Source 2150020
Source 3250030
Source 4450015
Source 540030
These values were assumed based on fitting by the model.
Table 4. Pump specifications by active treatment.
NameSymbol in Figure 1Pumping Rate
[m3/day]
Reference
Monitoring well 11250[19]
Monitoring well 22250
Monitoring well 33250
Monitoring well 44250
Monitoring well 55250
Monitoring well 66250
Monitoring well 77250
Monitoring well 88250
Monitoring well 99250
Monitoring well aa250
Monitoring well bb250
Monitoring well cc250
Pumping well 1P110[35]
Pumping well 2P231
Pumping well 3P323
Publisher’s Note: MDPI stays neutral with regard to jurisdictional claims in published maps and institutional affiliations.

