The Use of Infrared Thermography on the Measurement of Microstructural Changes of Reservoir Rocks Induced by Temperature

 , , ,
, , ,
Abstract
:1. Introduction
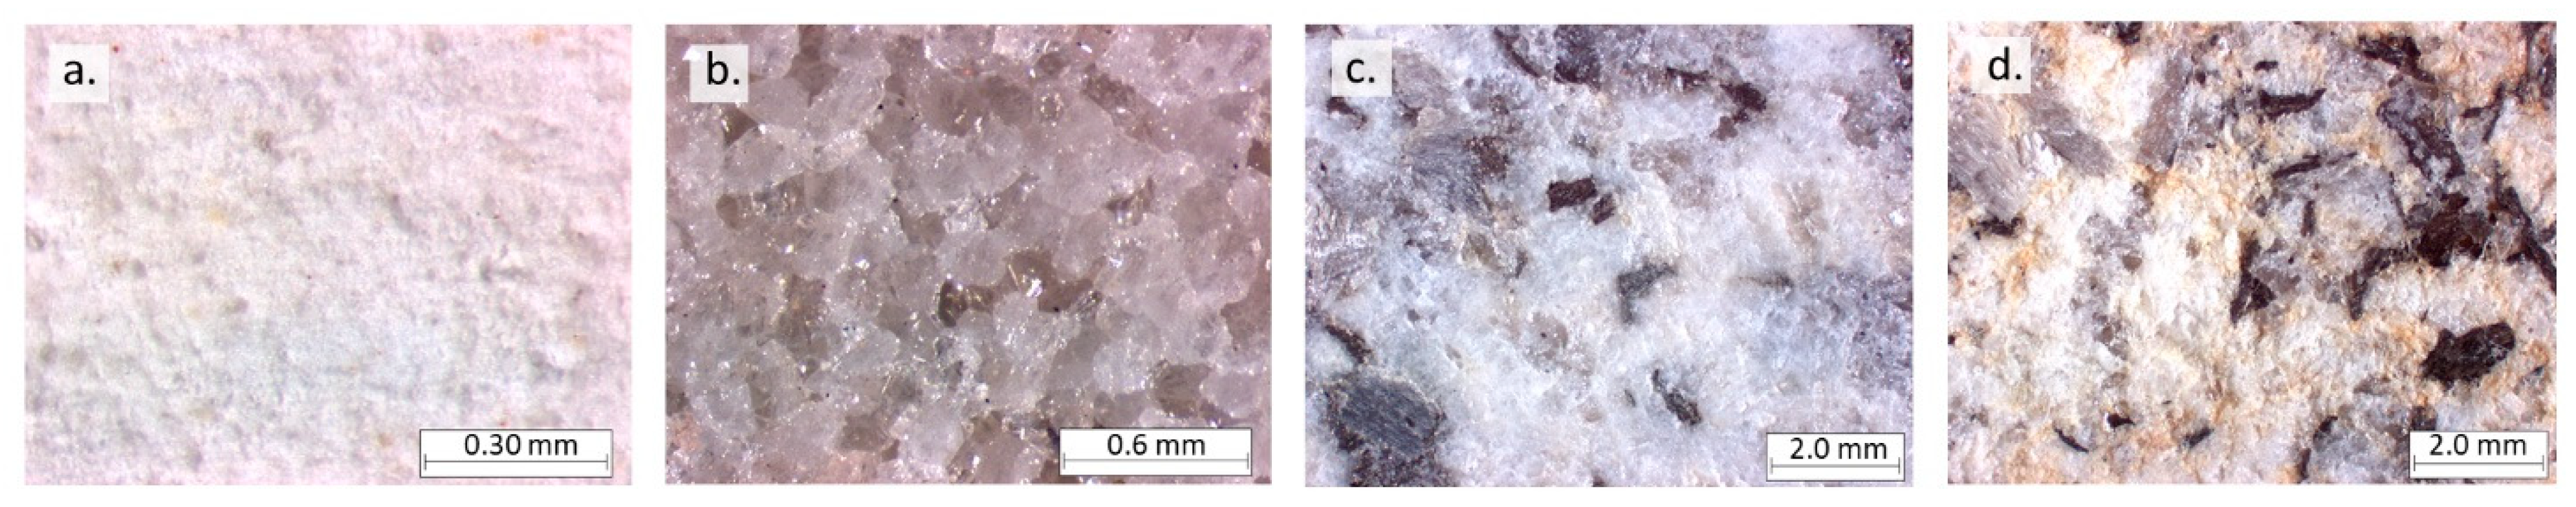
2. Materials
3. Methodology
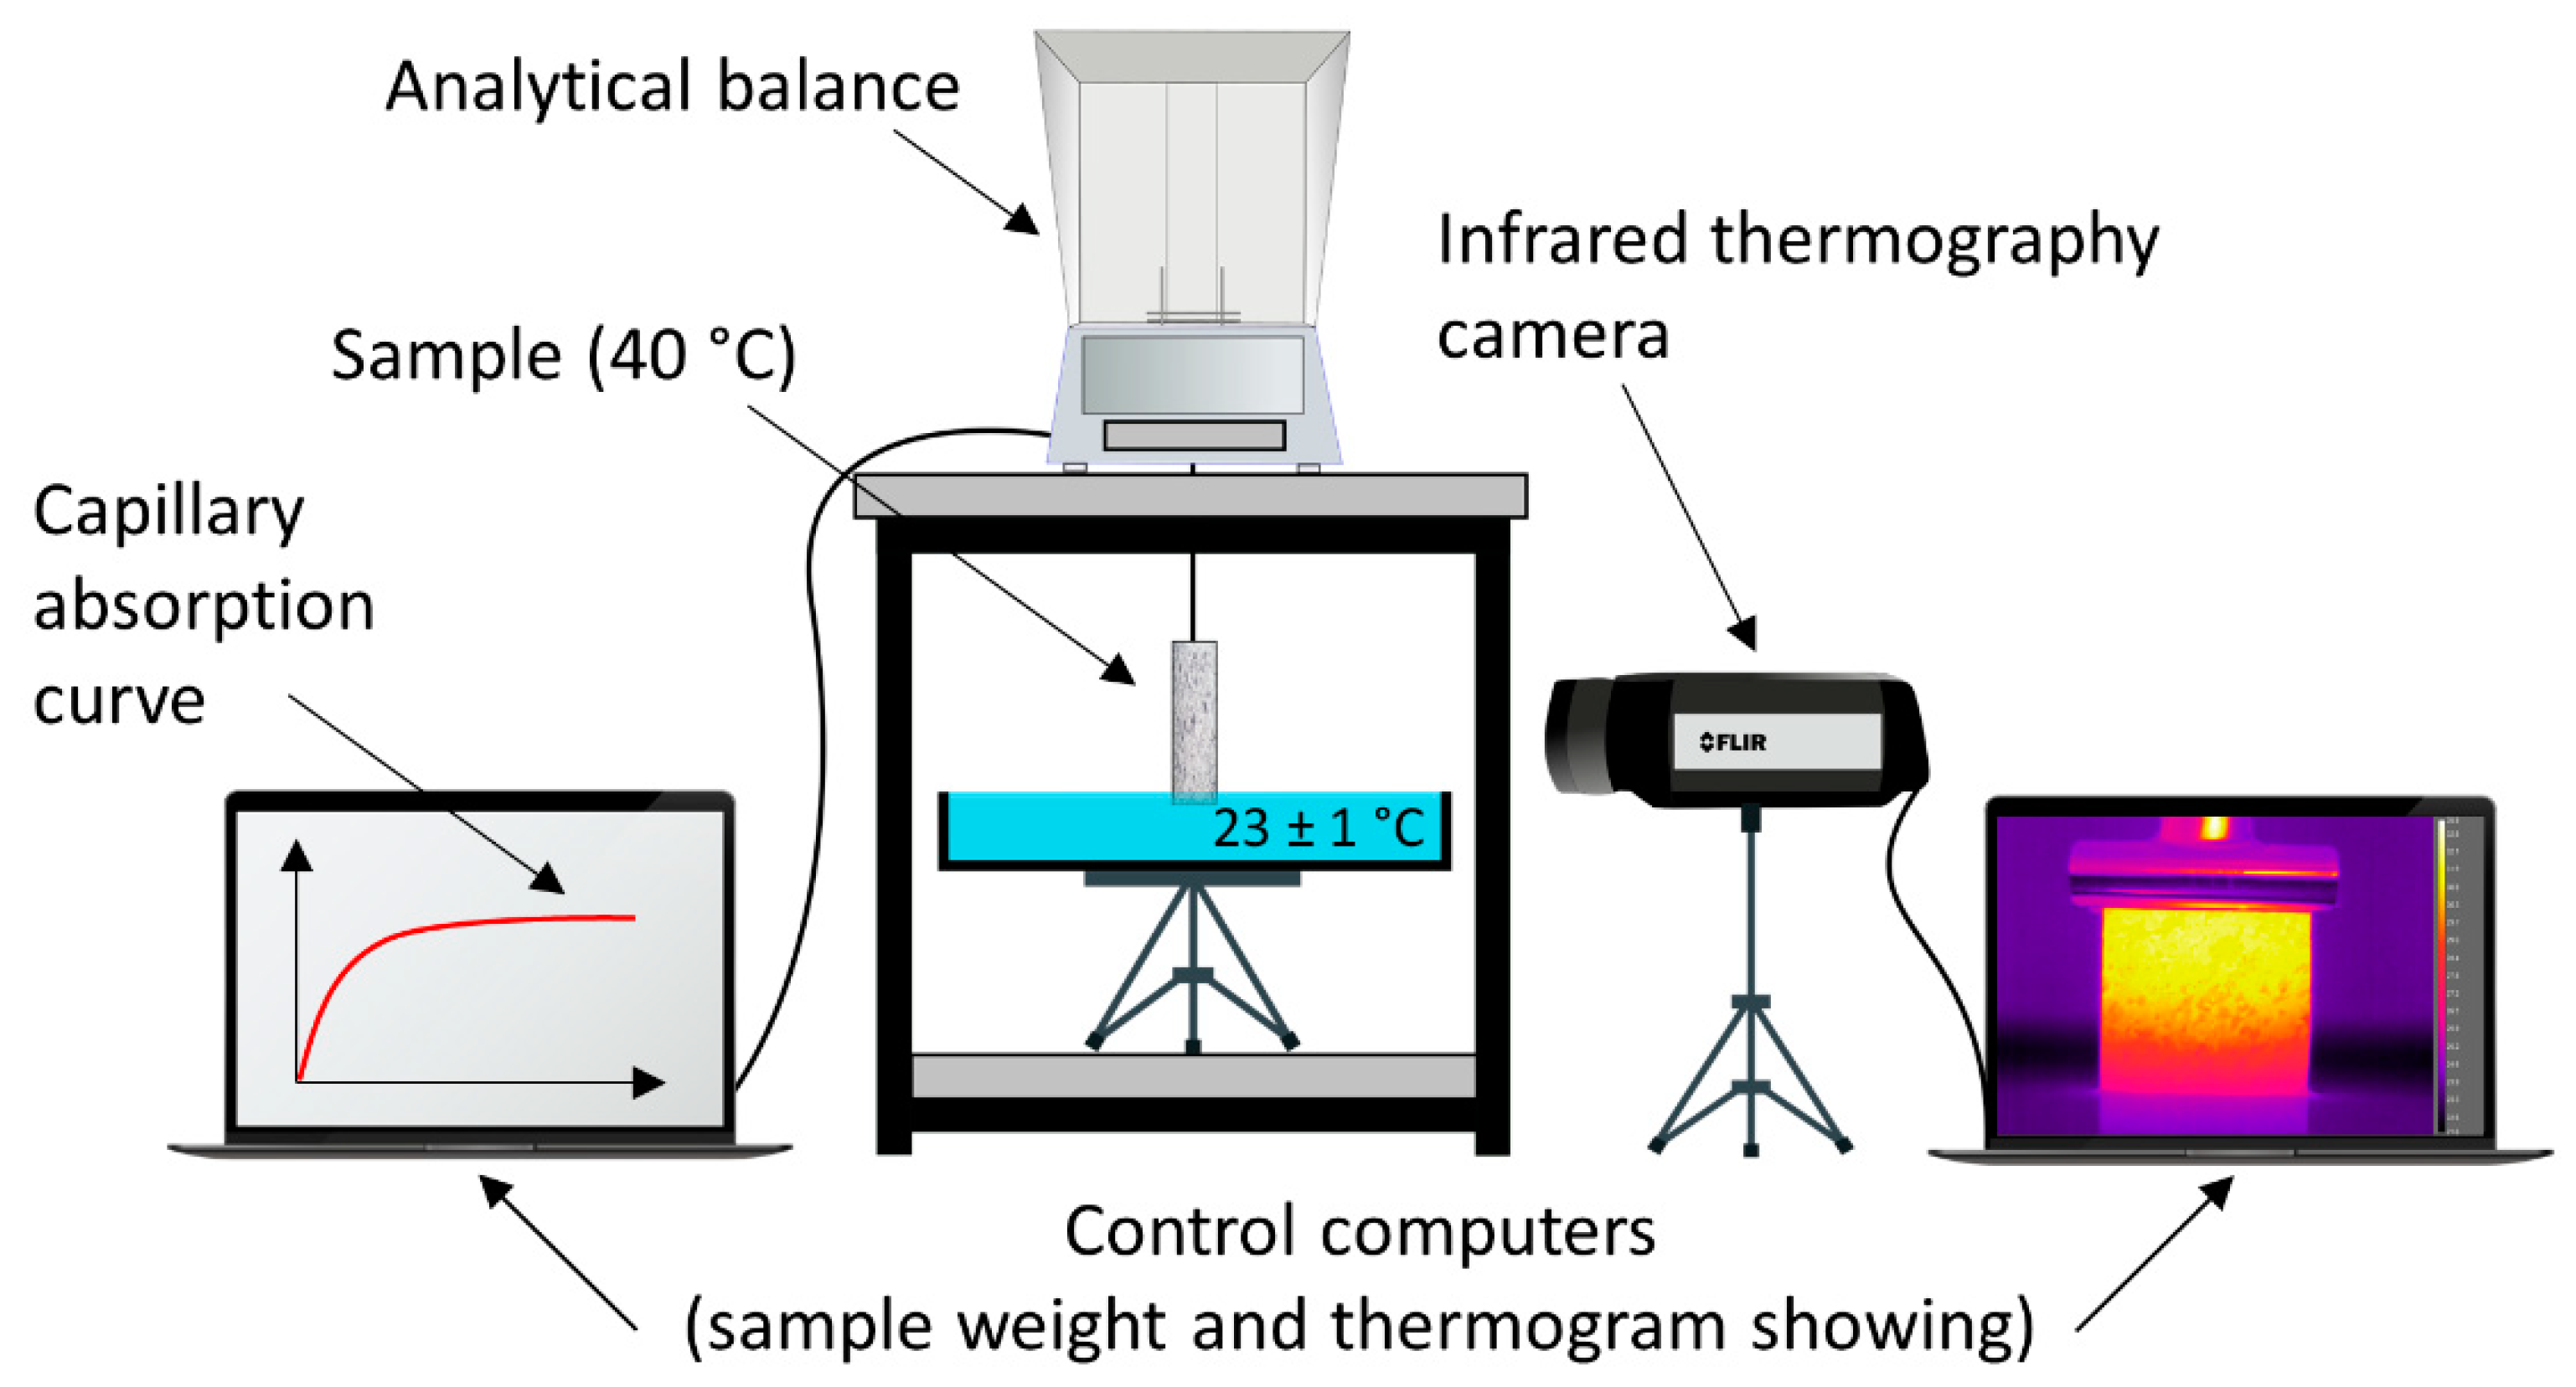
3.1. Experimental Setup
3.2. Analysis of the Variations
3.2.1. Scanning Electron Microscopy (SEM)
3.2.2. Mercury Injection Porosimetry (MIP)
3.2.3. Capillarity Water Uptake
3.2.4. IRT Monitoring
4. Results
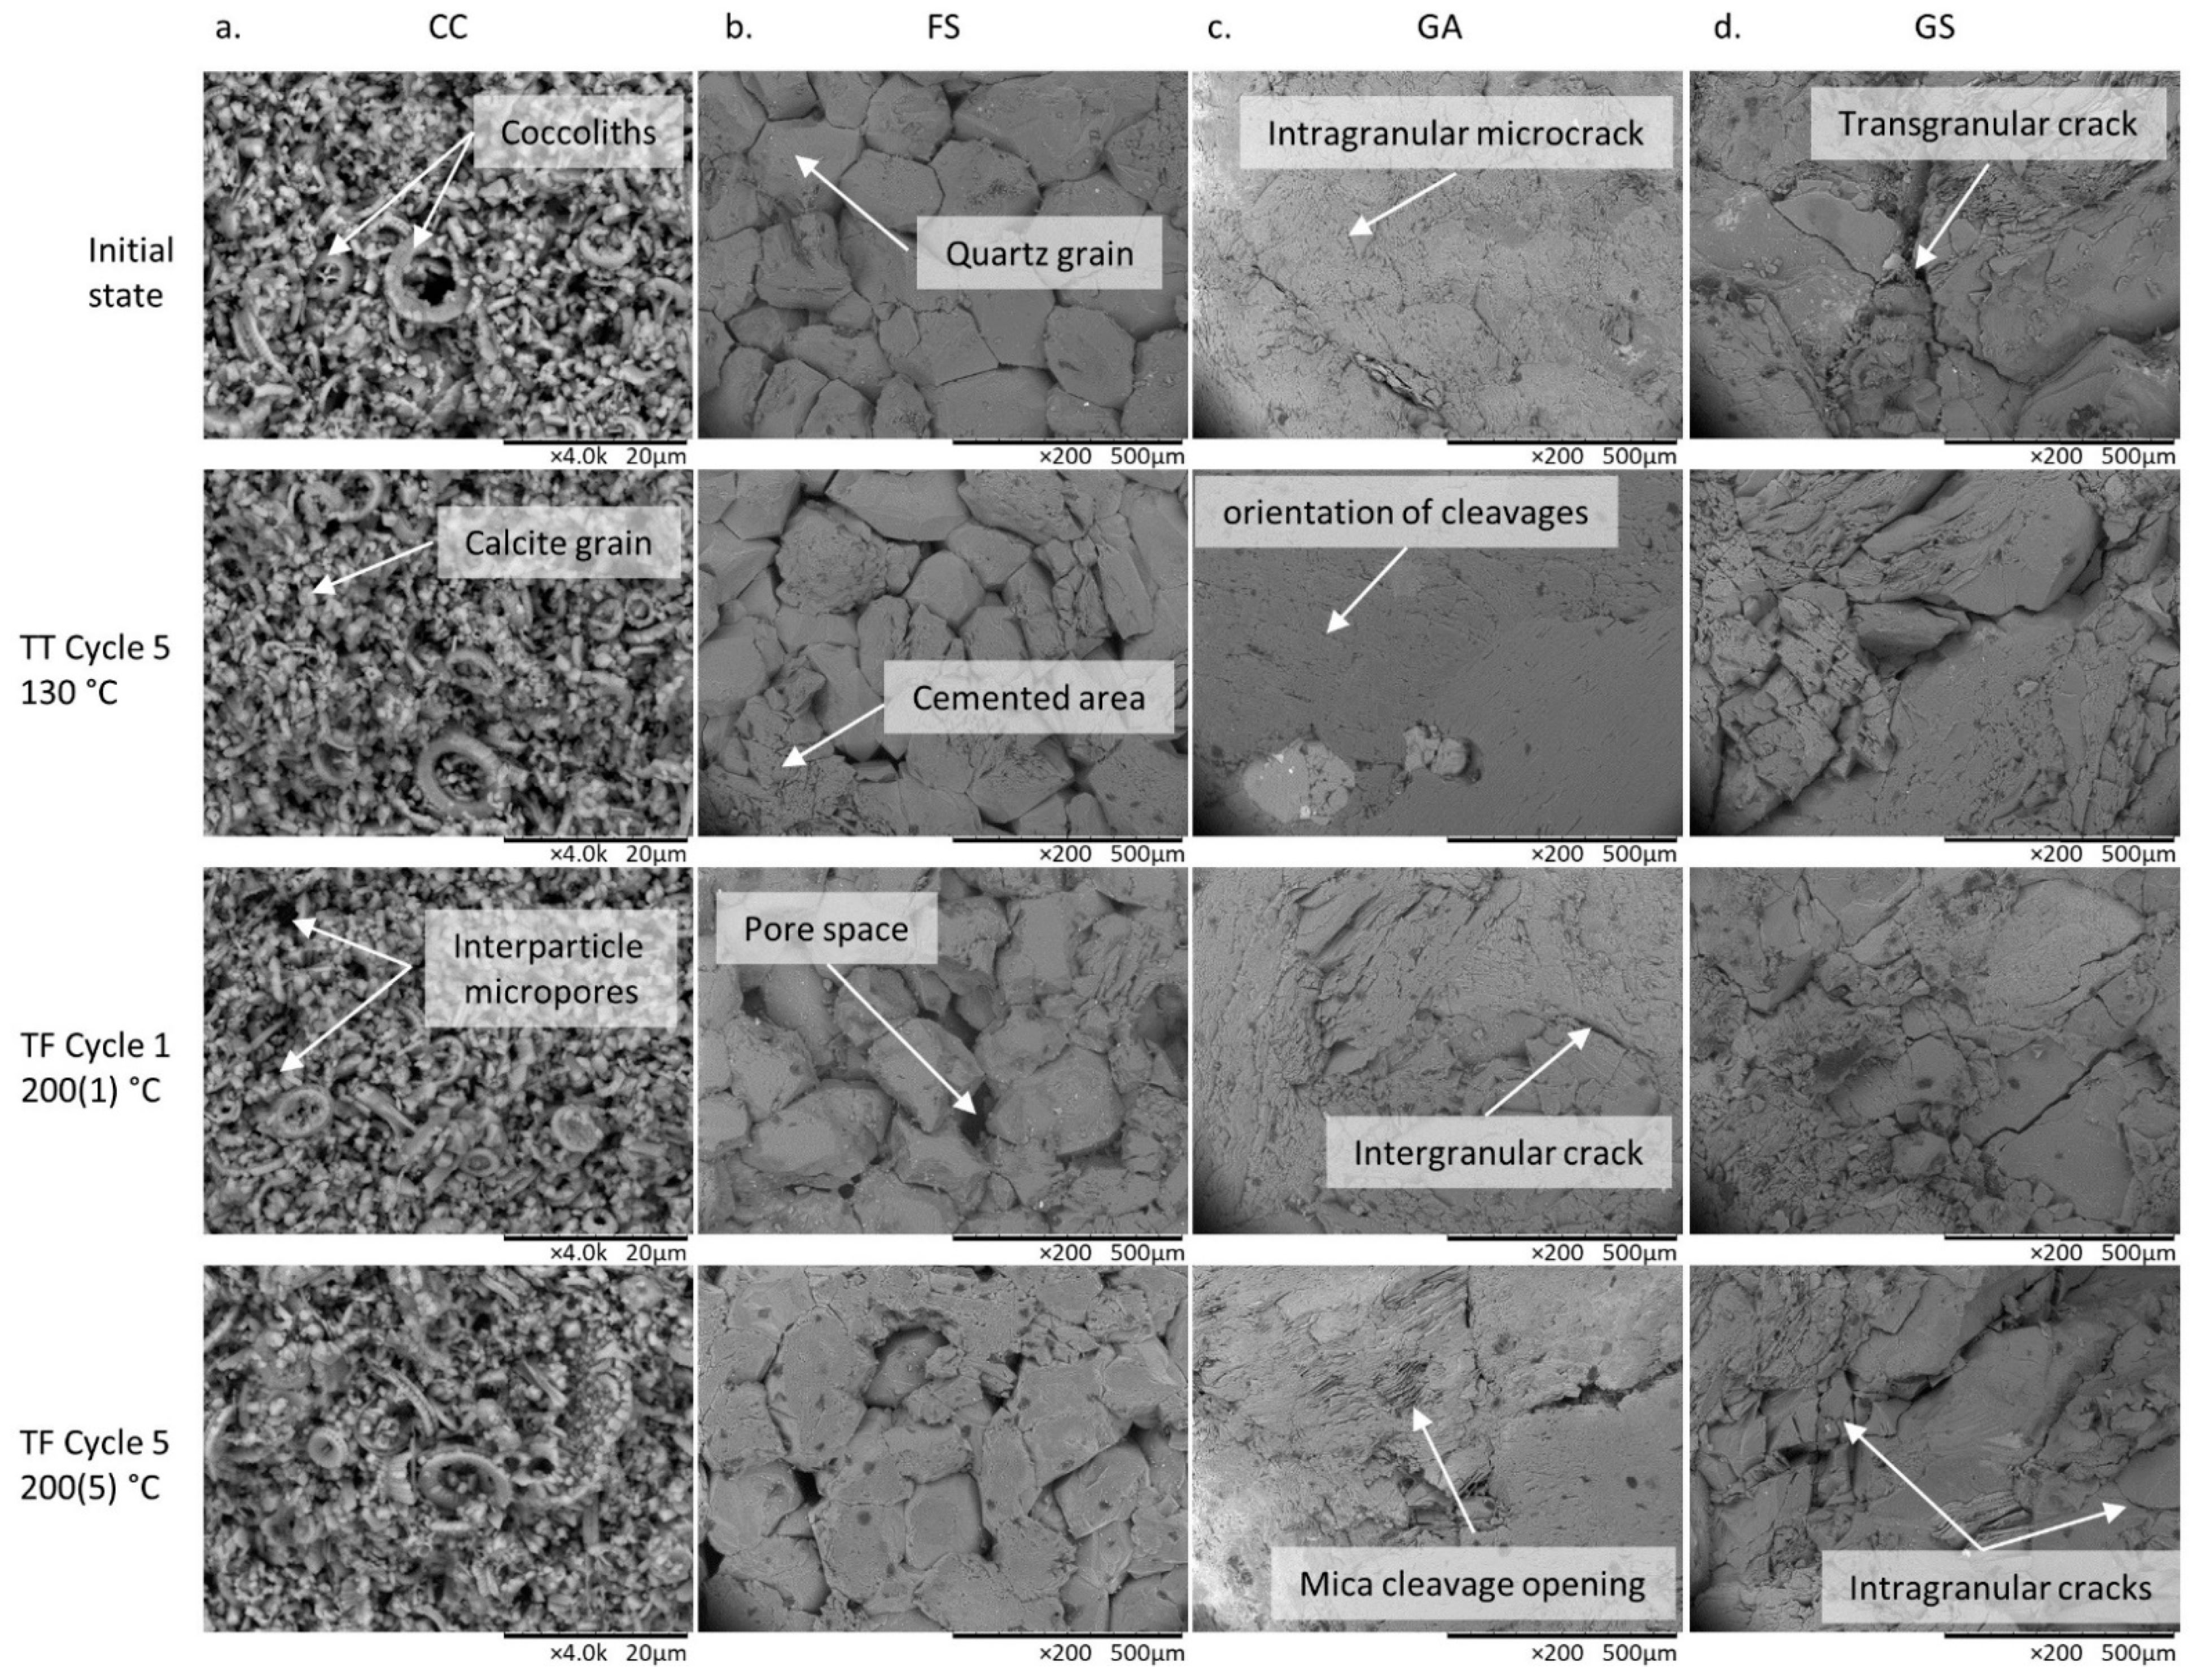
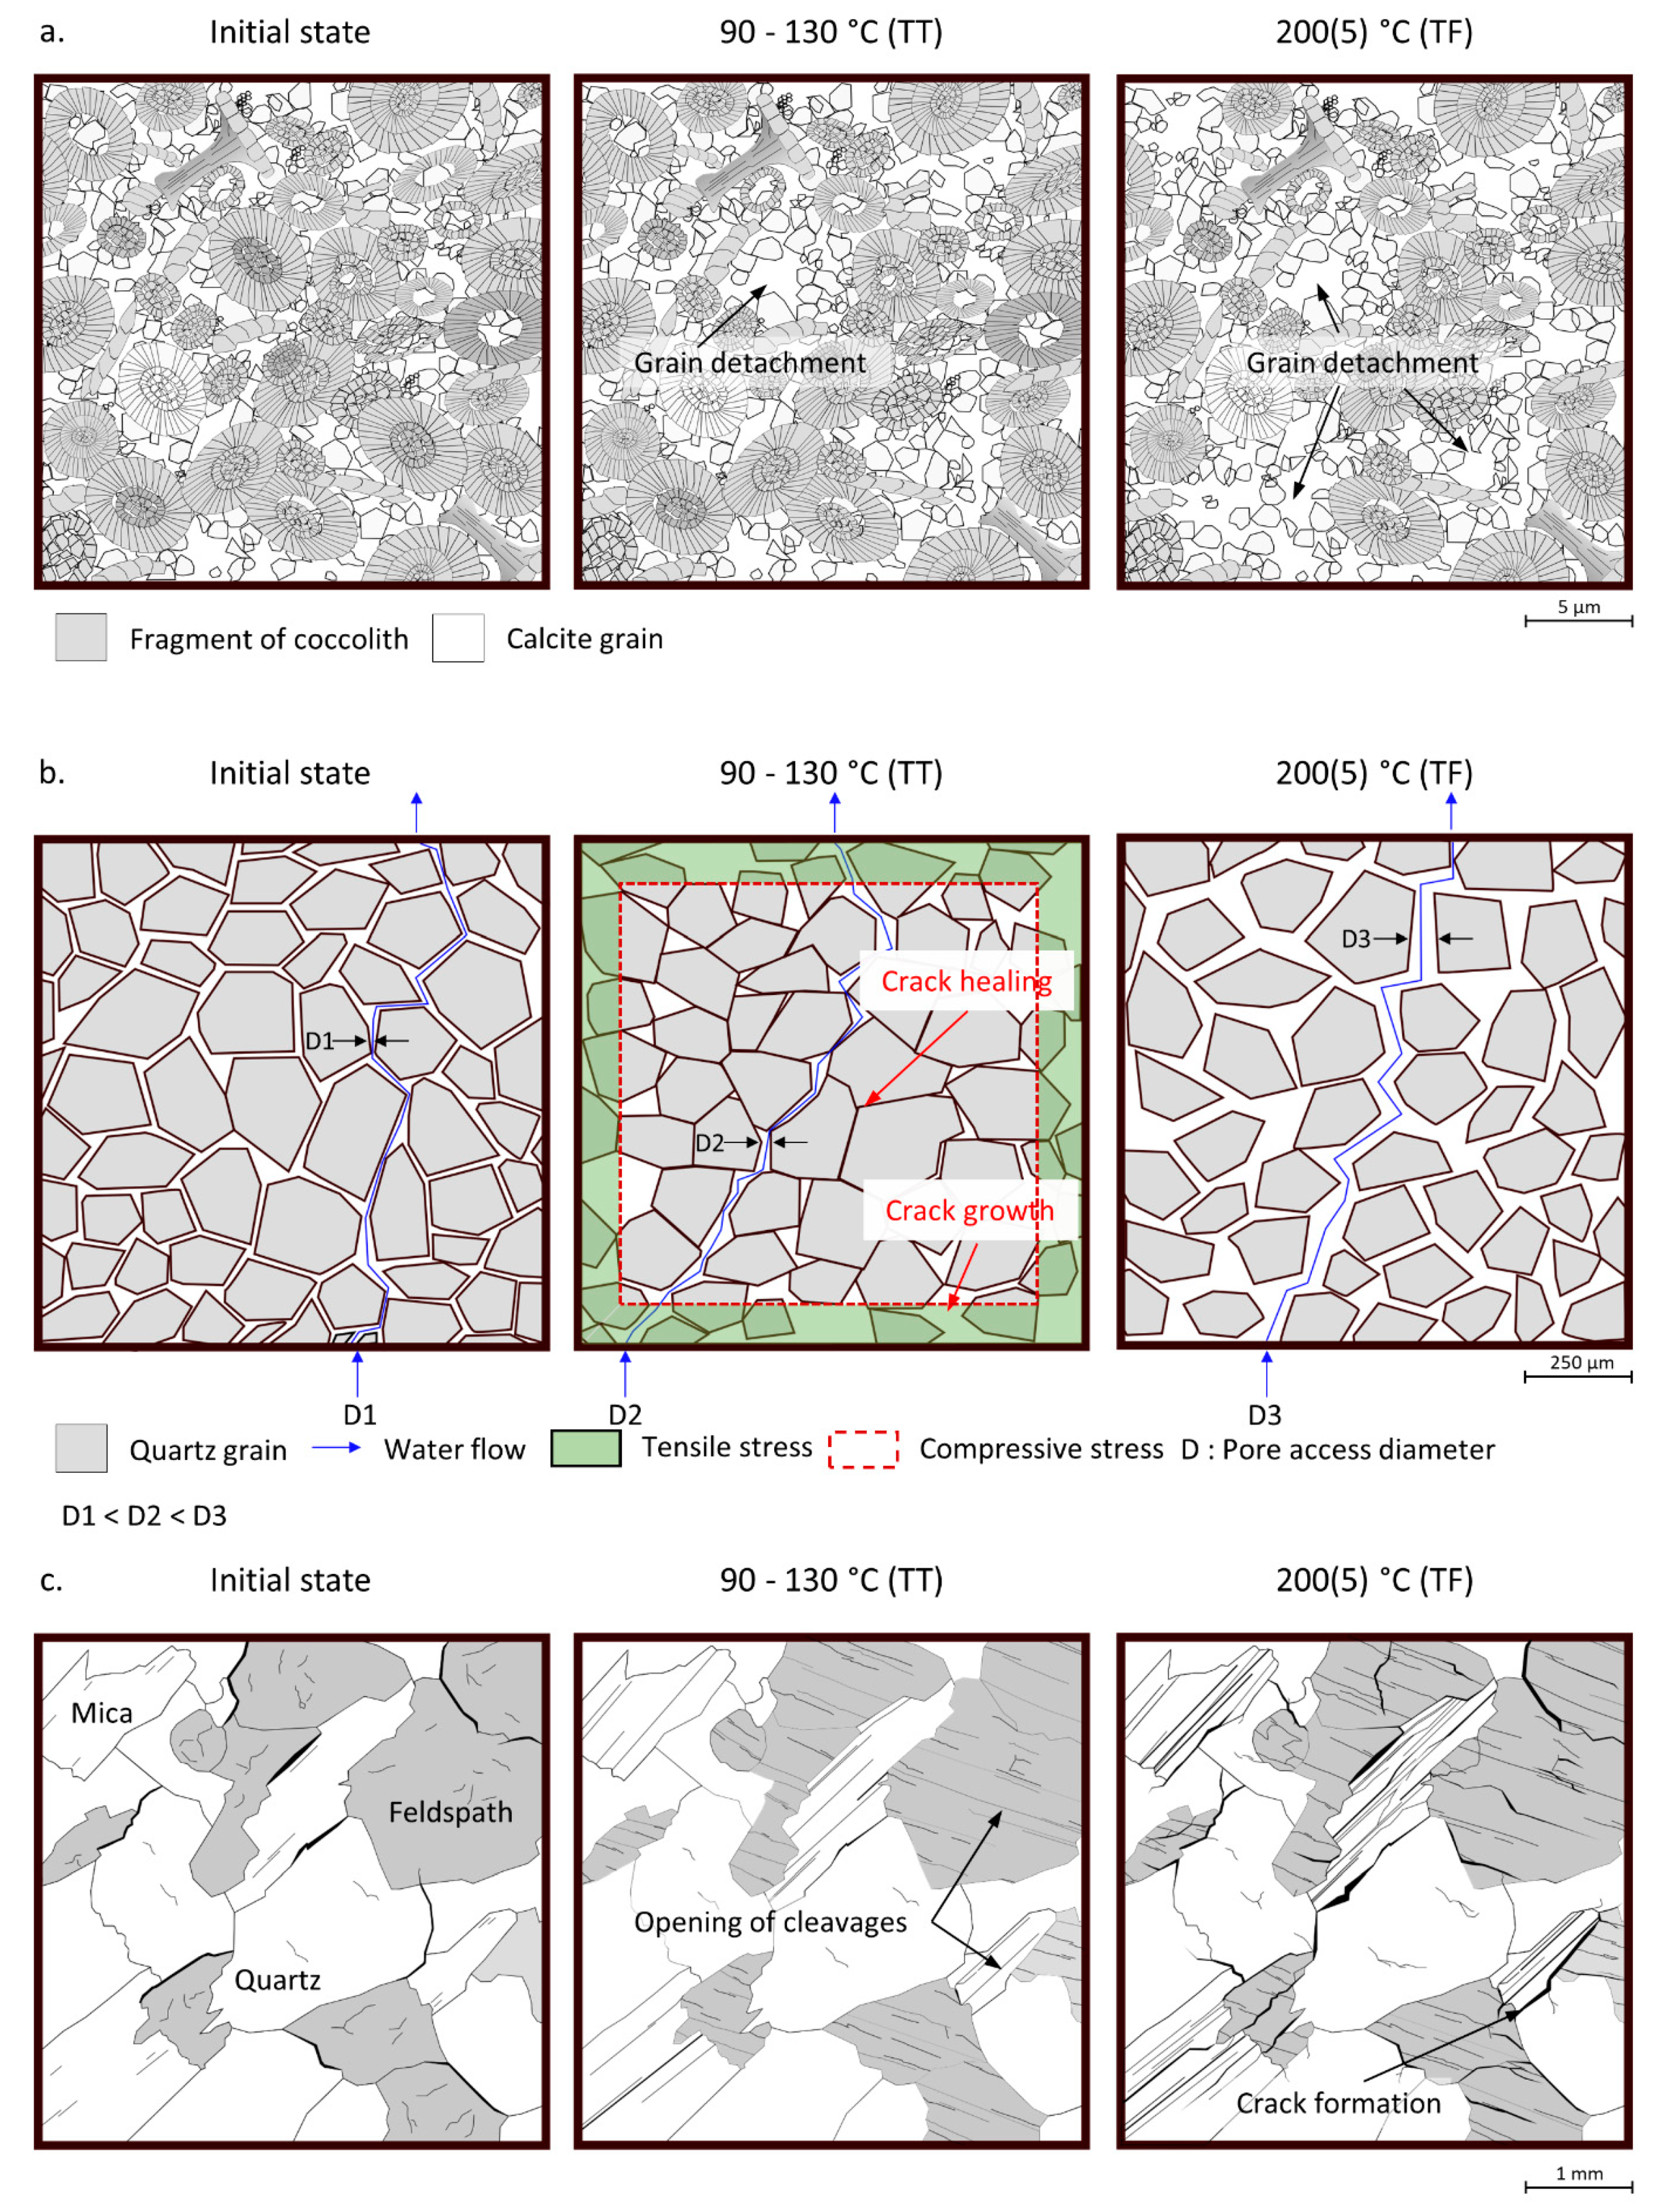
4.1. Scanning Electron Microscopy Observations
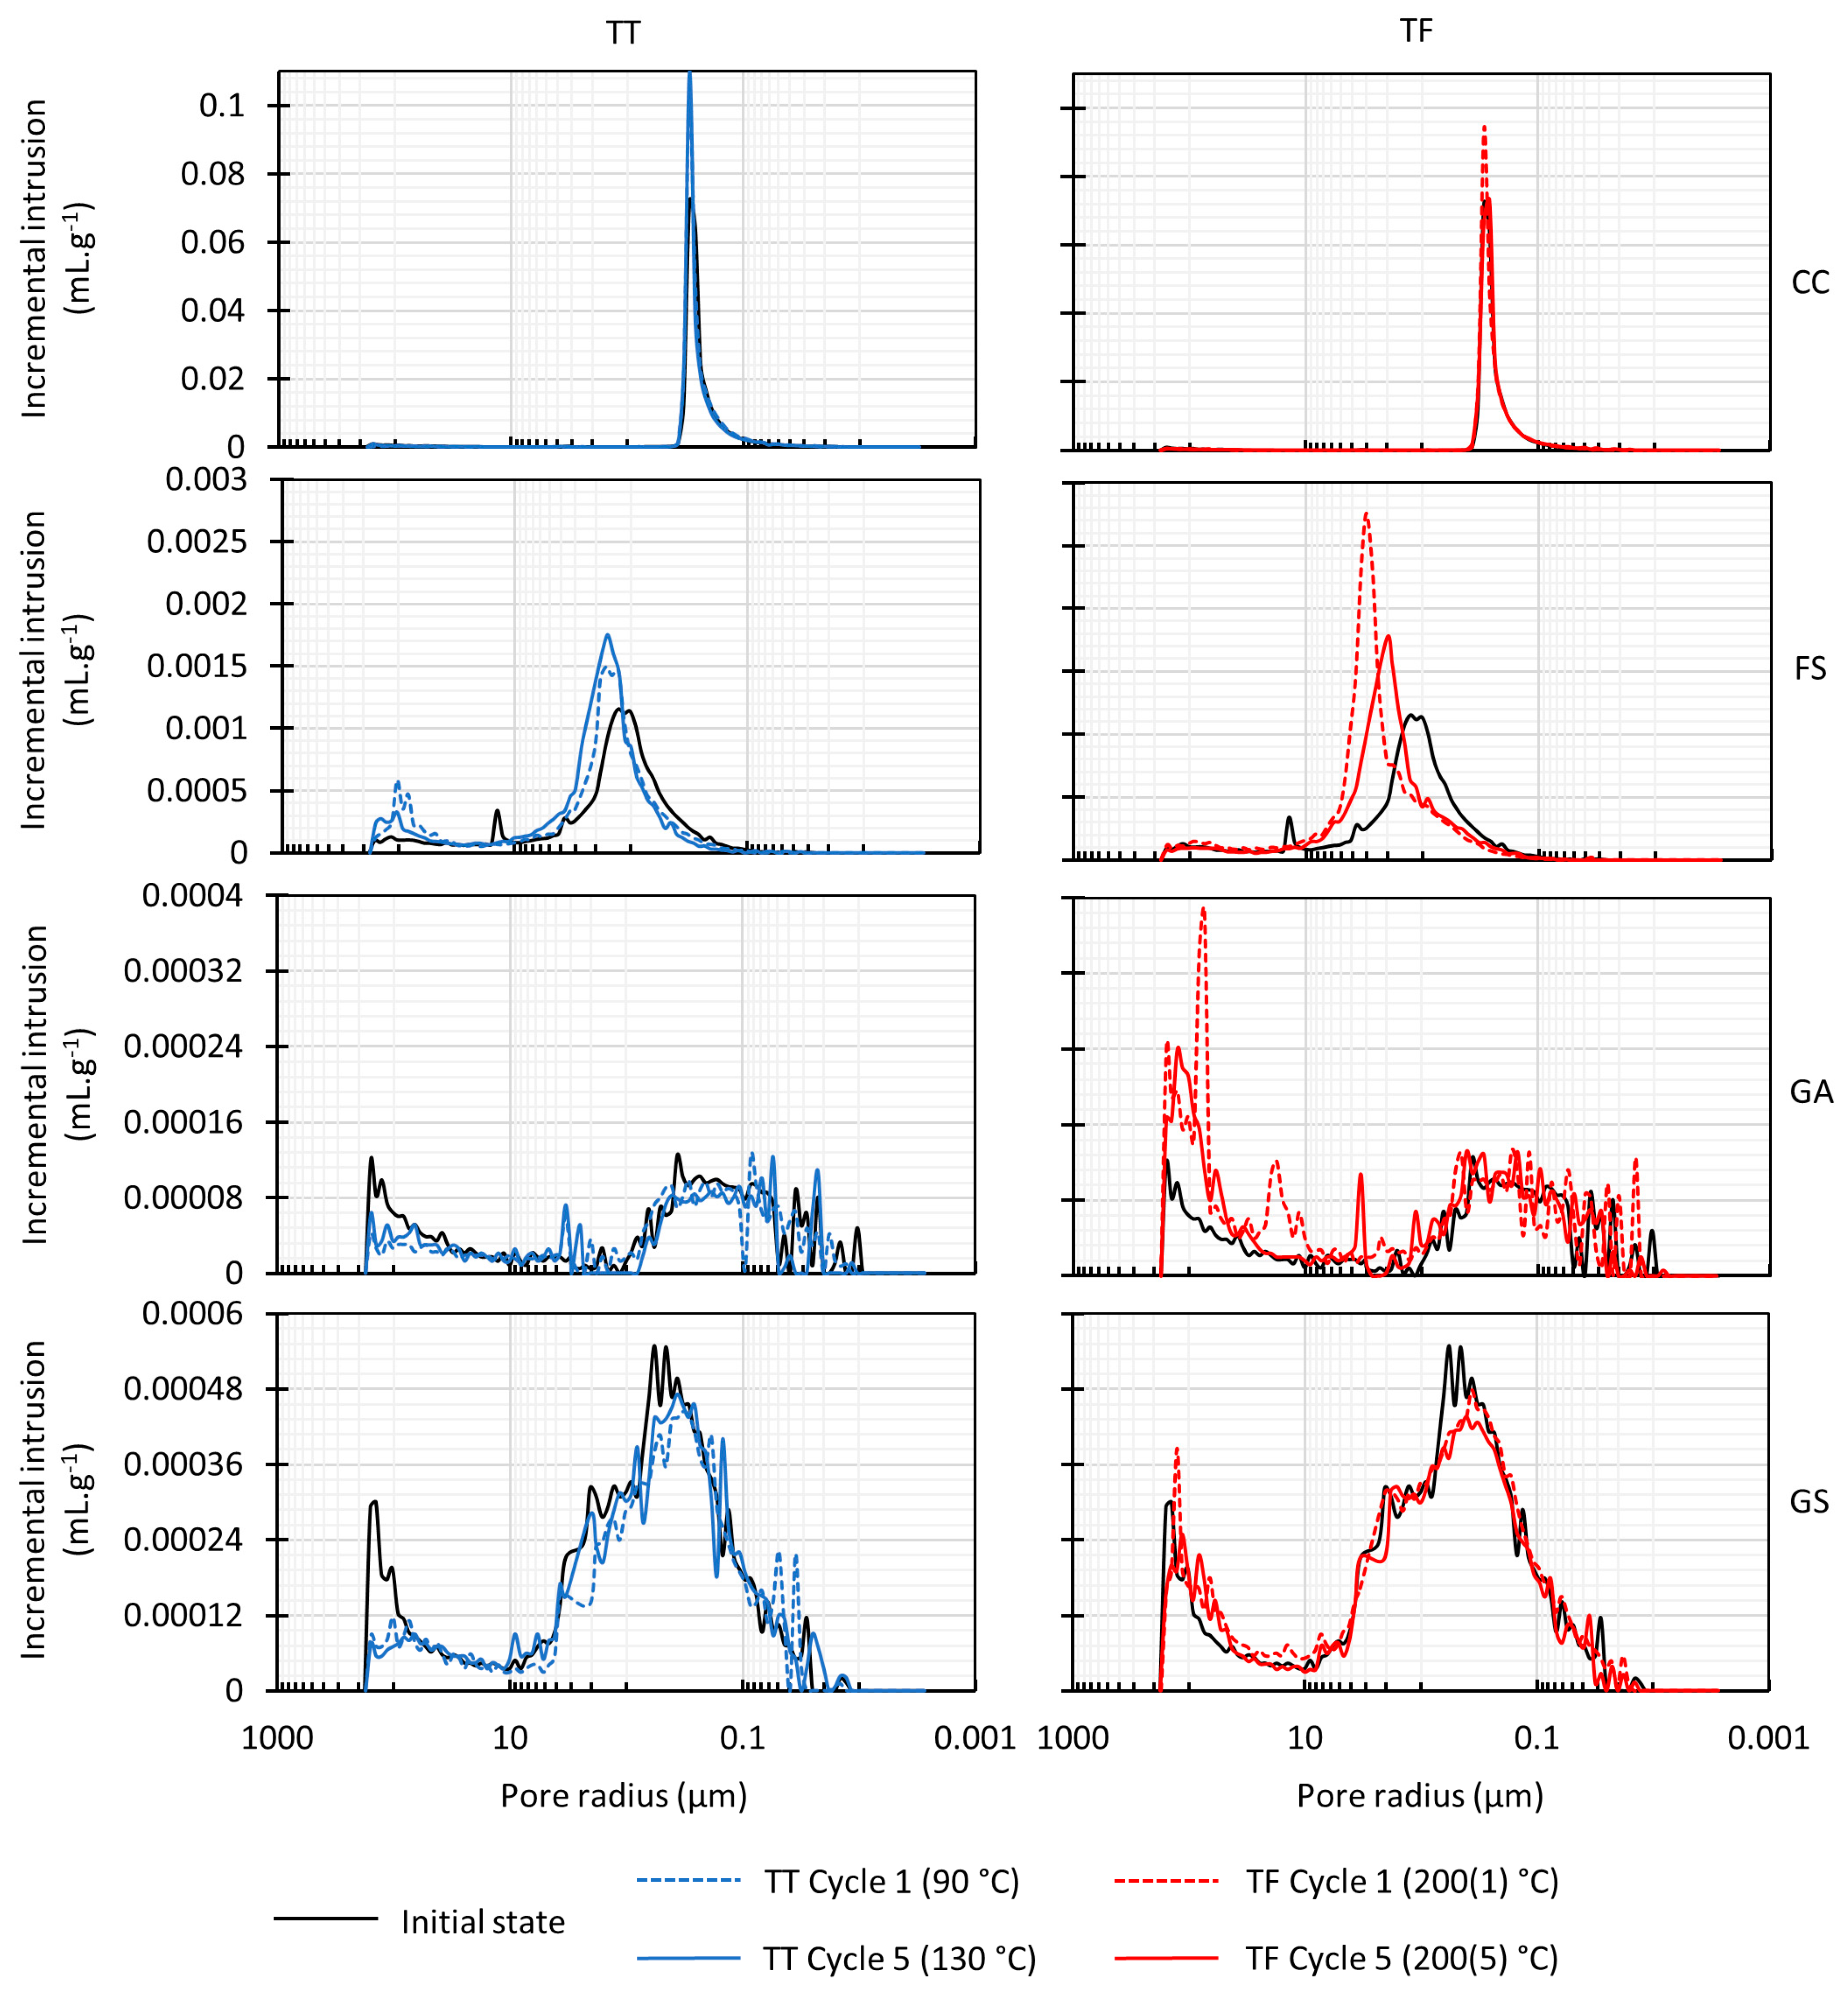
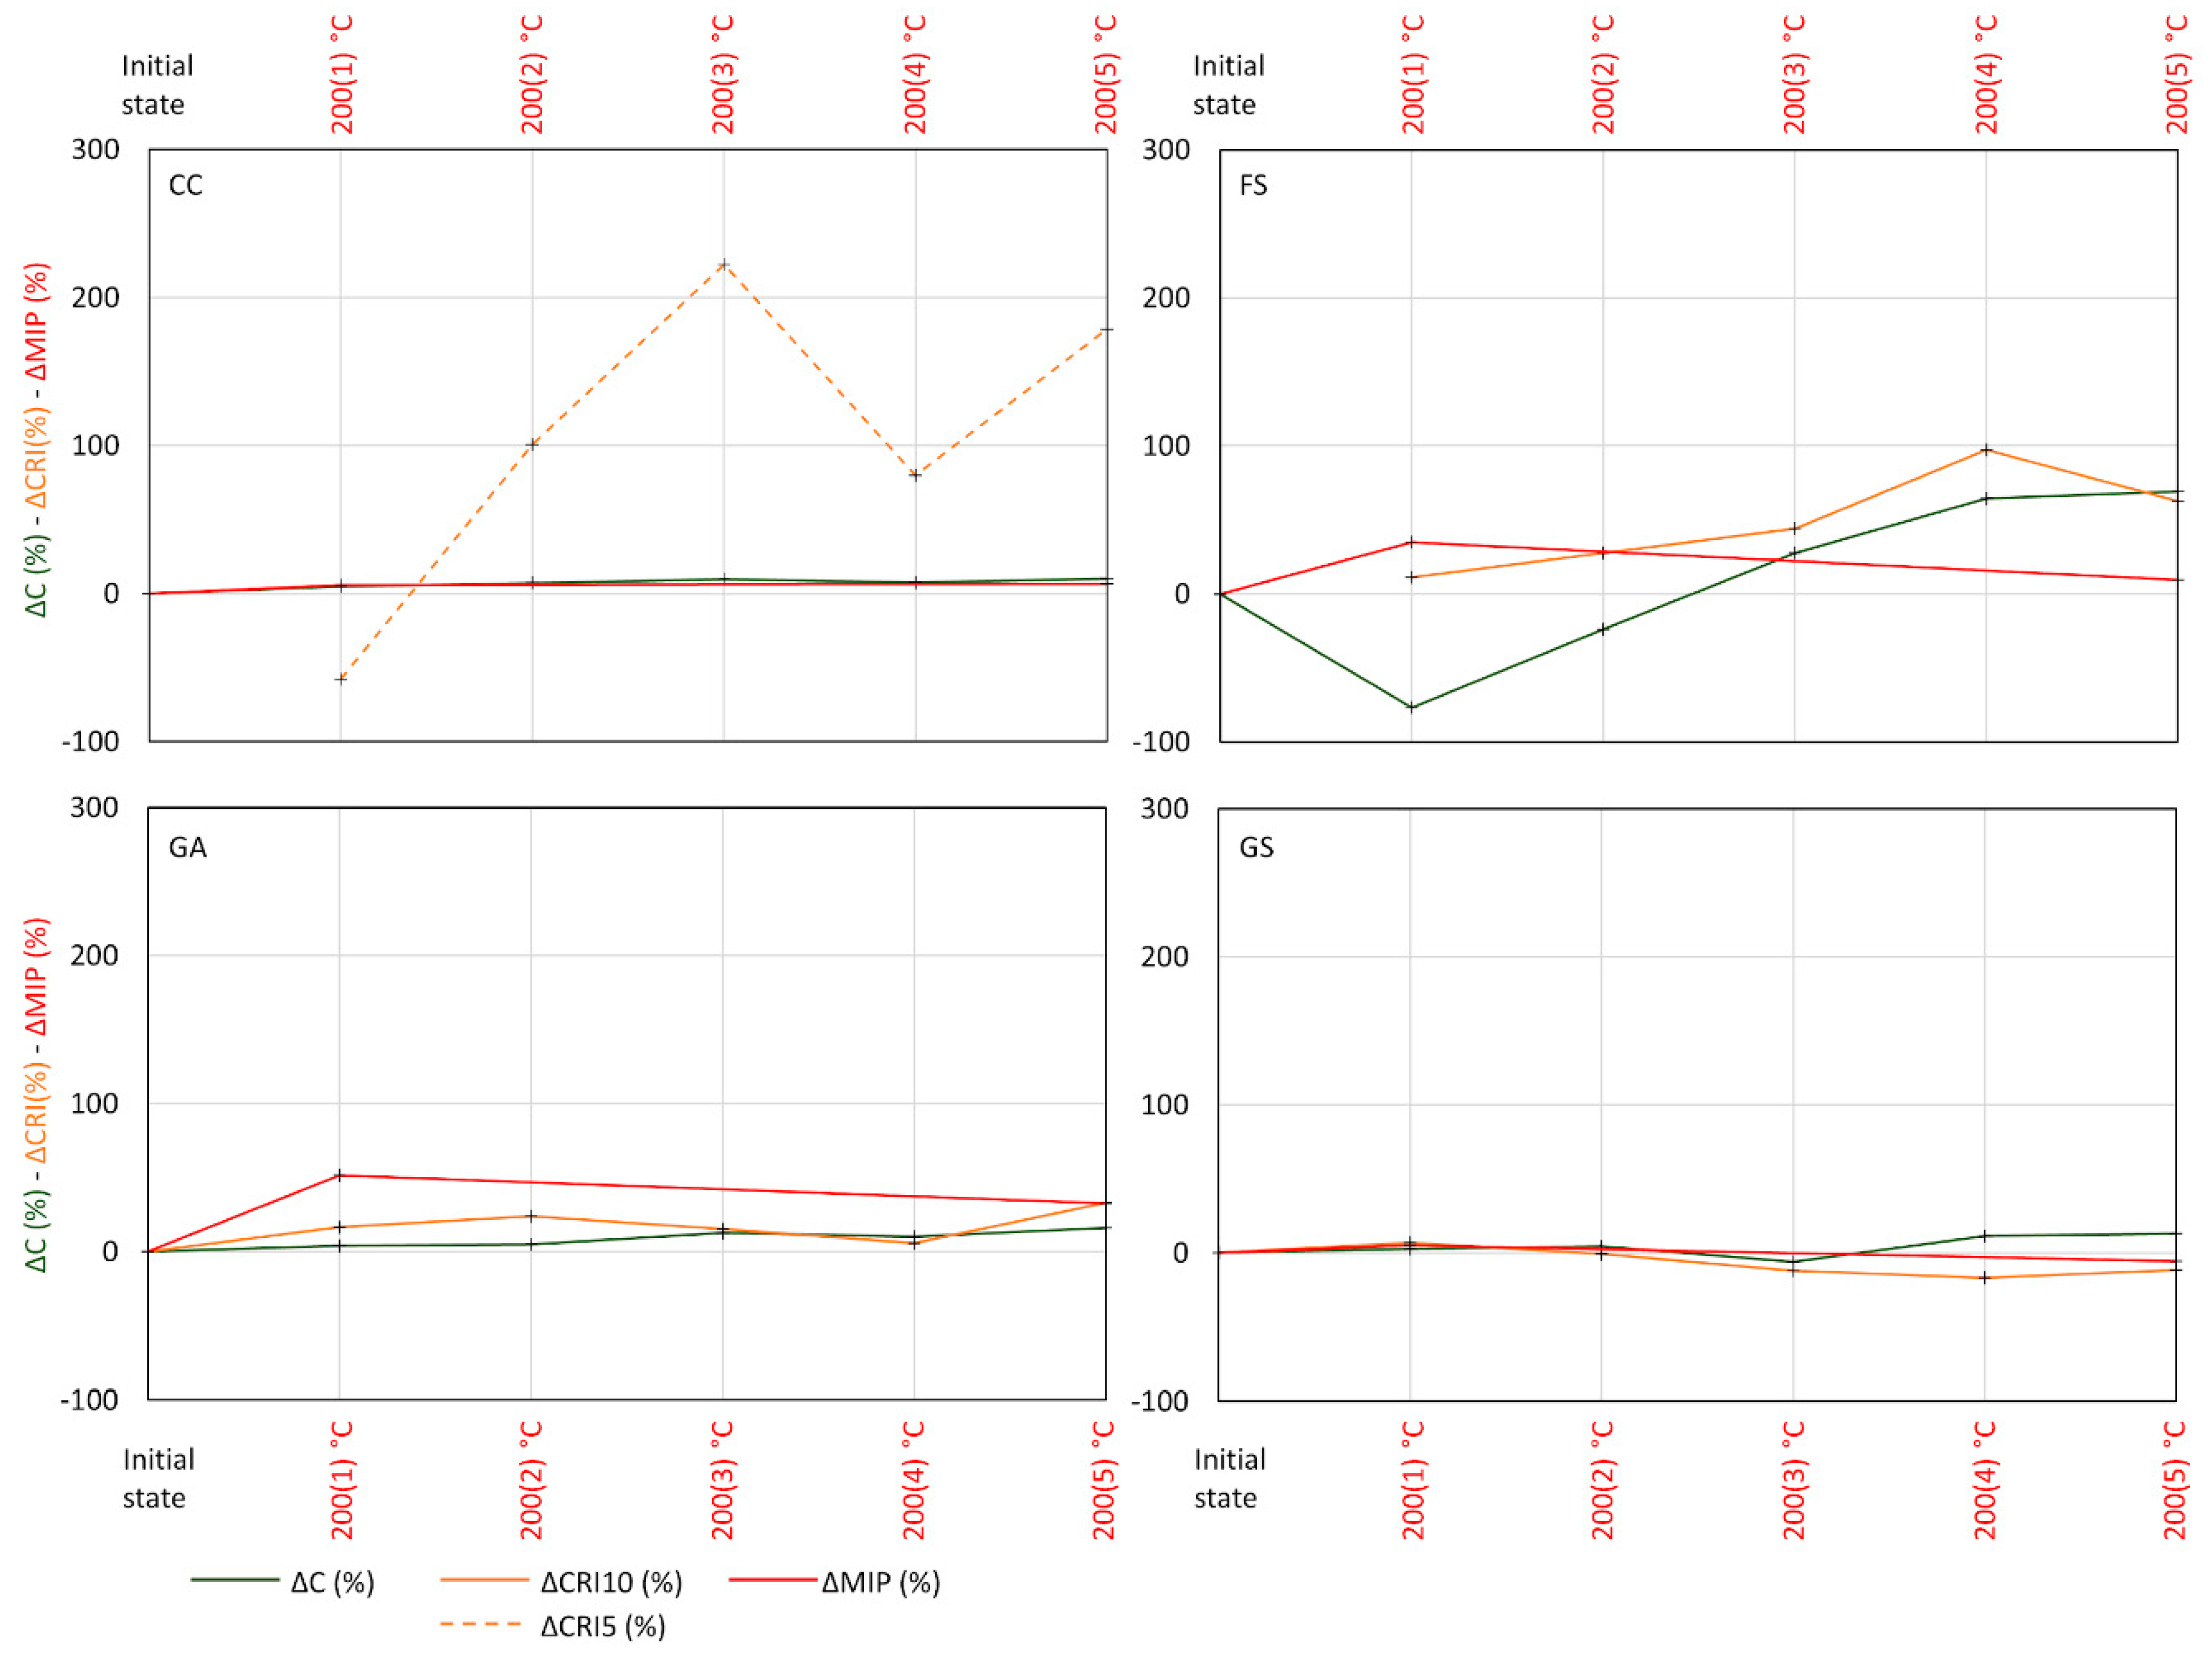
4.2. Mercury Injection Porosimetry (MIP)
4.3. Capillary Absorption
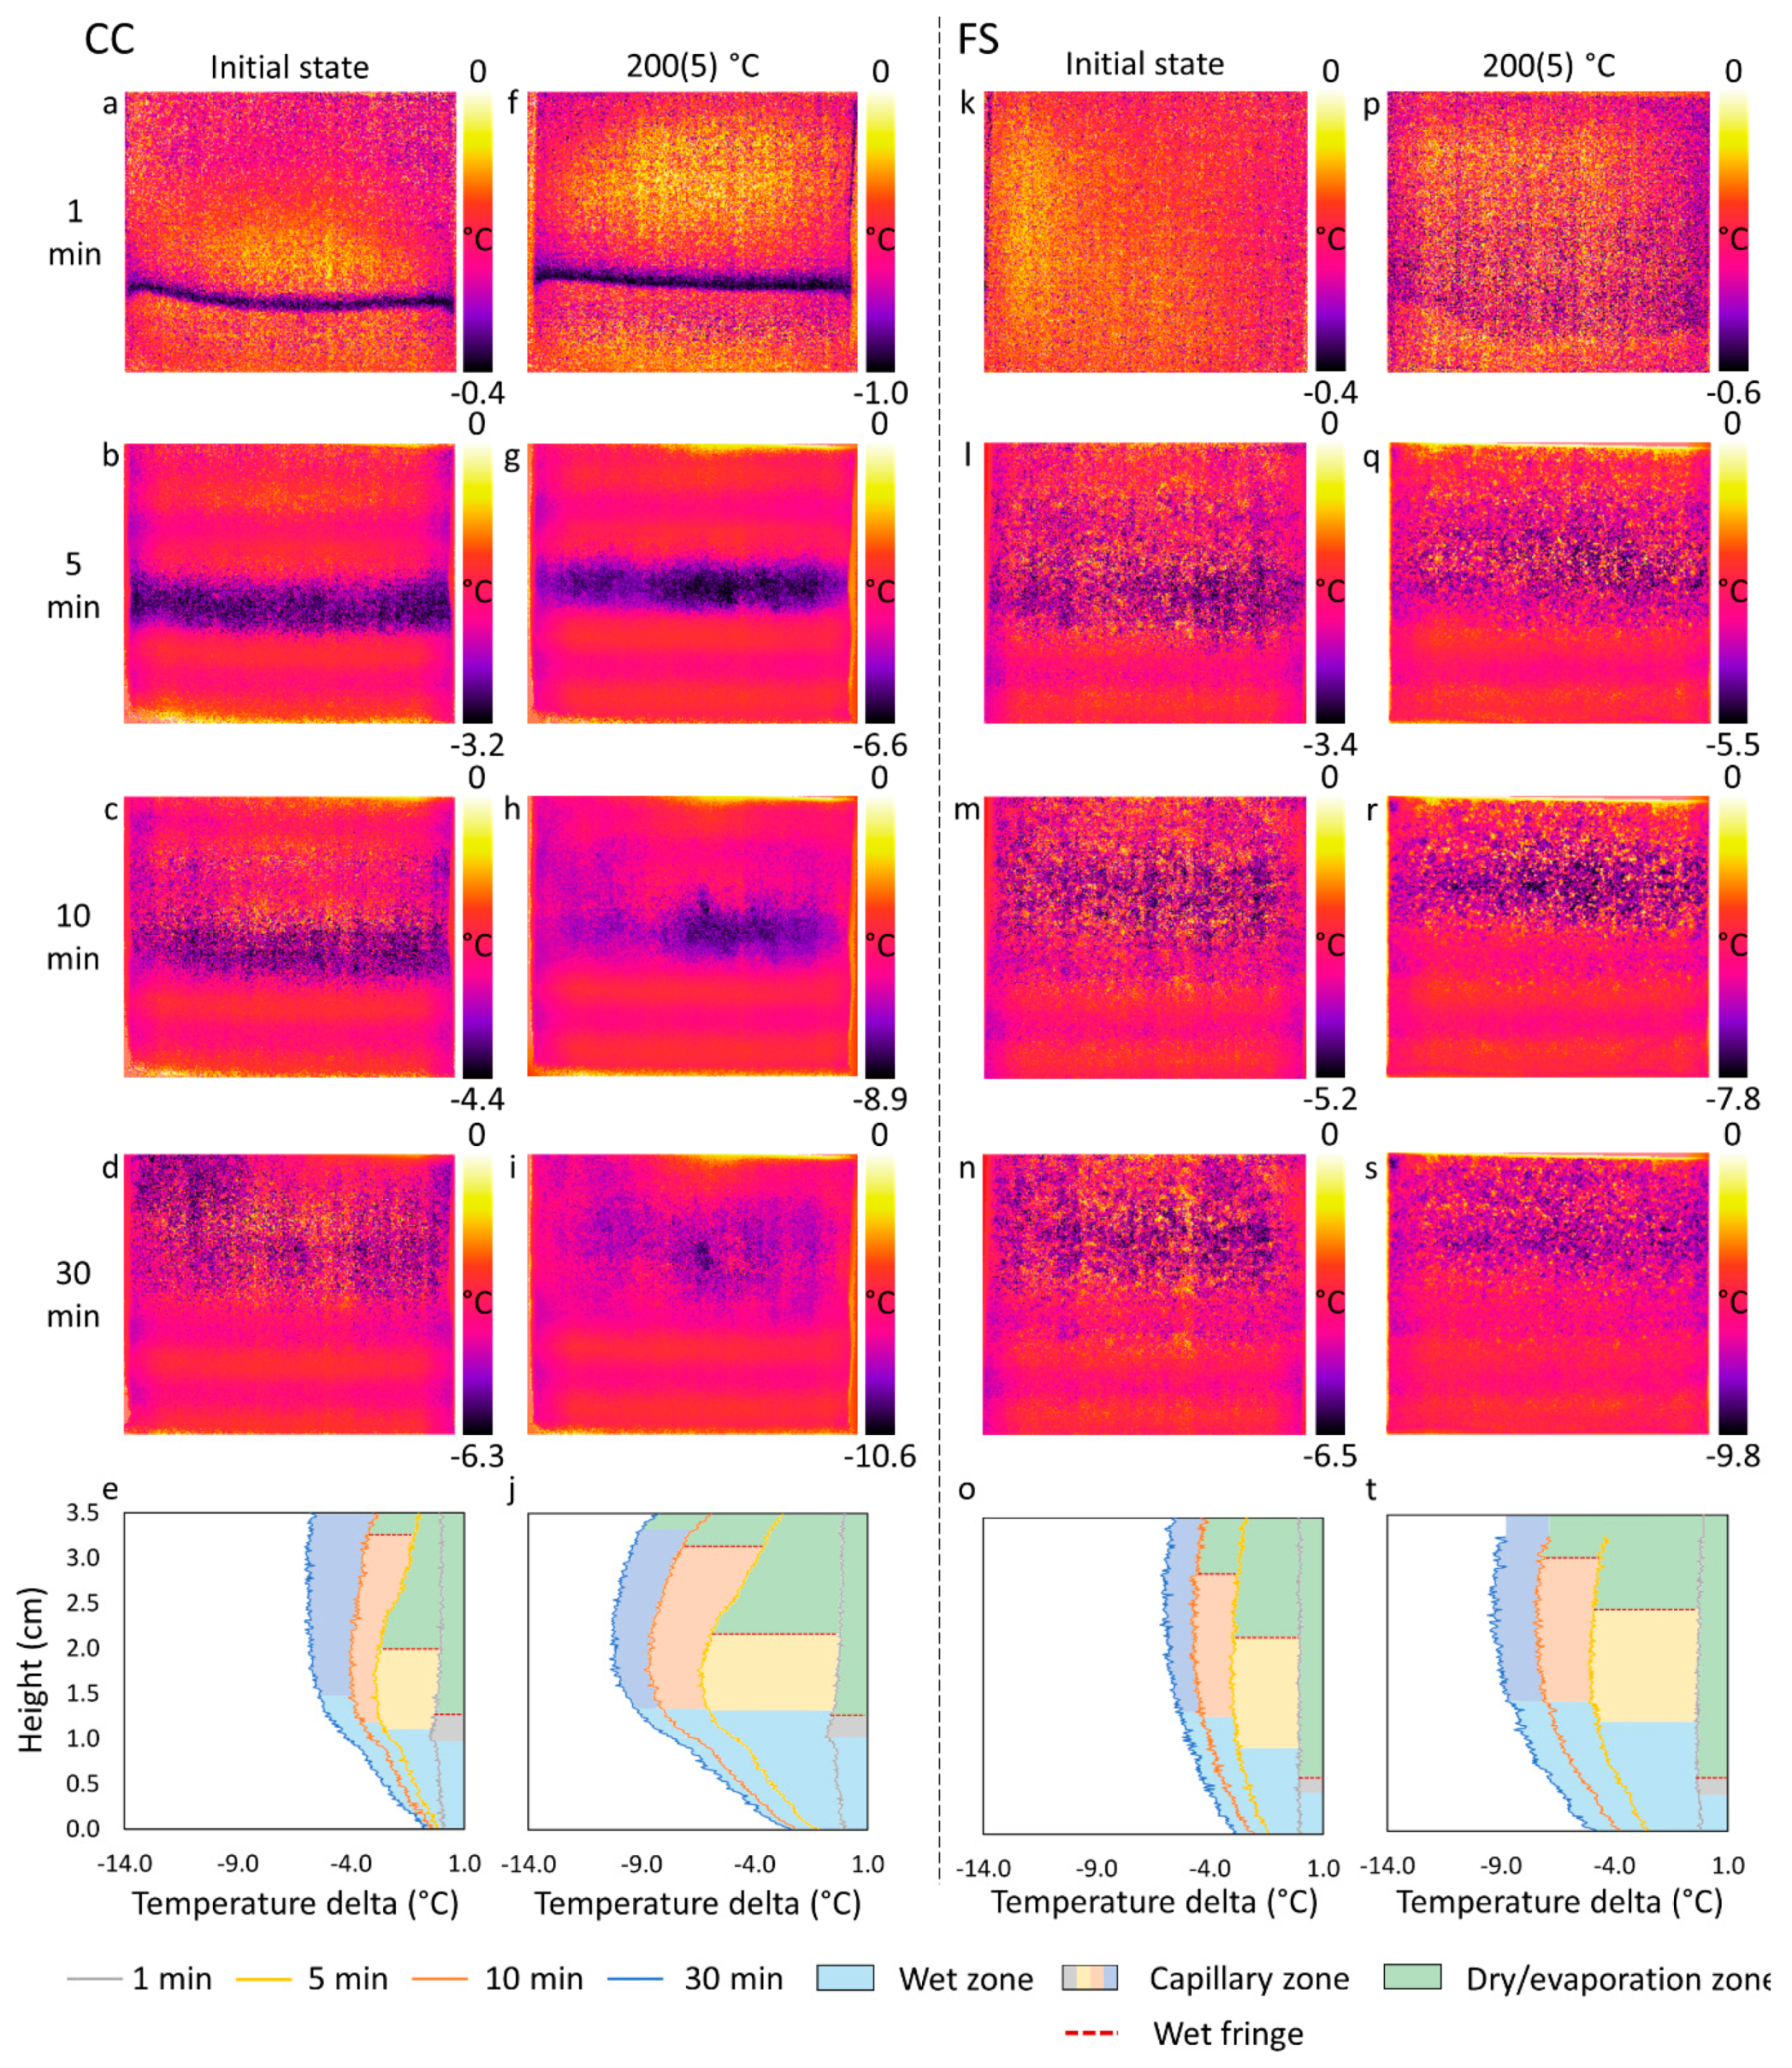
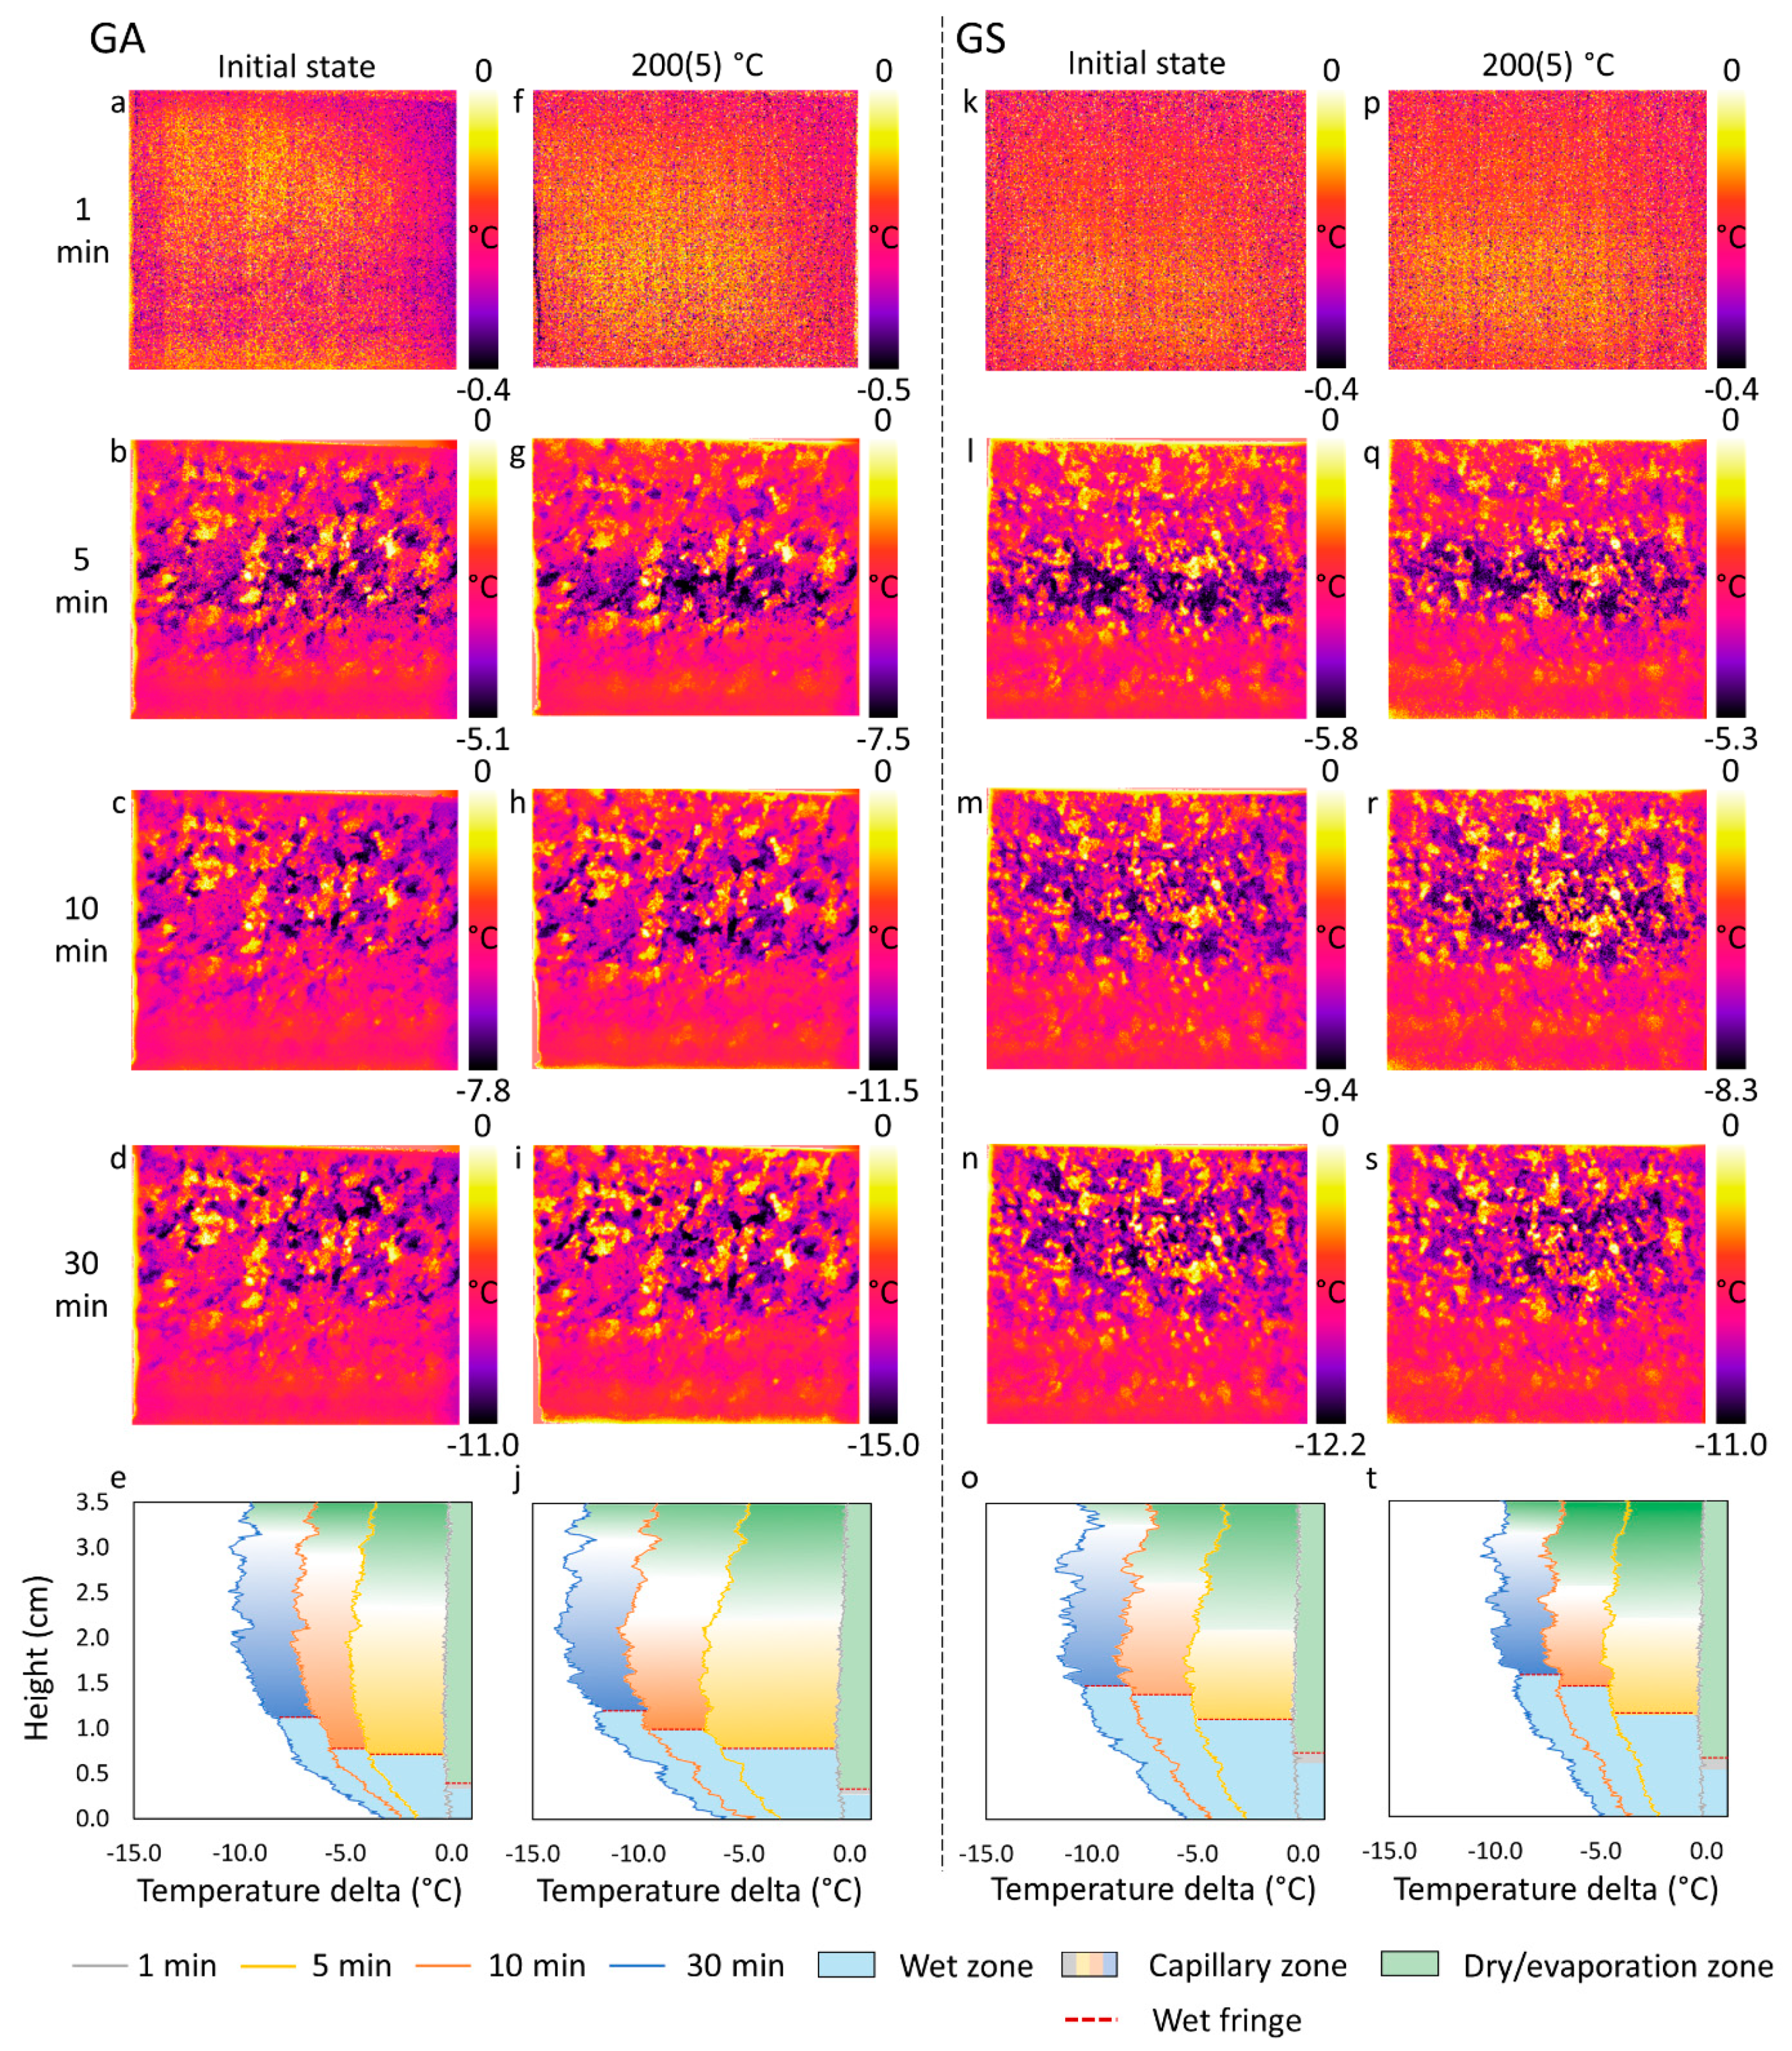
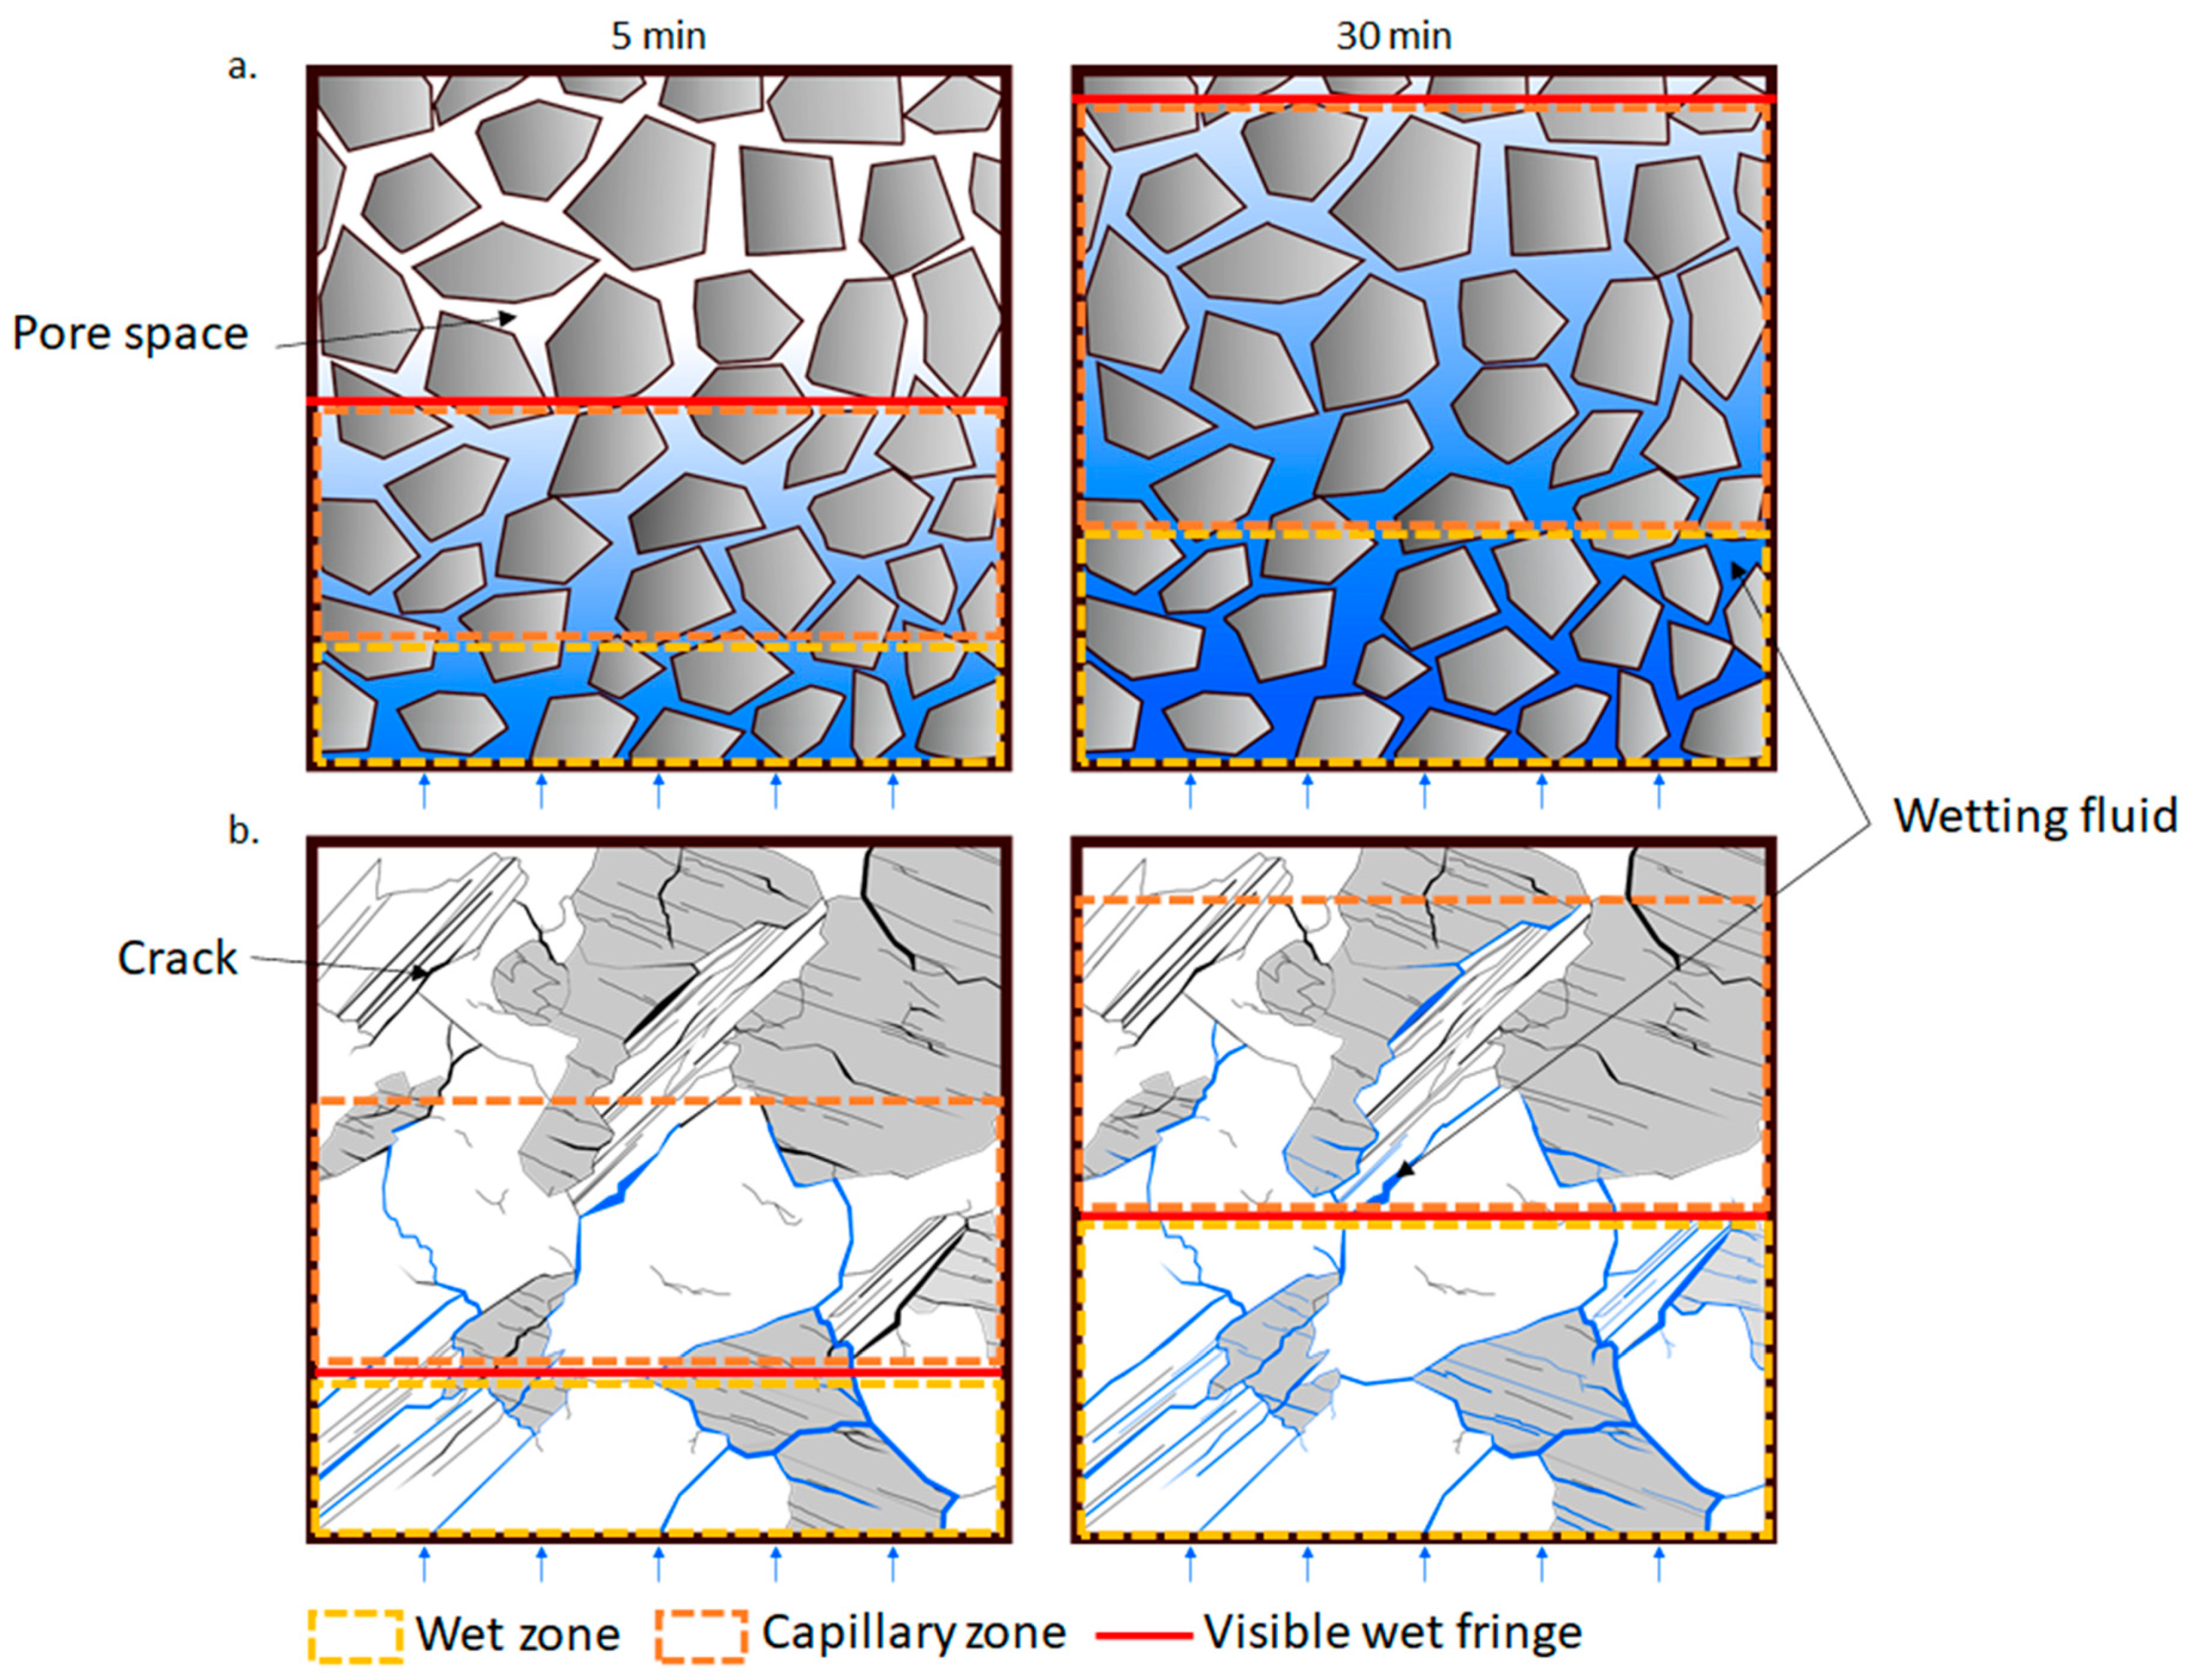
4.4. Wet Fringe
- In the sedimentary stones, this zone was also observed by the naked eye as wet. The upper part of the capillary zone corresponded to the visible wet fringe.
- In the granites, this zone was dry although a strong mineral cooling produced only by water effect was observed by IRT. The bottom part of the capillary zone corresponded to the visible wet fringe.
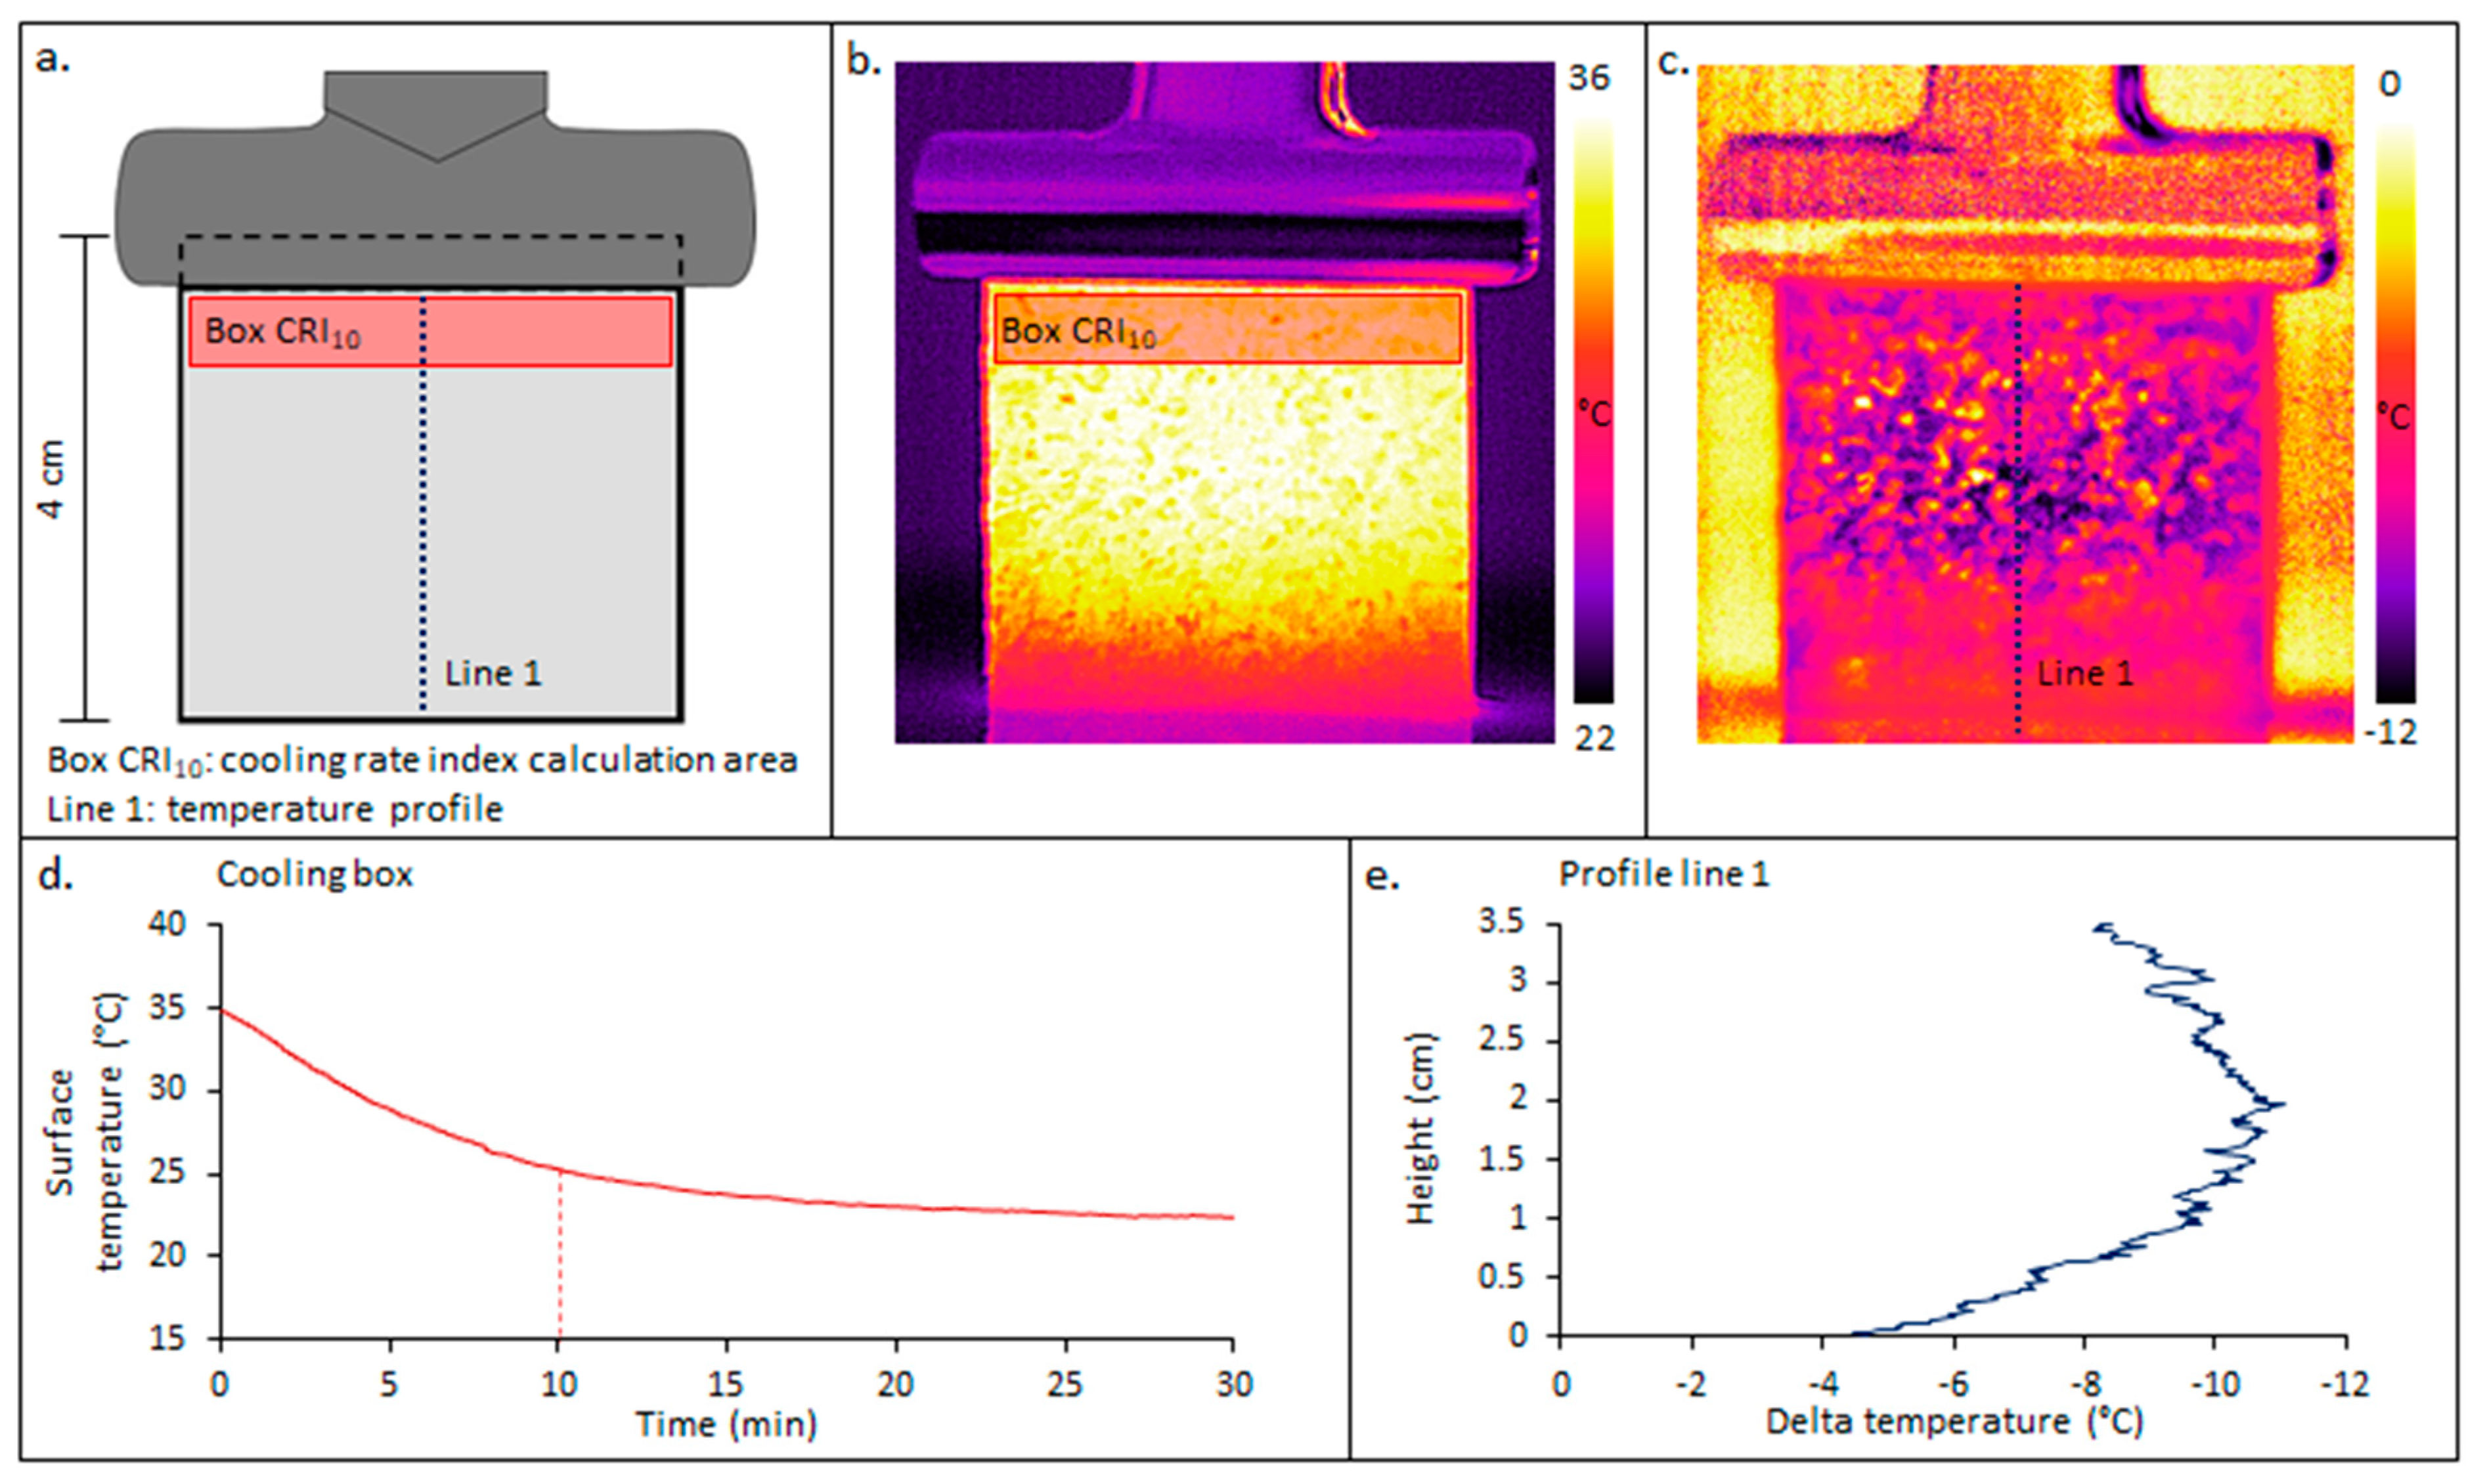
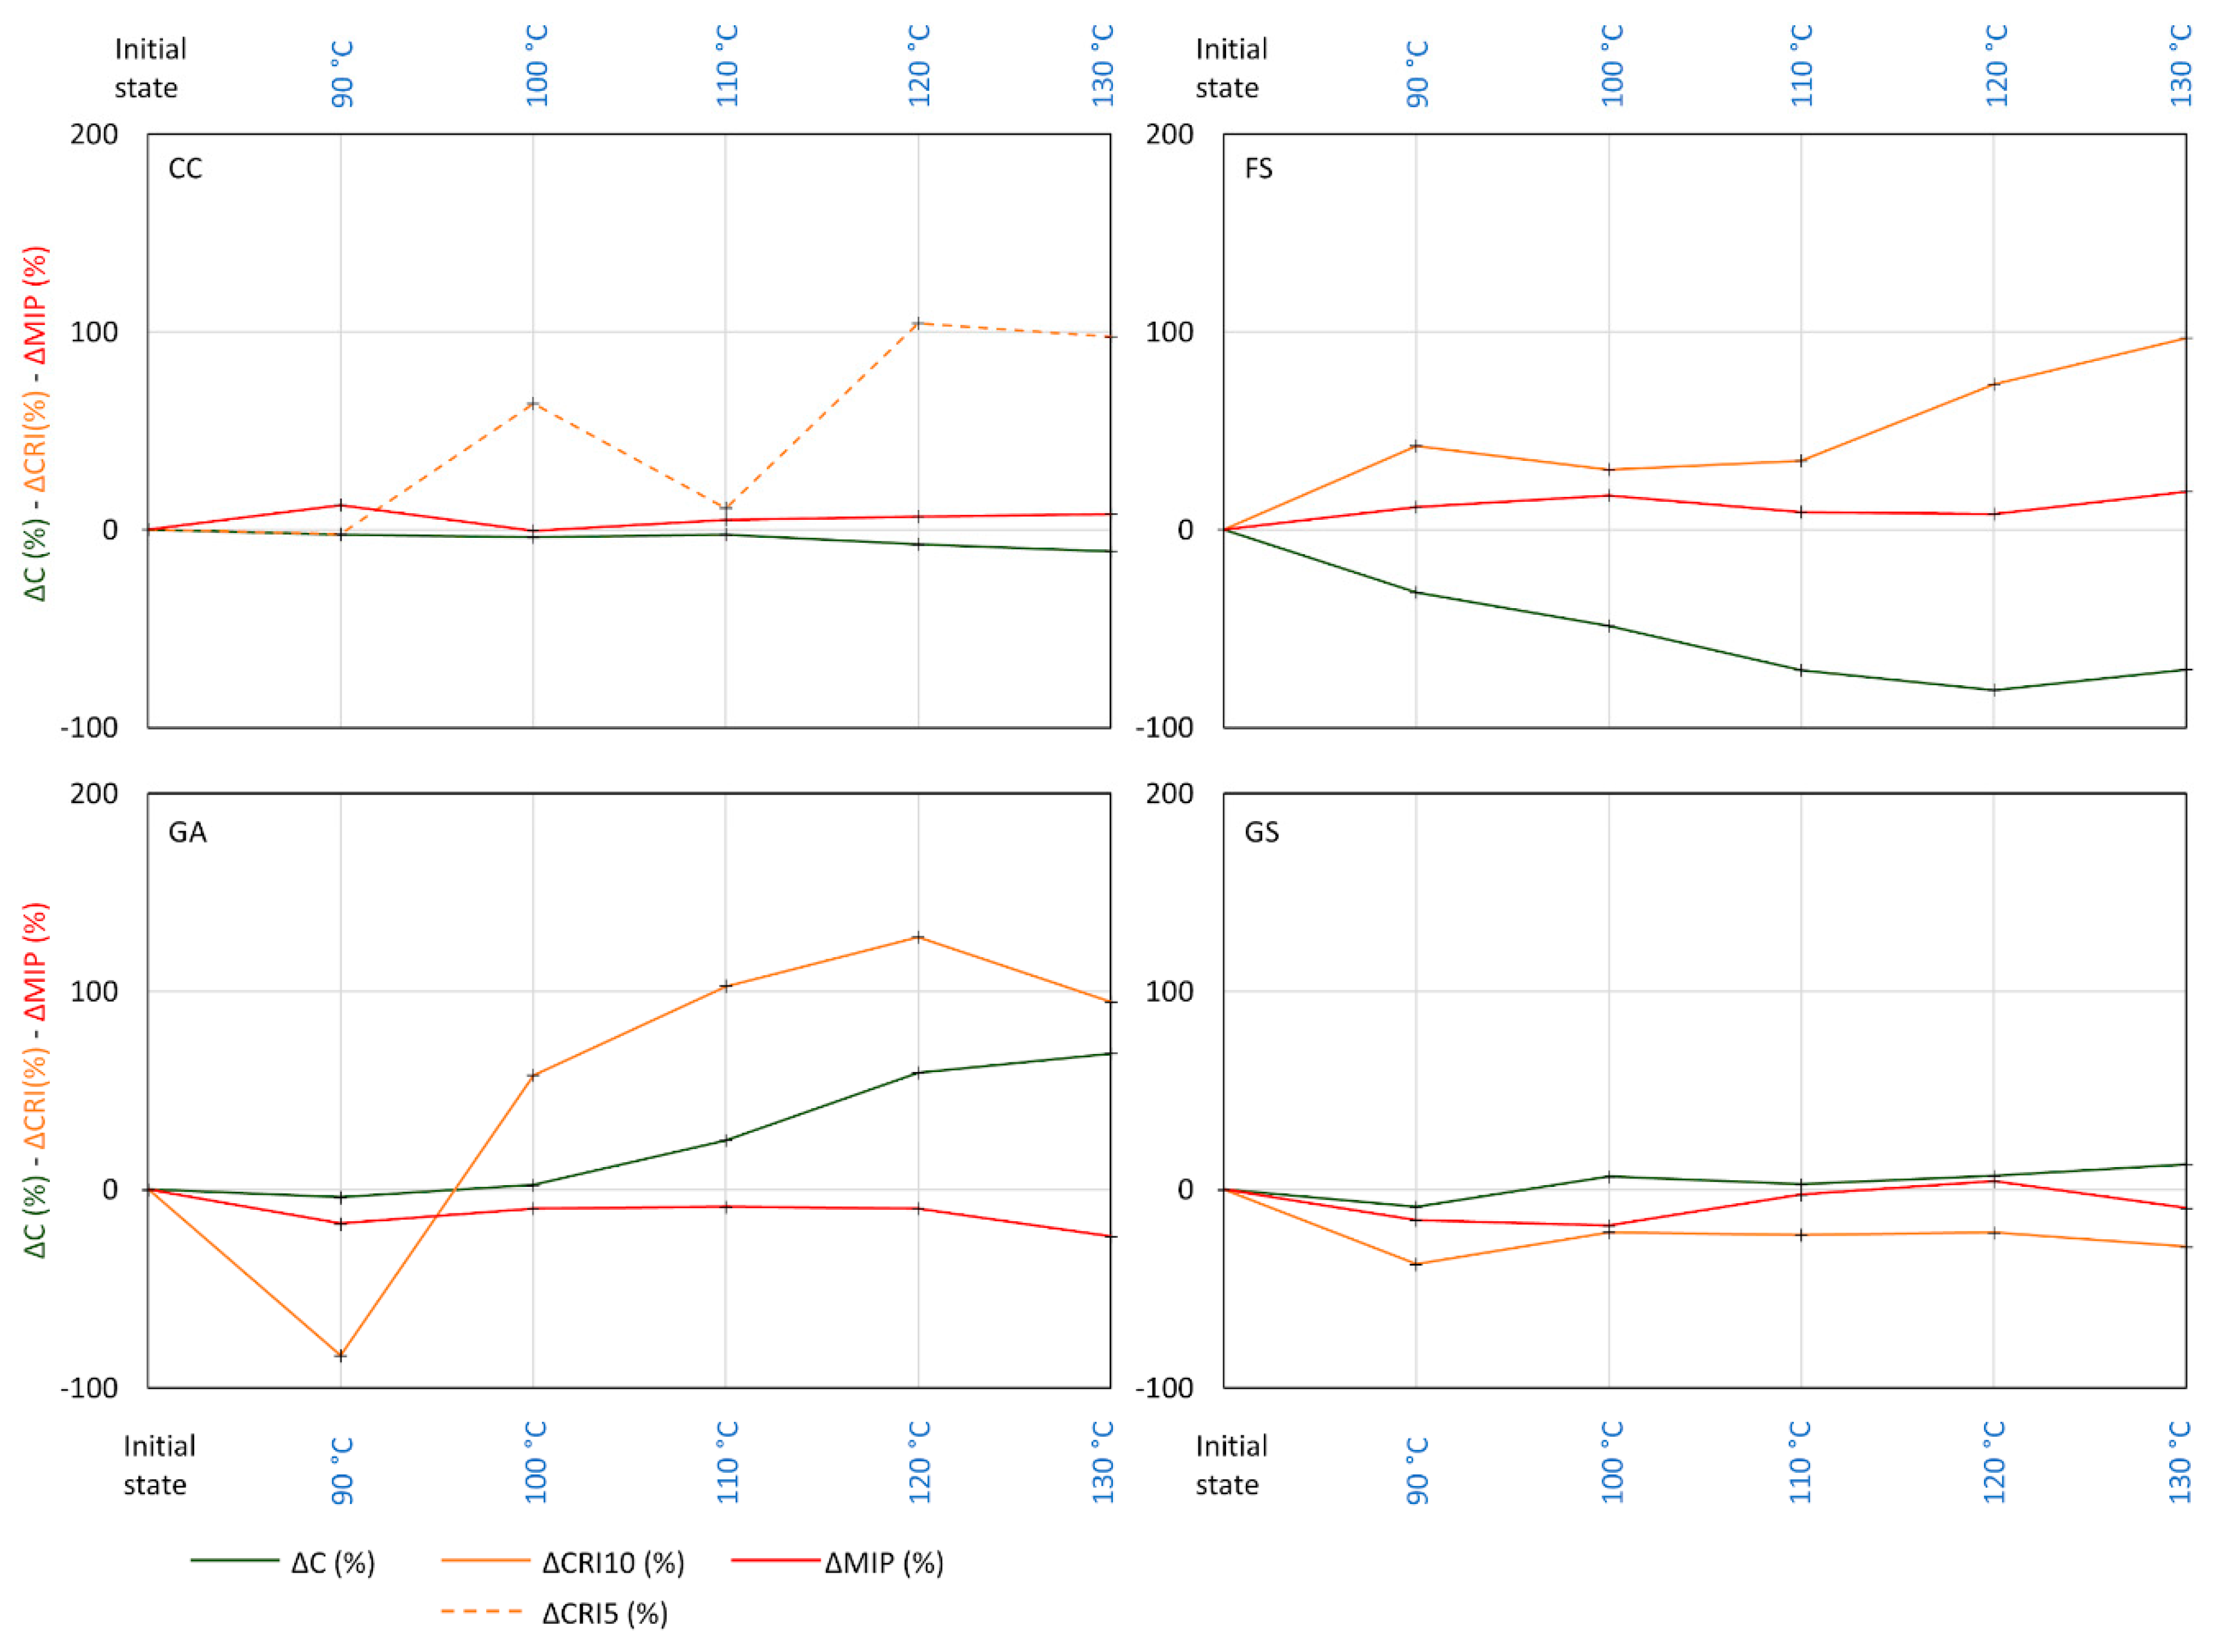
4.5. Cooling Rate Index (CRI)
5. Discussion
5.1. Thermal Threshold Test (TT)
5.2. Thermal Fatigue Test (TF)
5.3. IRT as a Tool to Detect Microstructural Changes
6. Conclusions
Author Contributions
Funding
Institutional Review Board Statement
Informed Consent Statement
Data Availability Statement
Acknowledgments
Conflicts of Interest
References
- Bai, B.; He, Y.; Li, X. Numerical study on the heat transfer characteristics between supercritical carbon dioxide and granite fracture wall. Geothermics 2018, 75, 40–47. [Google Scholar] [CrossRef]
- Brehme, M.; Blöcher, G.; Cacace, M.; Kamah, Y.; Sauter, M.; Zimmermann, G. Permeability distribution in the Lahendong geothermal field: A blind fault captured by thermal–hydraulic simulation. Environ. Earth Sci. 2016, 75, 1088. [Google Scholar] [CrossRef]
- Nadah, J.; Skoczylas, F.; Bakowski, S. Effet de la temperature sur le comportement mecanique d’une craie du Nord de la France. In Congrès Français de Mécanique; AFM, Maison de la Mécanique: Courbevoie, France, 2009. [Google Scholar]
- Witherspoon, P.A.; Nelson, P.; Doe, T.; Thorpe, R.; Paulsson, B.; Gale, J.; Forster, C. Rock Mass Characterization for Storage of Nuclear Waste in Granite. IEEE Trans. Nucl. Sci. 1980, 27, 1280–1290. [Google Scholar] [CrossRef] [Green Version]
- Andreassen, K.A. Temperature Influence on Rock Mechanical Properties: High-Porosity, Low-Cemented Chalk; Technical University of Denmark (DTU): Lyngby-Taarbæk, Denmark, 2011. [Google Scholar]
- Heuze, F.E. High-temperature mechanical, physical and Thermal properties of granitic rocks—A review. Int. J. Rock Mech. Min. Sci. Geomech. Abstr. 1983, 20, 3–10. [Google Scholar] [CrossRef]
- Lion, M.; Skoczylas, F.; Ledesert, B. Effects of heating on the hydraulic and poroelastic properties of bourgogne limestone. Int. J. Rock Mech. Min. Sci. 2005, 42, 508–520. [Google Scholar] [CrossRef]
- Somerton, W.H.; Mehta, M.M.; Dean, G.W. Thermal Alteration of Sandstones. J. Pet. Technol. 1965, 17, 589–593. [Google Scholar] [CrossRef]
- Takarli, M.; Prince-Agbodjan, W. Temperature Effects on Physical Properties and Mechanical Behavior of Granite: Experimental Investigation of Material Damage. JAI 2008, 5, 1–13. [Google Scholar] [CrossRef]
- Sajid, M.; Coggan, J.; Arif, M.; Andersen, J.; Rollinson, G. Petrographic features as an effective indicator for the variation in strength of granites. Eng. Geol. 2016, 202, 44–54. [Google Scholar] [CrossRef] [Green Version]
- Faÿ-Gomord, O.; Soete, J.; Katika, K.; Galaup, S.; Caline, B.; Descamps, F.; Lasseur, E.; Fabricius, I.L.; Saïag, J.; Swennen, R.; et al. New insight into the microtexture of chalks from NMR analysis. Mar. Pet. Geol. 2016, 75, 252–271. [Google Scholar] [CrossRef] [Green Version]
- Madland, M.V.; Hiorth, A.; Omdal, E.; Megawati, M.; Hildebrand-Habel, T.; Korsnes, R.I.; Evje, S.; Cathles, L.M. Chemical Alterations Induced by Rock-Fluid Interactions When Injecting Brines in High Porosity Chalks. Transp. Porous Media 2011, 87, 679–702. [Google Scholar] [CrossRef]
- Rosenbrand, E.; Haugwitz, C.; Jacobsen, P.S.M.; Kjøller, C.; Fabricius, I.L. The effect of hot water injection on sandstone permeability. Geothermics 2014, 50, 155–166. [Google Scholar] [CrossRef]
- Somerton, W.H.; Janah, A.H.; Ashqar, P.I. Thermal Expansion of Fluid Saturated Rocks Under Stress. In Proceedings of the SPWLA 22nd Annual Logging Symposium, Mexico City, Mexico, 23–26 June 1981. [Google Scholar]
- Wang, Y.; Dusseault, M.B. A coupled conductive-convective thermo-poroelastic solution and implications for wellbore stability. J. Pet. Sci. Eng. 2003, 38, 187–198. [Google Scholar] [CrossRef]
- Ding, Q.-L.; Ju, F.; Mao, X.-B.; Ma, D.; Yu, B.-Y.; Song, S.-B. Experimental Investigation of the Mechanical Behavior in Unloading Conditions of Sandstone After High-Temperature Treatment. Rock Mech. Rock Eng. 2016, 49, 2641–2653. [Google Scholar] [CrossRef]
- Yang, S.-Q.; Ranjith, P.G.; Jing, H.-W.; Tian, W.-L.; Ju, Y. An experimental investigation on thermal damage and failure mechanical behavior of granite after exposure to different high temperature treatments. Geothermics 2017, 65, 180–197. [Google Scholar] [CrossRef]
- Berest, P.; Vouille, G. Notions de base de la thermomécanique. In La Thermomécanique des Roches, BRGM Manuels Méthodes 16; Berest, P., Weber, P., Eds.; Bureau de Recherches Géologique et Minières: Orléans, France, 1988; pp. 68–101. [Google Scholar]
- Chayé d’Albissin, M.; Sirieys, P. Thermal deformability of rocks: Relation to rock structure. In Rock at Great Depth; Maury & Fourmaintraux: Balkema, Rotterdam, 1989; pp. 363–370. [Google Scholar]
- Gómez-Heras, M.; Smith, B.J.; Fort, R. Surface temperature differences between minerals in crystalline rocks: Implications for granular disaggregation of granites through thermal fatigue. Geomorphology 2006, 78, 236–249. [Google Scholar] [CrossRef]
- Vázquez, P.; Siegesmund, S.; Alonso, F.J. Bowing of dimensional granitic stones. Environ. Earth Sci. 2011, 63, 1603–1612. [Google Scholar] [CrossRef] [Green Version]
- Darot, M.; Gueguen, Y.; Baratin, M.-L. Permeability of thermally cracked granite. Geophys. Res. Lett. 1992, 19, 869–872. [Google Scholar] [CrossRef]
- Géraud, Y.; Mazerolle, F.; Raynaud, S. Comparison between connected and overall porosity of thermally stressed granites. J. Struct. Geol. 1992, 14, 981–990. [Google Scholar] [CrossRef]
- Lin, W. Permanent strain of thermal expansion and thermally induced microcracking in Inada granite. J. Geophys. Res. Solid Earth 2002, 107, ECV 3-1–ECV 3-16. [Google Scholar] [CrossRef]
- Meredith, P.G.; Atkinson, B.K. Fracture toughness and subcritical crack growth during high-temperature tensile deformation of Westerly granite and Black gabbro. Phys. Earth Planet. Inter. 1985, 39, 33–51. [Google Scholar] [CrossRef]
- Yu, Q.L.; Ranjith, P.G.; Liu, H.Y.; Yang, T.H.; Tang, S.B.; Tang, C.A.; Yang, S.Q. A Mesostructure-based Damage Model for Thermal Cracking Analysis and Application in Granite at Elevated Temperatures. Rock Mech. Rock Eng. 2015, 48, 2263–2282. [Google Scholar] [CrossRef]
- Janio de Castro Lima, J.; Paraguassú, A.B. Linear thermal expansion of granitic rocks: Influence of apparent porosity, grain size and quartz content. Bull. Eng. Geol. Environ. 2004, 63, 215–220. [Google Scholar] [CrossRef]
- Vázquez, P.; Sánchez-Delgado, N.; Carrizo, L.; Thomachot-Schneider, C.; Alonso, F.J. Statistical approach of the influence of petrography in mechanical properties and durability of granitic stones. Environ. Earth Sci. 2018, 77, 287. [Google Scholar] [CrossRef]
- Vázquez, P.; Shushakova, V.; Gómez-Heras, M. Influence of mineralogy on granite decay induced by temperature increase: Experimental observations and stress simulation. Eng. Geol. 2015, 189, 58–67. [Google Scholar] [CrossRef]
- Zhang, W.; Sun, Q.; Zhu, S.; Wang, B. Experimental study on mechanical and porous characteristics of limestone affected by high temperature. Appl. Therm. Eng. 2017, 110, 356–362. [Google Scholar] [CrossRef]
- Zhang, W.; Sun, Q.; Hao, S.; Yang, L. Experimental study of the effect of thermal damage on resistivity and mechanical properties of sandstone. Acta Geodyn. Geomater. 2015, 13, 185–192. [Google Scholar] [CrossRef] [Green Version]
- Zhao, F.; Sun, Q.; Zhang, W. Fractal analysis of pore structure of granite after variable thermal cycles. Environ. Earth Sci. 2019, 78, 677. [Google Scholar] [CrossRef]
- Benavente, D.; Lock, P.; Ángeles García Del Cura, M.; Ordóñez, S. Predicting the Capillary Imbibition of Porous Rocks from Microstructure. Transp. Porous Media 2002, 49, 59–76. [Google Scholar] [CrossRef]
- Thomachot-Schneider, C.; Gommeaux, M.; Fronteau, G. Modifications of the porous network of sandstone accompanying the formation of black varnish. Environ. Geol. 2008, 56, 571–582. [Google Scholar] [CrossRef]
- Vázquez, P.; Alonso, F.J.; Esbert, R.M.; Ordaz, J. Ornamental granites: Relationships between p-waves velocity, water capillary absorption and the crack network. Constr. Build. Mater. 2010, 24, 2536–2541. [Google Scholar] [CrossRef]
- Avdelidis, N.P.; Moropoulou, A.; Marioli Riga, Z.P. The technology of composite patches and their structural reliability inspection using infrared imaging. Prog. Aerosp. Sci. 2003, 39, 317–328. [Google Scholar] [CrossRef]
- Forestieri, G.; de Buergo, M.Á. Infrared Thermography technique (IRT) for the evaluation of the hydric behavior of building stones. Acta IMEKO 2018, 7, 20–23. [Google Scholar] [CrossRef]
- Ludwig, N.; Rosina, E.; Sansonetti, A. Evaluation and monitoring of water diffusion into stone porous materials by means of innovative IR thermography techniques. Measurement 2018, 118, 348–353. [Google Scholar] [CrossRef] [Green Version]
- Zhang, F.; Zhang, X.; Li, Y.; Tao, Z.; Liu, W.; He, M. Quantitative description theory of water migration in rock sites based on infrared radiation temperature. Eng. Geol. 2018, 241, 64–75. [Google Scholar] [CrossRef]
- Grinzato, E.; Marinetti, S.; Bison, P.G.; Concas, M.; Fais, S. Comparison of ultrasonic velocity and IR thermography for the characterisation of stones. Infrared Phys. Technol. 2004, 46, 63–68. [Google Scholar] [CrossRef]
- Mineo, S.; Pappalardo, G. InfraRed Thermography presented as an innovative and non-destructive solution to quantify rock porosity in laboratory. Int. J. Rock Mech. Min. Sci. 2019, 115, 99–110. [Google Scholar] [CrossRef]
- Mineo, S.; Pappalardo, G. The Use of Infrared Thermography for Porosity Assessment of Intact Rock. Rock Mech. Rock Eng. 2016, 49, 3027–3039. [Google Scholar] [CrossRef]
- Thomachot-Schneider, C.; Vázquez, P.; Gommeaux, M.; Lelarge, N.; Conreux, A.; Drothière, X.; Mouhoubi, K.; Bodnar, J.-L. Thermal response of building stones contaminated with salts. Constr. Build. Mater. 2019, 226, 331–344. [Google Scholar] [CrossRef]
- Pappalardo, G.; Mineo, S.; Zampelli, S.P.; Cubito, A.; Calcaterra, D. InfraRed Thermography proposed for the estimation of the Cooling Rate Index in the remote survey of rock masses. Int. J. Rock Mech. Min. Sci. 2016, 83, 182–196. [Google Scholar] [CrossRef]
- Pappalardo, G.; Mineo, S. Investigation on the mechanical attitude of basaltic rocks from Mount Etna through InfraRed Thermography and laboratory tests. Constr. Build. Mater. 2017, 134, 228–235. [Google Scholar] [CrossRef]
- Kim, K.; Kemeny, J.; Nickerson, M. Effect of Rapid Thermal Cooling on Mechanical Rock Properties. Rock Mech. Rock Eng. 2014, 47, 2005–2019. [Google Scholar] [CrossRef]
- Robert, R. Analytical Characterization of Porous Geomaterials: Reference Assessment in Some Sedimentary Rocks. Ph.D. Thesis, Humboldt-Universität zu Berlin, Berlin, Germany, 2004. [Google Scholar]
- Vera, J.A. Geología de España; SGE-IGME: Madrid, Spain, 2004. [Google Scholar]
- Chaki, S.; Takarli, M.; Agbodjan, W.P. Influence of thermal damage on physical properties of a granite rock: Porosity, permeability and ultrasonic wave evolutions. Constr. Build. Mater. 2008, 22, 1456–1461. [Google Scholar] [CrossRef]
- Dwivedi, R.D.; Goel, R.K.; Prasad, V.V.R.; Sinha, A. Thermo-mechanical properties of Indian and other granites. Int. J. Rock Mech. Min. Sci. 2008, 45, 303–315. [Google Scholar] [CrossRef]
- Homand-Etienne, F.; Houpert, R. Thermally induced microcracking in granites: Characterization and analysis. Int. J. Rock Mech. Min. Sci. Geomech. Abstr. 1989, 26, 125–134. [Google Scholar] [CrossRef]
- Reuschlé, T.; Gbaguidi Haore, S.; Darot, M. The effect of heating on the microstructural evolution of La Peyratte granite deduced from acoustic velocity measurements. Earth Planet. Sci. Lett. 2006, 243, 692–700. [Google Scholar] [CrossRef]
- Tang, Z.C.; Sun, M.; Peng, J. Influence of high temperature duration on physical, thermal and mechanical properties of a fine-grained marble. Appl. Therm. Eng. 2019, 156, 34–50. [Google Scholar] [CrossRef]
- Huang, Y.-H.; Yang, S.-Q.; Tian, W.-L.; Zhao, J.; Ma, D.; Zhang, C.-S. Physical and mechanical behavior of granite containing pre-existing holes after high temperature treatment. Arch. Civ. Mech. Eng. 2017, 17, 912–925. [Google Scholar] [CrossRef]
- Kumari, W.G.P.; Ranjith, P.G.; Perera, M.S.A.; Chen, B.K.; Abdulagatov, I.M. Temperature-dependent mechanical behaviour of Australian Strathbogie granite with different cooling treatments. Eng. Geol. 2017, 229, 31–44. [Google Scholar] [CrossRef]
- Li, B.; Ju, F.; Xiao, M.; Ning, P. Mechanical stability of granite as thermal energy storage material: An experimental investigation. Eng. Fract. Mech. 2019, 211, 61–69. [Google Scholar] [CrossRef]
- Ozguven, A.; Ozcelik, Y. Investigation of some property changes of natural building stones exposed to fire and high heat. Constr. Build. Mater. 2013, 38, 813–821. [Google Scholar] [CrossRef]
- Thermtest Thermal Conductivity Measurement & Testing Service. Available online: https://thermtest.com/ (accessed on 7 January 2021).
- Homand-Etienne, F. Manuel de Mécanique des Roches; Presses des MINES: Paris, France, 1986. [Google Scholar]
- Freire-Lista, D.M.; Fort, R.; Varas-Muriel, M.J. Thermal stress-induced microcracking in building granite. Eng. Geol. 2016, 206, 83–93. [Google Scholar] [CrossRef] [Green Version]
- Tiskatine, R.; Oaddi, R.; Ait El Cadi, R.; Bazgaou, A.; Bouirden, L.; Aharoune, A.; Ihlal, A. Suitability and characteristics of rocks for sensible heat storage in CSP plants. Sol. Energy Mater. Sol. Cells 2017, 169, 245–257. [Google Scholar] [CrossRef]
- Megawati, M.; Madland, M.V.; Hiorth, A. Mechanical and physical behavior of high-porosity chalks exposed to chemical perturbation. J. Pet. Sci. Eng. 2015, 133, 313–327. [Google Scholar] [CrossRef] [Green Version]
- Nermoen, A.; Korsnes, R.I.; Aursjø, O.; Madland, M.V.; Kjørslevik, T.A.C.; Østensen, G. How Stress and Temperature Conditions Affect Rock-Fluid Chemistry and Mechanical Deformation. Front. Phys. 2016, 4, 2. [Google Scholar] [CrossRef]
- Madland, M.V. Water Weakening of Chalk: A Mechanistic Study; University of Stavanger: Stavanger, Norway, 2005. [Google Scholar]
- Addis, M.A. The Behaviour and Modelling of Weak Rocks. In Proceedings of the ISRM International Symposium, Pau, France, 30 August–2 September 1989. [Google Scholar]
- Brignoli, M.; Santarelli, F.J.; Righetti, C. Capillary phenomena in an impure chalk. In Proceedings of the Rock Mechanics in Petroleum Engineering, Delft, The Netherlands, 29–31 August 1994. [Google Scholar]
- Charlez, P.; Heugas, O.; Shao, J.F. Effect of Temperature on Mechanical Properties of Chalk; Joint Chalk Research Program: Deauville, France, 1992. [Google Scholar]
- DaSilva, F.; Sarda, J.P.; Schroeder, C. Mechanical behavior of chalks. In Proceedings of the North Sea Chalk Symposium, Stavanger, Norway, 1 January 1985. [Google Scholar]
- Potts, D.M.; Jones, M.E.; Berget, O.P. Subsidence above the Ekofisk Oil Reservoirs; British Maritime Technology: London, UK, 1988. [Google Scholar]
- Hellmann, R.; Renders, P.J.; Gratier, J.-P.; Guiguet, R. Experimental pressure solution compaction of chalk in aqueous solutions. Part 1. Deformation behavior and chemistry. Water-rock interactions, ore deposits, and environmental geochemistry: A tribute to David A. Crerar 2002, 7, 129–152. [Google Scholar]
- Weisbrod, N.; Nativ, R.; Adar, E.M.; Ronen, D.; Ben-Nun, A. Impact of coating and weathering on the properties of chalk fracture surfaces. J. Geophys. Res. Solid Earth 2000, 105, 27853–27864. [Google Scholar] [CrossRef]
- Vasin, R.N.; Nikitin, A.N.; Lokajicek, T.; Rudaev, V. Acoustic emission of quasi-isotropic rock samples initiated by temperature gradients. Izv. Phys. Solid Earth 2006, 42, 815–823. [Google Scholar] [CrossRef]
- Yu, J.; Chen, S.; Chen, X.; Zhang, Y.; Cai, Y. Experimental investigation on mechanical properties and permeability evolution of red sandstone after heat treatments. J. Zhejiang Univ. Sci. A 2015, 16, 749–759. [Google Scholar] [CrossRef] [Green Version]
- Jian-ping, Z.; He-ping, X.; Hong-wei, Z.; Su-ping, P. SEM in situ investigation on thermal cracking behaviour of Pingdingshan sandstone at elevated temperatures. Geophys. J. Int. 2010, 181, 593–603. [Google Scholar] [CrossRef] [Green Version]
- Kim, B.-C.; Chen, J.; Kim, J.-Y. Relation between crack density and acoustic nonlinearity in thermally damaged sandstone. Int. J. Rock Mech. Min. Sci. 2020, 125, 104171. [Google Scholar] [CrossRef]
- Hassanzadegan, A.; Blöcher, G.; Milsch, H.; Urpi, L.; Zimmermann, G. The Effects of Temperature and Pressure on the Porosity Evolution of Flechtinger Sandstone. Rock Mech. Rock Eng. 2014, 47, 421–434. [Google Scholar] [CrossRef]
- Dormieux, L.; Molinari, A.; Kondo, D. Micromechanical approach to the behavior of poroelastic materials. J. Mech. Phys. Solids 2002, 50, 2203–2231. [Google Scholar] [CrossRef]
- Skinner, B.J. Thermal expansion. Mem. Geol. Soc. Am. 1966, 97, 76–96. [Google Scholar]
- Jansen, D.P.; Carlson, S.R.; Young, R.P.; Hutchins, D.A. Ultrasonic imaging and acoustic emission monitoring of thermally induced microcracks in Lac du Bonnet granite. J. Geophys. Res. Solid Earth 1993, 98, 22231–22243. [Google Scholar] [CrossRef]
- Somerton, W.H. Thermal Properties and Temperature-Related Behavior of Rock/Fluid Systems; Elsevier Science Ltd.: Amsterdam, The Netherlands; New York, NY, USA, 1992. [Google Scholar]
- Gayo, E.; de Frutos, J. Interference filters as an enhancement tool for infrared thermography in humidity studies of building elements. Infrared Phys. Technol. 1997, 38, 251–258. [Google Scholar] [CrossRef]
- Cernuschi, F. Can TBC porosity be estimated by non-destructive infrared techniques? A theoretical and experimental analysis. Surf. Coat. Technol. 2015, 272, 387–394. [Google Scholar] [CrossRef]


| TT | TF | ||||||||||
|---|---|---|---|---|---|---|---|---|---|---|---|
| Cycle | Temp. | CWUT | IRT | MIP | SEM | Cycle | Temp. | CWUT | IRT | MIP | SEM |
| 0 | Initial state |  |  |  |  | 0 | Initial state |  |  | - | - |
| 1 | 90 °C |  | - | 1 | 200(1) °C |  |  | ||||
| 2 | 100 °C |  | - | 2 | 200(2) °C | - | - | ||||
| 3 | 110 °C |  | - | 3 | 200(3) °C | - | - | ||||
| 4 | 120 °C |  | - | 4 | 200(4) °C | - | - | ||||
| 5 | 130 °C |  |  | 5 | 200(5) °C |  |  | ||||
 : 10 mm × 40 mm × 40 mm;
  : 10 mm × 10 mm × 15 mm. Temp.: assigned temperature; CWUT: capillary water uptake tests; MIP: mercury injection porosimetry; SEM: scanning electron microscopy; IRT: infrared thermography.
| TT | TF | |||||||
|---|---|---|---|---|---|---|---|---|
| 25 °C | 90 °C | 100 °C | 110 °C | 120 °C | 130 °C | 200(1) °C | 200(5) °C | |
| CC | 37.93 | 42.61 | 37.69 | 39.81 | 40.44 | 40.95 | 40.05 | 40.35 |
| FS | 4.34 | 4.84 | 5.09 | 4.73 | 4.68 | 5.18 | 5.86 | 4.75 |
| GA | 1.05 | 0.87 | 0.95 | 0.96 | 0.95 | 0.80 | 1.59 | 1.39 |
| GS | 3.77 | 3.19 | 3.08 | 3.68 | 3.93 | 3.42 | 3.97 | 3.56 |
| TT | TF | |||||||||||
|---|---|---|---|---|---|---|---|---|---|---|---|---|
| 25 °C | 90 °C | 100 °C | 110 °C | 120 °C | 130 °C | 25 °C | 200(1) °C | 200(2) °C | 200(3) °C | 200(4) °C | 200(5) °C | |
| CC | 462 | 451 | 445 | 451 | 428 | 411 | 444 | 466 | 476 | 486 | 477 | 489 |
| 345 | 339 | 356 | 363 | 350 | 335 | 396 | 416 | 416 | 417 | 347 | 330 | |
| FS | 14.8 | 10.1 | 7.6 | 4.3 | 2.8 | 4.3 | 6.7 | 1.6 | 5.1 | 8.6 | 11.1 | 11.4 |
| 21.7 | 13.3 | 15.4 | 16.8 | 15.5 | 14.6 | 6.5 | 7.7 | 6.9 | 6.1 | 5.7 | 6.5 | |
| GA | 2.2 | 2.1 | 2.2 | 2.7 | 3.5 | 3.7 | 4.8 | 5.0 | 5.0 | 5.4 | 5.3 | 5.6 |
| 5.5 | 4.2 | 5.2 | 4.8 | 4.7 | 4.8 | 5.0 | 4.9 | 5.2 | 5.3 | 5.2 | 4.9 | |
| GS | 21.9 | 20.0 | 23.3 | 22.5 | 23.4 | 24.7 | 20.2 | 20.8 | 21.1 | 19.0 | 22.5 | 22.8 |
| 19.1 | 19.9 | 21.0 | 21.6 | 22.2 | 22.6 | 23.5 | 25.2 | 24.6 | 26.1 | 26.3 | 26.6 | |
| TT | TF | ||||||||
|---|---|---|---|---|---|---|---|---|---|
| 25 °C | 90 °C | 100 °C | 110 °C | 120 °C | 130 °C | 25 °C | 200(1) °C | 200(5) °C | |
| CC (CRI5) | 0.26 | 0.26 | 0.42 | 0.29 | 0.53 | 0.51 | - | 0.11 | 0.72 |
| FS (CRI10) | 0.43 | 0.62 | 0.57 | 0.59 | 0.75 | 0.86 | - | 0.48 | 0.71 |
| GA (CRI10) | 0.31 | 0.05 | 0.49 | 0.63 | 0.71 | 0.6 | 0.67 | 0.78 | 0.89 |
| GS (CRI10) | 0.90 | 0.56 | 0.71 | 0.7 | 0.71 | 0.64 | 0.77 | 0.83 | 0.68 |
Publisher’s Note: MDPI stays neutral with regard to jurisdictional claims in published maps and institutional affiliations. |
© 2021 by the authors. Licensee MDPI, Basel, Switzerland. This article is an open access article distributed under the terms and conditions of the Creative Commons Attribution (CC BY) license (http://creativecommons.org/licenses/by/4.0/).
Share and Cite
Junique, T.; Vazquez, P.; Thomachot-Schneider, C.; Hassoun, I.; Jean-Baptiste, M.; Géraud, Y. The Use of Infrared Thermography on the Measurement of Microstructural Changes of Reservoir Rocks Induced by Temperature. Appl. Sci. 2021, 11, 559. https://0-doi-org.brum.beds.ac.uk/10.3390/app11020559
Junique T, Vazquez P, Thomachot-Schneider C, Hassoun I, Jean-Baptiste M, Géraud Y. The Use of Infrared Thermography on the Measurement of Microstructural Changes of Reservoir Rocks Induced by Temperature. Applied Sciences. 2021; 11(2):559. https://0-doi-org.brum.beds.ac.uk/10.3390/app11020559
Chicago/Turabian StyleJunique, Thomas, Patricia Vazquez, Céline Thomachot-Schneider, Issra Hassoun, Mirlène Jean-Baptiste, and Yves Géraud. 2021. "The Use of Infrared Thermography on the Measurement of Microstructural Changes of Reservoir Rocks Induced by Temperature" Applied Sciences 11, no. 2: 559. https://0-doi-org.brum.beds.ac.uk/10.3390/app11020559