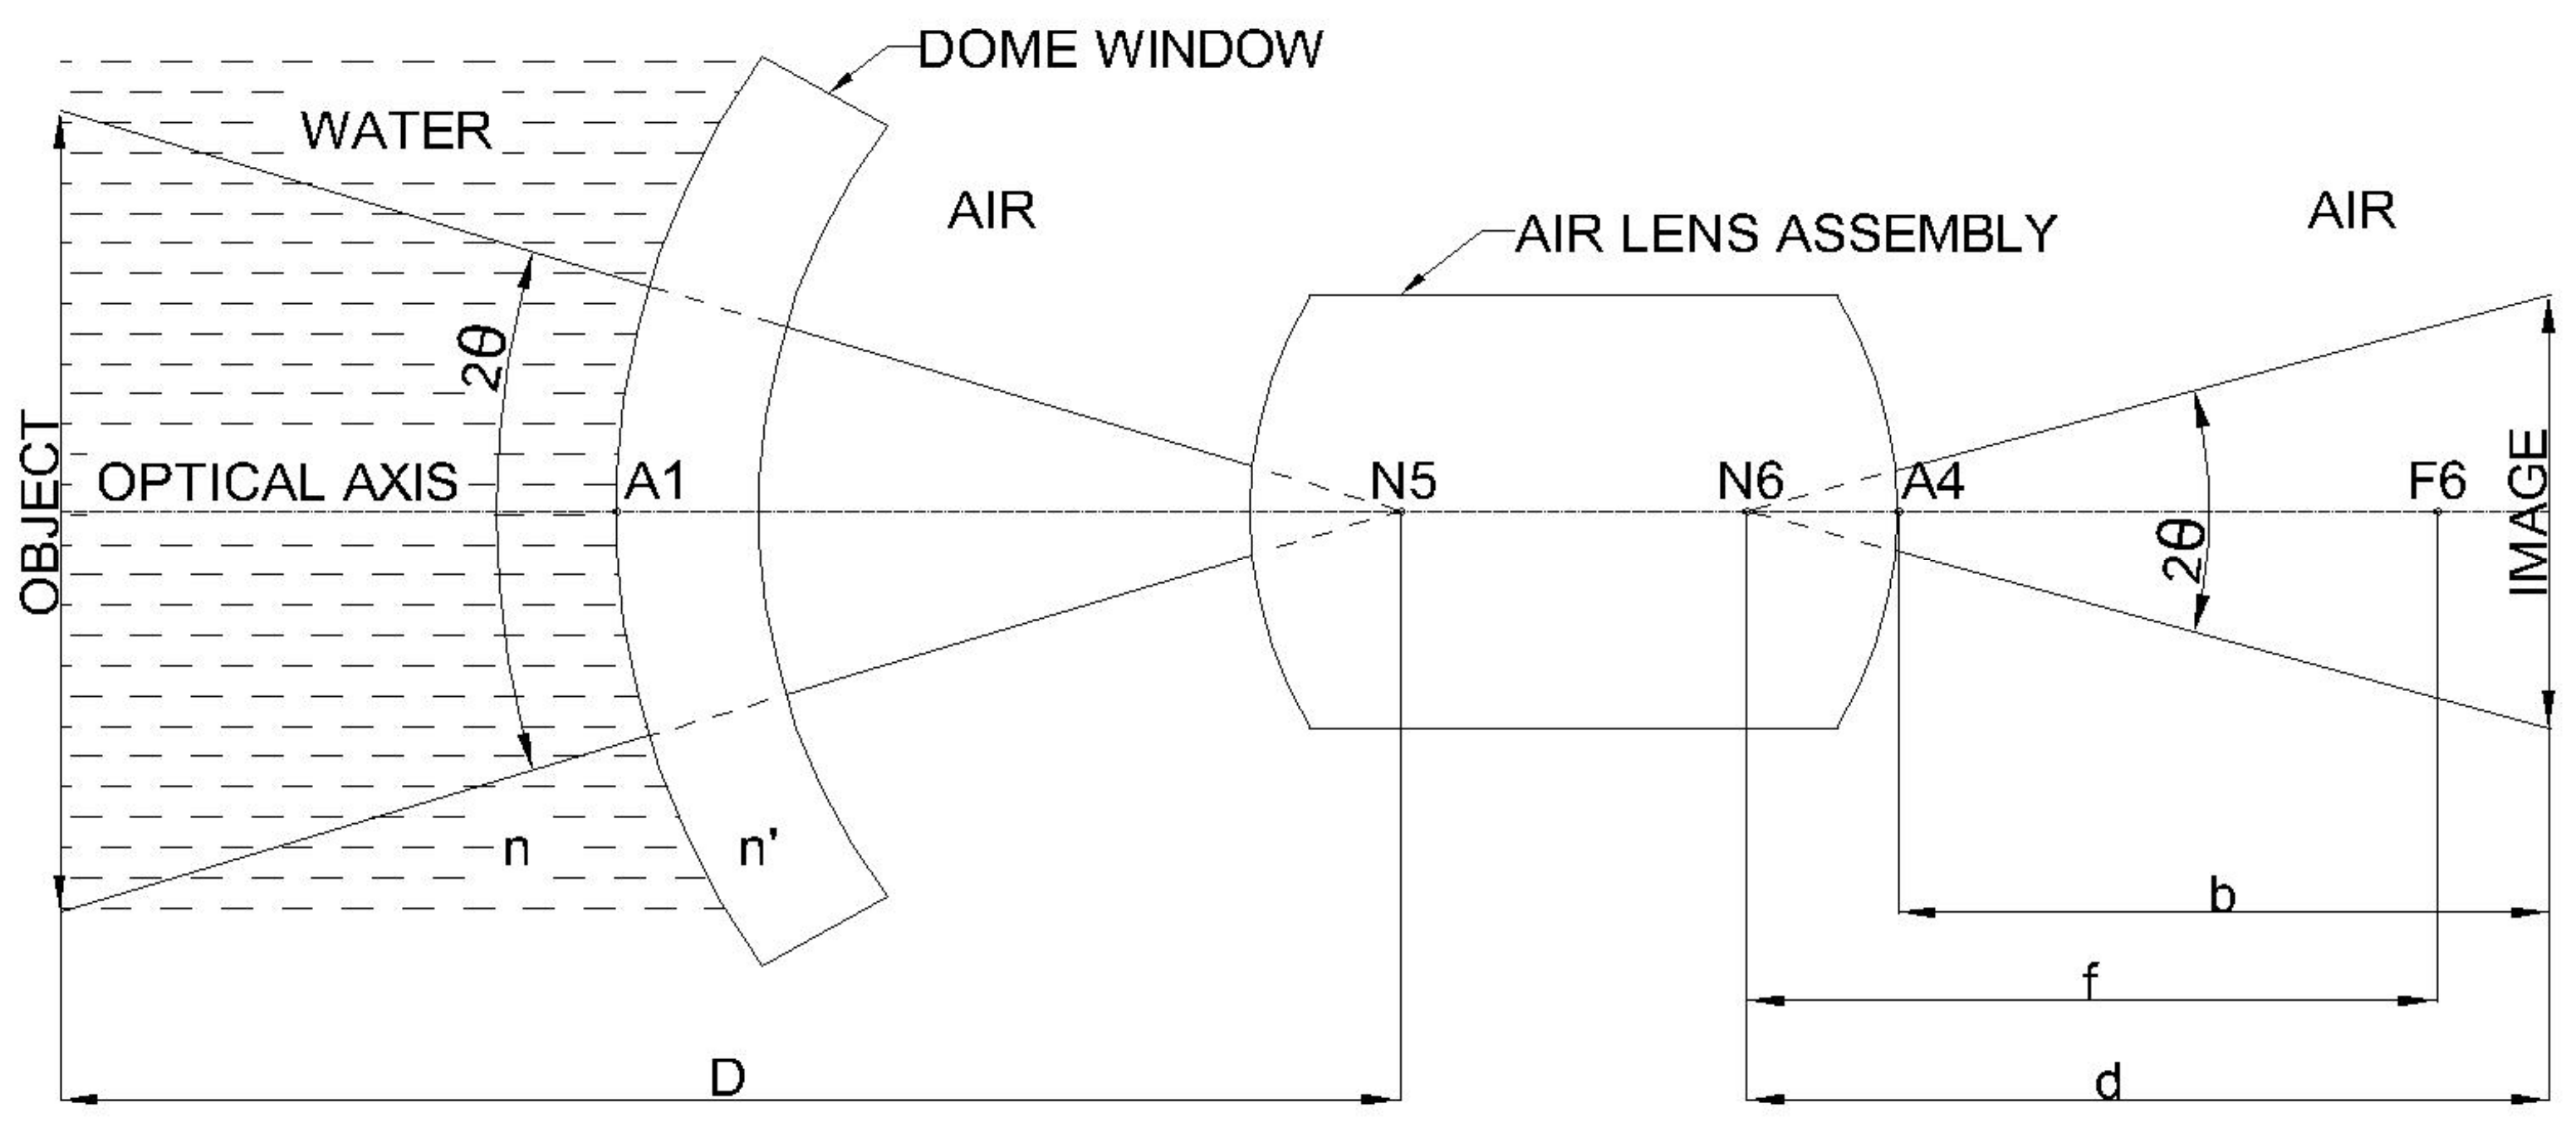
Figure 1.
Underwater camera [
1]: Photo from 1. Gomer T. McNeil,
Metrical Fundamentals of Underwater Lens System, Optical Engineering, vol. 16, no. 2, pp. 128–139 (1977).
Figure 1.
Underwater camera [
1]: Photo from 1. Gomer T. McNeil,
Metrical Fundamentals of Underwater Lens System, Optical Engineering, vol. 16, no. 2, pp. 128–139 (1977).
Figure 2.
General visible spectrum. The wavelength of visible light ranges from 380.00 to 760.00 nm. Violet, indigo, blue, green, yellow, orange, and red light have wavelengths from short to long.
Figure 2.
General visible spectrum. The wavelength of visible light ranges from 380.00 to 760.00 nm. Violet, indigo, blue, green, yellow, orange, and red light have wavelengths from short to long.
Figure 3.
Spectrum of the horizontal axis which is around the water depth from 0 to 20 m, and the vertical axis is light intensity (%). Blue and green lights attenuate the slowest and second slowest in intensity; red light attenuates the fastest. This diagram is from reference [
10].
Figure 3.
Spectrum of the horizontal axis which is around the water depth from 0 to 20 m, and the vertical axis is light intensity (%). Blue and green lights attenuate the slowest and second slowest in intensity; red light attenuates the fastest. This diagram is from reference [
10].
Figure 4.
Penetration of light at different wavelengths [
11]. In Lake Superior, the penetration depth of red light is less than 50 m, whereas that of blue and green lights exceeds 100 m.
Figure 4.
Penetration of light at different wavelengths [
11]. In Lake Superior, the penetration depth of red light is less than 50 m, whereas that of blue and green lights exceeds 100 m.
Figure 5.
(a) Positive and (b) negative distortion.
Figure 5.
(a) Positive and (b) negative distortion.
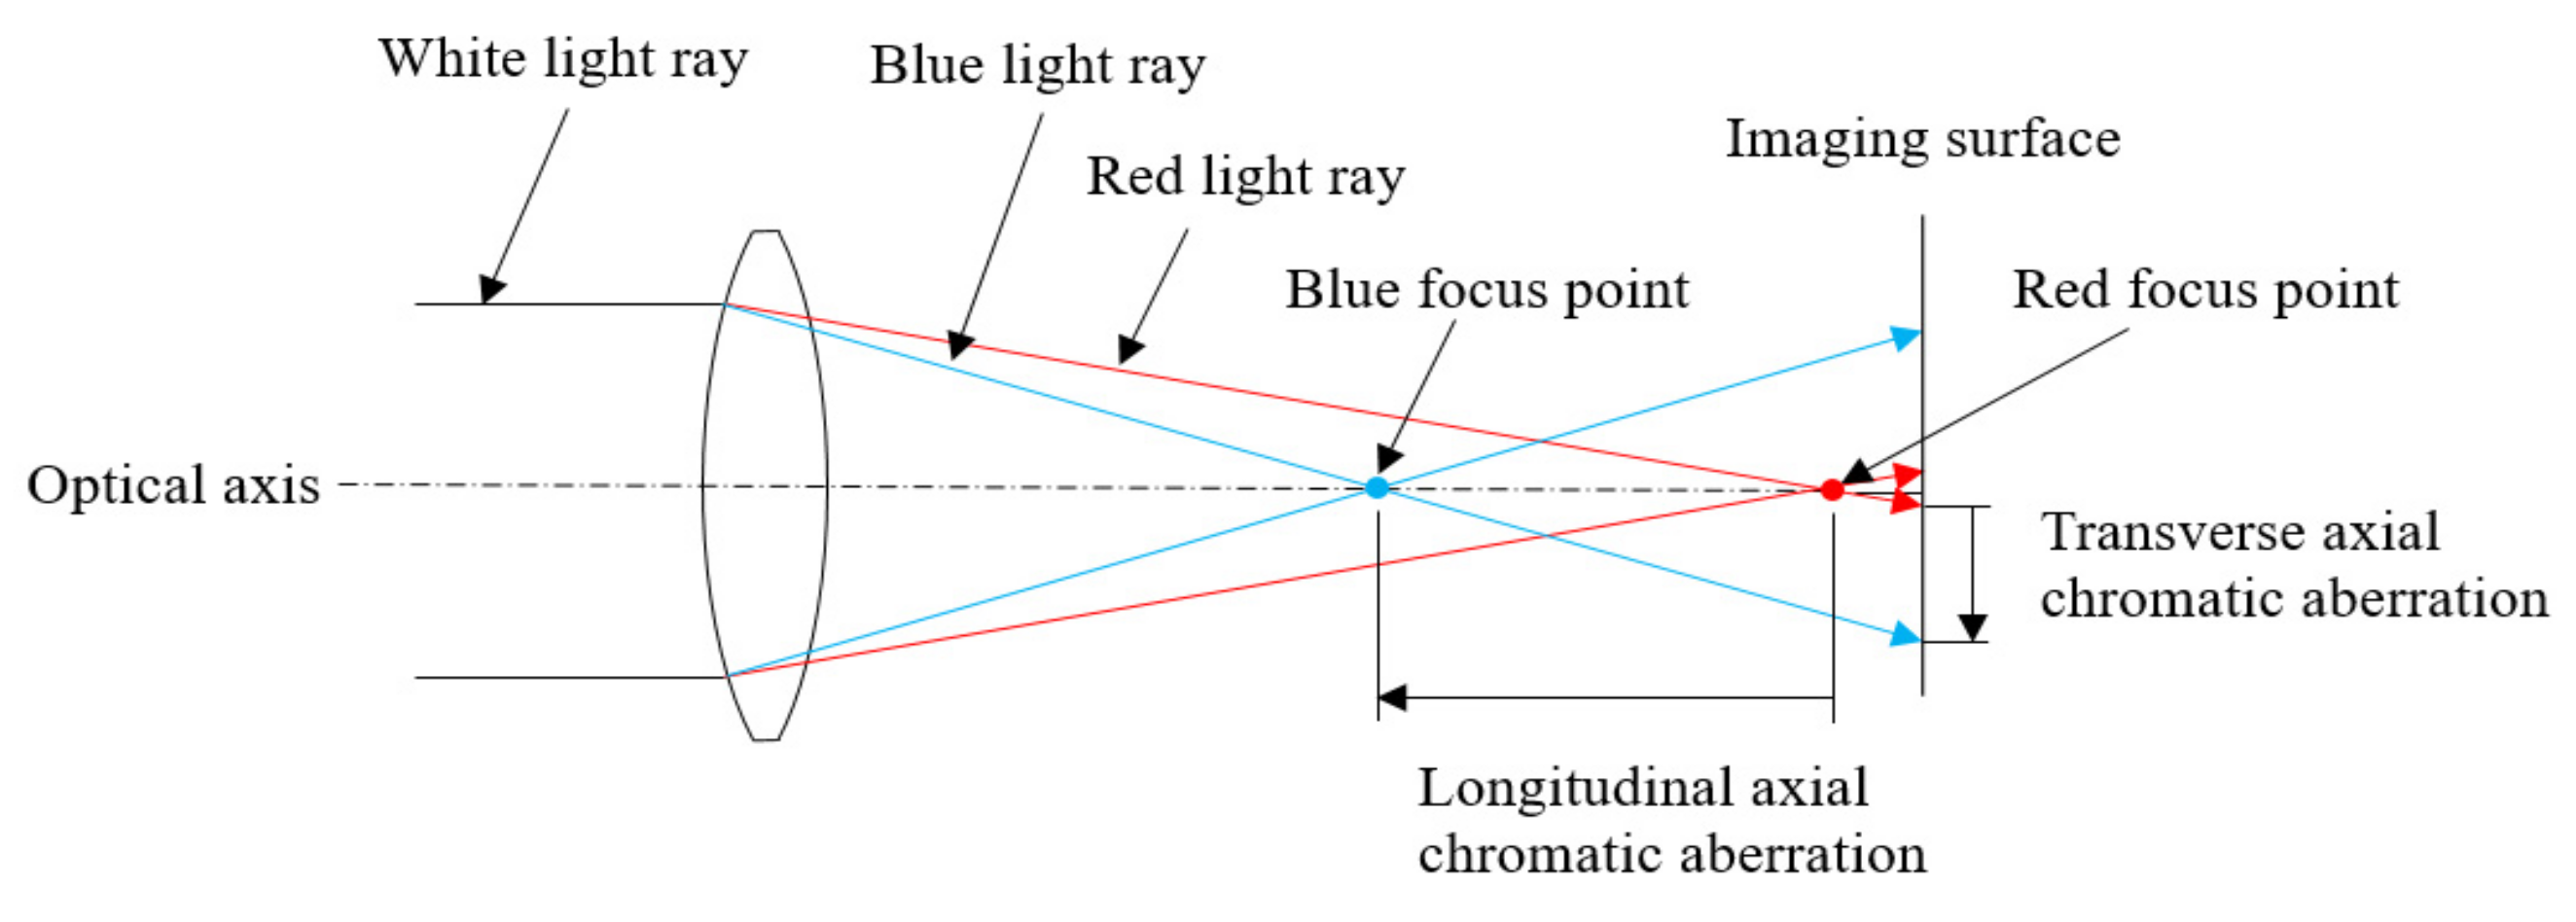
Figure 6.
Axial chromatic aberration. Such chromatic aberration typically affects the displacement of the focus points of different colored light in different spectra and enables underwater cameras to produce absolute images.
Figure 6.
Axial chromatic aberration. Such chromatic aberration typically affects the displacement of the focus points of different colored light in different spectra and enables underwater cameras to produce absolute images.
Figure 7.
Lateral chromatic aberration. Such chromatic aberration typically occurs at the edges of images and is commonly used with a haze to produce an effect similar to flare. Although nonconsequential in this study, the selection of glass using the genetic algorithm increases image quality and reduces flare.
Figure 8.
(a) Polaris, (b) cabin configuration, and (c) data-processing center.
Figure 8.
(a) Polaris, (b) cabin configuration, and (c) data-processing center.
Figure 9.
Optical system with the object at infinity.
Figure 9.
Optical system with the object at infinity.
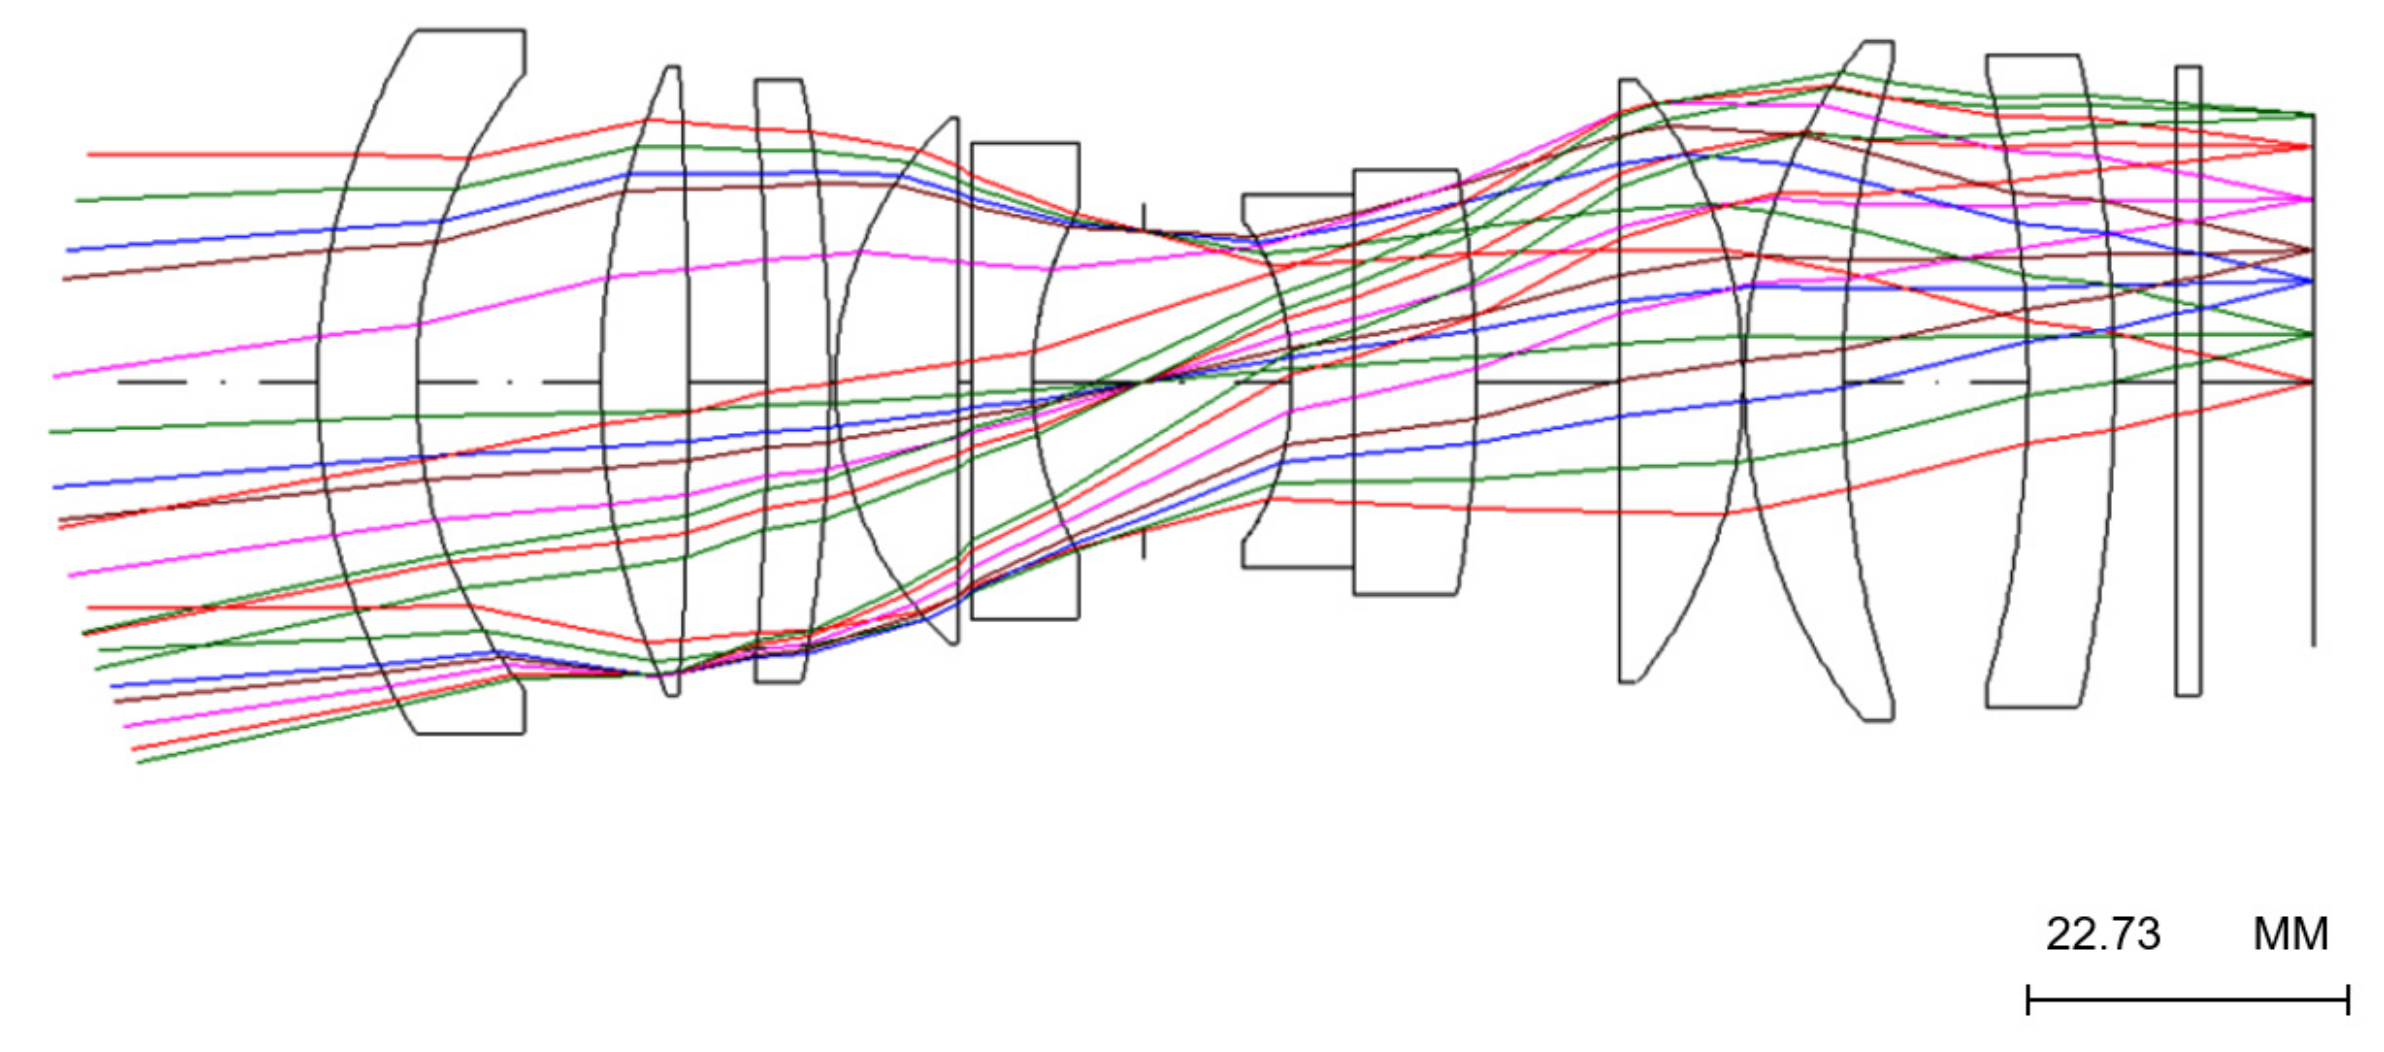
Figure 10.
Optical design layout of the underwater lenses.
Figure 10.
Optical design layout of the underwater lenses.
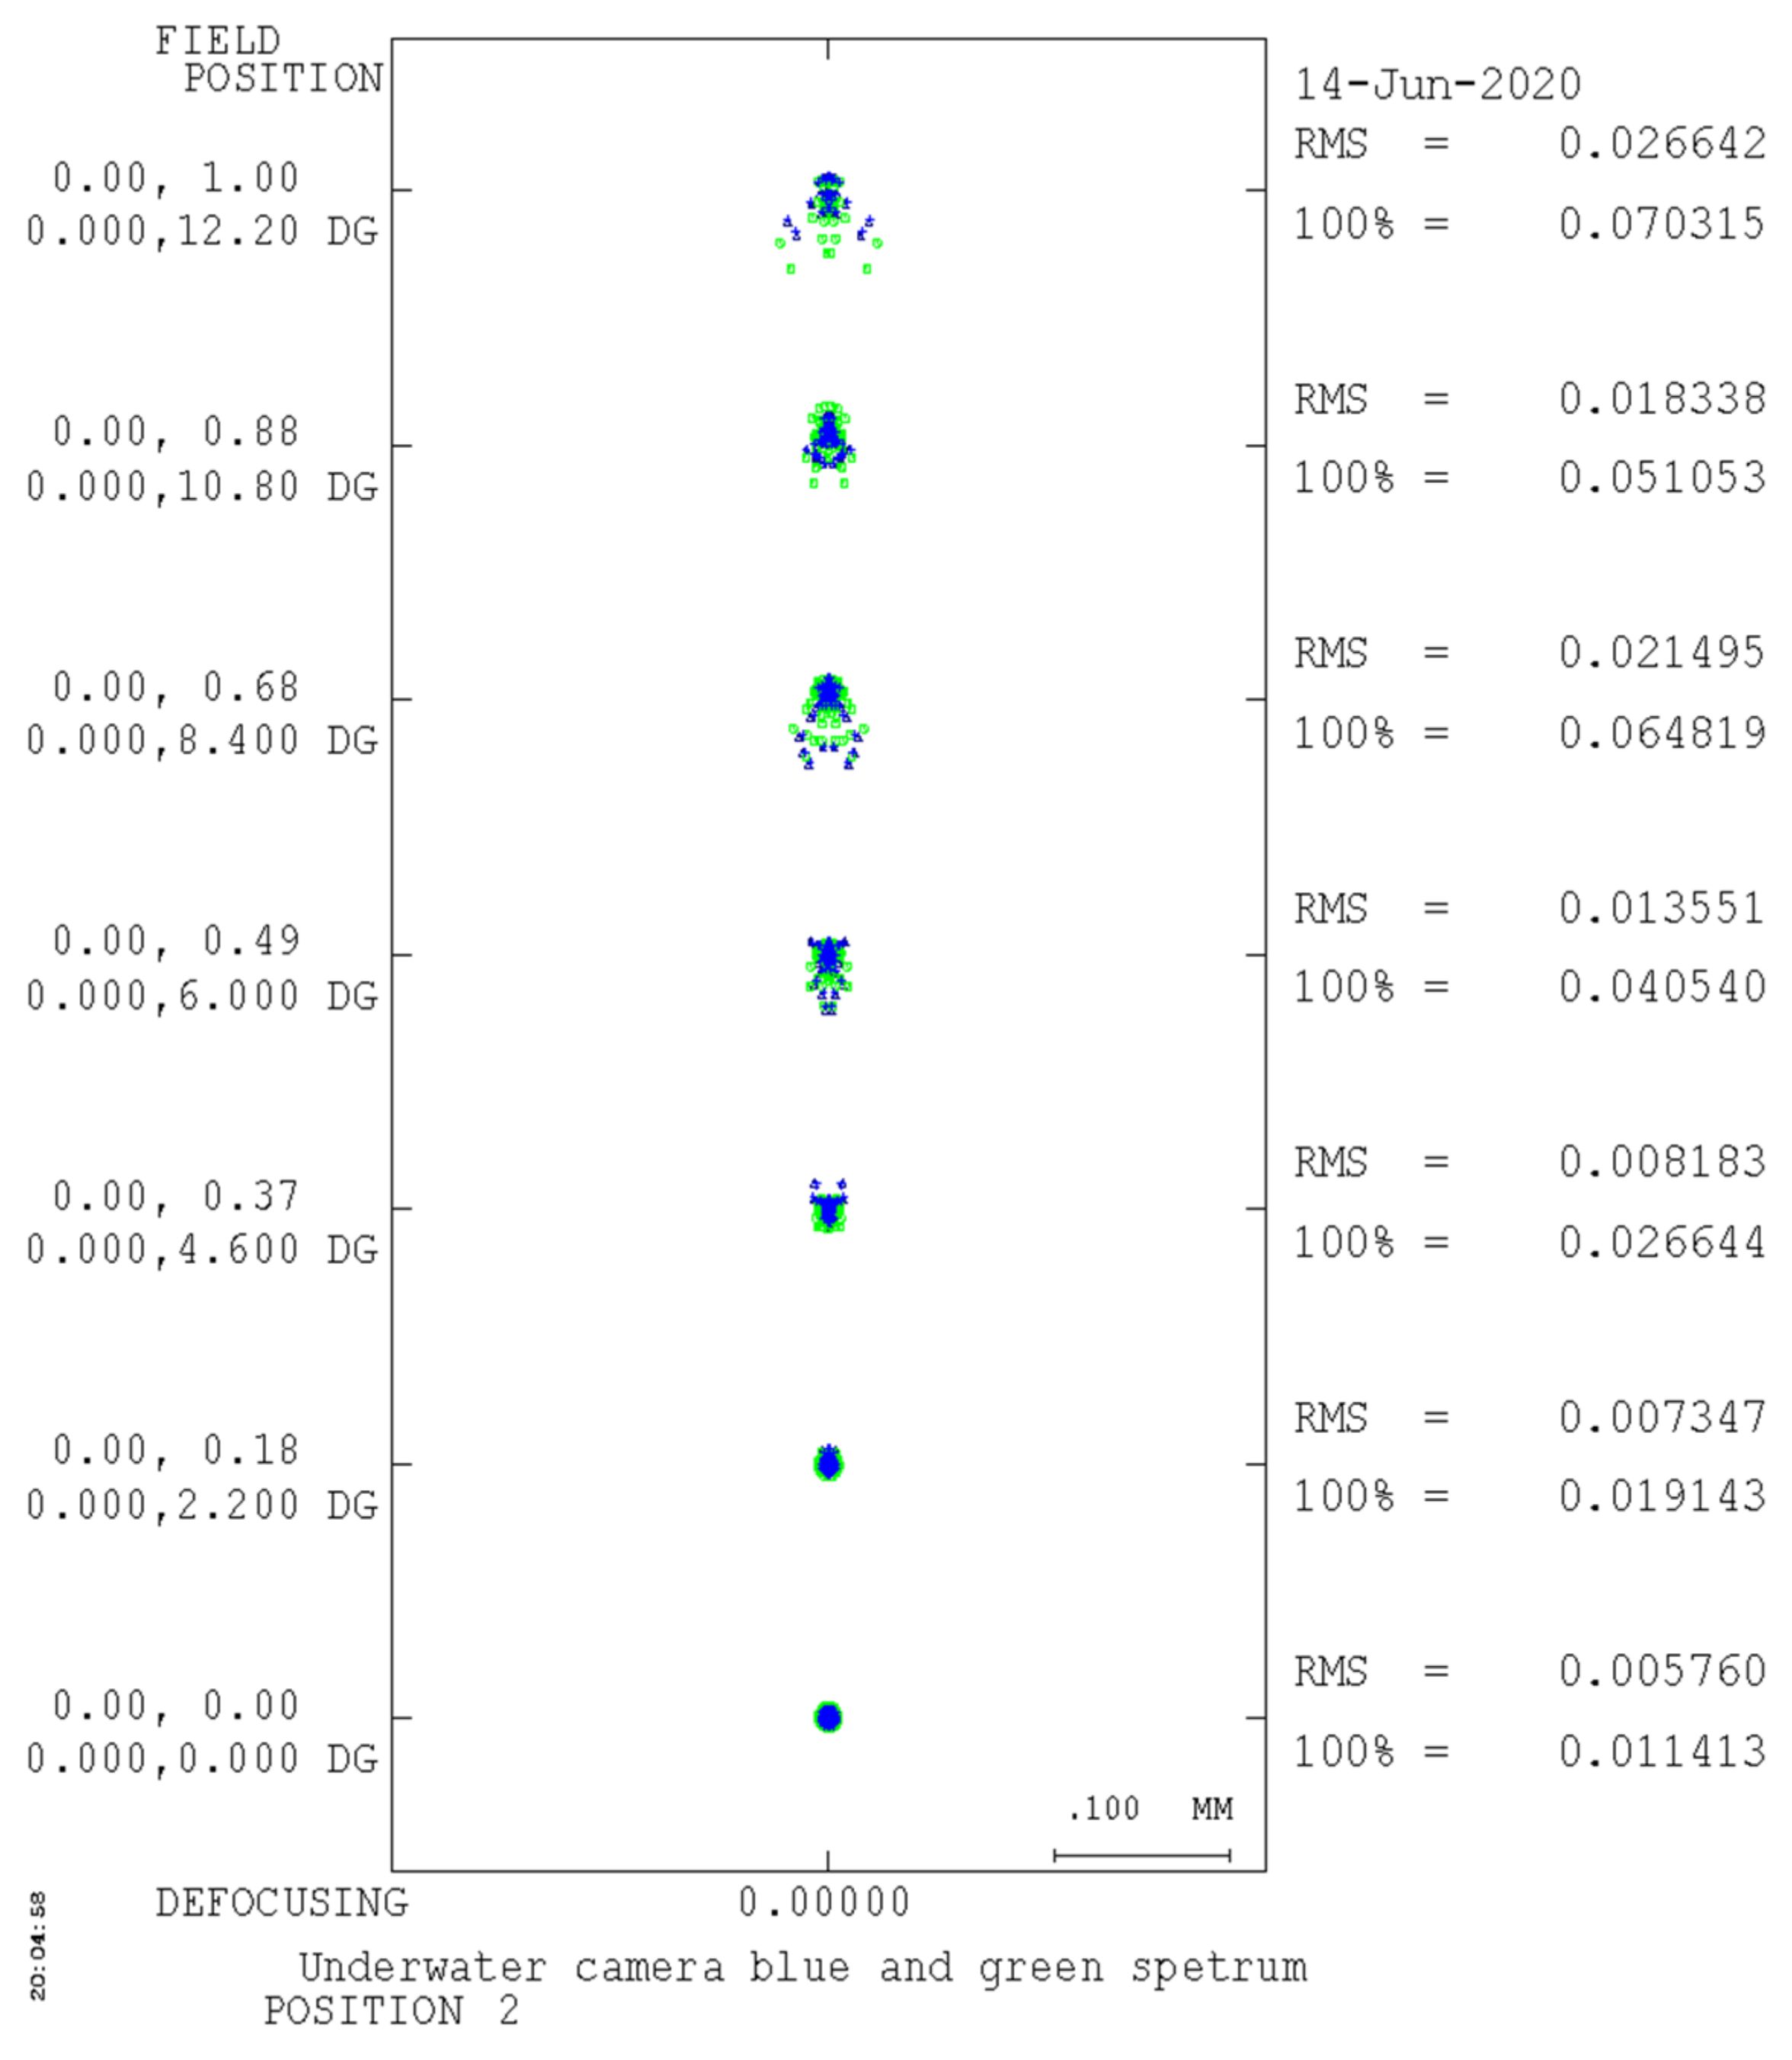
Figure 11.
Spot size diagram with an infinite object distance (generated by CODE V).
Figure 11.
Spot size diagram with an infinite object distance (generated by CODE V).
Figure 12.
Spot size diagram with a 10 m object distance (generated by CODE V).
Figure 12.
Spot size diagram with a 10 m object distance (generated by CODE V).
Figure 13.
Spot size diagram with a 5 m object distance (generated by CODE V).
Figure 13.
Spot size diagram with a 5 m object distance (generated by CODE V).
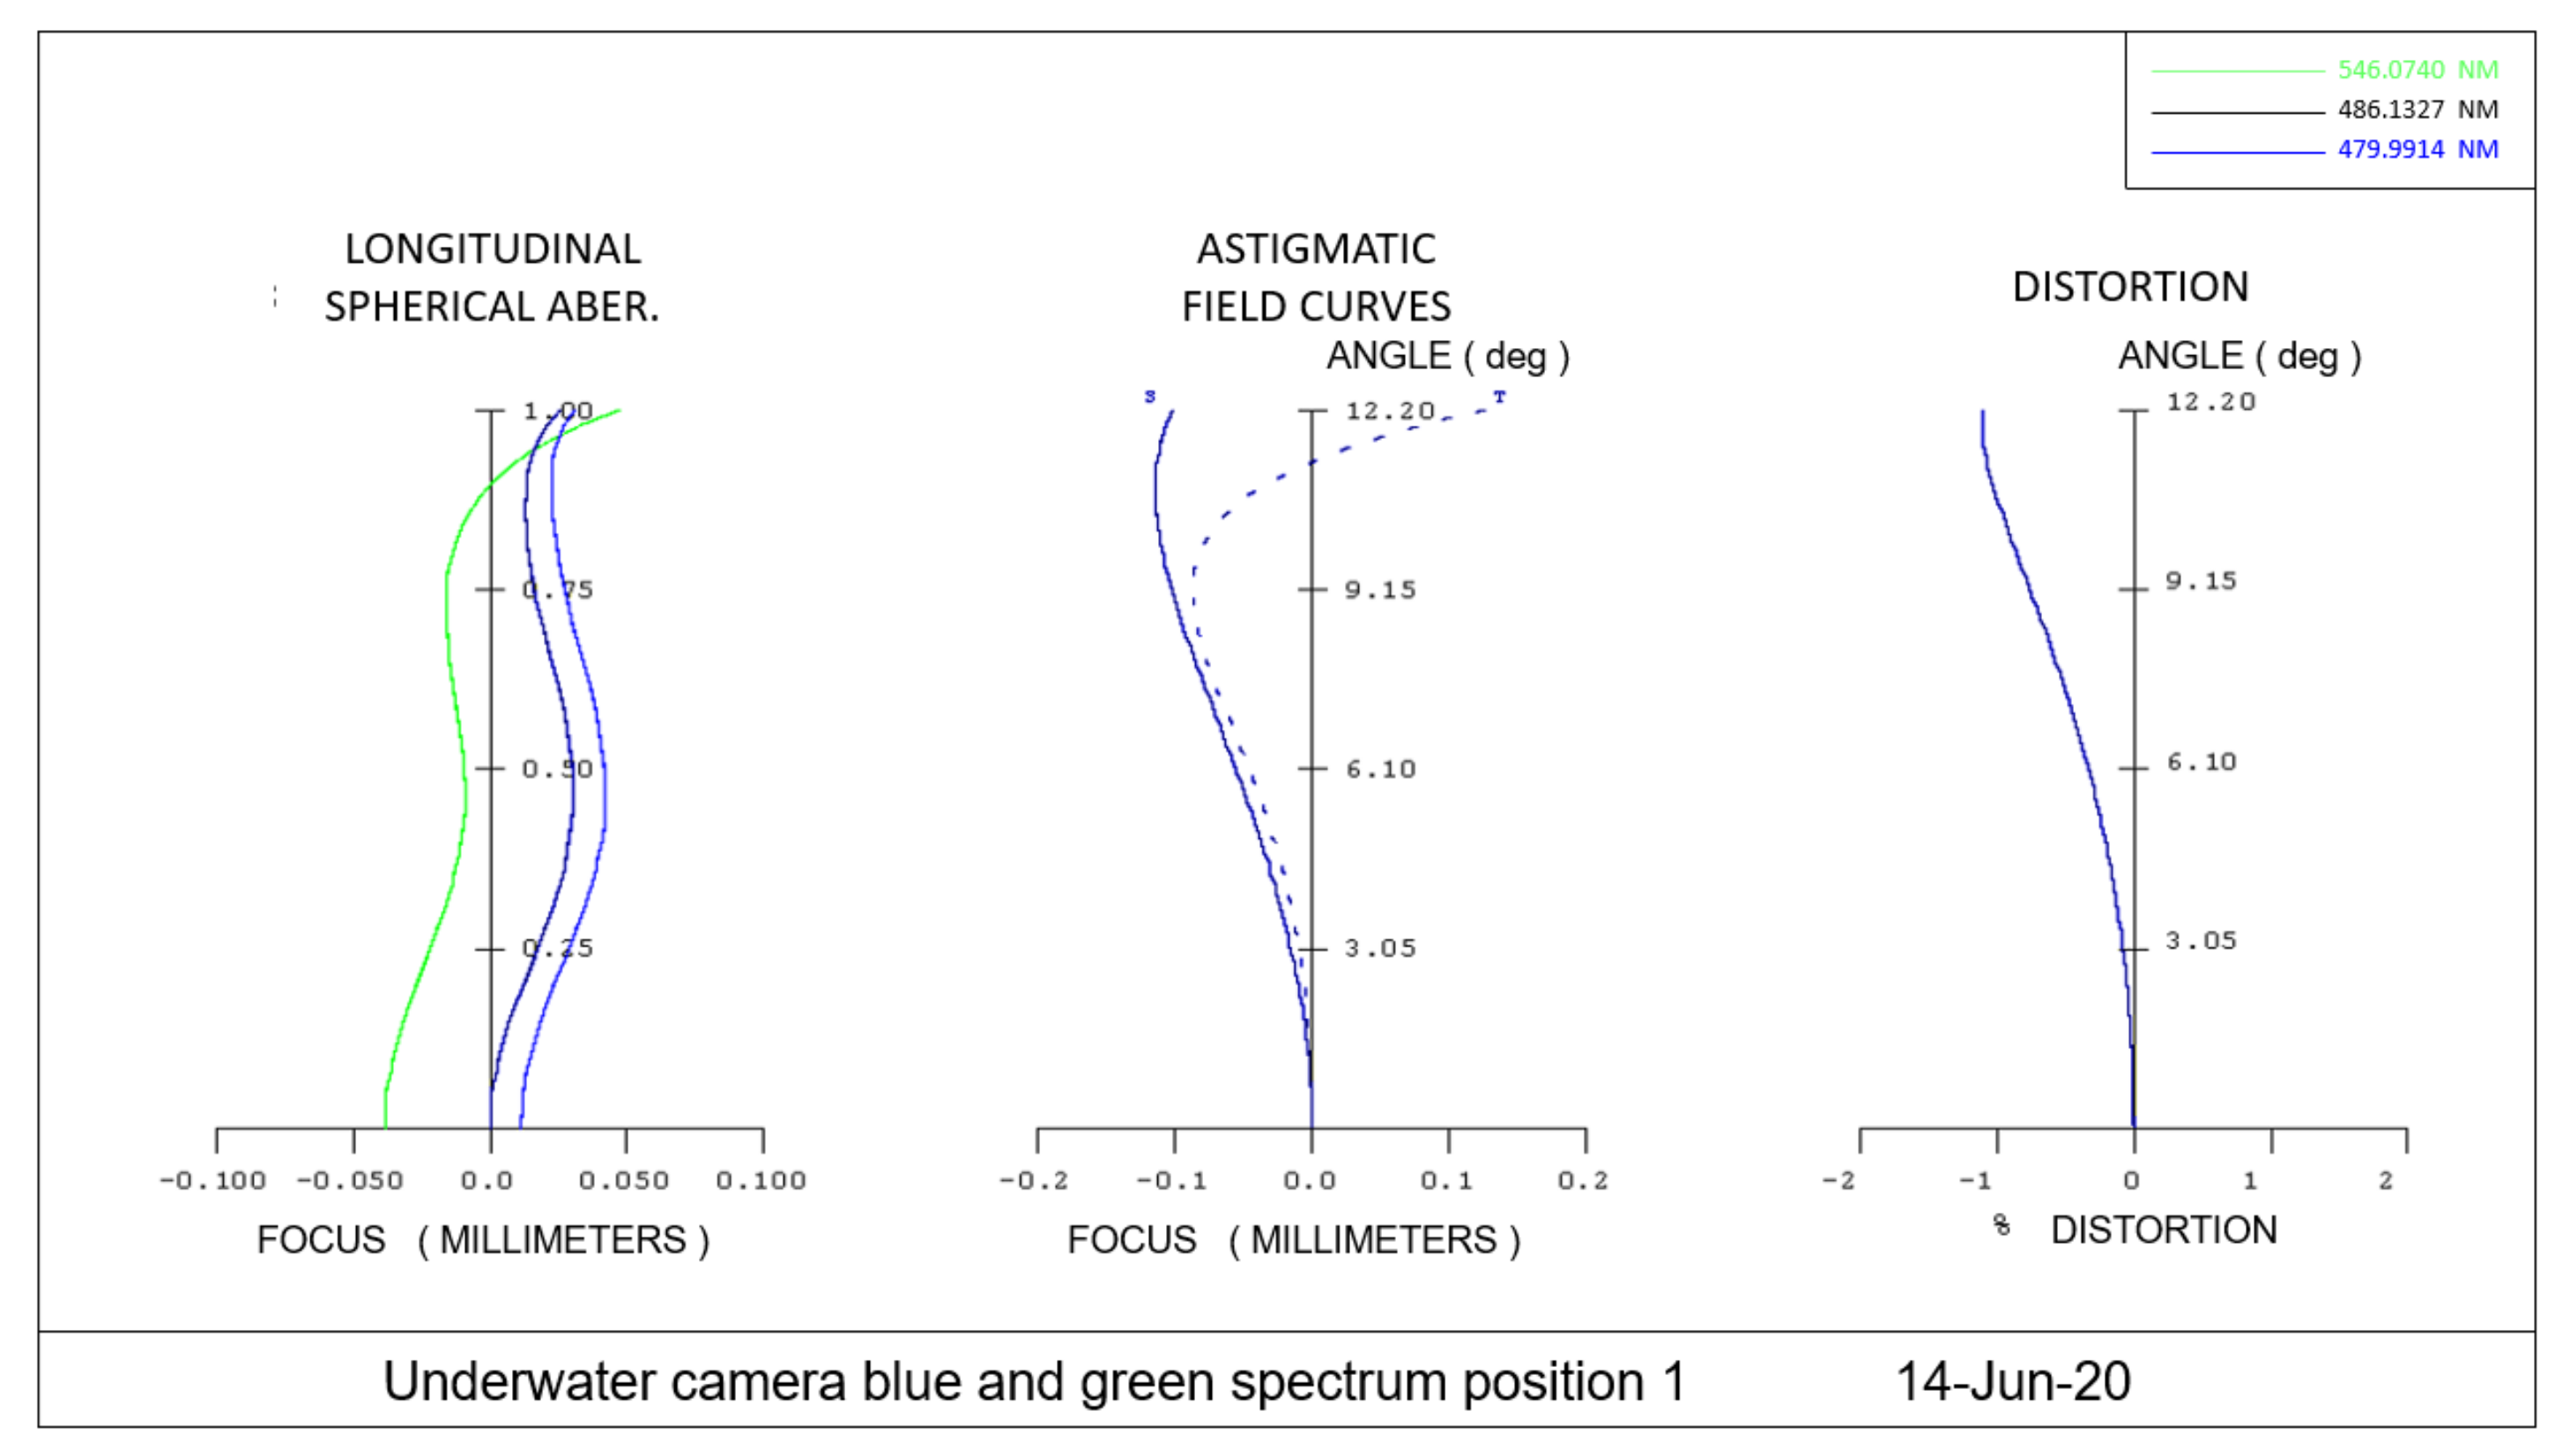
Figure 14.
Optical aberration diagram with an infinite object distance ((left), axial chromatic aberration; (middle), astigmatic (blue line) field curvature (blue dot line); and (right), distortion).
Figure 14.
Optical aberration diagram with an infinite object distance ((left), axial chromatic aberration; (middle), astigmatic (blue line) field curvature (blue dot line); and (right), distortion).
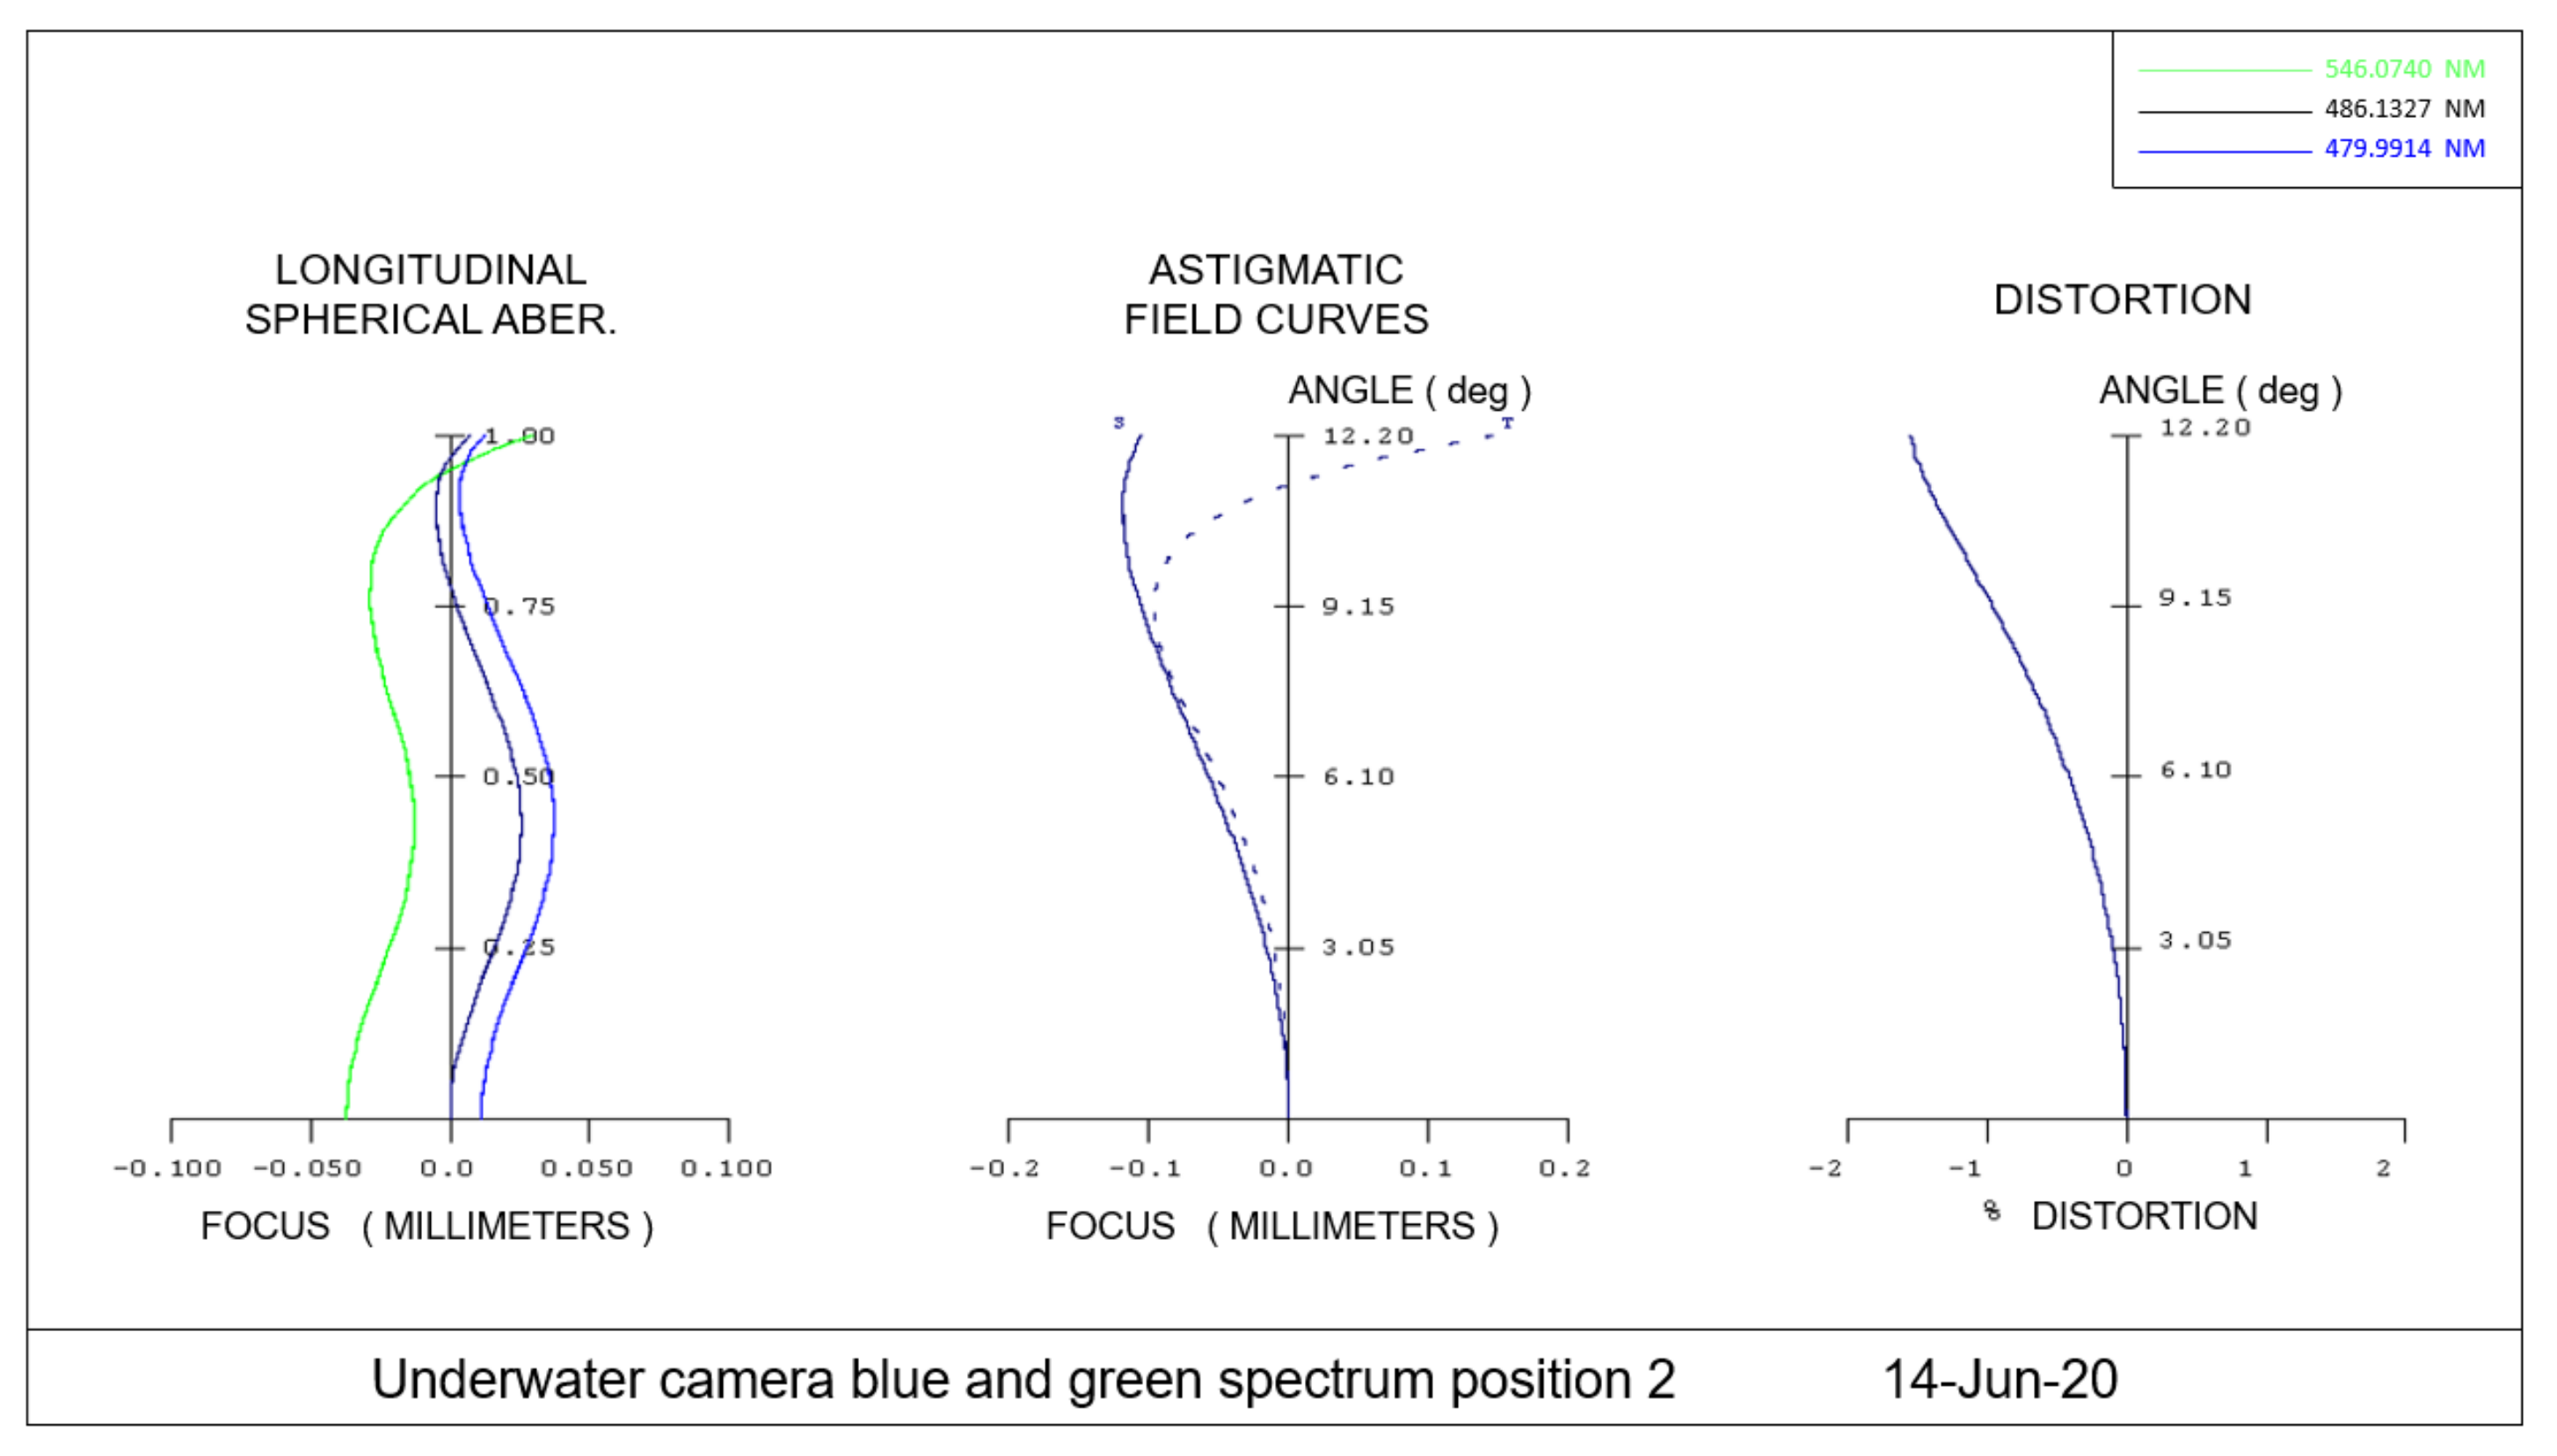
Figure 15.
Optical aberration diagram with a 10 m object distance ((left), axial chromatic aberration; (middle), astigmatic (blue line) field curvature (blue dot line); and (right), distortion).
Figure 15.
Optical aberration diagram with a 10 m object distance ((left), axial chromatic aberration; (middle), astigmatic (blue line) field curvature (blue dot line); and (right), distortion).
Figure 16.
Optical aberration diagram with a 5 m object distance ((left), axial chromatic aberration; (middle), astigmatic field (blue line) curvature (blue dot line); and (right), distortion).
Figure 16.
Optical aberration diagram with a 5 m object distance ((left), axial chromatic aberration; (middle), astigmatic field (blue line) curvature (blue dot line); and (right), distortion).
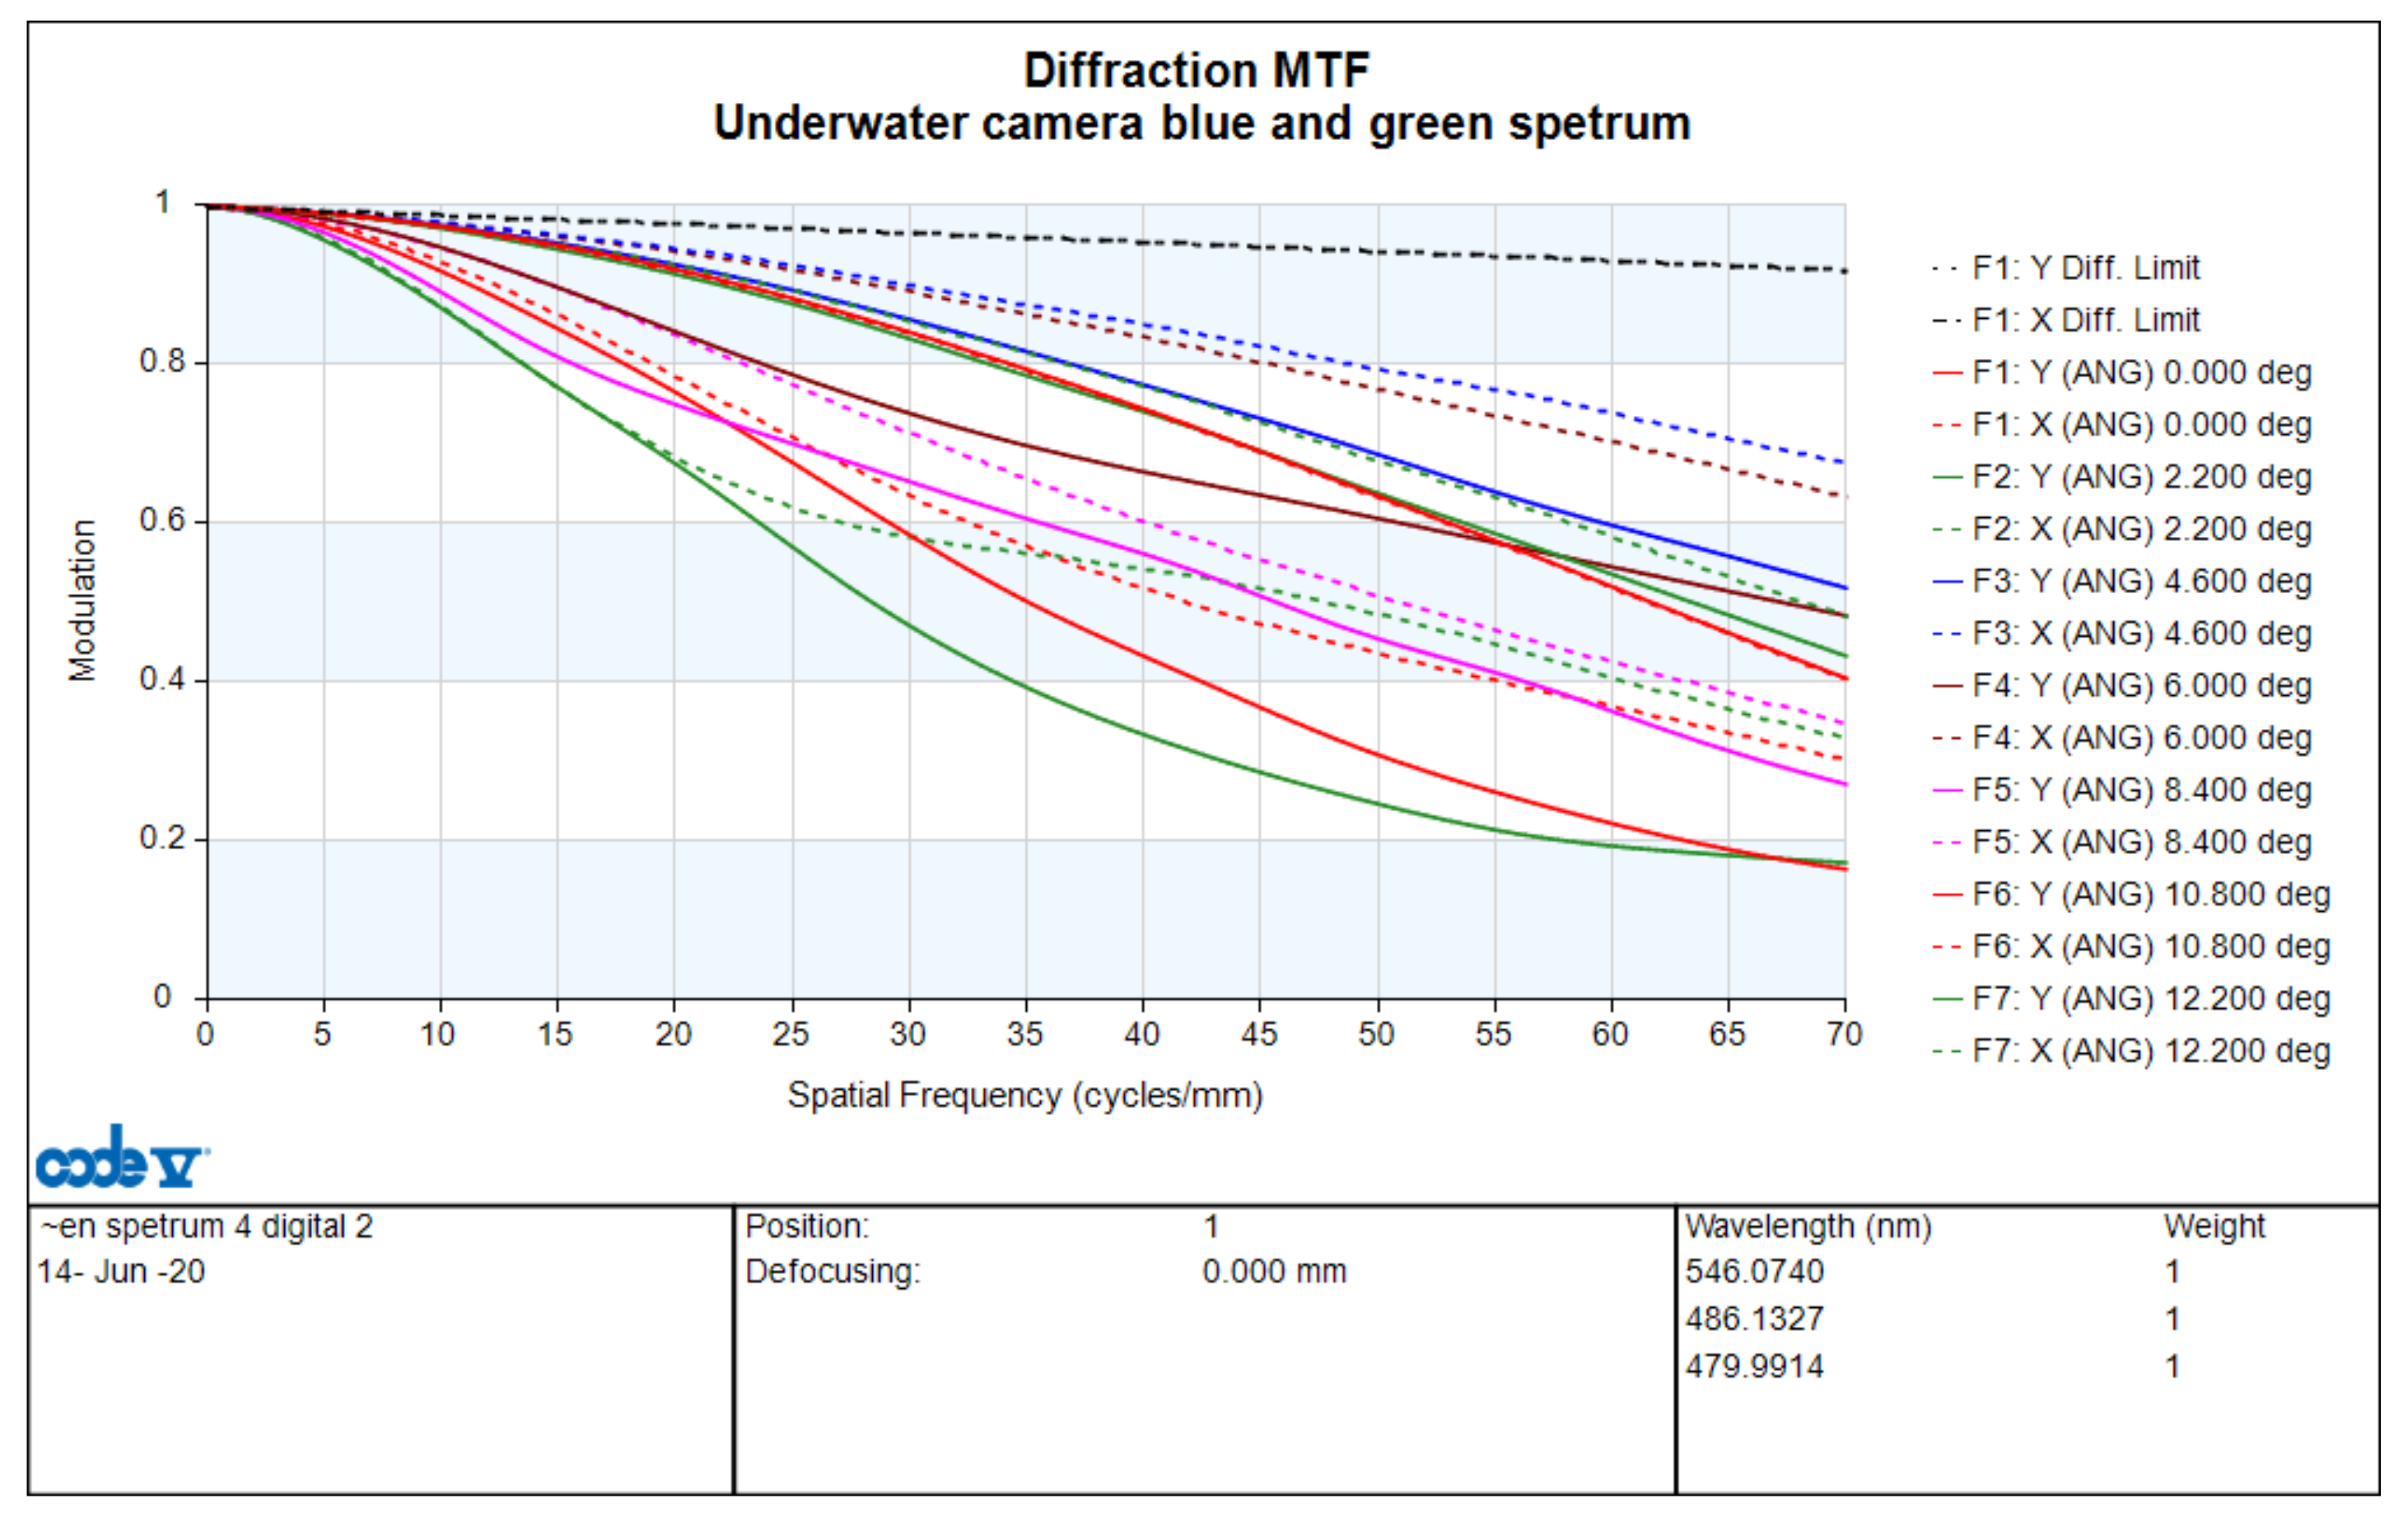
Figure 17.
MTF curves with an infinite object distance.
Figure 17.
MTF curves with an infinite object distance.
Figure 18.
MTF curves with a 10 m object distance.
Figure 18.
MTF curves with a 10 m object distance.
Figure 19.
MTF curves with a 5 m object distance.
Figure 19.
MTF curves with a 5 m object distance.
Figure 20.
Two-dimensional simulation with an infinite object distance.
Figure 20.
Two-dimensional simulation with an infinite object distance.
Figure 21.
Two-dimensional simulation with a 10 m object distance.
Figure 21.
Two-dimensional simulation with a 10 m object distance.
Figure 22.
Two-dimensional simulation with a 5 m object distance.
Figure 22.
Two-dimensional simulation with a 5 m object distance.
Figure 23.
Flowchart of the genetic algorithm calculation.
Figure 23.
Flowchart of the genetic algorithm calculation.
Figure 24.
Optical layout of underwater optical zoom optics. From top to bottom, the focal length is 5 mm, 10 mm, and 15 mm. This zoom design is characterized with only one element for zoom function, which significantly simplifies opto-mechanical system design for underwater image systems.
Figure 24.
Optical layout of underwater optical zoom optics. From top to bottom, the focal length is 5 mm, 10 mm, and 15 mm. This zoom design is characterized with only one element for zoom function, which significantly simplifies opto-mechanical system design for underwater image systems.
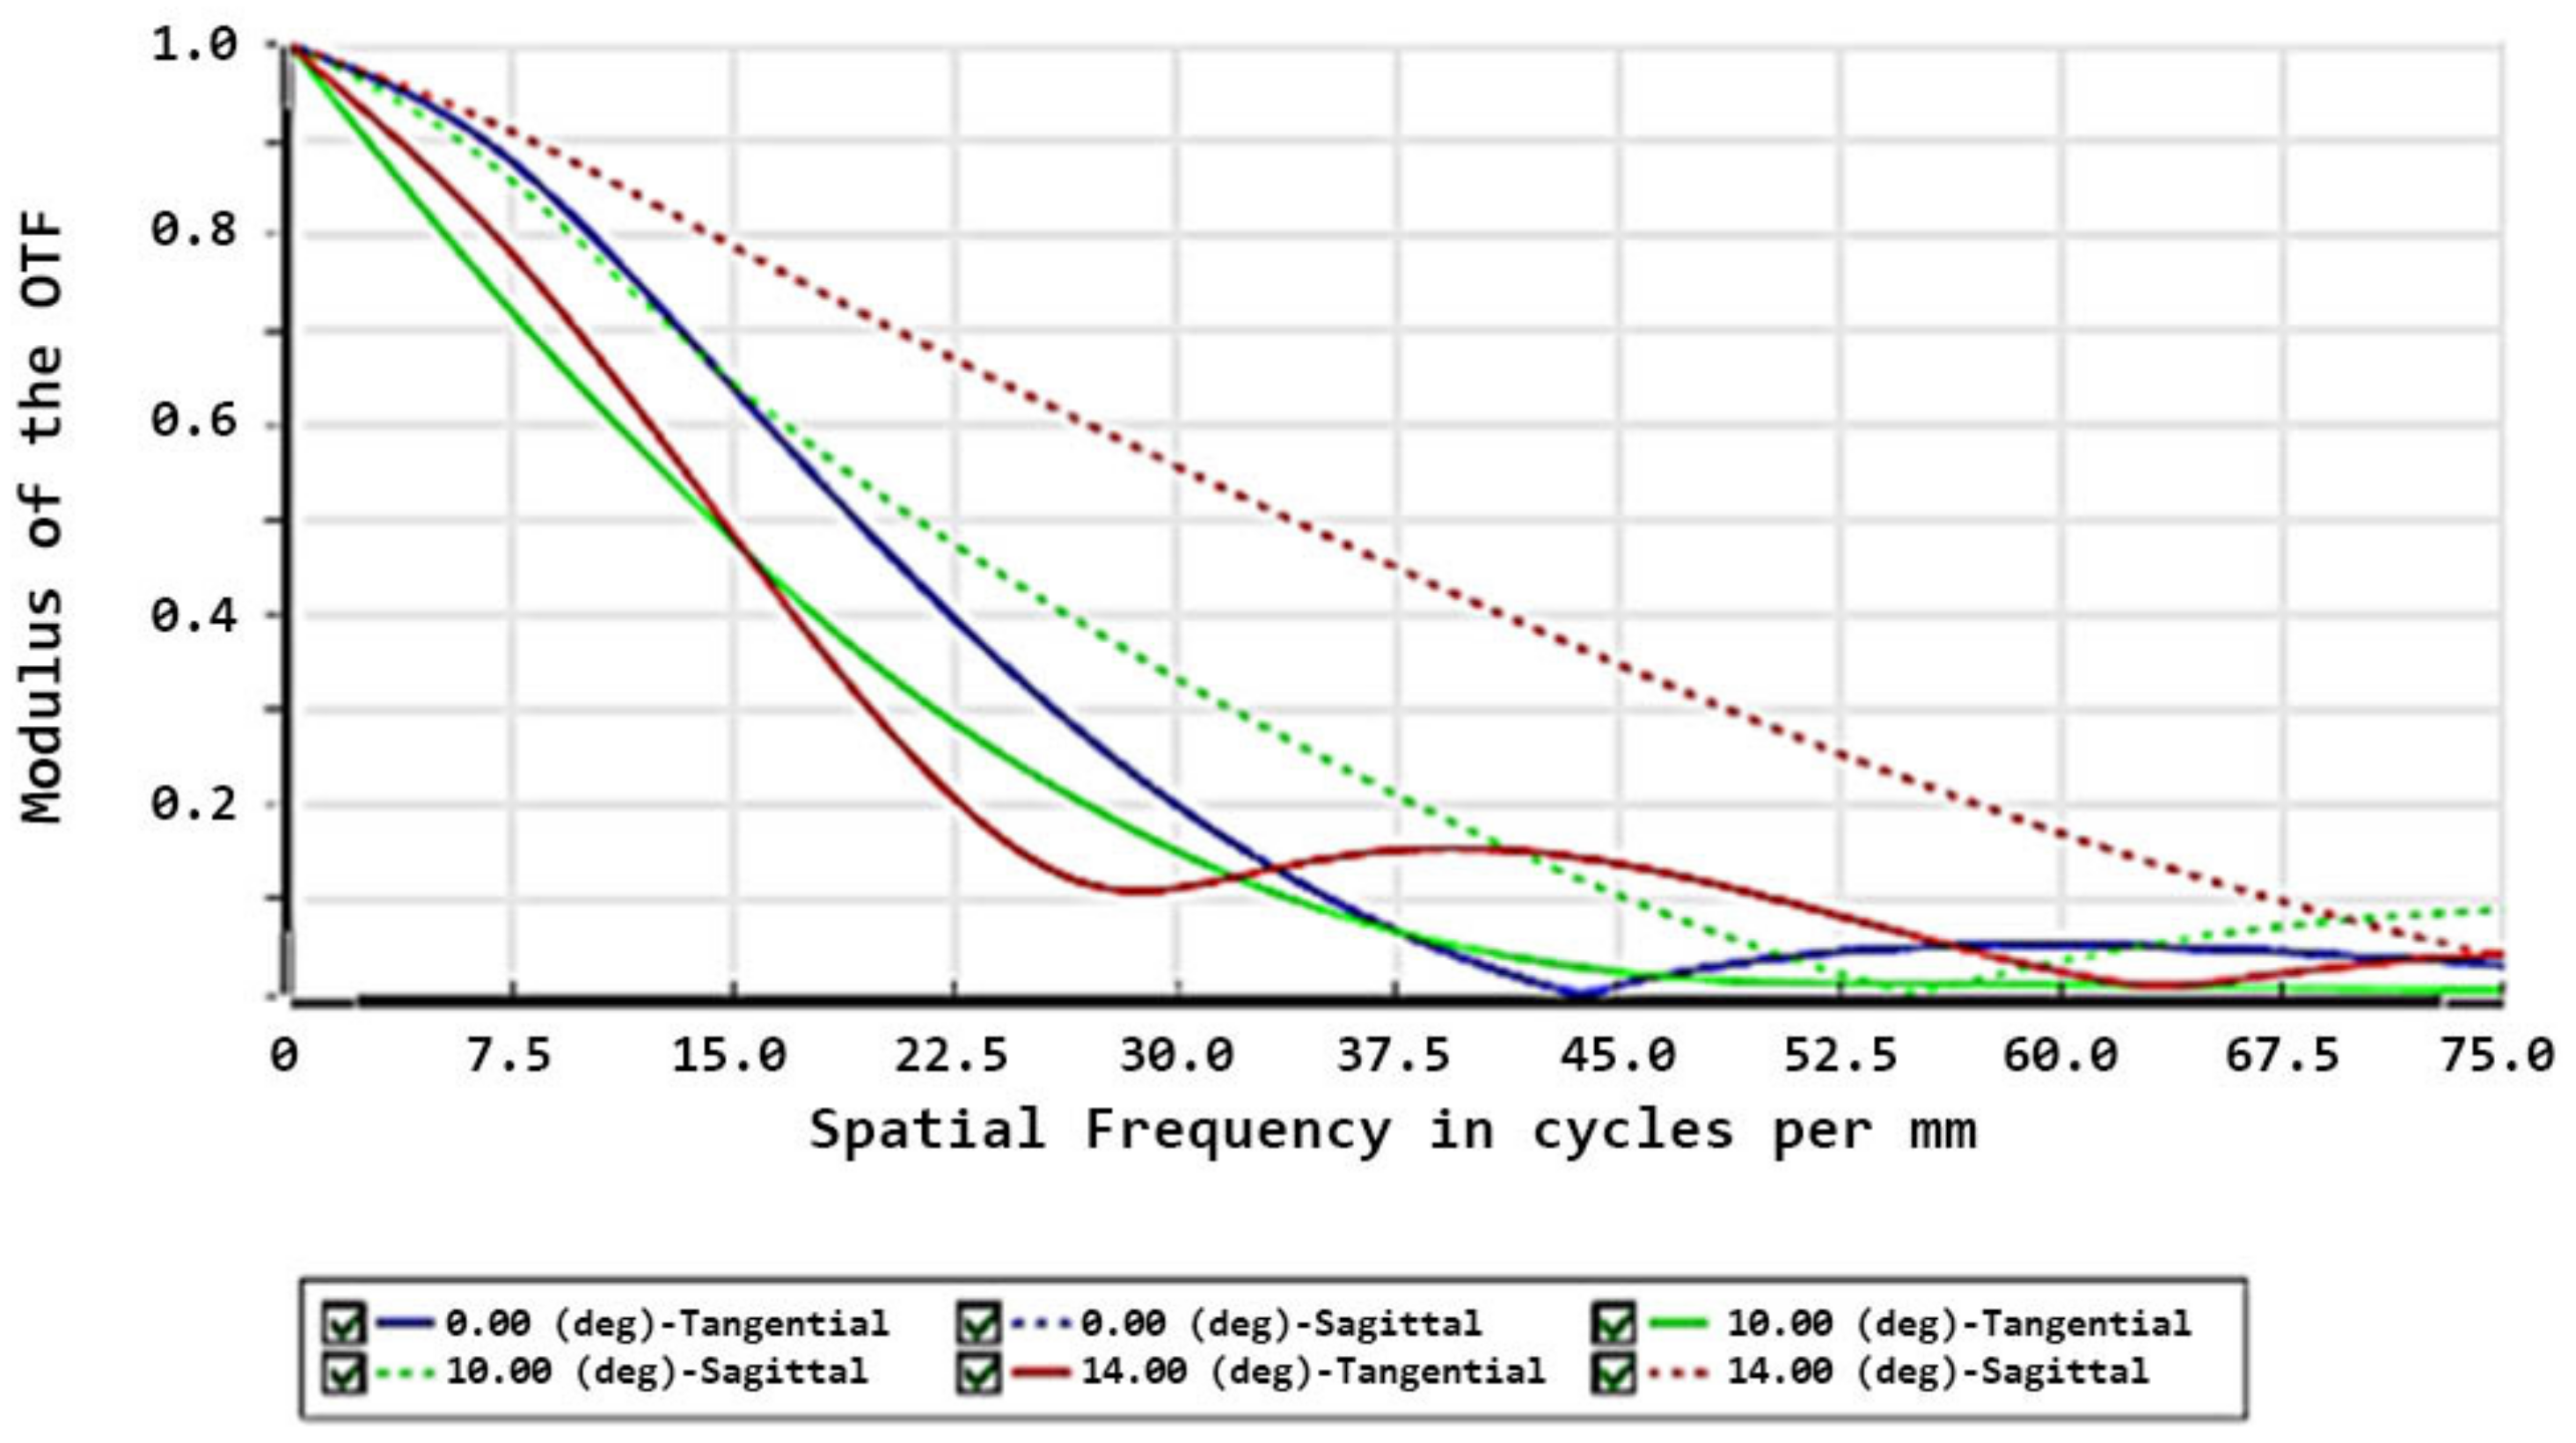
Figure 25.
MTF chart for zoom 1 (focal length = 5 mm).
Figure 25.
MTF chart for zoom 1 (focal length = 5 mm).
Figure 26.
MTF chart for zoom 2 (focal length = 10 mm).
Figure 26.
MTF chart for zoom 2 (focal length = 10 mm).
Figure 27.
MTF chart for zoom 1 (focal length = 15 mm).
Figure 27.
MTF chart for zoom 1 (focal length = 15 mm).
Table 1.
Refractive indices of light at different wavelengths at a water temperature of 20 °C [
10].
Table 1.
Refractive indices of light at different wavelengths at a water temperature of 20 °C [
10].
| Press, Chapter 2 Ocean optics, P.R.C. |
|---|
| Wavelength (nm) | Refractive Index | Wavelength (nm) | Refractive Index |
|---|
| 250 | 1.3773 | 486 | 1.3371 |
| 308 | 1.3569 | 589 | 1.3330 |
| 359 | 1.3480 | 768 | 1.3289 |
| 400 | 1.3433 | 1000 | 1.3247 |
| 434 | 1.3403 | 1250 | 1.3210 |
Table 2.
Variables in the refractive index of the D-Line wavelength [
10].
Table 2.
Variables in the refractive index of the D-Line wavelength [
10].
Salinity
(‰, ppt) | Temperature (°C) |
|---|
| 0 | 10 | 20 | 30 |
|---|
| 0 | 1.33400 | 1.33369 | 1.33298 | 1.33194 |
| 5 | 1.33498 | 1.33463 | 1.33390 | 1.33284 |
| 10 | 1.33597 | 1.33557 | 1.33482 | 1.33374 |
| 15 | 1.33595 | 1.33652 | 1.33573 | 1.33464 |
| 20 | 1.33793 | 1.33746 | 1.33665 | 1.33554 |
| 25 | 1.33892 | 1.33840 | 1.33757 | 1.33644 |
| 30 | 1.33990 | 1.33934 | 1.33849 | 1.33734 |
| 35 | 1.34088 | 1.34028 | 1.33940 | 1.33824 |
| 40 | 1.34186 | 1.34123 | 1.34032 | 1.33914 |
Table 3.
Specifications of the novel underwater prime lens.
Table 3.
Specifications of the novel underwater prime lens.
| Resolution | 4800 × 3600 (1700 K) |
| Sensor size | 36 mm × 24 mm (CMOS) |
| Diagonal length | 43.2 mm |
| Actual image height | 21.6 mm |
| Object distance | Infinity |
| Spatial cutoff frequency | 70 lp/mm |
| Half-angle of view | 12.20° |
| Focal length | 75 mm |
| Aperture | f/2 |
Table 4.
Fields of view and their weights.
Table 4.
Fields of view and their weights.
| Half-Angle of View | Weight |
|---|
| 0° | 3 |
| 2.2° | 3 |
| 4.5° | 2 |
| 6.0° | 2 |
| 8.4° | 2 |
| 10.8° | 1 |
| 12.2° | 1 |
Table 5.
Weight ratios for wavelengths in the blue–green spectrum.
Table 5.
Weight ratios for wavelengths in the blue–green spectrum.
| Wavelength | Weight |
|---|
| 546.1 nm () | 1 |
| 486.1 nm () | 1 |
| 479.9 nm () | 1 |
Table 6.
Specifications of the novel underwater zoom lens.
Table 6.
Specifications of the novel underwater zoom lens.
| Resolving power | 2100 K pixels |
| Sensor size | 12.8 mm × 9.6 mm (CMOS) |
| Diagonal length | 14.6 mm |
| Actual image height | 7.3 mm |
| Object distance | Infinity |
| Spatial cutoff frequency | 70 lp/mm |
| Angle of view | 72.20° |
| Focal length | 5 mm to 15 mm 3x |
| Aperture | f/2.8 to f4.5 |
Table 7.
Field of view and weights.
Table 7.
Field of view and weights.
| Angle of View | Weight |
|---|
| 0° | 3 |
| 4.6° | 3 |
| 9.1° | 2 |
| 18.2° | 2 |
| 27.3° | 2 |
| 36.7° | 1 |


 ,
, 


