
A Novel Measurement Standard for Surface Roughness on Involute Gears


Physikalisch-Technische Bundesanstalt, Bundesallee 100, 38116 Braunschweig, Germany
*
Author to whom correspondence should be addressed.
Appl. Sci. 2021, 11(21), 10303; https://0-doi-org.brum.beds.ac.uk/10.3390/app112110303
Submission received: 4 October 2021
/
Revised: 23 October 2021
/
Accepted: 27 October 2021
/
Published: 2 November 2021
(This article belongs to the Special Issue New Trends in Manufacturing Metrology)
Abstract
:Although manufacturers of coordinate measurement systems and gear measurement systems already provide instruments that enable an end-of-line-monitoring of the roughness properties of gears, the roughness measurement on gear flanks still lacks traceability with respect to the standardised SI-units. There is still a gap between well standardised roughness measurements on planar surfaces and gear measurements on involutes. This gap is bridged by a novel physical measurement standard (PMS), also referred to as material measure, for roughness measurements on involute gears that has been developed at the Physikalisch-Technische Bundesanstalt (PTB). The necessary transformations between the systems of roughness and gear measurements have been implemented. The measurement standard itself represents calibrated roughness values for the parameters , , , , and and and . Furthermore, the PMS can be measured both with classic profilometers as well as gear measurement systems with integrated roughness probes.
1. Introduction
The relevance of the quality of surfaces of gears has increased dramatically over the last decade. Its texture has big impacts on the efficiency of gear boxes, which is why a precise description of profile properties is required. The mechanical power density, running behaviour, noise and the wear of a gear are influenced by the roughness properties of gear flanks [1].
In order to decrease noise [2], wear and power dissipation [3,4,5], gear flanks with roughness values of are achieved and used in production. This is made possible by using modern manufacturing processes such as slide grinding or polishing grinding [6].
This is why the surface quality of gears has grown more important over the last ten years. Manufacturers of coordinate measurement systems and gear measurement systems have developed probes specially designed to enable end-of-line-monitoring of the roughness properties of gears [7,8]. Manufacturers of such instruments request national institutes and standardisation committees to meet their demand for traceability and comparability with established roughness metrology. Their customers typically are those in machine building and automotive industries. However, the roughness measurements on gear flanks still lack traceability with respect to standardised SI-units. Physical Measurement Standards (PMS), also denoted as material measure, for conventional roughness profile measurements represent planar surfaces only. In addition, most of them do not represent the functionality of surfaces regarding their tribological properties. The big challenge of roughness evaluations on gear flanks lies in the involute shape of the surface [9].
There still is a gap in dimensional metrology between measurement technologies for inspecting surface textures and for inspecting 3D geometries [10,11]. Surface texture measurement strategies consider a surface as a plane with the topographic features perpendicular to the plane and being around three orders of magnitude smaller than the lateral sizes. Objects mounted on conventional roughness measurements instruments are required to be flat and often required to be sufficiently small. Calibration procedures for maintaining traceability of roughness instruments have been established for many decades. However, in the case of roughness metrology on involute geometries, the planarity assumption no longer holds. As a consequence, specific involute measurement devices have been developed and are already commercially available. For the specific involute roughness measurement systems, no calibration strategies currently exist. As those measurement systems are capable of mounting larger gear systems and can scan single teeth on an entire gear, it is a challenge to inspect such a system and to retrace its roughness data to the SI.
Physical Measurement Standards (in short, PMS, and also referred to as material measure) are a common means to represent physical quantities used for calibration. Despite new and innovative approaches to the manufacture of PMS [12,13], there is still no PMS allowing for the traceability of roughness measurements on an involute shape. Such a Physical Measurement Standard has been developed at the Physikalisch-Technische Bundesanstalt (PTB). It yields the following unique features of a PMS employed as the calibration standard for the inspection and calibration of involute roughness measurement systems:
- First roughness measurement standard on a non-planar (but involute) surface;
- Modular layout of the artefact for both types of measurement systems on gear measuring machines and classical profilometers.
This publication on the development of a PMS is structured as follows.
In Section 2, the processes of measurement, analysis and calibration of the standard are explained. Different methods of separating form from form deviation and surface texture are presented. The two differing coordinate systems of profilometer data and of gear measuring machine data are explained. A procedure to determine the involute form from data of the profilometer by a least square optimisation algorithm is described. In roughness metrology, standardised filtration methods are employed to separate long and short spatial wavelength components of the topography, which are referred to as waviness and roughness profiles. After discussing the usage of the filters that are in accordance with standardised filtration methods, statistical parameters characterizing surface texture features and that are embodied within the standard are discussed shortly.
Subsequently, the characterisation of an example gear used for developing the evaluation algorithms and designing the PMS are shown in Section 3. It comprises the presentation of different profiles from different forms of elimination procedures and measurement systems and different reference systems as well as the corresponding roughness and material ratio values.
The discussion is followed by Section 4, in which the methods and concepts of the development of the standard are presented. Starting with the explanation of the modular structure of the standard, other characteristics of the manufacturing process are then outlined. This is followed by the presentation of the calibrated roughness profile, including the discussion of the influences on measurement uncertainty. Finally, a short discussion on alternative surface finishing processes with regard to the relocalisation issue is included.
As a conclusion, the impact of the results as well as suggested applications are discussed, and an outlook on further questions and interesting challenges is provided in Section 5.
2. Methods for the Analysis of Surface Roughness on Involutes
In order to close the gap between the described measurement principles of surface texture measurements and 3D gear property measurements, different coordinate systems were used: a Cartesian coordinate system used by profilometers and a non-Cartesian system of roll angles referred to as gear coordinates. The association of the involute form to data points on the surface of a tooth that are represented in profilometer coordinates requires an appropriate optimization procedure, which is presented in this article. The obtained involute parameters enable a transformation into gear coordinates and form removal in order to obtain the primary profile for roughness analysis. In roughness metrology, standardised filtration methods are employed for separating long and short spatial wavelength components of the topography, which are referred to as waviness and roughness profiles.
2.1. The Involute
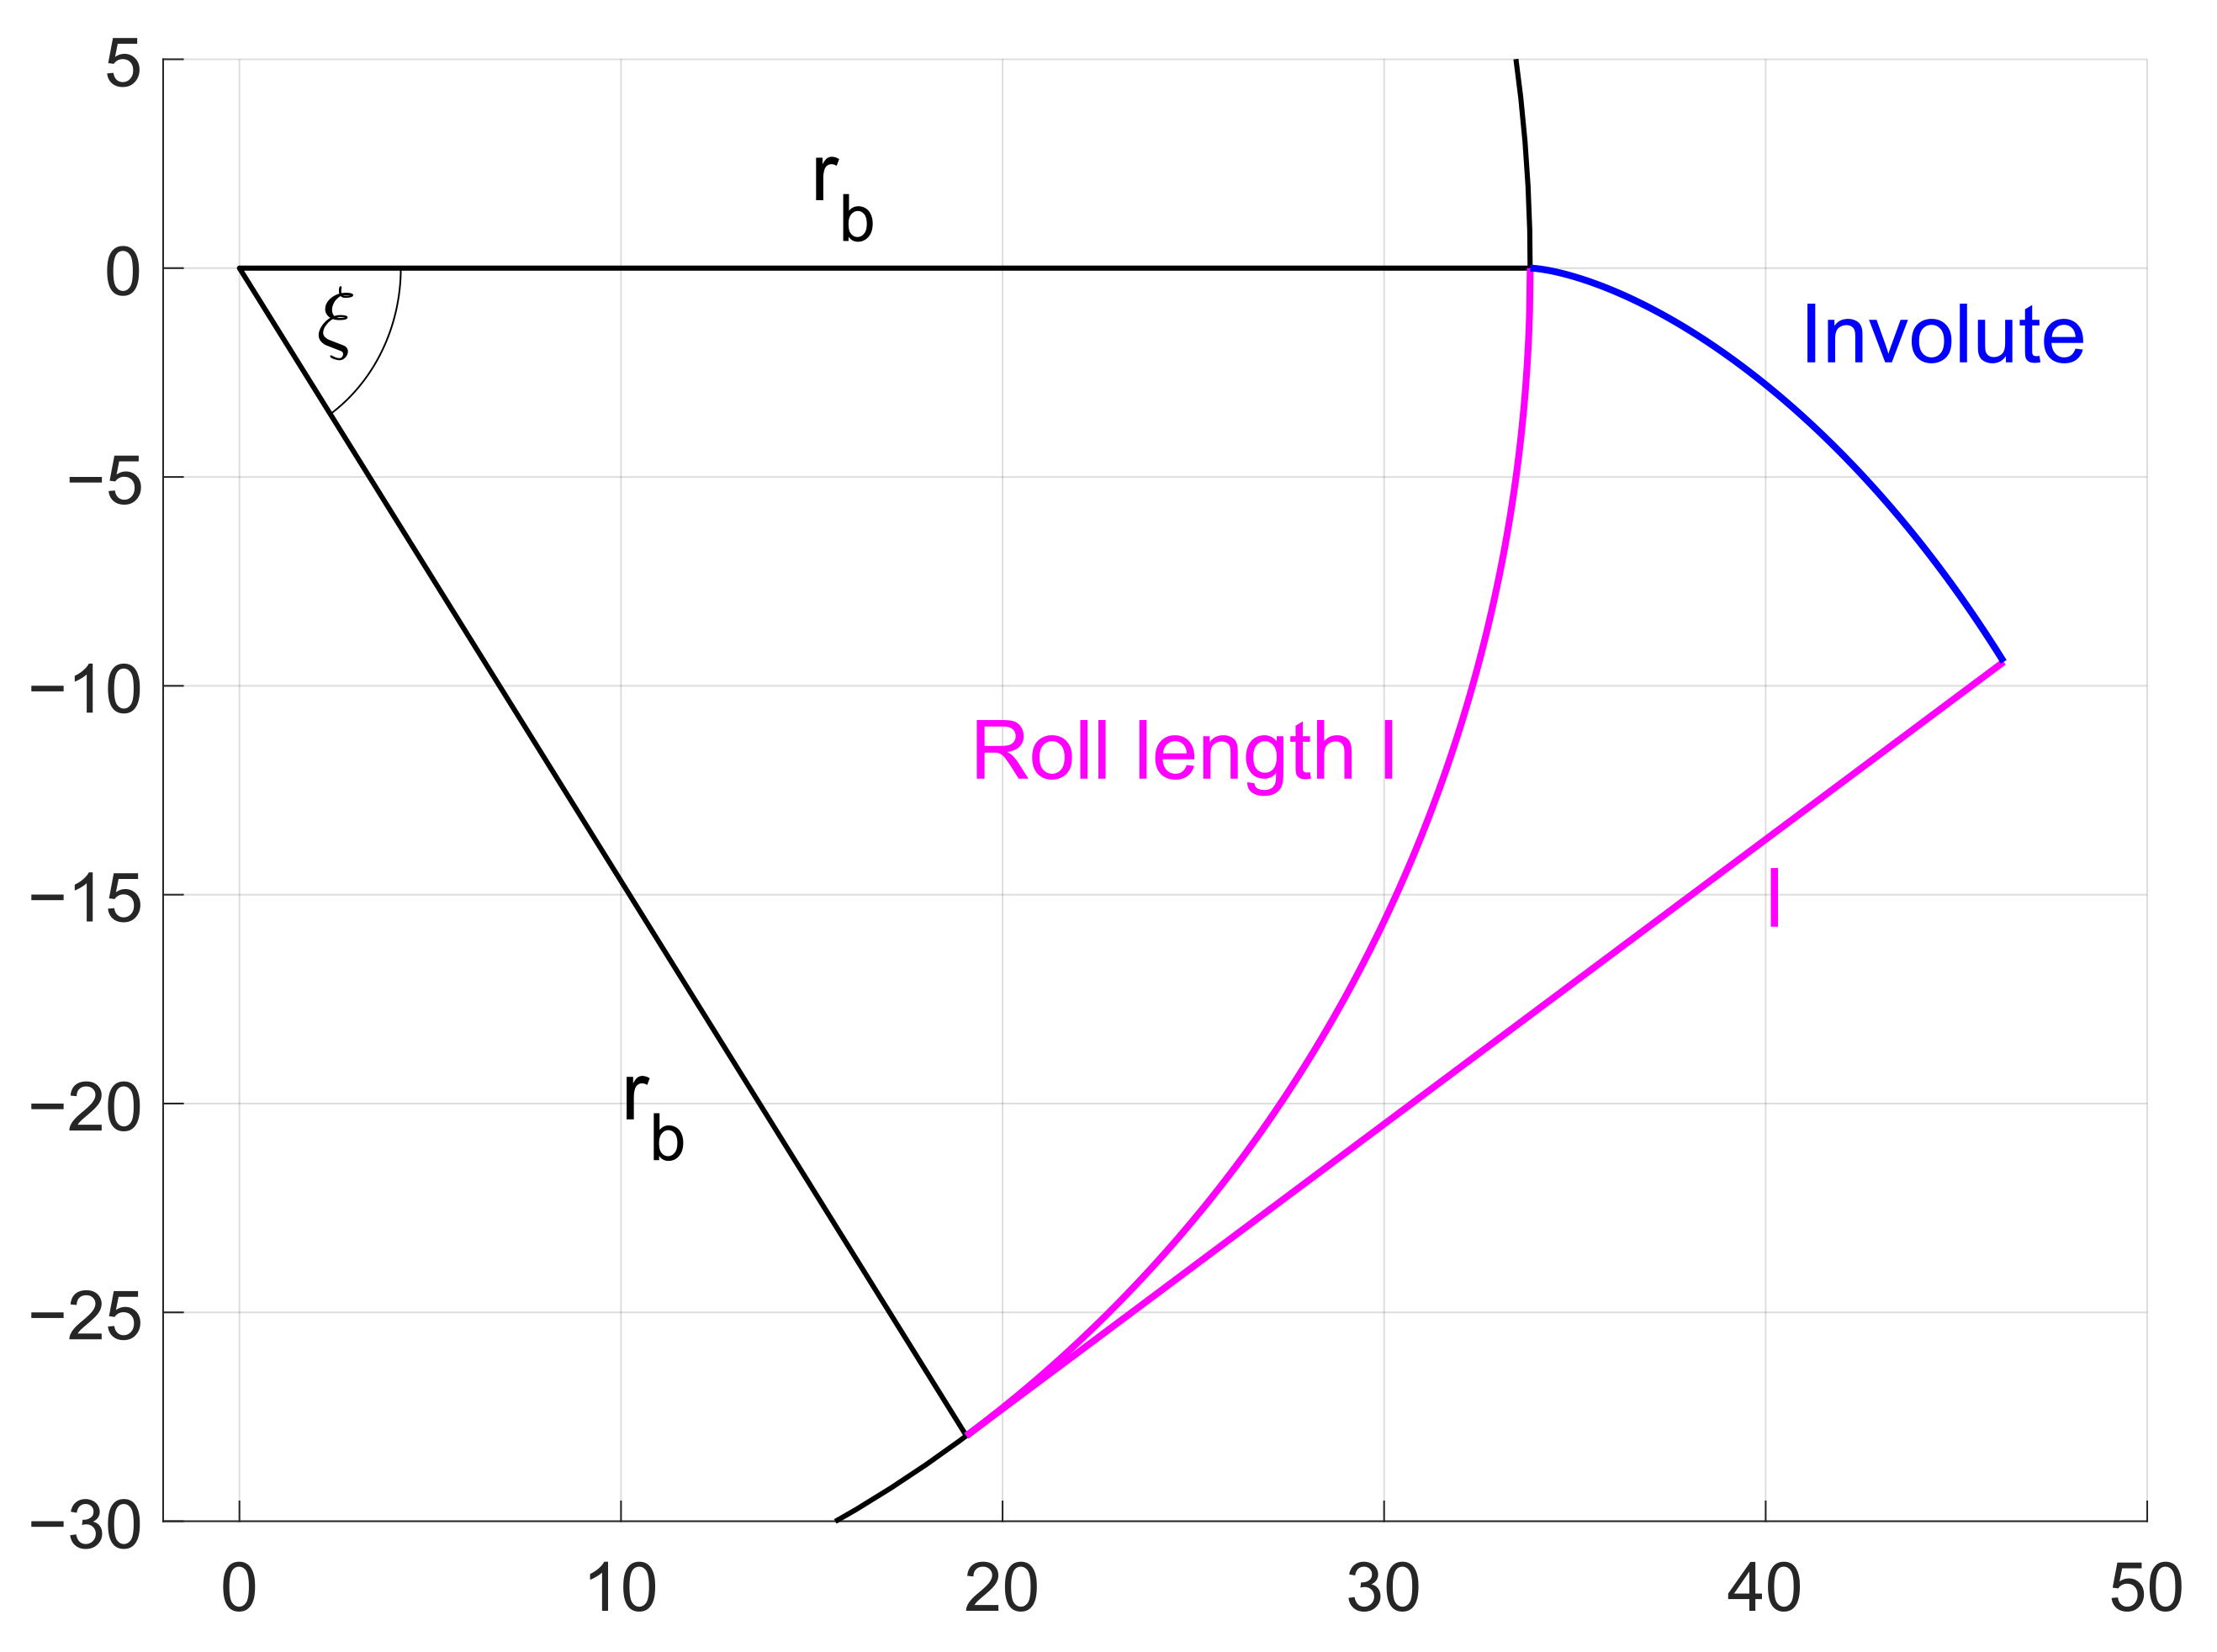
The most commonly used shape of gear teeth by far is the involute, shown in Figure 1.
All form deviations including the roughness values have to be evaluated relative to the ideal involute of the workpiece. The simplest form and position of a left flank involute in the x-y-plane is described by using the roll angle :
with denoting the base circle’s radius and denoting the roll angle. The roll angle can be expressed as function of the base circle radius and the roll length l.
In contrast to common usage with respect to parameterising involute geometries with roll length l, this article preferably employs roll angle instead.
2.2. Coordinate Systems Involved
The modular design of PMS facilitates measurements on both gear measuring systems and classical profilometers. While the former directly uses gear coordinates and mainly roll length l as their reference system, the latter detects the profile of a probe by using Cartesian coordinates, in this case on the surface of a tooth. Roughness parameters, however, are defined by assuming planar surfaces, thus using Cartesian coordinates on the surface of the workpiece. The surface is considered as a skin that is unwrapped from a geometrical element. In the case of a gear tooth, the involute shape is removed by delivering the positions along the arc of the tooth in a two-dimensional Cartesian coordinate system. The lateral coordinate values lie on the arc of the fitted involute, and the vertical coordinate values represent the deviations of the real workpiece surface normal to the fitted involute. These point pairs represent the so-called primary profile.
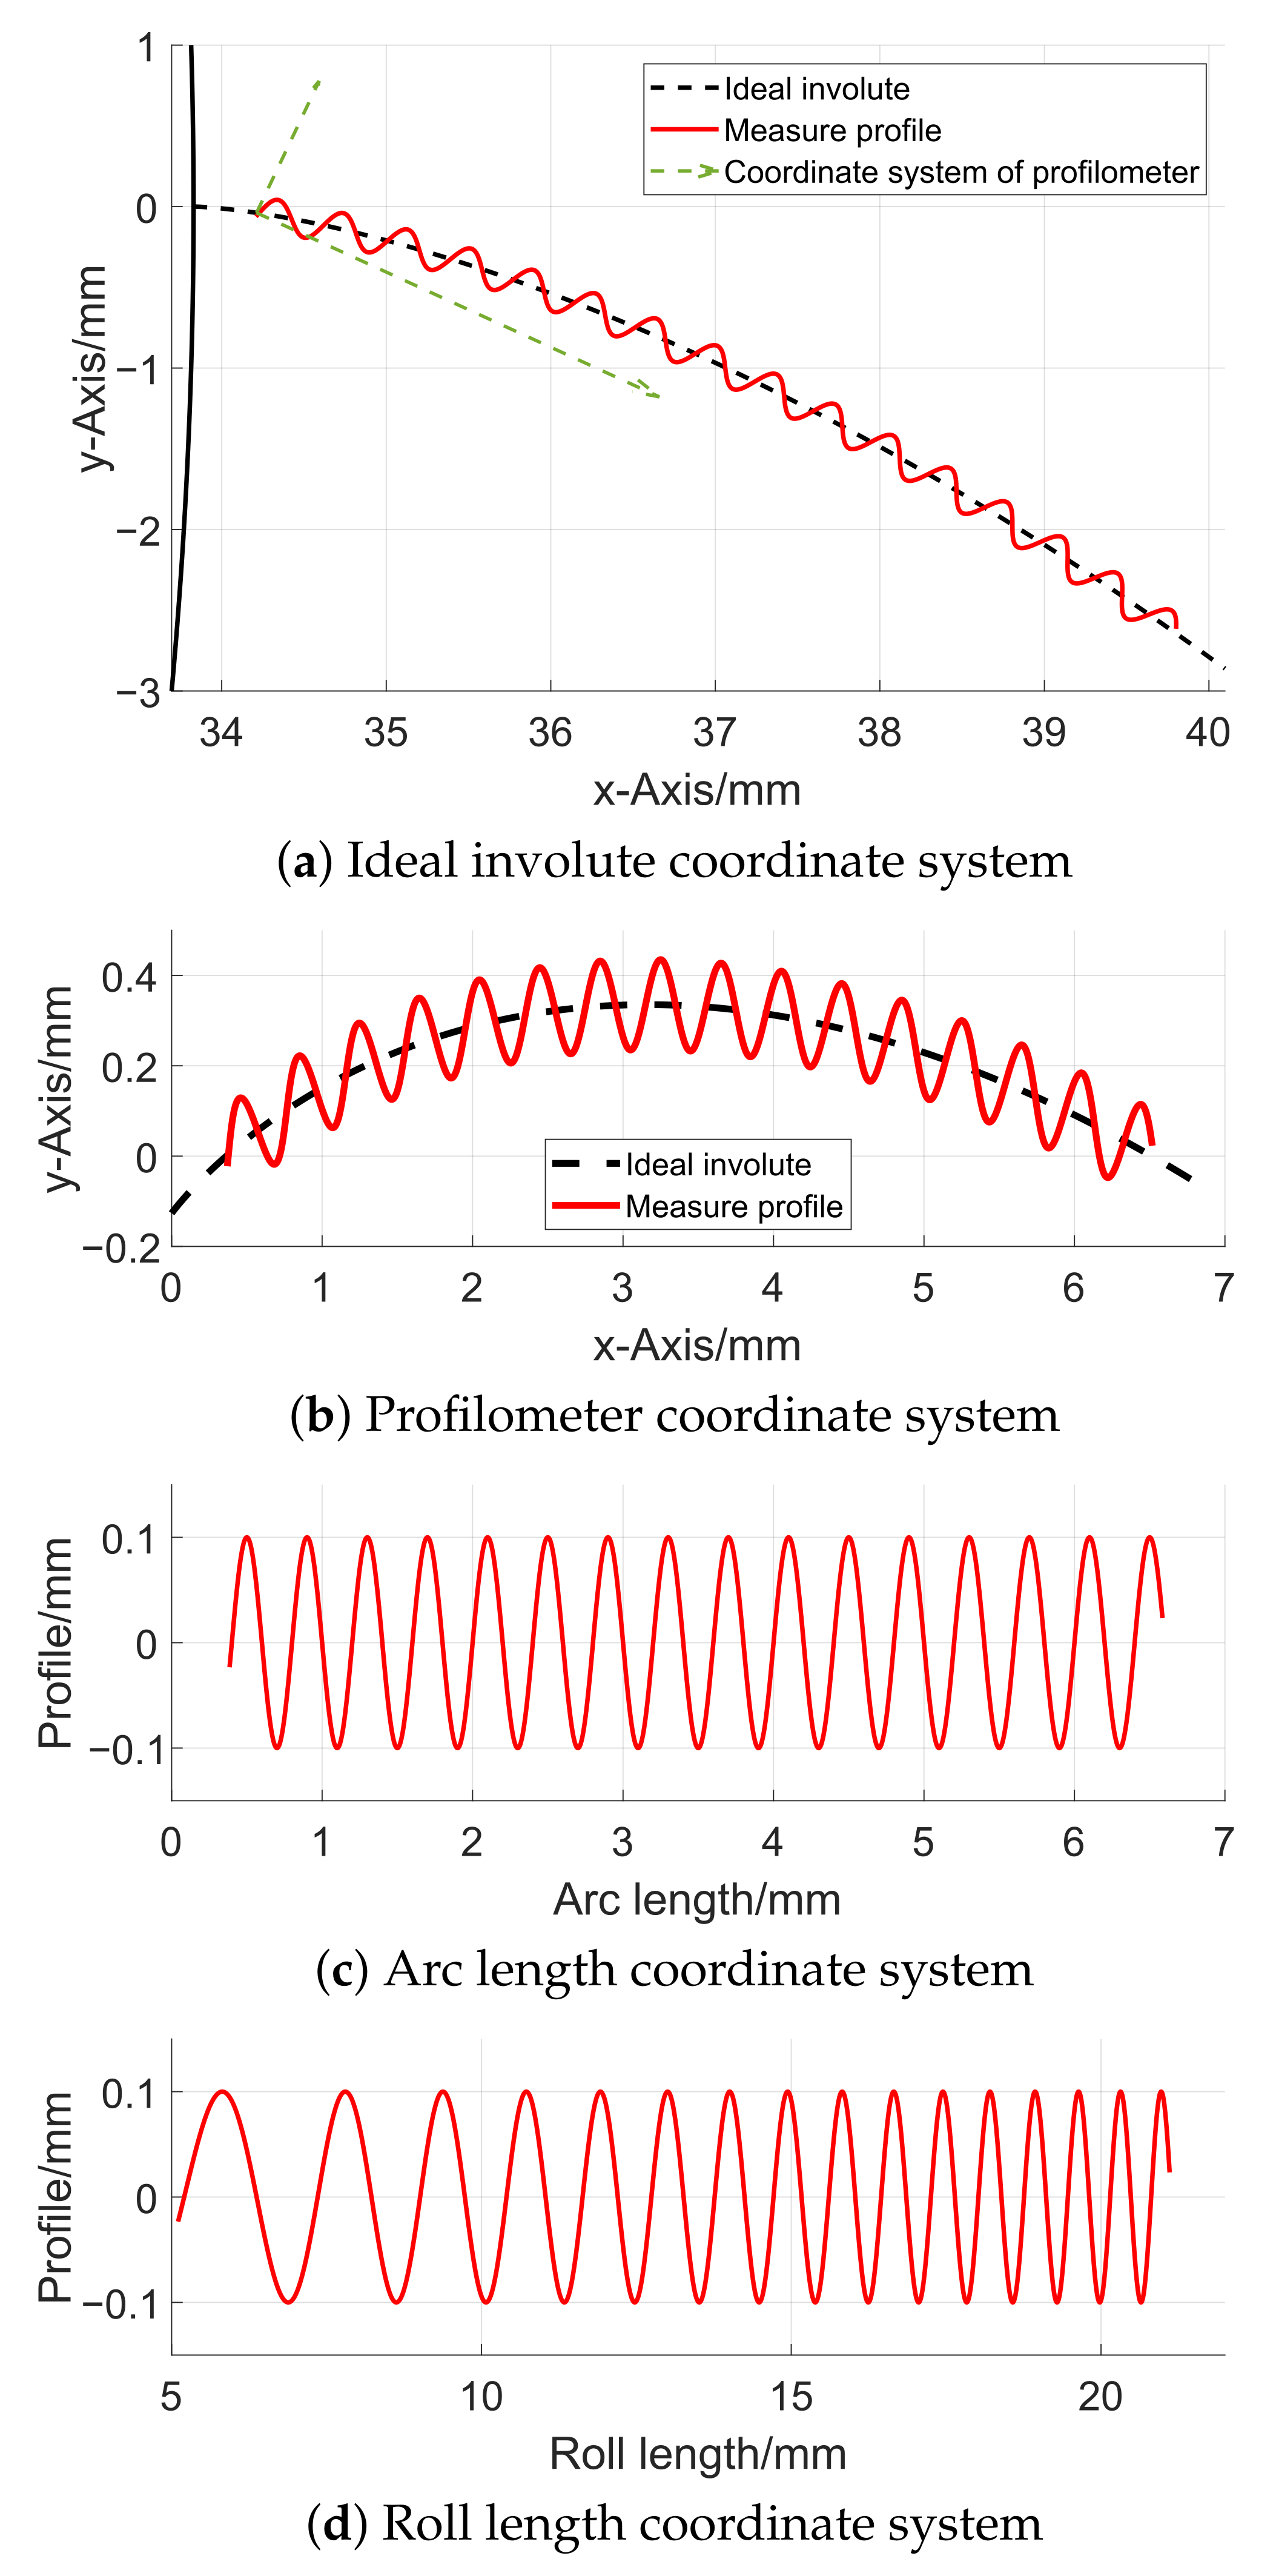
While a gear measuring machine delivers roll angles or roll lengths and the full geometry of the workpiece, a profilometer has no information on the geometry of the gear and, therefore, no access to the involute shape. The profilometrically obtained topography data do not provide information on the actual involute arc geometry and represent the profile points in a Cartesian system with its lateral axis lying parallel to some secant of the arc with its absolute position relative to the involute remaining unknown. This means that at least four different reference systems have to be considered when dealing with the different methods of measuring and analysing the profile of this gear-roughness standard. Those reference systems are illustrated in Figure 2 via an artificial texture as sinusoidal profile to illustrate the non-linearity of the transformation between the coordinate system of roll angles and chord positions; they are defined as follows:
One deviation profile will appear differently when displayed (or measured) in different reference systems, as shown in Figure 2a,d, with an artificial profile. A profile that appears as a regular sine with respect to the arc length (Figure 2d, ) also includes the shape of the involute, when displayed in Cartesian coordinates including the involute shape (Figure 2a, and Figure 2b, ).
Using roll length as the reference length () shows the same profile stretched and compressed in the x-axis, as shown in Figure 2d. Most measurements in gear metrology are described in reference to the roll length l. Hence, the distinction between l and the arc length s marks the gap between the gear metrology sector and the classical roughness measurement sector. This means that it is of utmost importance to always ensure that measurements and evaluations are performed by using the adequate coordinate system. To be able to correctly evaluate and compare the measured data, one first needs to be able to transform the data between these reference systems.
The relevant transformations are presented subsequently. Note that combining the three presented transformations enables the transformation between all coordinate systems; only the optimisation algorithm cannot be reversed if the transformation parameters are not saved separately.
2.2.1.
The coordinates in the roll length reference system are as follows:
where they consist of the amplitude of deviation of the Cartesian data point to the ideal involute and the roll angle marking the base point on the ideal involute. The base point is the point on the ideal involute that fulfills the requirement that is perpendicular to the involute in . The transformation from to requires that for every Cartesian point , the corresponding base point is calculated. A parametrisation that includes this transformation has already been described by Härtig et al. in [14]. By using the parametrisation of cartesian coordinates via different parallel involutes and simplifying it to the two-dimensional case of spur gears, one can transform any point in the Cartesian x-y-plane () to the corresponding gear-related coordinates of roll-angle , the amplitude of deviation p and the position of the base point on the ideal involute.
2.2.2.
The data points in the roll length system only differ from the arc length system in their x-coordinate. In other words, the difference is not what the amplitude of the deviation is, but where on the involute it is located. In both cases, the x-coordinates mark distinct points on the ideal involute (1), which yields the following.
2.2.3.
It is assumed that the measurement on the profilometer has taken place sufficiently perpendicular to the gear axis. Therefore, both reference systems are located in the same 3D-plane. This reduces the transformation to a 2D-problem.
The Cartesian coordinate systems and only differ in position and orientation to one another. This means that the transformation between these coordinate systems can be performed by using one translation via a two-dimensional vector:
and one rotation around an angle via the following operator.
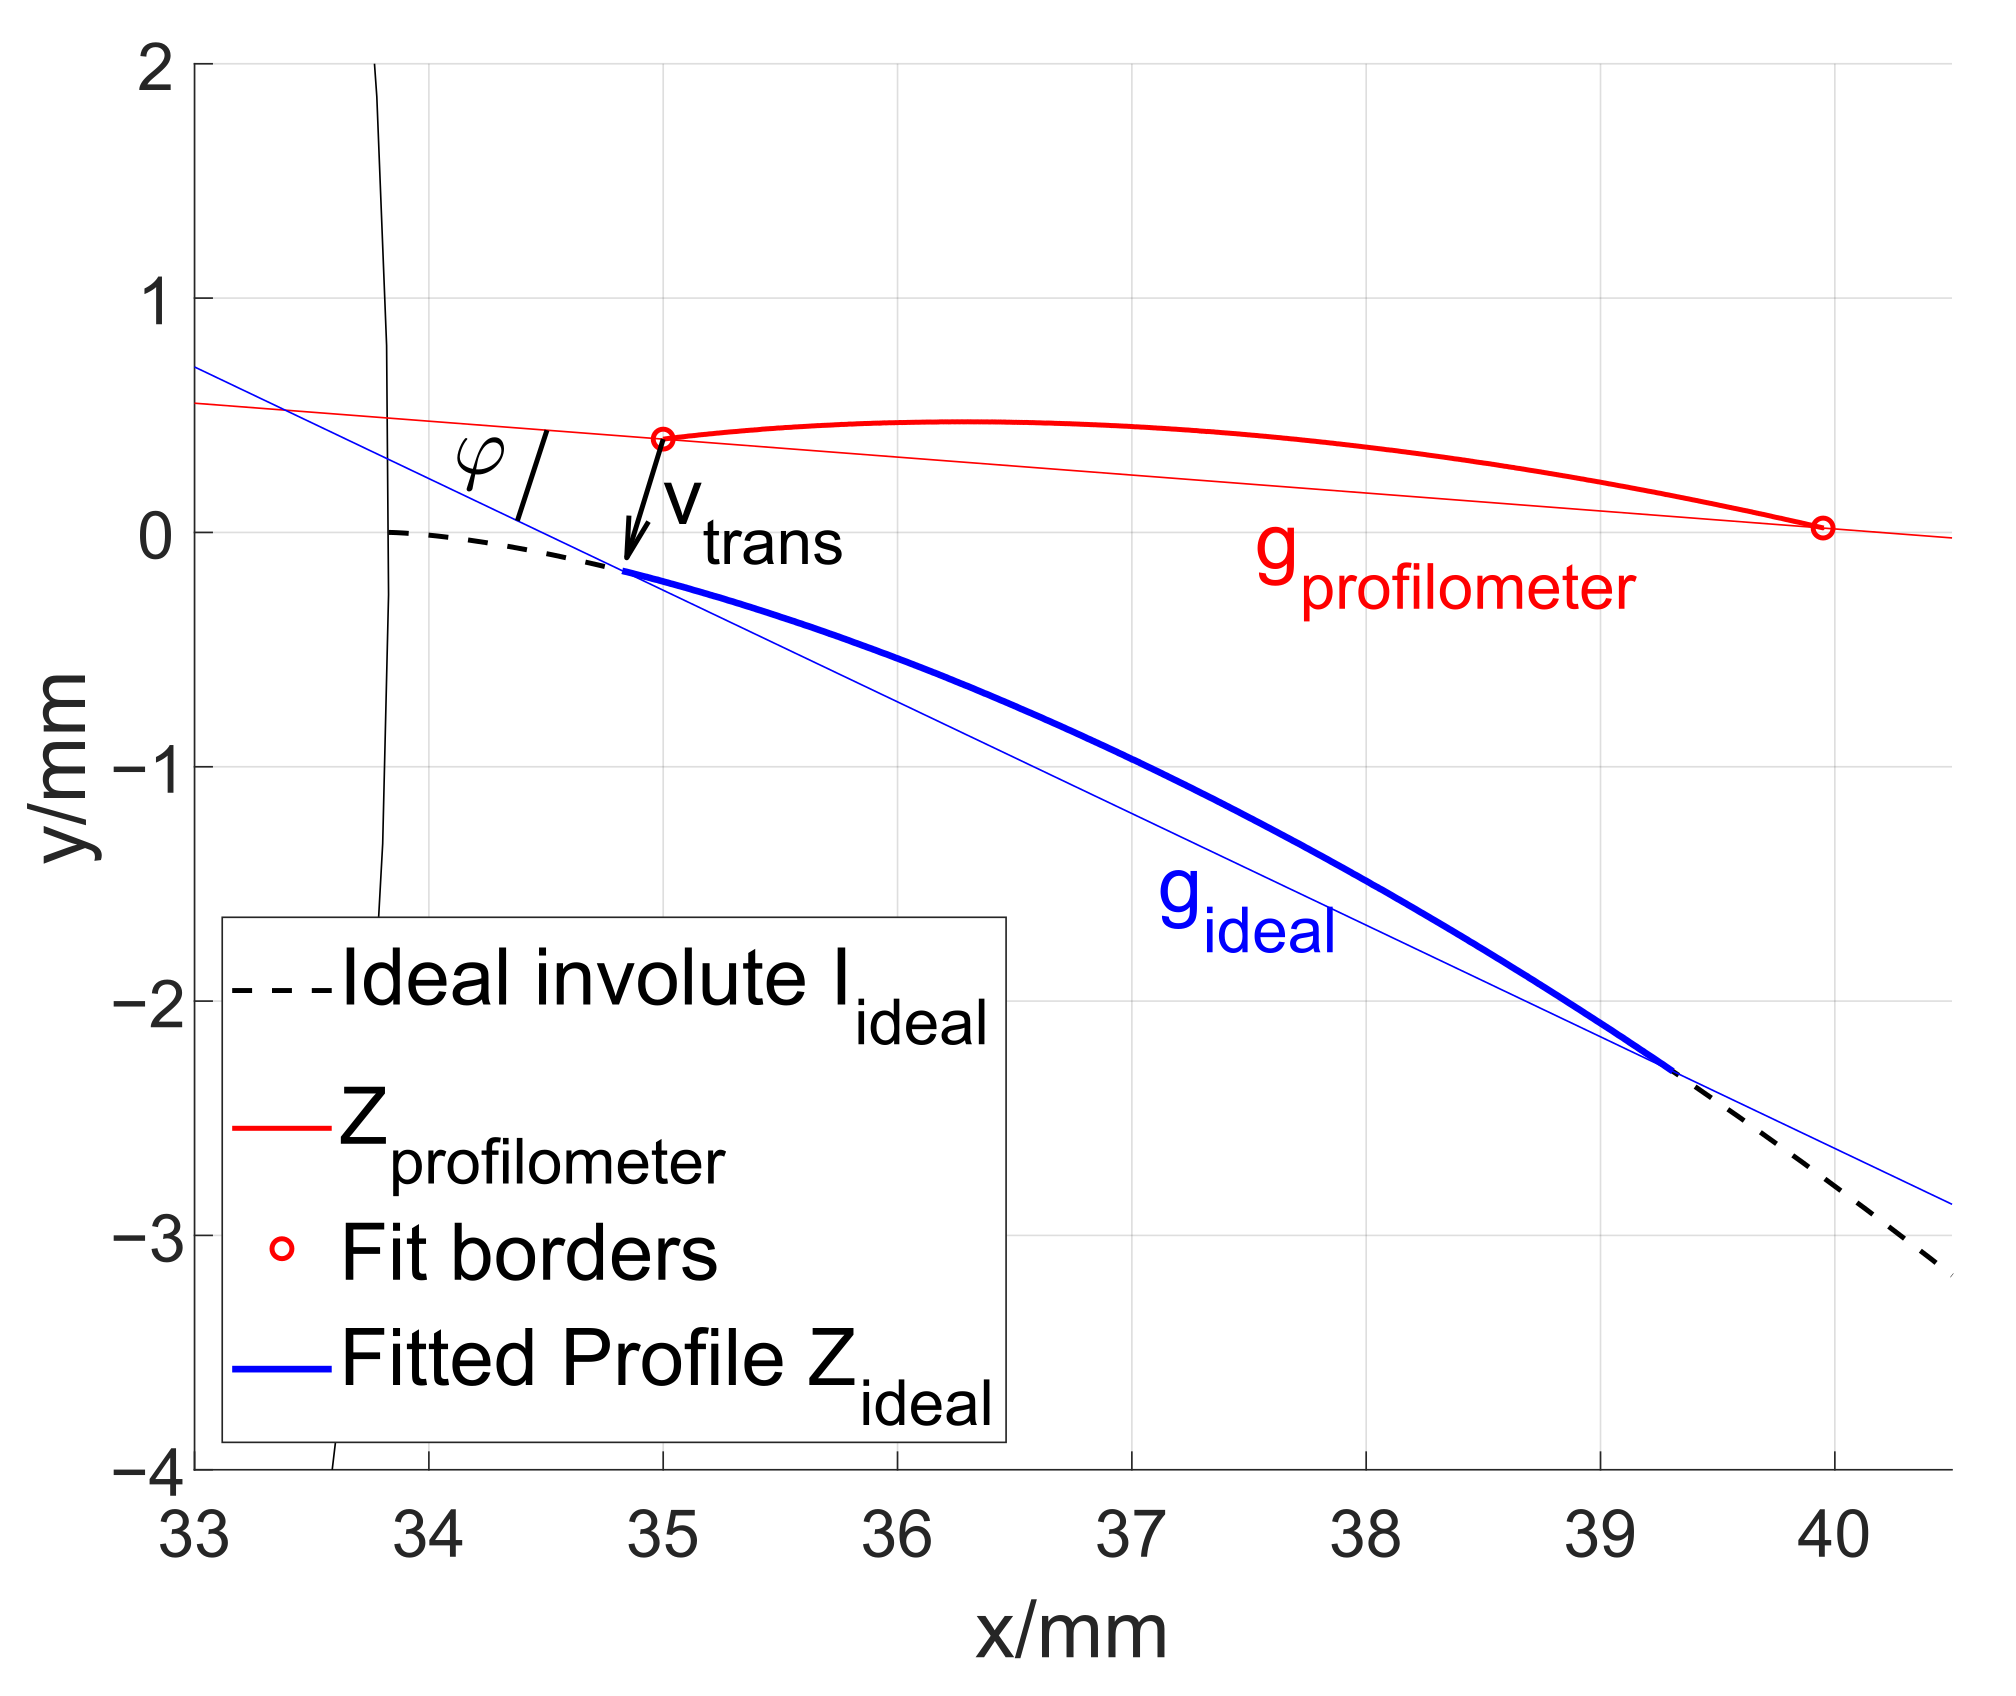
This, however, requires the knowledge of and . In practice, the transformation can be implemented with different methods depending on the definition of and . As visualised in Figure 3, one defines as the angle between the line through the first and last point of the measurement data and through the first and last point of the fitted data . The vector is defined as the vector from the first data point in the -system to the corresponding point in the -system. The transformation is then executed by rotating and shifting the data points accordingly. The measurement on a profilometer, however, does not provide any direct information about the position of the measured data relative to the ideal involute.
That is why an optimisation algorithm (fit) is implemented to find the optimal transformation parameters and . The optimum is defined as the transformation that yields the transformed profile with the least mean square error to the ideal involute . In other words, the profilometer profile is shifted and turned until it matches the ideal involute best.
In order to stabilize the optimisation procedure, choosing reasonable starting values for the transformation parameters will be helpful, e.g., choosing a vector that shifts the first point of to the first point of the ideal involute .
Alternative form fitting methods are available and are described in [15].
2.3. Form Removal
The developed optimisation algorithm combines the transformations between all coordinate systems described in Section 2.2. As a result, when applied to a Cartesian data set of profile measurement data (such as in Figure 2b) and the base circle radius of the ideal involute is provided, the algorithm directly provides the primary profile as the deviation of the measured coordinates from the ideal involute in reference to the unwound arc length s (such as in Figure 2c). This fitted profile also provides absolute information about the position of the measured data on the involute and, therefore, enables the reference of the profile to the gear dimensions. Note that even an incomplete form removal provides an adequate primary profile for the roughness evaluation as remaining form contributions will also be removed by removing the waviness profile, as described in Section 2.4.
A different approach to remove the form from the measured data is to by directly applying a smoothing spline to the measured coordinates. This effectively projects the profile onto a chord of the ideal involute, along which the profilometer has registered the measured coordinates (see the dashed green axis in Figure 2a). The obtained primary profile is (slightly) compressed in comparison to the fitted primary profile. This can be compensated by stretching the primary profile laterally, if (e.g., by comparing with the fitted profile) the correct lengths of the measured profile segment are known. This stretched profile still contains a deviation in the position of the coordinates, as linear stretching does not account for the real distribution of measured points along the shape of the involute.
2.4. Filtration
In standardised procedures of geometrical product specification, geometrical irregularities or form deviations contained in a scale-limited area or profile are referred to as surface texture (see [16] Clause 3.1.2). The ISO standard [16] specifying the statistical parameters for characterizing roughness defines the term primary profile, in short P-profile, as the residuals of a profile trace on the surface of a geometrical object obtained by removing the form. Furthermore, it defines the waviness profile, W-profile, as a scale-limited profile obtained by removing small scale lateral components and the roughness profile, R-profile, as a scale-limited profile obtained by removing large scale lateral components.
The removal and the separation of small and large scale lateral components, respectively, are performed by applying a filter with specified cut off wavelength , which, in roughness metrology, is also referred to as nesting index. There exist a variety of filter algorithms specified in a series of ISO standards. The commonly used filter is a Gaussian filter specified in ISO standard 16610-2 [17]. Let be the primary profile, then the waviness profile is obtained by a linear low pass filter either by convolution of the following:
with a convolution kernel
or equivalently in the Fourier domain with the following transfer function.
and are the spatial wavelengths. The transfer function H is the low pass filter, while is the high pass delivering the roughness profile, R-profile and . Equivalently, the R-profile is given by the P-profile by removing the W-profile: .
In order to minimize filtration errors of signals of finite size, the borders need to be dealt with appropriately. The usage of any kind of windowing function suppresses information and amplitude content within the border regions. However, using a combination of the Gaussian filter with a Savitzky–Golay filter minimizes such effects that the roughness metrology refers to as end effects. Savitzky–Golay filters employ regression polynomials to locally follow a signal, and the local range it acts on depends on the width of the regression polynomial. The degree of the regression polynomial determines the shape it follows. A straight line follows the slope of the signal within the covered range, a parabola of the curvature and so forth. To minimize end effects, the width of the range covered by the regression polynomial is equal to the cut off wavelength , and the degree shall comply by following the signal slope at the border regions. A shape retainment expressed by following the primary profile’s curvature is not required because it is assumed that the curved shape lies inside the form associated when fitting the involute. The Savitzky–Golay polynomial chosen is, therefore, the straight line, i.e., the order of the polynomial is . The filter is called a Gaussian regression filter, as developed in [18,19], and subsequently standardised as ISO 16610-28 [20]. For a discrete set of data points representing a profile and with denoting the waviness profile and , which is the vector of height values of the primary profile, the Gaussian regression for order is given by the following convolution:
with
and the following.
is the Gaussian kernel for distances in Equation (8); and n are integer numbers; are the indices of discrete sampling positions and , i.e., the coordinates of the lateral axis; and n is the number of sampling points.
At the central part of a signal, i.e., beyond the two border regions of length of the cut off wavelength, the Gaussian Regression for order according to Equations (10)–(12) and the Gaussian filter according to Equation (7) or Equation (9) deliver the same result. Therefore, they can both be used interchangeably in case border regions are omitted for subsequent evaluations of statistical roughness parameters. Effects at the boundary region are significantly smaller when employing the regression Gaussian filter instead of the Gaussian filter. Therefore, the Gaussian regression filter is required in this case, the work piece or measurement setup does not allow enough space to perform pre-trial scan and trial scan regions and Gaussian regression has to be employed.
2.5. Roughness Parameters
The standard ISO 4288 [21] and its successor ISO 21920-3 [22], respectively, specifies the evaluation length of a roughness profile and the value of the cut off wavelength , which is the length of a single section, in accordance with the range of values of or . The evaluation length is an integer multiple of sections of a length equal to the cut off wavelength.
The default value of the number of sections specified in ISO 4288 [21] is .
For the application dealt with in this article, the appropriate value of the cut off wavelength is mm; hence, mm.
The height parameters , and characterizing the height distribution are defined in ISO 21920-2 [16], which will soon replace ISO 4287 [23] as follows:
and the following is the case.
is the difference between the height value of the summit of the highest peak and the lowest point of the deepest dale within the i-th of sections.
2.6. Measurement Systems
Profilometer measurements are carried out by using the High Resolution Topo Scan (HRTS) that has been developed at PTB. It is traced back to the SI functioning as the reference profilometer. The HRTS is capable of providing roughness measurements with measurement uncertainties (MU) in the Nanometer range [25]. The HRTS profiler moves a stylus with diamond tip along a straight line. The stylus is controlled to follow the topography of a scanned surface. Scanning a gear tooth with the profilometric measurement principle then results in a data set of equidistantly sampled lateral positions along a chord line of the tooth’s involute shape and the belly of the involute shaped as vertical height values.
The P40—measurement system (P40) by the KLINGELNBERG AG [26] is capable of measuring roughness profiles on gear flanks within a gear measurement regime. A diamond tip is moved along the surface of the gear flank as the gear is turned. This ensures that the measuring probe is orientated perpendicular to the surface for the entire measured line. The recorded coordinates are distributed equally in length of roll , although they are displayed in the arc length dimension.
The two differently operating measurement system deliver very different profile data. While the HRTS delivers a data set displaying the involute shape, the P40 delivers a profile that does not contain that shape. This requires that, for the profilometer, a form removal is to be performed in order to obtain the primary profile .
The sampling intervals differ as well. While the sampling intervals of the profilometer are equidistant with respect to a chord close to the surface of the tooth, the sampling intervals of the P40 are not. They are regularly distributed along roll angle instead.
For both types of instruments, a separation of the larger scale components of the texture, the waviness and the small scale texture features is realised by applying a Gaussian filter or a Gaussian regression filter.
3. Investigations of the Roughness of an Industrial Gear
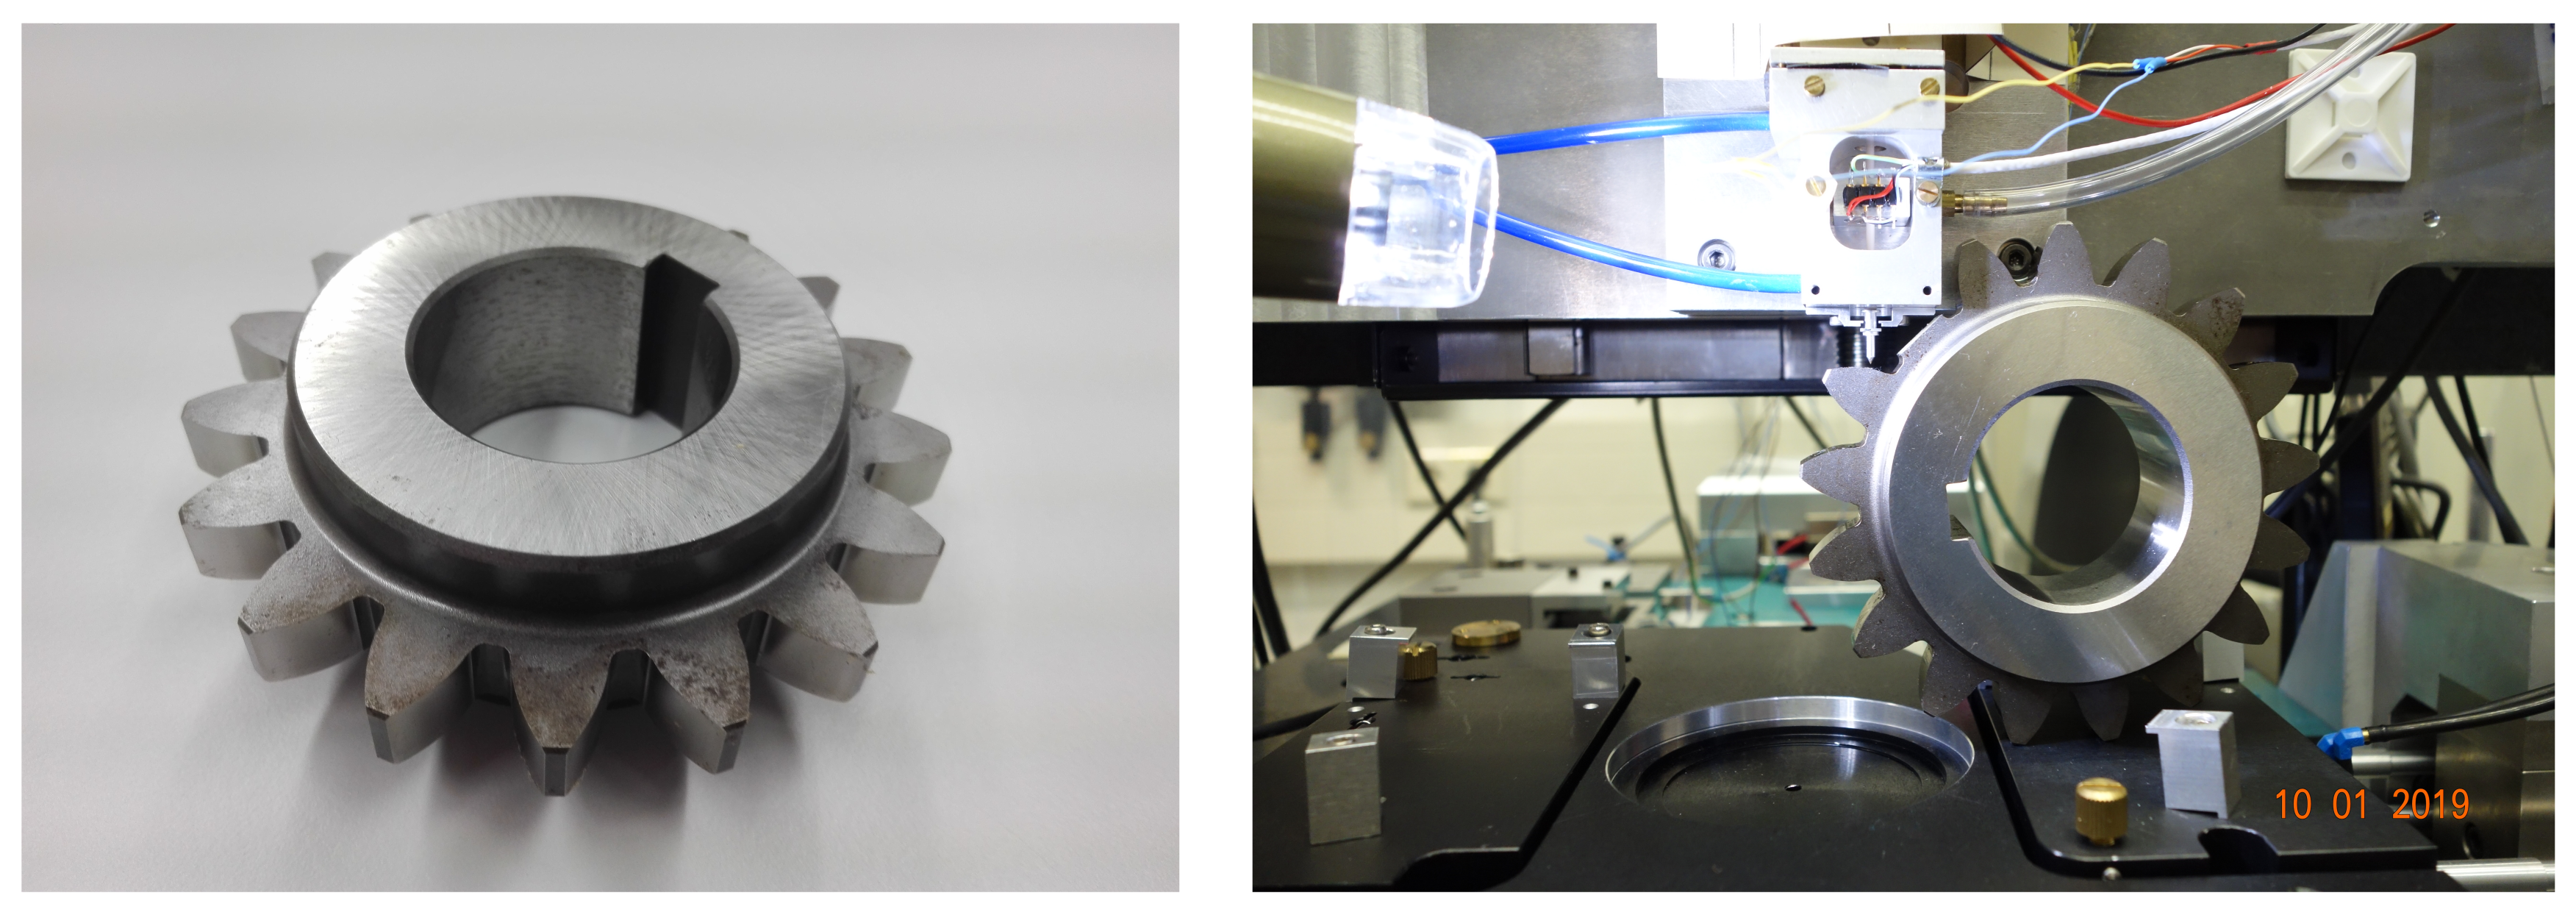
To provide a physical measurement standard, PMS, that is sufficiently representative of the gears used in the industry, a typical work piece has been chosen as the master work piece (see Figure 4). The master work piece represents a typical gear of a common industrial application. It is a spur gear as used in reverse gears in the automotive industry with a base radius of mm and teeth.
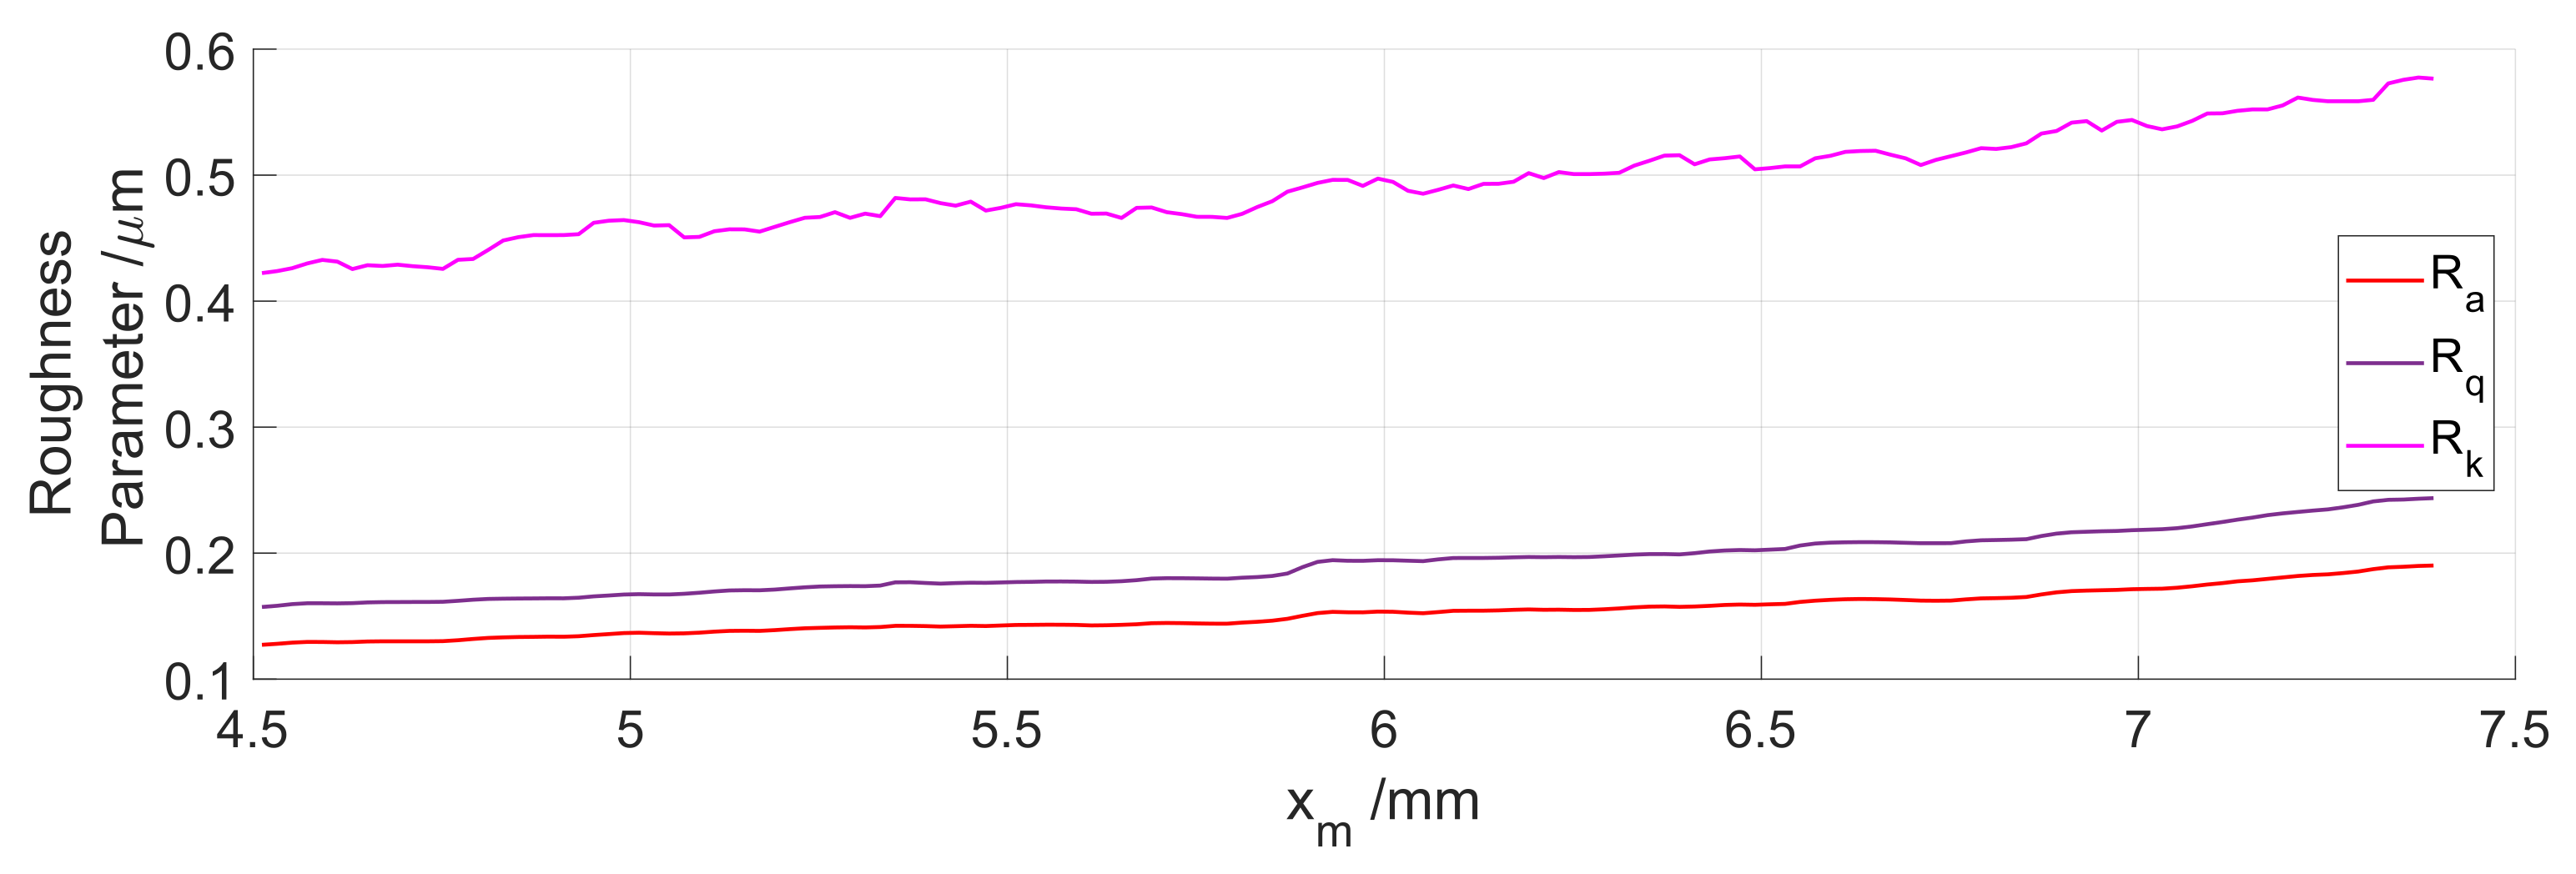
The surfaces are finished by gear-grinding processes with rolling in accordance with the involutes. Even after super fine end finishing without rolling, the roughness features are visible and vary between root and tip of a tooth. Figure 5 shows a variation, the so-called gradation, of roughness parameters , and as functions of the position of the evaluation interval of the roughness profile on the master work piece.
To facilitate the examination of a tooth flank of the master work piece by the PTB home built profilometer HRTS, one of the teeth has been removed. Then, profiles have been scanned on the exposed tooth from the root to the tip. Scanning a tooth on the gear enables a comparison measurement on the P40 instrument. The scanning direction is referred to as x-direction. The profiles have been processed by form removal and waviness filtration.
The measured profiles have a length of 8 mm. The roughness parameters in Figure 5 have been obtained, as explained in Section 2.5, by using an evaluation length of mm. The roughness parameters as functions of the positions of evaluation intervals , i.e., as , and , clearly show a change between root and tip region of a tooth. This reveals that the relocalisation of the evaluation region is an important issue. For the design of a physical measurement standard, this issue includes two aspects:
- One aspect is that the dependence of the roughness parameters on the position of the evaluation region should be negligible by preparing a surface texture that is homogeneous.
- The other aspect is the macroscopic geometry which is the involute shape with root and tip of a tooth and its orientation and position relative to the base circle.
The involute shape is a function of the base radius . In order to remove the form from the profile measured by the HRTS, the data points of the cartesian system of the profiler are related to the involute shape and orientation, as explained in Section 2.2. This optimization procedure has specifically been developed for these investigations and is not available in any kind of software of commercial form testers and profilers. Therefore, an alternative form operator that is more easily obtainable, such as a smoothing spline, has been employed to compare the influence of form operation.
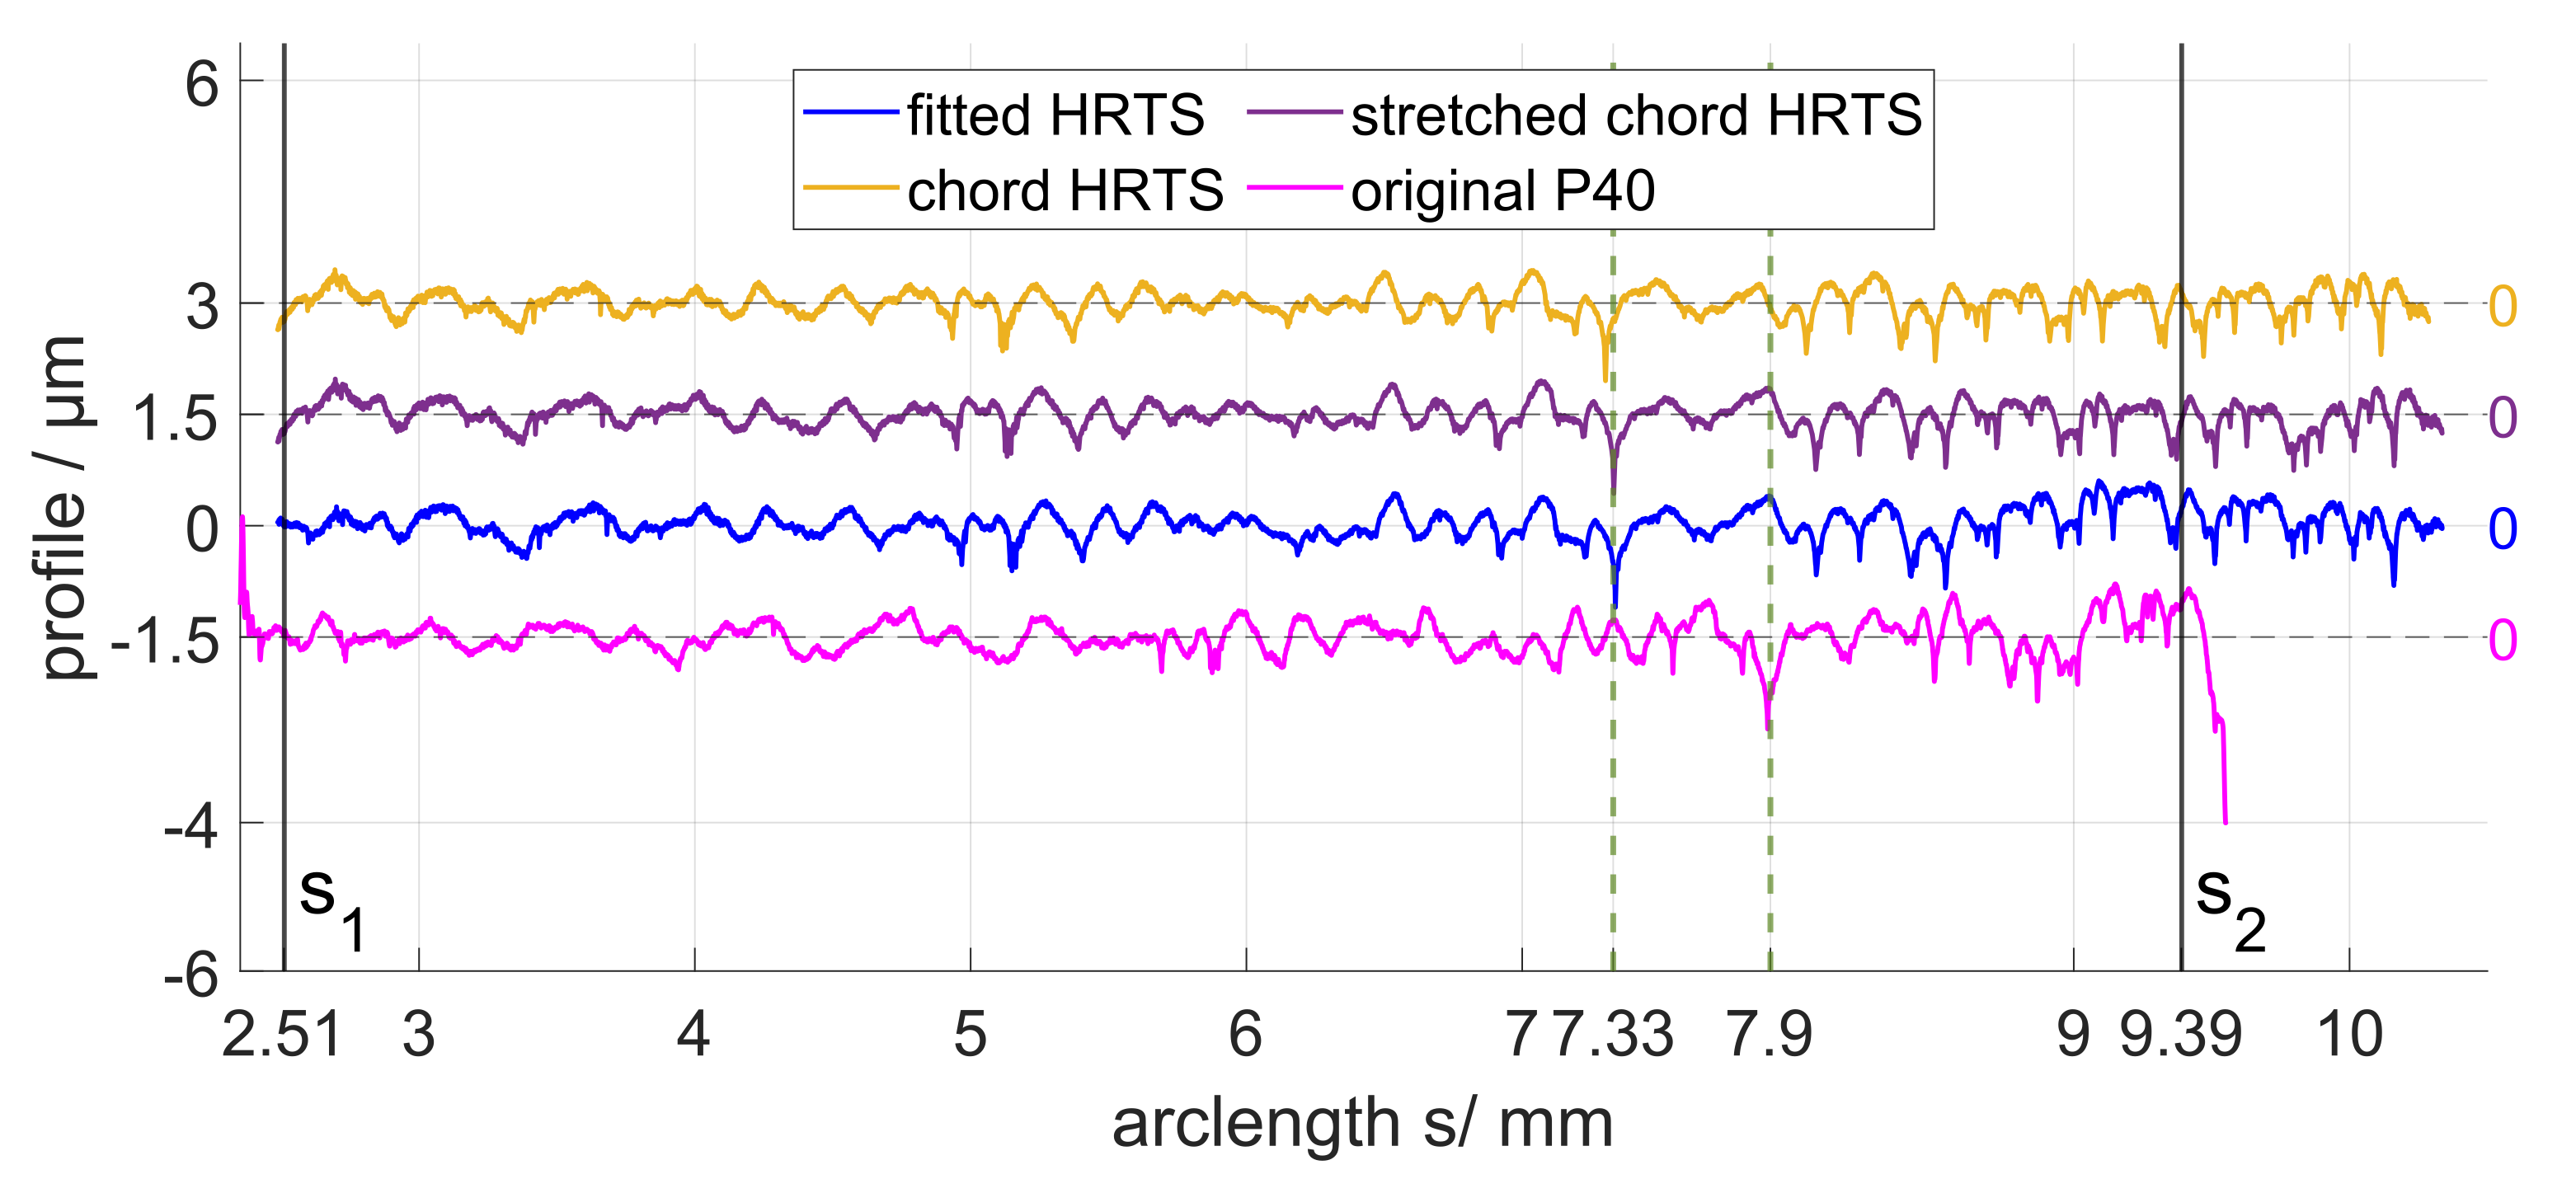
To compare the gear measuring system P40 with the profilometer HRTS, the same tooth of the master work piece has been scanned with both instruments. Furthermore, the HRTS measured profile has been processed by three different methods resulting in four types of primary profiles :
- P40 measurement system;
- HRTS: form removal via the fitting algorithm delivering lateral coordinates on the arc of the involute and vertical perpendicular to the arc;
- HRTS: form removing the form via a smoothing spline filter delivering lateral coordinates on a chord;
- HRTS with spline but stretched according to the arc length.
All primary profiles have been filtered with a cut off wavelength mm.
In order to reduce the effect of the dependency of the roughness parameters on the position of the evaluation interval, the size of the interval has been increased by using more sections such that the interval size now takes mm. A larger evaluation length means a larger range to average roughness features.
The influence of the form operation on the appearance can be observed when regarding the distinct characteristic deep valleys and peaks (see Figure 6). The profiles measured by the HRTS system deviate from the profile measured with the P40 system, mainly due to the different reference lengths. The P40-profile is measured with data points equally distributed along the roll angle; thus, the roll length is measured, but it is plotted as a function of the position on the arc of the involute and the arc length.
Identifying distinct peaks such as the deep valley around mm for HRTS-profiles and mm for the P40-profile shows the same distinct properties of the profile on the master work piece for measurements on both measurement systems.
However, this means that in addition to a different lateral distribution, distinct features at the edge of the evaluated parts of the profile can slip in or out of the evaluation process for the roughness parameters. This effect can be seen when comparing the HRTS-profiles with the P40-profile in Figure 6.
Table 1 lists the values of the roughness parameters obtained from the four different roughness profiles. To estimate the uncertainty range of the values of the roughness parameters by using the larger evaluation length of mm, the position of the evaluation interval has been shifted along the scanning direction by mm.
The results obtained using the spline filter for form removal deviate only slightly from the results obtained by subtracting a fitted involute. This shows that using a spline filter can be a valid alternative to the fitting algorithm even on such a curved surface.
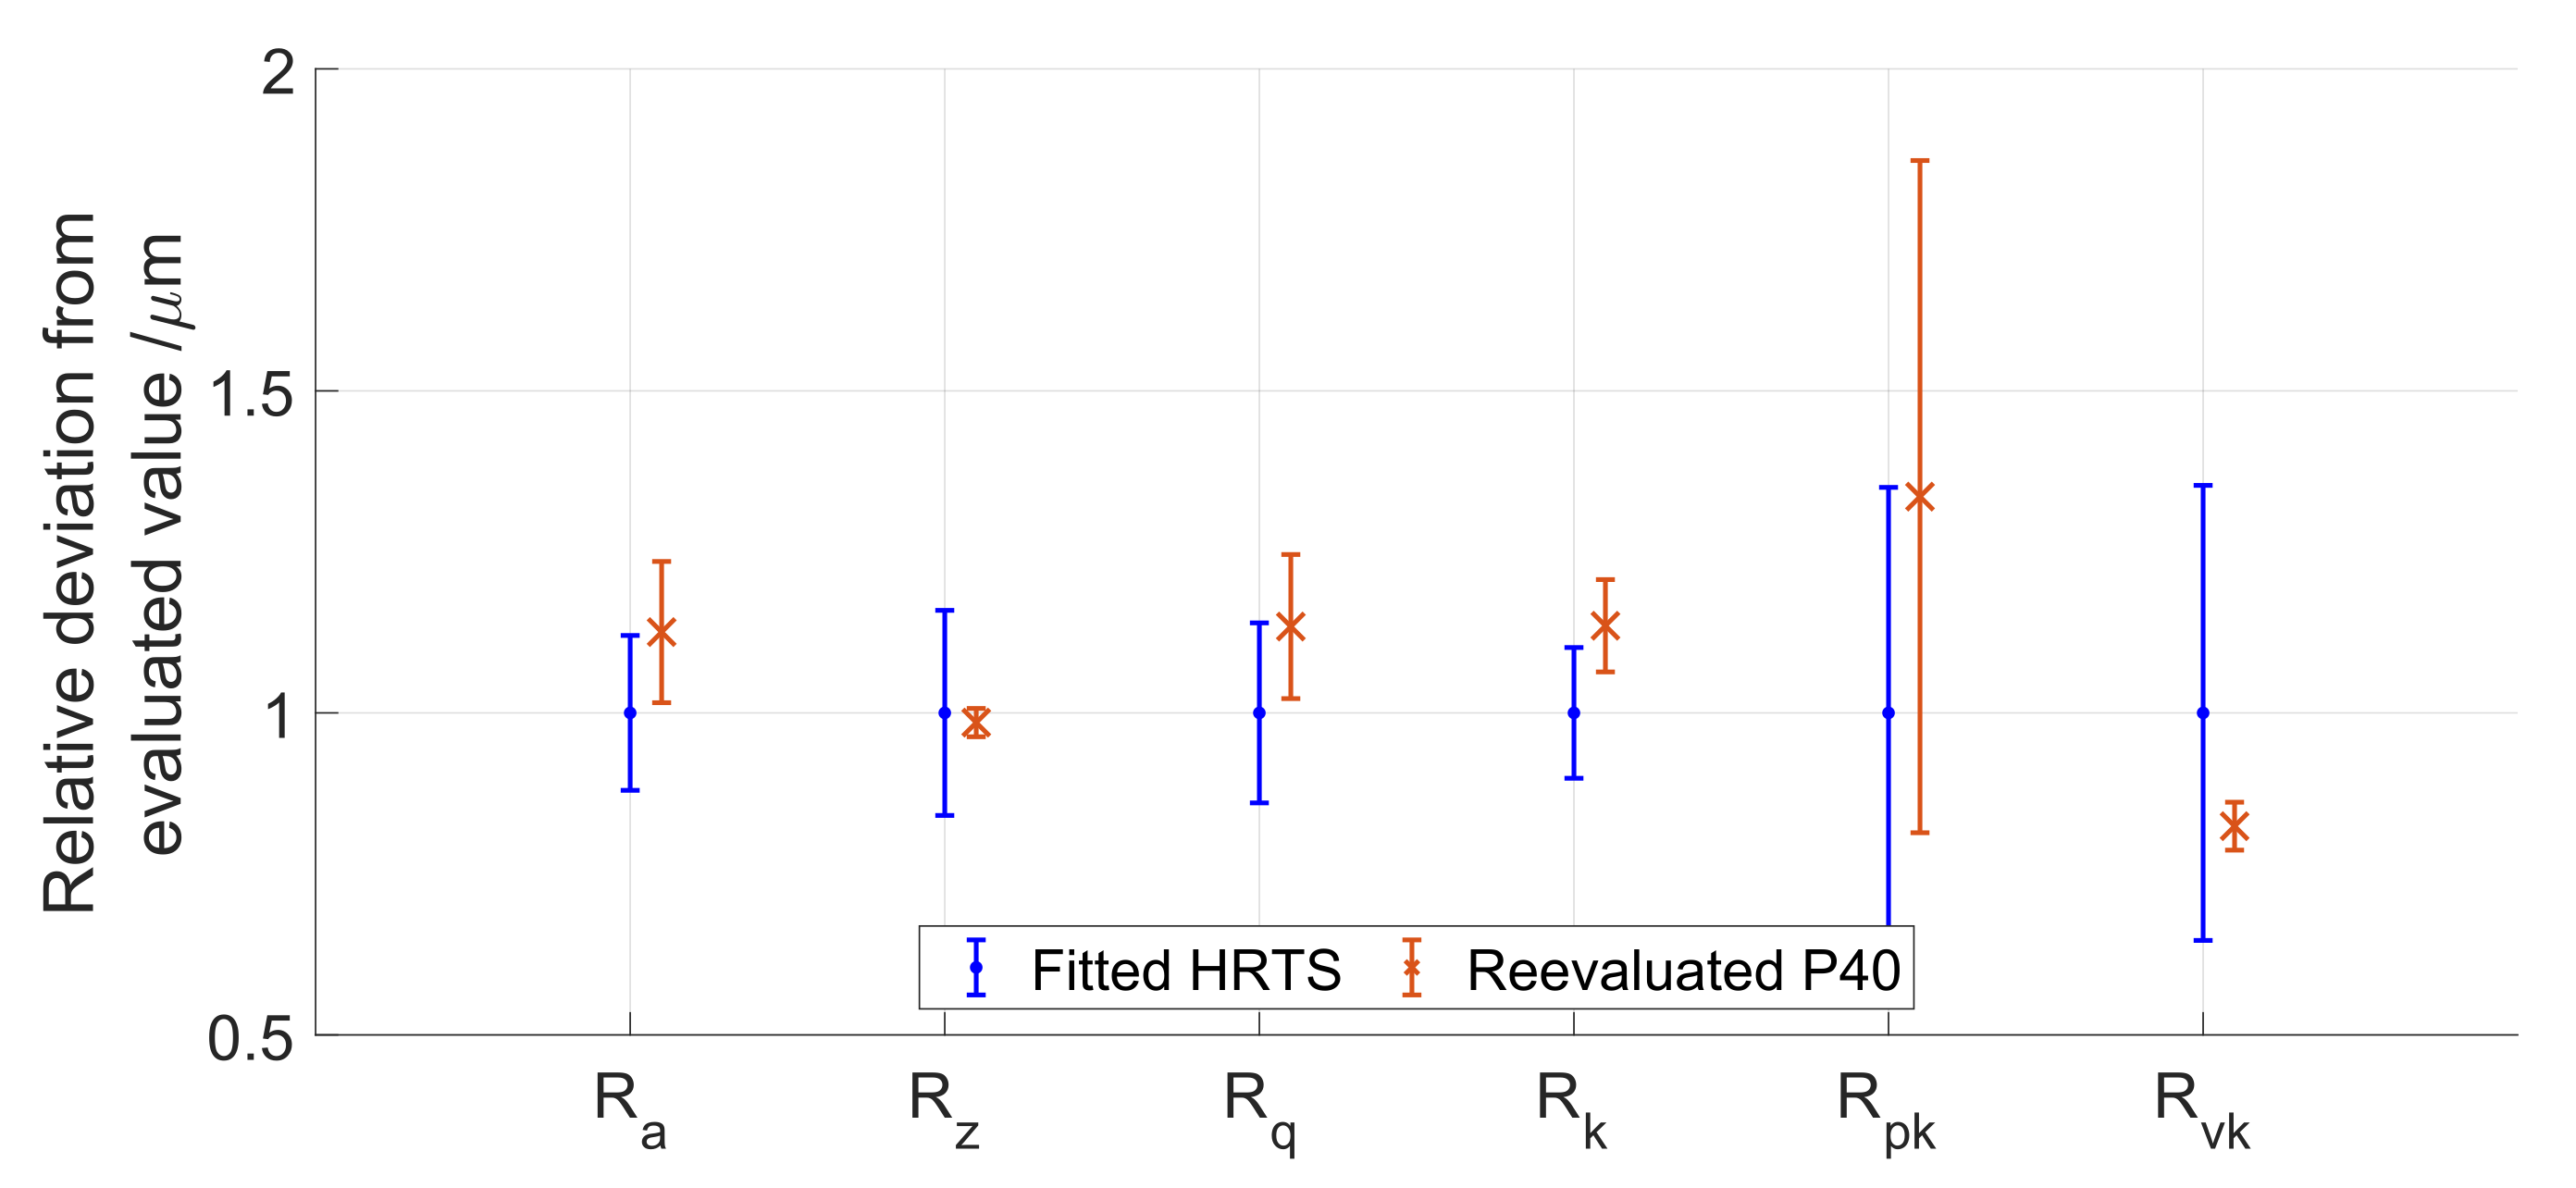
It is apparent that many parameters evaluated from P40-profiles deviate distinctively from the parameters evaluated from the HRTS profile. This is further illustrated in Figure 7, which shows the relative deviations of the P40-measurements from the reference values from the HRTS-measurements, including the possible range of values discussed above.
Implications
The distinct deviations between the evaluations using the two measurement systems imply two important requirements for the roughness evaluation and, therefore, for the design of a roughness standard:
- In the case of surfaces with heterogeneous textures, the position of the evaluated interval can have significant influences on the values of roughness parameters. Therefore, physical measurement standards, PMS, are designed either with texture features with a periodicity of an integer fraction of the section length or with a homogeneous texture.
- The type of reference system influences the position of the evaluation interval, which in the case of heterogeneous and non-periodic textures has an influence on deviations of roughness parameter values.
4. Physical Measurement Standard (PMS) Representing Roughness on Involutes
4.1. Design of the PMS
The goal is to realize an artefact as PMS for calibrating measurement instruments that determine roughness on gear teeth. The requirements are that the roughness parameters represented by the PMS should adhere to the following:
- Are reproducible and have to be insensitive to the positioning of the evaluation interval;
- Can be traced back to the international unit meter of the dimension length.
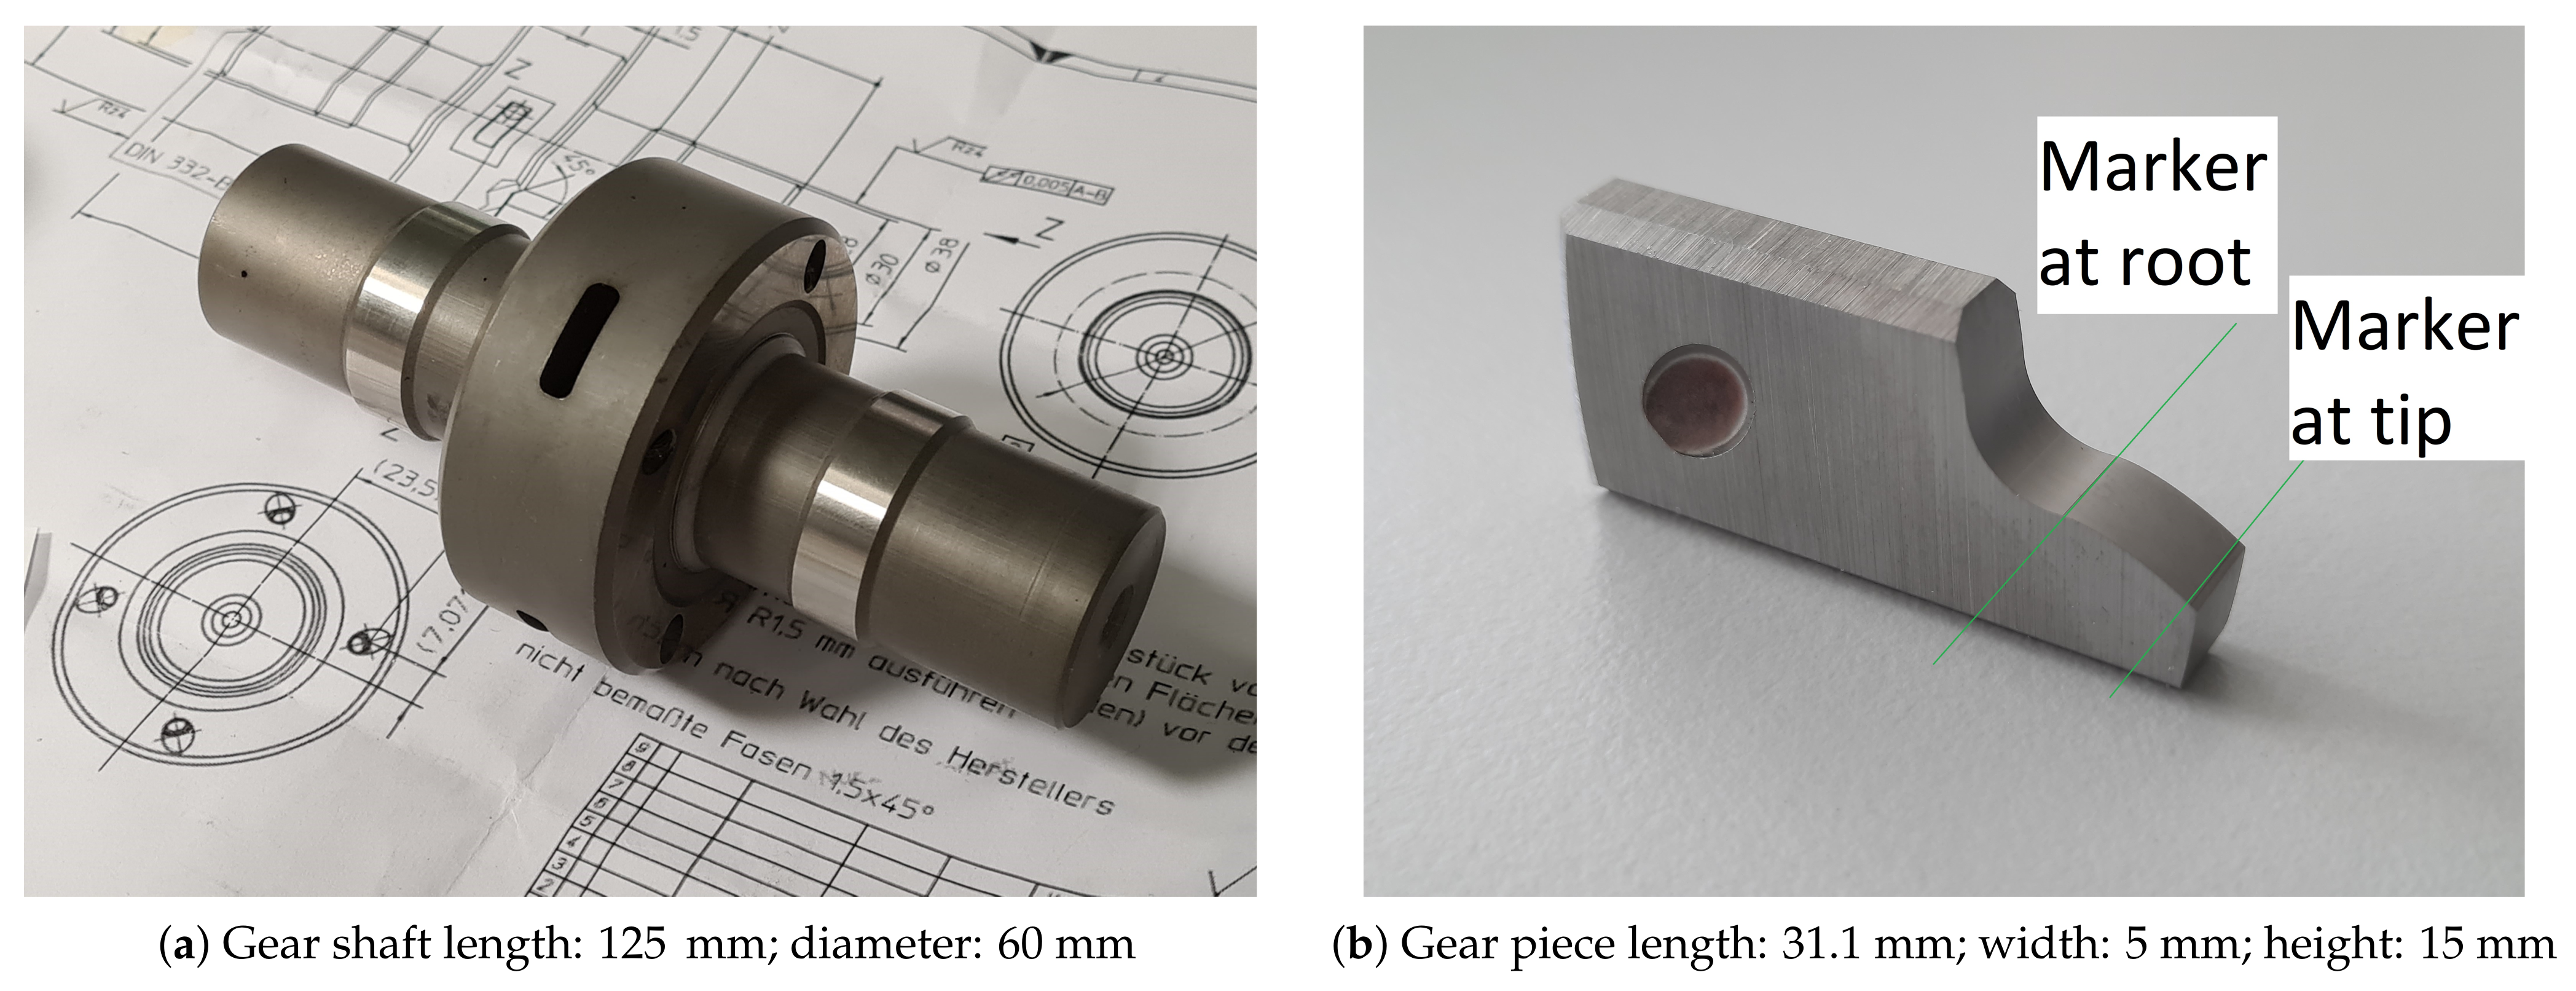
To facilitate calibration procedures using calibrated profilometers, a modular object resembling a gear with shaft and gear piece has been designed. This ensures that the gear piece, representing a tooth, can be removed from the shaft such that it can be measured with a profilometer separately. When combined, the entire standard can be examined by using a gear measurement system and its roughness probes. The gear shaft then provides the reference to the entire gear geometry with shaft axis direction and position and with base radius . The modular structure of the standard is shown in Figure 8.
The axis of the gear shaft has to be coaxial to the axis of the involute on the gear piece when the two modules are assembled. The measurement processes of the gear shaft and the gear piece are independent in the case of this object and require sufficiently high precision. Furthermore, consistency requires an exact adjustment of the gear piece when mounting it on the shaft.
The gear shaft of the PMS ensures that the profile can be measured similarly to a common gear on a gear measuring system. This mainly means that the measurement can be performed by using rolling movements. It consists of an axis with two reference bands that enable determining the axis precisely and of a central cylinder with four eroded deepenings that are precisely manufactured and hold the gear piece. The gear piece is positioned by using a skew screw and a steel ball to ensure three-point contact of the gear piece within the gear shaft. Using this technique, the surface centre of all three surfaces of the gear piece can be positioned with a reproducibility of m.
The gear shaft can be used for gear pieces that embody mm. Smaller base radii cause the correct position of the root of the involute to be located within the body of the gear shaft. Such profiles can, therefore, not be realised, including the root area of the involute.
For the gear piece, a manufacturing method is needed that meets both requirements concerning the design of the texture following an involute geometry and, furthermore, has to be applicable on hardened steel such that diamond turning is not an option. The most appropriate process that can be realized at PTB, therefore, is Electrical Discharge Machining (EDM). The gear piece is manufactured from a hardened steel similar to the materials used in actual gears in production. This ensures that the PMS resembles gears from production also in its material properties and provides necessary robustness. Super fine roughness standards are commonly manufactured from a copper substrate with a layer hardened by nickel phosphorus that is thick enough to be usable for structuring. This allows surfaces to be manufactured via turning with a highly determined diamond tip. It enables the roughness profile to be configured before production on a m level.
The PMS, however, faces additional requirements and is, therefore, not manufactured via diamond turning. While high performance profilometers impose small contact forces in the mN range, gear measurement systems often use much higher forces. To withstand these contact forces, the gear piece of the PMS is made of hardened steel. PMS’s made of this material are commonly used in gear metrology and maintenance procedures to prevent rust and to keep the artefact clean are well established. In this manner, it is possible to perform roughness measurements on the PMS both on classical profilometers and gear measurement systems.
The gear piece consists of a shank that fits into the gear shaft and ensures the precise positioning of the gear piece and the actual embodied involute roughness profile. It has an edge for the steel ball to lie in. When performing measurements on profilometers, one has to account for their limited vertical measuring range. This can be optimised by tilting the gear piece so that the necessary vertical lift of the probe is minimised.
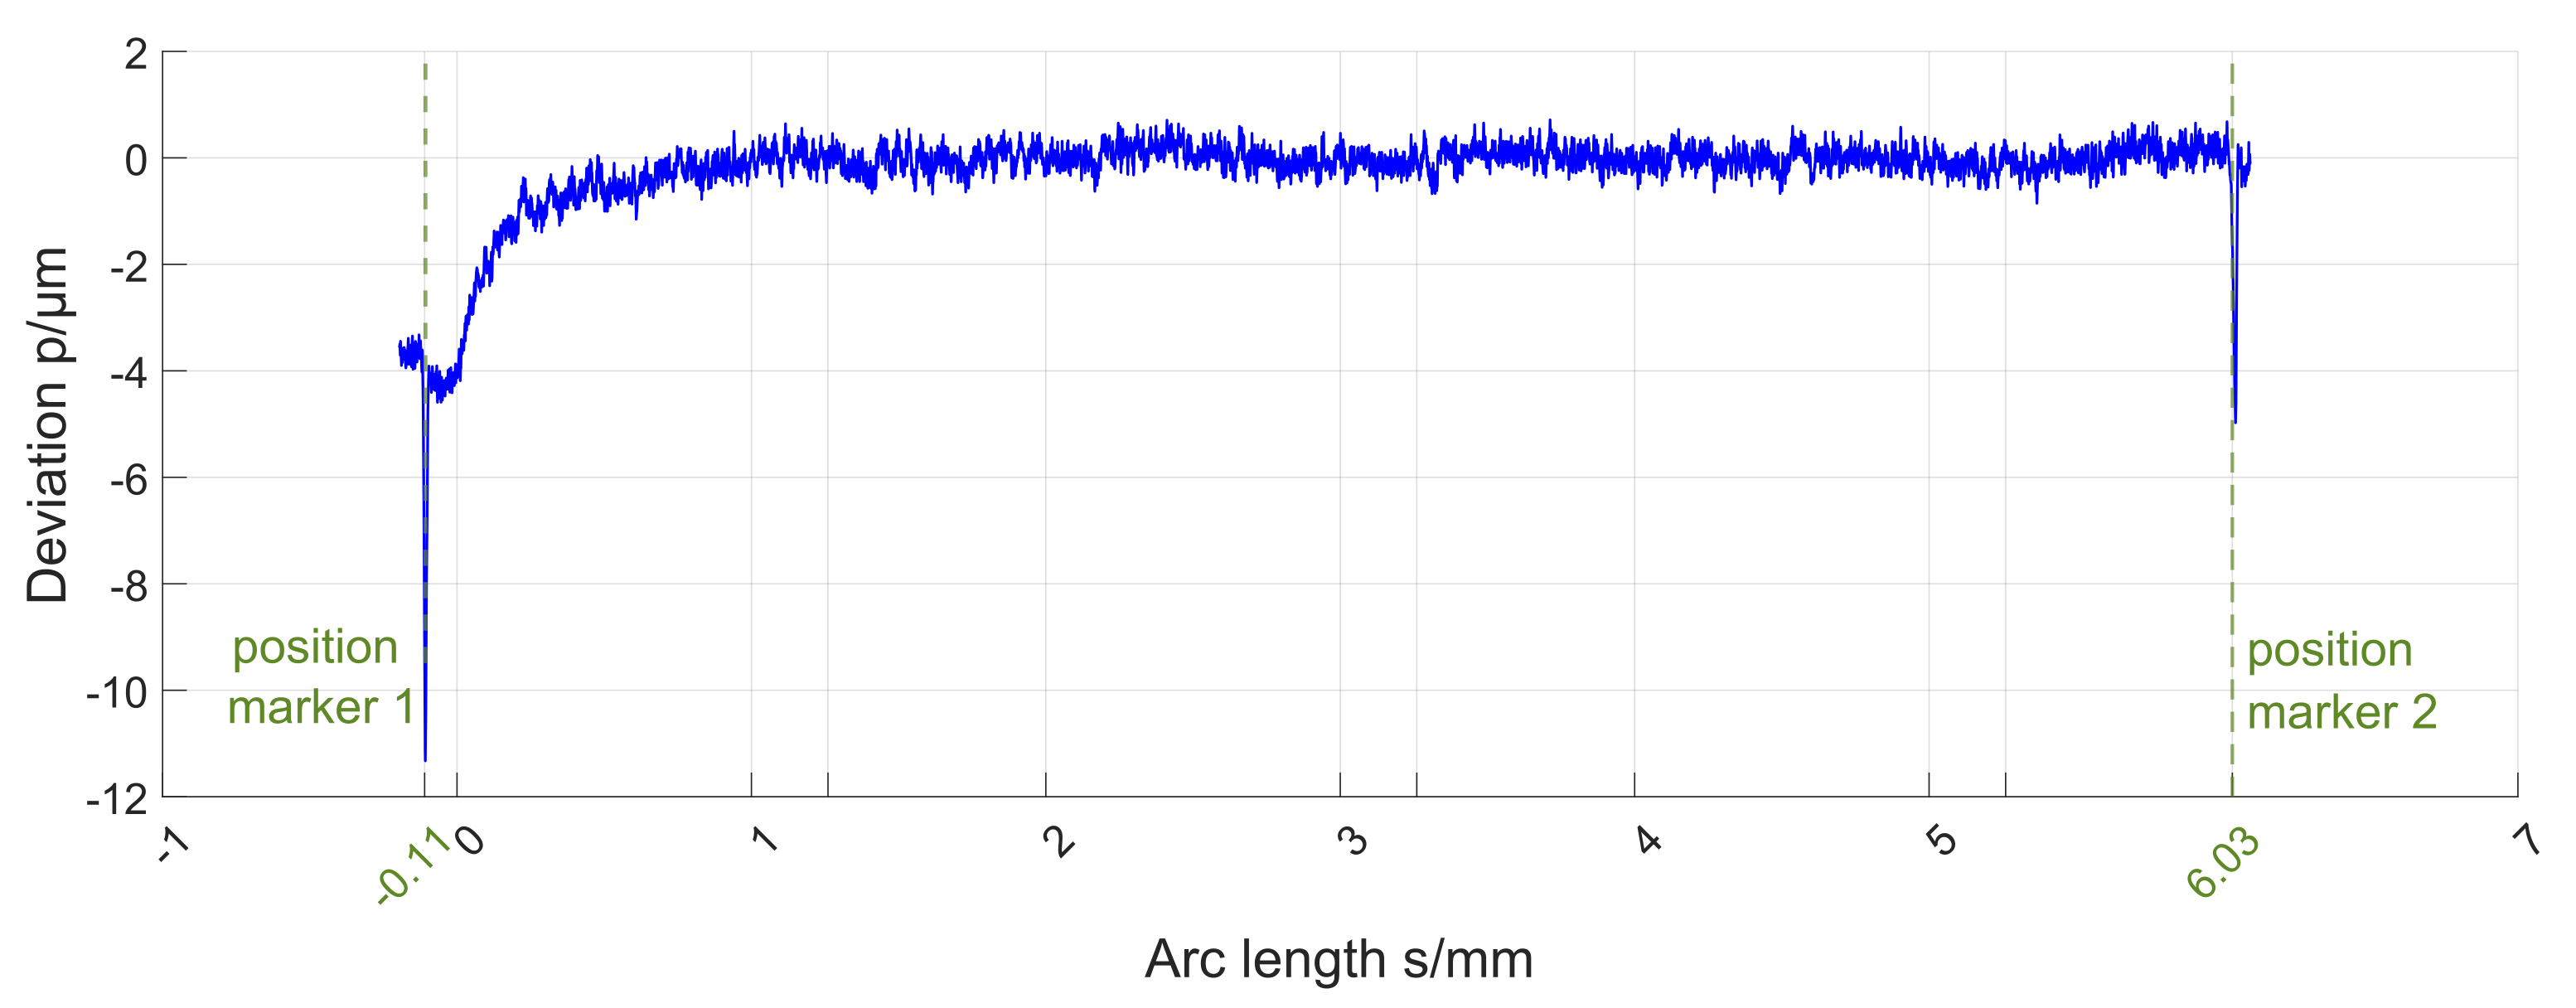
The embodied involute determines the used base radius and the gear piece has to be manufactured accordingly. The involute itself is marked with two approximately 5 m deep notches. These are used to facilitate orientation on the profile. The positions of these markers, also referred to as fiducials (in roll length/arc length and the Cartesian coordinate system), are known so that profile measurements can be aligned with these fixed points in the coordinate systems. The primary profile after the form removal, as displayed in Figure 9, clearly shows those fiducials in the root and tip part of the profile.
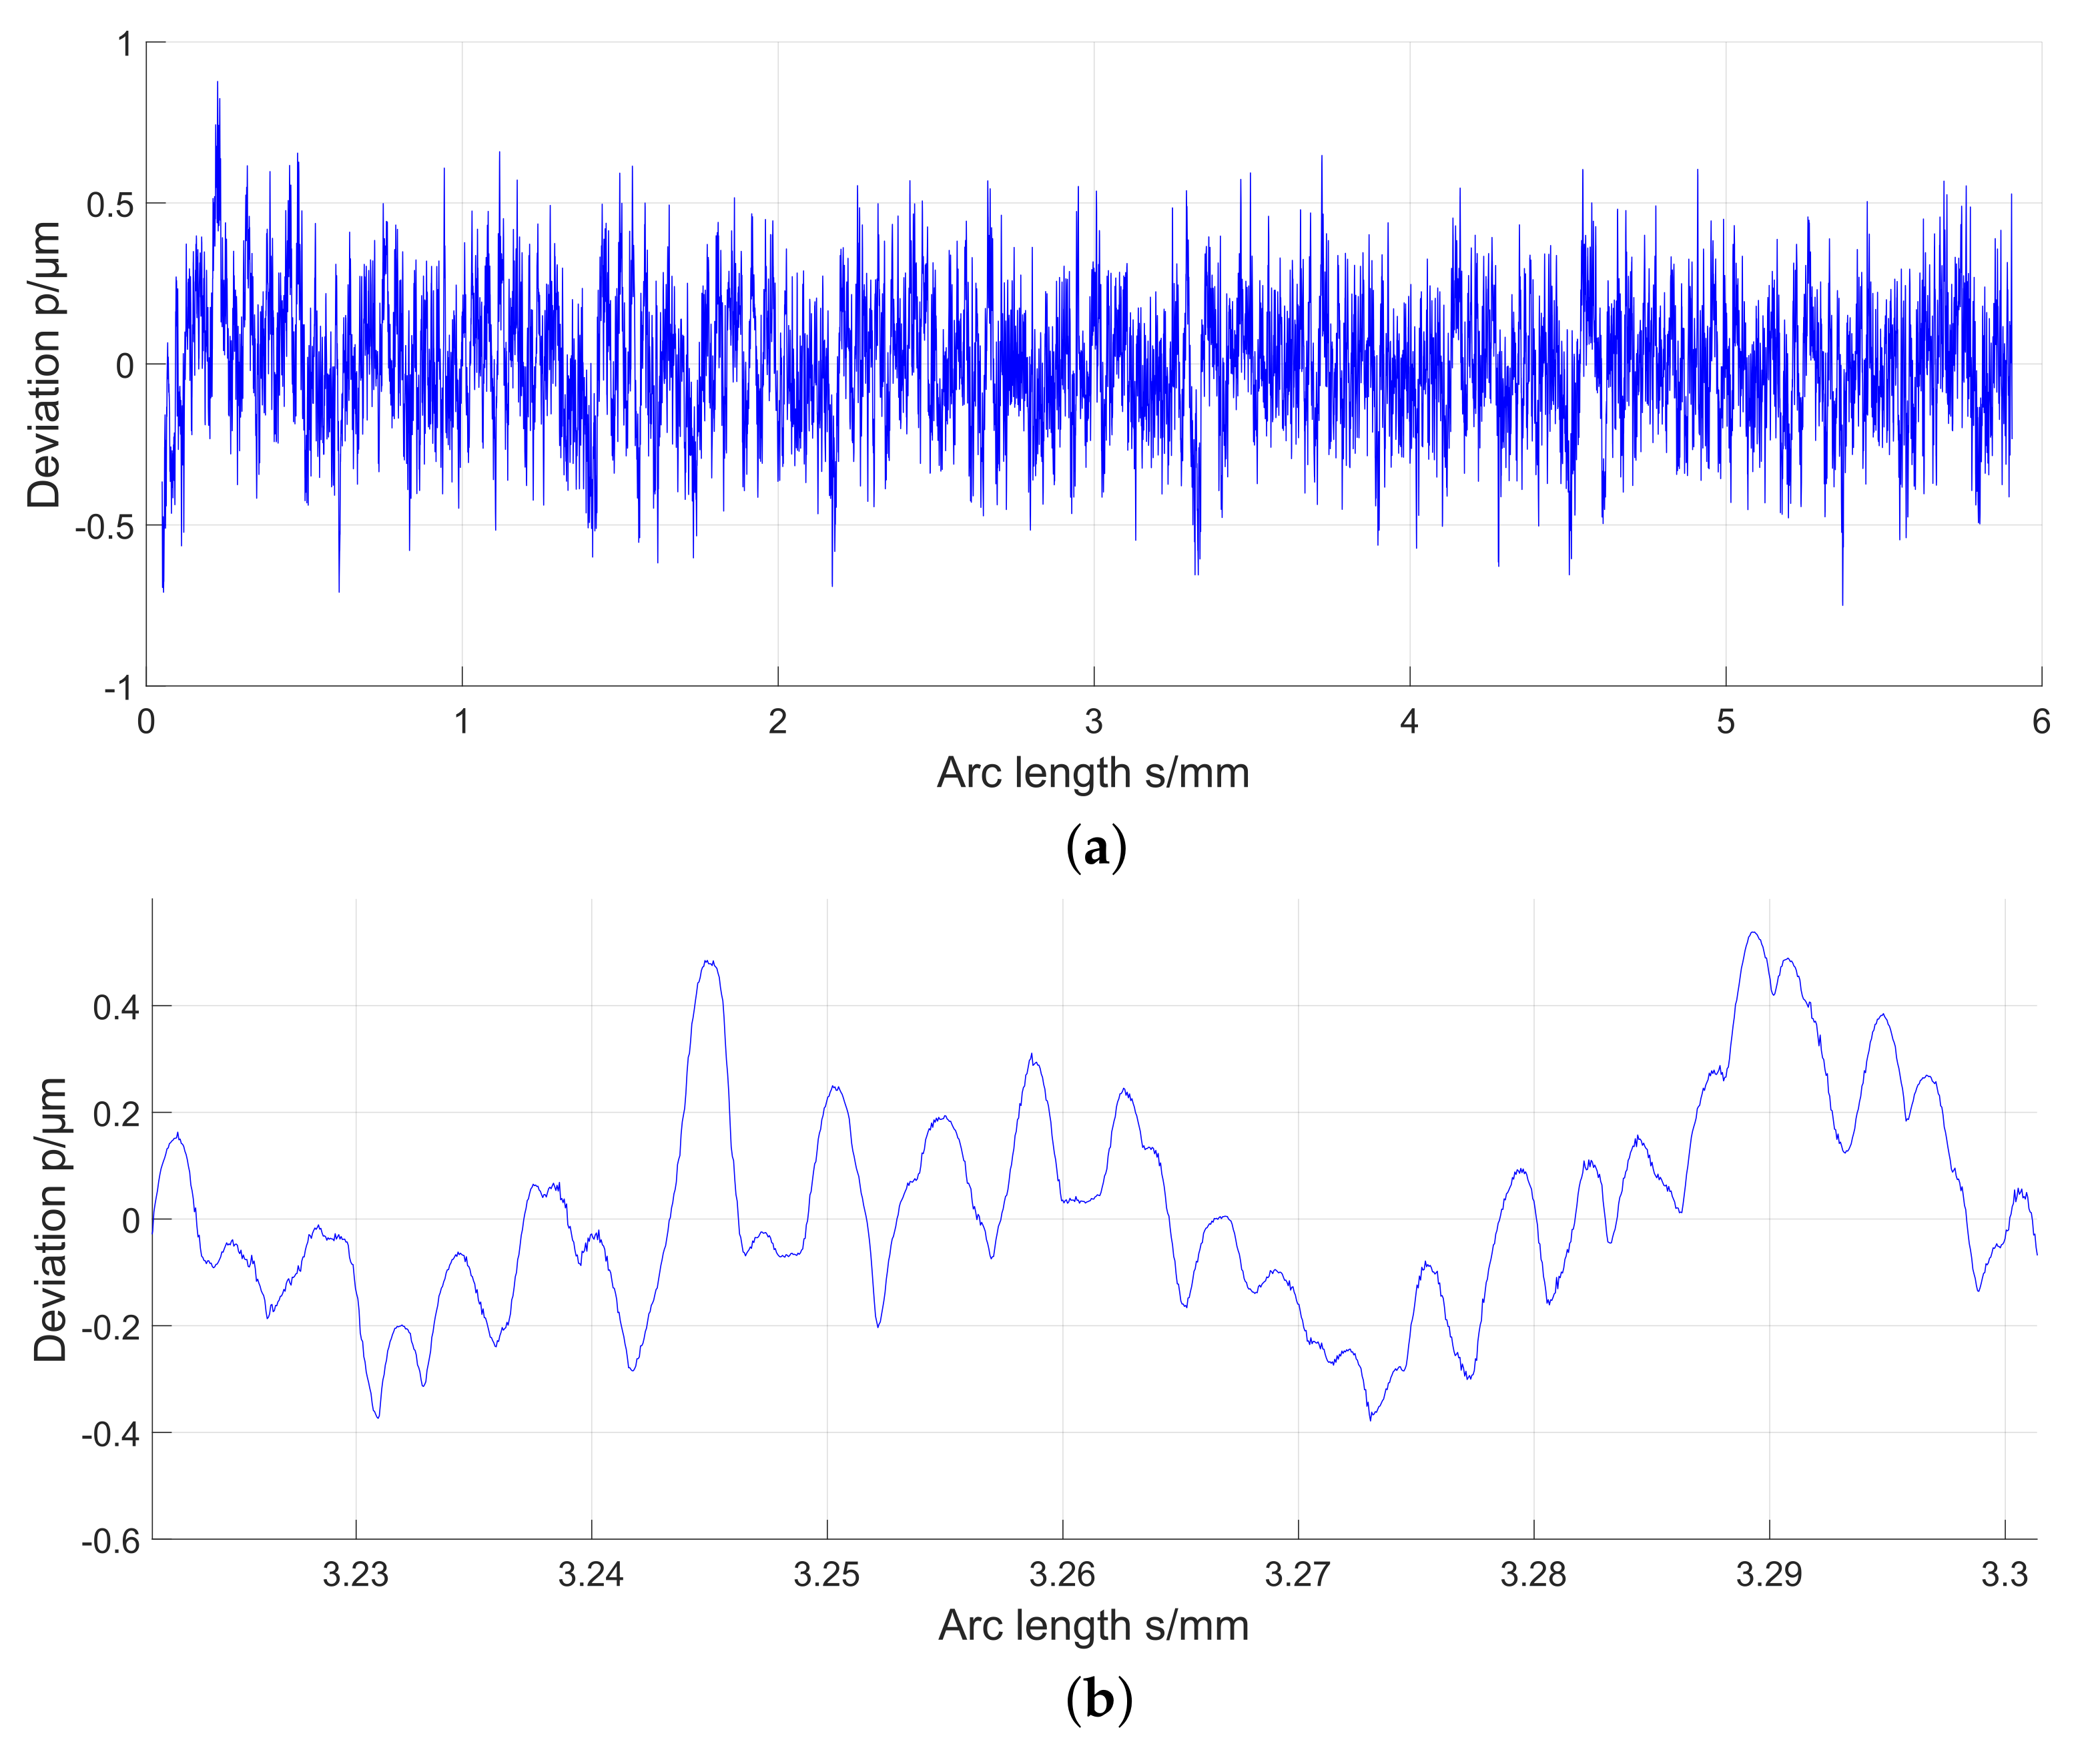
Manufacturing the shape of the involute by EDM creates a profile with the heights following a homogeneous and normal distribution (see Figure 10). Although not periodic, this ensures that the roughness evaluation is relatively independent of the exact position of the evaluation subprofile, reducing the overall variance of roughness evaluation results.
4.2. Calibration of the PMS
The measurements for the calibration of the PMS are performed by using the HRTS described in Section 2.6. Showing the profile obtained via the fitting algorithm not only shows the structure of the roughness profile but also the two distinct valleys of the markers at the root and tip part of the profile. These simplify the orientation on the profile but are excluded from the filtered roughness profile to prevent distortions.
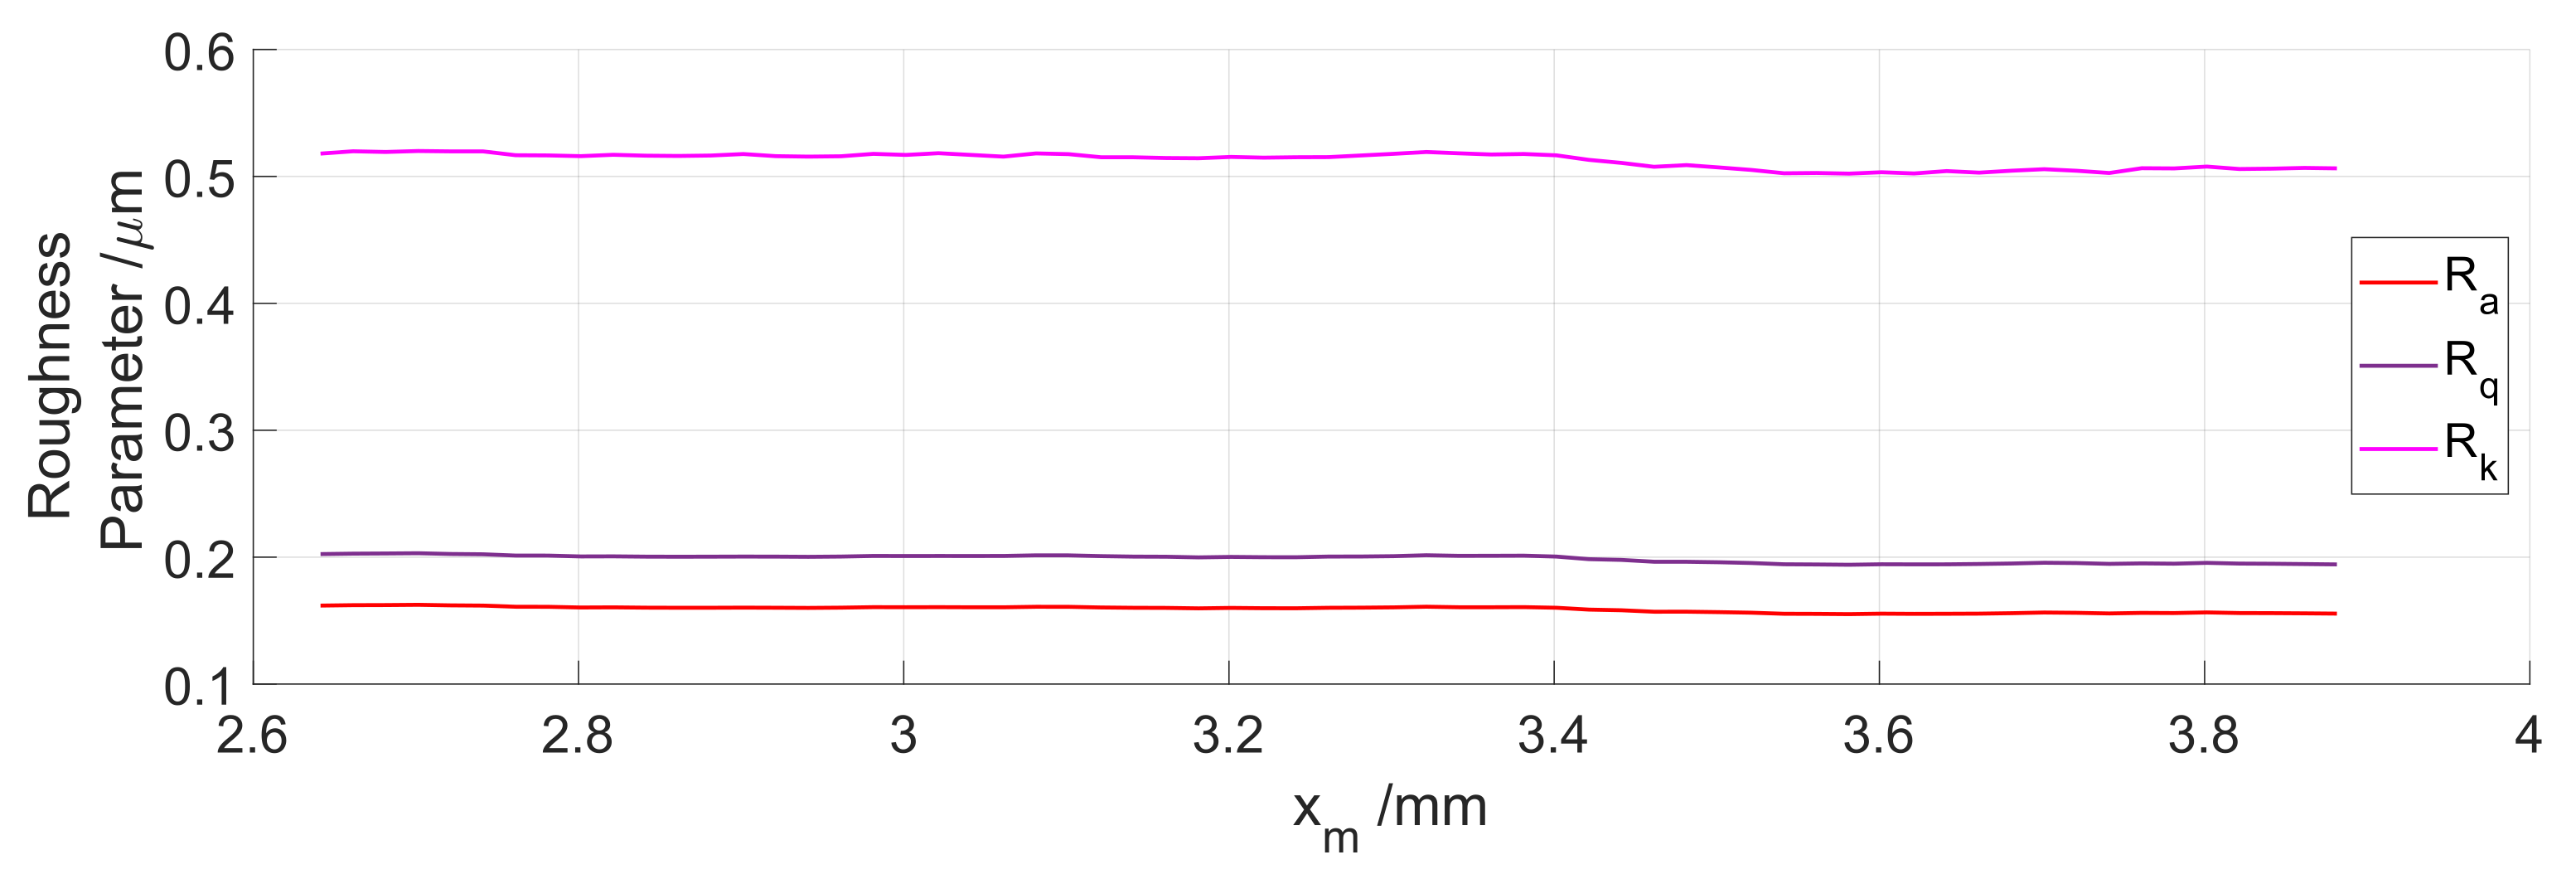
The roughness profile of the PMS, shown in Figure 10, consists of peaks and valleys within the range of m. There is no noticeable change in the characteristics along the arc length. In contrast to the results of the measurements on the master work piece shown in Figure 5), the roughness parameters remain almost constant for all positions of the evaluation intervals (see Figure 11). By manufacturing a much more homogeneous profile, the sensitivity of the evaluation towards the position of the evaluation subprofile is reduced and the metrological applicability is improved.
Measurement uncertainties are influenced by the instrument, the measurement object and the environment. The contributions due to the instrument and its environment are small compared to the characteristics of the object. Previous investigations have already shown how the sensitivity of roughness parameters to the heterogeneity of textures can be determined [27]. For the industrial gear surface, it has been shown that texture varies along the tooth and, therefore, causes a dependency of the roughness parameters on the location of the evaluation region (see Section 3). The gear piece of the PMS has been manufactured, aiming at a high degree of homogeneity of the texture. Still, there is a small residual influence of the randomness of the texture features that needs to be accounted for as an uncertain contribution. It has been observed that the contribution is significantly larger than the uncertainty contribution of the HRTS measurement process. The relocalization of the evaluation region and whether the evaluation length is that on the arc of the involute or on its chord determine which texture features are included. Therefore, the following parameters influence the uncertainty of the roughness parameters:
- Position of the evaluated partial profile in tooth width direction;
- Position of the evaluation region in involute direction;
- Length of the evaluation region;
- Form operator: removal of fitted involute and removal of a smoothing spline with or without scaling correction with respect to chord vs. arc bow size.
According to the “Guide to Measurement Uncertainty” and its supplementary documents [28], uncertainty has been estimated by varying the relevant parameters of the evaluation.
Roughness evaluation for the calibration values is performed by following the relevant ISO standards ([21,23,24] and their successors [16,22]), with an evaluation length of mm = 4 mm.
The specific values of the roughness parameters will not be published to ensure the possibility of future round robin tests but their magnitude and the determined measurement uncertainties are presented in Table 2.
The values of the roughness and material ratio parameters are in the order of magnitude of common gears in production. The profile does not show the typical asymmetry of deep valleys and small peaks but shows a normally distributed profile. This is demonstrated in the symmetry of and .
As the profile is much more homogeneous than the profile on the example gear, the volatility of the roughness evaluation results towards the position of the evaluation subprofile is much smaller. This in addition to utilising three repetitions of eleven measurement lines on the gear piece results in a measurement uncertainty that is smaller in comparison to the range of calculated values of the evaluation of the example gear.
4.3. Outlook: Manufacturing a Periodic Profile via Grinding
The roughness of the surface of the PMS gear piece has been manufactured in order to minimize effects of texture inhomogeneities. On the other hand, the goal has been to apply texture features that realistically represent the functionality of a gear. This second requirement has not yet been fully met. Therefore, alternatives to electrical discharge machining are sought after, especially those that can produce textures that resemble better gear textures. Investigations of manufacturing periodic profiles of hardened steel by grinding have already started.
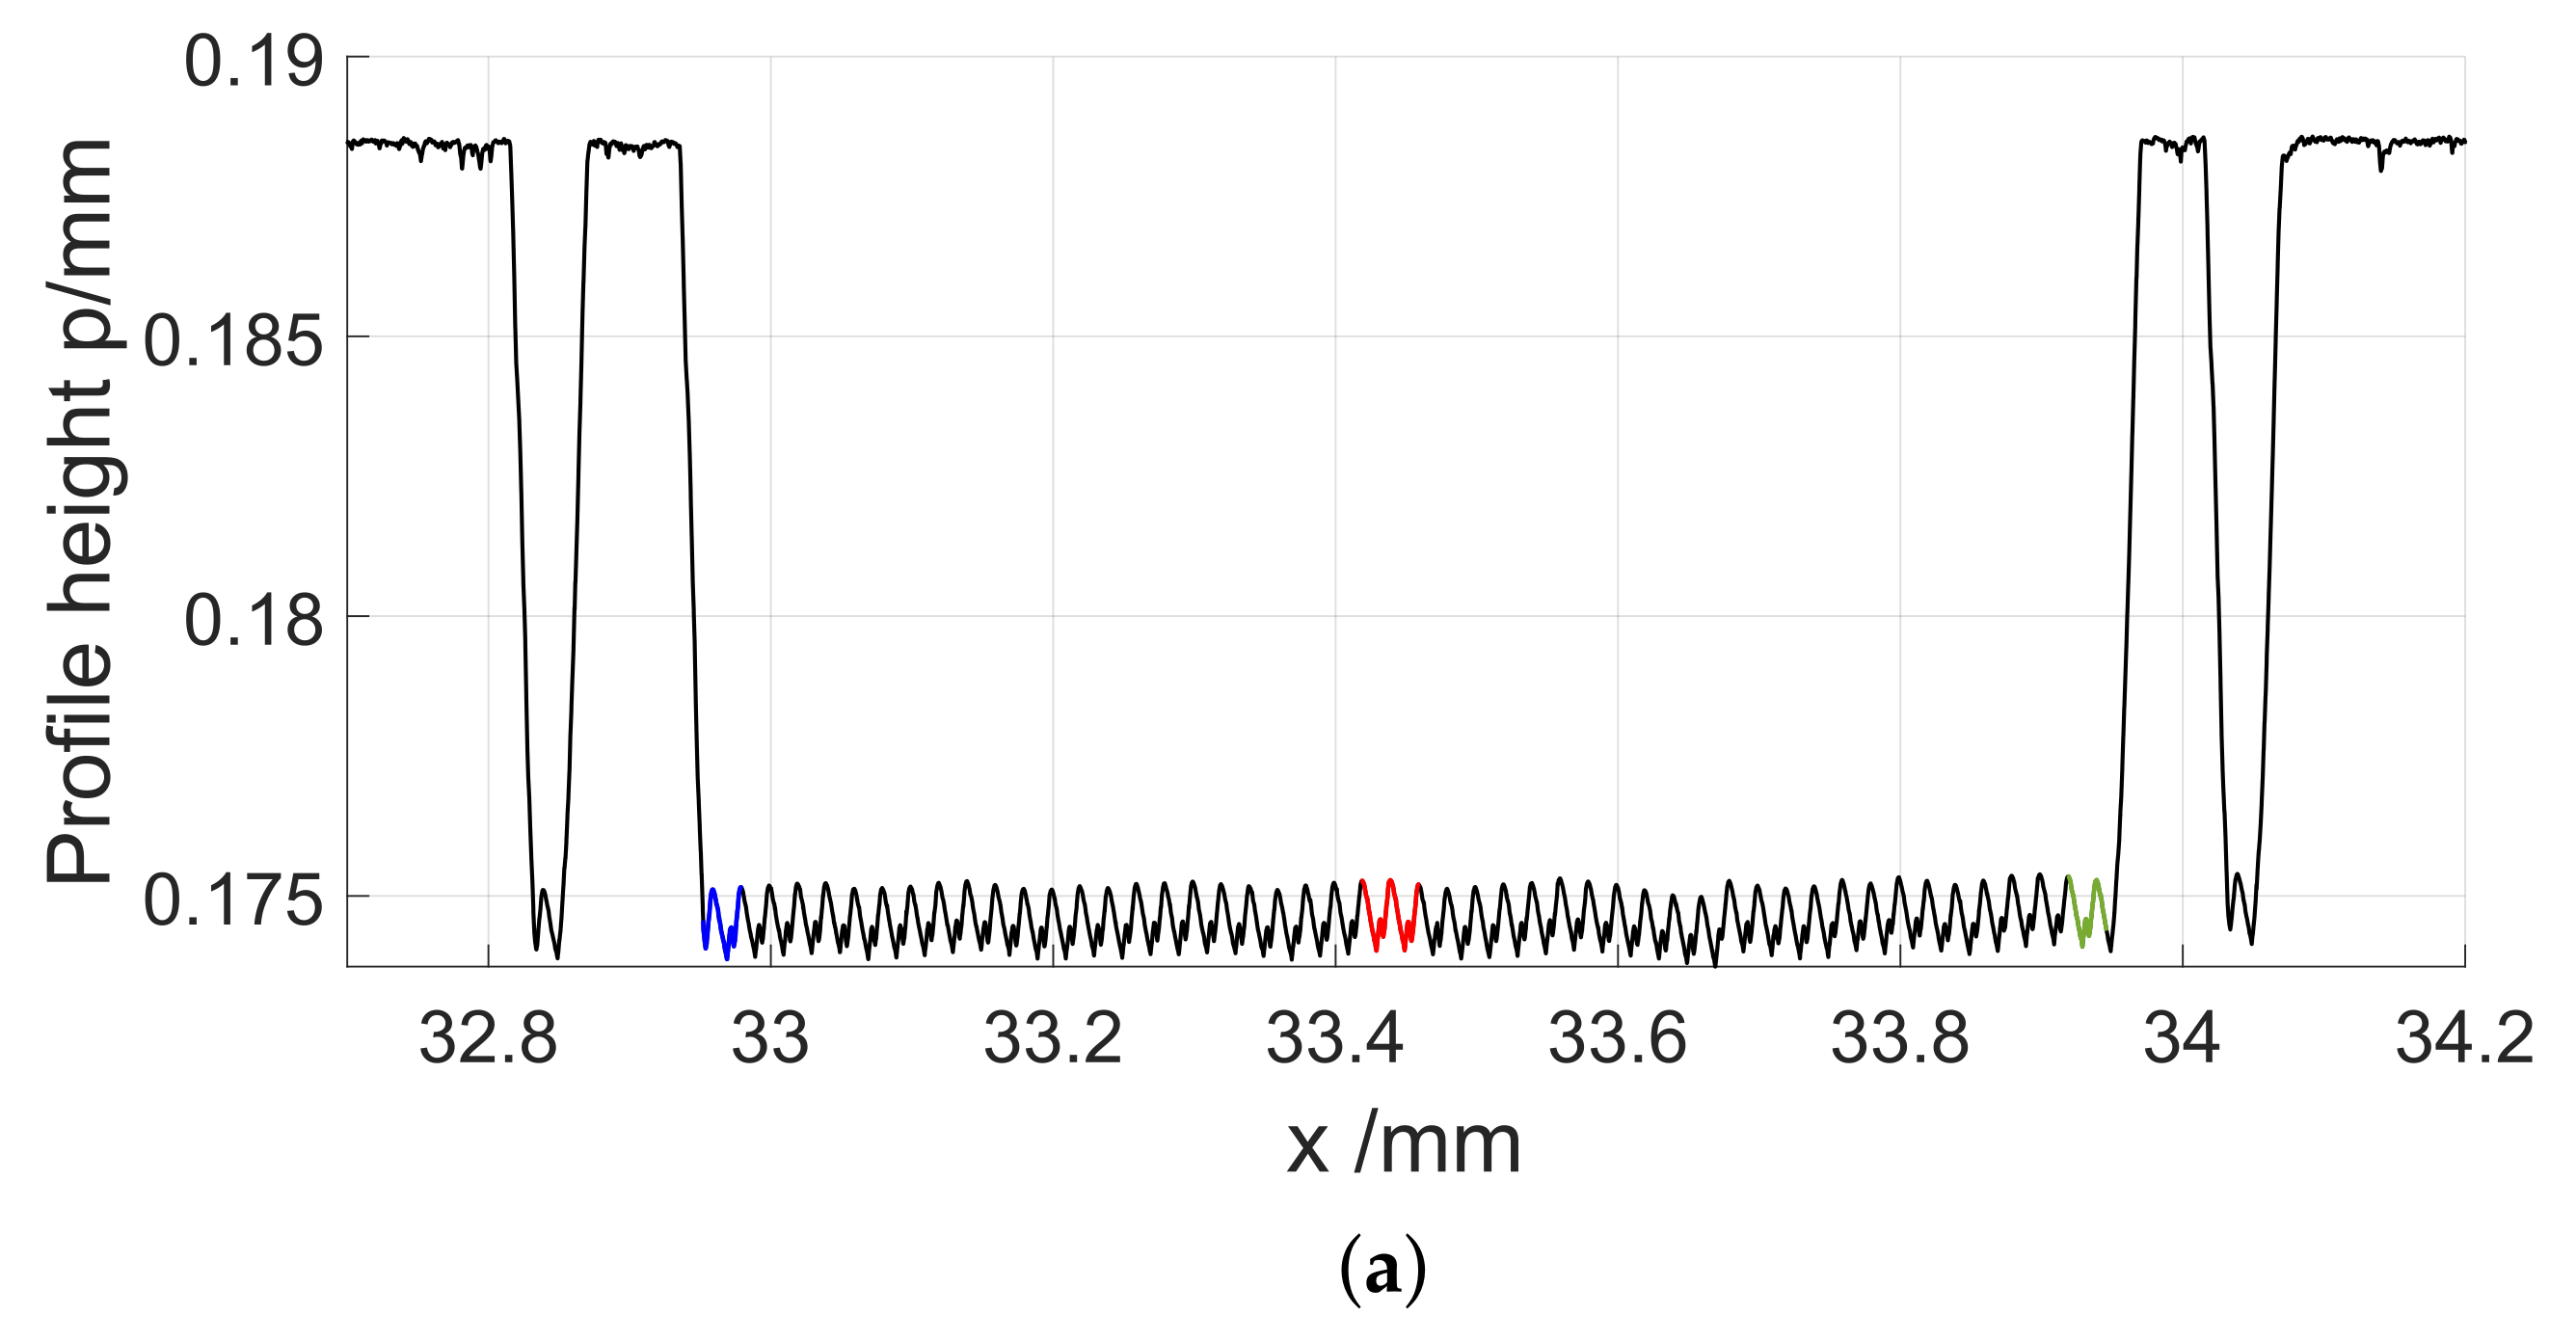
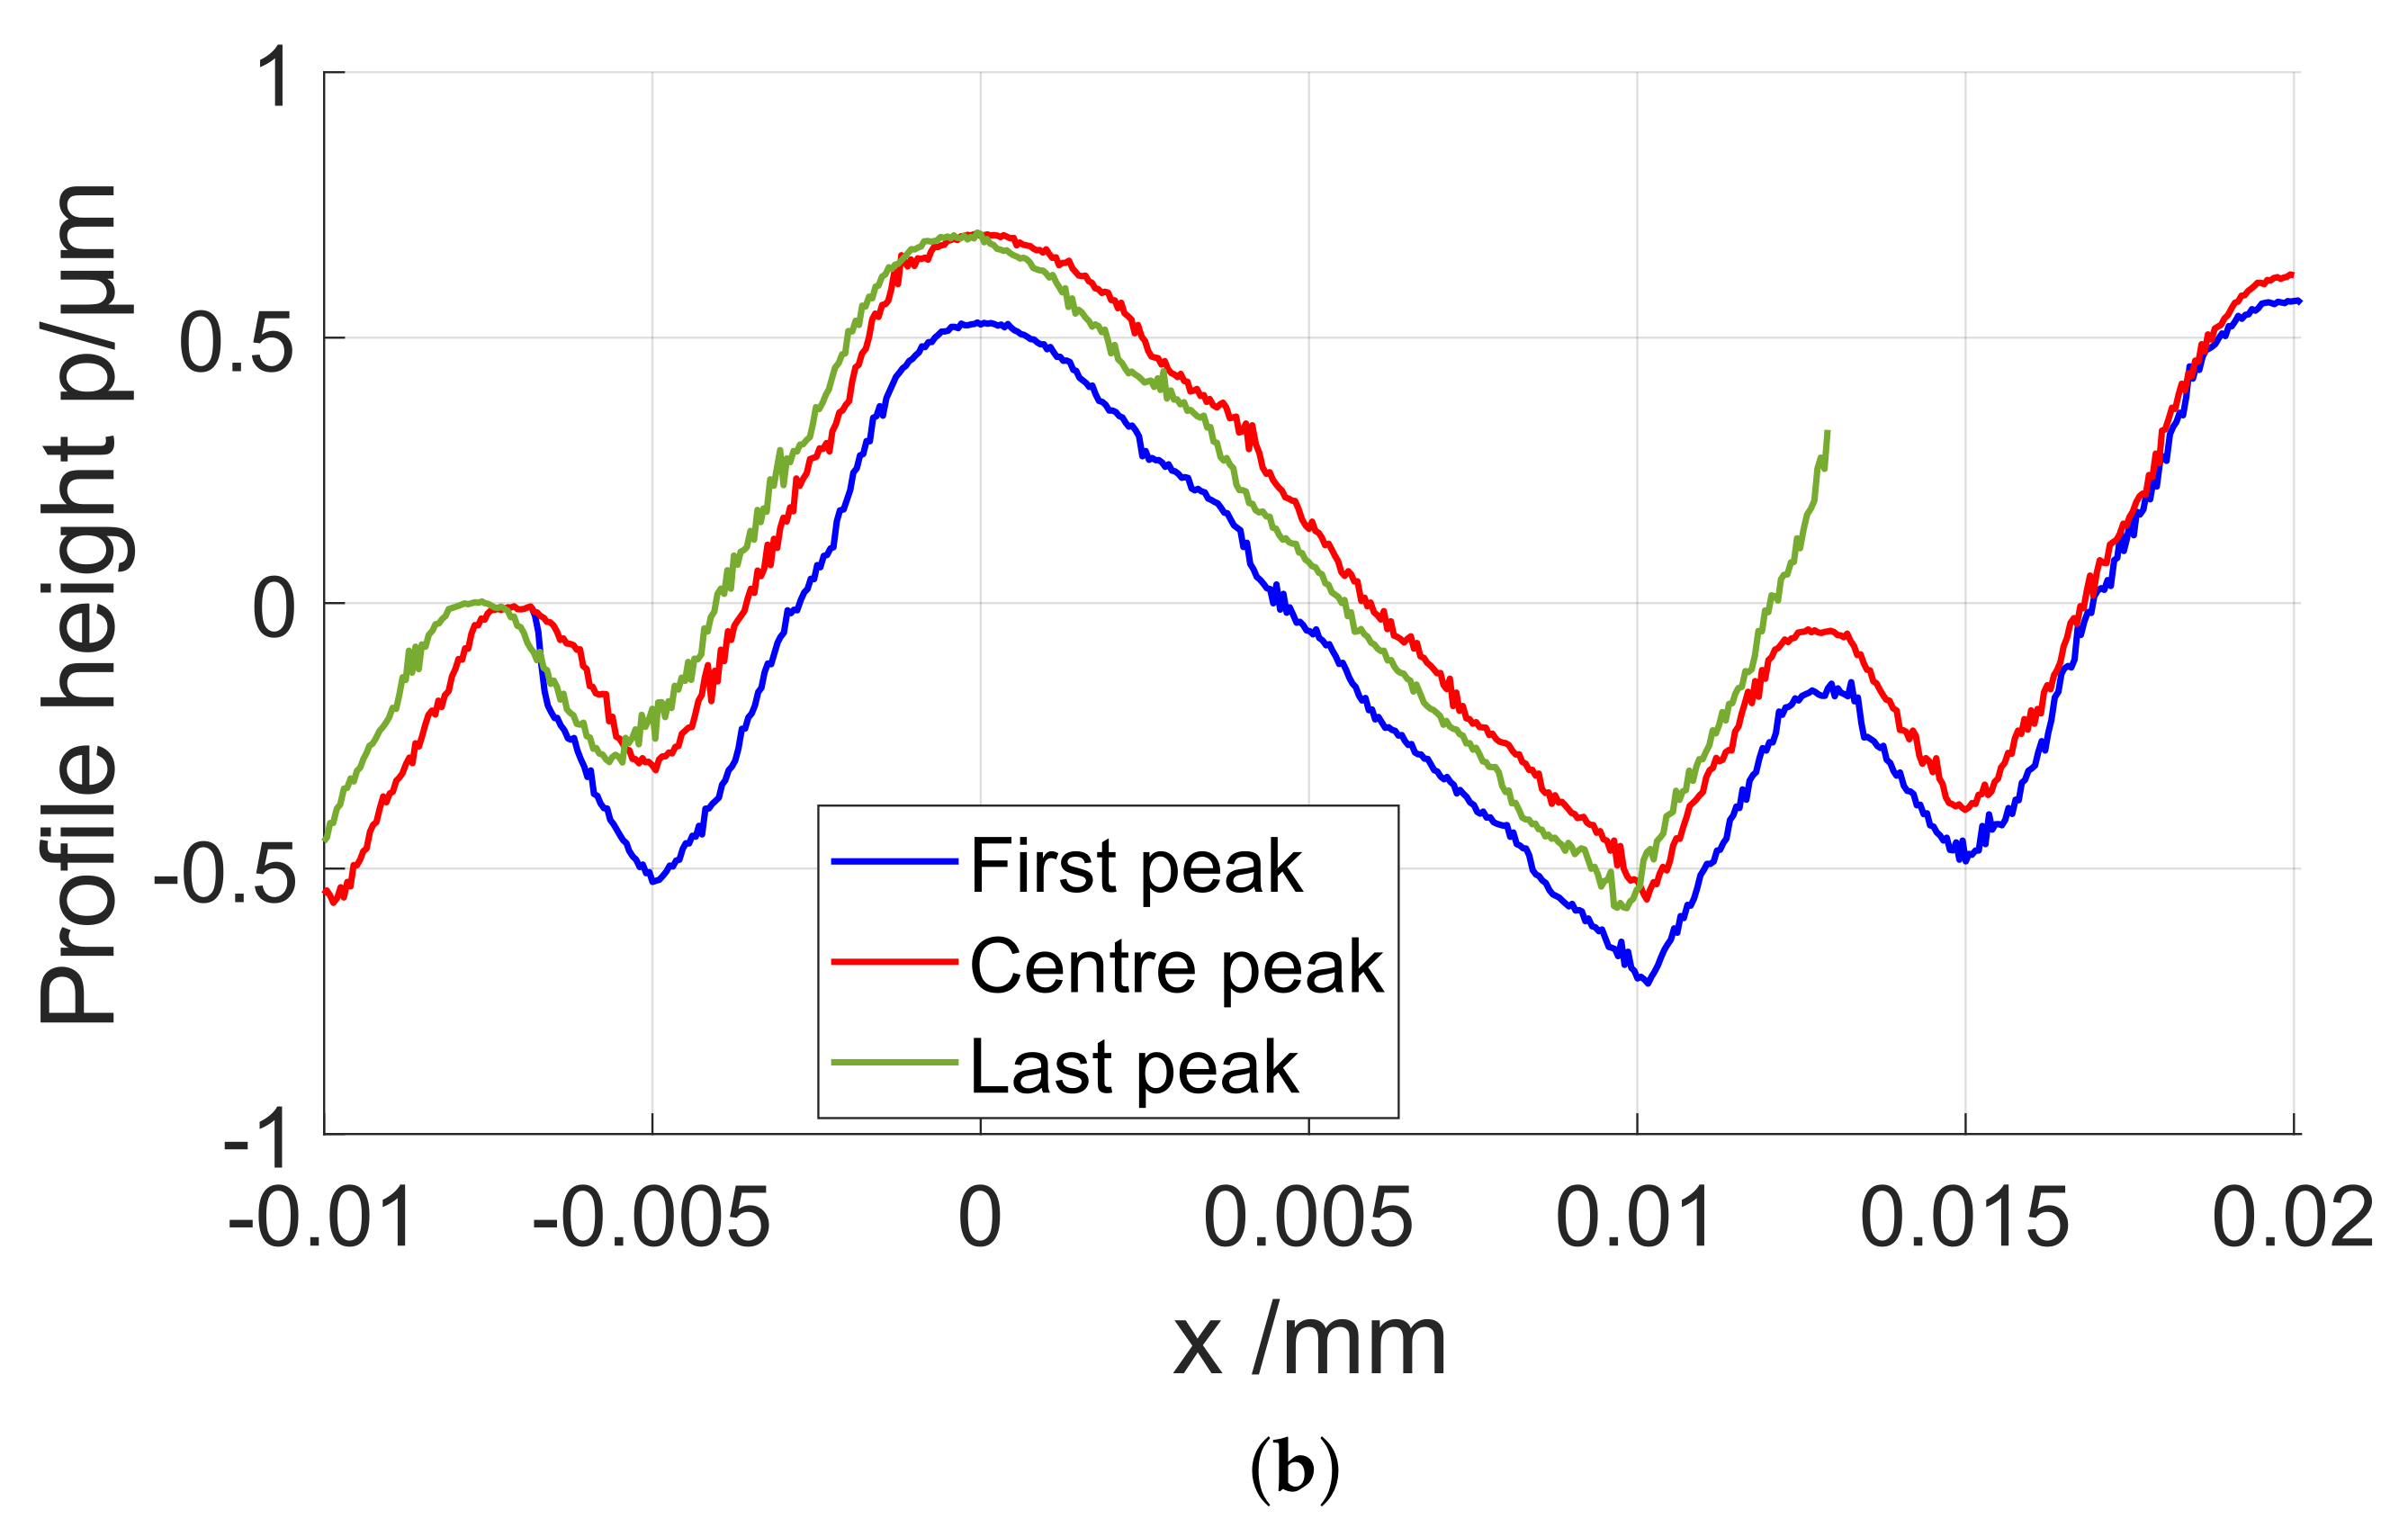
Although the repeated section is largely determined by the random configuration of the grinding wheel, the sections can be placed together deterministically and with high consistency for many instances, as shown in Figure 12. The resulting profiles are, therefore, called semi-deterministic profiles. Up to now, this process could only be applied to a planar rather than an involute geometry. It serves as proof of principle how well the relocalisation problem can be overcome when grinding a surface. Further efforts to finish surfaces on curved objects are in progress. This requires ultra-precision grinding processes applying removals of less then m in height in order to maintain an involute shape [29].
5. Conclusions
A Physical Measurement Standard (PMS) for roughness measurements on involute gear flanks has been developed. It embodies calibrated roughness height parameters (, and ) and material ratio parameters (, , , and ). It is possible to investigate the PMS both with classical profilometers as well as gear measurement systems using the gear shaft. Measurement uncertainties are comparable to those of other PMS, e.g., the material measure described in [30]. As described in Section 1, there are already established measurement systems capable of measuring not only the involute shape but the roughness on the teeth of gears as well. The demand for traceability of roughness measurements on gears by manufacturers of such instruments and their customers can now be fulfilled via the developed PMS.
Necessary evaluation algorithms have been developed. The developed optimisation algorithm (fit) has shown to be capable of directly determining the primary profile as the normal deviation from the ideal involute with respect to the unwrapped arc length of the involute. This process uses more computing resources than when using a smoothing spline as the form filter. However, the fit delivers information about the absolute position of the profile on the involute and, therefore, enables the direct comparison of measurements on profilometers and gear measurement systems, closing the gap between these applications of roughness measurement.
Furthermore, it has been shown that the values of roughness parameters of inhomogeneous surface textures are highly sensitive to variations of the position of the evaluation region. This positioning uncertainty further increased when the relevant reference systems are applied incorrectly.
Next to the development of the semi-deterministically ground surface described in Section 4.3, further comparative measurements of the calibrated PMS, especially on gear measurement systems, are planned.
Author Contributions
Conceptualization, M.S.; methodology, F.S., D.H., R.M. and M.S.; software, F.S. and D.H.; validation, F.S. and D.H.; formal analysis, F.S. and D.H.; investigation, F.S., R.M. and D.H.; resources, R.M.; data curation, F.S. and D.H.; writing—original draft preparation, F.S. and D.H.; writing—review and editing, F.S., D.H., R.M. and M.S.; visualization, F.S.; supervision, M.S. and D.H.; project administration, M.S. All authors have read and agreed to the published version of the manuscript.
Funding
This research received no external funding.
Data Availability Statement
The data presented in this study are available on request from the corresponding author. The data are not publicly available to not influence comparative measurements.
Acknowledgments
We acknowledge the fruitful discussions and the provision of the example gear by the following industrial project partners: Klingelnberg AG, Volkswagen AG and Magna PT B.V. & Co. KG.
Conflicts of Interest
The authors declare no conflict of interest.
Abbreviations
The following abbreviations are used in this manuscript:
| PMS | Physical Measurement Standard; |
| PTB | Physikalisch Technische Bundesanstalt; |
| HRTS | High Resolution Topo Scan; |
| EDM | Electrical Discharge Machining. |
References
- Koulin, G.; Zhang, J.; Frazer, R.C.; Wilson, S.J.; Shaw, B.A. Improving applied roughness measurement of involute helical gears. Meas. Sci. Technol. 2017, 28, 124006. [Google Scholar] [CrossRef] [Green Version]
- Kim, S.; Singh, R. Gear Surface Roughness Induced Noise Prediction Based on a Linear Time-varying Model with Sliding Friction. J. Vib. Control 2007, 13, 1045–1063. [Google Scholar] [CrossRef]
- Wang, Q.J.; Chung, Y.W. (Eds.) Encyclopedia of Tribology; Springer: Boston, MA, USA, 2013; p. 1315. [Google Scholar] [CrossRef]
- Sun, W.; Claudiu Giusca, A.L.; Frazer, R. Good Practice Guide No. 147: Surface Texture Measurements of Gear Surfaces Using Stylus Instruments; National Physical Laboratory: Teddington, Middlesex, UK, 2017. [Google Scholar]
- Clarke, A.; Jamali, H.; Sharif, K.; Evans, H.; Frazer, R.; Shaw, B. Effects of profile errors on lubrication performance of helical gears. Tribol. Int. 2017, 111, 184–191. [Google Scholar] [CrossRef]
- Mies, G. Rauheitsmessungen an Verzahnungen. VDI-Berichte 2017, 2316, 55–64. [Google Scholar]
- Klingelnberg AG. Done-In-One: Messlösungen für Rotationssymmetrische Werkstücke; Klingelnberg AG: Zürich, Switzerland, 2021. [Google Scholar]
- Mahr GmbH. Fully Automatic Roughness Measurements on Shafts with MarSurf XR 20 CNC—Mahr Metrology; Mahr GmbH: Göttingen, Germany, 2021. [Google Scholar]
- VDI/VDE 2612-5. Measurement and Testing of Gearings—Surface Roughness Measurement of Cylindrical Gears and Bevel Gears by Means of Stylus-Type Instruments; VDI/VDE-Gesellschaft Mess- und Automatisierungstechnik: Düsseldorf, Germany, 2015. [Google Scholar]
- Wagner, M.; Michaud, M. A Comparison of Surface Roughness Measurement Methods for Gear Tooth Working Surfaces; AGMA Technical Paper; American Gear Manufacturers Association: Alexandria, VA, USA, 2019; Volume 19FTM21, p. 26. [Google Scholar]
- Koulin, G.; Zhang, J.; Frazer, R.C.; Shaw, B.A.; Sewell, I. A new profile roughness measurement approach for involute helical gears. Meas. Sci. Technol. 2017, 28, 055004. [Google Scholar] [CrossRef]
- Eifler, M.; Schneider, F.; Seewig, J.; Kirsch, B.; Aurich, J.C. Manufacturing of new roughness standards for the linearity of the vertical axis—Feasibility study and optimization. Eng. Sci. Technol. Int. J. 2016, 19, 1993–2001. [Google Scholar] [CrossRef] [Green Version]
- Seewig, J.; Eifler, M.; Schneider, F.; Aurich, J.C. Design and Verification of Geometric Roughness Standards by Reverse Engineering. Procedia CIRP 2016, 45, 259–262. [Google Scholar] [CrossRef] [Green Version]
- Härtig, F.; Stein, M. 3D involute gear evaluation—Part I: Workpiece coordinates. Measurement 2019, 134, 569–573. [Google Scholar] [CrossRef]
- Brandão, J.A.; Seabra, J.H.; Castro, M.J. Surface fitting of an involute spur gear tooth flank roughness measurement to its nominal shape. Measurement 2016, 91, 479–487. [Google Scholar] [CrossRef]
- ISO/FDIS 21920-2. Geometrical Product Specifications (GPS)—Surface Texture: Profile—Part 2: Terms, Definitions and Surface Texture Parameters; International Organization for Standardization: Geneva, Switzerland, to be published.
- ISO 16610-21:2011. Geometrical Product Specifications (GPS)—Filtration—Part 21: Linear Profile Filters: Gaussian Filters; International Organization for Standardization: Geneva, Switzerland, 2011. [Google Scholar]
- Seewig, J. Praxisgerechte Signalverarbeitung zur Trennung der Gestaltabweichungen Technischer Oberflächen; Shaker: Aachen, Germany, 2000. [Google Scholar]
- Seewig, J. Linear and robust Gaussian regression filters. J. Phys. Conf. Ser. 2005, 13, 254. [Google Scholar] [CrossRef] [Green Version]
- ISO 16610-28:2016. Geometrical Product Specifications (GPS)—Filtration—Part 28: Profile filters: End Effects; International Organization for Standardization: Geneva, Switzerland, 2016. [Google Scholar]
- ISO 4288:1996. Geometrical Product Specifications (GPS)—Surface Texture: Profile Method—Rules and Procedures for the Assessment of Surface Texture; International Organization for Standardization: Geneva, Switzerland, 1996. [Google Scholar]
- ISO/FDIS 21920-3. Geometrical Product Specifications (GPS)—Surface Texture: Profile—Part 3: Specification Operators; International Organization for Standardization: Geneva, Switzerland, to be published.
- ISO 4287:1997. Geometrical Product Specifications (GPS)—Surface Texture: Profile—Part 2: Terms, Definitions and Surface Texture Parameters; International Organization for Standardization: Geneva, Switzerland, 1997. [Google Scholar]
- ISO 13565-2:1996. Geometrical Product Specifications (GPS)—Surface Texture: Profile Method; Surfaces having Stratified Functional Properties—Part 2: Height Characterization Using the Linear Material Ratio Curve; International Organization for Standardization: Geneva, Switzerland, 1996. [Google Scholar]
- Thomsen-Schmidt, P. Characterization of a traceable profiler instrument for areal roughness measurement. Meas. Sci. Technol. 2011, 22, 094019. [Google Scholar]
- P 40 KLINGELNBERG Präzisionsmesszentrum. 2019. Available online: https://klingelnberg.com/geschaeftsbereiche/praezisionsmesszentren (accessed on 20 October 2021).
- Hüser, D.; Hüser, J.; Rief, S.; Seewig, J.; Thomsen-Schmidt, P. Procedure to approximately estimate the uncertainty of material ratio parameters due to inhomogeneity of surface roughness. Meas. Sci. Technol. 2016, 27. [Google Scholar] [CrossRef] [Green Version]
- JCGM 104:2009. Evaluation of Measurement Data—An Introduction to the “Guide to the Expression of Uncertainty in Measurement” and Related Documents; JCGM: Paris, France, 2009. [Google Scholar]
- Zhang, Z.; Yan, J.; Kuriyagawa, T. Manufacturing technologies toward extreme precision, International Journal of Extreme Manufacturing. Int. J. Extrem. Manuf. 2019, 1, 022001. [Google Scholar] [CrossRef] [Green Version]
- Seewig, J.; Eifler, M.; Hüser, D.; Meeß, R. Rk material measure: A model based design. Tech. Mess. 2019, 86, 478–486. [Google Scholar] [CrossRef]
Figure 1.
Left flank involute (blue) defined by the base circle radius and parameterised by the roll angle as defined in Equation (1).
Figure 1.
Left flank involute (blue) defined by the base circle radius and parameterised by the roll angle as defined in Equation (1).

Figure 2.
Artificial deviation profile presented in different reference coordinate systems. (a) Ideal involute coordinate system: shows the profile as it appears in the coordinate system of the ideal involute (dashed line). The green arrows indicate the x-axis and y-axis of the coordinate system along a chord for (b). (b) Profilometer coordinate system: shows the profile as it is measured with reference to a chord of the involute such as it is performed on a profilometer (). (c) Arc length coordinate system: shows the profile as it appears with reference to the arc length s (). In this case, the x-axis follows the shape of the ideal involute. (d) Roll length coordinate system: shows the profile as it appears with reference to roll length l in coordinate system and causes the profile, which appears as a regular sine-wave in the arc length system, to appear non-linearly stretched.

Figure 3.
Principle of the fitting process: The profile as measured by the profilometer (red) is fitted onto the ideal involute (black), yielding the measured profile in the coordinate system of the ideal involute (blue). This is performed by finding the shift-and-turn transformation that yields the minimal squared error of the transformed curve to the ideal involute via an optimisation algorithm.

Figure 4.
A typical spur gear used in industry with teeth and base radius mm taken as master piece for investigations to aid the process of designing a physical measurement standard.
Figure 4.
A typical spur gear used in industry with teeth and base radius mm taken as master piece for investigations to aid the process of designing a physical measurement standard.

Figure 5.
Roughness parameters as function of the position of the evaluation interval; the master gear shows that the roughness is graded along the profile.
Figure 5.
Roughness parameters as function of the position of the evaluation interval; the master gear shows that the roughness is graded along the profile.

Figure 6.
Four roughness profiles of the master gear comparing different measurement and different data analysis strategies; profiles are shifted artificially in height by mm for better vision.
Figure 6.
Four roughness profiles of the master gear comparing different measurement and different data analysis strategies; profiles are shifted artificially in height by mm for better vision.

Figure 7.
Relative deviation from mean of each of the roughness parameters obtained by the involute form operator plotted for six different roughness parameters; error bars indicate the range of results obtained by varying evaluation positions.
Figure 7.
Relative deviation from mean of each of the roughness parameters obtained by the involute form operator plotted for six different roughness parameters; error bars indicate the range of results obtained by varying evaluation positions.

Figure 8.
Components of the PMS: (a) gear shaft to enable measurements as a gear and (b) gear piece with calibrated roughness profile.
Figure 8.
Components of the PMS: (a) gear shaft to enable measurements as a gear and (b) gear piece with calibrated roughness profile.

Figure 9.
Primary profile of PMS, i.e., profile after form removal and before filtration; physical markers (fiducials) for relocalisation at root and tip of profile (green).
Figure 9.
Primary profile of PMS, i.e., profile after form removal and before filtration; physical markers (fiducials) for relocalisation at root and tip of profile (green).

Figure 10.
Roughness profile of Physical Measurement Standard (PMS) after form elimination and filtration. (a) Complete roughness profile. (b) Zoomed in part of roughness profile.
Figure 10.
Roughness profile of Physical Measurement Standard (PMS) after form elimination and filtration. (a) Complete roughness profile. (b) Zoomed in part of roughness profile.

Figure 11.
Roughness parameters as function of the position of the evaluation interval; PMS shows that roughness is constant along the profile.
Figure 11.
Roughness parameters as function of the position of the evaluation interval; PMS shows that roughness is constant along the profile.

Figure 12.
Semideterministic periodic profiles that are an attempt to utilize periodic profiles on involute gear flanks as PMSs. (a) Entire semideterministic profile manufactured by repeating grinding processes and resulting in a periodic profile. (b) Peaks of different parts of the profile (start, centre and end) combined and aligned: the peaks are equal to the sub-m level; thus, the profile can be considered to be periodic.


Table 1.
Results of roughness evaluation of the example gear.
| /m | /m | /m | /m | /m | /m | /% | /% | |
|---|---|---|---|---|---|---|---|---|
| fit HRTS (reference values) | 0.147 | 0.98 | 0.187 | 0.47 | 0.17 | 0.26 | 10 | 92.0 |
| range of values | 0.018 | 0.16 | 0.027 | 0.05 | 0.06 | 0.10 | 6 | 4 |
| chord HRTS | 0.136 | 0.95 | 0.172 | 0.45 | 0.14 | 0.22 | 7 | 91 |
| stretched chord HRTS | 0.136 | 0.94 | 0.172 | 0.45 | 0.14 | 0.20 | 7 | 90 |
| reevaluated P40 | 0.17 | 0.96 | 0.21 | 0.53 | 0.23 | 0.21 | 8.3 | 88.7 |
| range of values | 0.017 | 0.022 | 0.021 | 0.04 | 0.09 | 0.01 | 0.9 | 0.017 |
Table 2.
Results of roughness evaluation of calibrated standard.
| /m | /m | /m | /m | /m | /m | Mr1/% | Mr2/% | |
|---|---|---|---|---|---|---|---|---|
| magnitude | >0.1 | >1.0 | >0.15 | >0.3 | >0.15 | >0.15 | >5 | >85 |
| <0.15 | <1.5 | <0.25 | <0.6 | <0.25 | <0.25 | <15 | <95 | |
| measurement uncertainty | 0.008 | 0.10 | 0.008 | 0.027 | 0.023 | 0.029 | 1.2 | 1.1 |
Publisher’s Note: MDPI stays neutral with regard to jurisdictional claims in published maps and institutional affiliations. |
© 2021 by the authors. Licensee MDPI, Basel, Switzerland. This article is an open access article distributed under the terms and conditions of the Creative Commons Attribution (CC BY) license (https://creativecommons.org/licenses/by/4.0/).
Share and Cite
MDPI and ACS Style
Steinmeyer, F.; Hüser, D.; Meeß, R.; Stein, M. A Novel Measurement Standard for Surface Roughness on Involute Gears. Appl. Sci. 2021, 11, 10303. https://0-doi-org.brum.beds.ac.uk/10.3390/app112110303
AMA Style
Steinmeyer F, Hüser D, Meeß R, Stein M. A Novel Measurement Standard for Surface Roughness on Involute Gears. Applied Sciences. 2021; 11(21):10303. https://0-doi-org.brum.beds.ac.uk/10.3390/app112110303
Chicago/Turabian StyleSteinmeyer, Felix, Dorothee Hüser, Rudolf Meeß, and Martin Stein. 2021. "A Novel Measurement Standard for Surface Roughness on Involute Gears" Applied Sciences 11, no. 21: 10303. https://0-doi-org.brum.beds.ac.uk/10.3390/app112110303
Note that from the first issue of 2016, this journal uses article numbers instead of page numbers. See further details here.