1. Introduction
With the development of electronic wireless devices, the problem of shielding from microwaves (300 MHz–300 GHz) is becoming increasingly important for the operation of electronic devices. Shielding of optoelectronic devices (OEDs) from this electromagnetic radiation is a part of scientific and practical tasks involved in electromagnetic compatibility (EMC), which means maintaining the useful characteristics of objects under the condition of irradiation by microwaves. The electromechanical parts of OEDs are successfully protected from microwaves by a metal housing, while the optical elements require smart shielding. Various methods make it possible to achieve effective shielding from parasitic radiation via the reflection or absorption of electromagnetic waves. Various semiconductors (indium–tin oxide films (ITO), germanium, or silicon [
1,
2,
3]), composites [
4,
5], solid solution MXenes [
6], carbon nanotubes films [
7], metal mesh structures [
8,
9], and metasurfaces [
10,
11] are used. Four types of conductive shielding structures can be used: a free-standing conductive mesh structure, a dielectric substrate with a conducting mesh structure, a dielectric substrate with a film on it, and a conductive substrate. Despite such a variety of different types of shielding structures, free-standing conductive mesh structures are currently used because of their low weight, flexibility, and effective shielding from microwaves. Such filters have been studied sufficiently, and analytical formulas are also available to predict the most important optical, electrical, and microwave properties. Currently, searches for a solution to OED shielding from microwaves are being carried out mostly by using various non-traditional materials to form conducting layers (e.g., ITO films [
1]) or by applying various surface designs [
10,
11].
In this paper, the possibility of using mesh structures for shielding some types of OEDs (a video camera and a laser rangefinder) from microwaves in a wavelength range from the visible to near-infrared (IR) is shown. The operating wavelengths of the video camera and the laser rangefinder are from 380 to 740 nm and at 1.55 µm, respectively. The aim is to provide a good transmission in the range of operating wavelengths and to suppress parasitic radiation in a wide wavelength range, from 1 decimeter to 1 millimeter, which corresponds to a frequency range from 0.3 to 300 GHz. In this investigation, the experimental data on electromagnetic wave attenuation in metal mesh structures on a optical glass were obtained in a frequency range from 2.5 to 100 GHz. A comparison of the experimental data with calculations of the shielding properties based on various theoretical models and a numerical simulation are carried out to study the mesh structure shielding effectiveness. Additionally, the theoretical spectra of the mesh structure transmission in a frequency range from 0.1 to 3 THz (near a resonant peak) were studied to define the limits of the applicability of various theoretical models of shielding and the features of these models.
2. Theoretical Methods of Calculation
To evaluate the effectiveness of shielding from electromagnetic radiation, the attenuation could be expressed as follows:
where
Pi and
Pt are the powers of incident and transmitted electromagnetic radiations, respectively. They are defined by a reflection loss and absorption loss and depend on the frequency of electromagnetic radiation [
12].
One-mode calculation can be used to describe the shielding properties of a mesh structure via the simplification of a full set of Floquet modes [
13]. Based on this simplification of the analytical theory, formulas for the transmission and reflection coefficients of the mesh structure were obtained. However, this model can only described a free-standing mesh structure with a specific configuration. The configuration types described in the model are shown in
Figure 1. This condition restricts the use of the model.
The second model used for modeling the shielding properties was described in detail in the monograph by M. I. Kontorovich [
14]. In this model, a simple equation was used to evaluate the approximate attenuation:
where
h is the side length of the square cell,
λ is the radiation wavelength, and
a is the effective transverse conductor size:
where
d is the conductor width and
t is the conductor thickness.
The limitations of the applicability of this model can be determined. This is the condition under which the decimal logarithm expression is equal to 1. Hence, the expression for the cut-off wavelength can be defined as follows:
The wavelength range of the model’s applicability includes wavelengths that exceed λb. The second theoretical approach is further named the Kontorovich calculation.
For a benchmark calculation of mesh structure transmission, a numerical calculation was carried out by the COMSOL Multiphysics software. The calculation was performed using the finite element method for the full set of Floquet modes in a wavelength range from 200 µm to 12 cm. In this method, a minimum size of a grid element was much smaller than the wavelength.
3. Samples and Measurement Methods
The samples were windows made of an optical K108 glass (TYDEX LLC, Saint Petersburg, Russia [
15]). The K108 optical glass is an analog of the well-known K8 glass (BK7 by Shott Company, Mainz, Germany). This means that these glasses (K108 and K8) have the same refractory index and absorption coefficients in the frequency range under study. The K108 optical glass is radiation-resistant, which can be useful in protecting OEDs under the influence of powerful microwave radiation. The thicknesses of the windows were the same and equal to 3 mm. Copper mesh structures with a square cell were sputtered on one side of each glass by MEMS (micro-electromechanical systems) technology. The size of the cell was chosen to obtain the optimal attenuation of the electromagnetic radiation. The cell size was modified to check the influence on the transmission coefficient in a wavelength range from visible to microwave: the size aperture was decreased by 3 times, the conductor width was decreased by 2 times, and its thickness remained unchanged. The mesh structure parameters (the square side × the copper conductor width × the conductor thickness) were 280 µm × 20 µm × 5 µm (
Figure 2a) and 90 µm × 10 µm × 5 µm (
Figure 2b).
Since the operating spectral range of the mesh structures is in the range of visible/near-IR radiation, it is necessary to reduce the reflection of the structure in this spectral range. For this purpose, the reverse side of the window was covered with an AR coating. The coating was sputtered on the glass. It consisted of alternating layers of SiO
2 and ZrO
2 with refractive indices n(SiO
2) = 1.45 and n(ZrO
2) = 1.95, respectively. The layers were arranged in the following way (a layer thickness is indicated in parentheses): glass–SiO
2 (100 nm)–ZrO
2 (10 nm)–SiO
2 (55 nm)–ZrO
2 (48 nm)–SiO
2 (11 nm)–ZrO
2 (78 nm)–SiO
2 (98 nm)–air (seven layers in the AR coating). The function of these coatings is as follows: if the optical thickness of the AR coating equals a quarter of the incident radiation wavelength
λ/4, then destructive interference appears at the air/AR interface between a reflected and an incoming wave and increases the transmission coefficient [
9].
The transmission spectrum was measured by the following equipment (
Figure 3): a Photon RT spectrophotometer (EssentOptic LTD, Borovlyany, Republic of Belarus), a Bruker Vertex 70 Fourier-spectrometer (Bruker Corporation, Billerica, MA, USA), and a Tera K8 Menlo Systems THz time-domain spectrometer (Menlo Systems GmbH, Martinsried, Germany) used in spectral ranges from 185 nm to 1.65 µm, from 0.9 µm to 670 µm, and from 150 µm to 3 mm, respectively.
The spectral resolutions of the Photon RT spectrophotometer were 0.3 nm, 0.6 nm, and 1.2 nm for the spectral ranges 185–350 nm, 350–990 nm, and 990–1650 nm, respectively. The spectral resolution of the Bruker Vertex 70 Fourier-spectrometer is 0.5 cm−1. The frequency resolution of the Tera K8 Menlo Systems THz time-domain spectrometer is 1 GHz. All spectra obtained by the Photon RT, the Bruker Vertex 70, and the Tera K8 Menlo Systems spectrometers were merged into one spectrum by Bruker OPUS software (Bruker Corporation, Billerica, MA, USA) with a built-in Merge Spectra Ranges function, which averaged the spectra in the intersection wavelength range. The Bruker’s OPUS has a set of built-in functions to measure and analyze the spectra including averaging and smoothing functions. A five-point smooth adjacent averaging function was applied to the full spectrum.
The radiation attenuation in the millimeter and centimeter spectral ranges was measured on several setups. An original equipment was assembled for measurements at a fixed frequency of 99 GHz (3030 µm). The source of continuous wave radiation was a GF-10/99/20 generator(DOK LTD, Moscow, Russia), and the detector was a Golay cell (TYDEX LLC, Saint Petersburg, Russia [
15]). Measurements were carried out in a free space. A horn antenna was used for the radiation channeling, and diaphragms and microwave absorbers were used to extinguish the parasitic radiation and re-reflections. The radiation power of the generator was 22 mW, and the dynamic range of the equipment was 50 dB. The attenuation in the mesh structure on the glass was measured in the centimeter range in a microwave waveguide transmission line by a scalar network analyzer. The radiation was emitted by a N5183A generator (Keysight Technologies, Santa Rosa, CA, USA) using an amplifier with a maximum power of 15 W and measured by a calibration receiver—N9030A spectrum analyzer (Keysight Technologies, Santa Rosa, CA, USA). The dynamic range of the equipment is 90 dB. Samples with diameters of 5 cm and 8 cm were used to measure the attenuation in the frequency ranges of 8–12 GHz (3.75–2.5 cm) and 2.2–4 GHz (13.6–7.5 cm), respectively.
4. Results and Discussion
The attenuation in these samples was measured at frequencies of 99 GHz, 12 GHz, 11 GHz, 10 GHz, 9 GHz, 8 GHz, 4 GHz, 3.5 GHz, 3 GHz, and 2.5 GHz to check the shielding properties. A full transmission spectrum was obtained in the wavelength range of 0.185–3000 µm (100 GHz–1620 THz).
In addition to the one-mode calculation, the Kontorovich calculation of the transmission coefficient was performed in a frequency range of 1–300 GHz (Equation (
2)). The experimental transmission coefficient of the mesh structures on the K108 glass (blue points), the numerical calculation of the transmission coefficient of the free-standing mesh structures and on the OHARA S-BSL7 (Ohara Inc., Sagamihara, Japan) and Schott N-BK7 glass (red and pink lines, respectively), and the model calculations of transmission coefficient of the free-standing mesh structures (the black line is the one-mode calculation, and the green line is the Kontorovich calculation) are shown in
Figure 4.
The Kontorovich calculation of the free-standing mesh structure transmission coefficient fits sufficiently well with the numerical calculation at low frequencies. The Kontorovich calculation mismatches the numerical one by 7% at a frequency of 38 GHz, at which the attenuation in sample 1 is 18 dB. The mismatch between transmission coefficients obtained by the numerical calculation and the Kontorovich calculation for sample 2 is 5% even at a frequency of 150 GHz with the same attenuation level of 18 dB. With an increase in a frequency the mismatch between the transmission coefficient obtained by Kontorovich calculation, the numerical calculation increases.
Oscillations in the transmission coefficient spectrum are shown in
Figure 4 and
Figure 5 for the mesh structures on the substrate. The transmission maxima and minima are explained by an interference in the glass (constructive and destructive interferences). The interference occurs between waves reflected from an air–glass interface and transmitted through the structure. The numerical calculation shows that the interference of waves should be observed in the experiment as well, but a frequency resolution and a small number of frequency points in the frequency range from 2.5 GHz to 150 GHz do not allow us to detect the interference in the experiment.
The mismatch between the experimental data and the numerical calculation of the transmission coefficient may be associated with a measurement error because the transmission coefficient in this frequency range is less than a percent. The attenuation estimated by the one-mode calculation in the frequency range of 1–150 GHz differs from that of the numerical calculation. The transmission coefficient was calculated using the one-mode calculation to evaluate the standard deviation from the numerical calculation of the free-standing filter transmission. For sample 1, the standard deviation equals to 7%, and for sample, it equals 2–0.5%.
The transmission of the mesh structure in a frequency range of 0.1–3 THz for sample 1 and sample 2 is shown in
Figure 5. The transmission of the free-standing mesh structure is shown in
Figure 5 by the red line, and the transmission of the mesh structure on the OHARA S-BSL7/Schott N-BK7 glass is shown by the blue line. Both glasses are analogs of the K108 glass, which was used in the experiment. For the evaluation of the limit of applicability of the one-mode calculation [
13], a comparison of this model with the numerical calculation of free-standing mesh structure transmission was carried out. The one-mode calculation of the transmission coefficient is shown in
Figure 5 by the black line. The analytical model of the transmission coefficient fits sufficiently well with the numerical calculation up to a resonant peak. After the resonant peak, the transmission coefficient is lower than that calculated using the numerical calculation and the resonant peaks associated with the high order modes are absent.
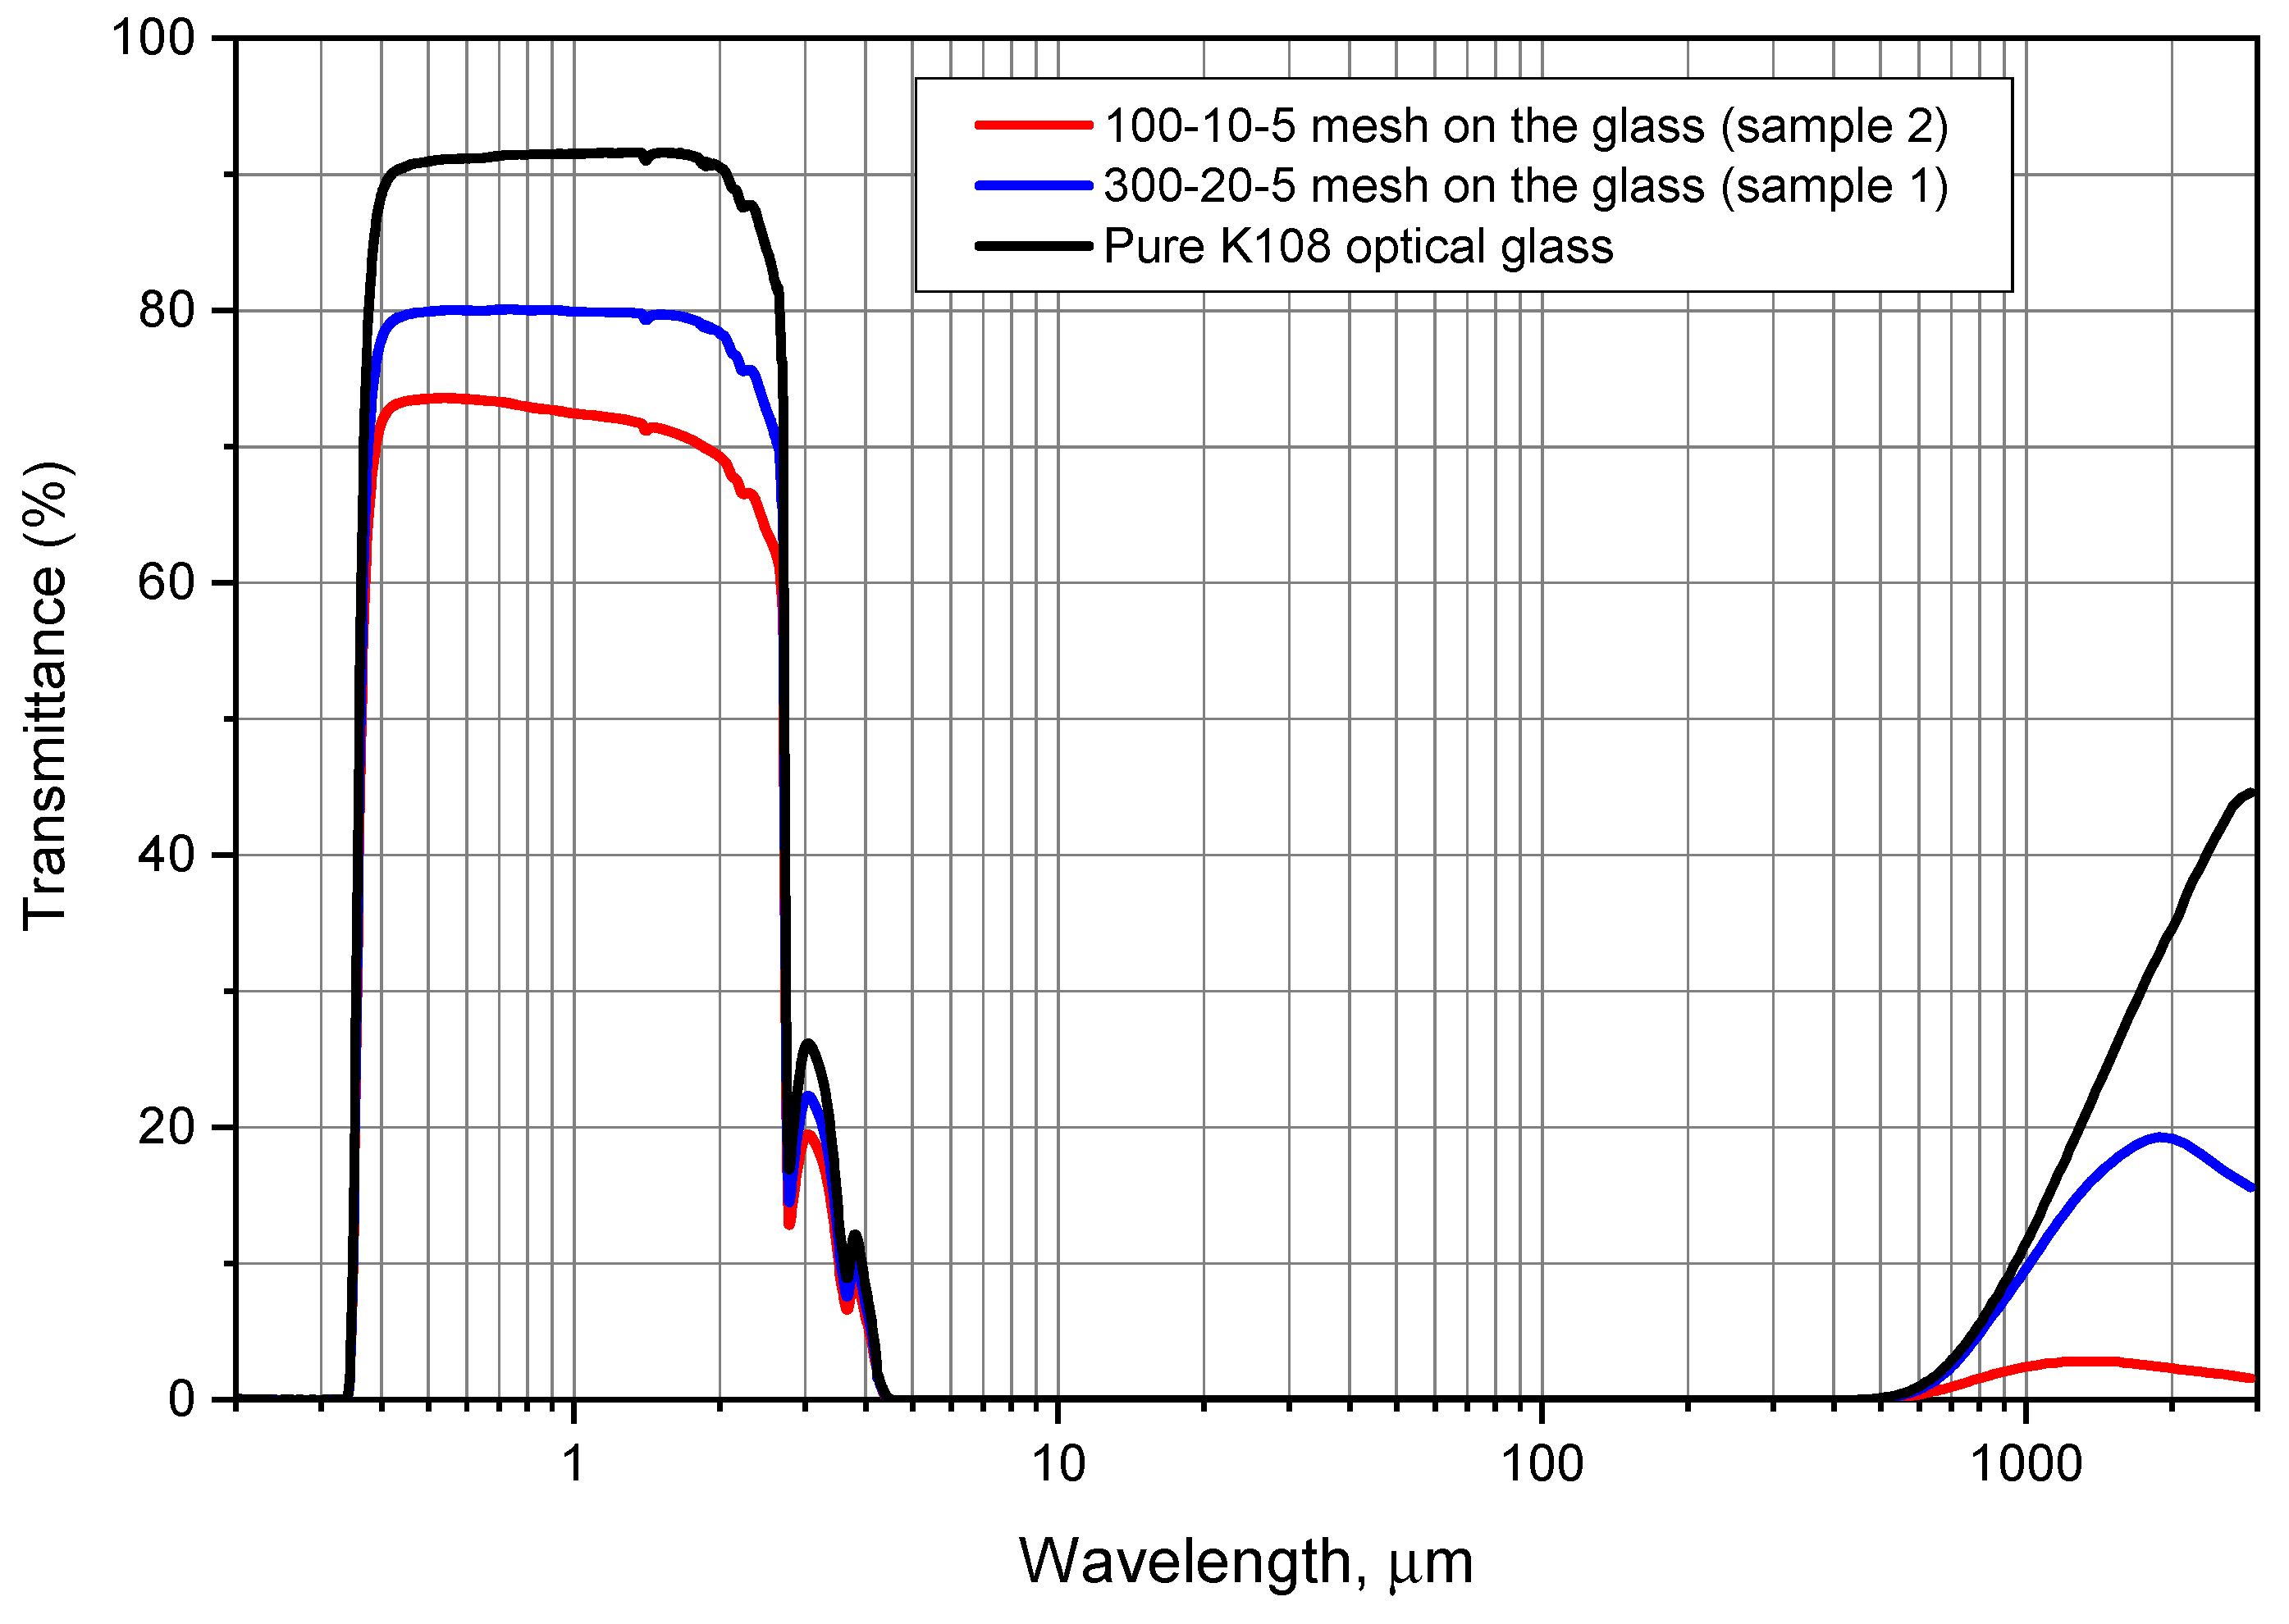
The experimental transmission of the mesh structures in a wide spectral range of 0.185–3000 µm is shown in
Figure 6. The bandwidth of this mesh structures is clearly visible in the spectrum. A comparison of transmission spectra of the free-standing mesh structure, the mesh structure on the substrate, and the pure substrate shows that the transmission of the glass can be superimposed on the free-standing mesh structure transmission. Therefore, the transmission of the mesh structure on the substrate becomes a band pass with two transmission bands: in the spectral ranges from visible to near-IR and in the THz frequency range.
Since the operating spectral range of OEDs such as video cameras and laser rangefinders are located in the visible and near-IR ranges, it is necessary to maximize the transmission in this spectral range. For a solution to this problem, an AR coating was used. The samples were fabricated with alternating zirconium and silicon dioxide layers with a total thickness of 420 nm for the 1.55 µm wavelength (for the laser rangefinder) and of 395 µm for the 0.515 µm wavelength (for the video camera), respectively. The experimental transmission spectra of the mesh structure on the glass with and without the AR coating are shown in
Figure 7. Due to the AR coating, the transmission coefficient was increased in the wavelength range from 0.35 µm to 2 µm.
Though the shielding properties of these mesh structures are inferior to some types of shielding structures, they also have a number of advantages. Although a filter based on carbon nanotubes has higher attenuation in the operating frequency range than the mesh structure it cannot be used as a band pass filter in the visible and near-IR wavelength ranges [
7]. Filters with non-traditional surface designs (e.g., with contiguous rings [
10] or petal-shaped [
11]) have good shielding abilities. A disadvantage of such filters is the complexity of the formation of these structures. A comparison of the shielding properties of the mesh structures with other shielding structures is shown in
Table 1. At a frequency of 12 GHz, the attenuations in the mesh structures with the sizes 90 µm × 10 µm × 5 µm and 280 µm × 20 µm × 5 µm is 34 dB and 23 dB, respectively, which are better or comparable with the filter based on the carbon nanotubes layer (25 dB for 10 nm thickness) [
7], the mesh structure made of contiguous rings (20 dB) [
10], and the petal-shaped mesh structure (31 dB) [
11]. At a frequency of 4 GHz, the attenuations are 38.9 dB and 34.2 dB, respectively, which are better than that for the filter based on a carbon nanotube layer with 10 nm thickness at the same frequency (30 dB).
Numerical calculations of the shielding properties of structures is quite expensive in terms of machine time and resources. Moreover, a comparison with the numerical calculation of the transmission of a mesh structure on the substrate shows a mismatch in the results due to the presence of interference in the glass and absorption. However, this model can be used in a rough calculation of the shielding properties. The Kontorovich calculation of the shielding properties has a higher error compared with the one-mode calculation of the shielding properties; therefore, it is less preferable in calculating the shielding properties. However, one-mode calculation of the shielding properties can be used for a rough and quick calculation of the transmission in a frequency range close to the resonance peak. Therefore, the standard deviations from the numerical calculation of the transmission in the frequency range from 50 GHz to the resonance peak frequency (0.9 THz for sample 1 and 2.8 THz for sample 2) are 13.5% and 5.2% for samples 1 and 2, respectively. The resonance peak frequency can be determined using the one-mode calculation of the transmission: the mismatch with the numerical calculation at a frequency of 0.9 THz for sample 1 is 0.7%, and that at a frequency of 2.6 THz for sample 2 is 0.4%. The mismatch of the numerical calculation of transmission at higher frequencies can reach 40% when taking into account only the first Floquet mode. Despite the fact that the numerical calculation of transmission is optimal, for the estimation of the shielding frequency range, the best method is the one-mode model due to its easy and quick calculations.


 ,
, 


