Article

Sustainability in the Design of an Itinerant Cultural Exhibition. Study of Two Alternatives

by
Natalia Muñoz-López
*,
Anna Biedermann
,
José Luis Santolaya-Sáenz
,
José Ignacio Valero-Martín
and
Ana Serrano-Tierz
Department of Design and Manufacturing Engineering, EINA, University of Zaragoza, 50018 Zaragoza, Spain
*
Author to whom correspondence should be addressed.
Submission received: 27 September 2021 / Revised: 10 October 2021 / Accepted: 20 October 2021 / Published: 22 October 2021
(This article belongs to the Special Issue New Trends in Design Engineering II)

Abstract

:
The sustainability improvement of museums and exhibitions is a recent concern for multiple organisations. The application of sustainability criteria is one of the most important strategies of innovation in design activities, products, and service systems. This study analyses the sustainability of two alternatives to an itinerant cultural exhibition service. The exhibition travels to 12 destinations over 3 years and is within a space of 300 m2. In the first alternative, the contents are printed and exposed on a physical medium, and in the second, audiovisual media projects the contents on the walls. Life cycle sustainability assessment is applied to evaluate the impacts in the environmental dimension and the economic and social dimensions. The calculation of indicators, such as the greenhouse gas emissions, total costs, and working time, which are referred to each sustainability dimension, is conducted. A descriptive, comparative study was performed to identify the impact factors with a higher incidence. The results demonstrate that the audiovisual exhibition is more sustainable than the printed exhibition, with a difference of 8.7%, 7%, and 6.6% in GWP100, CE, and TW indicators, respectively.

1. Introduction

Service systems are receiving increasing attention from marketers, designers, and business administrators, since the evolution towards a service economy, in which more customized solutions are provided, is taking place. At the same time, the design of sustainable solutions balancing social, economic, and environmental issues is required to achieve the challenges of the Sustainable Development Goals (SDGs) adopted by the United Nations in 2015.
In order to provide more sustainable services, the cultural sector is gradually integrating sustainability concepts and should apply methods and tools related to the current sustainability practice. Significant advances on the design of sustainable services as well as the integration of sustainability in cultural services associated with museums and exhibitions development are exposed below.

1.1. Advances in the Design of Sustainable Services

New trends in design entail the best possible combination of both operative and sustainable aspects, not only in the case of product systems but also in the development of service systems.
Approaches used to evaluate sustainability and improve service designs have been evolving. Particularly, models such as the life cycle sustainability assessment (LCSA), which evaluates environmental impacts and the economic and social aspects of a system [1,2], have been developed. LCSA is a trans-disciplinary framework that covers all three dimensions of sustainability by adopting a life cycle approach and broadens the life cycle assessment (LCA) methodology standardised in ISO 14040 [3].
The LCSA method has been mainly applied to product systems, and its application to service systems has been limited. In addition, in most of the studies, only the provision stage of the service life cycle is analysed. Activities conducted in service creation and actions developed when a service operation is finished are rarely considered. We reviewed recent studies on sustainability in service systems [4,5,6,7,8,9] (Table 1) and observed the following: they frequently compare impacts of alternatives as a research objective, their sustainability results focus on the environmental dimension, and in only a few cases were socioeconomic data obtained.
Thus, the application of practical approaches in the study of service systems, taking into account each sustainability dimension and a life cycle perspective, is required. Since the sustainability improvement of museums and exhibitions is a recent concern for multiple organisations, the study of this type of cultural services is carried out in this work.

1.2. Advances in the Integration of Sustainability in Museums and Exhibitions

Cultural services, particularly museums and exhibitions, have a significant impact on individuals, societies, the economy, and the environment [10,11,12,13,14]. Museums need to acknowledge that they are inextricably linked to sustainability principles [15]. In addition to being a permanent institution in the service of society and its development, in which the tangible and intangible heritage of humanity is exhibited for education, study, and enjoyment [16,17], they have started to be regarded as having a key role in shaping our sustainable future [18]. Museums seek to have a positive impact on sustainable development [19] and transmit the urgency of the crises in nature, so they should develop and implement sustainable solutions.
Cultural organisations have been encouraged to adopt more sustainable museums based on the triple bottom line approach, which evaluates their work according to their contribution to the social, economic, and environmental development goals of society [20,21]. The Working Group on Sustainability [22] was created to define sustainable solutions. These actions are relevant to increase the recognition of the impact generated by the cultural sector as well as other sectors [23]. Going green enables museums to connect to a deepening eco-consciousness among young individuals, their future audience and supporters [24,25,26]. To be sustainable, museums, through their mission, must be ‘an active and attractive part of the community by adding value to heritage and social memory’ [27].
In the last two decades, notable efforts have been made in museums and institutional buildings, in which transformations towards reducing their environmental impacts, especially energy demand [15,28,29], have been performed. Main advances are summarized in Table 2. A suggestion is to review the reliance on air conditioning and decrease water usage in museum operations, exhibits, and collection spaces. Further advice from the Museums Association consisted of incorporating virtual exhibits and collections [30] as well as other modern technologies such as hands-on interactive exhibits, virtual reality [31], and E-museums [32] to decrease the reliance on physical resources and converting to using energy from renewable resources to decrease environmental impact, at the same time allowing museums to become more attractive [33]. Another relevant view is that of the Canadian Museums Association [34]: a museum is sustainable if ‘it assesses the impact of its activities on the environment, on the quality of life of its stakeholders and on the economy’. The initiatives as part of Energy Performance Certification in the European Union (Buildup.eu) or Leadership in Energy and Environmental Design in the United States of America have helped to establish criteria for environment improvement.
In 2006, the Critical Assessment Framework was created by the Working Group on Museums and Sustainable Communities. It is based on a stratified approach that helps planners develop museums that achieve a culture of sustainability and fulfil the needs and opportunities related to individuals, communities, the museum, and global reality [35]. Another study developed a new eight-step carbon footprinting methodology to manage the impact of the museum loan programmes, tested using data from the Art Department of Amagueddfa Cymru-National Museum Wales [36]. Furthermore, various self-assessment methods are mentioned, such as ‘sustainability audits’ or checklists for the achievement of some sustainability standards [37]. However, these methods have a high degree of subjectivity, and the results obtained for various museums are not comparable.
Environmental and human health impacts have been investigated in the study of exhibitions at the Museum of Fine Art in Boston. The evaluation of materials and processes used in the display, transport, and preservation of cultural heritage is conducted using LCA [38]. This pioneering research in applying LCA to the museum’s permanent exhibited objects analyses museum activities and presents results on loan activities, options for lighting galleries, and heating and cooling systems. Additionally, a life cycle analysis library and beta tool dedicated to cultural heritage preservation and exhibition practices [39] has been applied to obtain environmental and human health impacts of three seventeenth- and eighteenth-century silver objects.
Progress in integrating sustainability in museums and other service systems is conditioned by the selection of appropriate indicators. Traditional indicators to measure a museum’s performance are attendance, revenue, membership, sales in gift shops, media coverage, balanced books, and corporate events [40]. Nevertheless, the unitary cost of a visit to the museum, estimated as the ratio between the total costs of the institution and the total number of visitors, is identified as a relevant sustainability indicator. The list of indicators pertaining to eco-museums [41] is substantially increased if they are described as a list of activities, actions, and effects that museums can have on society. The proportion of earned income (income earned by museums through activities, e.g., selling tickets and souvenirs, renting spaces, and lending objects) in the total revenues of a museum is also used [42] to estimate their level of cultural entrepreneurship.
Another model for evaluation [43] suggests five indicators: unconventional territory adoption, in situ conservation and interpretation, management of sites conducted by liaison, cooperation and development of partnerships, empowerment of local communities, and potential for interdisciplinary and holistic interpretation. According to the International Council of Museums, an important indicator for measuring a museum’s success in becoming sustainable is intellectual and financial autonomy.
Studies [44,45,46,47,48] have considered four pillars in the sustainability of museums: economic, social, environmental, and cultural. The maximum level of sustainability is attained when the equilibrium among the four pillars or spheres is reached. In achieving equilibrium, progress in each of the four dimensions must be assessed regularly, requiring the creation of valid, reliable, and simple instruments for objective measurement. Often, increased performance in one dimension creates negative effects on another dimension.
Museums, defined by their permanent collections, use temporary and itinerant exhibitions to engage with the public, make local audiences return to the museum, and help attract sponsors and media attention and maintain ticket pricing [50]. A travelling exhibition remains in each destination for a relatively short time, refers to a specific theme, and is usually exhibited in a relatively small space. Regarding the current situation influenced by COVID-19, the World Tourism Organization estimated that the decrease in tourism from 2019 (before the pandemic) to 2021 is 85% [51]. The importance of temporary itinerant exhibitions is expected to increase because they help local audiences by creating a sense of urgency and exclusivity.
In this work, a practical approach is applied to analyse the sustainability of an itinerant exhibition and select the most sustainable design between two different alternatives. The methods applied and the results obtained in a specific case study are presented in the following sections.

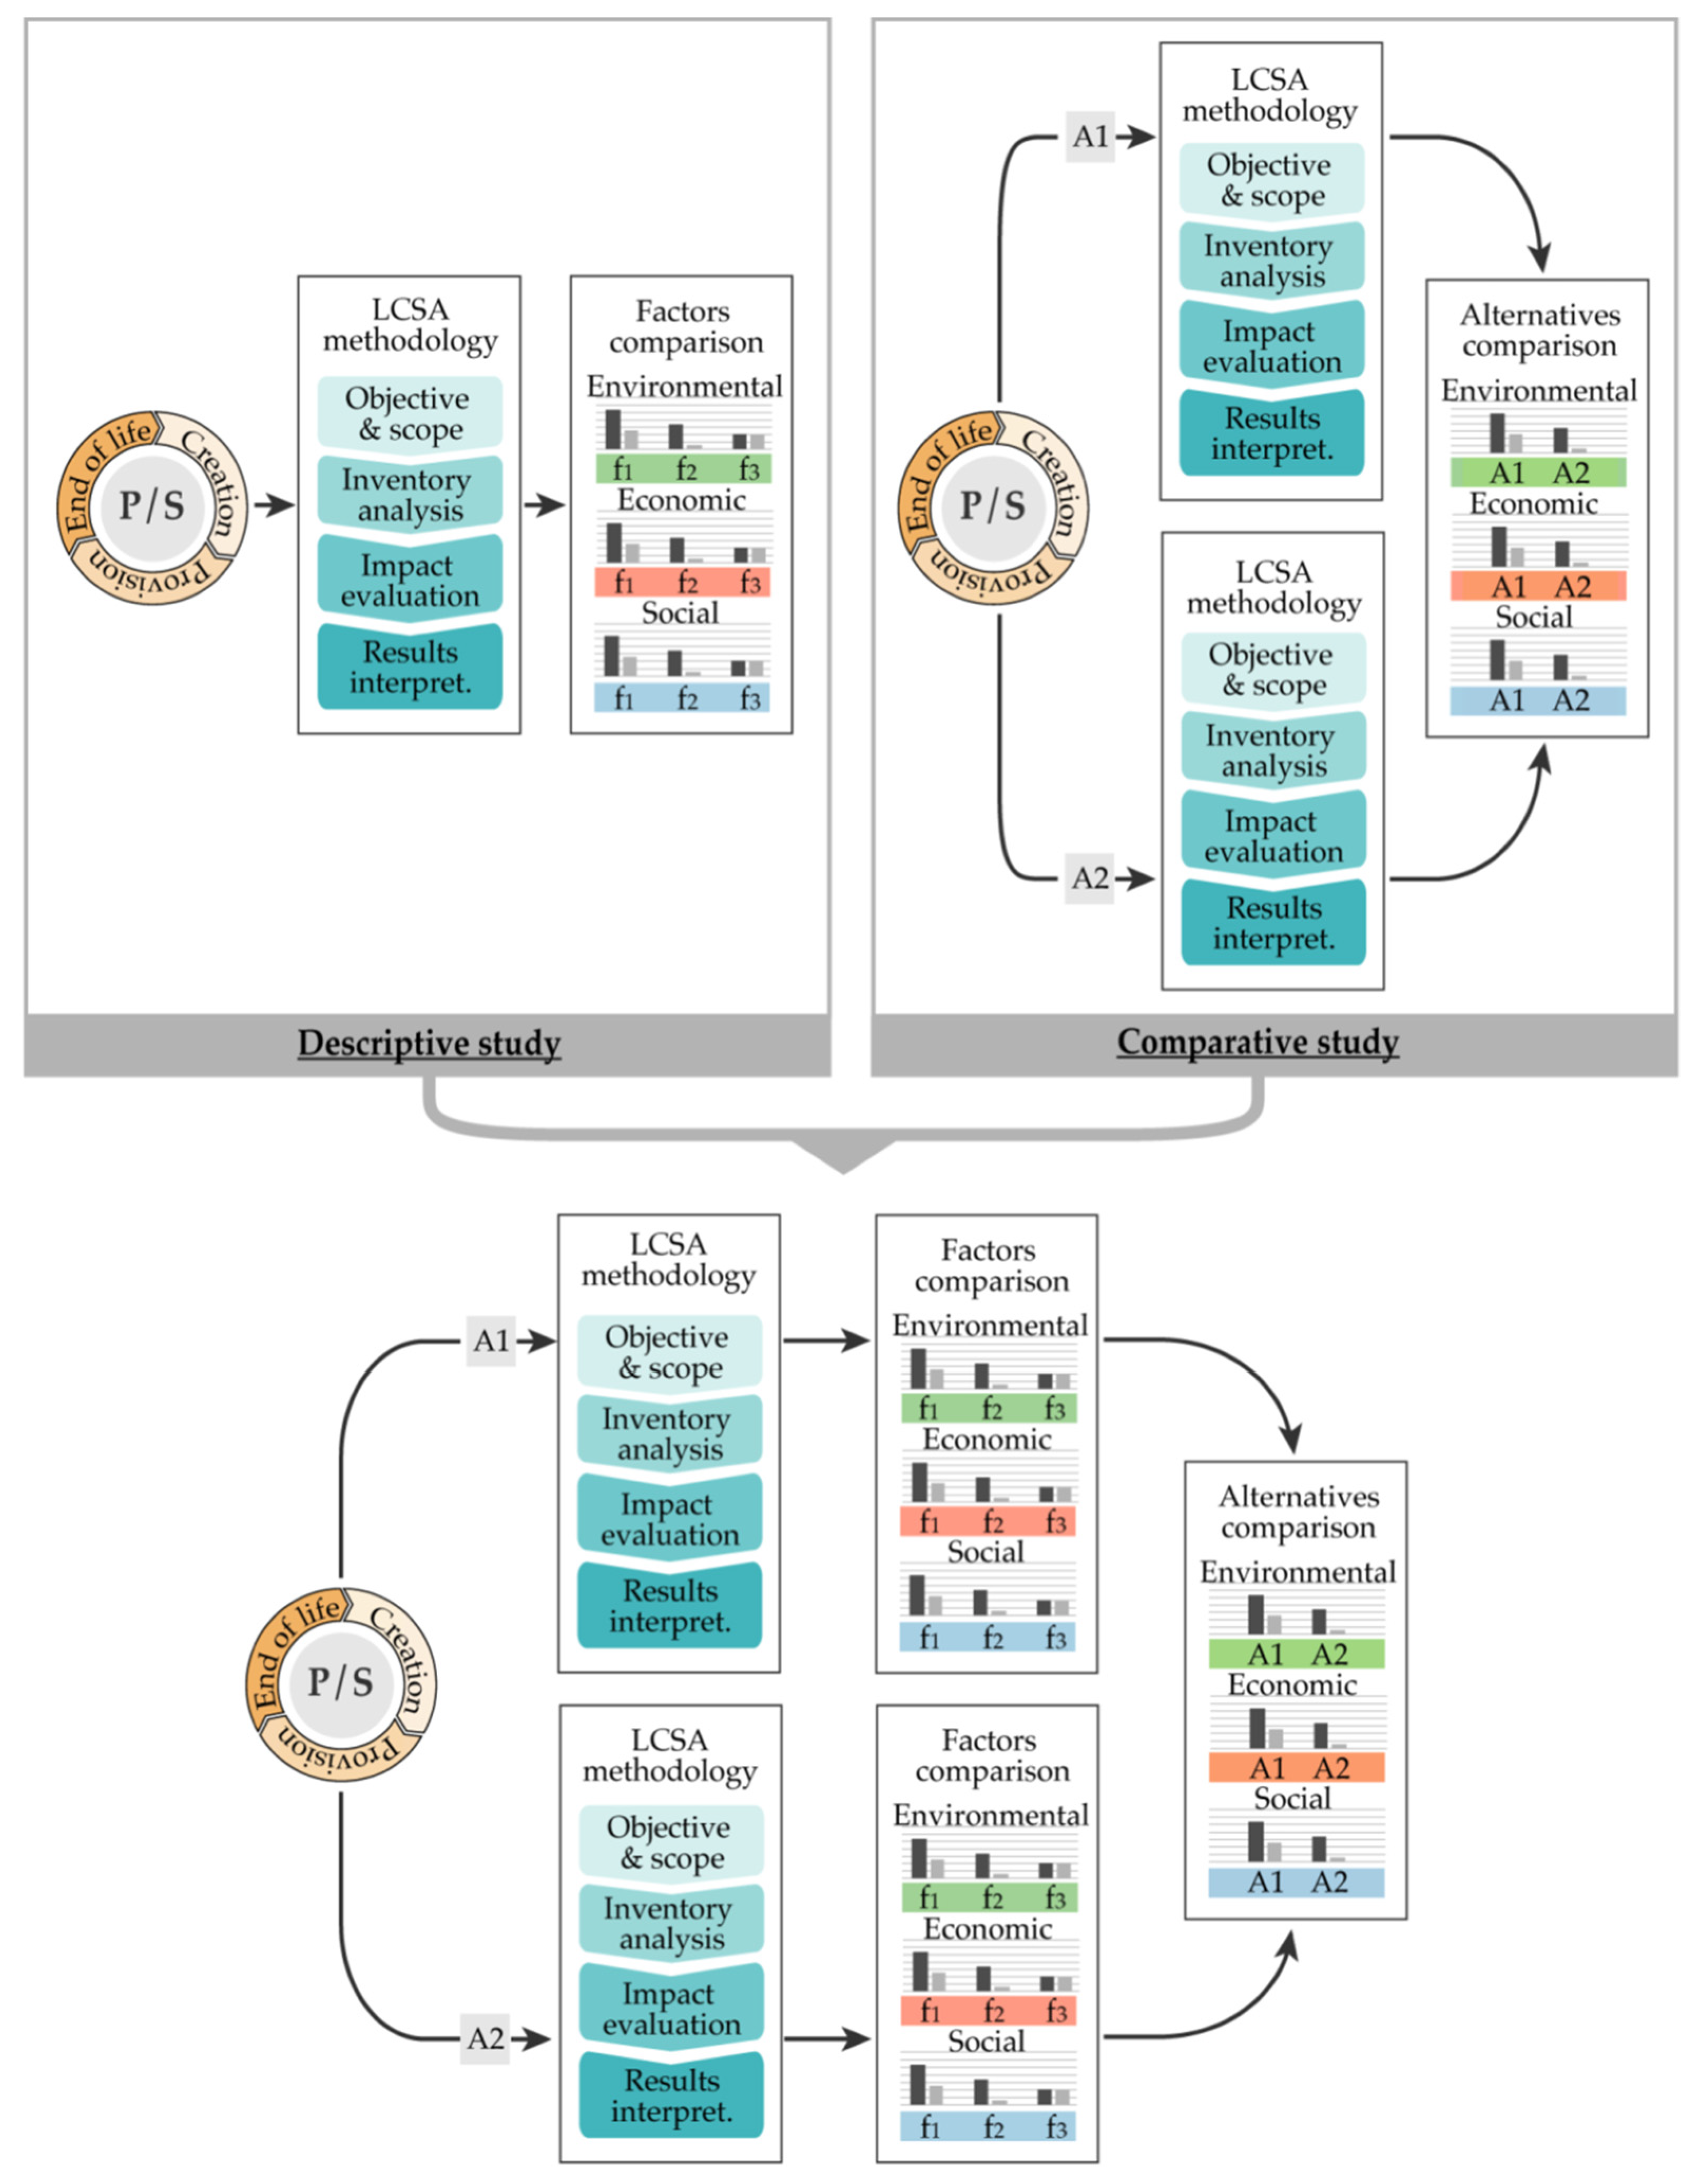
2. Materials and Methods

In this study, the LCSA methodology is applied to analyse the impacts produced in sustainability. The development of this methodology implies a life cycle approach, in which the impacts of all life cycle stages need to be considered comprehensively. According to ISO 2006 [3], different phases can be differentiated within the life cycle of a product system, which can be grouped into three main stages: creation, use, and end-of-life. Similarly, the life cycle of a service system can be divided into three main stages: service creation, provision, and end-of-life treatment, in which activities and intermediate products are required [52].
The background for LCSA development is the ‘triple bottom line’ approach of sustainability (referred to as environmental, economic, and social impacts). It is achieved by combining the environmental life assessment, life cycle costing, and social LCA techniques [1,2]. The LCSA practice application is based on four phases:
(1)
Definition of the goal and scope of the study.
(2)
Inventory analysis: identification and quantifying of the inputs and outputs.
(3)
Impact evaluation in each sustainability dimension using different indicators.
(4)
Interpretation of results, study conclusions, and recommendations.
Two types of sustainability studies applied to product or service systems can be distinguished (Figure 1). The first type, a descriptive study, focuses on evaluating a system and identifying the different factors (f1, f2, f3, …) affecting the indicators of each sustainability dimension. Results interpretation in this type of study can be used to achieve sustainability improvements [53]. The second type, a comparative study, evaluates the sustainability of two or more scenarios or alternatives (A1, A2, …). This type of study focuses on comparing impacts in each sustainability dimension (environmental, economic, and social) and determining the most sustainable alternative. Many studies have applied the LCSA to evaluate the sustainability of product systems [54].
In this study, the LCSA is applied to obtain sustainability indicators for a service system. Additionally, a combination of descriptive and comparative studies was conducted to achieve a thorough sustainability analysis of the system (Figure 1). Thus, a comparative presentation of the impact factors of two different service alternatives is performed, and factors with the highest incidence in each sustainability dimension are identified. Moreover, a parallel comparison between indicators referring to each sustainability dimension was conducted, enabling the most sustainable alternative to be selected.
A critical point in the analysis is the selection of effective indicators to assess each sustainability dimension. The number of indicators for measuring the three dimensions of sustainability can vary according to the difficulty of obtaining practical information and the scope of the study. In this study, quantitative indicators are selected to measure the impacts of each sustainability dimension, and the results are presented without aggregation. The global warming potential (GWP100) and execution cost (CE) indicators were used to evaluate the environmental and economic dimensions. GWP100 represents greenhouse gas emissions, which affect the Earth’s warming and measures how much energy the emissions of 1 ton of a gas will absorb over 100 years, relative to the emissions of 1 ton of carbon dioxide (CO2). CE expresses the total cost of developing an activity or process within a system. These indicators are commonly used to evaluate environmental and economic impacts. Additionally, the selection of quantitative indicators to value social impacts is a difficult task. Workers were selected as the stakeholder category to assess the social dimension of sustainability, and the working time (TW) indicator or time required to develop an activity was used to quantitatively evaluate the social impact.
Specific software and different databases were used in this study to determine sustainability indicators. The environmental unit indicators of different materials and products are presented in the ProBas database [55]. The environmental impact due to raw material procurement and manufacturing processes of audiovisual equipment was consulted in the literature [56]. Emission factors of commercial electric companies [57] were used to calculate greenhouse gas emissions from both electric and fuel consumption. Cype software was used to obtain a wide amount of data on construction, assembly, and dismantling activities. Specifically, the execution costs and working times of activities in the study case are calculated using this software. In addition, CE3X software was used to calculate the energy consumption of a building or space according to its characteristics and location data.

3. Case Study

A cultural service, which consists of an itinerant exhibition dedicated to didactically transmitting the legacy of Francisco de Goya, is the object of study. Itinerant exhibitions will travel to 11 Spanish and Portuguese destinations (Zaragoza, Bilbao, Valladolid, Santiago, Oporto, Lisbon, Seville, Málaga, Murcia, Valencia, and Barcelona) after their inauguration in Madrid, remaining for 3 months in each. The exhibition will be open daily (except Mondays) for 11 hours over 3 months at each destination.
Two alternatives were analysed. In the first alternative, the cultural content of the exhibition will be exposed to hard copies (print on fabric and vinyls). In the second alternative, these contents will be projected onto the exhibition hall walls using audiovisual media. In both alternatives, a rectangular exhibition area of 300 m2 (20 m × 15 m) and 4 m high is required. The entire life cycle was also reviewed. Thus, in each alternative, the activities necessary to transform an empty hall into a suitable exhibition space are analysed in the creation stage, as is the service development during the provision stage and the dismantling and management of all used materials in the end-of-life stage after the exhibition is finished in the last destination. The design of the printed support and audiovisual content was not included in the scope of this research.
The LCSA was used to assess and compare the sustainability of both itinerant cultural exhibition services. An entire tour (12 destinations) was also considered. The sustainability indicators of each alternative are expressed considering the entire tour. In addition, to facilitate a comparison of these indicators with other cultural exhibitions in which the operation time or the exhibition area differ, a functional unit of 1 month and 1 m2 can be defined.

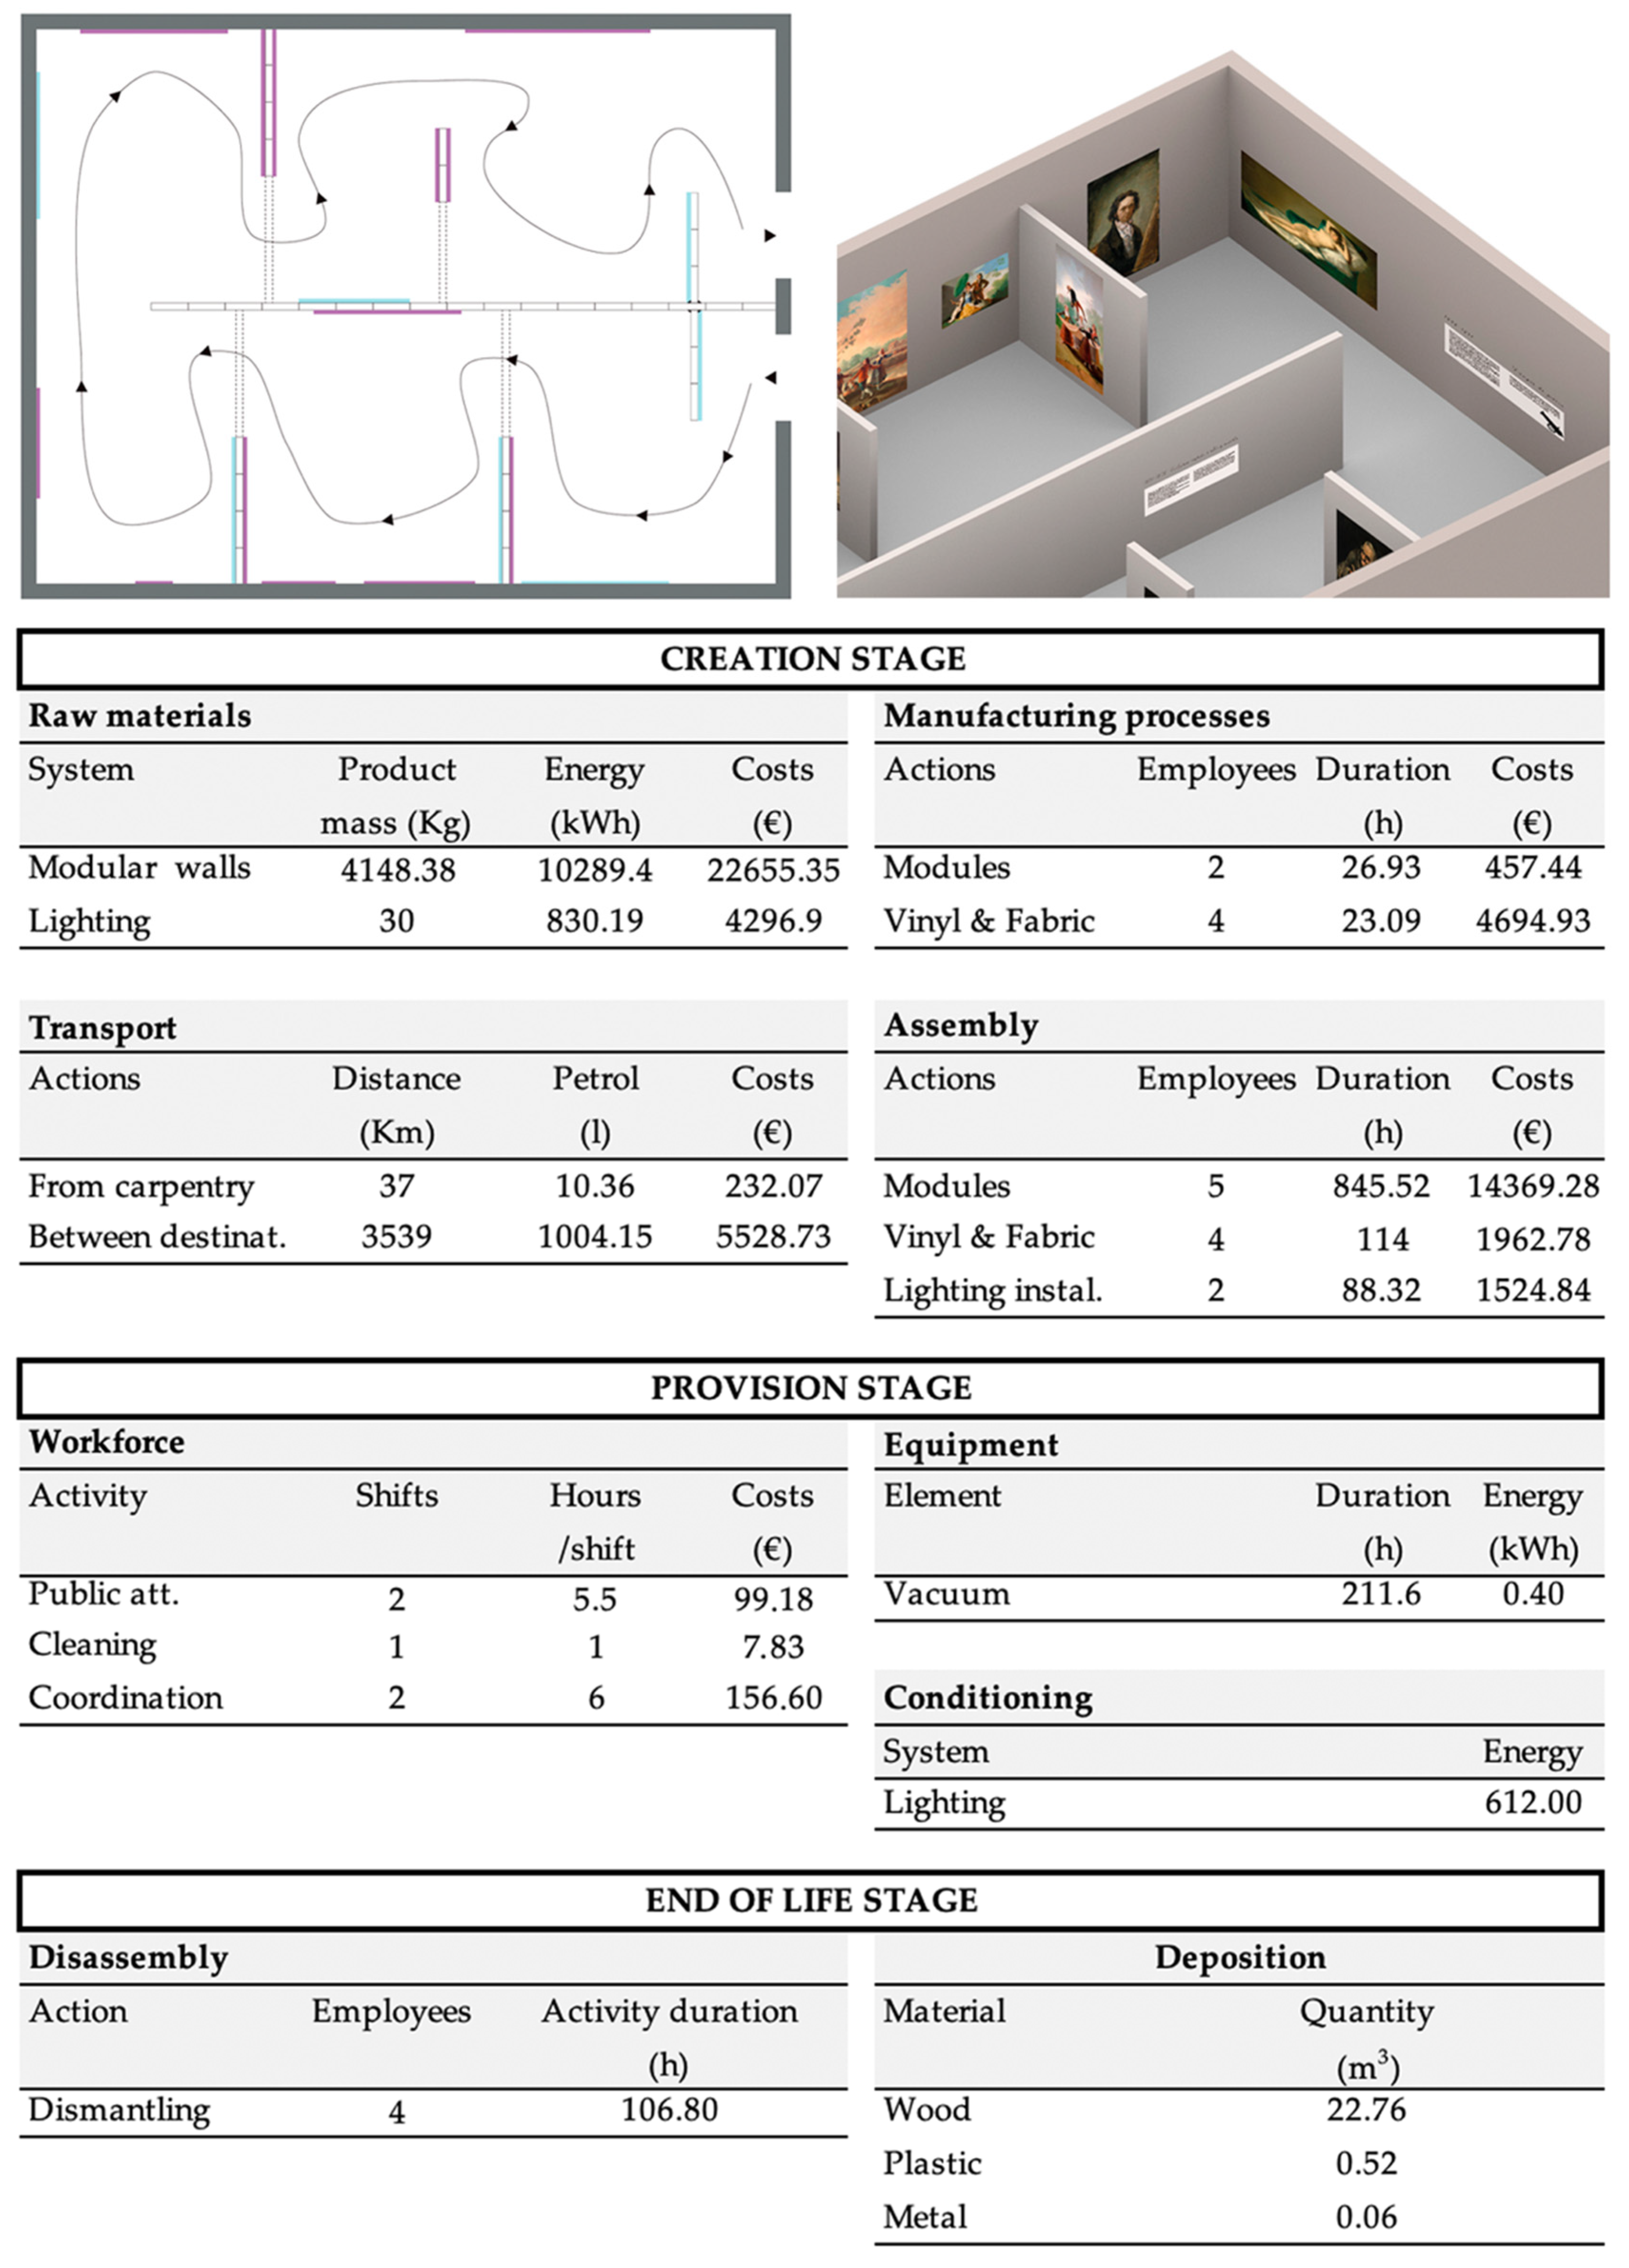
3.1. Alternative 1: Printed Exhibition

In this case, the preliminary conditioning of the exhibition area involves the construction of a modular wall system with the printed material exposed on them (printed and cut-out vinyl). Thirty-seven modules (1 m × 3 m × 0.2 m) were attached to the wall with struts and brackets, and the modules were properly distributed in the exhibition area to obtain an appropriate route to show the cultural content (Figure 2). The structure of each module is made of wood slats, joined by dowels and adhesives, and subsequently covered with medium-density fibreboard (MDF) panels; later, successive products (filler, primer, and two paint layers) were applied to them. Finally, printed vinyls and cut-out vinyls were attached to some of these modules.
The raw materials required for the construction of the modular wall system, as well as manufacturing processes and assembly of on-site activities, were examined in the creation stage. The sequence of activities performed by the team of carpenters, printer drivers, and electrical installers, as well as the materials required for the full preparation of the exhibition, were determined. In addition, the transport of materials was considered, from carpentry to the exhibition hall (37 km) and between destinations (3539 km in total). A truck with a capacity of 25 m3 was used.
The service provision stage mainly involves the activities of public attention and coordination, conducted in two shifts of 5.5 and 6 h, respectively. The cleaning of the exhibition hall is organised before opening in one shift of 1 h (which includes daily floor vacuuming). Exhibition development is conditioned by suitable lighting, using 20 spotlights distributed by electrified rails and content oriented, and appropriate heating and cooling. When each exhibition finishes (end-of-life stage), the modular wall system can be disassembled and reused in the next destination. However, printed materials must be manufactured again for each destination because their reuse is not possible. At the last destination, all materials were discarded, classified into appropriate categories (wood, plastic, or metal), and transported to waste management plants (6.6 km from the exhibition hall).
Sustainability was evaluated using the indicators selected in the prior section. Results obtained for the printed content alternatives are presented in Table 3 and expressed per entire exhibition tour and per month and m2. Throughout the service life cycle, more than 51 tons of CO2-eq are emitted, the total execution costs exceed EUR 358,000, and the accumulated working times by workers involved in the development of the service make up almost 25,000 h. Indicators expressed per functional unit are 4.74 kg CO2-eq, EUR 33.17, and 2.3 h. The provision stage generates most of the impact on the environmental, economic, and social dimensions, 71.6%, 79.4%, and 89.3% of the total impact, respectively. The creation stage also had a significant incidence.

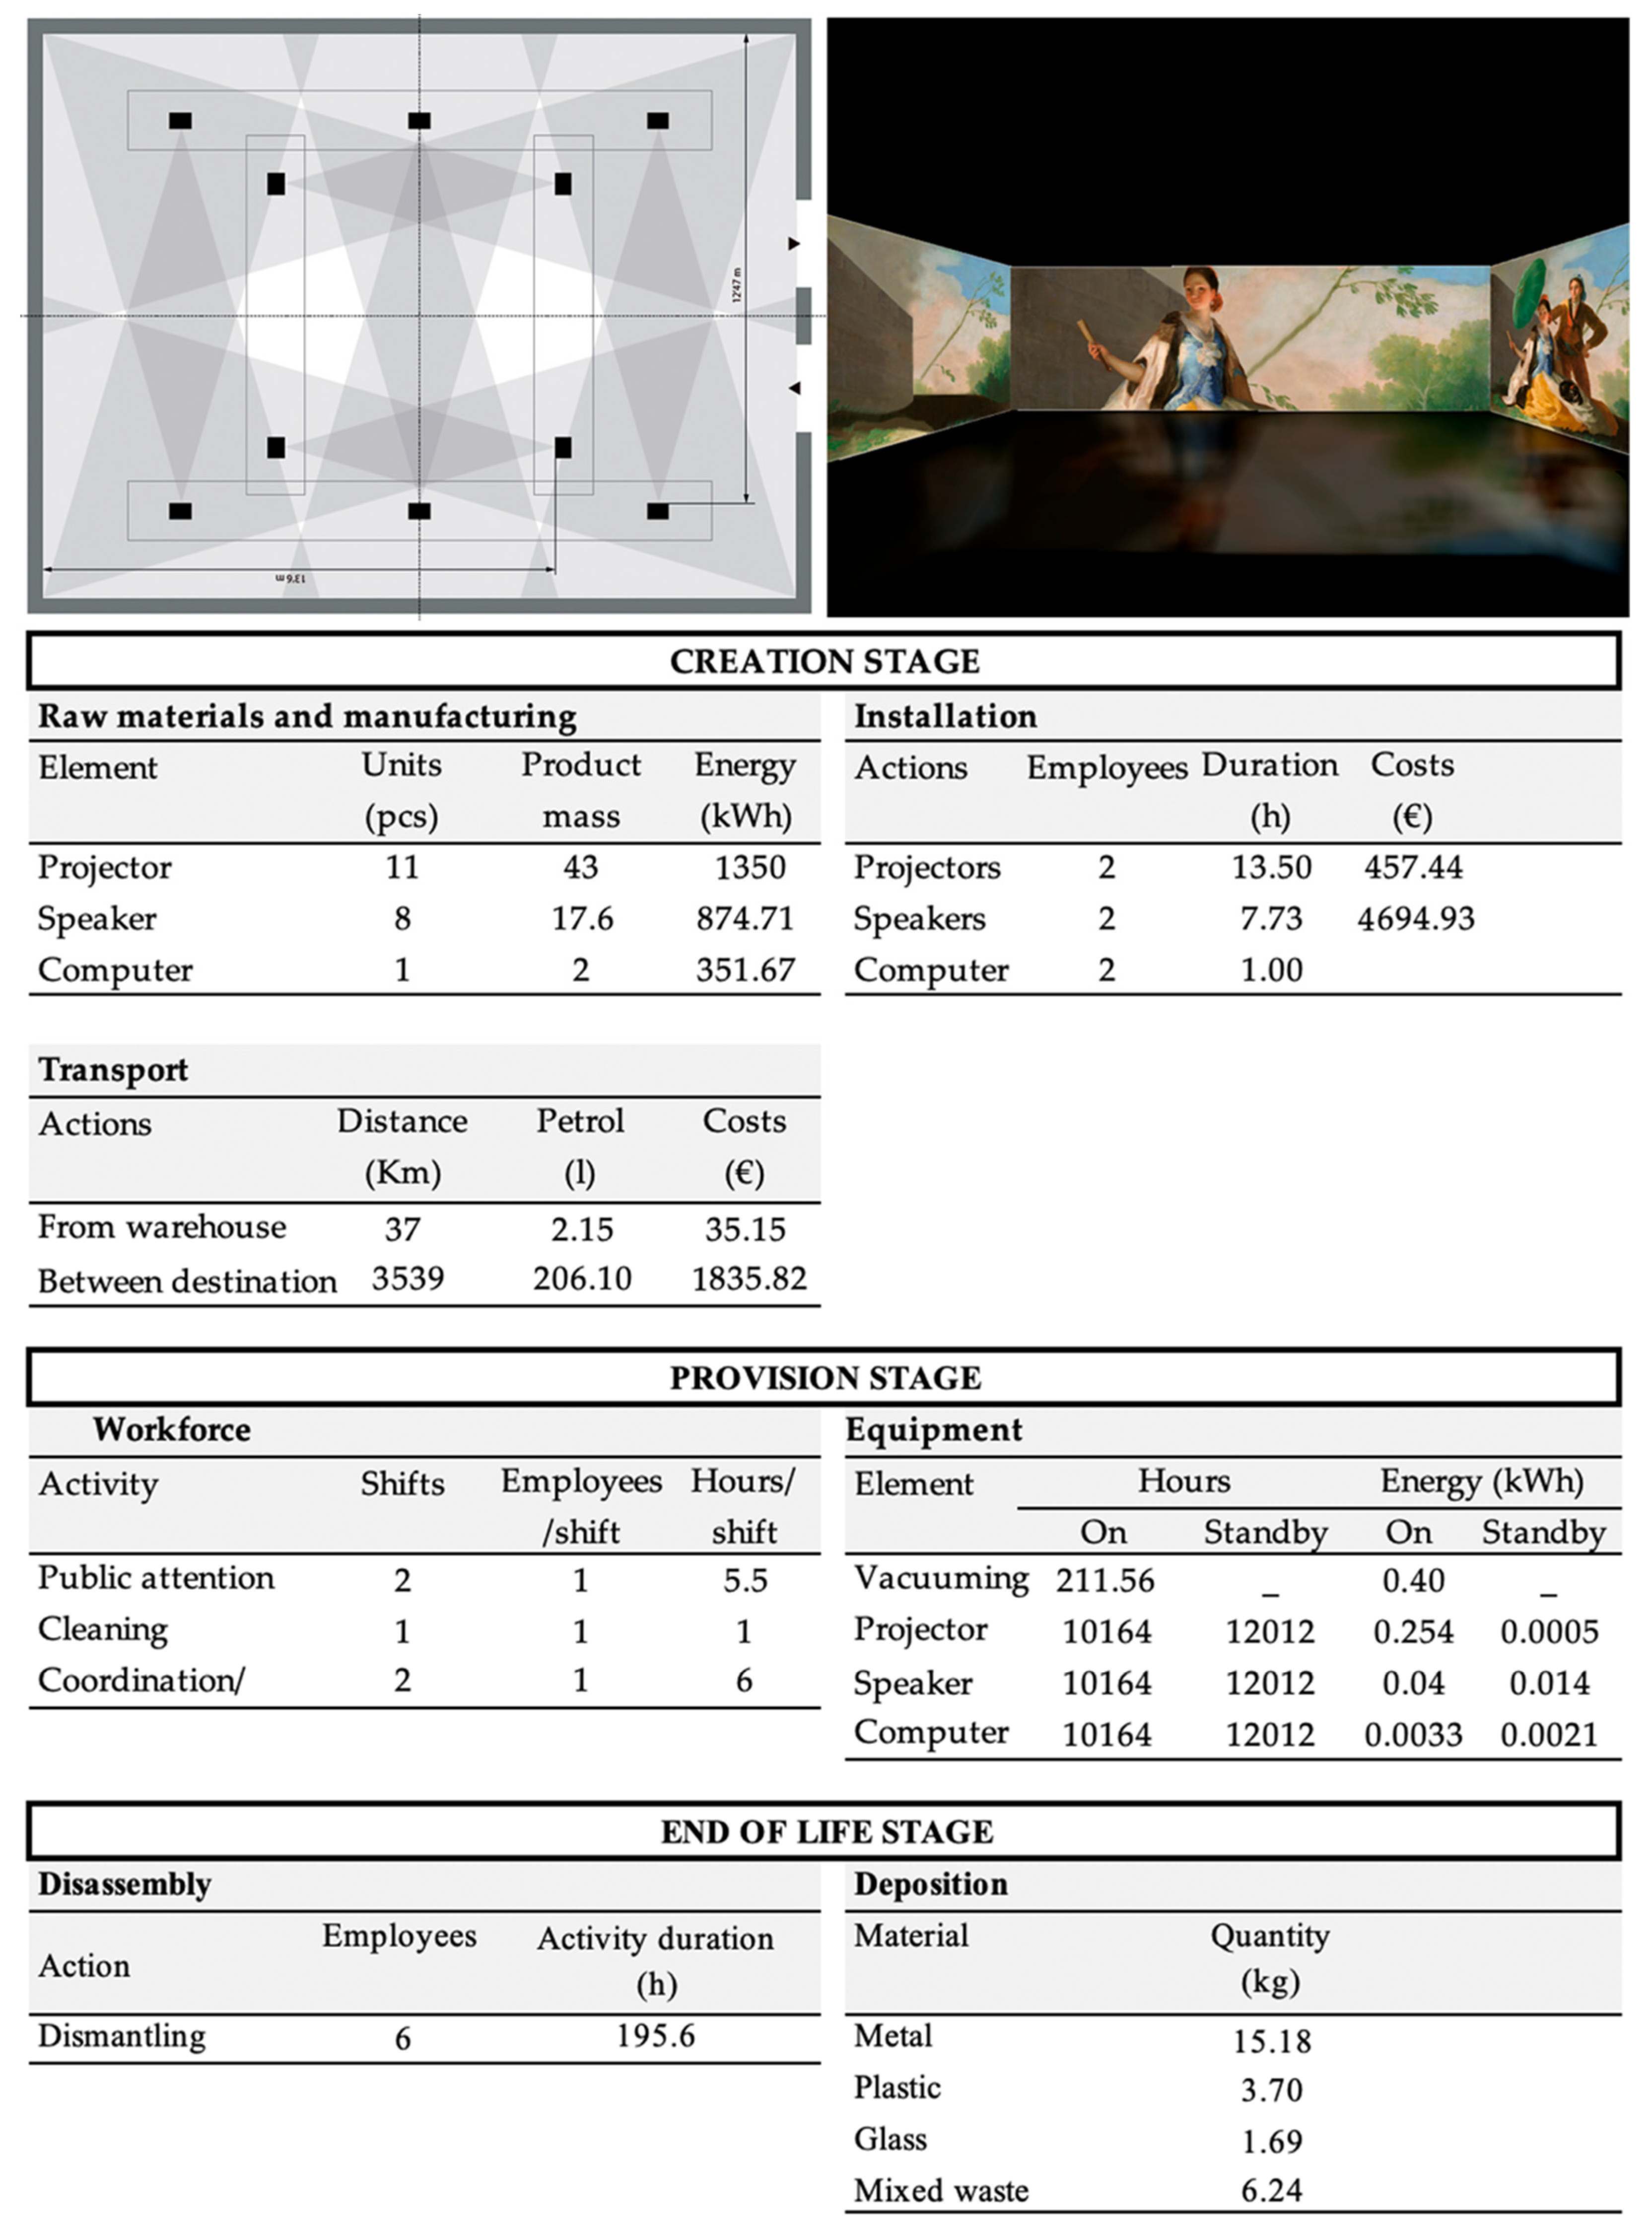
3.2. Alternative 2: Audiovisual Exhibition

In this alternative, the exhibition of cultural content is based on the use of audiovisual media. Contents are projected onto the four walls by ten projectors (plus one spare), and audio tracks are emitted by eight speakers. This equipment is conveniently distributed and installed by two workers on the technical ceiling (floor plan and showroom perspective; Figure 3). In addition, a computer to control audiovisual material is required. The device’s raw materials and manufacturing data, transport from the warehouse to the exhibition hall (37 km), transport between destinations (3539 km), and installation activities in the showroom are examined in the creation stage.
Activities of public attention, coordination/on-call technicians, and cleaning are developed by five workers in the provision stage. Moreover, exhibition development is accomplished by the correct operation of equipment (on and standby modes are differentiated according to the working mode). Specific lighting is not necessary for this type of exhibition. The safety lighting in the showroom is sufficient and not considered. The data are summarised in Figure 3.
When each exhibition finishes after 3 months, the equipment is disassembled, uninstalled, and moved to the next destination in one rented van, with a 3 m3 capacity, by the installers. At the final destination, in addition to the dismantling activity after the exhibition closed, all the materials were discarded (26.81 kg), moved to waste management plants (6.6 km away), and categorised according to the nature of the material (metal, plastic, glass, or mixed waste).
The sustainability indicators obtained in each life cycle stage of the audiovisual exhibition are listed in Table 4, expressed per entire exhibition tour and per month and m2. If the total life cycle is evaluated, less than 47 tons of CO2-eq are emitted, the total execution costs reach EUR 333,000, and accumulated working times by the workers involved in the development of the service are approximately 23,000 h. Indicators expressed per functional unit are, respectively, 4.33 kg CO2-eq, EUR 30.85, and 2.15 h. Thus, lower impacts than in the printed exhibition are valued. Notably, indicators calculated in the provision stage are significantly higher than those obtained in the creation and dismantling stages: 89%, 80.1%, and 89.3% of the total impact, respectively.

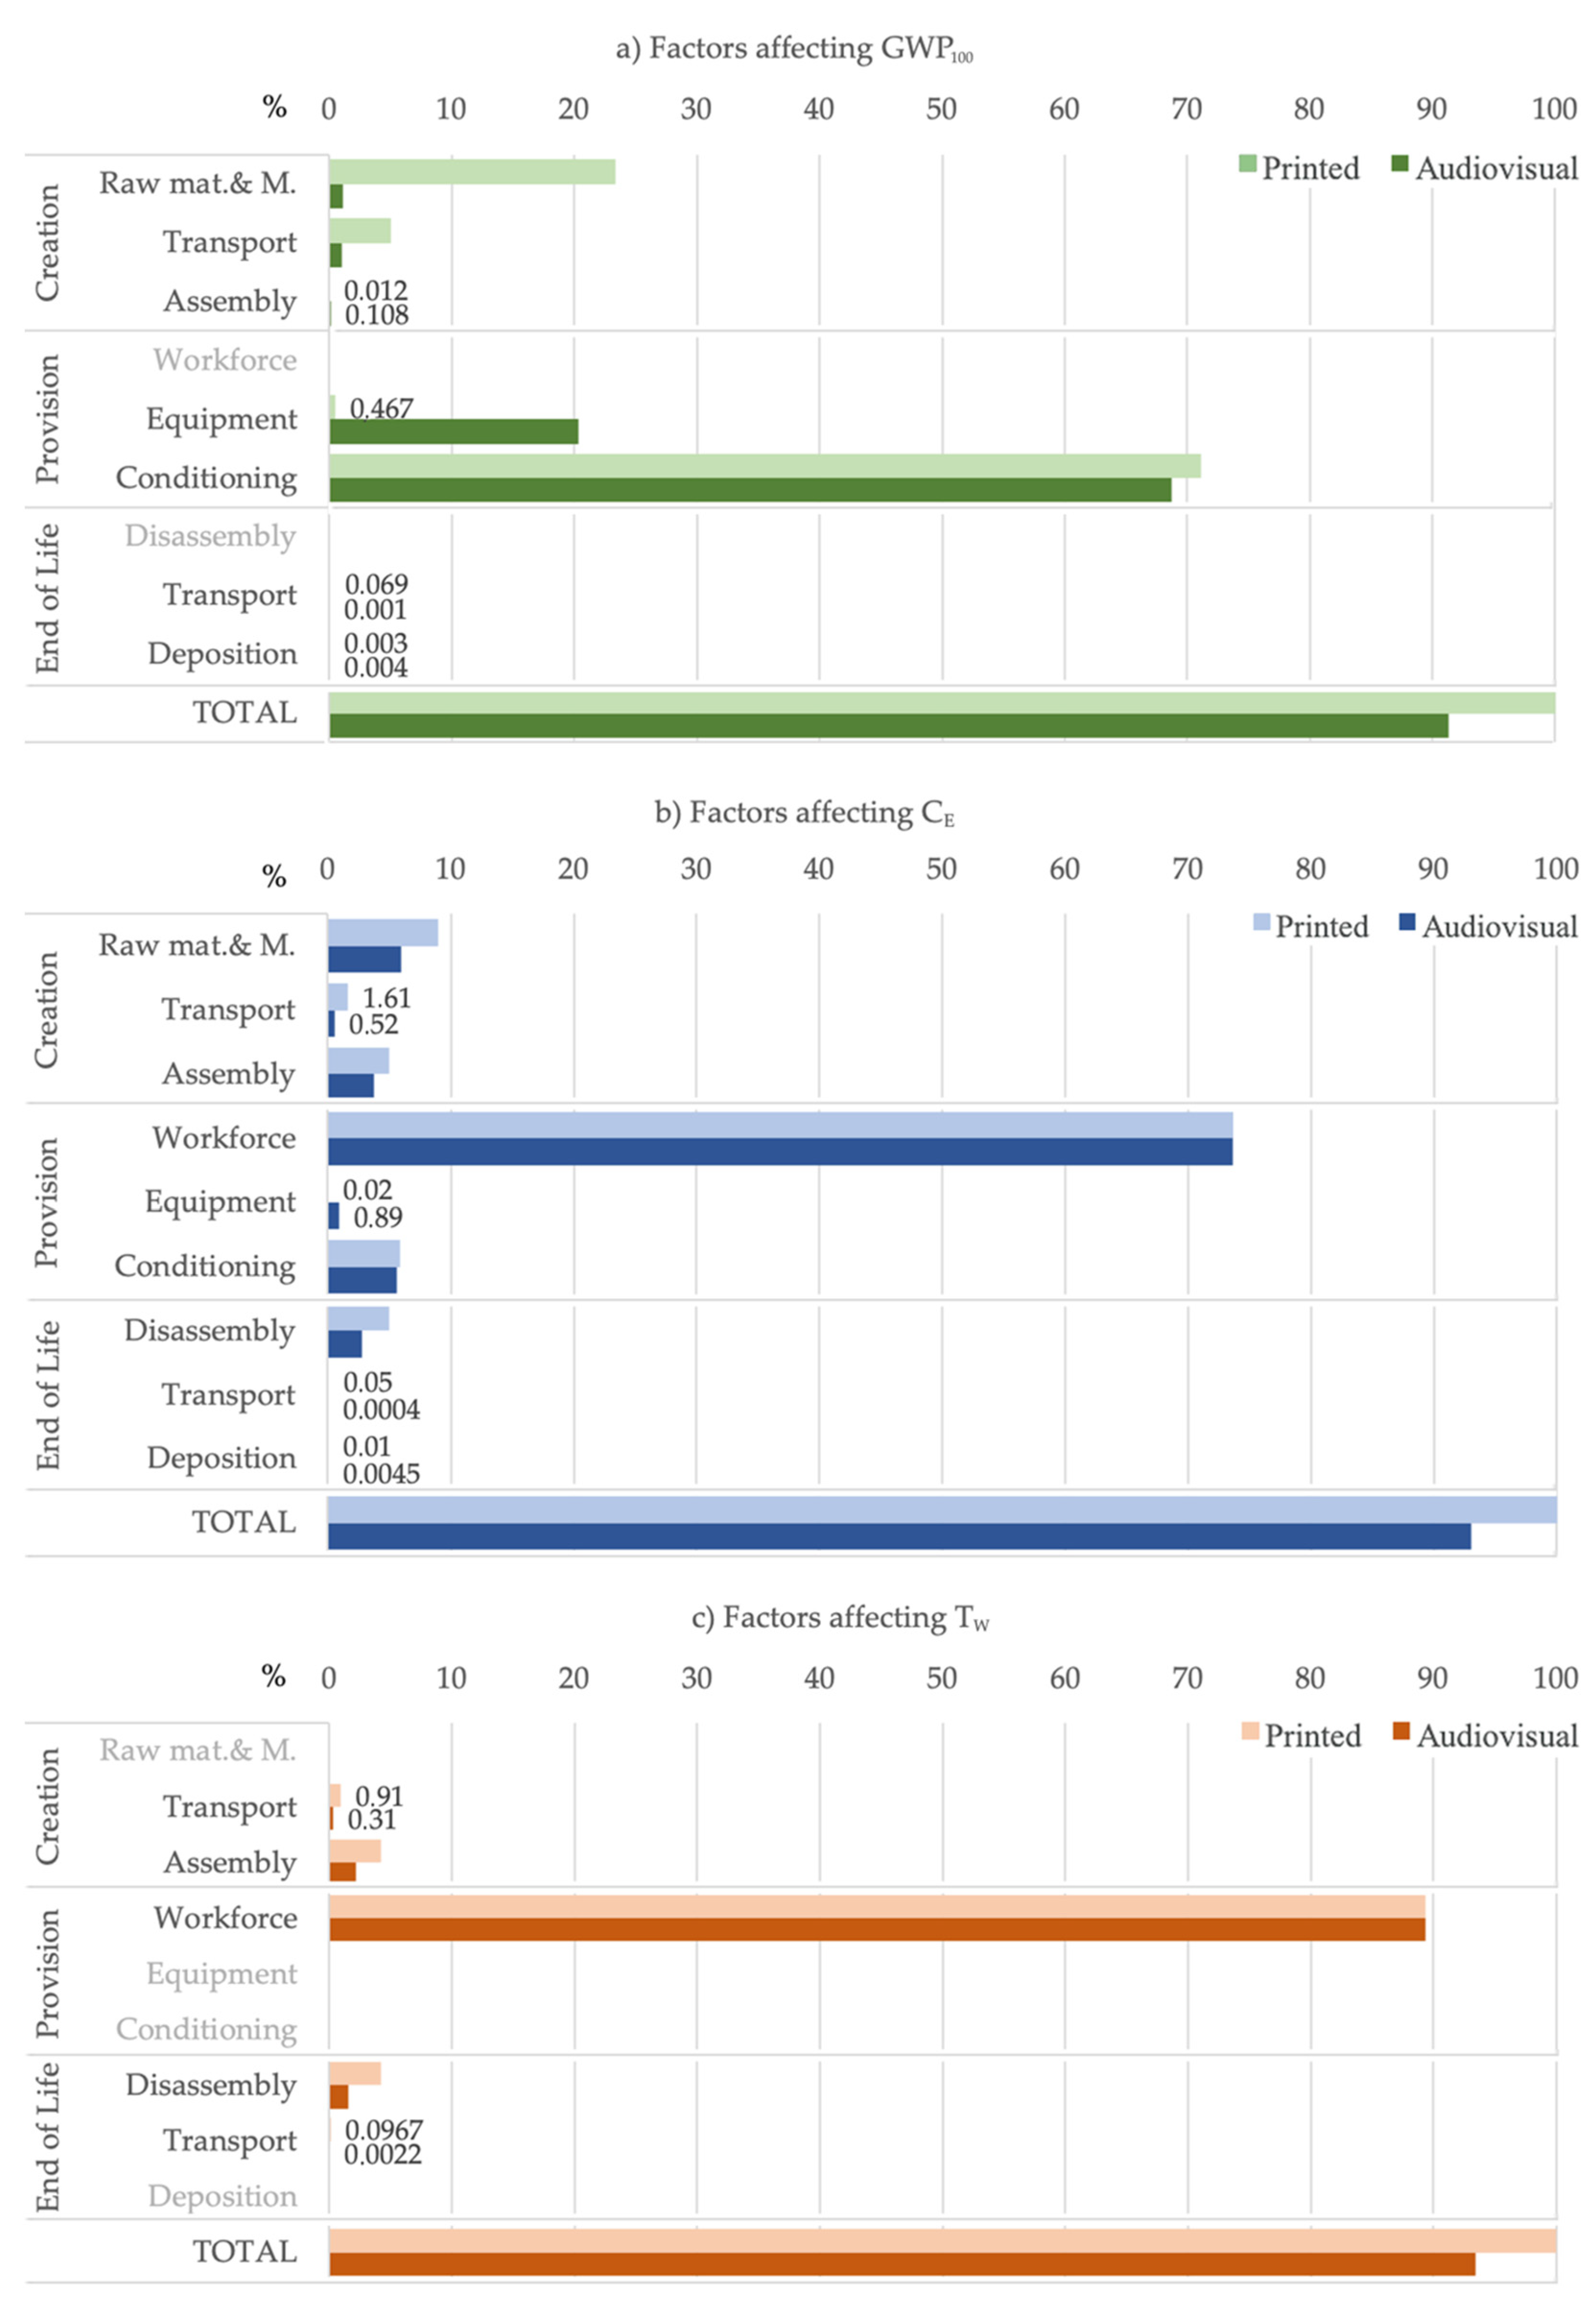
3.3. Comparing Results

The sustainability indicators obtained for the two exhibition alternatives are compared in Figure 4. Diagrams of the GWP100, CE, and TW indicators are shown in Figure 4a–c, in which the percentage distributions of different impact factors are shown. A set of factors was selected to express the impact distribution for each life cycle stage; some appeared with a slightly marked font because they could not be evaluated.
Significant variations were observed in the indicators evaluated during the creation stage. In the case of the printed exhibition, the mass of materials required in the construction of the modular wall system is 4.1 tons. The audiovisual exhibition alternative does not need the subdivision of the exhibition space, and material requirements are considerably reduced. Thus, the incidence of different factors during the creation stage showed a notable decrease. GWP100 and CE indicators reduce, respectively, 11.1 tons of CO2-eq and EUR 13,250, due to the obtainment of raw materials and manufacturing processes.
The use of a minor amount of material has a direct effect on transport activity. Transport of materials from warehouses and between destinations is included in the creation stage, and transport of materials to waste treatment facilities is included in the end-of-life stage. Fuel consumption, as well as costs and working times due to operations associated with the loading, transport, and unloading of materials, are reduced in the audiovisual exhibition alternative. If the entire tour is considered, GWP100, CE, and TW indicators are reduced, respectively, 2.2 tons of CO2-eq, EUR 6100, and 151 h.
A significant increase in greenhouse emissions was observed in the audiovisual alternative during the provision stage. An increase of 8.9 tons of CO2-eq was evaluated in the GWP100 indicator. Although the incidence of conditioning is higher in printed exhibitions because it requires appropriate lighting (content oriented), in contrast with the audiovisual alternative where a dark room is necessary, the energy consumption by equipment is considerably higher in the audiovisual exhibition. In addition, energy consumption affects the CE indicator. An increase of EUR 2200 is calculated. Nevertheless, execution costs in the provision stage depend mainly on the workforce factor, and this factor is not modified much in the two projected exhibition alternatives.
Finally, in the end-of-life stage, sustainability indicators of the audiovisual alternative are also lower than those of the printed exhibition. As a smaller amount of materials is required, activities considered in this stage (disassembly, transport to treatment facilities, and deposition) cause lower impacts. Particularly, disassembly operations generate a reduction of EUR 5477 and 657 h in the CE and TW indicators, respectively.
Comparing the total values of indicators for each sustainability dimension demonstrates that the impacts of audiovisual exhibitions are lower than those of printed exhibitions. Greenhouse emissions, execution costs, and working times are reduced, respectively, 4.4 tons of CO2-eq, EUR 25,173, and 1648 h, along the entire tour of the cultural service development; thus, a relative percentage reduction of 8.7%, 7%, and 6.6%, respectively, was obtained.

4. Conclusions

Museums and exhibitions have been endeavouring to be more sustainable and transmit the urgency of the climate crisis to society. Understanding the sustainability impact of cultural services can help achieve this goal. However, there is little evidence in the literature of studies applying assessment methods to evaluate cultural services, museums, or exhibitions. In addition, the sustainability or sustainable development concept is usually associated with the realization of activities related to conservation and preservation of cultural heritage rather than the quantitative assessment of environmental, economic, and social impacts. This study contributes to obtaining sustainability indicators and projecting itinerant exhibitions with sustainable criteria.
Most studies on sustainable design have focused on product systems. In studies of service systems, sustainability is usually only analysed in the provision stage and from an environmental view. In this work, a multidimensional approach is applied. According to the LCSA method, environmental, economic, and social dimensions are considered and the GWP100, CE, and TW indicators are, respectively, evaluated. Moreover, a life cycle approach was applied, and all the inputs and outputs produced in each activity and used resources in the creation, provision, and end-of-life stages were analysed. This work combines descriptive and comparative sustainability studies in order to analyze and compare two different design alternatives of an itinerant exhibition.
The development of an itinerant exhibition that travels to 12 destinations over 3 years has been studied. The exhibition is dedicated to didactically displaying the legacy of ‘Francisco de Goya’ within an exhibition space of 300 m2. In the first alternative, the contents are printed on fabric or vinyl disposed on auxiliary modular MDF walls distributed adequately to create a tour in the exhibition hall. In the second alternative, the contents are projected directly into the walls of the exhibition hall using an appropriate system of projectors and speakers.
The analysis of service sustainability is conducted by combining descriptive and comparative study types. Thus, the most sustainable alternative is selected, and the most significant factors affecting the sustainability of each alternative are determined. In each sustainability dimension, the impacts of audiovisual exhibitions are lower than those of printed exhibitions. The greenhouse emissions, execution costs, and working times are reduced by 4.4 tons of CO2-eq, EUR 25,173, and 1648 h, respectively, along the entire tour of the cultural service development.
Sustainability analysis with a life cycle perspective facilitates a comparative study of the two exhibition alternatives. The mass of materials required in the creation stage of the printed exhibition was considerably higher than that in the audiovisual exhibition. Thus, the incidence of different activities and processes associated to the creation stage (i.e., raw materials obtaining, manufacturing, transport, assembly) showed a notable decrease in the case of the audiovisual alternative. Reductions of 13.4 tons of CO2-eq, EUR 19,300, and 960 h were evaluated in the GWP100, CE, and TW indicators of the service creation stage, respectively. The use of less material is also observed at the end-of-life stage. Particularly, dismantling activities involve a significant reduction in cost and working time. During the provision stage, the energy consumption by the equipment was considerably higher in the audiovisual exhibition. Thus, an increase of 8.9 tons of CO2-eq is evaluated in the GWP100 indicator, and operation costs increase by EUR 2200 along the entire tour exhibition development.
The final values of sustainability indicators show that in the studied cases the audiovisual exhibition alternative is more sustainable than the printed exhibition. The results are independent of the presented content but related with the scale and duration of the service operation. If the time of the service provision were extended, more impacts related to the energy consumption of the projectors would be registered in the case of the audiovisual exhibition. On the other hand, if the size of the exhibition space was to be increased, more public attention personnel would be needed in case of the printed exhibition; meanwhile, in the case of the audiovisual one, as it operates in an open layout, the same number of personnel could be maintained, even if the size were doubled. The sensibility analysis, which assesses the impact of those modifications, will be conducted in future studies. Further research should also assess the cultural dimension of sustainability, expand the scope of the study, add other involved factors, or perform a sensitivity analysis to observe the variations produced by the exhibition size, the number of locations, or the distance between them. Other types of itinerant cultural exhibitions could also be analysed and compared to understand the most sustainable option.

Author Contributions

Conceptualisation, A.B.; methodology, J.L.S.-S.; software, N.M.-L.; validation, A.B., J.L.S.-S. and N.M.-L.; formal analysis, A.B. and J.L.S.-S. and N.M.-L.; Investigation, A.B., J.L.S.-S. and N.M.-L.; resources, J.L.S.-S. and J.I.V.-M.; data curation, A.B. and N.M.-L. and A.S.-T.; writing—original draft preparation, A.B. and N.M.-L. and A.S.-T. Writing—review and editing; J.L.S.-S. and J.I.V.-M.; visualisation, A.B. and J.I.V.-M.; supervision, J.L.S.-S.; project administration, A.B.; funding acquisition, A.B. All authors have read and agreed to the published version of the manuscript.

Funding

This work was supported for publication by the “Conselleria de Innovación, Universidades, Ciencia y Sociedad Digital” of the Generalitat Valenciana. The authors would like to thank also to the INGEGRAF association. In addition, it was supported for research by the University of Zaragoza UZ2020-TEC-02: Planteamiento de una Metodología de Diseño Sostenible en Sistemas Producto-Servicio.

Acknowledgments

Anna Biedermann and Natalia Muñoz López are members of the OAAEP research group, financed by the Government of Aragon with FEDER funds.

Conflicts of Interest

The authors declare no conflict of interest.

References

  1. Kloepffer, W. Life cycle sustainability assessment of products (with comments by HeliasA. Udo de Haes, p. 95). Int. J. Life. Cycle. Assess. 2008, 13, 89–95. [Google Scholar] [CrossRef]
  2. Finkbeiner, M.; Schau, E.M.; Lehmann, A.; Traverso, M. Towards life cycle sustainability assessment. Sustainability 2010, 2, 3309–3322. [Google Scholar] [CrossRef] [Green Version]
  3. ISO. ISO. ISO 14040 International Standard. In Environmental Management-Life Cycle Assessment—Principles and Framework; International Organisation: Geneva, Switzerland, 2006. [Google Scholar]
  4. Amaya, J.; Lelah, A.; Zwolinski, P. Design for intensified use in product-service systems using life-cycle analysis. J. Eng. Des. 2014, 25, 7–9. [Google Scholar] [CrossRef] [Green Version]
  5. Scheepens, A.E.; Vogtländer, J.G.; Brezet, J.C. Two life cycle assessment (LCA) based methods to analyse and design complex (regional) circular economy systems. Case: Making water tourism more sustainable. J Clean Prod 2016, 114, 257–268. [Google Scholar] [CrossRef]
  6. Nurhadi, L.; Borén, S.; Ny, H.; Larsson, T. Competitiveness and sustainability effects of cars and their business models in Swedish small town regions. J. Clean. Prod. 2017, 140, 333–348. [Google Scholar] [CrossRef]
  7. Bech, N.M.; Birkved, M.; Charnley, F.; Kjaer, L.L.; Pigosso, D.C.A.; Hauschild, M.Z.; McAloone, T.C.; Moreno, M. Evaluating the Environmental Performance of a Product/Service-System Business Model for Merino Wool Next-to-Skin Garments: The Case of Armadillo Merino®. Sustainability 2019, 11, 5854. [Google Scholar] [CrossRef] [Green Version]
  8. Zheng, X.; Easa, S.M.; Yang, Z.; Ji, T.; Jiang, Z. Life-cycle sustainability assessment of pavement maintenance alternatives: Methodology and case study. J. Clean. Prod. 2019, 213, 659–672. [Google Scholar] [CrossRef]
  9. Casson, A.; Giovenzana, V.; Tugnolo, A.; Fiorindo, I.; Beghi, R.; Guidetti, R. Environmental impact of a new concept of food service: A case study for the re-use of naval shipping containers. J. Clean. Prod. 2020, 274, 122912. [Google Scholar] [CrossRef]
  10. American Alliance of Museums Homepage. Available online: https://www.aam-us.org/programs/aboutmuseums/museum-facts-data/ (accessed on 9 April 2021).
  11. Towse, R.; Hernández, T.N. Handbook of Cultural Economics, 3rd ed.; Edward Elgar Publishing: Cheltenham, UK, 2020. [Google Scholar]
  12. Loach, K.; Rowley, J.; Griffiths, J. Cultural sustainability as a strategy for the survival of museums and libraries. Int. J. Cult. Policy 2017, 23, 186–198. [Google Scholar] [CrossRef]
  13. Sutter, G.C. Promoting sustainability: Audience and curatorial perspectives on the human factor. Curator Mus. J. 2008, 51, 187–202. [Google Scholar] [CrossRef]
  14. Rentschler, R.; Gilmore, A. Museums: Discovering services marketing. Int. J. Arts Manag. 2002, 5, 62–72. [Google Scholar]
  15. Adams, E. Towards Sustainability Indicators for Museums in Australia; Collections Council of Australia Ltd.: Adelaide, Australia, 2010. [Google Scholar]
  16. Recommendations and the Report Submitted by the Standing Committee for MuseumDefinition, Prospects and Potentials (MDPP). Available online: https://icom.museum/wpcontent/uploads/2019/01/MDPP-report-and-recommendations-adopted-by-the-ICOM-EBDecember-2018_EN-2.pdf (accessed on 12 September 2020).
  17. Bertacchini, E.E.; Dalle Nogare, C.; Scuderi, R. Ownership, organization structure and public service provision: The case of museums. J. Cult. Econ. 2018, 42, 619–643. [Google Scholar] [CrossRef]
  18. Blagoeva-Yarkova, Y. The Role of Local Cultural Institutions for Local Sustainable Development. Case-Stud.Bulg. Trakia J. Sci. 2012, 10, 42–52. [Google Scholar]
  19. Pop, I.L.; Borza, A.; Buiga, A.; Ighian, D.; Toader, R. Achieving cultural sustainability in museums: A step toward sustainable development. Sustainability 2019, 11, 970. [Google Scholar] [CrossRef] [Green Version]
  20. Jankowska, M.A.; Marcum, J.W. Sustainability Challenge for Academic Libraries: Planning for the Future. Coll. Res. Libr. 2010, 71, 160–170. [Google Scholar] [CrossRef] [Green Version]
  21. Stylianou-Lambert, T.; Boukas, N.; Christodoulou-Yerali, M. Museums and Cultural Sustainability: Stakeholders, Forces, and Cultural Policies. Int. J. Cult. Policy 2014, 20, 566–587. [Google Scholar] [CrossRef]
  22. International Council of Museums (ICOM). Available online: https://icom.museum/en/network/committeesdirectory/?type=341&q=sustainability (accessed on 17 October 2021).
  23. Marshall, G. Don’t Even Think about It: Why Our Brains Are Wired to Ignore Climate Change; Bloomsbury: New York, NY, USA, 2014. [Google Scholar]
  24. Sutter, G.C. Thinking like a system: Are museums up to the challenge? Mus. Soc. Issues 2006, 1, 203–218. [Google Scholar] [CrossRef]
  25. Worts, D. Fostering a culture of sustainability. Mus. Soc. Issues 2006, 1, 151–172. [Google Scholar] [CrossRef]
  26. Brophy, S.S.; Wylie, E. The Green Museum: A Primer onEnvironmental Practice, 2nd ed.; Altamira Press: Plymouth, UK, 2008. [Google Scholar]
  27. International Council of Museums (ICOM). Museums and Sustainable Development: How can ICOM Support, in Concrete Terms, the Museum Community’s Sustainable Development Projects? In Proceedings of the Advisory Committee Meeting, Paris, France, 6–8 June 2011. [Google Scholar]
  28. Sutton, S. Environmental Sustainability at Historic Sites and Museums; Rowman & Littlefield: Lanham, MD, USA, 2015. [Google Scholar]
  29. Brophy, S.S.; Wylie, E. The Green Museum: A Primer on Environmental Practice; AltaMiraPress: Lanham, MD, USA, 2013. [Google Scholar]
  30. Museums Association. Sustainability and Museums: Your Chance to Make a Difference; Museum’s Association: London, UK, 2008. [Google Scholar]
  31. Lepouras, G.; Vassilakis, C. Virtual museums for all: Employing game technology for edutainment. Virtual Real. 2004, 8, 96–106. [Google Scholar] [CrossRef]
  32. Laine-Zamojska, M.; Zielonka, K.; Ku´smidrowicz-Król, A.; de Rosset, A. E-Museums Project. Making Polish Cultural Heritage Accessible Online. Int. J. Herit. Digit. Era 2014, 3, 701–711. [Google Scholar] [CrossRef]
  33. Bell, L. Engaging the Public in Technology Policy A New Role for Science Museums. Sci. Commun. 2008, 29, 386–398. [Google Scholar] [CrossRef]
  34. Canadian Museums Association. A Sustainable Development Guide for Canada’s Museums. Available online: http://www.museums.ca/client/document/documents.html?categoryId=361 (accessed on 23 December 2015).
  35. Worts, D. Measuring museum meanings: A critical assessment framework. J. Mus. Educ. 2006, 31, 41–49. [Google Scholar] [CrossRef]
  36. Lambert, S.; Henderson, J. The carbon footprint of museum loans: A pilot study at Amgueddfa Cymru National Museum Wales. Mus. Manag. Curatorship 2011, 26, 127. [Google Scholar] [CrossRef]
  37. Chitima, S.S. Developing sustainable museums through “greening”: A case study of the Zimbabwe MilitaryMuseum. In African Museums in the Making: Reflections on the Politics of Material and Public Culture in Zimbabwe; Mawere, M., Chiwaura, H., Thondhlana, T.P., Eds.; Langaa RPCIG: Bamenda, Camerun, 2015; pp. 223–245. [Google Scholar]
  38. Nunberg, S.; Eckelman, M.; Hatchfield, P. Life cycle assessments of loans and exhibitions:three case studies at the Museum of Fine Arts, Boston. J. Am. Inst. Conserv. 2016, 55, 2–11. [Google Scholar] [CrossRef]
  39. Nunberg, S.; Sutton, S.; Eckelman, M. Planning a Life Cycle Analysis Library and Beta Tool for Sustainable Cultural Heritage Preservation and Exhibition Practices. In Addressing the Challenges in Communicating Climate Change Across Various Audiences; Leal Filho, W., Lackner, B., McGhie, H., Eds.; Springer: Cham, Switzerland, 2019; pp. 531–543. [Google Scholar] [CrossRef]
  40. Worts, D. Museums in Search of a Sustainable Future. Alberta Museums Review. 2004, pp. 40–57. Available online: http://douglasworts.org/wp-content/uploads/2009/06/worts_ma_review_article.pdf (accessed on 6 April 2013).
  41. Corsane, G. Using ecomuseum indicators to evaluate the robben island museum and world heritage site. Landsc. Res. 2006, 31, 399–418. [Google Scholar] [CrossRef]
  42. Rentschler, R.; Geursen, G.M. Entrepreneurship, marketing and leadership in non-profit performing arts organisations. J. Res. Mark. Entrep. 2004, 6, 44–51. [Google Scholar] [CrossRef] [Green Version]
  43. Davis, P. New Museologies and the Ecomuseum. In The Ashgate Research Companion to Heritage and Identity; Graham, B., Howard, P., Eds.; Ashgate: Aldershot, UK, 2008; pp. 397–414. [Google Scholar]
  44. Pop, I.L.; Borza, A. Factors influencing museum sustainability and indicators for museum sustainability measurement. Sustainability 2016, 8, 101. [Google Scholar] [CrossRef] [Green Version]
  45. Pietro, L.D.; Mugion, R.G.; Renzi, M.F.; Toni, M. An audience-centric approach for museums sustainability. Sustainability 2014, 6, 5745–5762. [Google Scholar] [CrossRef] [Green Version]
  46. Friedman, A.J. The great sustainability challenge: How visitor studies can save cultural institutions in the21st Century. Visit. Stud. 2007, 10, 3–12. [Google Scholar] [CrossRef]
  47. Swanson, K.K.; DeVereaux, C. A theoretical framework for sustaining culture: Culturally sustainable entrepreneurship. Ann. Tour. Res. 2017, 62, 78–88. [Google Scholar] [CrossRef]
  48. Hawkes, J. The Fourth Pillar of Sustainability: Culture’s Essential Role in Public Planning; Common Ground Publishing: Melbourne, Australia, 2001. [Google Scholar]
  49. Farreny, R.; Oliver, J.; Escuder, S.; Roca, M.; Sevigné, E.; Gabarrell, X.; Rieradevall, J. The metabolism of cultural services. Energy and water flows in museums. Energy Build. 2012, 47, 98–106. [Google Scholar] [CrossRef]
  50. Vastari. Available online: https://blog.vastari.com/covid-19-touring-exhibitions-impact/ (accessed on 23 August 2021).
  51. Rodríguez, J.P. Manual de Museografía; Almuzara: Córdoba, Spain, 2019. [Google Scholar]
  52. Muñoz, N.; Santolaya, J.L.; Biedermann, A.; Serrano, A. Sustainability Assessment of Product-Service Systems using flows between systems approach. Sustainability 2020, 12, 3415. [Google Scholar] [CrossRef] [Green Version]
  53. Lacasa, E.; Santolaya, J.L.; Biedermann, A. Obtaining sustainable production from the product design analysis. J. Clean. Prod. 2016, 139, 706–716. [Google Scholar] [CrossRef]
  54. Santolaya, J.L.; Lacasa, E.; Biedermann, A.; Muñoz, N. A practical methodology to project the design of more sustainable products in the production stage. Res. Eng. Des. 2019, 30, 539–558. [Google Scholar] [CrossRef]
  55. Probas Database. German Environmental Protection Agency. Umweltbundesamt (UBA). Available online: www.probas.umweltbundesamt.de/php/index.php (accessed on 13 April 2017).
  56. Cheung, C.W.; Berger, M.; Finkbeiner, M. Comparative life cycle assessment of re-use and replacement for video projectors. Int. J. Life Cycle Assess 2018, 23, 82–94. [Google Scholar] [CrossRef]
  57. Mapama. Spain Government. Available online: www.miteco.gob.es/es/cambio-climatico/temas/mitigacion-politicas-y-medidas/factores_emision_tcm30-446710.pdf (accessed on 15 August 2018).
Figure 1. Sustainability studies in product/service systems.
Applsci 11 09863 g001
Figure 2. Alternative 1: printed exhibition. Inventory data (entire tour).
Applsci 11 09863 g002
Figure 3. Alternative 2: audiovisual exhibition. Inventory data (entire tour).
Applsci 11 09863 g003
Figure 4. Results comparison in the two exhibition alternatives.
Applsci 11 09863 g004
Table 1. Sustainability studies of service systems applying a life cycle approach.
Service SystemObjective and MethodsResults
-Bicycle sharing—[4]Evaluate and compare different design alternatives. Method: LCAEnvironmental impact is reduced by the product requirements’ improvement.
-Water recreation tourism—[5]Study different projects of water navigation. Method: LCARecommended the use of electric technology in the propulsion system.
-Private car business—[6]Analysis and redesign of business models. Method: LCSACarpooling is the most competitive when driving short-medium distances.
-T-shirt Product-Service System (PSS)—[7]Quantify and compare impacts in two different systems. Method: LCAEnvironmental impact is reduced if a circular PSS is proposed.
-Pavement maintenance—[8]Study three alternatives.
Methods: LCSA and Multi-criteria decision making
The option based on recycling is the most suitable in economic and social dimensions.
-Street food service—[9]Compare the environmental impact of two alternatives. Method: LCAElectricity consumed, oil used to fry, and customised structure are high hotspots.
Table 2. Advances in the integration of sustainability in museums and exhibitions.
2004Economic dimension prevalence. The unitary cost of a visit to the museum is considered the most relevant indicator to measure museum performance [40].
Income earned by museums through their activities is used to assess the level of cultural entrepreneurship [42].
2006Equilibrium among different sustainability dimensions. The tool ‘Critical Assessment Framework’ helps planners develop museums based on the culture of sustainability [35].
Definition of 21 indicators associated with eco-museum performance, described as a list of effects that museums can have on society [37].
2007Three interacting dimensions (financial, intellectual, and social) are identified. Visitor studies are considered crucial to understand cultural institutions and build more sustainable models [46].
2008Sociocultural aspects are mainly considered within an evaluation model in which five indicators are identified [43].
2011Sustainability is focused on responding to the needs of the community. The intellectual and financial autonomy of a museum is an important indicator [27].
Development of a carbon footprint methodology to control the impact of museum loan programmes [36].
2012Demand for resources and emissions is quantified. Energy and water consumption have a strong correlation with the museum area and number of visits [49].
2015Use of various methods of sustainability assessment (i.e., self-assessment, sustainability audits, checklists) with a high degree of subjectivity [37].
2016Use of standardised, objective methods.
LCA application to the museum’s permanent exhibited objects [38].
Each dimension/pillar of sustainability must be considered and evaluated. Simple, objective instruments are required [45].
2019LCA and beta tools for cultural heritage preservation and exhibition practices [39].
Table 3. Alternative 1: printed exhibition. Sustainability indicators.
Environmental DimensionEconomic DimensionSocial Dimension
GWP100CETw
Life Cycle StageKg CO2-eq/
Entire Tour
Kg CO2-eq/
Month∙m2
EUR/
Entire Tour
EUR/
Month∙m2
h/
Entire Tour
h/
Month∙m2
Creation14,502.841.3455,722.325.161578.960.15
Provision36,653.323.39284,613.5826.3522,176.002.05
End-of-life36.870.003417,905.461.661072.320.10
Total51,193.034.74358,241.3533.1724,827.282.30
Table 4. Alternative 1: audiovisual service. Sustainability indicators.
Environmental DimensionEconomic DimensionSocial Dimension
GWP100CETw
Life Cycle StageKg CO2-eq/
Entire Tour
Kg CO2-eq/
Month∙m2
EUR/
Entire Tour
EUR/
Month∙m2
h/
Entire Tour
h/
Month∙m2
Creation1168.090.1136,496.643.38610.690.06
Provision45,579.014.22286,842.0926.5622,176.002.05
End-of-life2.240.00029810.870.91391.750.04
Total46,749.334.33333,149.6030.8523,178.442.15
Publisher’s Note: MDPI stays neutral with regard to jurisdictional claims in published maps and institutional affiliations.

