Article

Subclinical Atherosclerosis Progression in Obese Children with Relevant Cardiometabolic Risk Factors Can Be Assessed through Carotid Intima Media Thickness

1
PhD School Department, Victor Babes University of Medicine and Pharmacy, 300041 Timisoara, Romania
2
Department of Pediatrics, Victor Babes University of Medicine and Pharmacy, 300041 Timisoara, Romania
3
Independent Researcher, 300041 Timișoara, Romania
4
Center for Translational Research and Systems Medicine, Department of Functional Sciences—Pathophysiology, Victor Babeş University of Medicine and Pharmacy, 300041 Timişoara, Romania
5
2nd Department of Internal Medicine, Victor Babes University of Medicine and Pharmacy, 300041 Timisoara, Romania
6
Center of Molecular Research in Nephrology and Vascular Disease, Faculty of Medicine, Victor Babes University of Medicine and Pharmacy, 300041 Timisoara, Romania
*
Author to whom correspondence should be addressed.
Submission received: 30 September 2021 / Revised: 3 November 2021 / Accepted: 11 November 2021 / Published: 13 November 2021

Abstract

:

Featured Application

The proposal to use intima-media thickness as a non-invasive and cost-efficient biomarker of subclinical atherosclerosis in obese children.

Abstract

Given the growing obesity rates among children, a more complete evaluation of their potential cardiometabolic risk is needed. Carotid intima-media thickness (CIMT), a marker of endothelial distress and a predictor of atherosclerotic progression in adulthood, may complete the day-to-day evaluation of children at risk. Multiple risk factors act as additional precipitant causes of atherosclerosis. We analyzed 60 patients aged 6–17 years old by measuring their CIMT using the Aixplorer MACH 30 echography machine automatic measurement software. All subjects were clinically and anamnestically assessed to identify risk factors. CIMT values are significantly higher in older children and boys. Over 20 kg weight gain during pregnancy and other at-risk disorders (p = 0.047), family history of cardiovascular risk (p = 0.049), hypertension (p = 0.012), and smoking (p = 0.015) are linked to increased CIMT. Our study also supports international data on artificial postnatal nutrition, high/low birth weight, and sedentary lifestyle being linked to increased CIMT. Significant correlations were detected between CIMT and the entire lipid panel. Weight excess and abdominal adiposity in children is clearly linked to increased CIMT. Moreover, waist circumference and TG/HDL-c are significant predictors of CIMT. Although each parameter of the lipid panel is correlated to CIMT, fasting glucose is not.

1. Introduction

Weight excess has been one of the largest public health problems of modern society for decades and, in the obesogenic context of the COVID-19 pandemic, obesity has been affecting children at rates faster than we have ever encountered before [1]. In many countries, not only are the lockdown conditions, which increased sedentary behavior, to blame, but also the worsening of financial status, which has led to reduced access to qualitative foods and more stress within families [2].
The importance of a comprehensive evaluation of obesity in children is of paramount importance for early detection of cardiovascular and metabolic complications. Atherosclerosis and high blood pressure, frequent complications of obesity, are slow but steady ongoing processes in obese children, manifesting in adolescence and early adulthood, depending on the severity of the weight excess [3].
Increased carotid intima-media thickness (CIMT) is one of the first observable signs of subclinical atherosclerosis, making this ultrasonographic technique probably the most accurate non-invasive method of detecting early stages of atherosclerosis. For a long time, in children, these early stages have been ordinarily estimated by monitoring the lipid and glucose metabolism alterations (lipid profile, fasting glucose levels, oral glucose tolerance tests, serum insulin, blood pressure values, etc.). Lately, cardiovascular risk has been proven to be well and reliably assessed through imaging technologies in pediatric patients as well [4]. Beauloye et al. showed that blood parameters that are classically assessed in obese children are significantly correlated to CIMT [5]. Therefore, studies estimate that the use of CIMT, a non-invasive, non-painful, non-radiating, cost-effective, and easily reproducible method, can become one of the pillars of risk evaluation for pediatric patients at risk.
Nevertheless, the value of CIMT in children as a predictor of risk is still a subject of research. Although cut-off points for CIMT are still a subject of discussion, there is significant evidence that its values reach higher points in children with obesity. According to Farello et al., both in metabolically healthy and unhealthy obese children, CIMT reaches higher values. The same study showed that early detection of high CIMT in children with metabolic syndrome is a predictor of cardiovascular disease in young adults [6].
Hence, one of the goals of the present study, other than assessing CIMT in relation to obesity, is to evaluate some of the other risks associated with higher CIMT in children, and their effect on the vascular thickness when associated with obesity. Most of the risk factors we have analyzed are already set in stone as aggravating factors of cardiometabolic disease in adults and many are on the way to being settled for the pediatric population as well.
Advancing age, masculine sex, and high BMI are three factors known to have a direct impact on CIMT values in both children and adults [7,8,9]. However, risks associated with pregnancy, mother’s health, perinatal aspects regarding weight or nutrition, family history of cardiometabolic disease, exposure to smoking, high values for blood pressure, and a lack of physical activity on daily basis may also be risks that can impact vascular integrity or worsen the atherosclerotic progression.
Previous studies place postnatal nutrition in a stronghold regarding breastfeeding’s universal protective characteristics, on the condition that it not be too prolonged [10,11]. There is evidence that artificial milk is associated with obesity, higher CIMT values, arterial hypertension, and insulin resistance [12,13,14,15].
Data on birth weight as a risk factor for increased CIMT show that low birth for gestational age is the most prominent risk, and the more severe the weight deficit is, the more powerful the risk [16]. On the other side of the spectrum, higher than normal birth weight is also a risk factor for high CIMT in young adult life [17].
Another important risk factor is maternal health during pregnancy. It is a factor that can affect CIMT values indirectly by inducing a pathology that places the newborn at risk for high CIMT. For instance, obesity in children is correlated to motherhood obesity and gestational diabetes [11,18]. High blood pressure in a pregnant woman tracks to her child, especially in their adult life. In fact, a mother’s entire cardiovascular profile is proven to be linked to her offspring’s [19]. In utero exposure to autoimmune Hashimoto thyroiditis is associated with an increased risk of the offspring developing a thyroid disorder, including Hashimoto thyroiditis, in childhood or adolescence [20]. With regard to CIMT, Hashimoto thyroiditis in children, especially in adolescent girls, is an aggravating factor of atherosclerosis, regardless of thyroid function, due to the maintenance of a status of chronic inflammation that affects endothelial integrity [21]. Moreover, smoking during pregnancy causes low birth for gestational age and hence, high CIMT values in the child’s young adulthood [16].
Family history obtained by targeted anamnesis and medical records is another important part of a full evaluation. From genetic predispositions to behavioral components of certain pathologies, they all echo the lifetime development of the offspring. A family history of premature cardiovascular disease reflects higher values of CIMT and the association of other factors like oxidant status, insulin resistance, and dyslipidemia [22].
Smoking cigarettes increases the values of CIMT directly and indirectly, so much so that the vascular age of a regular smoker is about 6–7 years older than of non-smokers. Smoking aggravates the effects of metabolic syndrome and age on CIMT, despite the fact that smokers are usually leaner and have a good glucose-insulin homeostasis [23]. There are also differences between how smoking affects the genders: Men are more affected by smoking in terms of arterial stiffness, probably due to the lack of estrogen-given protection; however, a lower exposure to cigarette smoke increases arterial stiffness in women [24]. Moreover, there is irrepressible evidence that passive (second-hand) smoking in children has the same dire adverse effects on vascular health by increasing the risk of atherosclerosis [25,26]. Furthermore, we mention a significantly higher risk of becoming a smoker among adolescents who have both parents as smokers [27].
Sedentary behavior is not just one of the main causes for weight gain, but is also involved in glucose metabolism as a promoter of insulin resistance, and in lipid metabolism as a maintainer of dyslipidemia. It also decreases the cardiovascular adaptability for effort. Previous studies have shown that leading a sedentary lifestyle as children increases cardiometabolic risk and carotid plaque development in young adulthood [28].
Alterations of glucose and lipid metabolisms are consequences of excess fat tissue, unhealthy lifestyle, and genetic risk factors. High levels of LDL cholesterol, total cholesterol, non-HDL cholesterol, triglycerides, low values of HDL cholesterol, and high ratios between total cholesterol and HDL-c and triglycerides and HDL-c, respectively, all induce, either separately or combined, defective lipid vascular clearance and excess lipoprotein storage in the sub-endothelial space. Pathological values of any of the aforementioned parameters can be associated with increased CIMT [29]. Insulin resistance, diagnosed by clinical and laboratory findings, is positively correlated to CIMT values and is a pathological precursor of type 2 diabetes in both children and adults [30].
Non-invasive evaluation of cardiovascular and metabolic risk in individuals with pathologies that present vascular implications can be based on the assessment of arterial stiffness and atherosclerosis progression and the evaluation of inflammatory markers [31].
Therefore, given the growing obesity rates among children and even among our patients, we have designed an observational study for our overweight and obese patients, with the scope of assessing the importance of CIMT in a more comprehensive clinical evaluation and cardiometabolic risk assessment. To achieve this scope, we have identified certain risk factors in our patients and analyzed their impact on CIMT values in obese and overweight children as opposed to normal-weight ones. The particularity of our study is that apart from analyzing CIMT in the context of weight excess in children, it shows to what extent certain risk factors correlate to CIMT increase in children. We believe this approach broadens our understanding of how easily identifiable risk factors influence CIMT, a fact that can be useful to clinicians who rely on CIMT in their day-to-day activity.

2. Materials and Methods

The observational study was performed in our US endocrinology unit from January 2021 until May 2021 on 60 children. The study was approved by the Ethics Committee of Scientific Research (CECS) of the University of Medicine and Pharmacy Victor Babes Timisoara and respects the ethical guidelines of the Helsinki Declaration.
The study was centered on the impact of excess adipose tissue on carotid intima-media thickness and how CIMT correlates to identifiable genetic and epigenetic risk factors. Three study groups were defined, depending on the severity of weight excess: obese and overweight, and normal-weight patients as controls.

2.1. Inclusion Criteria

  • Obese group—patients with a BMI score ≥ 95th percentile for age and sex, overweight group—BMI ranging from the 85th percentile to 95th percentile, and the control group—BMI ranging from the 5th percentile to the 85th.
  • Both sexes were included, and ages ranged from 6 to 17.

2.2. Exclusion Criteria

  • Secondary obesity causes: Cushing syndrome, thyroid disfunctions with hypothyroidism, insulin-dependent diabetes mellitus, polycystic ovarian syndrome, hypothalamic injury/disorders, genetic syndromes like Prader–Willi syndrome [32], grelin–leptin dysfunction [33], and use of medication that can induce weight gain (glucocorticosteroids, sulphonylureas, tricyclic antidepressants, antipsychotics) [34].
Prior to any examination, informed consent forms were administered to the patient’s parent/legal guardian and a verbal agreement was given by the child, after exhaustive explanations regarding the study and further examinations.
The main analysis consisted of the measurement of CIMT by carotid ultrasonography and the comparison of the values found between groups, depending on certain risk factors.
In addition to the ultrasonography measurement, we performed a clinical examination (weight, height, waist circumference, and blood pressure measurements) and a targeted anamnesis to detect the presence of certain risk factors: postnatal nutrition (breastfed/formula-fed), birth weight (<2500 g/>3500 g/normal weight), pregnancy-associated risk factors (no pathology/>20 kg surplus/gestational diabetes/gestational hypertension/autoimmune thyroiditis/smoking during pregnancy), family history (no pathologies/obesity/dyslipidemia/type 2 diabetes/coronary disease/stroke/autoimmune thyroiditis), smoking during pregnancy (yes/no), smoking by the patient (yes/no), and physical activity (normal/sedentary *). Moreover, the following blood parameters were selected from each patient’s previous 6 months of medical history: fasting glucose (mg/dL), HDL cholesterol (mg/dL), LDL cholesterol (mg/dL), total cholesterol (mg/dL), and triglycerides (mg/dL).
* We considered sedentary a subject who performed no sport and/or less than 1 h of physical activity/day.

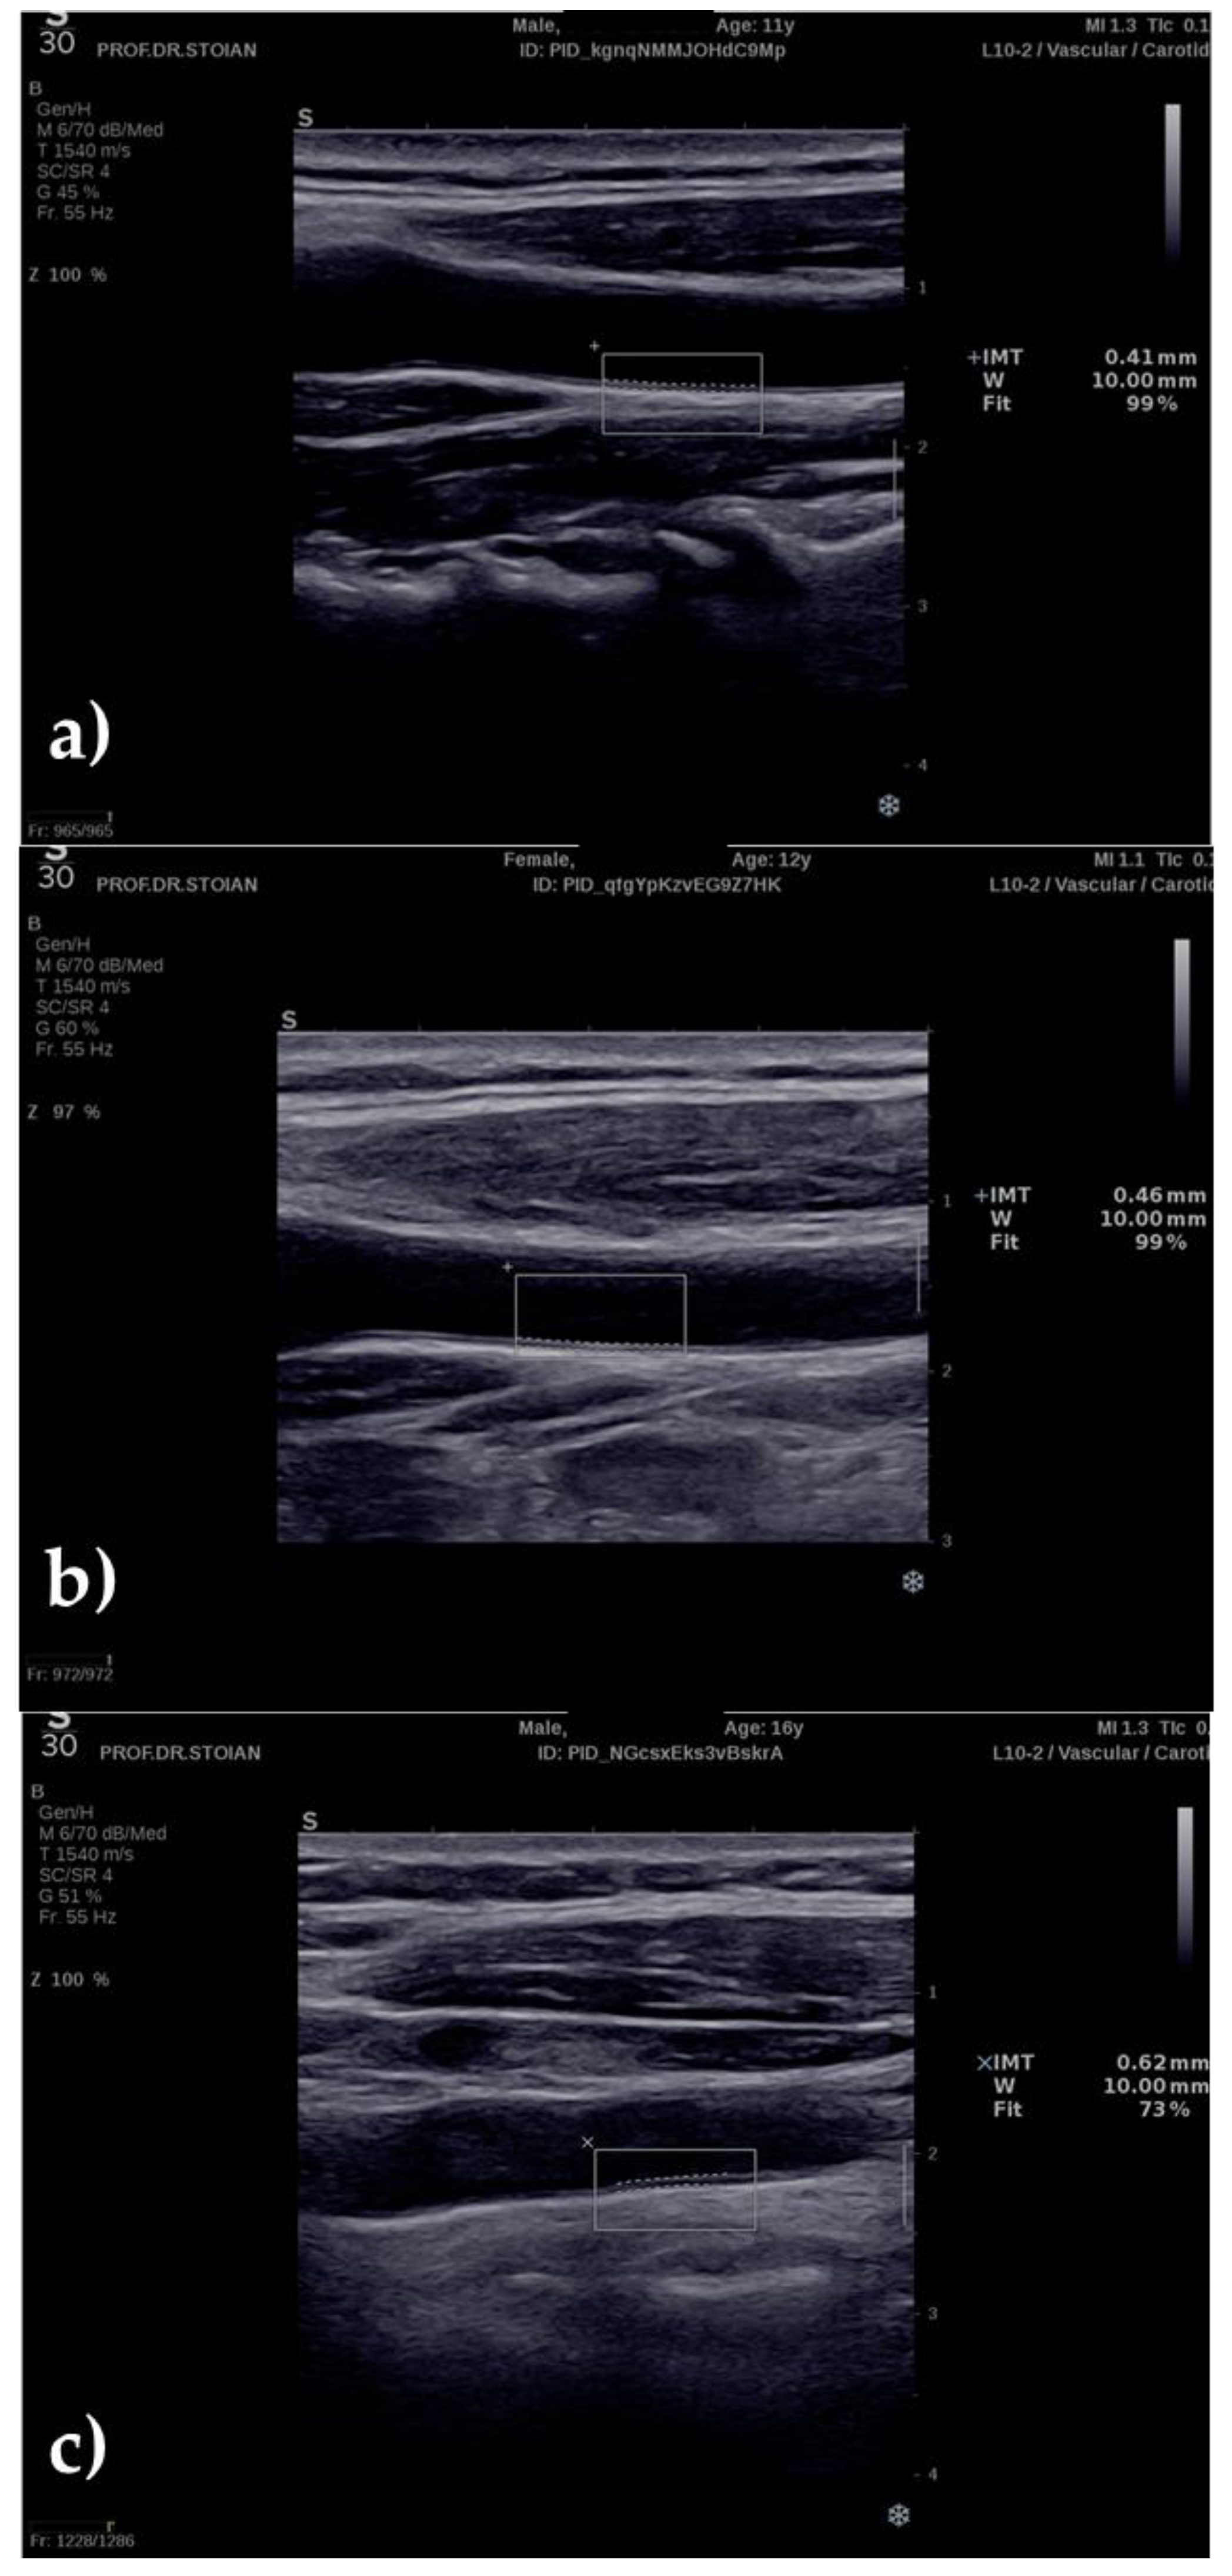
2.3. Ultrasonography Technique

The Aixplorer MACH 30 echography machine (SuperSonic Imagine, Aix-en-Provence, France) was utilized to perform the carotid ultrasonography. We used 2 ultrasound probes: SuperLinear SL 10-2 (2–10 MHz) and SL 18-5 (5–18 MHz). CIMT values were determined automatically by Aixplorer MACH 30 software (SuperSonic Imagine, Aix-en-Provence, France). We performed 3 measurements on both the right and the left common carotid artery and used the mean of all measurements in our analysis.
Examination starts by choosing the appropriate setting: vascular probe and carotid evaluation (B-mode setting). The patient lies in a supine position with their neck tilted backwards in an extended position. The exploration of the right and left carotids starts by transversal scanning, starting from the clavicle and guiding the probe upwards to locate the carotid bulb (bifurcation of the common carotid artery into the internal and external carotid arteries). At this point, the probe is rotated 180°, fixating the region of interest to distinguish the carotid lumen and carotid walls clearly, with the carotid bulb visible on the left of the screen and a clear intima-media in the 1–2 cm caudally from the carotid bulb. After the image is frozen in the most accurate instance, the Aixplorer MACH 30 software automatically measures the space between the intimal–luminal and the medial–adventitial interfaces on the posterior (far) wall of the left and right carotids [35,36,37]. Among other advantages, the novelty of this measurement is that it eliminates human-eye mistakes [38,39].
Examples of CIMT measurements (Figure 1):

2.4. Statistical Analysis

Data were collected and statistically analyzed using Microsoft Excel and SPSS statistical software version 17 (SPSS Inc., Chicago, IL, USA). We used statistical tests to assess differences between study groups and the prevalence of risk factors, as well as their impact on the objects of our research.
Normality of variable distribution was checked in SPSS prior to statistical analysis (Shapiro–Wilk test). For normally distributed variables we used means, Student’s T test and Pearson’s correlation, whereas for non-normally distributed variables we used medians, the Mann–Whitney test, and Spearman’s correlation. Subjects were divided into three main groups—obese, overweight, and normal weight (control)—and subgroups (by age, sex, and risk factors). Categories were analyzed individually and/or in pairs, mainly focusing on CIMT. Statistical significance was considered p = 0.05. For cases of multiple analysis on the same data (2 by 2 tests on 3 groups), we performed ANOVA (single factor) tests and post-hoc tests (Bonferroni corrected) in Microsoft Excel and adjusted the p-values according to the Bonferroni corrected α in order to keep the significance threshold at 0.05. Multivariable regression analysis was performed in SPSS with the stepwise method, with CIMT as the dependent variable.

3. Results

The study included 60 children, aged 6 to 18, of both sexes. They were divided by BMI scores into three groups: obese group (13 boys and 7 girls), overweight group (10 boys and 5 girls), and normal-weight group (12 boys and 13 girls). Extremely significant differences were detected between the CIMT values of the three groups: obese vs. normal weight, p << 0.001; obese vs. overweight, p = 0.037; and overweight vs. normal weight, p = 0.001 (Bonferroni-corrected p-values). That means that CIMT mean values grew as BMI and weight excess severity grew. The overall CIMT values for the three groups combined were normally distributed (Shapiro–Wilk test significance = 0.081). However, the obese and the normal-weight groups presented non-normal distribution for CIMT values.

3.1. CIMT with Regard to Age

Children from each weight group were further subdivided into three age subgroups: pre-pubertal (<12 years old), pubertal (12–15 years old), and post-pubertal (≥16 years old). The p-values were Bonferroni corrected for all comparisons in Table 1, with a significance threshold of 0.05.
We did not detect statistically significant differences between the age subgroups in the case of obese children (Table 1), with all three groups having similar values for CIMT (p-values for obese children are not presented in their Bonferroni-corrected form because they were too high, corrected α = 0.016). In the overweight group (Table 1), we detected higher values of CIMT in pubertal compared to pre-pubertal patients and even higher values of CIMT for post-pubertal patients compared to pre-pubertal ones (p = 0.024). However, only the latter comparison was statistically significant.
In the normal-weight controls, pre-pubertal and pubertal children scored significantly lower CIMT averages, but children 16 years old and over had an CIMT average closer to the obese and overweight lots (Table 1).
CIMT values in obese, overweight, and normal-weight post-pubescent children always scored the highest values. For children under 12 years of age, we found significantly higher values for CIMT in obese children compared to overweight children (p = 0.015) and compared to the control group (p << 0.001) (Bonferroni-corrected p values). The same finding was detected in overweight children under 12 compared to normal-weight children under 12, but the p-value was not statistically significant.

3.2. CIMT with Regard to Gender

In the overweight and normal-weight lots, boys demonstrated higher CIMT averages than girls; nevertheless, the variation was statistically significant only in the overweight section, p = 0.043. In the group of obese children, the CIMT averages of boys and girls were almost identical (Table 2).

3.3. Assessment of Risk Factors

We further present the comparison between CIMT values in the context of the presence of certain risk factors within the analyzed groups: overweight vs. normal weight and obese vs. normal weight. We acknowledge the fact that when divided into subgroups according to certain risk factors, the lots become too small to reflect true statistical significance. Nevertheless, our intention is to show the trend of the analyzed data and how it matches with similar published data on the subject.

3.3.1. Obese Patients

Obese patients showed CIMT values close to 0.50 mm, with high percentages for formula nutrition, abnormal birth weight, pregnancy-related risks, pathological family history and sedentary lifestyle (Table 3).
Postnatal nutrition. 65% of our obese patients received formula nutrition as nurslings. The CIMT mean of formula-fed children did not differ from the CIMT mean of the entire obese group, and it was almost equal to the CIMT mean of the breastfed group. The differences between the two subgroups were statistically insignificant (p = 0.989).
Birth weight. Half of our obese patients had abnormal birth weight (BW), either higher (>3500 g) or lower (<2500 g) than normal. In children with low BW, CIMT mean ( X ¯ = 0.546 mm) was higher than the mean of the entire obese sample, whereas in children with high BW, the CIMT mean was closer to the mean of the obese sample. No statistical significance was detected when comparing subgroups (p = 0.62). Obese children with normal BW had a slightly lower CIMT mean than those with abnormal BW.
Biological mother’s health during pregnancy. Up to 70% of the obese patients were born to mothers who presented different pathologies during their pregnancy (Figure 2). Obese children who were born to unhealthy mothers had statistically significantly higher CIMT values than the entire obese sample and obese children who were born to healthy mothers (p = 0.047). Over 20 kg weight gain during pregnancy was the most encountered risk factor (30% of cases), followed closely by the presence of autoimmune thyroiditis (25%). No mother admitted to smoking during pregnancy in this group.
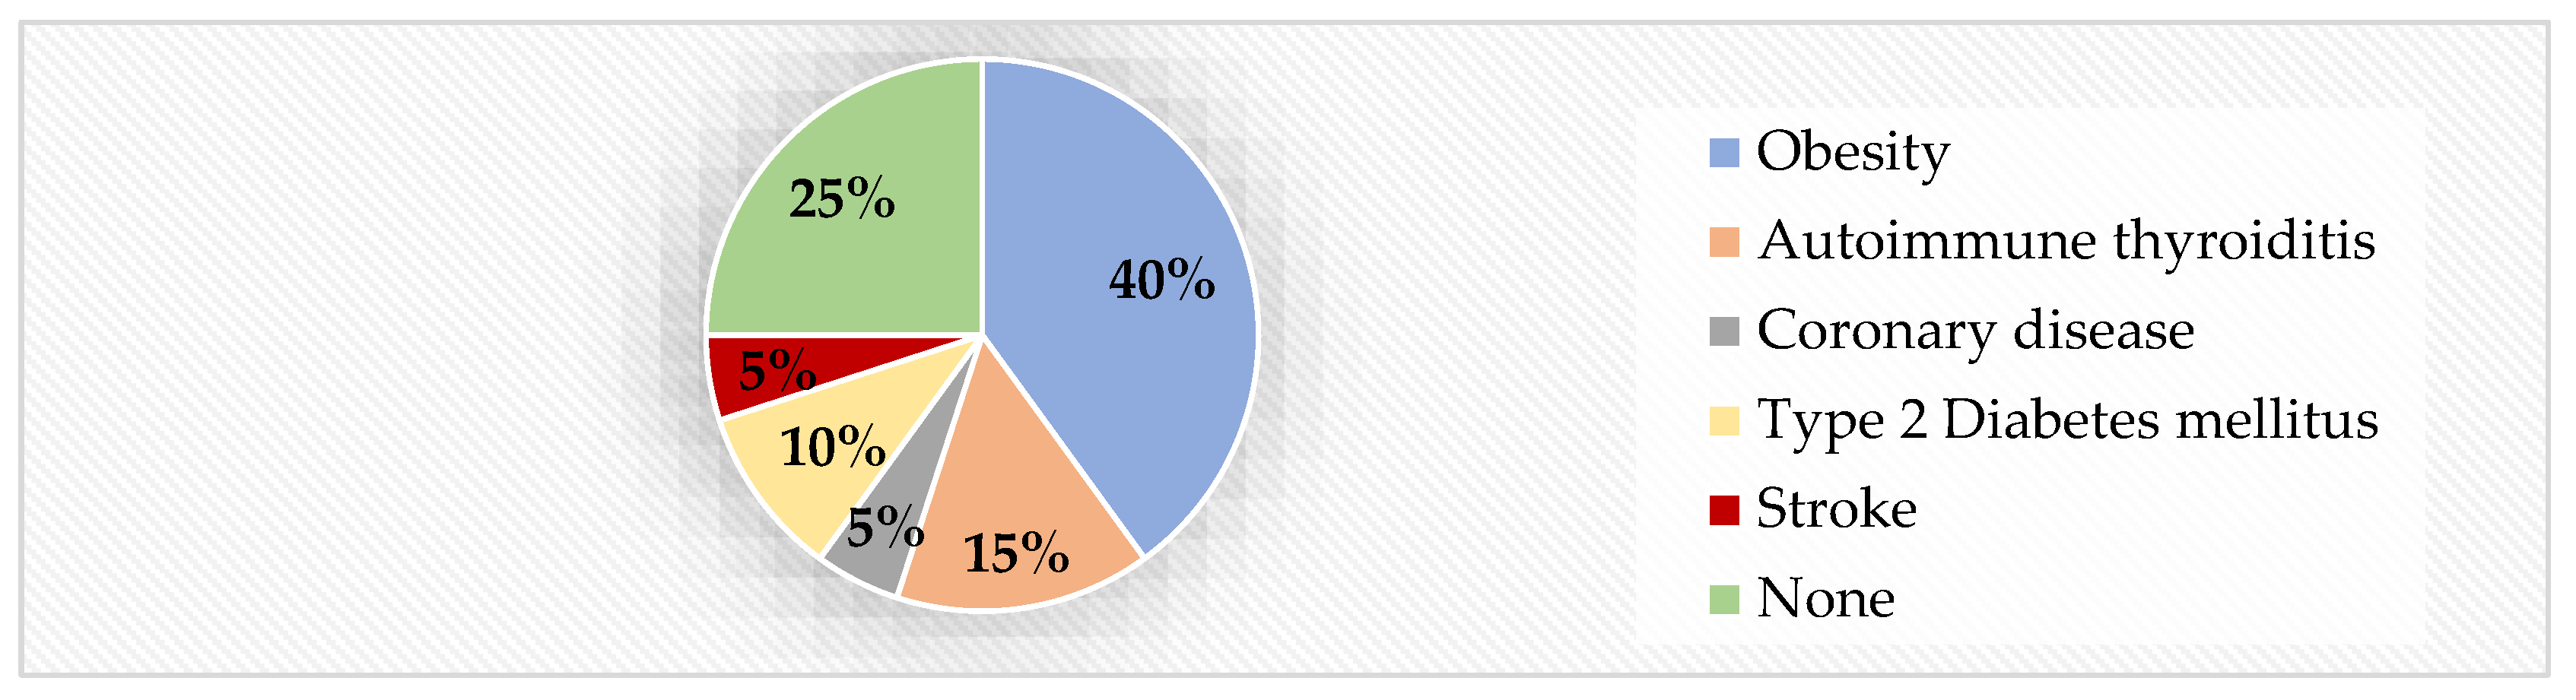
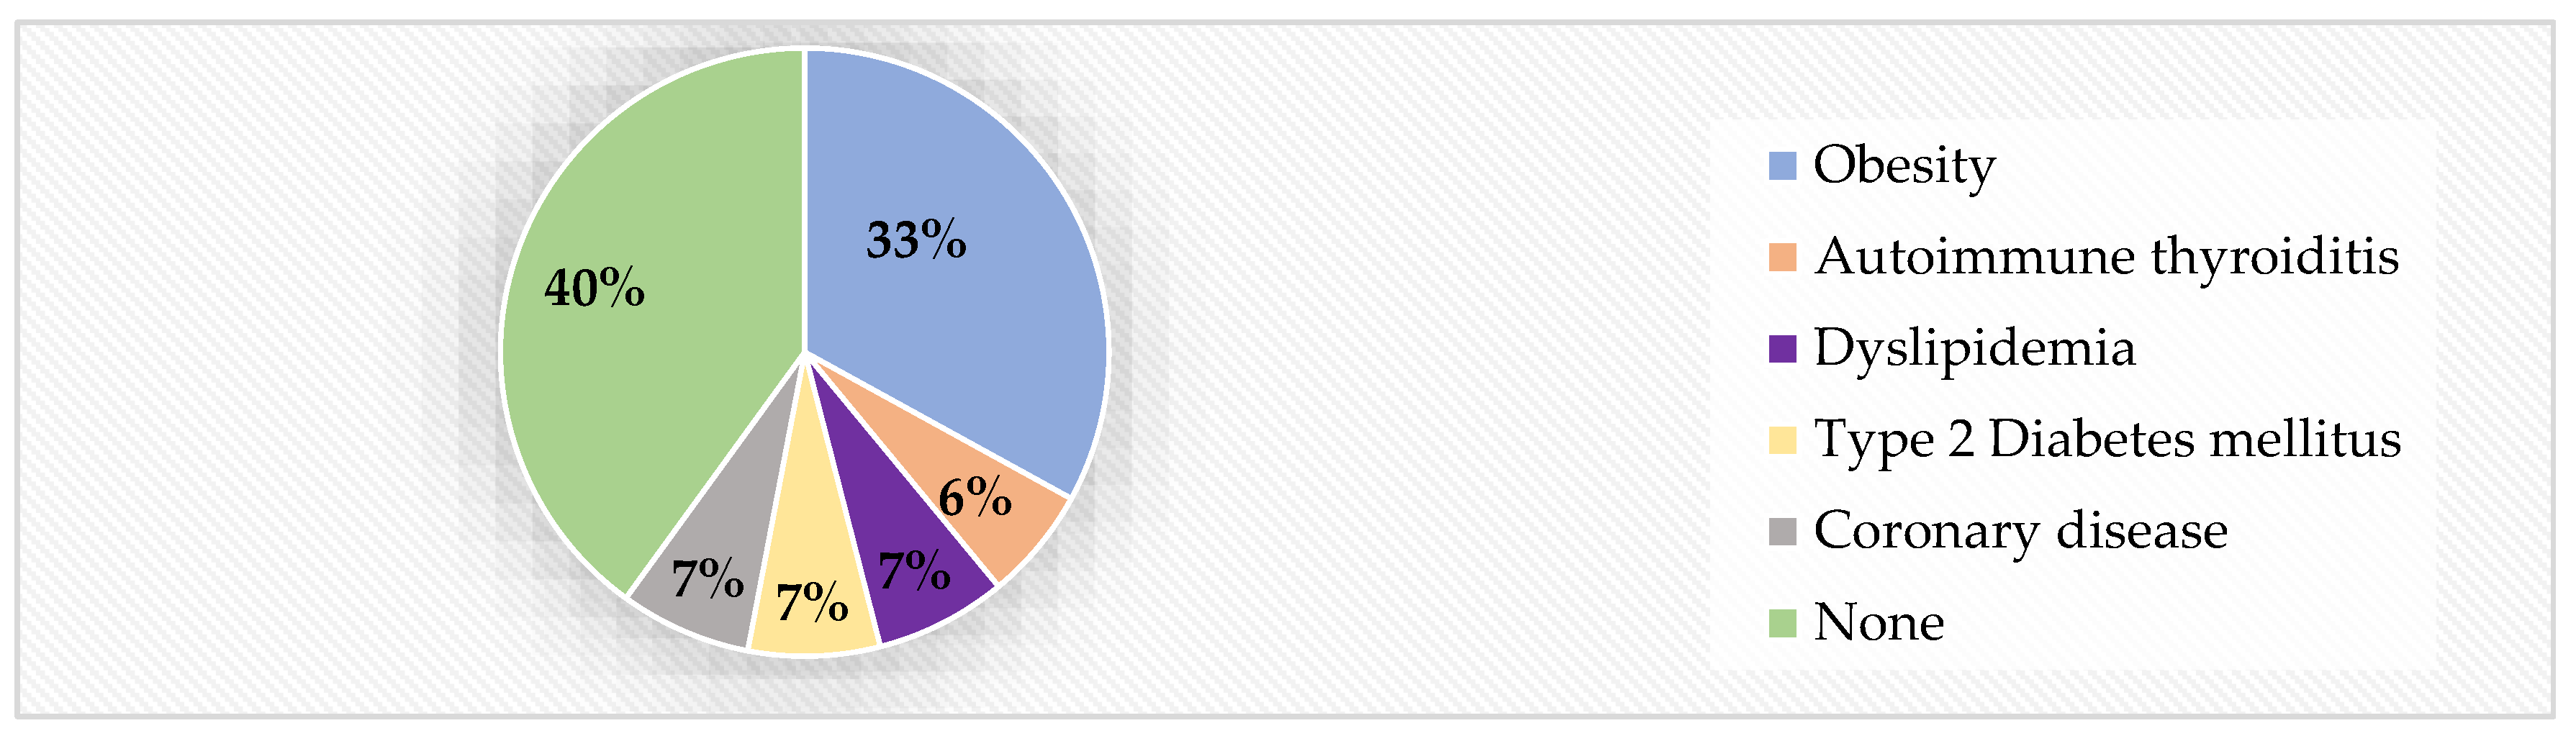
  • Family history. Family history was an important context for the obese group: 75% of obese children had at least one significant cardiometabolic risk factor within their close family history (Figure 3). Obesity was present in 40% of the cases, followed by autoimmune thyroiditis and type 2 diabetes. CIMT reached statistically significant higher values in children with positive family history than in those without (p = 0.049).
  • High blood pressure. High blood pressure was detected in 20% of the obese patients. Although CIMT scored higher values in this group than in the one with healthy blood pressure levels, the difference was not statistically significant (p = 0.102).
  • Smoking. Smoking proved to be a significant risk factor. Only 15% of the adolescents pertaining to the obese group declared that they were smokers. Their CIMT mean was highest than any of the analyzed subgroups and the differences were statistically significant (p = 0.015). Moreover, smoking was strongly and positively correlated with higher values of CIMT (r = 0.53).
  • Lifestyle. In the obese group, 65% of children declared a sedentary lifestyle (practicing no sport and having less than an hour/day of physical activity). CIMT values were higher than in children with healthy physical activity, but the differences were not statistically significant.

3.3.2. Overweight Patients

Overall CIMT mean values were lower for overweight children than for obese children (Table 4).
  • Postnatal nutrition. In the overweight group, the nutrition factor was divided almost equally between children, with 47% having received formula as nurslings. However, the mean CIMT was significantly higher in children fed with formula ( X ¯ = 0.5 mm) than in breastfed children ( X ¯ = 0.44 mm), p = 0.023.
  • Birth weight. Exactly one third of the overweight patients were born with a birth weight higher than 3500 g and scored higher CIMT values ( X ¯ = 0.5 mm) than the low BW and normal BW groups ( X ¯ = 0.45 mm and X ¯ = 0.46 mm, respectively). No statistical differences were detected between subgroups.
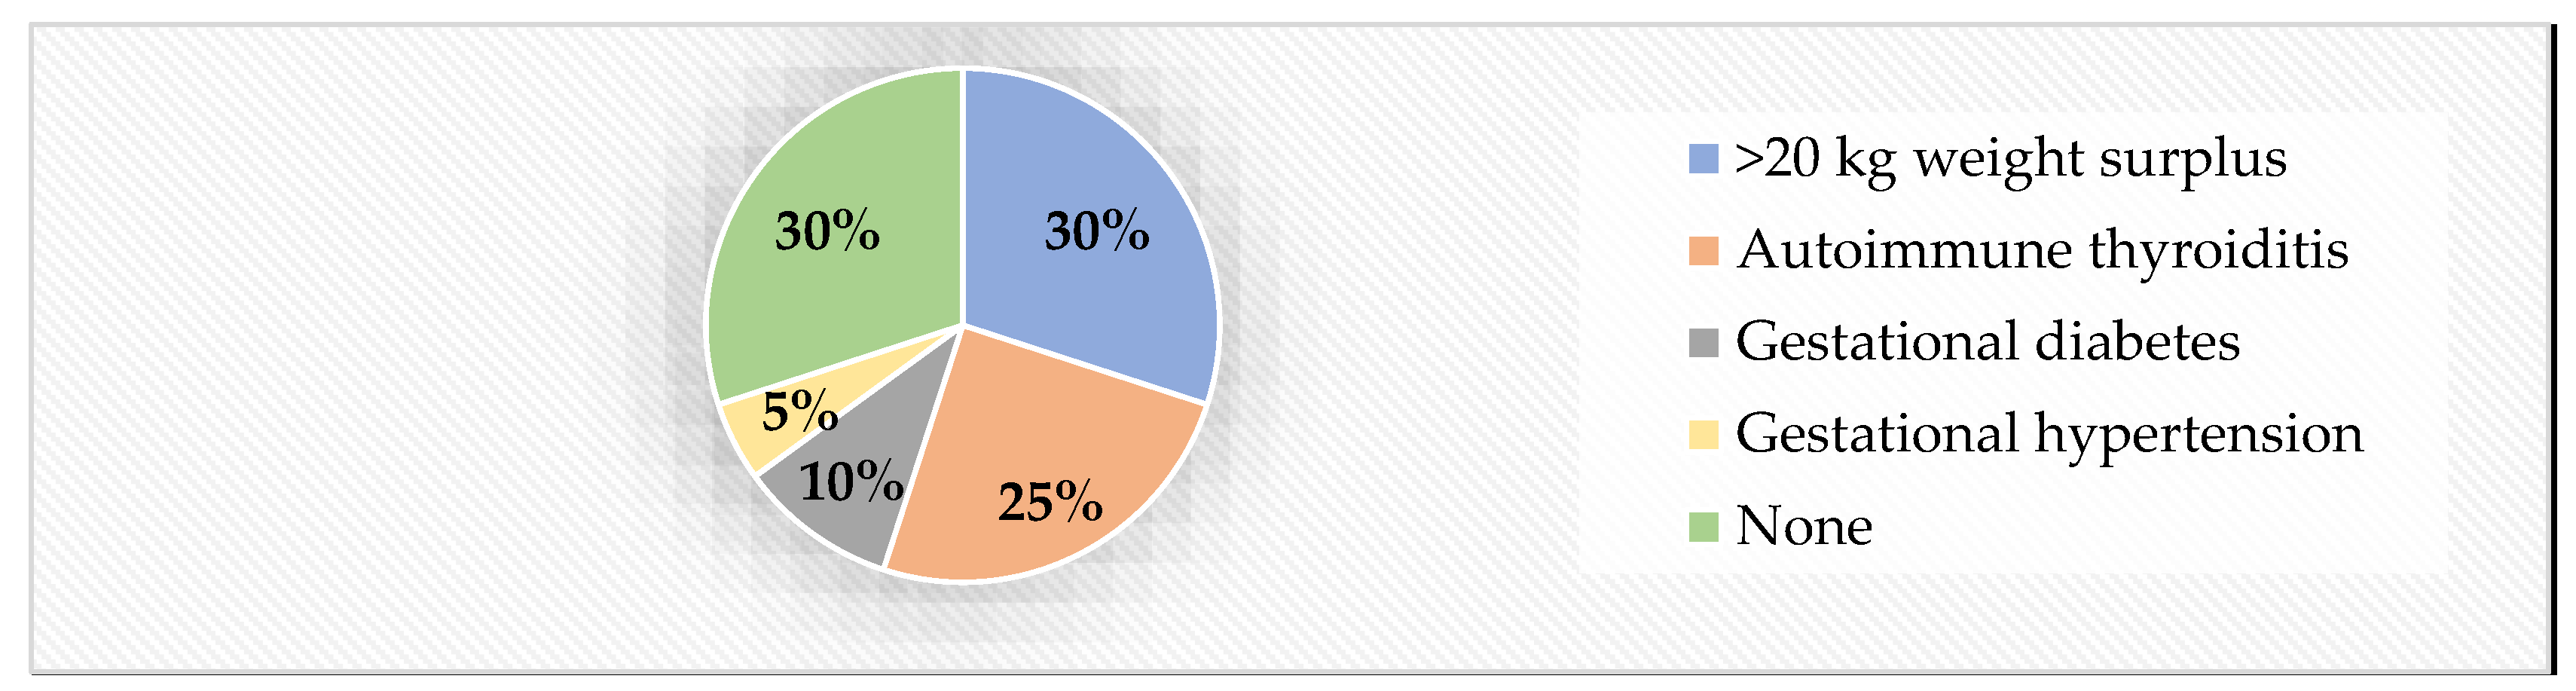
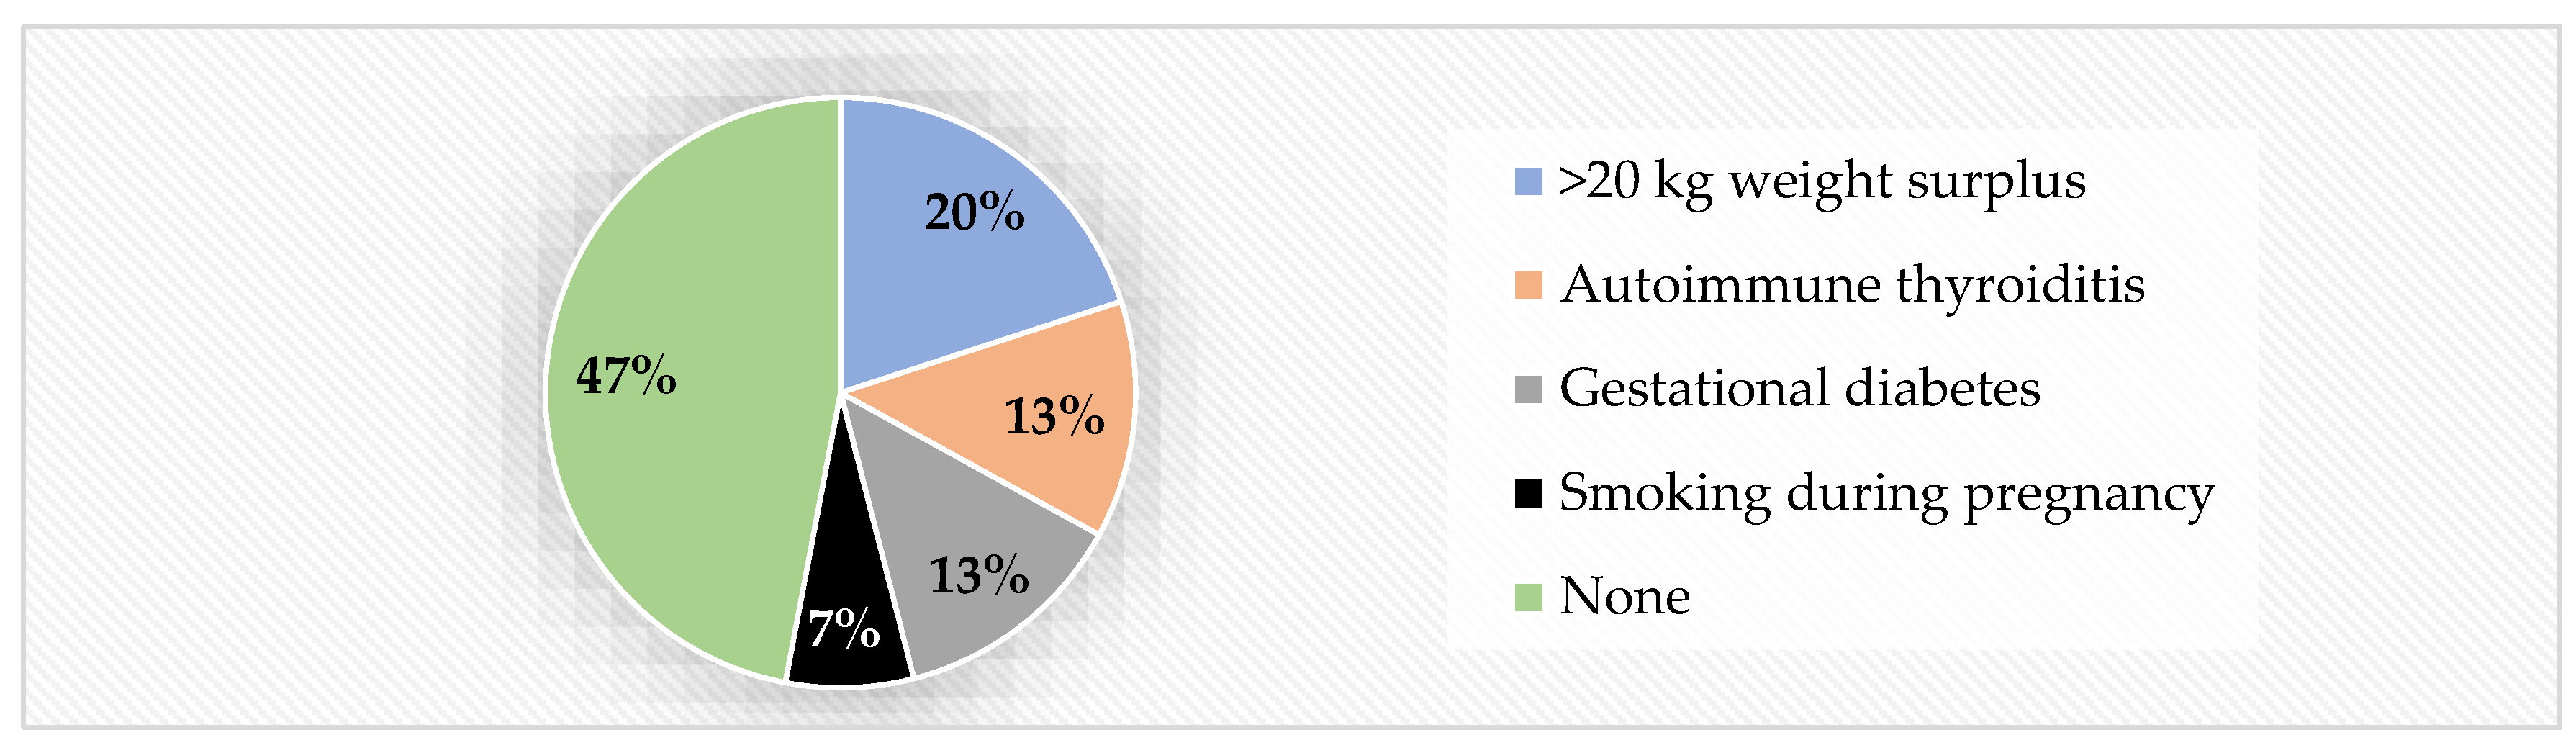
  • Biological mother’s health during pregnancy. A total of 53% of overweight patients were born to mothers who had problematic pregnancies. These children showed higher CIMT values than those who were born to healthy mothers (Table 4) and the differences between them were statistically significant (p = 0.042). The most encountered risk factor was weight gain of over 20 kg during pregnancy (20% of cases), followed by autoimmune thyroiditis and gestational diabetes in equal percentages (13%). A total of 7% of mothers admitted to smoking during pregnancy in this group (Figure 4).
  • Family history. A total of 60% of overweight kids had an at-risk medical family history (Figure 5). Statistically significantly higher CIMT values were detected in the group with such risk factors within the immediate family, compared to children with negative family history (p = 0.049).
  • High blood pressure. Even fewer children presented high blood pressure in the overweight group (13%, compared to 20% in the obese group). However, the CIMT values were significantly higher in hypertensive children than in non-hypertensive ones (p = 0.012).
  • Smoking. CIMT mean was higher in smoking overweight children, but the differences were not statistically significant due to the small case sample (p = 0.06). Even so, smoking remains a solid risk factor for increased CIMT, in overweight children as well.
  • Lifestyle. A total of 40% of overweight children admitted to leading a sedentary lifestyle, with less than 1 h of physical activity per day. However, the higher values of CIMT in the risk group were not statistically significant (p = 0.324).

3.3.3. Normal-Weight Patients

CIMT overall mean values were lower in all subgroups compared to the ones in the obese and overweight groups. Although we detected higher CIMT in all risk categories, the differences were not statistically significant, due to small samples (Table 5).
  • Postnatal nutrition. Only 36% of normal-weight children received formula as nurslings, and their CIMT mean values scored higher than in the breastfed group ( X ¯ = 0.41 mm vs. X ¯ = 0.37 mm).
  • Birthweight. Birth weight had no influence on the outcome of CIMT; 52% of children had normal BW and a X ¯ = 0.38 mm CIMT, whereas 48% had abnormal BW (8% <2500 g and X ¯ = 0.39 mm CIMT, and 40% >3500 g and X ¯ = 0.4 mm CIMT, respectively).
  • Biological mother’s health during pregnancy. Unhealthy pregnancy seemed to be a valid risk factor for higher CIMT ( X ¯ = 0.43 mm vs. X ¯ = 0.37 mm) even in normal-weight children; however, only 32% of normal-weight children were born from unhealthy pregnancies, compared to 70% in the case of obese children and 53% in the case of overweight children, respectively. A total of 12% of unhealthy pregnancies were due to >20 kg weight gain and 8% due to autoimmune thyroiditis, whereas gestational diabetes, gestational hypertension, and smoking during pregnancy added up to 4% each. A total of 68% of pregnancies that resulted in normal-weight children were declared completely physiological.
  • Family history. Up to 72% of normal-weight children had no family history of cardiometabolic diseases. CIMT mean values scored higher in children with at-risk family history, but the differences were not statistically significant ( X ¯ = 0.42 mm vs. X ¯ = 0.3 mm, p = 0.2). Out of the 28% of children with a history of cardiometabolic diseases in their immediate family, 16% declared obesity, whereas autoimmune thyroiditis, high blood pressure, and type 2 diabetes each added up 4%.
  • High blood pressure. Out of the 25 overall subjects with high blood pressure, only one patient belonged to the normal-weight group.
  • Smoking. The same situation was detected for the risk factor of smoking: One patient out of the 25 smoking patients belonged to the normal-weight group.
  • Lifestyle. Up to 68% of normal-weight controls led healthy lifestyles with regard to physical activity (>1 h of exercise/day and/or practicing an organized sport). Those patients presented lower values for CIMT than children with sedentary lifestyles, but the differences were not statistically significant (p = 0.24).

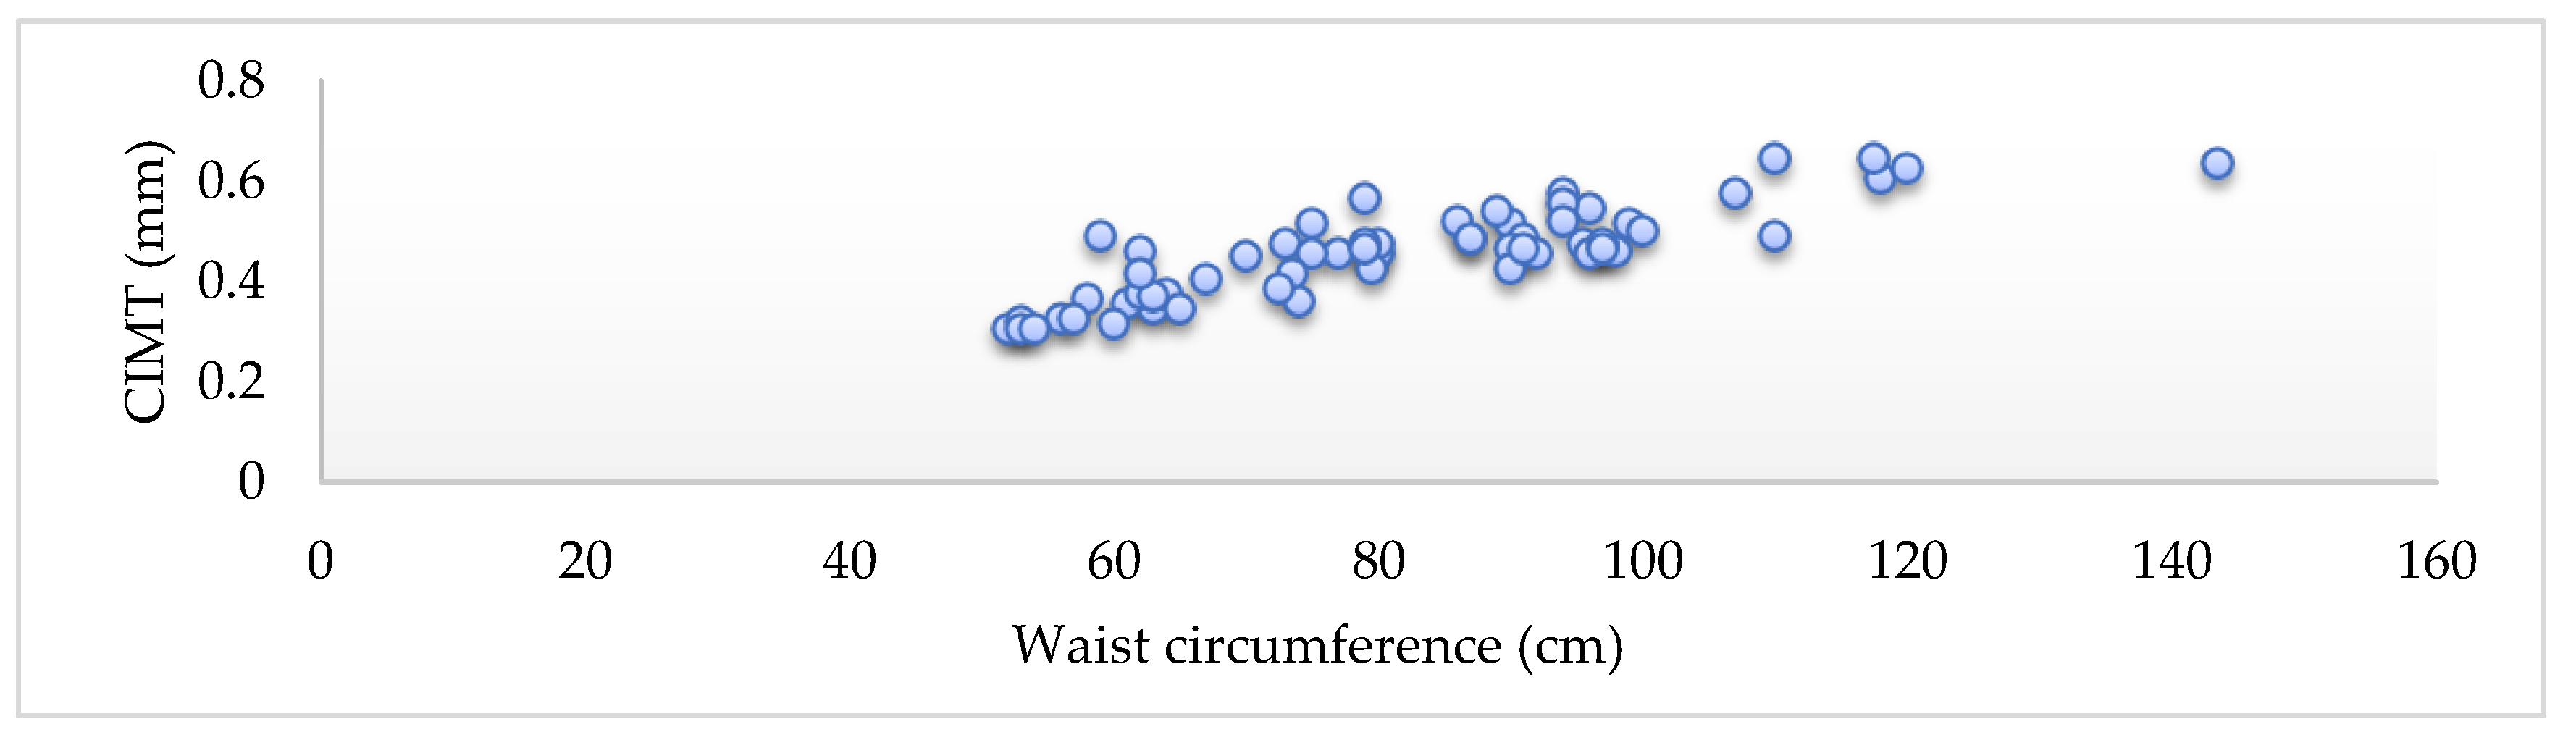
3.4. Assessment of Waist Circumference and CIMT

3.4.1. Waist Circumference in Obese Children

Mean waist circumference was X ¯ = 100.5 cm, with no difference between girls and boys (p = 0.96).
We detected a strong positive correlation between values of children’s waist circumference and their CIMT values (Spearman’s correlation coefficient ρ = 0.69, p = 0.0006). See Figure 3.
In addition, the higher the values of their waist circumference, the higher their blood pressure (r = 0.61, p = 0.004); see Table 6.

3.4.2. Waist Circumference in Overweight Children

Mean waist circumference was X ¯ = 87.3 cm, with no difference between girls and boys (p = 0.6).
A strong positive correlation was found between waist circumference and CIMT (Pearson’s r = 0.64) in overweight children, but we did not detect any other correlations for other parameters.

3.4.3. Waist Circumference in Normal-Weight Children

  • Mean waist circumference was X ¯ = 63.9 cm, with no difference between girls and boys (p = 0.96).
  • We detected a strong positive correlation between values of children’s waist circumference and their CIMT values (Spearman’s ρ = 0.77); see Table 7 and Figure 5.
Waist circumference, an acknowledged marker of visceral obesity and insulin resistance [40], is positively correlated to CIMT values (Figure 6) and to other complications of obesity, especially to higher blood pressure values.

3.5. Assessment of Blood Parameters and CIMT

The focus of this part was the correlation analysis between CIMT values and the below-mentioned blood parameters.

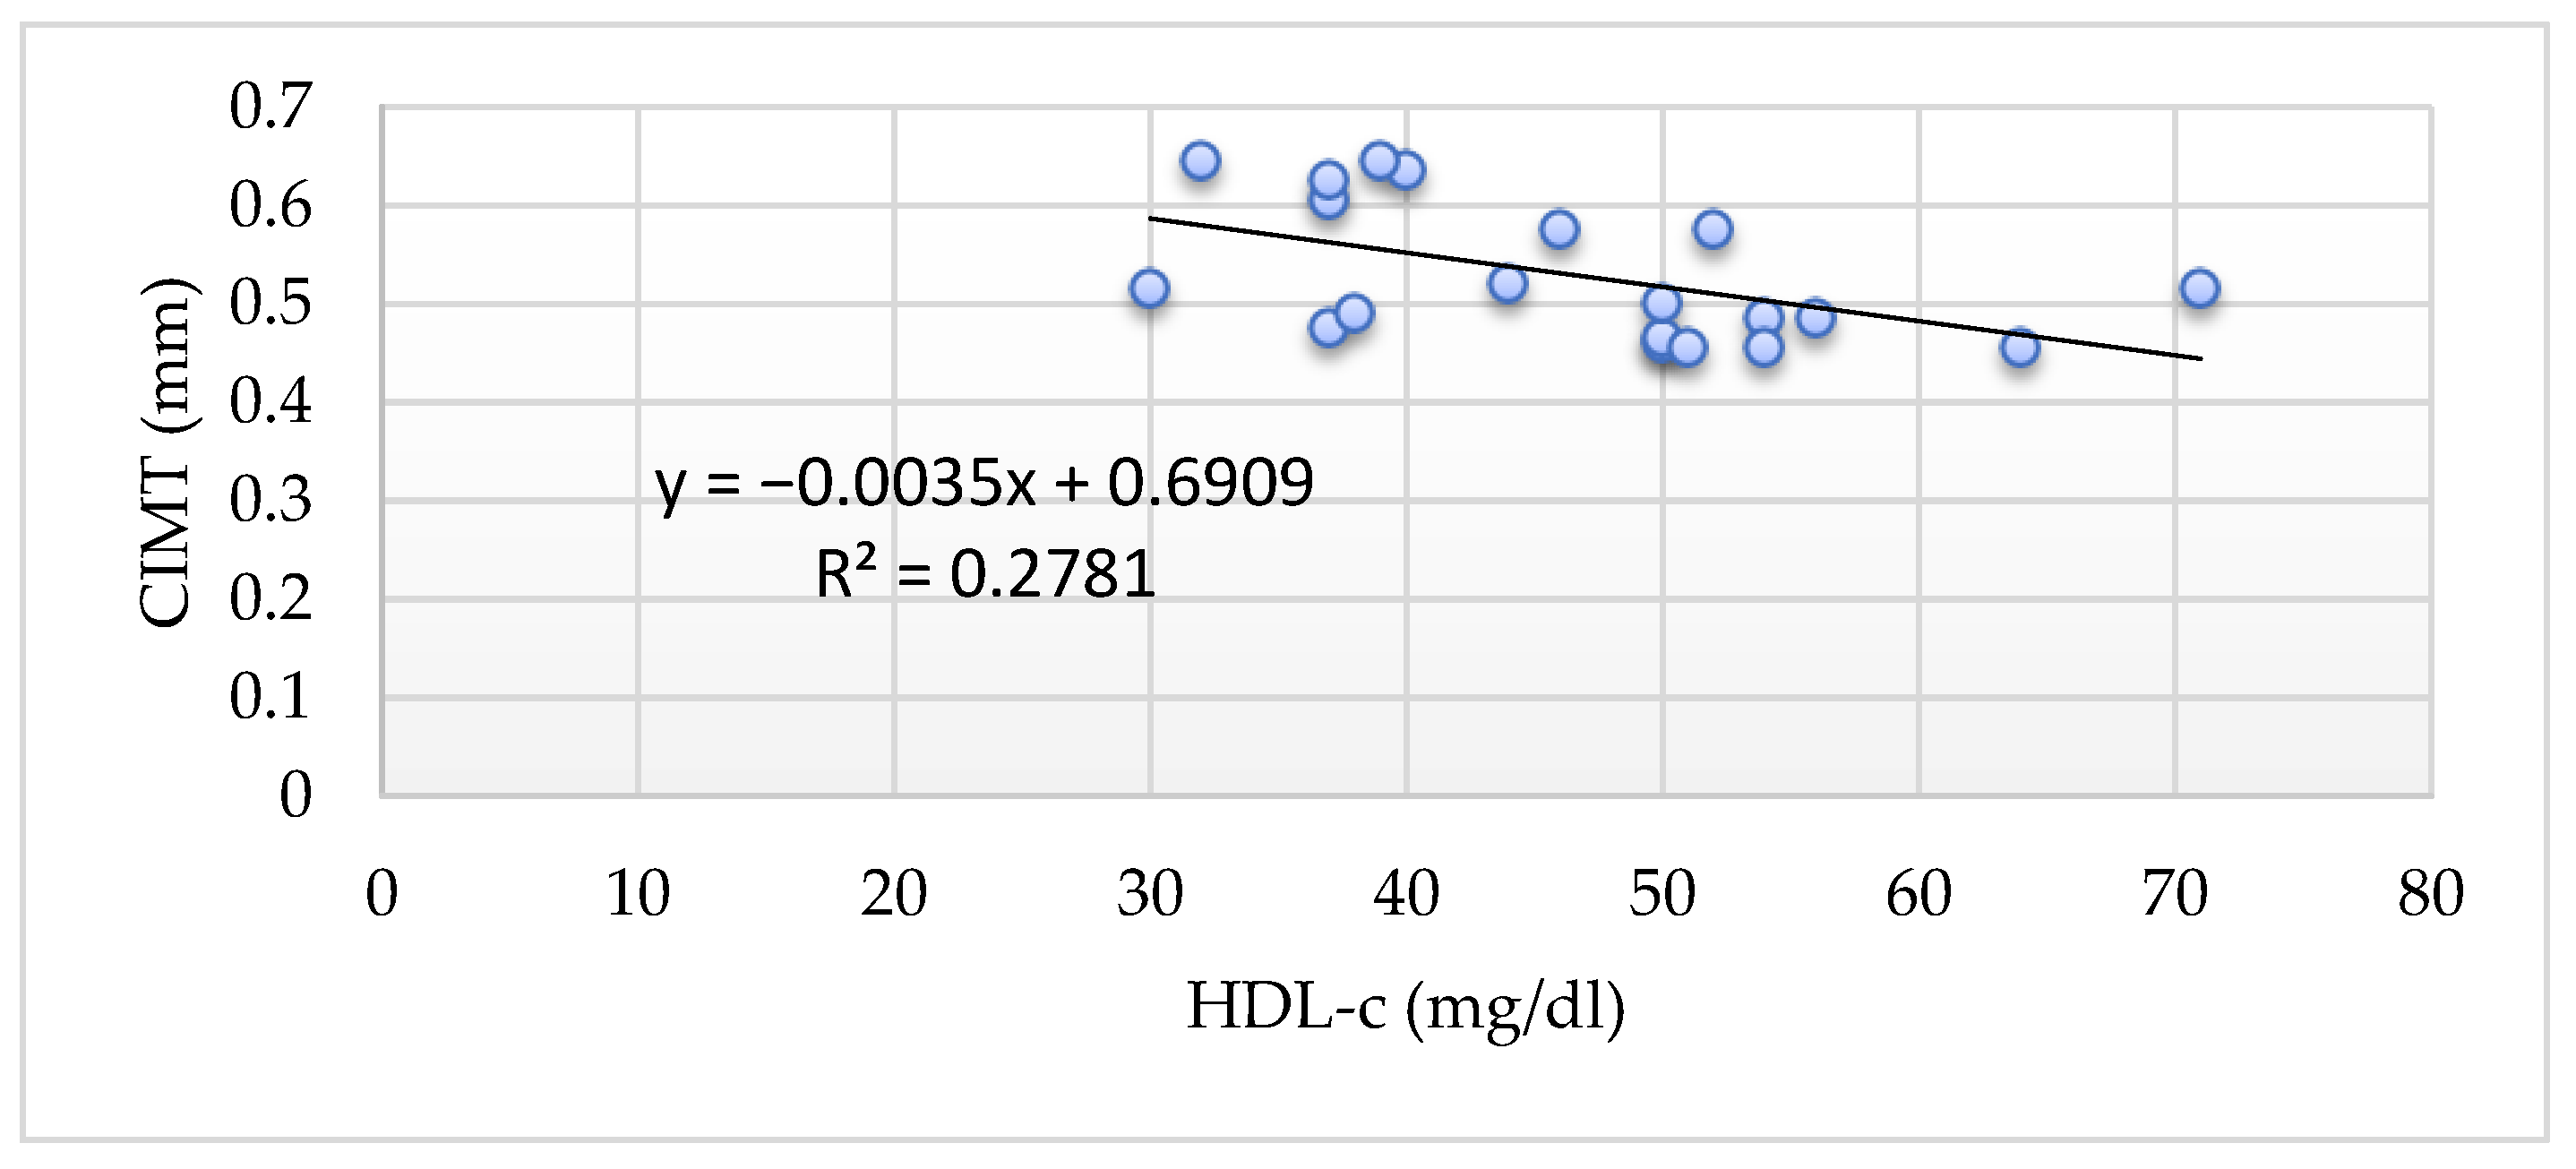
3.5.1. HDL Cholesterol and CIMT

Obese children showed a moderate negative correlation between values of CIMT and HDL cholesterol (HDL-c), ρ = −0.53 (Figure 7), but there was a weaker negative correlation in normal-weight children. Mean values of HDL-c were slightly above 40 mg/dL, and a surprising result is that the lowest mean values were detected in the normal-weight group ( X ¯ = 42.3 mg/dL).

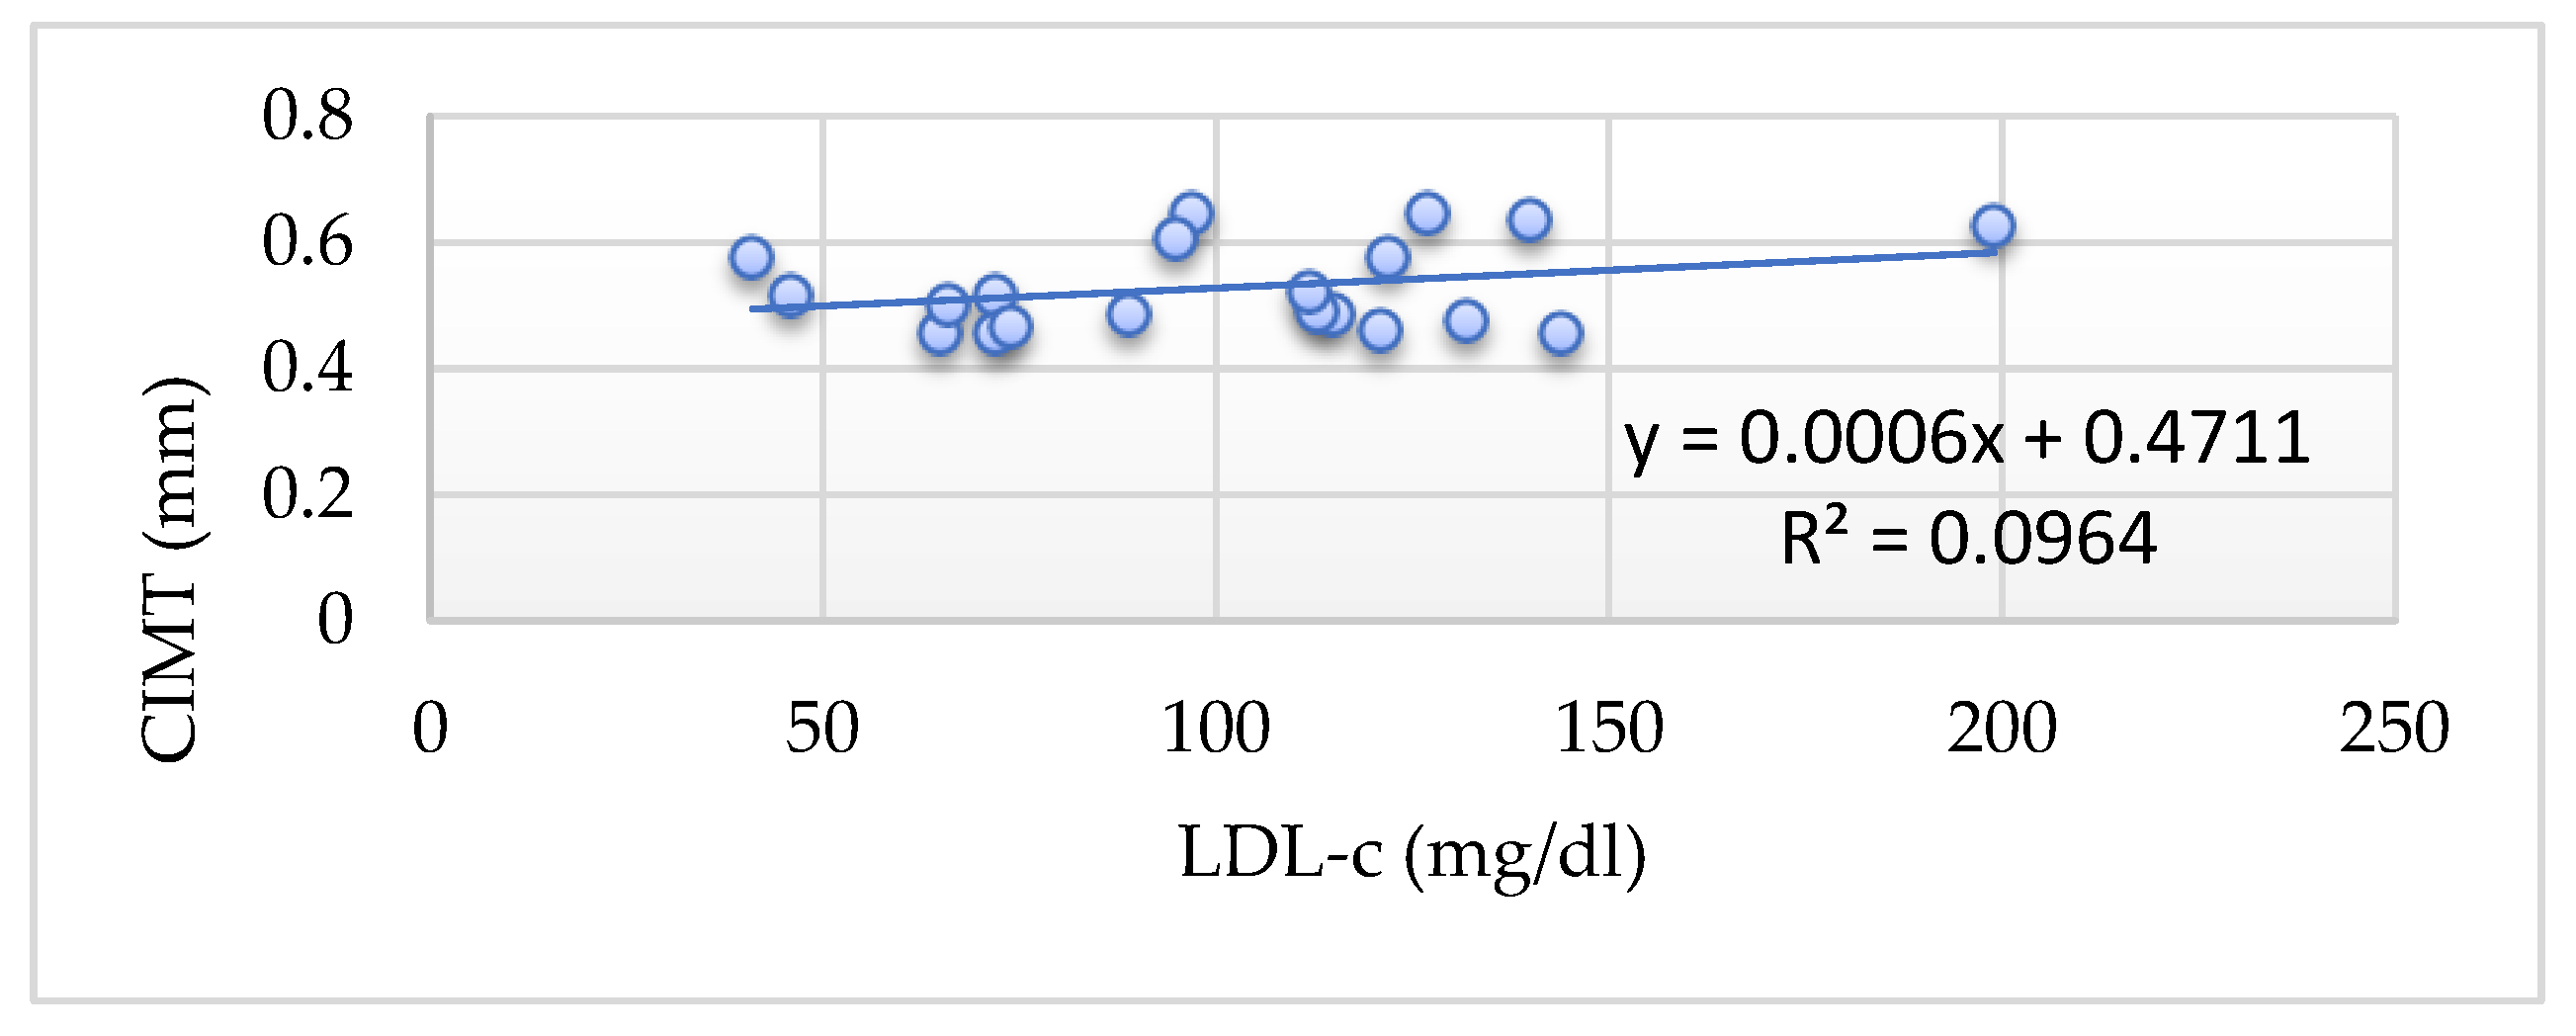
3.5.2. LDL-Cholesterol and CIMT

We detected a positive correlation between CIMT and the values of LDL cholesterol (LDL-c) in the obese group, ρ = 0.31 (Figure 8). Neither the controls nor the overweight group showed such a correlation (ρ = 0.04 and r = 0.07, respectively); see Table 8. Mean LDL-c values were similar, with no statistical differences between groups. CIMT mean values were highest for obese ( X ¯ = 0.53 mm) and overweight ( X ¯ = 0.5 mm) children, and only X ¯ = 0.4 mm in the normal-weight group.

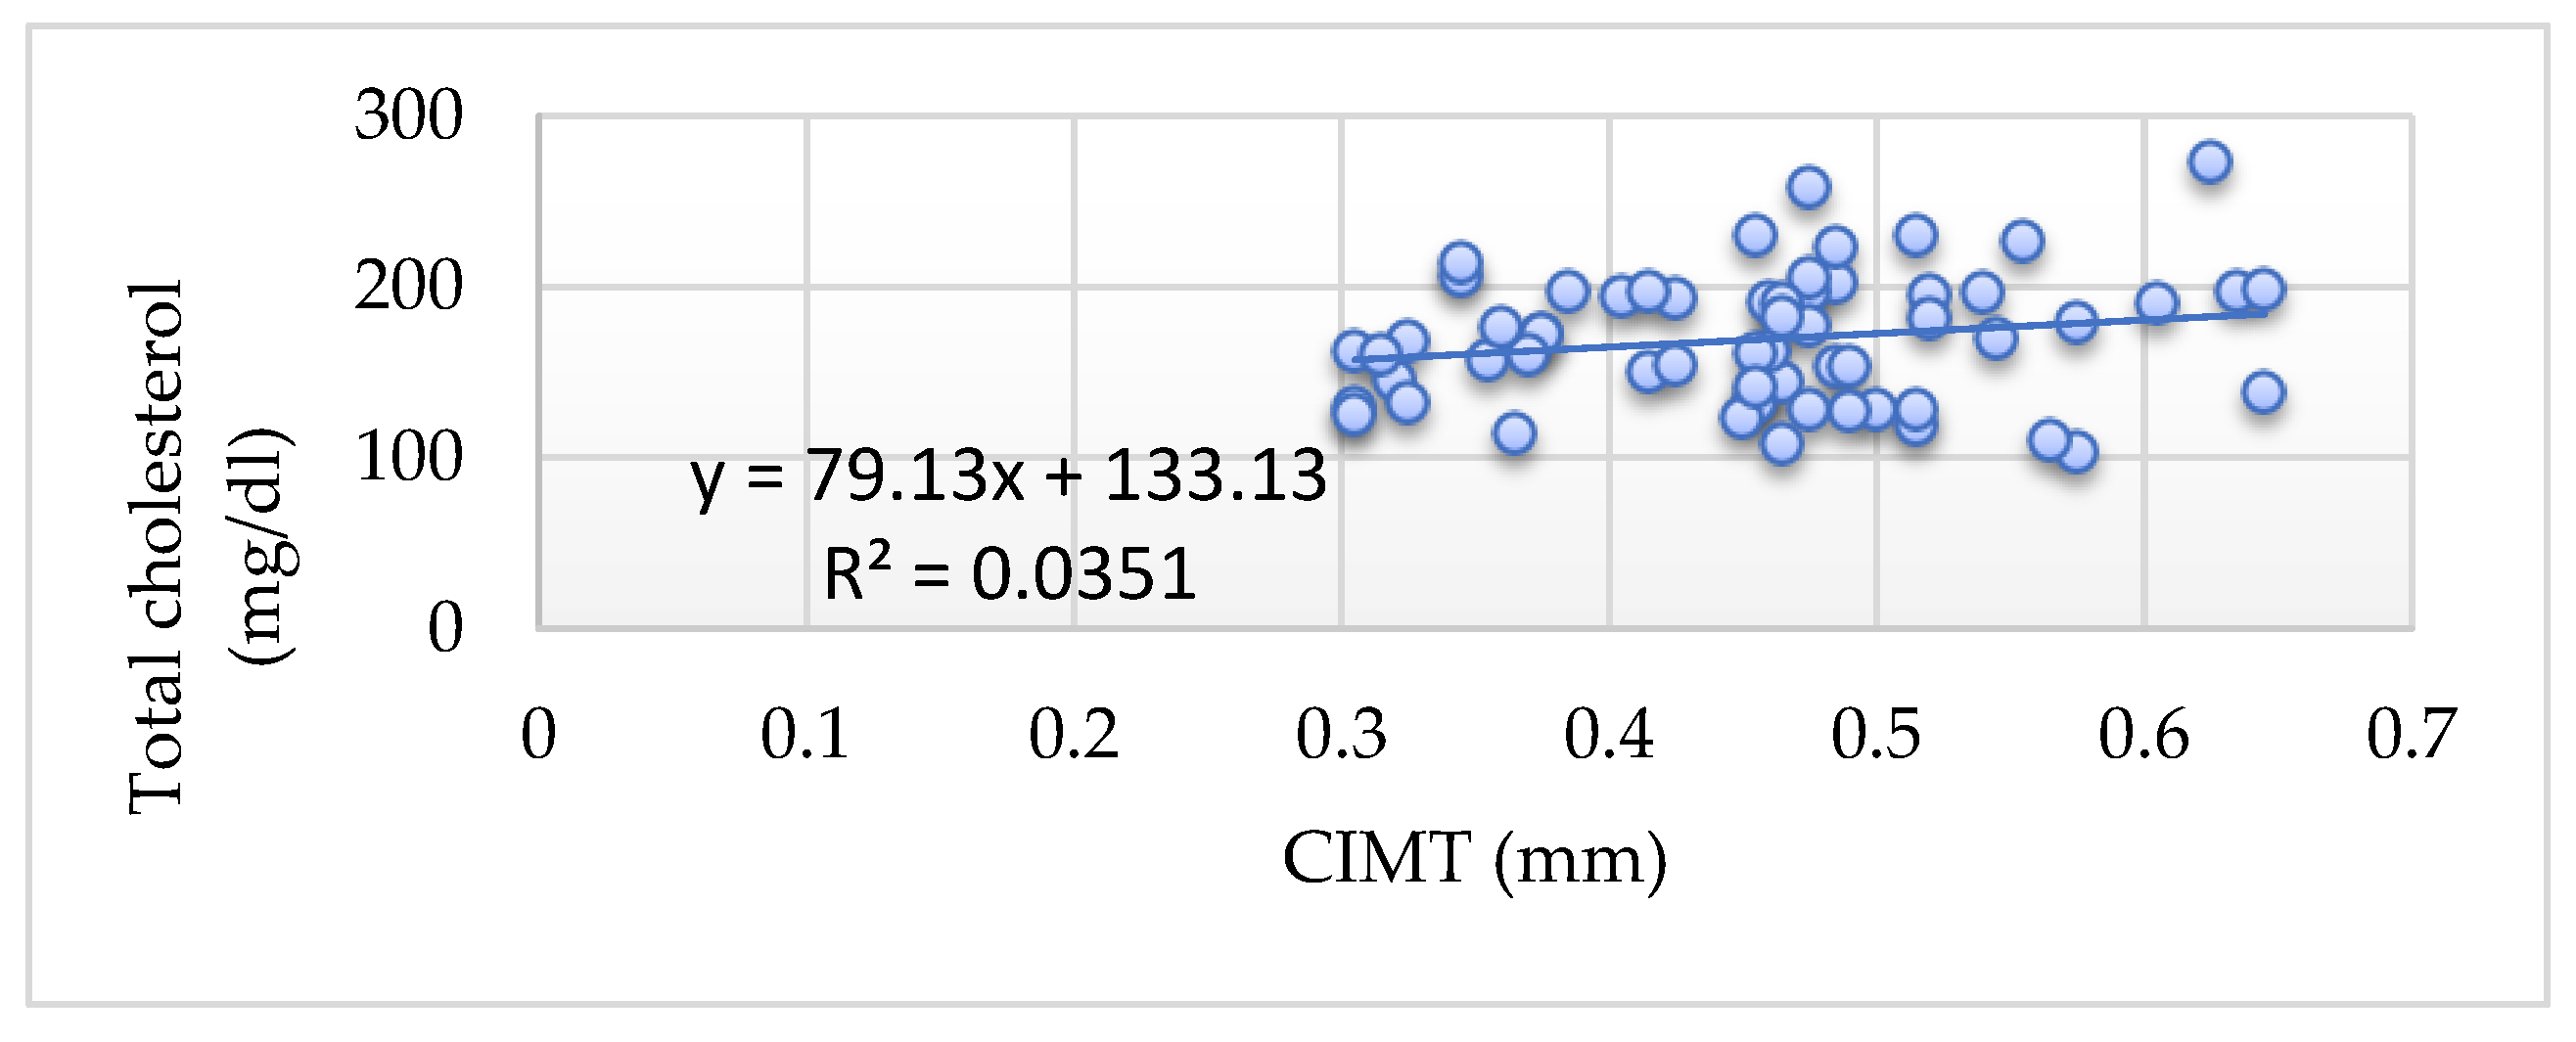
3.5.3. Total Cholesterol and CIMT

We detected weak positive correlations between the values of total cholesterol (TC) and CIMT in the weight-excess groups of study (ρ = 0.23 in obese children, r = 0.15 in overweight children, and ρ = 0.07 in normal weight ones). No statistical significance was detected. We observed that the more severe the weight excess was, the stronger the correlation between the TC and CIMT (Figure 9).

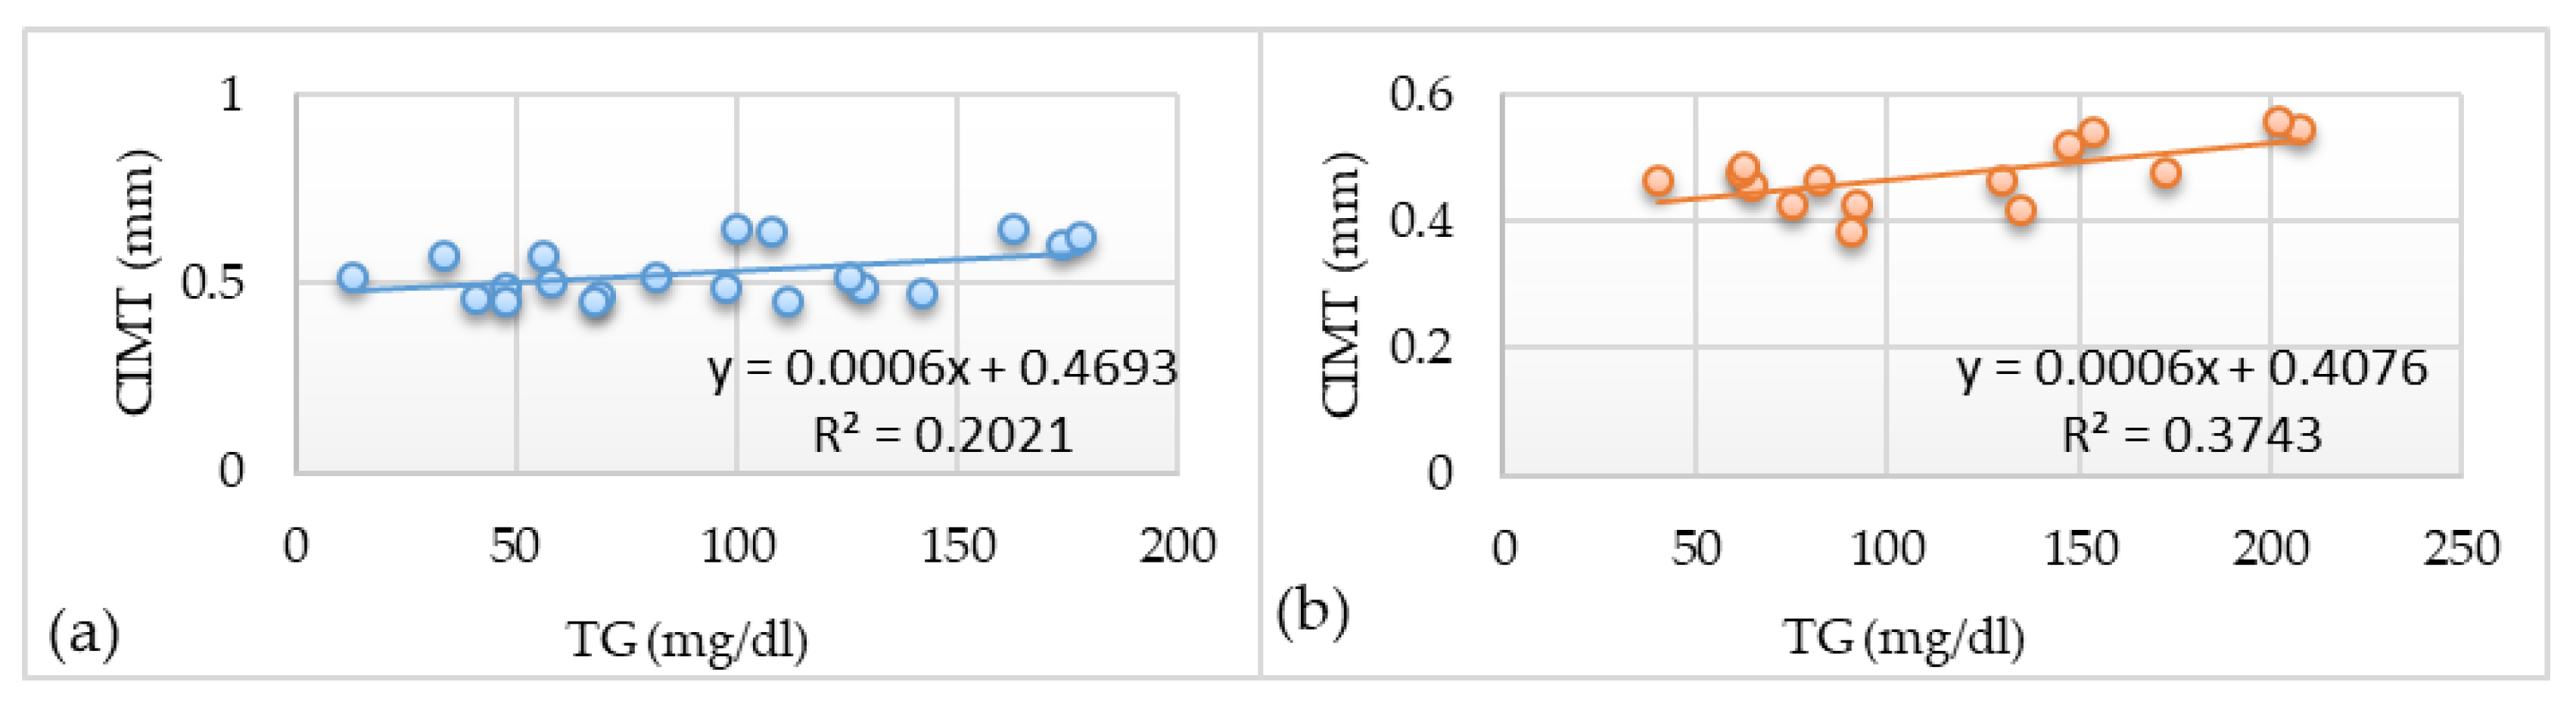
3.5.4. Triglycerides and CIMT

Moderate and strong correlations between CIMT values and the levels of triglycerides (TG) were detected in the obese (Figure 10a) and overweight groups (ρ = 0.45 and r = 0.6, respectively, Figure 10b), whereas no correlation was detected in the normal-weight group (ρ = 0.08); see Table 8. Mean levels of TG were significantly higher in the overweight group, as was the strength of the correlation. TG levels are correlated to BMI values (r = 0.2) and mean values of TG in sedentary children are higher, but our findings were not statistically relevant (p = 0.47).

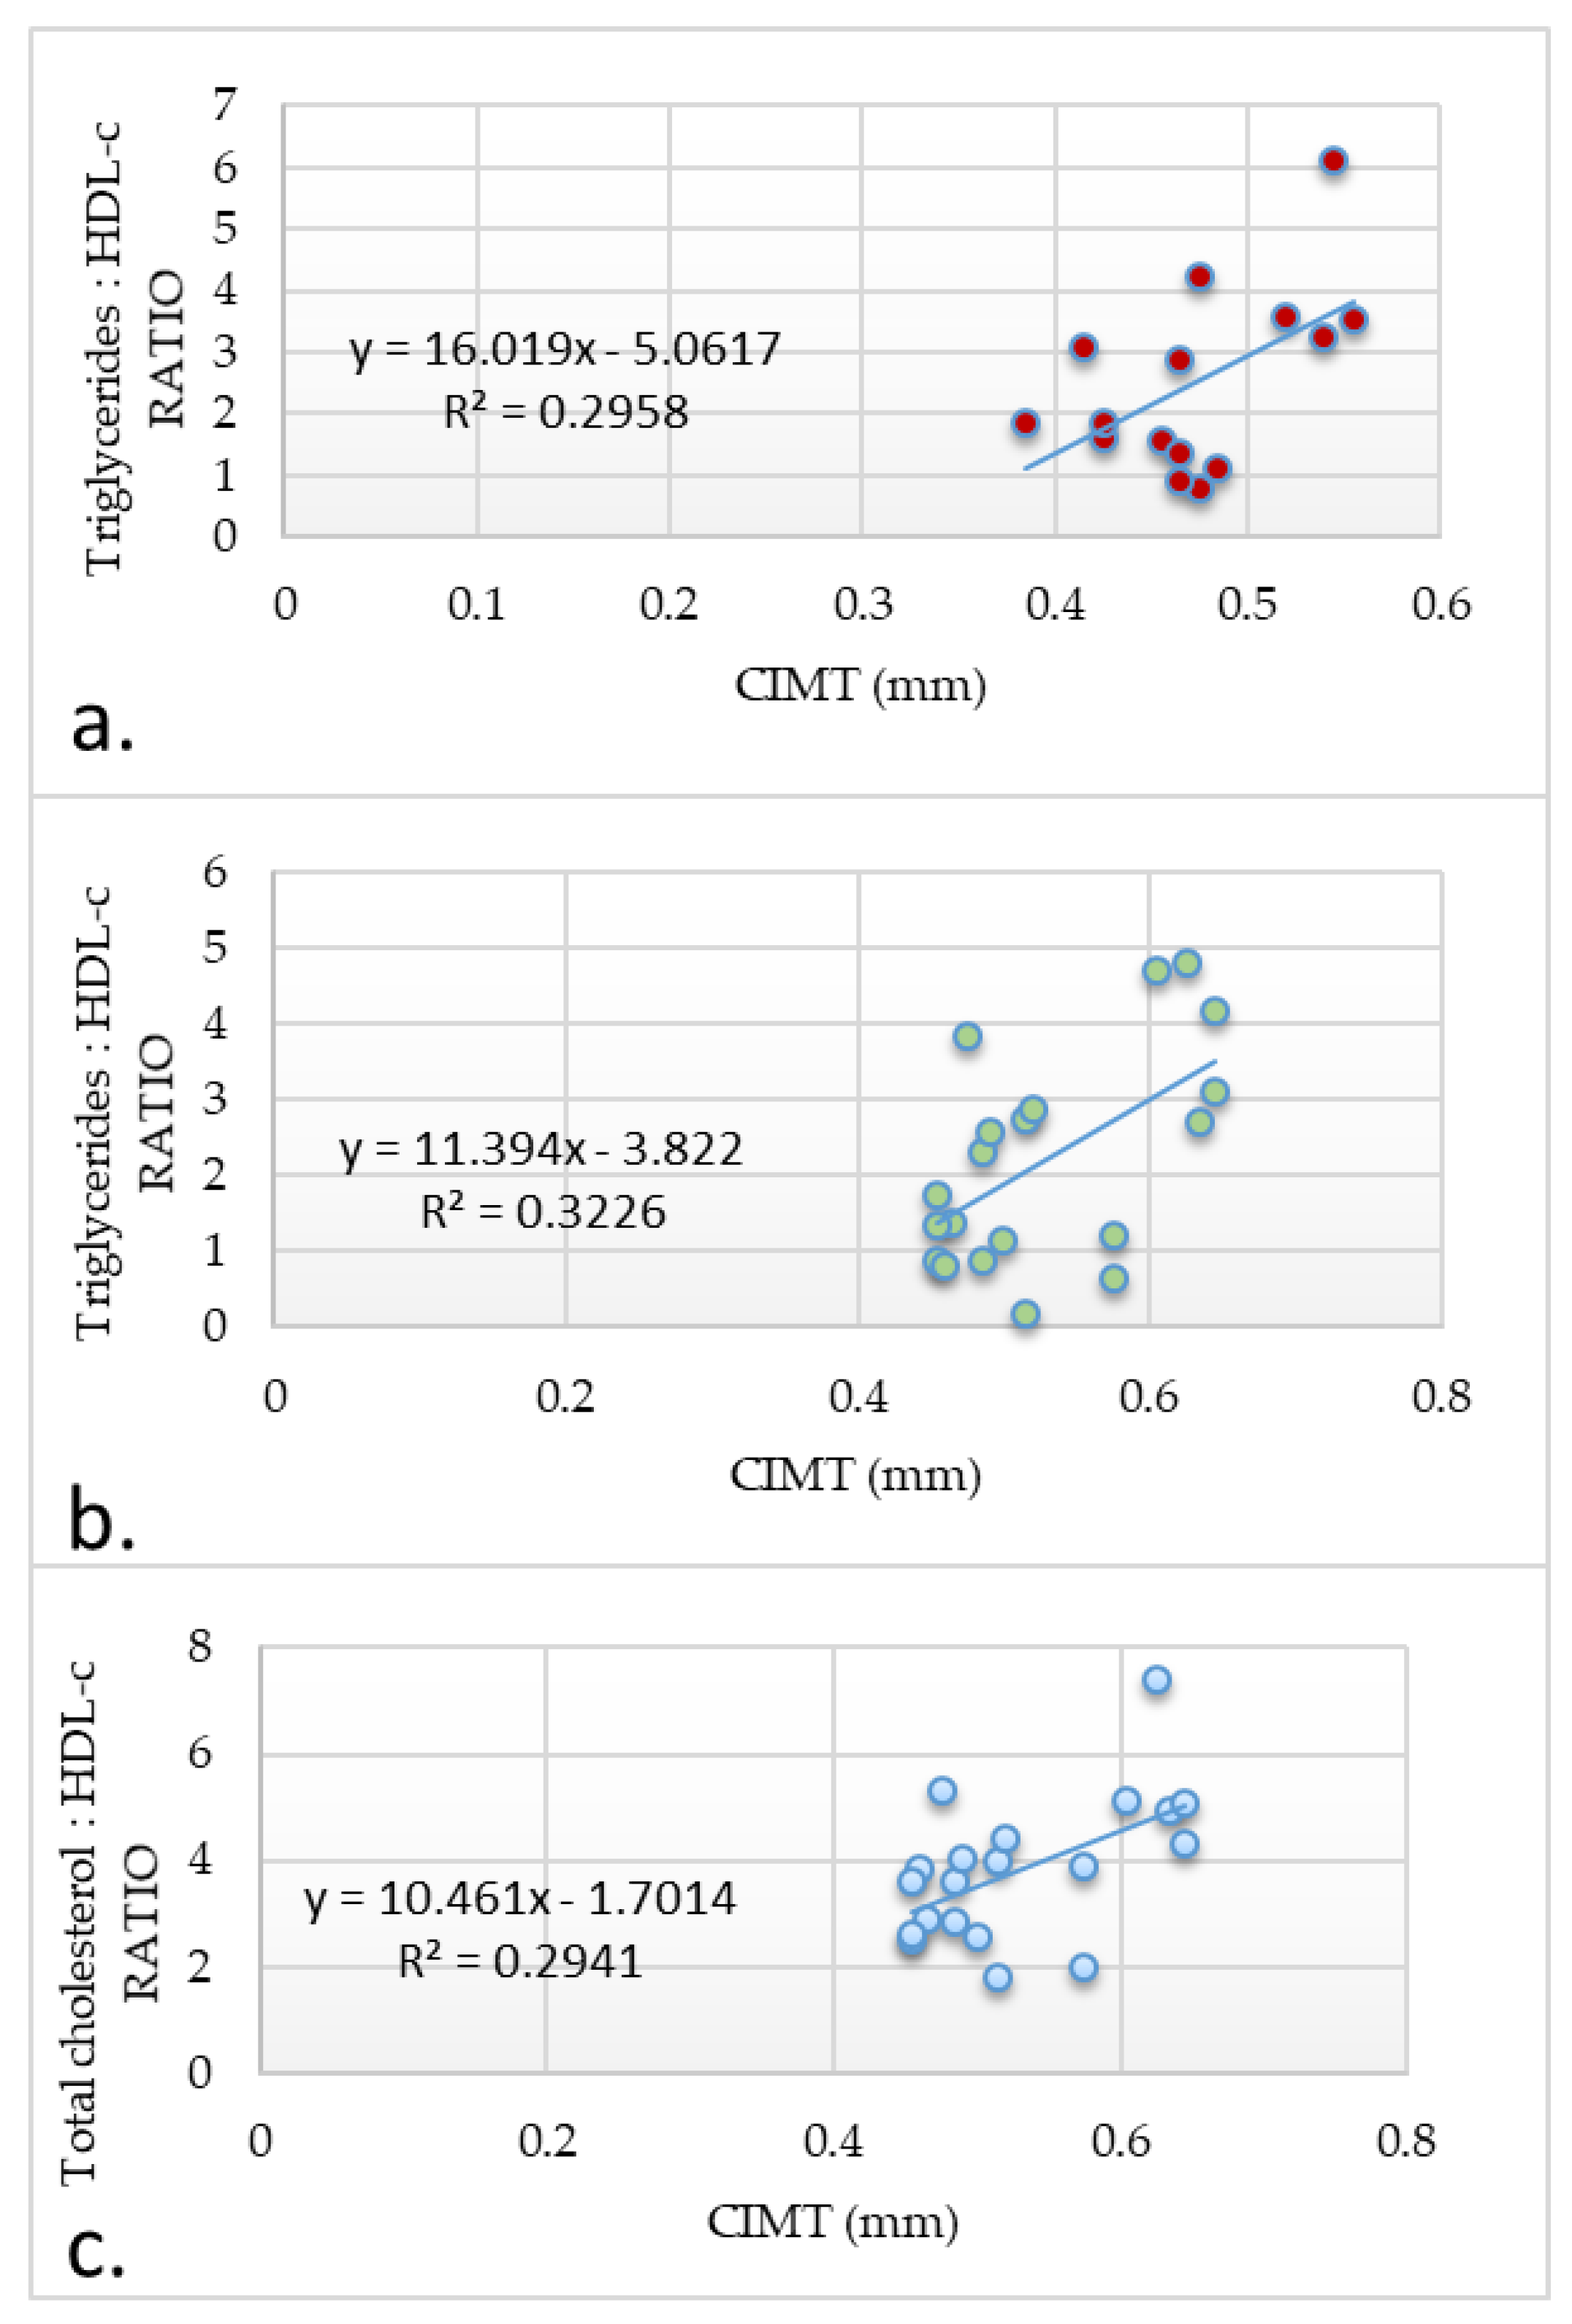
3.5.5. Non-HDL Cholesterol, Total Cholesterol/HDL-c Ratio, Triglyceride/HDL-c Ratio, and CIMT

Mean values for non-HDL-c, TC/HDL-c ratio, and TG/HDL-c ratio were less ideal as weight severity increased (Table 9). Correlation strengths between CIMT values and the mentioned parameters grew in tandem with weight excess, as well (Table 8, Figure 11). We did not detect any statistically significant difference between CIMT values of different range categories when comparing these parameters.
Up to 40% of obese and overweight patients presented at risk values of non-HDL-c (≥145 mg/dL). Half the patients with normal weights presented healthy values for non-HDL-c (<120 mg/dL) and only 20% presented values higher than 145 mg/dL [41].
Up to 60% of all three groups presented borderline TC/HDL-c ratio values (3.5–5) and 19% of obese children presented TC/HDL-c ratio values ≥5 [41].
Over 70% of patients in all three groups presented TG/HDL ratios ≥1.12, which, according to de Georgis et al. and Iwani et al. are values indicating higher risk [42,43,44]. We mention that cut-off values for TG/HDL-c in children are not fully established and differ among ethnicities [44].

3.5.6. Fasting Glucose and CIMT

The results concerning the relationship between fasting glucose (FG) and CIMT were somewhat contradictory in the sense that we detected negative correlations between FG and CIMT in the control and obese group (r = −0.1 and ρ = −0.3, respectively), and a positive correlation in the overweight group (r = 0.21); see Table 8. These results are either due to small group sampling, or to the fact that fasting glucose in children with ongoing pathologies like insulin resistance have fluctuations in their fasting glucose levels [45]. Mean values of FG were similar in all groups ( X ¯ = 82 mg/dL).

3.6. Multivariate Regression Linear Model

We applied a multivariate linear regression model to identify independent predictors for CIMT. Independent variables included waist circumference, LDL-c, HDL-c, TC, TG, non-HDL-c, TC/HDL-c ratio, and TG/HDL-c ratio. CIMT was considered a dependent variable. Our analysis showed that waist circumference and TG/HDL-c ratio are statistically significant predictors of the dependent variable, CIMT (Table 10 and Table 11).

4. Discussion

The main purpose of this study was to show to what degree CIMT can be considered a reliable evaluation parameter along with the usual ones in obese children. To achieve this goal, we analyzed whether the presence of certain genetic and epigenetic factors influence the values of CIMT and observed how CIMT correlated to certain usual clinical and blood parameters.
We chose ultrasonography-measured CIMT as the focus of our analysis, which, although not the most accurate way of analyzing arterial walls, is the most appropriate for children as a screening tool. Studies have proven that MRI wall-thickness measurements may have better clinical utility because they have better prognostic value for cardiovascular risk than ultrasonography. In addition to intima-media measurement, MRI also images adventicia thickening and its vasa vasorum proliferation, the entire carotid artery, and the carotid bulb, where plaque forms early. However, its limitations make it more of a research tool than a day-to-day clinical one. It is over 10 times more expensive than ultrasonography, less accessible due to construction costs, requires longer scan times, and, because it is so sensible to motion, its common use in children is unrealistic [46,47]. CT angiography may detect vasa vasorum neovascularization and thus be a good predictor of vascular accidents, but its limitations with regard to radiation and poor contrast between lipid and fibrotic structures makes it unfit for a screening tool, especially in children [47]. Fluorodeoxyglucose-PET can be useful in assessing plaque vulnerability, because it targets areas of inflammation that are prone to rupture. When coupled with CT or MRI, its value increases. However, it is a method that is highly unlikely to be useful in screening children at risk [48]. That said, it is obvious that for our everyday clinical risk assessment in minor patients, CIMT ultrasonography is the only imagistic tool that is useful in assessing subclinical atherosclerosis.
Our patients were divided into three study groups—obese, overweight, and normal-weight—and subgroups depending on the object of study. CIMT values were correlated to BMI levels and there were significant differences between the three groups with regard to CIMT. In our study, excess adipose tissue was estimated by BMI and waist circumference measurements, but we acknowledge that the utility of peripheral adipose tissue ultrasound measurement and bioelectrical impedance analysis as a more accurate detection of subcutaneous fat tissue, which has been shown to have important roles in cytokine and growth-factor production and thus, in cardiometabolic risk [49].
Atherosclerosis is a process that starts in early childhood and has a lifelong progression, its pathological speed depending on genetic predisposition and environmental factors [7]. As a consequence, CIMT is a parameter that increases over time. In order to analyze how obesity affects children of different ages, we divided each study group into age categories: pre-pubertal (<12 years old), pubertal (12–15 years old), and post-pubertal (≥16 years old). In the overweight group, significant differences concerning CIMT values were detected between pre-pubertal and post-pubertal patients (p = 0.024, Bonferroni corrected); see Table 1. Extremely significant differences were detected in the normal-weight group (Table 1), where CIMT values increased very clearly with age, so much so that post-pubertal normal-weight children had CIMT mean values very similar to children of the same age with weight excess. Moreover, when analyzing the <12-years-old category, we detected extremely significant differences between CIMT mean values in the obese and overweight groups (p = 0.015), and the obese and normal-weight groups (p << 0.001). Therefore, in the presence of considerable excess weight, age has a smaller impact on the endothelial wall than the pathological processes caused by excess adipose tissue. Inflammation and an early onset of subclinical atherosclerosis makes the arterial walls of pre-pubertal obese children have similar characteristics to the arterial walls of normal-weight or slightly overweight post-pubertal children and even young adults.
In adults, CIMT reaches higher values in men [8]; however, in children, differences on behalf of sex are insignificant. In our analysis, in the obese group, the mean values for CIMT in boys and girls were identical, whereas in the overweight group, boys scored higher values for CIMT (p = 0.043); see Table 2.
An essential part of our study was the analysis of potential factors that increase risk for higher CIMT from an early age. Most of these factors overlap their influence on CIMT with that of weight excess predisposition. We analyzed each risk factor within the respective group.
Although discussions on postnatal nutrition’s role in cardiometabolic risk is still being researched, most studies are in agreement that breastfeeding has a protective cardiovascular role only when it is not prolonged, being inversely associated with mortality by coronary disease [10]. A 65-year longitudinal study showed that breastfeeding reduces the progression of atherosclerosis, which translates into a lower CIMT [13]. On the other hand, artificial feeding is known to be associated not only with obesity [12], but also with high blood pressure [14] and insulin resistance [15]. Our analysis showed that although in all three groups, children who were bottle-fed presented higher CIMT values, the results were not statistically significant, except for the overweight group (p = 0.023). Although the results concerning CIMT were inconclusive, the proportions of formula-fed/breast-fed children in each group clearly suggest that artificial nutrition represents a risk factor for weight excess in childhood: 65% of the obese group, 47% of the overweight group, and only 37% of the normal-weight group were bottle-fed.
Data on birth weight and its influence on cardiometabolic risk over time are more conclusive. Children born large for gestational age have a predisposition for obesity and an increased CIMT in young adulthood, although they seem to have an otherwise healthy cardiovascular risk [17]. Children with low birth weight have increased CIMT values in young adulthood only if they have experienced severe intrauterine growth retardation followed by exaggerated postnatal growth [50]. A recent meta-analysis showed that in children born small for gestational age, CIMT has increased values in infants rather than in older children, which may prove that fetal growth restriction is an important factor that may increase the child’s risk trajectory [51]. Our findings are in accord with previous studies, although our sample cases were smaller. In all three study groups, approximately half of the children had normal birth weights (2500–3500 g) and the other half had either low birth weight (<2500 g) or high birth weight (>3500 g) (Table 3, Table 4 and Table 5). Although we did not detect significant differences, CIMT had higher values for children with high birth weight in both overweight children and controls. However, in the obese group, the mean values for low birth weight were higher than for high birth weight (Table 3). Low birth weight might have more of impact on endothelial suffering, as it is associated with in utero cardiac remodeling and reduced arterial compliance [52]. Previous studies have shown that the more severe fetal growth impairment is, the more significant the data [51].
Because a mother’s health and health-related habits during pregnancy are directly connected to the intrauterine development of the child [53], we analyzed how some maternal risk factors for child obesity and cardiovascular risk influence our subjects.
A total of 70% of our obese patients were born to unhealthy mothers. A total of 30% of them had mothers who gained >20 kg during their pregnancy, 25% had mothers with autoimmune thyroiditis, 10% had mothers with gestational diabetes mellitus, and 5% had mothers with gestational hypertension (Figure 2). These patients presented significantly increased values in CIMT compared to obese children born to healthy mothers (p = 0.047, Table 3). In overweight children, the proportion of cases that came from abnormal pregnancies dropped to 53%, and we also detected increased CIMT mean values compared to the overweight children with healthy mothers (p = 0.049, Table 4). For normal-weight children, the proportion of unhealthy pregnancies was even smaller, at 32% (Table 5). Overall, the most predominant risk factor was by far maternal obesity (>20 kg weight gain). The mechanism behind its effects on the fetus is based on placental insufficiency, which promotes intrauterine growth restriction [54]. This can lead to structural and functional alterations on the fetus’ cardiovascular system that may persist throughout childhood [55] and can remain permanent risks or predispositions for high blood pressure, increased CIMT, and arterial stiffness [56].
Family medical history should play an important role in shaping an individual’s cardiometabolic risk profile. Family history alone is not enough to place blame, but it surely helps to evaluate the genetic risk of the individual in order to estimate prognostics on the onset and severity of the disease’s evolution [57]. In our study, 75% of obese children had a family history positive for risk, 40% had obese first-grade relatives, followed by a long distance by autoimmune thyroiditis, type 2 diabetes mellitus, and cardiovascular diseases (Figure 3). Although CIMT values were higher for children with a family history of risk in all three groups of study, significance was found only in the overweight group (p = 0.049).
Smoking is a well-known risk factor for vascular dysfunction, affecting the integrity of endothelial cells and promoting lipid and monocyte invasion of endothelial walls [58], and thus accelerating the stiffness of the arterial wall. We addressed the problem of adolescent smoking, but cannot rely on our findings due to the small amount of smoking teenagers in our group. Obese smokers had the most increased CIMT mean: X ¯ = 0.61 mm, p = 0.015 (Table 3). We note the only case of a 16-year-old male normal-weight smoker, who presented neither of the evaluated risk factors and who had a CIMT value of 0.56, higher than anyone in his group (group CIMT X ¯ = 0.39 mm); see Table 5. Because both age and the presence of metabolic syndrome are closely linked to inflammation and oxidative stress, and ultimately the damage of the vasculature structure, which is easily detectable starting in young adulthood [59], in young adults with such conditions, smoking will strengthen the adverse effects of age and all the other risk factors by directly damaging endothelial integrity.
High blood pressure in obese children and young adults is a consequence of the mixture of insulin resistance, sympathetic nervous system overactivity, and damage to the endothelial wall [60]. With regard to CIMT values, once installed, hypertension is an aggravating factor [61]. Moreover, hypertensive children present increased CIMT values, regardless of their BMI [62]. Our study confirmed the higher CIMT values among hypertensive children compared to normotensive ones (p = 0.012) with similar BMIs. Hypertensive subjects in the obese group reached 20%.
Our approach to lifestyle as a risk was focused on the level of sedentary behavior of each subject. We considered a subject sedentary when they practiced no sport and/or had less than 1 h of physical activity/day. Lack of physical activity is the factor that completes the big picture of obesity [63]. Although we did not find statistically meaningful differences, our study showed a tendency toward higher CIMT based on sedentary habits in all weight categories. However, this factor is a rather indirect one with concern to CIMT, because it affects vascular integrity by increasing the subject’s susceptibility to obesity.
Abdominal visceral excess adipose tissue, clinically estimated by measurement of waist circumference, is considered a marker of insulin resistance [64] and a key component of metabolic syndrome when it reaches values >90th percentile for age and sex in children [65,66]. In the general population, CIMT values are significantly higher in men and women with a waist circumference ≥79 cm compared to values <79 cm [67]. Our study also showed a high correlation between the values of waist circumference and CIMT. In the obese group, significant correlations were detected between waist circumference and parameters like BMI, blood pressure, total cholesterol, LDL cholesterol, and triglycerides, as well (Table 6). In all three groups, the higher the mean values of waist circumference were, the stronger the correlations to CIMT and other evaluation parameters.
As for blood parameters, we analyzed the correlations between CIMT values and parameters usually used for evaluating weight excess in children: lipid panel and fasting glucose levels.
HDL cholesterol is considered the protective component of the lipid panel, with cytoprotective, anti-inflammatory, antithrombotic, and antioxidant functions and playing a large role in clearing away excess cholesterol from vessels and transporting it back to the liver [68]. Recent studies show that HDL-c’s functionality is more important than its circulating quantity per se, and factors that affect its functionality should be avoided as much as possible: oxidative environment (acute phase response), metabolic syndrome, obesity, and consumption of saturated fats [69]. HDL-c in children is primarily affected by lack of physical activity [70]. Dietary habits that include enough polyunsaturated fats, in detriment to saturated fats, improve the anti-inflammatory function of HDL-c [71]. Children with increased CIMT and sedentary behavior are the ones with the lowest HDL-c, highest triglycerides levels, and highest risk of developing metabolic syndrome [67]. In our study, HDL cholesterol was significantly and negatively correlated to CIMT mean values (Table 8). It was also one of the most prevalent abnormal parameters detected, with 40% of the obese and normal-weight children and 7% of the overweight children presenting an HDL level of ≤40 mg/dL.
LDL cholesterol plays a major role in atherosclerotic plaque progression due to its migration under the sub-endothelial space, along with excess chylomicrons, where they are ingurgitated by macrophages and monocytes [72]. High LDL-c is usually associated with low HDL-c, depending on individual physical fitness. The diagnostic of dyslipidemia in an obese child should be taken into consideration as an aggravating factor for arterial long-term health [73]. Adolescents with high lipid levels present a greater risk of developing high CIMT as adults, and, should they have weight excess, the risk increases substantially compared to adults who did not have either risk during their childhood [74]. In obese children, LDL-c correlated to CIMT values (Table 8), a finding that supports international data. Furthermore, all three analysis groups showed correlations between CIMT and total cholesterol values (Figure 9), although mean values of total cholesterol were not suggestive for dyslipidemia. This may be because overall LDL-c values were not extremely high, and HDL-c levels were low (47% of cases presented <40 mg/dL values). We did note, however, that as weight excess severity increased, the lipid panel showed pathological, at-risk values. Individuals with familial hypercholesterolemia present high values for lipoproteins even in the context of less extreme weight excess, and affected children present higher CIMT than their unaffected siblings. This is further proof that once installed, dyslipidemia increases the progress of atherosclerosis, which can be detected early enough to evaluate the cardiovascular risk and aid the medical effort to avoid cardiovascular complications [74].
Triglyceride levels are influenced primarily by dietary habits and in part by physical activity [75]. As obese children have problems with both aspects, it is not a surprise that obese children present higher levels of TG [76]. Fasting triglycerides levels >150 mg/dL are known to represent a biomarker for cardiovascular risk [77]. Nevertheless, specific roles of TG are still controversial because there is significant personal variability involved in serum levels of TG compared to other more stable parameters like HDL-c [77]. Many studies have shown that TG levels are not directly involved in the increase of CIMT [78,79]. However, other studies suggest that serum TG’s importance in estimating atherosclerotic risk is undervalued and that the lack of consistency in showing a connection could be derived from the fact that TG levels have great variability from one day to another [80]. Some studies have shown discreet correlations of TG levels to CIMT, and, even more specifically, through remnant triglyceride-rich lipoproteins associated with fatty meals [81]. As essential as fats are for human health, the modern diet of both children and adults disregards the ideal proportions of polyunsaturated fatty acids (PUFAs). This imbalance is an aggravating factor for vascular damage. Moreover, genetic variations in children with obesity may influence the metabolism of PUFAs, and the intake requirements for a healthy cardiovascular profile may therefore vary [82,83]. Our findings support these data: We detected significant correlations between TG levels and CIMT in both obese and overweight children (Table 8, Figure 10a,b). Although mean values were not surprisingly high, we did detect an association of higher TG with higher BMI and sedentary behavior. More data should be assessed in larger groups of obese children and a comparison between fasting TG and postprandial TG levels would be highly recommended.
Moreover, non-HDL cholesterol has proven to be an important tool in assessing atherosclerotic risk, as well [84]. Furthermore, a recent longitudinal study has shown that pathological levels of non-HDL-c in youths over 15 years old correlate to high CIMT in adulthood. Its predictive value for high adult CIMT was similar to LDL-c’s. It has also been shown that through preventive actions, the effects of youth dyslipidemia can be attenuated if serum lipids are normalized by adulthood [85]. Total cholesterol/HDL-c ratio is one of the better predictors of ischemic coronary events. Its ability to do so is given by the cluster of metabolic disturbances present in individuals with abdominal obesity, insulin resistance, and dyslipidemia; therefore, its prediction value is even more powerful in individuals who have them all [86]. Triglyceride/HDL-c ratio could be a better predictor for cardiometabolic risk and insulin resistance in children than metabolic syndrome status [42,44,87]. Our findings showed correlations between CIMT values and non-HDL-c, TC/HDL-C ratio, and TG/HDL-C ratio, and their correlation strengths grew as weight severity based on BMI grew (Table 8, Figure 11). The mean values for these three parameters were influenced by weight excess (Table 9). Over half of the subjects in all three groups presented values higher than ideal for all three parameters, especially in the case of TG/HDL-c ratio (Table 9).
Childhood obesity disturbs glucose–insulin metabolism as well, and one of the earliest signs is the impairment of fasting glucose, which highly predicts type 2 diabetes mellitus [88,89]. However, the problem with impaired fasting glucose (IGF) as a factor for risk evaluation is that it varies substantially between different regions and ethnicities. For instance, IGF in Swedish and American obese children is considerably higher than in central European obese children [90]. Both IGF and impaired glucose tolerance increase CIMT by affecting arterial vessels [40]. As weight excess becomes more severe, insulin resistance and high glucose levels support the pathological processes of endothelial thickening. However, in this pre-diabetic situation, glucose variability is possible, with highs and lows all throughout the day [45]. This may be a reason why studies on IFG should be conducted on larger sample sizes to increase statistical significance. On this note, our research found a contradicting negative correlation between CIMT and fasting glucose levels in our obese group. However, in the overweight group, we detected a positive correlation, which suggests that the need for larger samples is indeed pertinent.
The multivariate linear regression analysis of CIMT as a dependent variable and waist circumference, LDL-c, HDL-c, TC, TG, non-HDL-c, TC/HDL-c ratio, and TG/HDL-c ratio as independent variables showed that waist circumference and TG/HDL-c ratio are statistically significant predictors of CIMT (Table 10 and Table 11). This is an important finding, with concrete clinical use.
The main limitation of this study was the small sample size, but even so, our analysis was statistically significant and in line with further publications. A further longitudinal analysis would be interesting regarding CIMT and other correlated parameters, once the same subjects start to lose weight and change their lifestyle.

5. Conclusions

Weight excess in children is associated with increased values of CIMT, and the severity of the excess increases the expected values of CIMT. Abdominal adiposity of obese children, a clinical marker of metabolic distress, is very reliably positively correlated to CIMT values. Waist circumference and TG/HDL-c are significant predictors of CIMT.
Risk factors like weight gain of over 20 kg during pregnancy and overall metabolic disturbances of the mother, family history of cardiovascular risk, high blood pressure, and smoking are linked to increased CIMT. Our study supports international data on artificial postnatal nutrition, high/low birth weight, smoking, and sedentary lifestyle being linked to increased CIMT, but our analysis’s statistical significance was not definitive.
All evaluated blood parameters showed correlations to CIMT, except for fasting glucose.

Author Contributions

Conceptualization, D.S. and M.-S.M.; methodology, D.S., M.-S.M. and I.M.; software, D.S. and A.C.; validation, D.S., C.P. and I.P.V.; formal analysis, M.-S.M. and I.M.; investigation, M.-S.M. and C.P.; resources, C.P., I.P.V. and D.S.; data curation, F.D.; writing—original draft preparation, M.-S.M.; writing—review and editing, D.S. and C.P.; visualization, A.C. and F.D.; supervision, D.S.; project administration, I.M. and D.S. All authors have read and agreed to the published version of the manuscript.

Funding

This research received no external funding.

Institutional Review Board Statement

The study was conducted according to the guidelines of the Declaration of Helsinki, and approved by the Ethics Committee of Scientific Research (CECS) of University of Medicine and Pharmacy Victor Babes Timisoara (Nr. 03/19.01.2021).

Informed Consent Statement

Informed consent was obtained from all subjects’ legal guardians involved in the study, as well as verbal consent from all the underage subjects. Written informed consent was obtained from the patients to publish this paper.

Acknowledgments

We are grateful for the collaboration of all the patients enrolled in this study and extend our wishes of health to all of them. We acknowledge the productive contributions of all authors and the support given by our centers of affiliation to facilitate our study.

Conflicts of Interest

The authors declare no conflict of interest.

References

  1. Browne, N.T.; Snethen, J.A.; Greenberg, C.S.; Frenn, M.; Kilanowski, J.F.; Gance-Cleveland, B.; Burke, P.; Lewandowski, L. When Pandemics Collide: The Impact of COVID-19 on Childhood Obesity. J. Pediatr. Nurs. 2021, 56, 90–98. [Google Scholar] [CrossRef] [PubMed]
  2. Stavridou, A.; Kapsali, E.; Panagouli, E.; Thirios, A.; Polychronis, K.; Bacopoulou, F.; Psaltopoulou, T.; Tsolia, M.; Sergentanis, T.N.; Tsitsika, A. Obesity in Children and Adolescents during COVID-19 Pandemic. Children 2021, 8, 135. [Google Scholar] [CrossRef] [PubMed]
  3. Thompson, M.; Mansfield, B.; Stringer, M.; Stewart, B.; Potter, J.; Fernengel, K. An evidence-based resource for the management of comorbidities associated with childhood overweight and obesity. J. Am. Assoc. Nurse Pract. 2016, 28, 559–570. [Google Scholar] [CrossRef] [PubMed]
  4. Downing, R., 2nd; Michael, T.; Place, R.; Hoffman, E.; Visich, P. The Influence of Metabolic Syndrome Risk Factors on Carotid Intima Media Thickness in Children. Glob. Pediatr. Health 2021, 8, 2333794X20987453. [Google Scholar] [CrossRef] [PubMed]
  5. Beauloye, V.; Zech, F.; Tran, H.T.; Clapuyt, P.; Maes, M.; Brichard, S.M. Determinants of early atherosclerosis in obese children and adolescents. J. Clin. Endocrinol. Metab. 2007, 92, 3025–3032. [Google Scholar] [CrossRef] [Green Version]
  6. Farello, G.; Antenucci, A.; Stagi, S.; Mazzocchetti, C.; Ciocca, F.; Verrotti, A. Metabolically healthy and metabolically unhealthy obese children both have increased carotid intima-media thickness: A case control study. BMC Cardiovasc. Disord. 2018, 18, 1–6. [Google Scholar] [CrossRef] [Green Version]
  7. Wilson, D.P. Is Atherosclerosis a Pediatric Disease? 2000. In Endotext. South Dartmouth (MA); Feingold, K.R., Anawalt, B., Boyce, A., Chrousos, G., de Herder, W.W., Dhatariya, K., Dungan, K., Hershman, J.M., Hofland, J., Kalra, S., et al., Eds.; MDText.com, Inc.: South Dartmouth, MA, USA, 2000. Available online: https://0-www-ncbi-nlm-nih-gov.brum.beds.ac.uk/books/NBK395576/ (accessed on 3 February 2020).
  8. Sinning, C.; Wild, P.S.; Echevarria, F.M.; Wilde, S.; Schnabel, R.; Lubos, E.; Herkenhoff, S.; Bickel, C.; Klimpe, S.; Gori, T.; et al. Gutenberg-Heart Study. Sex differences in early carotid atherosclerosis (from the community-based Gu-tenberg-Heart Study). Am. J. Cardiol. 2011, 107, 1841–1847. [Google Scholar] [CrossRef]
  9. Van den Oord, S.C.; Sijbrands, E.J.; ten Kate, G.L.; van Klaveren, D.; van Domburg, R.T.; van der Steen, A.F.; Schinket, A.F.L. Carotid intima-media thickness for cardiovascular risk assessment: Systematic review and meta-analysis. Atherosclerosis 2013, 228, 1–11. [Google Scholar] [CrossRef]
  10. Fall, C.H.D.; Barker, D.J.P.; Osmond, C.; Winter, P.D.; Clark, P.M.S.; Hales, C.N. Relation of infant feeding to adult serum cholesterol concentration and death from ischaemic heart disease. BMJ 1992, 304, 801–805. [Google Scholar] [CrossRef] [Green Version]
  11. Lurbe, E.; Aguilar, F.; Álvarez, J.; Redon, P.; Torró, M.I.; Redon, J. Determinants of Cardiometabolic Risk Factors in the First Decade of Life: A Longitudinal Study Starting at Birth. Hypertension 2018, 71, 437–443. [Google Scholar] [CrossRef]
  12. Oddy, W.H.; Mori, T.A.; Huang, R.C.; Marsh, J.A.; Pennell, C.E.; Chivers, P.T.; Hands, B.P.; Jacoby, P.; Rzehak, P.; Koletzko, B.V.; et al. Early infant feeding and adiposity risk: From infancy to adulthood. Ann. Nutr. Metab. 2014, 64, 262–270. [Google Scholar] [CrossRef] [Green Version]
  13. Martin, R.M.; Ebrahim, S.; Griffin, M.; Davey-Smith, G.; Nicolaides, A.N.; Georgiou, N. Breastfeeding and atherosclerosis: Intima-media thickness and plaques at 65-year follow-up of the Boyd Orr cohort. Arterioscler. Thromb. Vasc. Biol. 2005, 25, 1482–1488. [Google Scholar] [CrossRef] [PubMed] [Green Version]
  14. Martin, R.M.; McCarthy, A.; Davies, D.P.; Davey Smith, G.; Ben-Shlomo, Y. Association between infant nutrition and blood pressure in early adulthood: The Barry Caerphilly Growth cohort study. Am. J. Clin. Nutr. 2003, 77, 1489–1497. [Google Scholar] [CrossRef] [PubMed] [Green Version]
  15. Ravelli, A.C.J.; van der Meulen, J.H.; Osmond, C.; Barker, D.J.P.; Bleker, O.P. Infant feeding and adult glucose tolerance, lipid profile, blood pressure, and obesity. Arch. Dis. Child. 2000, 82, 248–252. [Google Scholar] [CrossRef] [PubMed] [Green Version]
  16. Belbasis, L.; Savvidou, M.D.; Kanu, C.; Evangelou, E.; Tzoulaki, I. Birth weight in relation to health and disease in later life: An umbrella review of systematic reviews and meta-analyses. BMC Med. 2016, 14, 147. [Google Scholar] [CrossRef] [Green Version]
  17. Skilton, M.R.; Siitonen, N.; Würtz, P.; Viikari, J.S.; Juonala, M.; Seppälä, I.; Laitinen, T.; Lehtimäki, T.; Taittonen, L.; Kähönen, M.; et al. High birth weight is associated with obesity and increased carotid wall thickness in young adults: The cardiovascular risk in young Finns study. Arterioscler. Thromb. Vasc. Biol. 2014, 34, 1064–1068. [Google Scholar] [CrossRef] [PubMed] [Green Version]
  18. Di Bernardo, S.; Mivelaz, Y.; Epure, A.M.; Vial, Y.; Simeoni, U.; Bovet, P.; Younes, S.E.; Chiolero, A.; Sekarski, N. Assessing the consequences of gestational diabetes mellitus on offspring’s cardiovascular health: MySweetHeart Cohort study protocol. BMJ Open 2017, 7, e016972. [Google Scholar]
  19. Benschop, L.; Schalekamp-Timmermans, S.; Roeters van Lennep, J.E.; Jaddoe, V.W.V.; Steegers, E.A.P.; Ikram, M.K. Cardiovascular Risk Factors Track from Mother to Child. JAHA 2018, 7, e009536. [Google Scholar] [CrossRef] [Green Version]
  20. Jølving, L.R.; Nielsen, J.; Kesmodel, U.S.; Nielsen, R.G.; Nørgård, B.M.; Beck-Nielsen, S.S. Chronic diseases in the children of women with maternal thyroid dysfunction: A nationwide cohort study. Clin. Epidemiol. 2018, 10, 1381–1390. [Google Scholar] [CrossRef] [Green Version]
  21. İşgüven, P.; Gündüz, Y.; Kılıç, M. Effects of Thyroid Autoimmunity on Early Atherosclerosis in Euthyroid Girls with Hashimoto’s Thyroiditis. J. Clin. Res. Pediatr. Endocrinol. 2016, 8, 150–156. [Google Scholar] [CrossRef]
  22. De Giorgis, T.; Giannini, C.; Scarinci, A.; D’Adamo, E.; Agostinelli, S.; Chiarelli, F.; Mohn, A. Family history of premature cardiovascular disease as a sole and independent risk factor for increased carotid intima-media thickness. J. Hypertens. 2009, 27, 822–828. [Google Scholar] [CrossRef]
  23. Li, S.; Yun, M.; Fernandez, C.; Xu, J.; Srinivasan, S.R.; Chen, W.; Berenson, G.S. Cigarette smoking exacerbates the adverse effects of age and metabolic syndrome on subclinical atherosclerosis: The Bogalusa Heart Study. PLoS ONE 2014, 9, e96368. [Google Scholar] [CrossRef]
  24. Mozos, I.; Maidana, J.P.; Stoian, D.; Stehlik, M. Gender Differences of Arterial Stiffness and Arterial Age in Smokers. Int. J. Environ. Res. Public Health 2017, 14, 565. [Google Scholar] [CrossRef] [PubMed]
  25. Burton, A. Parental smoking may set up children for atherosclerosis. Environ. Health Perspect. 2010, 118, A200. [Google Scholar] [CrossRef] [PubMed] [Green Version]
  26. Yang, B.; Li, M.; Chen, B.; Xu, Y.; Li, T.D. Deterioration of endothelial function and carotid intima-media thickness in Tibetan male adolescents exposed to second-hand smoke. JRAAS 2012, 13, 413–419. [Google Scholar] [CrossRef]
  27. Vuolo, M.; Staff, J. Parent and child cigarette use: A longitudinal, multigenerational study. Pediatrics 2013, 132, e568–e577. [Google Scholar] [CrossRef] [PubMed] [Green Version]
  28. Khalil, A.; Huffman, M.D.; Prabhakaran, D.; Osmond, C.; Fall, C.H.D.; Tandon, N.; Lakshmy, R.; Prabhakaran, P.; Biswas, S.K.; Ramji, S.; et al. New Delhi Birth Cohort. Predictors of carotid intima-media thickness and carotid plaque in young Indian adults: The New Delhi birth cohort. Int. J. Cardiol. 2013, 167, 1322–1328. [Google Scholar] [CrossRef] [PubMed] [Green Version]
  29. Magnussen, C.G.; Venn, A.; Thomson, R.; Juonala, M.; Srinivasan, S.R.; Viikari, J.S.; Berenson, G.S.; Dwyer, T.; Raitakari, O.T. The association of pediatric low- and high-density lipoprotein cholesterol dyslipidemia classifications and change in dyslipidemia status with carotid intima-media thickness in adulthood evidence from the cardiovascular risk in Young Finns study, the Bogalusa Heart study, and the CDAH (Childhood Determinants of Adult Health) study. J. Am. Coll. Cardiol. 2009, 53, 860–869. [Google Scholar]
  30. Santos, I.S.; Bittencourt, M.S.; Goulart, A.C.; Schmidt, M.I.; Diniz, M.F.H.S.; Lotufo, P.A.; Benseñor, I.M. Insulin resistance is associated with carotid intima-media thickness in non-diabetic subjects. A cross-sectional analysis of the ELSA-Brasil cohort baseline. Atherosclerosis 2017, 260, 34–40. [Google Scholar] [CrossRef]
  31. Mozos, I.; Malainer, C.; Horbańczuk, J.; Gug, C.; Stoian, D.; Luca, C.T.; Atanasov, A.G. Inflammatory Markers for Arterial Stiffness in Cardiovascular Diseases. Front. Immunol. 2017, 8, 1058. [Google Scholar] [CrossRef] [Green Version]
  32. Velea, I.P.; Albulescu, R.; Arghirescu, S.T. Obezitatea la copil. In Pediatrie-Curs Pentru Studenții Facultății de Medicină: Obezitatea la Copil; Velea, I., Ed.; Editura Victor Babes: Timisoara, Romania, 2016; pp. 289–297. [Google Scholar]
  33. Bennett, W.E., Jr.; Hendrix, K.S.; Thompson, R.T.; Carroll, A.E.; Downs, S.M. The natural history of weight percentile changes in the first year of life. JAMA Pediatr. 2014, 168, 681–682. Available online: http://jamanetwork.com/journals/jamapediatrics/fullarticle/1867333 (accessed on 15 May 2020). [CrossRef] [PubMed] [Green Version]
  34. Kumar, S.; Kelly, A.S. Review of Childhood Obesity: From Epidemiology, Etiology, and Comorbidities to Clinical Assessment and Treatment. In Mayo Clinic Proceedings; Elsevier: Amsterdam, The Netherlands, 2017; Volume 92, pp. 251–265. Available online: http://www.mayoclinicproceedings.org/article/S0025-6196(16)30595-X/fulltext (accessed on 5 June 2020).
  35. Casella, I.B.; Presti, C.; Porta, R.M.; Sabbag, C.R.; Bosch, M.A.; Yamazaki, Y. A practical protocol to measure common carotid artery intima-media thickness. Clinics 2008, 63, 515–520. [Google Scholar] [CrossRef] [PubMed] [Green Version]
  36. Gómez-Marcos, M.A.; Recio-Rodríguez, J.I.; Patino-Alonso, M.C.; Agudo-Conde, C.; Gómez-Sanchez, L.; Gómez-Sanchez, M.; Rodríguez-Sánchez, E.; García-Ortiz, L. Protocol for measuring carotid intima-media thickness that best correlates with cardiovascular risk and target organ damage. Am. J. Hypertens. 2012, 25, 955–961. [Google Scholar] [CrossRef] [PubMed] [Green Version]
  37. El Jalbout, R. Intima-Media Thickness Measurement in Children; Techniques and Reference Values. Am. J. Biomed. Sci. Res. 2020, 7, 101–103. [Google Scholar] [CrossRef] [Green Version]
  38. Freire, C.M.; Ribeiro, A.L.; Barbosa, F.B.; Lana, A.M.; e Silva, A.C.; Ribeiro-Oliveira, A. Comparison between automated and manual measurements of carotid intima-media thickness in clinical practice. Vasc. Health Risk Manag. 2009, 5, 811–817. [Google Scholar]
  39. Vermeersch, S.; Rietzschel, E.; De Buyzere, M.; Van Bortel, L.M.; D’Asseler, Y.; Gillebert, T.C.; Verdonck, P.R.; Segers, P. Validation of a new automated IMT measurement algorithm. J. Hum. Hypertens. 2007, 21, 976–978. [Google Scholar] [CrossRef] [Green Version]
  40. Aydin, Y.; Berker, D.; Ustun, I.; Gul, K.; Erden, G.; Kutlucan, A.; Yilmaz, L.; Guler, S. Evaluation of carotid intima media thickness in impaired fasting glucose and impaired glucose tolerance. Minerva Endocrinol. 2011, 36, 171–179. [Google Scholar] [CrossRef]
  41. FOR, E.P.O.I.G.; CHILDREN, R.R.I. Expert Panel on Integrated Guidelines for Cardiovascular Health and Risk Reduction in Children and Adolescents; National Heart, Lung, and Blood Institute. Expert panel on integrated guidelines for cardiovascular health and risk reduction in children and adolescents: Summary report. Pediatrics 2011, 128, S213–S256. [Google Scholar] [CrossRef] [Green Version]
  42. Iwani, N.A.K.Z.; Jalaludin, M.Y.; Zin, R.M.W.M.; Fuziah, M.Z.; Hong, J.Y.H.; Abqariyah, Y.; Mokhtar, A.H.; Nazaimoon, W.M.W. TG : HDL-C Ratio Is a Good Marker to Identify Children Affected by Obesity with Increased Cardiometabolic Risk and Insulin Resistance. Int. J. Endocrinol. 2019, 2019, 8586167. [Google Scholar] [CrossRef]
  43. Di Giorgis, T.; Marcovecchio, M.L.; Di Giovanni, I.; Giannini, C.; Chiavaroli, V.; Chiarelli, F.; Mohn, A. Triglycerides-to-HDL ratio as a new marker of endothelial dysfunction in obese prepubertal children. Eur. J. Endocrinol. 2013, 170, 173–180. [Google Scholar] [CrossRef]
  44. Iwani, N.A.K.Z.; Jalaludin, M.Y.; Zin, R.M.W.M.; Fuziah, M.Z.; Hong, J.Y.H.; Abqariyah, Y.; Mokhtar, A.H.; Nazaimoon, W.M.W. Triglyceride to HDL-C ratio is associated with insulin resistance in overweight and obese children. Sci. Rep. 2007, 7, 40055. [Google Scholar] [CrossRef] [Green Version]
  45. Chakarova, N.; Dimova, R.; Grozeva, G.; Tankova, T. Assessment of glucose variability in subjects with prediabetes. Diabetes Res. Clin. Pract. 2019, 151, 56–64. [Google Scholar] [CrossRef] [Green Version]
  46. Skilton, M.R.; Boussel, L.; Bonnet, F.; Bernard, S.; Douek, P.C.; Moulin, P.; Serusclat, A. Carotid intima–media and adventitial thickening: Comparison of new and established ultrasound and magnetic resonance imaging techniques. Atherosclerosis 2011, 215, 405–410. [Google Scholar] [CrossRef]
  47. Zhang, Y.; Guallar, E.; Qiao, Y.; Wasserman, B.A. Arterioscler. Is Carotid Intima-Media Thickness as Predictive as Other Noninvasive Techniques for the Detection of Coronary Artery Disease? Arterioscler. Thromb. Vasc. Biol. 2014, 34, 1341–1345. [Google Scholar] [CrossRef] [Green Version]
  48. Rudd, J.H.; Narula, J.; Strauss, H.W.; Virmani, R.; Machac, J.; Klimas, M.; Tahara, N.; Fuster, V.; Warburton, E.A.; Fayad, Z.A.; et al. Imaging atherosclerotic plaque inflammation by fluorodeoxyglucose with positron emission tomography: Ready for prime time? J. Am. Coll. Cardiol. 2010, 55, 2527–2535. [Google Scholar] [CrossRef] [Green Version]
  49. Chirita-Emandi, A.; Papa, M.C.; Abrudan, L.; Dobrescu, M.A.; Puiu, M.; Velea, I.P.; Paul, C. A novel method for measuring subcutaneous adipose tissue using ultrasound in children-interobserver consistency. Rom J. Morphol. Embryol. 2017, 58, 115–123. [Google Scholar]
  50. Oren, A.; Vos, L.E.; Uiterwaal, C.S.; Gorissen, W.H.; Grobbee, D.E.; Bots, M.L. Birth weight and carotid intima-media thickness: New perspectives from the atherosclerosis risk in young adults (ARYA) study. Ann. Epidemiol. 2004, 14, 8–16. [Google Scholar] [CrossRef] [Green Version]
  51. Epure, A.M.; Rios-Leyvraz, M.; Anker, D.; Di Bernardo, S.; Da Costa, B.R.; Chiolero, A.; Sekarski, N. Risk factors during first 1,000 days of life for carotid intima-media thickness in infants, children, and adolescents: A systematic review with meta-analyses. PLoS Med. 2020, 17, e1003414. [Google Scholar] [CrossRef]
  52. Verburg, B.O.; Jaddoe, V.W.; Wladimiroff, J.W.; Hofman, A.; Witteman, J.C.; Steegers, E.A. Fetal hemodynamic adaptive changes related to intrauteringrowth: The Generation R Study. Circulation 2008, 117, 649–659. [Google Scholar] [CrossRef] [Green Version]
  53. Golab, B.; Santos, S.; Voerman, E.; Lawlor, D.; Jaddoe, V.; Gaillard, R. Common pregnancy complications and risk of childhood obesity-influence of maternal obesity: An individual participant data. Lancet Child Adolesc. Health 2019, 2, 812. [Google Scholar] [CrossRef] [Green Version]
  54. Grieger, J.A.; Clifton, V.L. A review of the impact of dietary intakes in human pregnancy on infant birthweight. Nutrients 2015, 7, 153–178. [Google Scholar] [CrossRef] [Green Version]
  55. Crispi, F.; Bijnens, B.; Figueras, F.; Bartrons, J.; Eixarch, E.; Le Noble, F.; Ahmed, A.; Gratacós, E. Fetal growth restriction results in remodeled and less efficient hearts in children. Circulation 2010, 121, 2427–2436. [Google Scholar] [CrossRef] [PubMed] [Green Version]
  56. Crispi, F.; Miranda, J.; Gratacós, E. Long-term cardiovascular consequences of fetal growth restriction: Biology, clinical implications, and opportunities for prevention of adult disease. Am. J. Obstet. Gynecol. 2018, 218, S869–S879. [Google Scholar] [CrossRef] [PubMed] [Green Version]
  57. Corica, D.; Aversa, T.; Valenzise, M.; Messina, M.F.; Alibrandi, A.; De Luca, F.; Wasniewska, M. Does family history of obesity, cardiovascular, and metabolic diseases influence onset and severity of childhood obesity? Front. Endocrinol. 2018, 9, 187. [Google Scholar] [CrossRef]
  58. Ambrose, J.A.; Barua, R.S. The pathophysiology of cigarette smoking and cardiovascular disease: An update. J. Am. Coll. Cardiol. 2004, 43, 1731–1737. [Google Scholar] [CrossRef] [Green Version]
  59. Costopoulos, C.; Liew, T.V.; Bennett, M. Ageing and atherosclerosis: Mechanisms and therapeutic options. Biochem. Pharmacol. 2008, 75, 1251–1261. [Google Scholar] [CrossRef] [PubMed]
  60. Sorof, J.; Danies, S. Obesity Hypertension in Children-A Problem of Epidemic Proportions. Hypertension 2002, 40, 441–447. [Google Scholar] [CrossRef] [Green Version]
  61. National High Blood Pressure Education Program Working Group on High Blood Pressure in Children and Adolescents. The fourth report on the diagnosis, evaluation, and treatment of high blood pressure in children and adolescents. Pediatrics 2004, 114, 1–22. [Google Scholar]
  62. Lande, M.B.; Carson, N.L.; Roy, J.; Meagher, C.C. Effects of Childhood Primary Hypertension on Carotid Intima Media Thickness-A Matched Controlled Study. Hypertension 2006, 48, 40–44. [Google Scholar] [CrossRef] [Green Version]
  63. Keane, E.; Li, X.; Harrington, J.M.; Fitzgerald, A.P.; Perry, I.J.; Kearney, P.M. Physical Activity, Sedentary Behavior and the Risk of Overweight and Obesity in School-Aged Children. Pediatr. Exerc. Sci. 2017, 29, 408–418. [Google Scholar] [CrossRef]
  64. Bassali, R.; Waller, J.L.; Gower, B.; Allison, J.; Davis, C.L. Utility of waist circumference percentile for risk evaluation in obese children. Int. J. Pediatr. Obes. 2010, 5, 97–101. [Google Scholar] [CrossRef]
  65. Freedman, D.S.; Kahn, H.S.; Mei, Z.; Grummer-Strawn, L.M.; Dietz, W.H.; Srinivasan, S.R.; Berenson, G.S. Relation of body mass index and waist-to-height ratio to cardiovascular disease risk factors in children and adolescents: The Bogalusa Heart Study. Am. J. Clin. Nutr. 2007, 86, 33–40. [Google Scholar] [CrossRef] [PubMed] [Green Version]
  66. Stefan, N.; Kantartzis, K.; Machannm, J.; Schick, F.; Thamer, C.; Rittig, K.; Balletshofer, B.; Machicao, F.; Fritsche, A.; Häring, H.U. Identification and characterization of metabolically benign obesity in humans. Arch. Intern. Med. 2008, 168, 1609–1616. [Google Scholar] [CrossRef] [PubMed]
  67. Kamon, T.; Kaneko, H.; Itoh, H.; Kiriyama, H.; Mizuno, Y.; Morita, H.; Yamamichi, N.; Komuro, I. Association Between Waist Circumference and Carotid Intima-Media Thickness in the General Population. Int. Heart J. 2020, 61, 103–108. [Google Scholar] [CrossRef] [Green Version]
  68. Toth, P.P. Reverse cholesterol transport: High-density lipoprotein’s magnificent mile. Curr. Atheroscler. Rep. 2003, 5, 386–393. [Google Scholar] [CrossRef]
  69. Kosmas, C.E.; Martinez, I.; Sourlas, A.; Bouza, K.V.; Campos, F.N.; Torres, V.; Montan, P.D.; Guzman, E. High-density lipoprotein (HDL) functionality and its relevance to atherosclerotic cardiovascular disease. Drugs Context 2018, 7, 212525. [Google Scholar] [CrossRef]
  70. O’Donovan, G.; Stensel, D.; Hamer, M.; Stamatakis, E. The association between leisure-time physical activity, low HDL-cholesterol and mortality in a pooled analysis of nine population-based cohorts. Eur. J. Epidemiol. 2017, 32, 559–566. [Google Scholar] [CrossRef] [Green Version]
  71. Nicholls, S.J.; Lundman, P.; Harmer, J.A.; Cutri, B.; Griffiths, K.A.; Rye, K.A.; Barter, P.J.; Celermajer, D.S. Consumption of saturated fat impairs the anti-inflammatory properties of high-density lipoproteins and endothelial function. J. Am. Coll. Cardiol. 2006, 48, 715–720. [Google Scholar] [CrossRef]
  72. Peterson, J.; Bihain, B.E.; Bengtsson-Olivecrona, G.; Deckelbaum, R.J.; Carpentier, Y.A.; Olivecrona, T. Fatty acid control of lipoprotein lipase: A link between energy metabolism and lipid transport. Proc. Natl. Acad. Sci. USA 1990, 87, 909–913. [Google Scholar] [CrossRef] [Green Version]
  73. Hatami, M.; Tohidi, M.; Mohebi, R.; Khalili, D.; Azizi, F.; Hadaegh, F. Adolescent lipoprotein classifications according to National Health and Nutrition Examination Survey (NHANES) vs. National Cholesterol Education Program (NCEP) for predicting abnormal lipid levels in adulthood in a Middle East population. Lipids Health Dis. 2012, 11, 107. [Google Scholar] [CrossRef] [Green Version]
  74. Kusters, D.M.; Wiegman, A.; Kastelein, J.J.P.; Hutten, B.A. Carotid Intima-Media Thickness in Children With Familial Hypercholesterolemia. Circ. Res. 2014, 114, 307–310. [Google Scholar] [CrossRef] [Green Version]
  75. Gortmaker, S.L.; Swinburn, B.A.; Levy, D.; Carter, R.; Mabry, P.L.; Finegood, D.T.; Huang, T.; Marsh, T.; Moodie, M.L. Changing the future of obesity: Science, policy, and action. Lancet 2011, 378, 838–847. [Google Scholar] [CrossRef] [Green Version]
  76. May, A.L.; Kuklina, E.V.; Yoon, P.W.; Centers for Disease Control and Prevention (CDC). Prevalence of abnormal lipid levels among youths–United States, 1999–2006. Morb. Mortal. Wkly. Rep. 2010, 59, 29–33. [Google Scholar]
  77. Boullart, A.C.; de Graaf, J.; Stalenhoef, A.F. Serum triglycerides and risk of cardiovascular disease. Biochim. Et Biophys. Acta (BBA)-Mol. Cell Biol. Lipids 2012, 1821, 867–875. [Google Scholar] [CrossRef] [PubMed]
  78. Gardener, H.; Della Morte, D.; Elkins, M.S.; Sacco, R.L.; Rundek, T. Lipids and carotid plaque in the Northern Manhattan Study. BMC Cardiovasc. Disord. 2009, 9, 55. [Google Scholar] [CrossRef] [Green Version]
  79. Touboul, P.J.; Labreuche, J.; Bruckert, E.; Schargrodsky, H.; Prati, P.; Tosetto, A.; Hernandez-Hernandez, R.; Woo, K.S.; Silva, H.; Vicaut, E.; et al. HDL-C, triglycerides and carotid IMT: A meta-analysis of 21,000 patients with automated edge detection IMT measurement. Atherosclerosis 2014, 232, 65–71. [Google Scholar] [CrossRef]
  80. Durrington, P. Triglycerides are more important in atherosclerosis than epidemiology suggested. Atherosclerosis 1998, 141, S57–S62. [Google Scholar] [CrossRef]
  81. Karpe, F.; Boquist, S.; Tang, R.; Bond, G.M.; de Faire, U.; Hamsten, A. Remnant lipoproteins are related to intima-media thickness of the carotid artery independently of LDL cholesterol and plasma triglycerides. J. Lipid Res. 2001, 42, 17–21. [Google Scholar] [CrossRef]
  82. Ander, B.P.; Dupasquier, C.M.; Prociuk, M.A.; Pierce, G.N. Polyunsaturated fatty acids and their effects on cardiovascular disease. Exp. Clin. Cardiol. 2003, 8, 164–172. [Google Scholar]
  83. Serafim, V.; Chirita-Emandi, A.; Andreescu, N.; Tiugan, D.A.; Tutac, P.; Paul, C.; Velea, I.; Mihailescu, A.; Șerban, C.L.; Zimbru, C.G.; et al. Single Nucleotide Polymorphisms in PEMT and MTHFR Genes are Associated with Omega 3 and 6 Fatty Acid Levels in the Red Blood Cells of Children with Obesity. Nutrients 2019, 11, 2600. [Google Scholar] [CrossRef] [Green Version]
  84. Frontini, M.G.; Srinivasan, S.R.; Xu, J.; Tang, R.; Bond, M.G.; Berenson, G.S. Usefulness of childhood non-high density lipoprotein cholesterol levels versus other lipoprotein measures in predicting adult subclinical atherosclerosis: The Bogalusa Heart Study. Pediatrics 2008, 121, 924–929. [Google Scholar] [CrossRef] [PubMed]
  85. Juonala, M.; Wu, F.; Sinaiko, A.; Woo, J.G.; Urbina, E.M.; Jacobs, D.; Steinberger, J.; Prineas, R.; Koskinen, J.; Sabin, M.A.; et al. Non-HDL Cholesterol Levels in Childhood and Carotid Intima-Media Thickness in Adulthood. Pediatrics 2020, 145, e20192114. [Google Scholar] [CrossRef]
  86. Lemieux, I.; Lamarche, B.; Couillard, C.; Pascot, A.; Cantin, B.; Bergeron, J.; Dagenais, G.R.; Després, J.P. Total Cholesterol/HDL Cholesterol Ratio vs LDL Cholesterol/HDL Cholesterol Ratio as Indices of Ischemic Heart Disease Risk in Men: The Quebec Cardiovascular Study. Arch. Intern. Med. 2001, 161, 2685–2692. [Google Scholar] [CrossRef]
  87. Krawczyk, M.; Rumińska, M.; Witkowska-Sędek, E.; Majcher, A.; Pyrżak, B. Usefulness of the triglycerides to high-density lipoprotein cholesterol ratio (TG/HDL-C) in prediction of metabolic syndrome in polish obese children and adolescents. Acta Biochim. Pol. 2018, 65, 605–611. [Google Scholar] [CrossRef] [PubMed]
  88. Hagman, E.; Ighani Arani, P.; Fischer, M.; Danielsson, P.; Marcinkiewicz, K.; Petriczko, E.; Marcus, C. Blood sugar levels are higher in young obese children in Sweden than in Poland. Acta Paediatr. 2014, 103, 1174–1178. [Google Scholar] [CrossRef] [PubMed] [Green Version]
  89. Amer Diabet, A. Diagnosis and classification of diabetes mellitus American Diabetes Association. Diabetes Care 2011, 34, S62–S69. [Google Scholar]
  90. Hagman, E.; Reinehr, T.; Kowalski, J.; Ekbom, A.; Marcus, C.; Holl, R.W. Impaired fasting glucose prevalence in two nationwide cohorts of obese children and adolescents. Int. J. Obes. 2014, 38, 40–45. [Google Scholar] [CrossRef] [Green Version]
Figure 1. Examples of CIMT measurements. (a) an 11-year-old normal-weight boy. (b) a 12-year-old overweight girl. (c) a 16-year-old obese boy.
Applsci 11 10721 g001
Figure 2. Mother’s health during pregnancy, in obese children.
Applsci 11 10721 g002
Figure 3. Family history of risk factors, in obese children.
Applsci 11 10721 g003
Figure 4. Mother’s health during pregnancy, in overweight children.
Applsci 11 10721 g004
Figure 5. Family history of risk factors, in overweight children.
Applsci 11 10721 g005
Figure 6. The correlation between waist circumference and CIMT values.
Applsci 11 10721 g006
Figure 7. Correlation between CIMT and HDL-c in obese children.
Applsci 11 10721 g007
Figure 8. Correlation between CIMT and LDL-c in obese children.
Applsci 11 10721 g008
Figure 9. Correlation between CIMT and total cholesterol in all children.
Applsci 11 10721 g009
Figure 10. (a). Correlation between CIMT and TG in obese children. (b) Correlation between CIMT and TG in overweight children.
Applsci 11 10721 g010
Figure 11. Correlations between CIMT and (a) TG:HDL-c ratio in overweight children, (b) TG:HDL-c ratio in obese children, and (c) TC:HDL-c ratio in obese children.
Applsci 11 10721 g011
Table 1. CIMT differences with regard to age.
Obese GroupGroup Number% of Entire GroupMean
CIMT (mm)
<12 yearsI55%0.48
12–15 yearsII25%0.49
≥16 yearsIII20%0.50
ComparisonI vs. III vs. IIIII vs. III
p-value 0.710.590.88
Overweight GroupGroup Number% of Entire GroupMean
CIMT (mm)
<12 yearsI34%0.43
12–15 yearsII53%0.48
≥16 yearsIII13%0.54
ComparisonI vs. III vs. IIIII vs. III
p-value0.110.0240.21
Normal-Weight GroupGroup Number% of Entire GroupMean
CIMT (mm)
<12 yearsI48%0.35
12–15 yearsII40%0.4
≥16 yearsIII12%0.51
ComparisonI vs. III vs. IIIII vs. III
p-value0.0420.00060.012
Table 2. CIMT with regard to gender.
GroupSex% of Entire GroupMean CIMT (mm)p-Value
ObeseGirls35%0.51350.99
Boys65%0.5134
OverweightGirls33%0.430.043
Boys67%0.49
NormalGirls52%0.380.55
Boys48%0.4
Table 3. Mean CIMT in the presence of different risk factors in obese children.
Risk Factor % of Total Obese ChildrenMean
CIMT (mm)
p-Value
Postnatal foodFormula65%0.530.99
Breastmilk35%0.53
Birth weight<2500 g25%0.540.62
>3500 g25%0.53
normal50%0.52
Biological mother’s healthRisk factors present70%0.550.047
No risk factors30%0.48
Family historyRisk factors present75%0.540.11
No risk factors25%0.48
SmokingSmoker15%0.610.015
Non-smoker85%0.51
High blood pressureYes20%0.580.1
No80%0.51
LifestyleSedentary65%0.550.89
Normal35%0.49
CIMT median for entire obese group (mm) 0.50
Table 4. Mean CIMT in the presence of different risk factors in overweight children.
Risk Factor % of Total Overweight ChildrenMean
CIMT (mm)
p-Value
Postnatal foodFormula47%0.50.023
Breast milk53%0.44
Birth weight<2500 g20%0.450.48
>3500 g33%0.5
Normal47%0.46
Biological mother’s health Risk factors present53%0.490.042
No risk factors47%0.44
Family historyRisk factors present60%0.490.049
No risk factors40%0.44
SmokingSmoker13%0.530.06
Non-smoker87%0.46
High blood pressureYes13%0.550.012
No87%0.46
LifestyleSedentary40%0.490.32
Normal60%0.46
CIMT   X ¯ for entire
overweight group (mm)
0.47
Table 5. Mean CIMT in the presence of different risk factors in normal-weight children.
Risk Factor % of Total Normal-Weight ChildrenMean
CIMT (mm)
p-Value
Postnatal foodFormula36%0.410.25
Breastmilk64%0.38
Birth weight<2500 g8%0.390.5
>3500 g40%0.40
Normal52%0.38
Biological mother’s health Abnormal32%0.430.09
Normal68%0.37
Family historyAbnormal28%0.420.2
Normal72%0.38
SmokingSmoker4%0.56N/A
Non-smoker96%0.38
HypertensionYes4%0.47N/A
No96%0.39
LifestyleSedentary32%0.420.24
Normal68%0.38
CIMT median for entire normal-weight group (mm) 0.37
Table 6. Correlations between waist circumference and other parameters in obese children.
CIMT Median (mm) BMI (kg/m2)LDL-c (mg/dL)Total Cholesterol (mg/dL)Triglycerides (mg/dL)Blood Pressure (mmHg)
Spearman’s ρ0.69 **Pearson’s r0.88 *0.430.340.420.61 *
p-value 0.0006p-value<0.0010.060.140.060.004
* Correlation is significant at the 0.05 level (two-tailed). ** Correlation is significant at the 0.01 level (two-tailed).
Table 7. Correlations between waist circumference and other parameters in normal-weight children.
CIMT Median (mm)BMI (kg/m2)Triglycerides (mg/dL) LDL-c (mg/dL)Total Cholesterol (mg/dL)Blood Pressure (mmHg)
Spearman’s ρ 0.77 **0.88 **0.23Pearson’s r0.3750.380.405 *
p-value <0.001<0.0010.26p-value0.0650.060.044
* Correlation is significant at the 0.05 level (two-tailed). ** correlation is significant at the 0.01 level (two-tailed).
Table 8. Correlations between CIMT and blood parameters (Spearman’s correlation for the obese and normal-weight group and Pearson correlation for the overweight group).
Obese GroupOverweight GroupNormal-Weight Group
HDL-c—CIMT−0.53−0.031−0.25
LDL-c—CIMT0.310.040.07
Total Cholesterol—CIMT0.230.1510.07
Triglycerides—CIMT0.450.60.08
Non-HDL-c—CIMT0.140.190.34
TC:HDL-c ratio—CIMT0.290.270.54
TG:HDL-c ratio—CIMT0.160.540.56
Fasting glucose—CIMT−0.30.21−0.1
Table 9. Means of non-HDL-c, TC/HDL-c ratio and TG/HDL-c ratio across the three groups.
Normal WeightOverweightObese
X ¯ Values
Non-HDL-c (mg/dL)119134122.7
TC/HDL-c ratio43.83.8
TG/HDL-c ratio22.52.2
Table 10. WC and TG/HDL-c as significant predictors of CIMT.
ModelRR-SquareAdjusted R-SquareStd. Error of the EstimateChange Statistics
R-Square ChangeF-Changedf1df2Sig. F-Change
10.855 0.7320.7270.046790.732158.2661580.000
20.284 0.0810.0650.086630.0815.0971580.028
Predictors: (constant), waist circumference. Dependent variable: CIMT.
Table 11. Independent variables excluded as predictors of CIMT.
Beta IntSig.Partial
Correlation
Collinearity Statistics
ToleranceVIFMinimum
Tolerance
LDL-c0.005 0.0690.9450.0090.9811.0200.981
HDL-c−0.078 −1.1510.255−0.1511.0001.0001.000
TG0.068 0.9640.3390.1270.9411.0630.941
TC0.010 0.1480.8830.0200.9571.0450.957
Non-HDL-c0.081 0.5370.5940.0710.7011.4270.701
TC/HDL-c ratio0.059 0.3120.7560.0410.4472.2350.447
Predictors: (constant), TG/HDL-c ratio. Dependent variable: CIMT.
Publisher’s Note: MDPI stays neutral with regard to jurisdictional claims in published maps and institutional affiliations.

