Article

Atrial Fibrillation and Anterior Cerebral Artery Absence Reduce Cerebral Perfusion: A De Novo Hemodynamic Model †

by
Timothy J. Hunter
1,2,
Jermiah J. Joseph
1,2,
Udunna Anazodo
1,2,
Sanjay R. Kharche
1,2,*,
Christopher W. McIntyre
1,2,* and
Daniel Goldman
1,*
1
Department of Medical Biophysics, Western University, 1151 Richmond Street North, London, ON N6A 5C1, Canada
2
Lawson Health Research Institute, 750 Baseline Road East, London, ON N6C 2R5, Canada
*
Authors to whom correspondence should be addressed.
This paper is an extended version of paper published in Functional Imaging and Modelling of the Heart 2021 in 11th International Conference, FIMH 2021, held in Stanford, CA, USA, 21–25 June 2021.
Submission received: 31 December 2021 / Revised: 29 January 2022 / Accepted: 30 January 2022 / Published: 8 February 2022

Abstract

:
Background: Atrial fibrillation is a prevalent cardiac arrhythmia and may reduce cerebral blood perfusion augmenting the risk of dementia. We hypothesize that geometric variations in the cerebral arterial structure called the Circle of Willis (CoW) play an important role in influencing cerebral perfusion. The objective of this work was to develop a novel cardio-cerebral lumped parameter hemodynamic model to investigate the role of CoW variants on cerebral blood flow dynamics under atrial fibrillation conditions. Methods: A computational blood flow model was developed by coupling whole-body and detailed cerebral circulation descriptions, modified to represent six common variations of the CoW. Cerebral blood flow dynamics were simulated in common CoW variants, under control and imposed atrial fibrillation conditions. Risk was assessed based on the frequency of beat-wise hypoperfusion events, and sensitivity analysis was performed with respect to this model output. Results: It was found that the geometry of the CoW influenced the frequency of hypoperfusion events at different heart rates, with the variant missing a P1 segment having the highest risk. Sensitivity analysis revealed that intrinsic heart rate is most associated with the considered outcome. Conclusions: Our results suggest that CoW geometry plays an important role in influencing cerebral hemodynamics during atrial fibrillation. The presented study may assist in guiding our future clinical-imaging research.

1. Introduction

This paper is an extension of work originally presented in Functional Imaging and Modelling of the Heart 2021 [1]. Atrial fibrillation (AF) currently affects a large part of the population. In addition to commonly known risks such as strokes and transient ischemic attacks, AF has been associated with increased cognitive decline and early dementia [2]. AF is known to reduce cerebral perfusion [3], and silent cerebral ischemia is thought to be a key mechanism in the increased cognitive risk [2,4]. Ongoing imaging research strongly suggests that a disrupted cerebral blood flow promotes debilitating early dementia [5]. The effects of AF on cerebral perfusion may be modulated by cerebral vascular geometry, and specifically by common congenital Circle of Willis (CoW) variants [6,7]. The function of a complete CoW is to ensure consistent distribution of blood flow to all regions of the brain. In cases with missing segments in the CoW, regions of the brain may be more susceptible to harmful altered hemodynamics. The aim of this work is to investigate whether structural variants of the CoW behave differently with respect to cerebral perfusion in AF conditions.
Multi-scale hemodynamic modelling has been used to study cerebral circulation and gain insight into patient-specific hemodynamics [8]. 3D modelling is a useful tool, which provides realistic and accurate patient-specific insight into patient hemodynamics. It has increasingly been used as the gold standard in computational hemodynamic studies as computational fluid dynamics platforms become more accessible [9]. We have recently found a close relationship between cardiac arrhythmia and systemic perfusion (Kharche et al., 2021; Frontiers in Medicine). However, current 3D methods remain computationally resource intensive, require high-definition vascular imaging, and are therefore unsuitable for applications studying large population hemodynamics.
In contrast to 3D hemodynamic models, lumped parameter (0D) models are known to provide clinically relevant information using significantly less time and computational resources [8]. 0D models are particularly useful in studies where there are poorly understood outcomes of diseases with well understood mechanisms because of their ability to assess the impact of a range of parameters or cases on a particular outcome. This lab has previously used 0D models to gain insight into the causes of pediatric hypertension [10] and investigate therapeutic hypothermia [11]. Anselmino et al. [4] have previously used 0D modelling to investigate the interplay between AF and cerebral hemodynamics. They determined that AF does indeed expose the brain to the risk of ischemia via low blood flow, or so-called hypoperfusion events. Saglietto et al. [12] have also used 0D modelling to predict that the optimal goal for a heart rate control strategy should be around 60 bpm, considered strict rate control.
The findings by Saglietto et al. [12] are in contrast to the common practice of lenient rate control (<110 bpm), which is based on findings from the RACE II trial, a large, randomized control trial [13]. The RACE II trial was a consequential study, which found that, compared to lenient rate control (<110 bpm), strict rate control (<80 bpm) was not more effective in reducing mortality in persistent AF patients. These findings have informed treatment strategies for persistent AF patients; however, they do not consider the increased risk for dementia, later confirmed by de Brujin et al. [2] in a longitudinal study. Modelling studies following de Brujin et al. [2] have aimed at elucidating the mechanism behind the increased risk and finding potential treatment strategies that mitigate it.
Previous modelling studies form the basis for the present work; however, the role of cerebral vascular structural variants, i.e., CoW variants, in the AF-cerebral perfusion relationship remains underexplored. As the CoW is known to play an important role in the distribution of blood flow to the brain, common variants should be considered while studying the interplay between AF and cerebral hemodynamics. In this study, a composite 0D model of human circulation with detailed cerebral vasculature was developed to discover the effects of AF on cerebral perfusion in cases with common CoW variants. Model composition is described in Section 2.1. The model is used to assess cerebral hemodynamics during AF in all six common CoW variants, the strategy for which is described in Section 2.4. Finally, the model itself is also assessed using sensitivity analysis as described in Section 2.5, which details the parameter values that are correlated to model outcomes.

2. Methods

This study is a modelling study that examines the role of varying blood vessel geometries in AF-related cerebral hypoperfusion. A previously developed composite 0D model [1] (Figure 1) was used to simulate cerebral hemodynamics under control and AF conditions. Six common variants of CoW geometry were modelled as separate cases, and the results for each were presented. Sensitivity analysis was also performed on the model to assess model parameters that had the greatest impact on simulated outcomes.

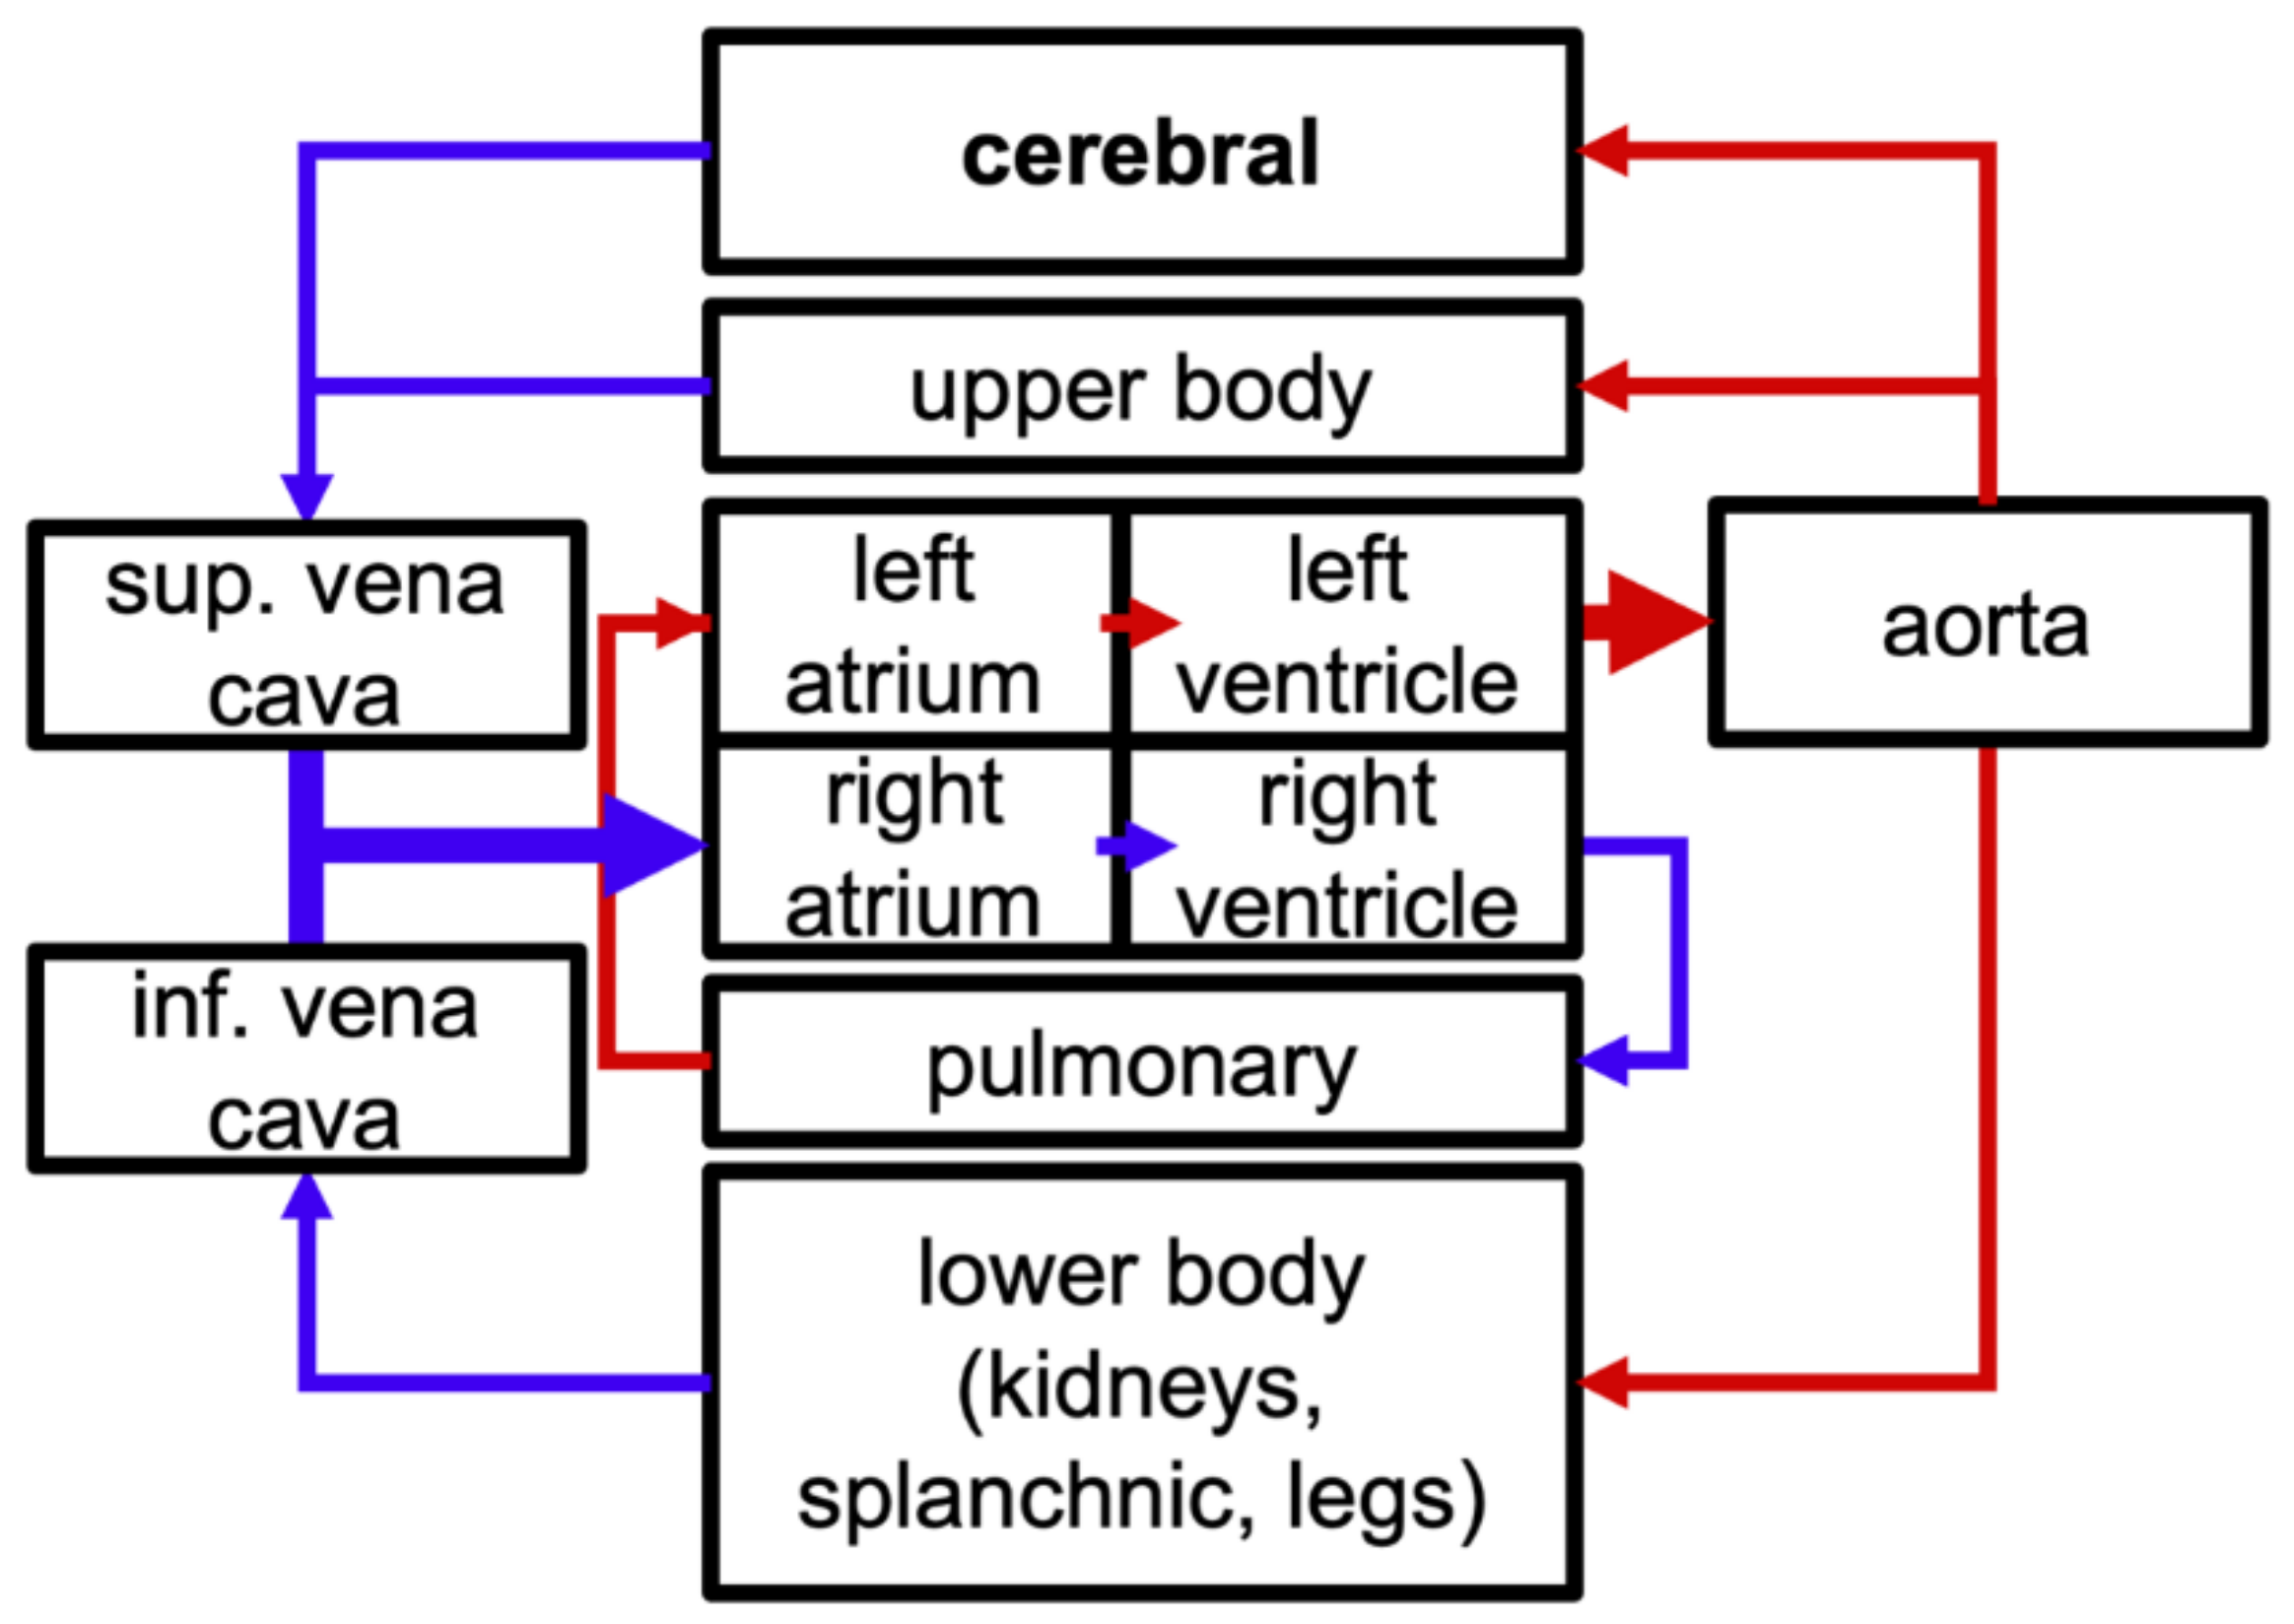
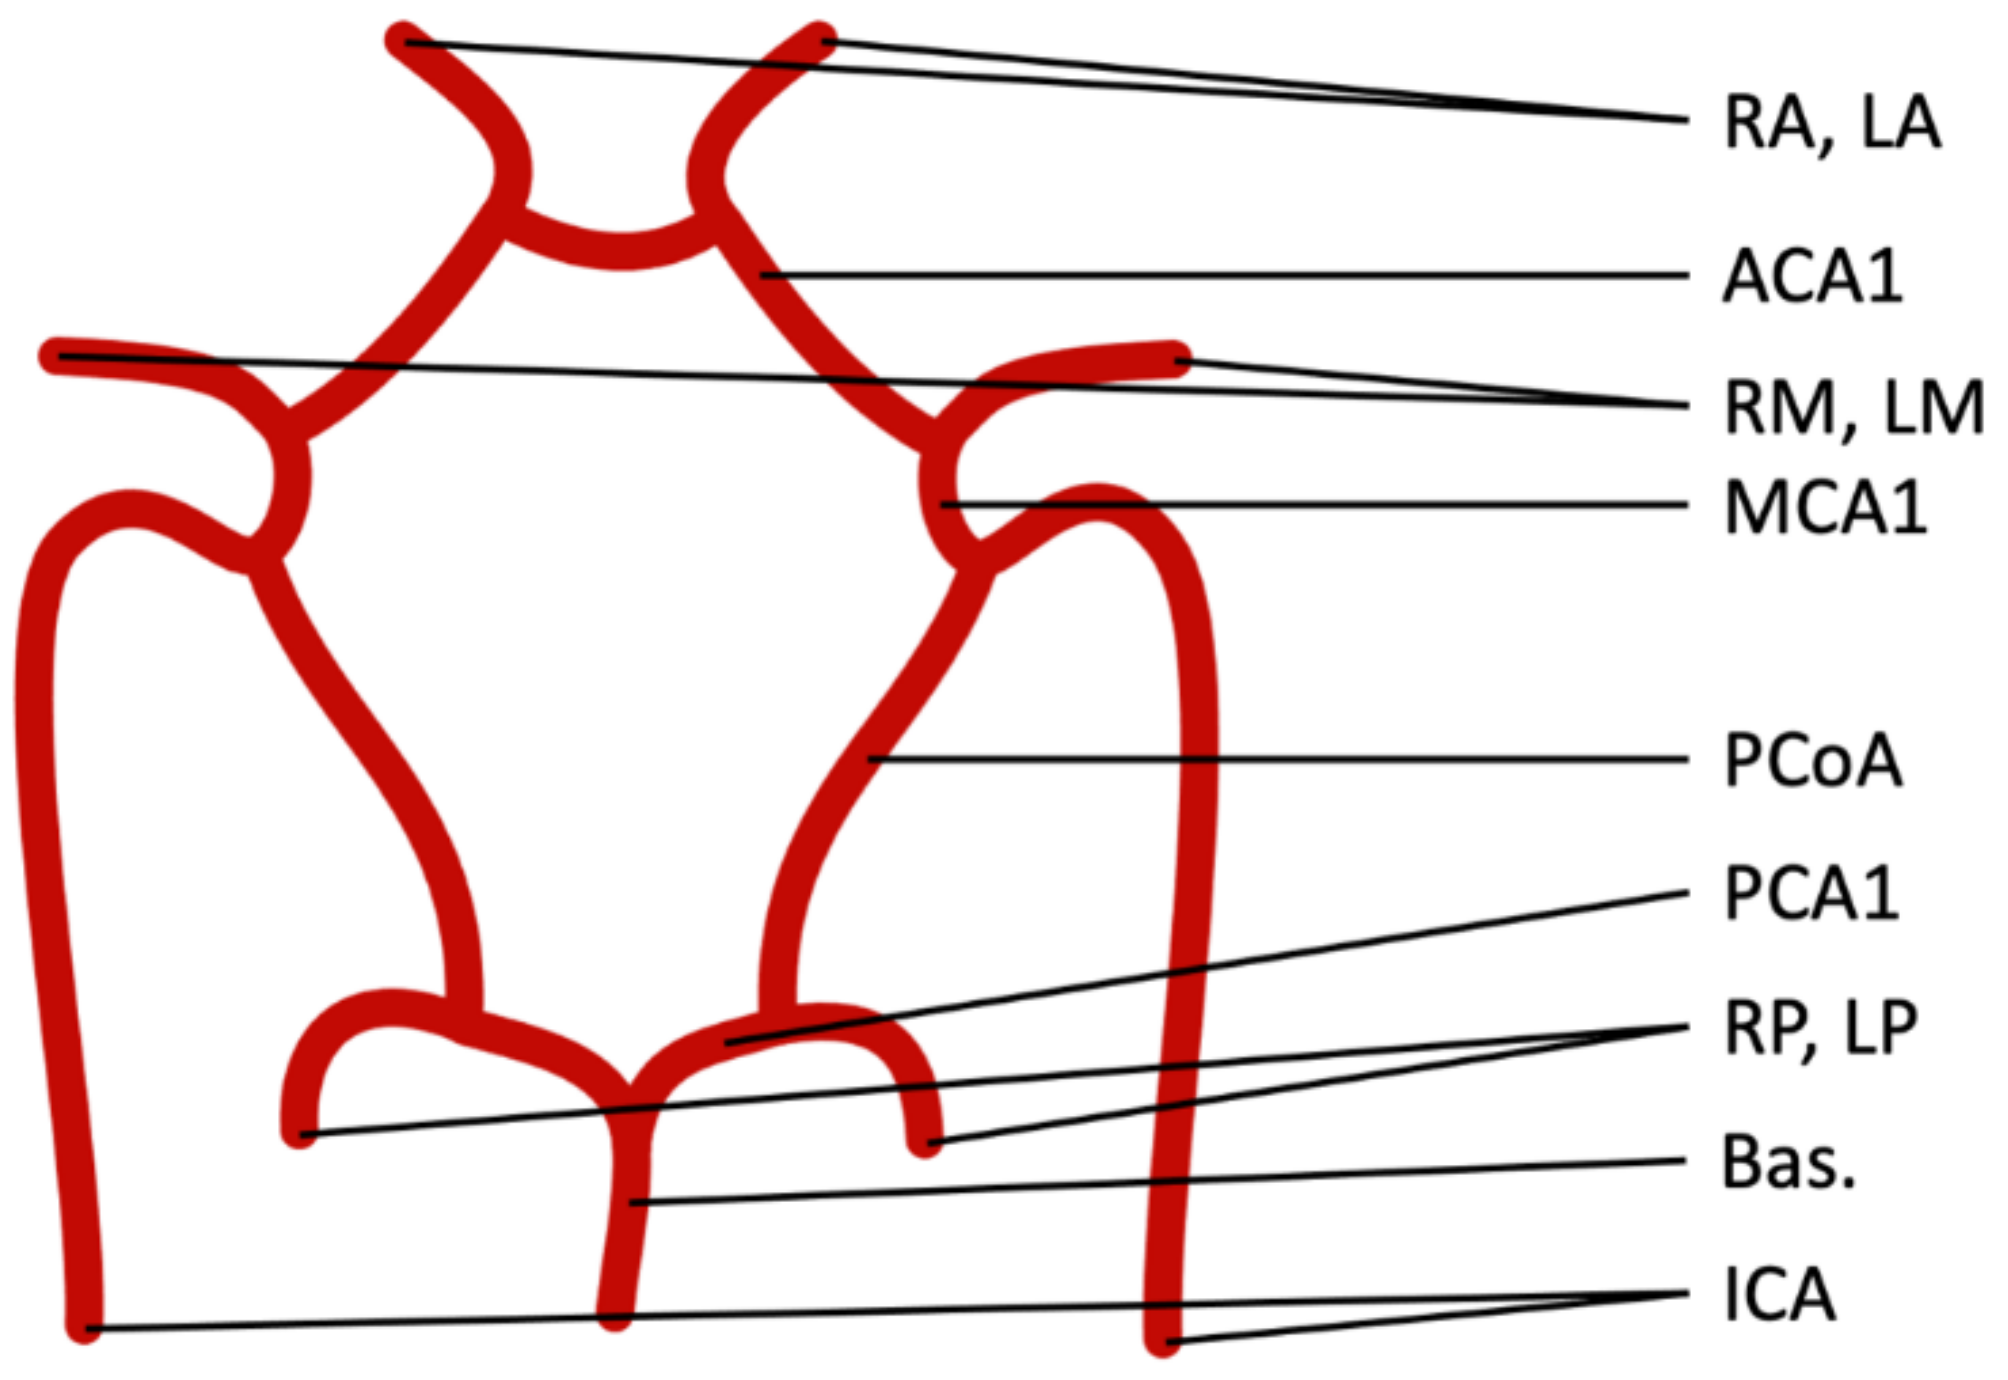
2.1. Model Components

The 0D model is a composite model that consists of whole-body circulation, a blood-pressure modulated baroreflex control mechanism, and detailed cerebral circulation with an autoregulation function. All model parameters were inherited from the literature values, unless otherwise stated.
The whole-body circulation model was adapted from the model published by Heldt [14]. It consists of a network of blood containing elastic Windkessel compartments, which represent individual, or networks of, blood vessels. The time-dependent change in pressure within each compartment is a function of the change in volume (i.e., flow in or out) divided by the compliance of the compartment shown by the equation:
d P d t = q i n q o u t C ,
where P denotes compartment pressure, t denotes time, q denotes flow, and C denotes compliance. The flow between connected compartments is calculated using the following equation:
q = P p P d R ,
where Pp and Pd denote proximal and distal pressure, respectively, and R denotes resistance.
The pumping heart is represented as four compartments with variable elastance (inverse of compliance), representing the four chambers of the heart. The time-dependent elastances of ventricles and atria were calculated using activation terms. The equation for atrial activation is:
0 < t l o c t a s y s : a c t a = 1 cos π t l o c t a s y s , t a s y s < t l o c 1.5 t a s y s : a c t a = 1 + cos 2 π t l o c t a s y s t a s y s o t h e r w i s e : a c t a = 0
in which acta is the activation term, tloc is the time since the initiation of the cardiac cycle, and tasys is a contraction timing parameter. Similarly, ventricular activation is calculated using:
  t a v < t l o c t a v + t s : a c t v = 1 cos π t l o c t a v t s t a v + t s < t l o c t a v + 1.5 t s : a c t v = 1 + cos 2 π t l o c t a v t s t s o t h e r w i s e : a c t v = 0 ,
where tav is the atrioventricular time delay and ts is a contraction timing parameter. The activation constants are applied to each heart compartment using the equation:
E = E d i a s + 0.5 E s y s E d i a s × a c t ,
where Esys and Edias are systolic and diastolic elastances, respectively.
Additionally, backflow is prevented in the heart and systemic veins by setting flow between compartments equal to 0 if distal pressure is greater than proximal pressure. A simplified caricature of the circulation model is presented in Figure 1, in which compartments are represented by boxes, and connections are indicated by arrows. It should be noted that the boxes labeled “cerebral” and “lower body” each represents multiple compartments.
The baroreflex is a feedback mechanism, which works to maintain hemodynamic homeostasis. It modulates peripheral vascular resistance, heart rate, and heart contractility to maintain systemic blood pressure and flow at healthy levels. The baroreceptor mechanism is implemented according to the model proposed by Lin et al. [15]. The model dynamically calculates sympathetic nervous activity (SNA) and parasympathetic nervous activity (PNA) based on the mean arterial pressure, as well as arterial PCO2, which is assigned a constant value of 40 mmHg. Values for SNA and PNA are then used to dynamically modulate peripheral vascular resistance, the intrinsic heart rate, as well as heart contractility via modulation terms [15].
The cerebral circulation model is comprised of a network of elastic compartments with compliances and resistances similar to the systemic circulation. While pressure and flow are governed by the same equations as the systemic model, the formulation is more complicated and is beyond the scope of this article. Readers may refer to Ursino and Gianessi [16] for further details. The model also implements cerebral autoregulation, which is a physiological mechanism that alters vascular resistance and compliance in order to maintain blood flow within healthy ranges in the case of widely varying cerebral perfusion pressure. Each downstream region (Figure 2, RA, LA, RM, LM, RP, LP) is regulated by its own autoregulation function comprised of two integrated signals: Blood flow rate in the region, which is calculated dynamically, and arterial PCO2, which is assigned at 40 mmHg. These two signals are applied to a first-order filter with time constants of 20 s for autoregulation and 40 s for CO2 control, and the resulting values are used to modulate compliance and resistance within the corresponding vascular region. Blood flow from the whole-body model to the cerebral model was allowed by connecting the basilar and internal carotid arteries to the aortic compartment, and by connecting the cerebral outlet vein to the superior vena cava compartment. A caricature of the arterial segments of the cerebral model is shown in Figure 2.
This work considers the six common variants of the Circle of Willis found in the cerebral vasculature, represented in Figure 3 [7]. All variants, aside from the complete variant, are characterized by one or multiple missing segments of the CoW. To model the absence of the relevant cerebral vessel, its inlet and outlet flow was assigned a nil value.

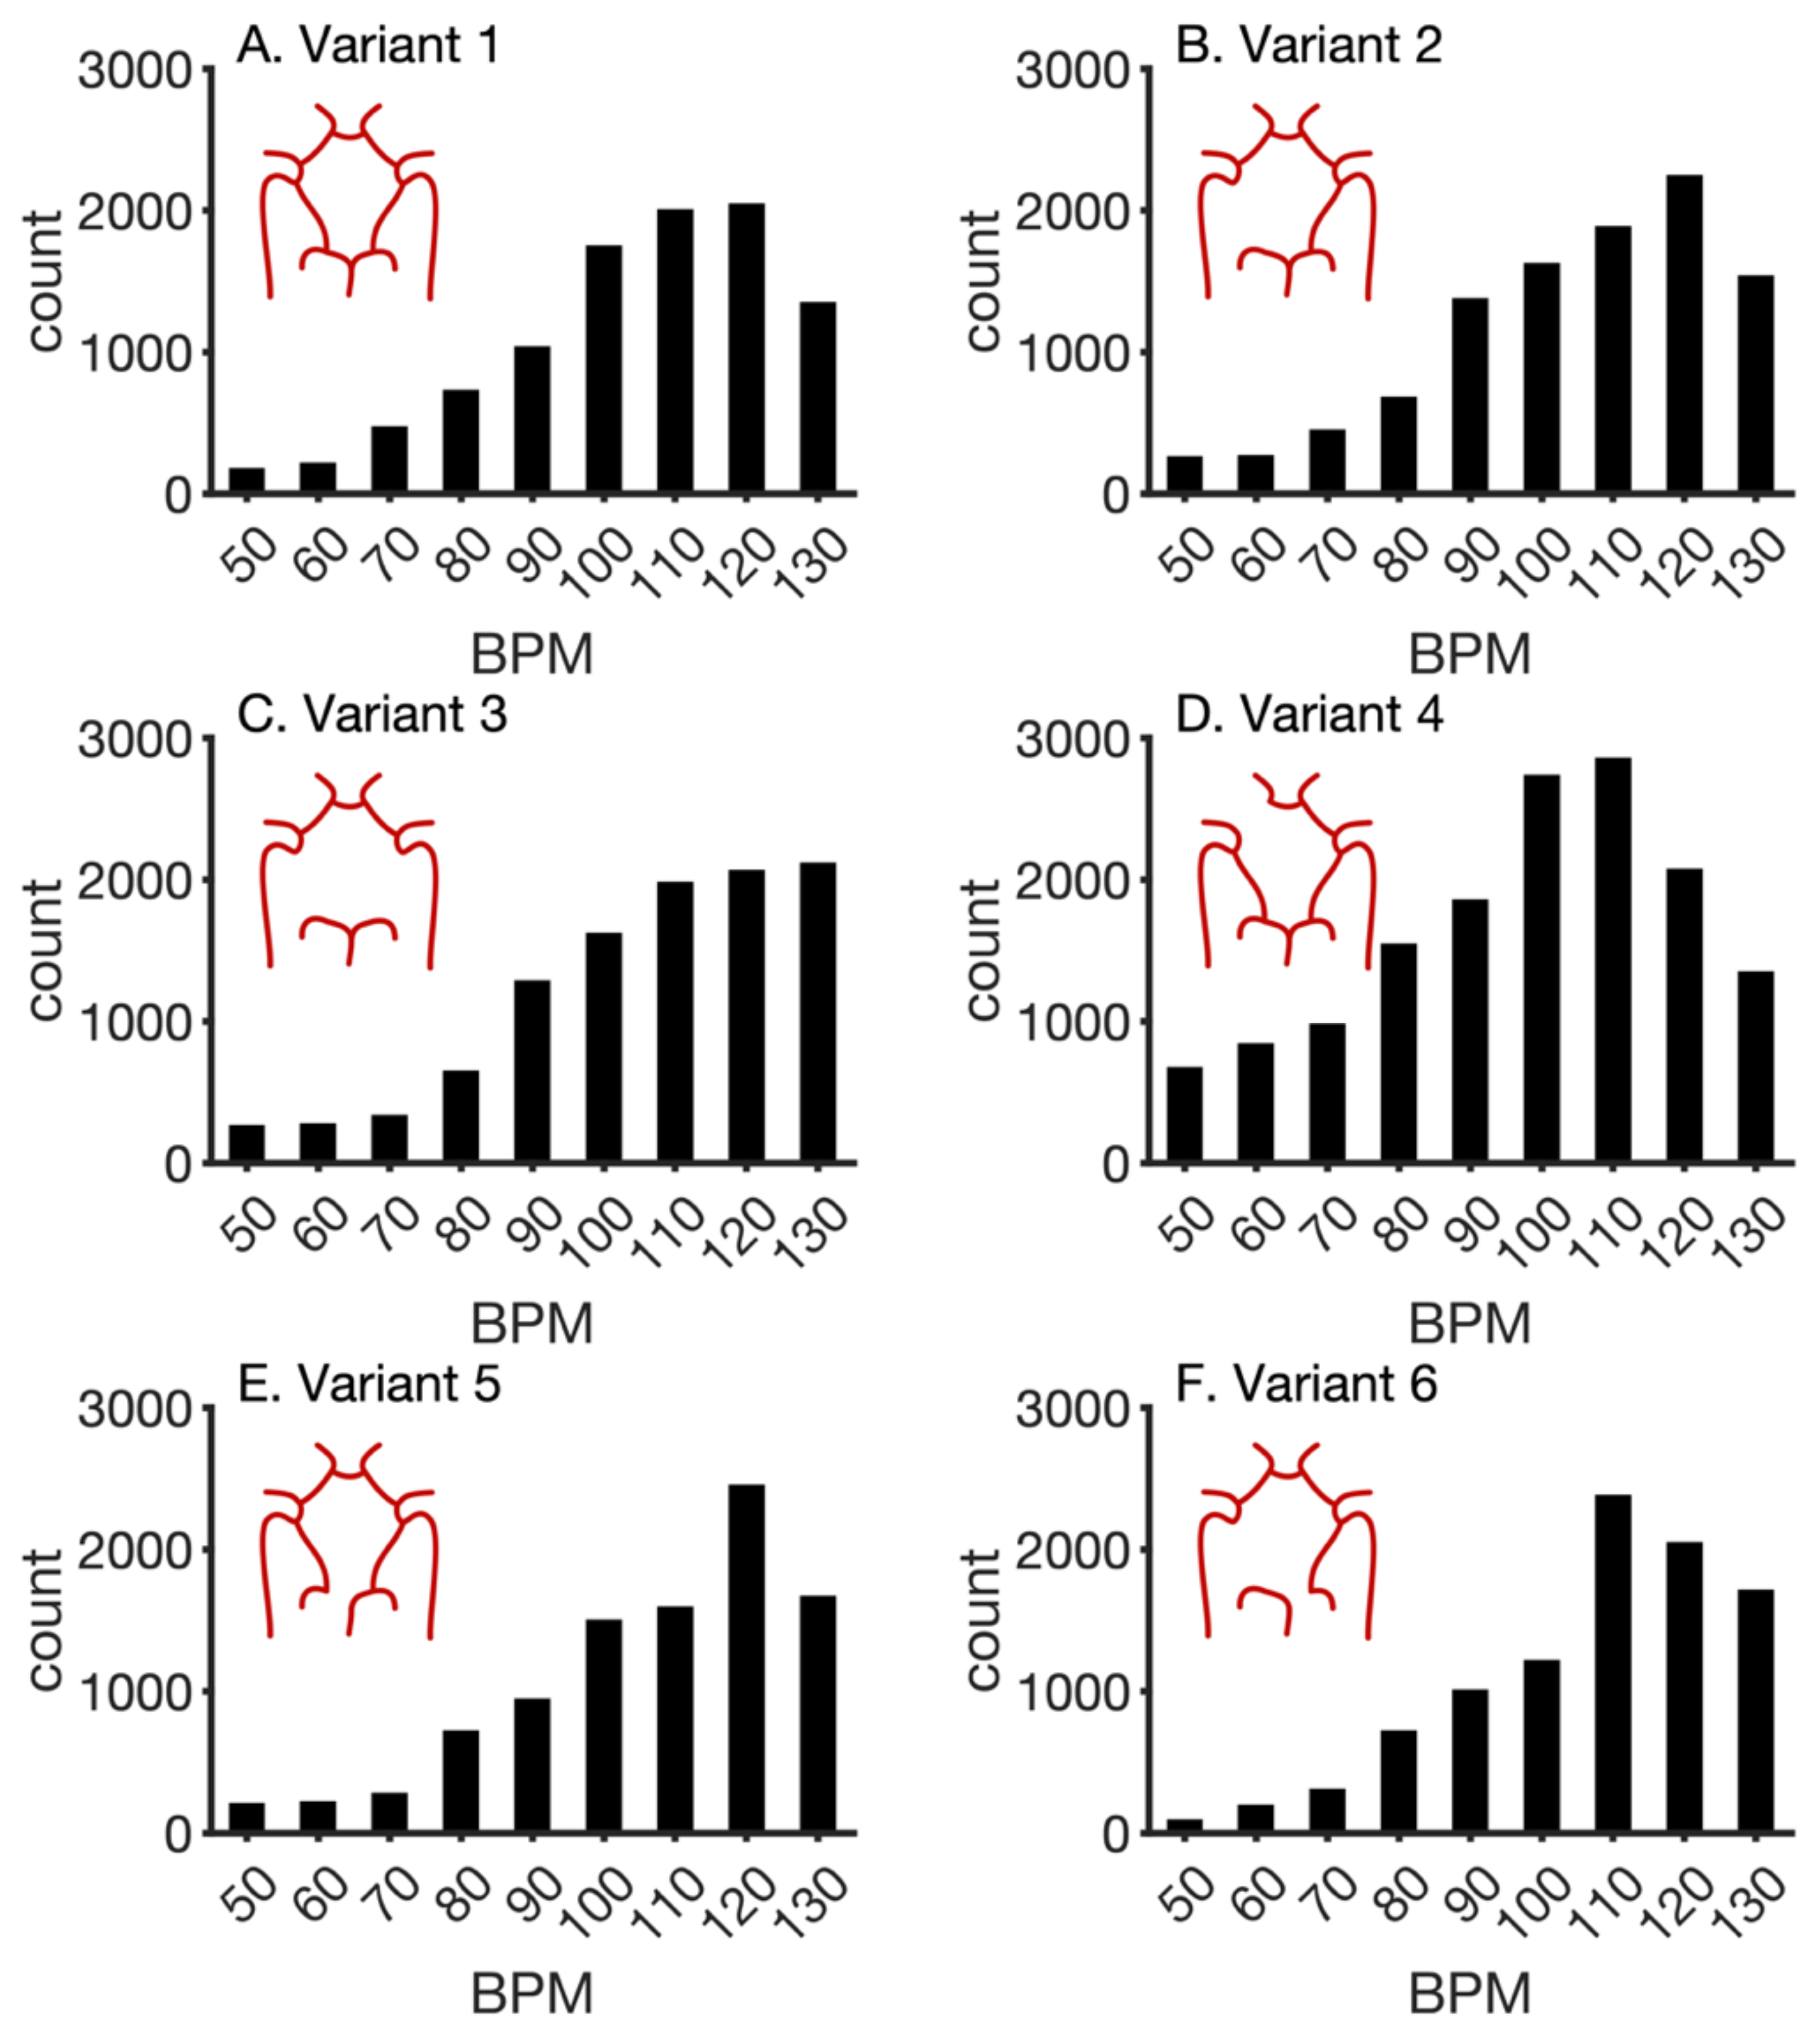
2.2. Atrial Fibrillation

Each instance was simulated under AF and control conditions. The control was defined as having normal sinus rhythm (NSR) with stochastic RR intervals sampled from a normally distributed pink noise generator [17]. AF was modelled by assigning stochastic RR intervals sampled from an exponentially modified Gaussian distribution around a mean heart rate, modifying ventricular elastances (contractility), and assigning nil atrial contractility [4,17,18,19]. Pink noise and exponential samples were generated using in-house MATLAB scripts.

2.3. Computational Methods

The model used in this study has 57 coupled stiff ordinary differential equations (ODEs). An in-house ODE solver [20] was deployed to generate stable and accurate numerical solutions. The maximum integration timestep in the adaptive and implicit solver was 0.001 s, which was found to provide the same solution when the timestep was halved. The solutions were obtained using a relative tolerance of 10−6, with an accuracy of O(dt6). Each instance of the simulation could be processed by available computing resources running Red Hat Linux within 60 s. Instances were trivially parallelized using GNU Parallel [21] in order to run a large number of instances (104) on multi-core compute nodes.

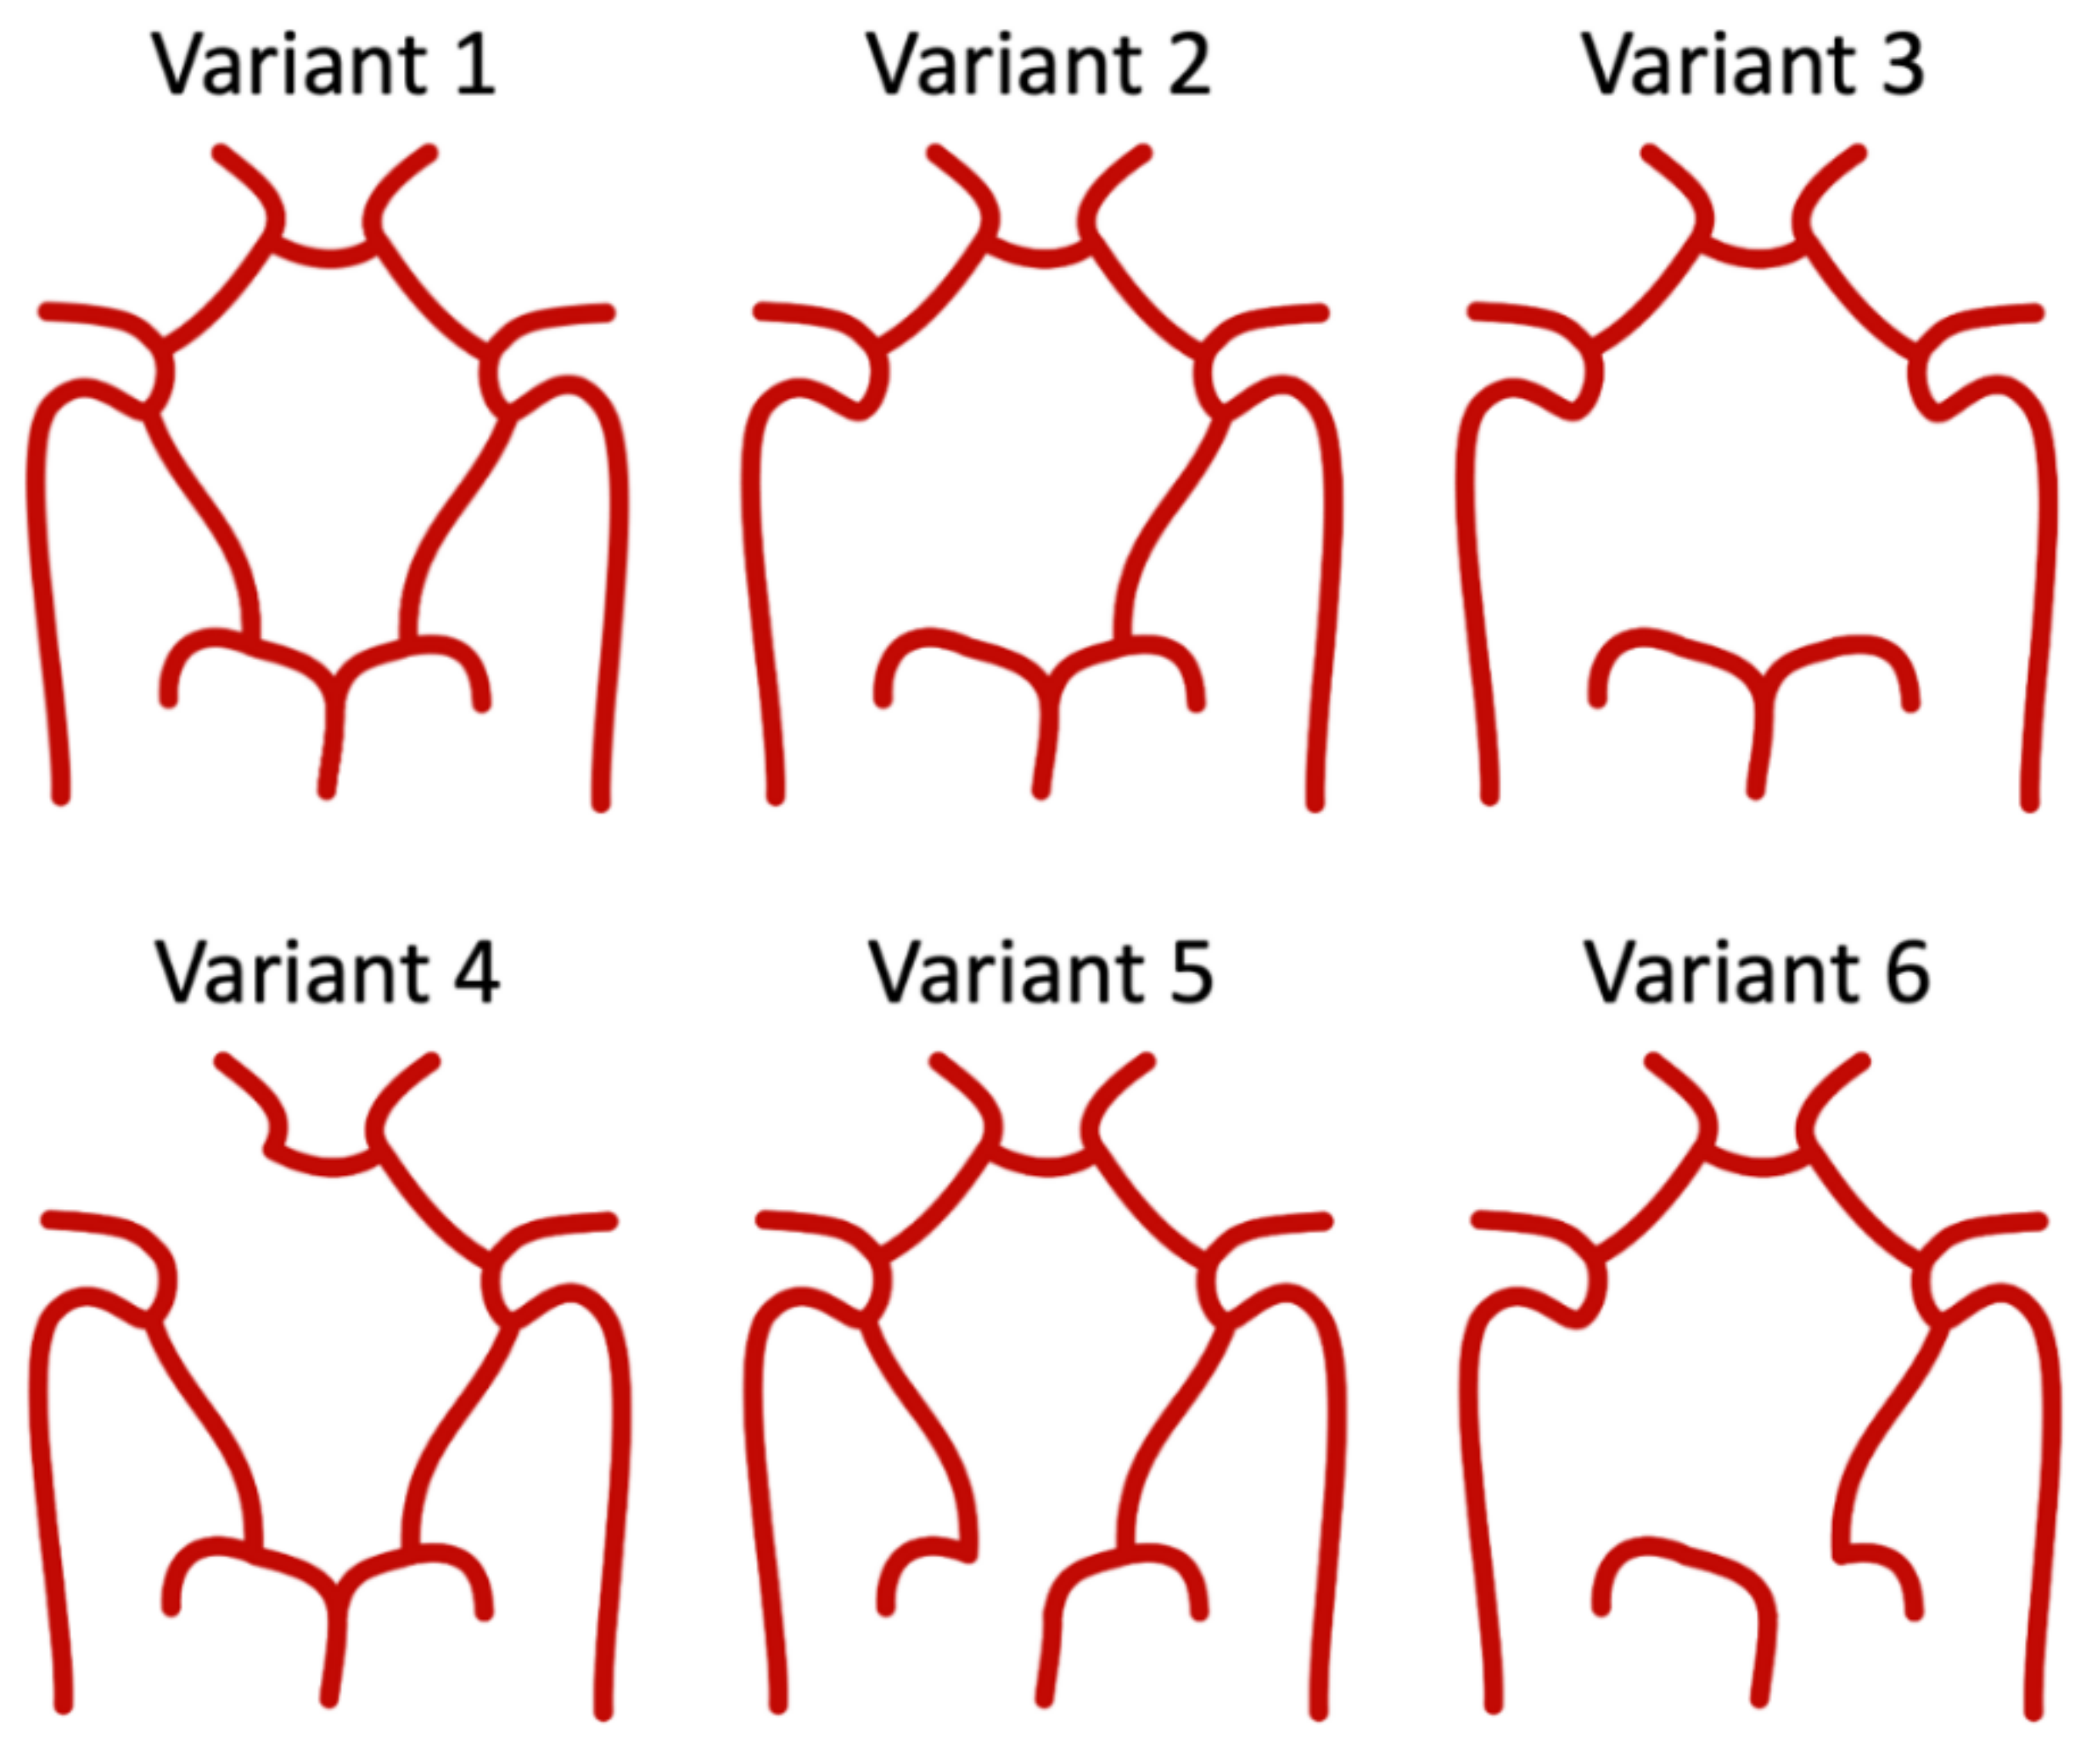
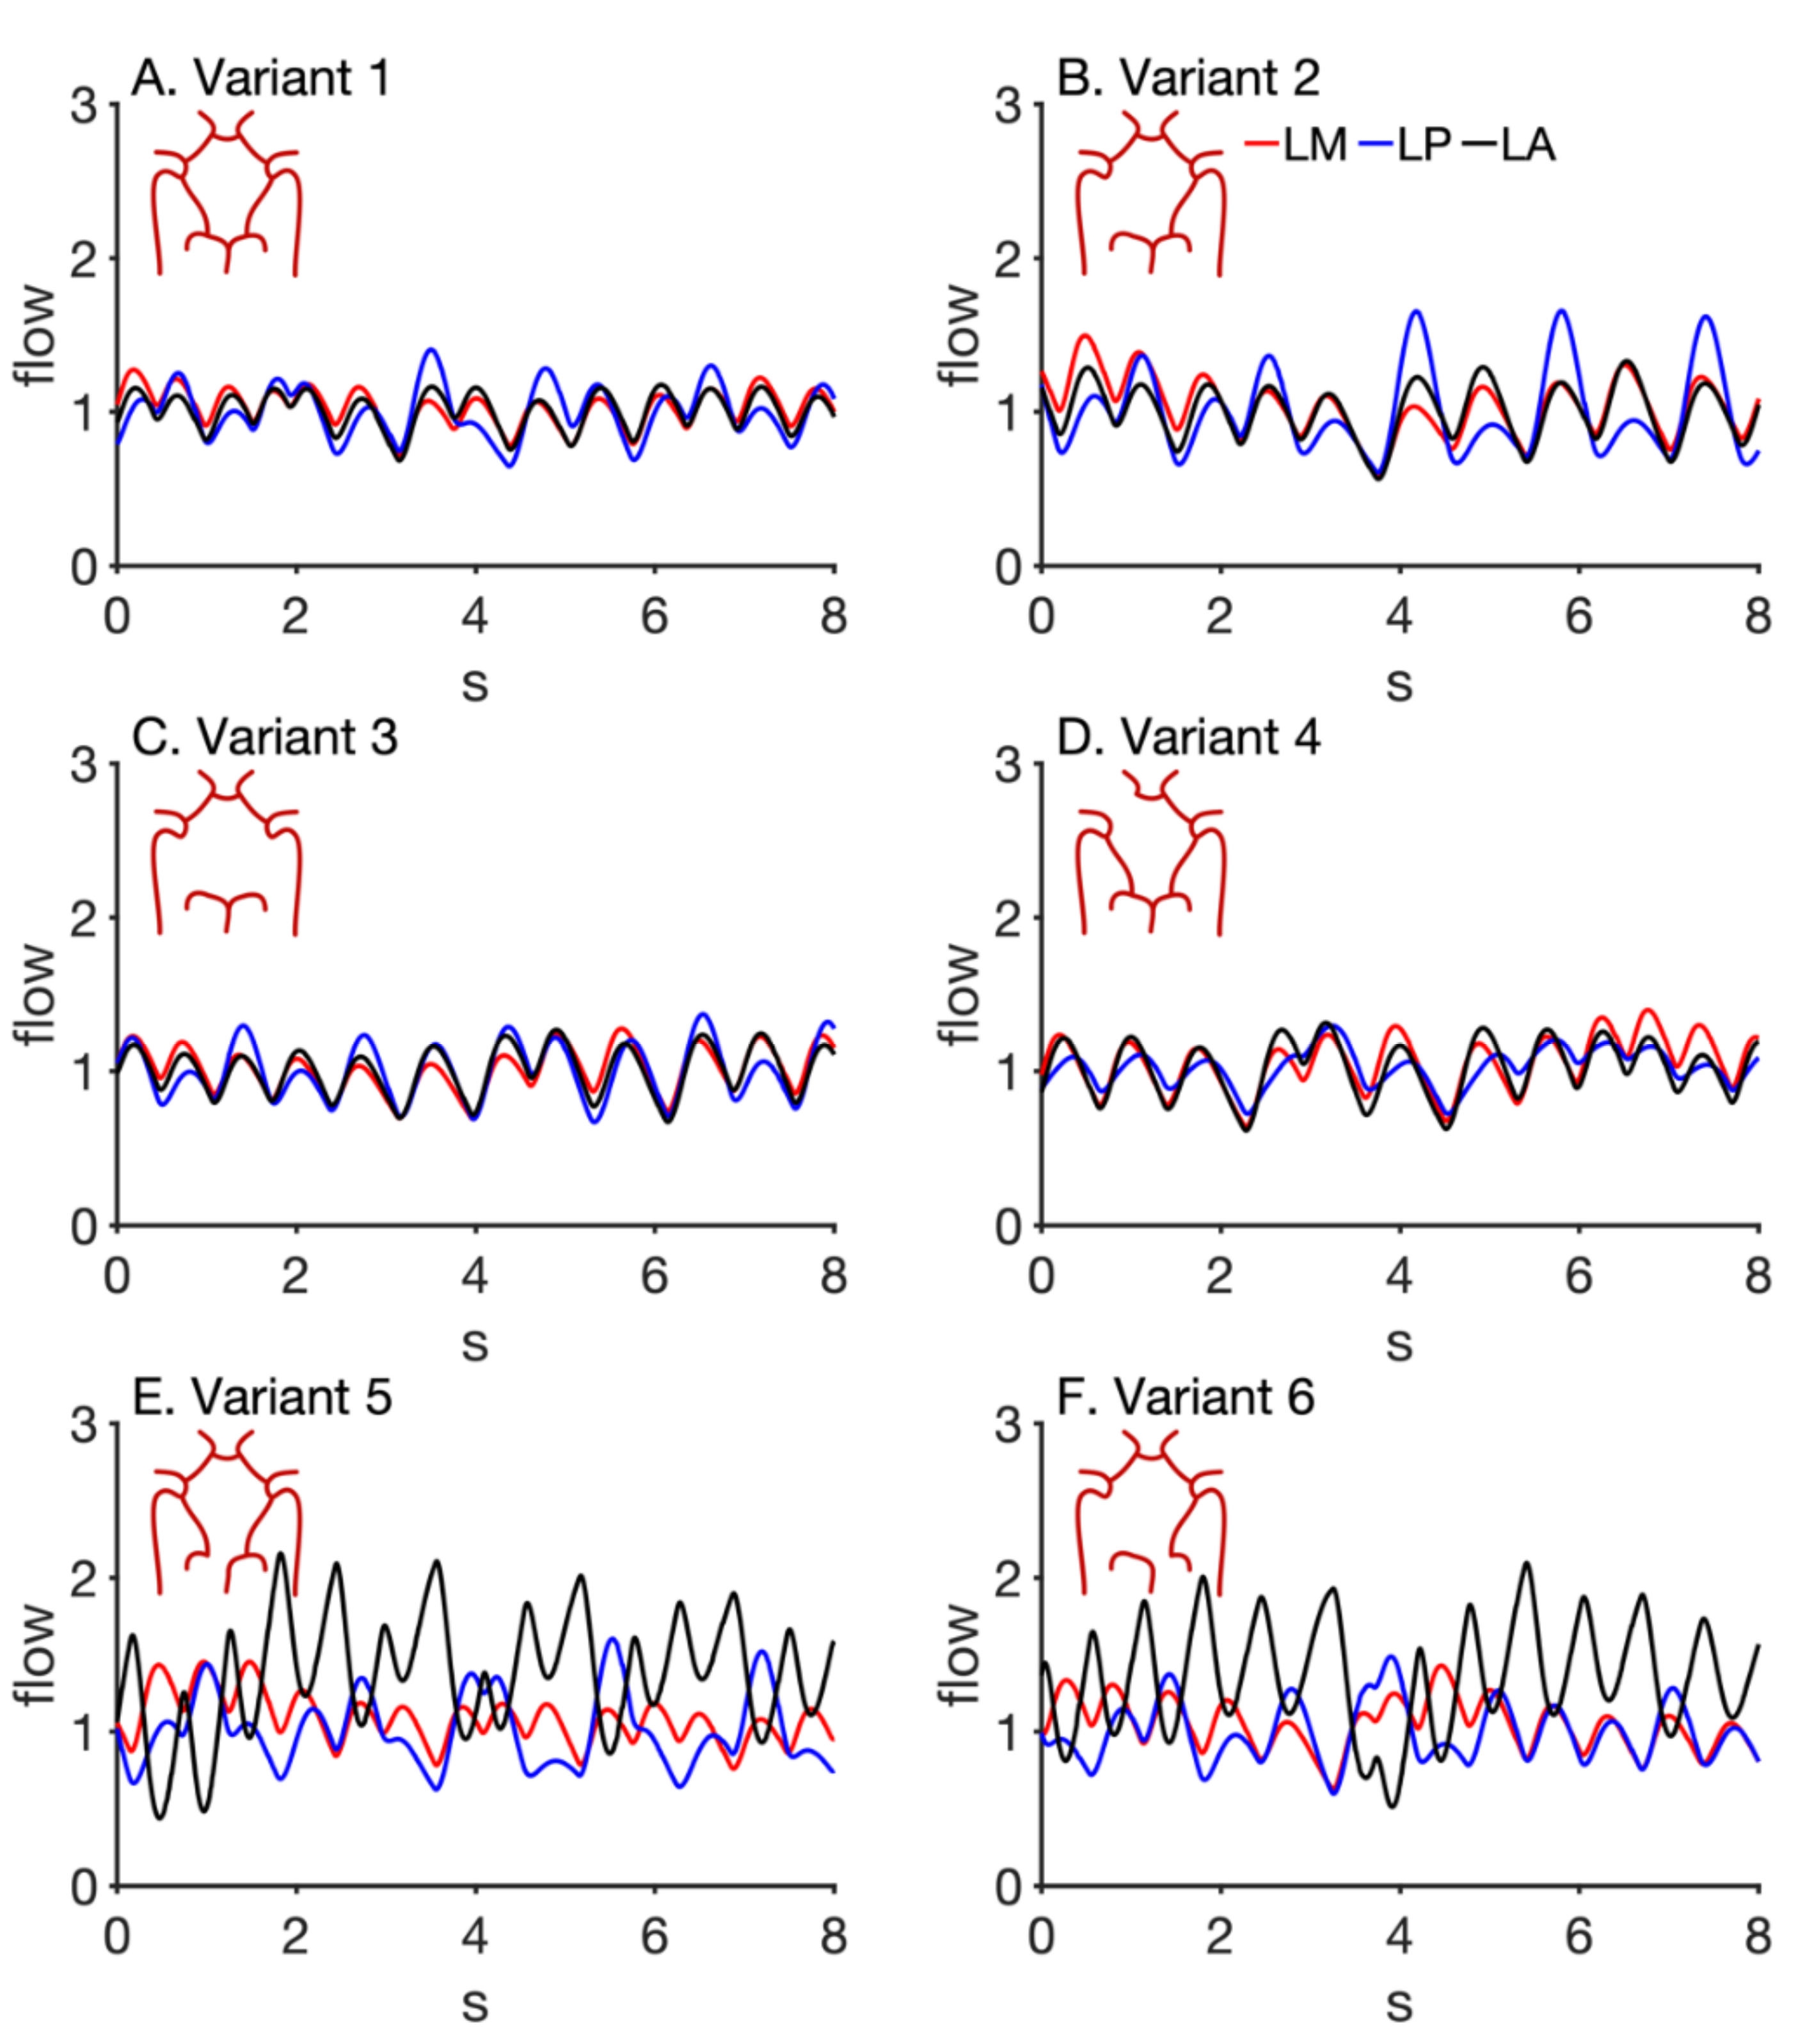
2.4. Hemodynamic Differences in CoW Variants

Blood flow was simulated in each variant at nine different intrinsic heart rates (50 to 130 bpm) in accordance with clinical practice [22]. The probability distribution functions underlying the RR intervals and the representative RR interval time series are illustrated in Figure 4. In each simulation, the number of hypoperfusion events was recorded to represent cerebral perfusion deficit. Derived measurements were the number of hypoperfusion events in each vascular bed over the 5000 beats of the simulation. A hypoperfusion event in any vascular bed was defined as a heartbeat in which the mean blood flow through the vascular bed fell below the 5th percentile of blood flow in the corresponding NSR experiment.

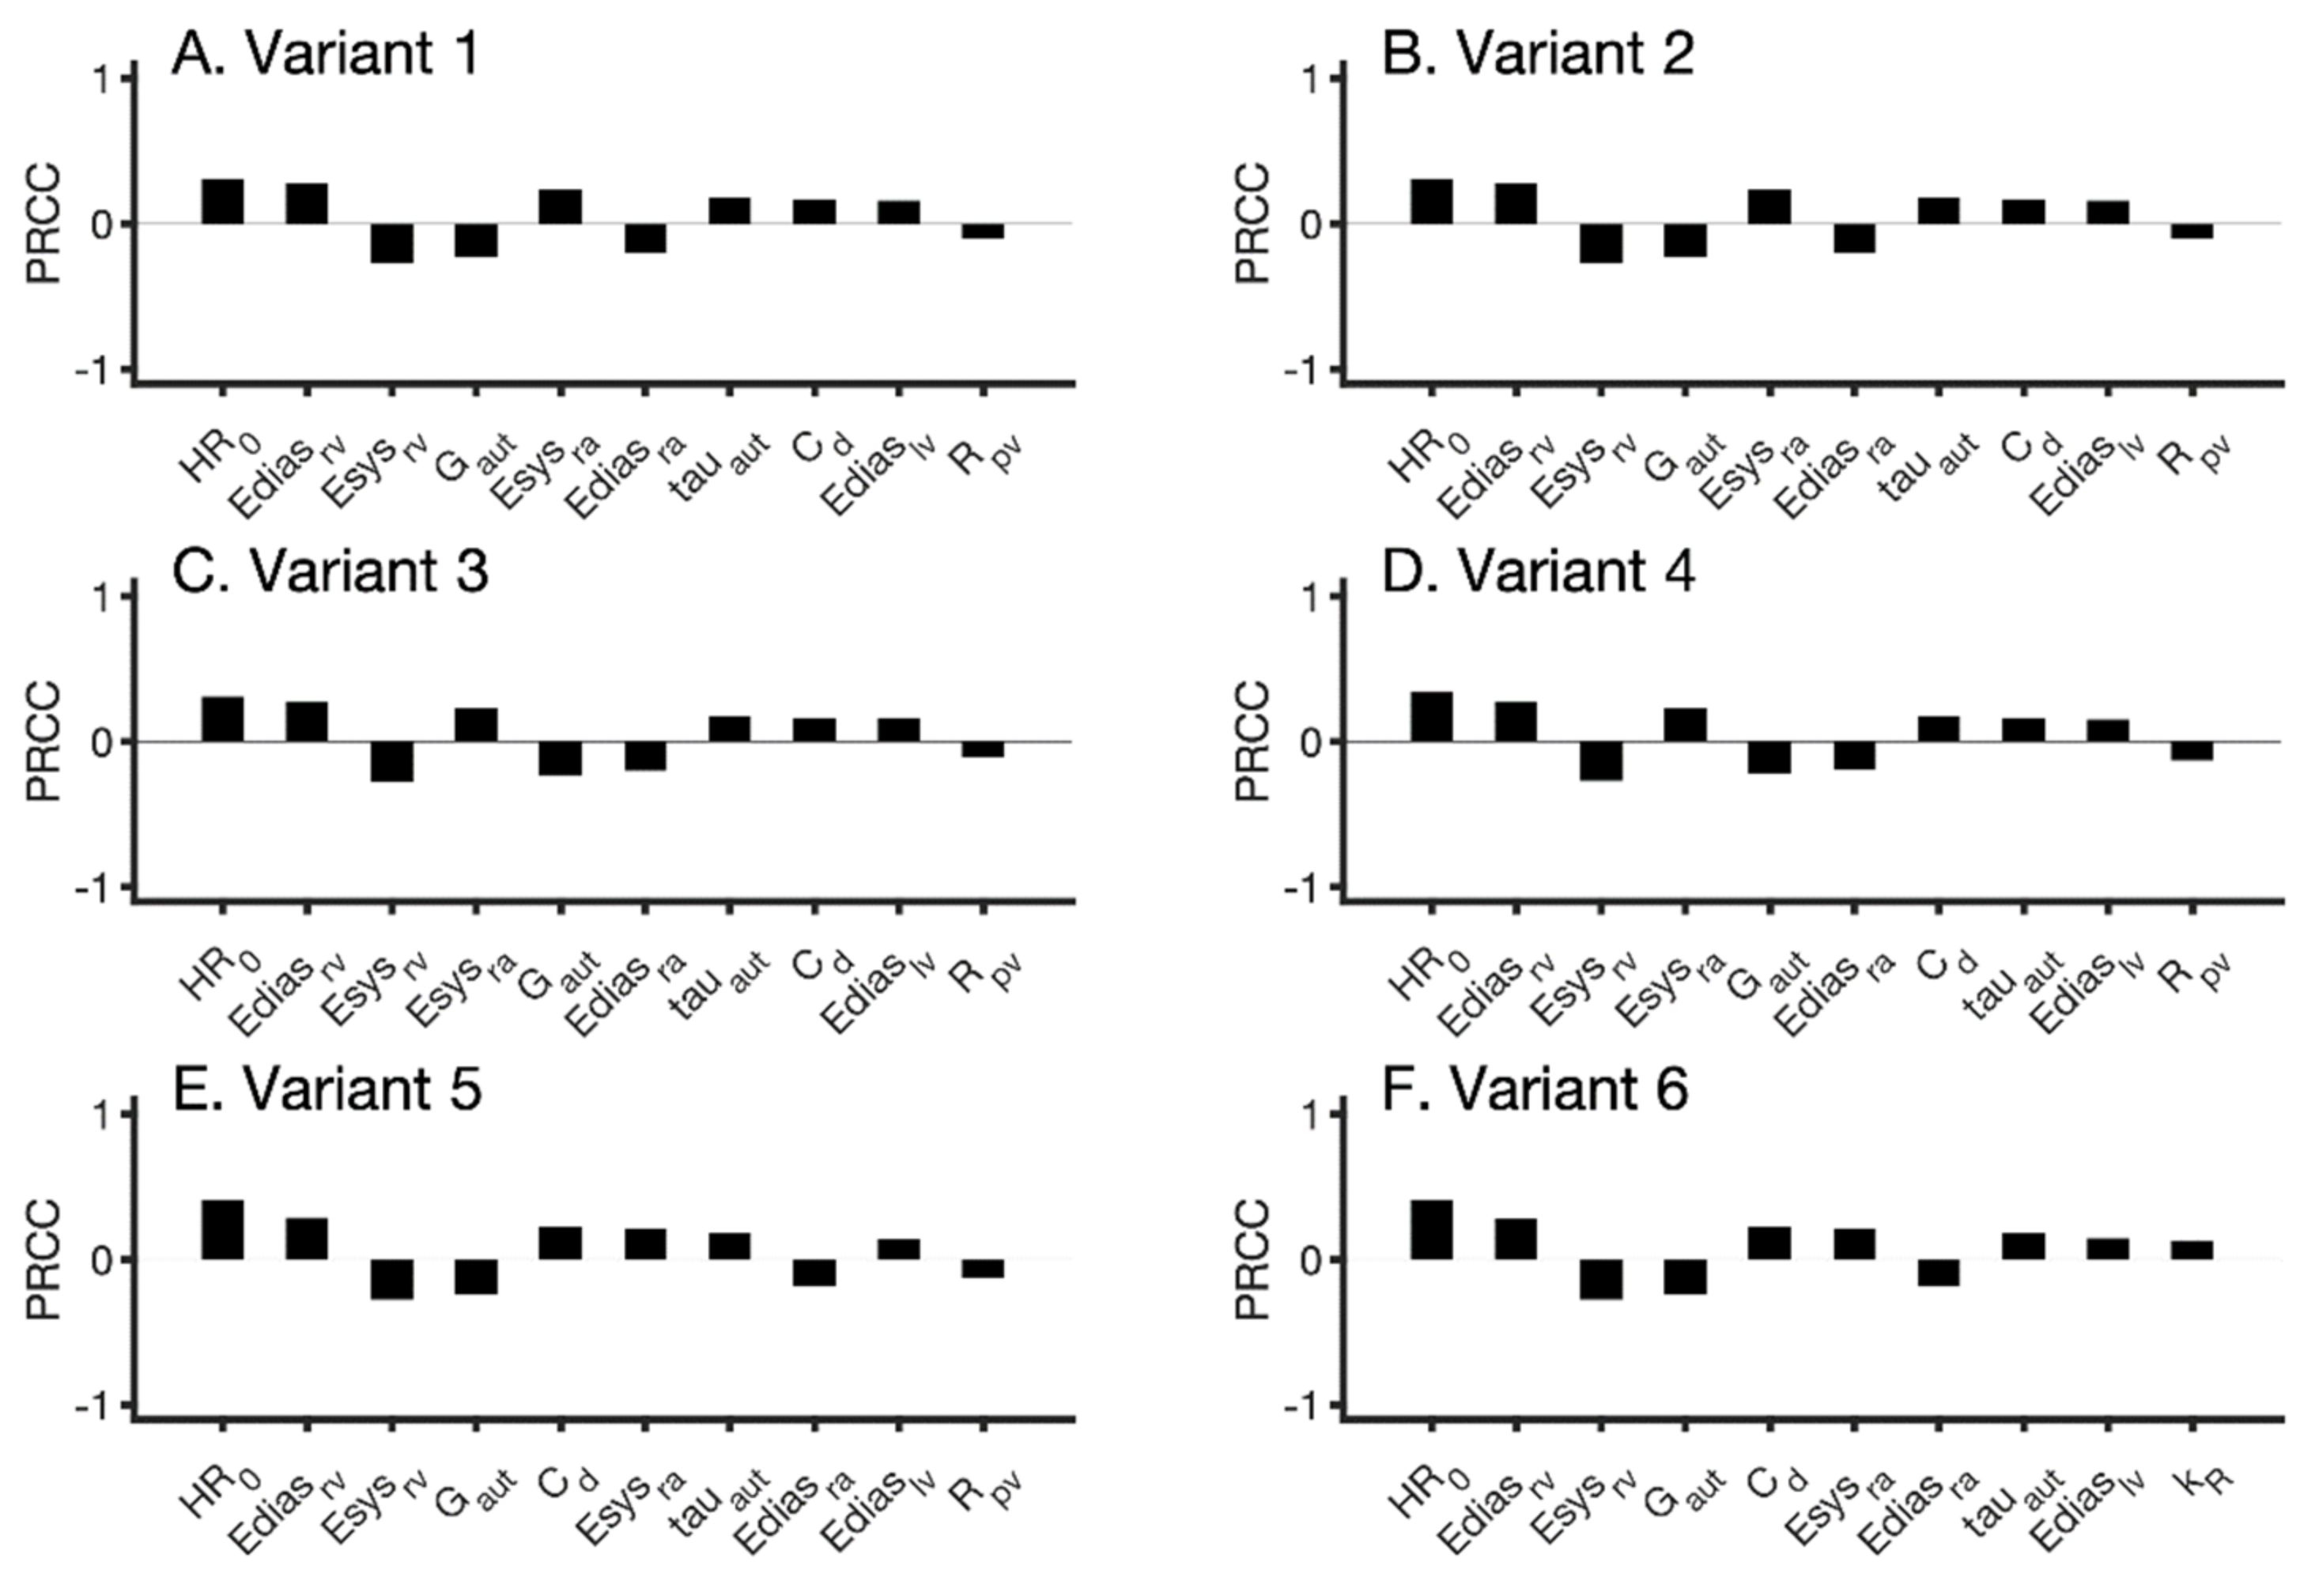
2.5. Sensitivity Analysis
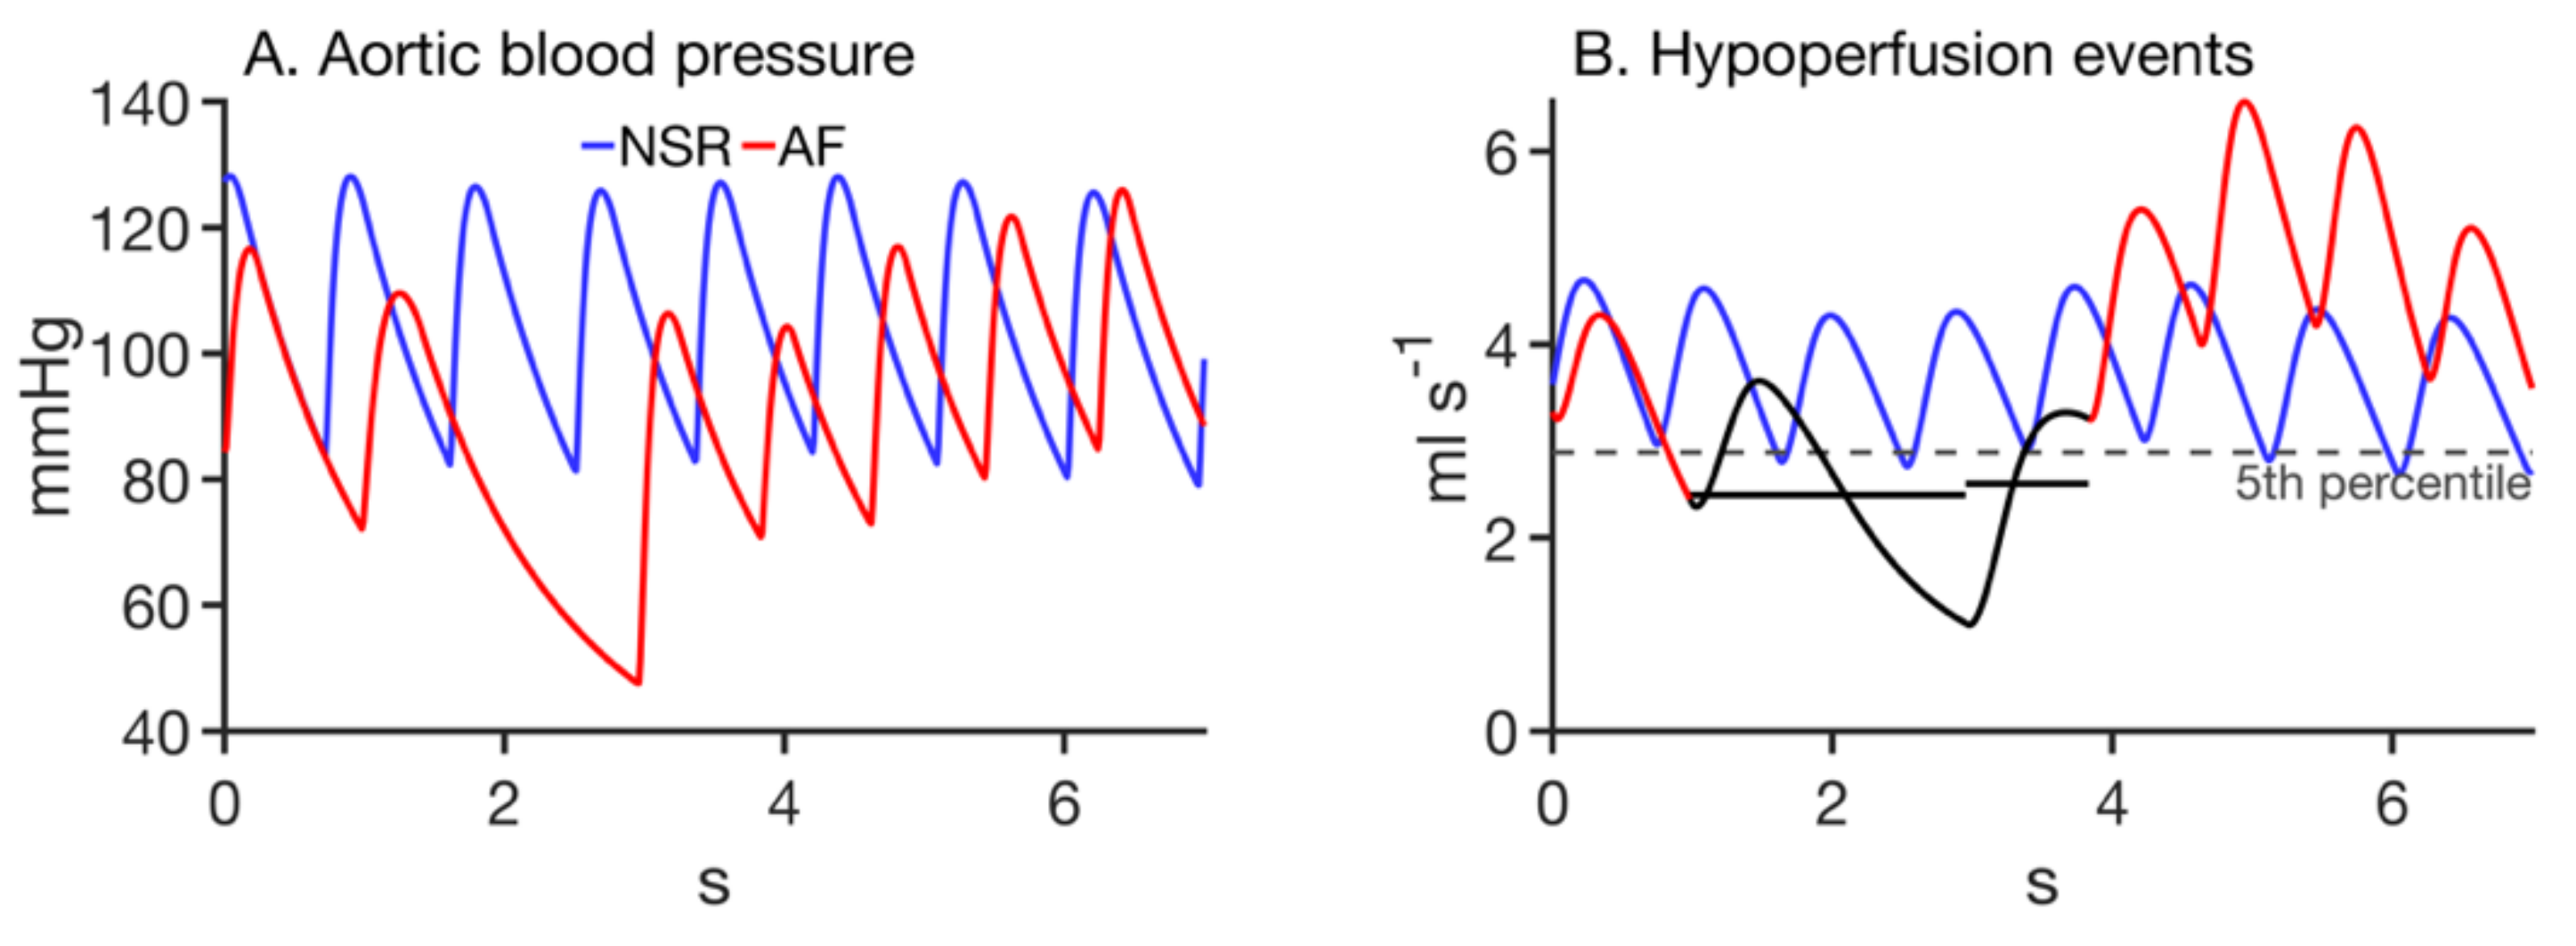
Sensitivity analysis is a tool that provides a comprehensive understanding of the workings of a computational model with respect to its parameters and a specified modelling outcome [23]. The model has 95 parameters, which include all resistances, compliances, vessel geometry attributes, time constants, and scaling factors. Parameters’ descriptions and acronyms, as well as their control values relevant to this work, are provided in Table 1. Model behavior was defined as the total number of hypoperfusion events in the distal cerebral circulation over a 5000-heartbeat simulation.
To permit sensitivity analysis, a control model population of 104 instances was constructed. To generate the population, 95 modelling parameters were each randomly sampled simultaneously from uniform distributions using a non-repetitive Mersenne Twister random number generator [24]. The sampling was constrained using Latin Hypercube Sampling [25]. The lower and upper limits adopted for each parameter’s uniform distribution were obtained by multiplying the literature value by 0.5. for the lower limit, and by 2.0 for the upper limit. The adopted limits provided a large range sampling for each parameter. The model parameters and model outputs were stored for further analysis. Sensitivity analysis, which ranked parameters according to their impact on model behavior, was performed using partial rank correlation coefficients (PRCC) [26].
To compute PRCC, the normally distributed parameters (xi), as well as the observed outputs (yi), were rank transformed. Then, the linear effects of other additional variables were accounted for by expressing each as a linear regression of the inputs:
x ^ j = a 0 + k = 1 k j N a k x k ,   a n d   y ^ j = b 0 + k = 1 k j N b k x k .
Using residuals defined as r x i = x j x ^ j and r y i = y j y ^ j , PRCC is defined as the correlation among these residuals normalized using their respective variances:
P R C C x i , y j = C o v r x i , r y j V a r r x i V a r r y j .
As evident in Equation (6), PRCC assumes an underlying statistical model that is linear (regression), and the assumption of monotonicity provides the strength of the linear relationship between a given pair of a parameter and an output [26,27]. The PRCC indices range from −1 to +1.

3. Results

Model output statistics are presented from a single simulation instance with CoW variant 1 (complete CoW) at 80 bpm in Table 2. The statistics from the AF case are shown to be similar to those in the NSR case. Median systemic blood pressures of 117.44/77.81 mmHg (systolic/diastolic) for NSR and 119.51/78.95 mmHg for AF are shown to be similar to physiological levels. Additionally, total cerebral blood flow is 12.54 mL s−1 for the NSR case and 12.31 mL s−1 for the AF case.
The model has demonstrated that large variations in blood pressure are propagated through the large arterial circulation and have a high impact on small vessels in the distal cerebral circulation, annotated as RA, LA, RM, LM, RP, and LP in Figure 2. This effect is demonstrated in Figure 5 where a drop in aortic blood pressure due to a long RR interval is associated with two consecutive hypoperfusion events. The example shows aortic blood pressure and simultaneous blood flow into the LM in a control and AF case, colored in blue and red, respectively. On panel A, the dip in blood pressure can be seen in the AF case between seconds 1 and 3. Corresponding with this dip, two hypoperfusion events are annotated with black in panel B, with horizontal lines indicating the mean blood flow value during the heartbeat to show that it is indeed below the fifth percentile of normal blood flow.
The heart rate and vascular geometry dependence of hypoperfusion events is illustrated in Figure 6. For each of the six common variants of the CoW, total hypoperfusion event counts are shown for simulations at imposed heart rates ranging from 50 to 130 bpm.
All variants displayed similar behavior within the range of heart rates examined, with some differences in the number of counts, as well as the point at which they have the highest hypoperfusion count. Variant 1, with a complete CoW, is represented in Figure 6A. This variant had a minimum count occurring at a heart rate of 50 bpm with 178 total events, and a maximum count at 120 bpm with 2048 total events. Variant two, with a missing PCoA, is represented in Figure 6B. This variant had a minimum count at 50 bpm with 264 events, and a maximum count at 120 bpm with 2248 events. Variant number three, with both PCoAs missing, is shown in Figure 6C. It had a minimum count at 50 bpm with 268 events, and a maximum count at 130 bpm with 2120 events. Variant four, with a missing ACA1, is represented in Figure 6D. This variant had a minimum count at 50 bpm with 675 events, and a maximum count at 110 bpm with 2861 events. Variant five, with a missing PCA1, is represented in Figure 6E. This variant had a minimum count at 50 bpm with 211 events, and a maximum count at 120 bpm with 2458 events. Variant six, with a missing PCoA and contralateral PCA1, is represented in Figure 6F. This variant had a minimum count at 50 bpm with 97 events, and a maximum count at 110 bpm with 2386 events. All variants had minimum counts at a 50 bpm heart rate. Maximum points varied between different variants, although all were within 110 to 130 bpm. Variant 3 is notable in that there is no count drop off at 130 bpm as there is in all other variants. Overall, all variants exhibit similar behavior, increasing count with bpm, up to a maximum around 120 bpm.
Figure 7 illustrates alterations in cerebral blood flow heterogeneity between the six variants. Under AF conditions, the left middle, left anterior, and left posterior regions experience a balanced outflow in variants 1 through 4 (Figure 7A–D), indicating virtually uniform cerebral perfusion. Alternatively, variants 5 and 6 show flow patterns that are more irregular. Both these variants also have either out-of-phase or negative-flow amplitude in the LP region relative to the other two regions shown. Additionally, flow oscillations in the LP region for these two variants have much larger amplitudes than flow to the other regions and compared to all flow in the other variants.
As illustrated in Figure 8, the maximal PRCC values regarding hypoperfusion count are the intrinsic heart rate (HR0), Ediasrv, Esysrv, Gaut, and Ediasra. Notably, HR0 ranked the highest for each variant, with varying amplitudes across the variants. Additionally, mechanical characteristics of the right ventricle and atria have high PRCC values, i.e., Ediasrv, Esysrv, Ediasra, and Esysra. Gaut and tauaut, which are both parameters that play a role in the cerebral autoregulation mechanism, also have high PRCC values for all variants.

4. Discussion

While current treatment methods for AF, such as heart rate control and atrial ablation, are assessed based on treatment mortality, there is growing evidence that other factors, such as the impact on cognitive function, should be considered [2]. As research continues in this field, the results of the present study suggest that the cerebrovascular structure should be considered in treatment planning to ensure better clinical outcomes.
The present model is a composite of previously published models. It is based on established biophysical modelling techniques, i.e., lumped-parameter modelling using windkessel compartments. The components have been used previously to model a variety of disease cases, including AF. While direct model validation with in vivo data was not within the scope of the study, model outputs were presented for comparison with published values. Median arterial blood pressures (systolic/diastolic) were 117.44/77.81 mmHg and 119.51/78.95 mmHg for NSR and AF, respectively, which are considered to be within healthy ranges. Additionally, blood flow in major cerebral arteries is presented for comparison with measured values published by Zarrinkoob et al. [28]. Zarrinkoob reports blood flow in the ACA, MCA, and PCA to be 12%, 21%, and 8% of total CBF, respectively. The model shows corresponding values of 8%, 29%, and 12% for the NSR case, and 8%, 30%, and 12% for the AF case. Therefore, the model reflects clinically measured blood flow distribution, with predominant blood flow occurring in the MCA.
Variations from regular blood pressure in large arteries due to AF were shown to be associated with large changes in blood flow in the distal circulation of the brain (Figure 5). These changes lead to occurrences of critical hypoperfusion events in the brain, which may lead to silent cerebral ischemia, damaging brain tissue over time. The present modelling of this phenomenon is in agreement with previous works [1,4,12], and is the primary motivation for further investigation into the impacts of AF with respect to the cerebral circulation. Additionally, in Figure 5, it can be observed that the initial hypoperfusion seen at 2–4 s is followed by hyperperfusion from 4–7 s. This is to be expected because of the reflexive nature of the autoregulation mechanism. The autoregulatory function modulates the resistance and compliance of the downstream cerebral vessels within which the blood flow is being observed. The autoregulation function acts on a time scale of approximately 20 s, therefore there is a small delay between the drop in blood flow and the response of decreased resistance and increased compliance. This small delay in autoregulation function is thought to be the reason spontaneous drops in arterial pressure due to irregular heartbeats can cause transient hypoperfusion in the brain.
The result illustrated in Figure 6 shows that all considered CoW variants follow largely the same pattern with respect to the effect of heart rate on hypoperfusion frequency. All variants had a minimum hypoperfusion count at 50 bpm (in the heart rates considered), with the maximum occurring around 120 bpm. The most consequential result from this section is the result from variant 4, shown in Figure 6D. Variant 4 has a minimum hypoperfusion count of 675 at 50 bpm, which is over 2.5 times higher than variant 3, which has the next highest minimum. This demonstrates that although patients with CoW variant 4 may respond to a heart rate control strategy, it may not be sufficient to protect against hypoperfusion in the distal circulation of the brain. Based on this result, it is recommended that for patients with variant 4 of the CoW, alternative treatment methods be used in addition to, or instead of, heart rate control, in order to avoid ischemic cerebral damage.
It should be noted that this finding, along with previous modelling results [12], contradicts the recommendation made based on the RACE II trial [13]. The study found that relative to strict rate control, lenient rate control was as effective in preventing mortality and other outcomes, and was easier to achieve. This finding has informed clinicians on rate control strategies in relation to preventing mortality in recent years. However, cognitive impairment/dementia was not considered to be outcomes of this study, and heart rate had not yet been linked to hypoperfusion events associated with AF. Therefore, there is now growing evidence supporting strict rate control for preventing deleterious cognitive outcomes.
It was shown that certain variants could lead to increased heterogeneity in cerebral blood flow, with increased blood flow in some regions, and decreased in others (Figure 7). In particular, both variants with a missing PCA1 segment (variants 5 and 6) displayed heterogeneous flow patterns, as well as having larger amplitudes of the oscillatory flow rate than the other variants. This indicates that the PCA1 segment plays a key role in the distribution of blood flow with respect to homogeneity among the distal cerebral vessels. Although the large oscillations in blood flow to the left posterior circulation present in these variants are not considered harmful by the metric of hypoperfusion events, which is the primary focus of this study, they may lead to detrimental outcomes via other mechanisms, such as abnormal wall shear stress or acute hypertension. These phenomena will be further investigated in future work.
Sensitivity analysis, as shown in Figure 8, shows the model parameters that have the largest impact on modelling outcomes, namely the hypoperfusion event frequency. It was shown that in all cases of variant CoWs, HR0 had the highest PRCC value, meaning that it is the parameter that most influences the hypoperfusion event frequency. This was expected, as heart rate control has been shown to be an effective method for decreasing hypoperfusion events [12,22]. In all variants, elastance values for the right heart were among the parameters with the largest PRCC values. This is an indication that the function of the right heart is strongly related to cerebral hypoperfusion outcomes, and warrants further study.
The present work is an investigation into the impact of AF on cerebral circulation considering common cases of congenital variations to the CoW. The presented model considers AF in the absence of other common cardiovascular conditions such as hypertension or atherosclerosis and represents simple cases of missing arterial segments, for the purposes of direct comparison. The model components have previously been used to study such conditions as hypertension, atherosclerotic lesions, and arterial occlusions. Additionally, small variations in cerebrovascular structure can be trivially modelled by assigning modified resistances to blood vessels. Future work will focus on incorporating these common conditions into our modelling, to further understand the impact of AF on cerebral circulation. Previously used techniques for representing populations using 0D models will be employed to elucidate the impacts of varied cerebrovascular structures [11].
In a clinical environment, it is critical for computational models to be applicable on a patient-specific basis. Methods for the incorporation of imaging data into 0D blood flow models are currently under development and will be used to further assess the impact of variant vascular structures using patient-specific data [8,29]. Such methods will also be effective in the clinic, opening up the possibility of patient-specific assessments for persistent AF patients. The presented model is extensible and personalizable, which will permit patient-specific risk stratification [30]. Further investigation will be conducted using spatially resolved 1D modelling to investigate the impacts of these phenomena on the blood vessels as well as the surrounding tissue in greater detail.

Author Contributions

Conceptualization, T.J.H., S.R.K. and D.G.; methodology, T.J.H. and S.R.K.; software, T.J.H. and J.J.J.; formal analysis, T.J.H.; original draft, T.J.H.; final manuscript, T.J.H., U.A., C.W.M. and D.G.; visualization, T.J.H.; supervision, D.G. and C.W.M.; project administration, S.R.K.; funding acquisition, C.W.M., D.G., and S.R.K.; All authors have read and agreed to the published version of the manuscript.

Funding

This research was funded by Canarie Inc. (#RS3-111, SRK, CWM, DG), the Canada Heart and Stroke Foundation (G-20-0028717, CWM), and the Canada NSERC operational grant (#R4081A03, DG).

Institutional Review Board Statement

Not applicable.

Informed Consent Statement

Not applicable.

Data Availability Statement

The source code to reproduce all results presented in this work is openly provided in the lab’s github: https://github.com/mccsssk2/MDPI2021_TH_CircleofWillis (accessed on 31 December 2021).

Acknowledgments

We thank Compute Canada for unrestricted compute access to S.R.K. We thank Lawson and Western University I.T. services for their support. We thank members of the McIntyre lab, Goldman labx, Kharche lab, and many others for many in-depth discussions.

Conflicts of Interest

The authors declare no conflict of interest. The funders had no role in the design of the study; in the collection, analyses, or interpretation of data; in the writing of the manuscript, or in the decision to publish the results.

References

  1. Hunter, T.J.; Joseph, J.J.; Anazodo, U.; Kharche, S.R.; McIntyre, C.W.; Goldman, D. Computational modelling of the role of atrial fibrillation on cerebral blood perfusion. In Functional Imaging and Modeling of the Heart; Ennis, D.B., Perotti, L.E., Wang, V.Y., Eds.; Springer International Publishing: Cham, Switzerland, 2021; Volume 12738 LNCS, pp. 679–686. [Google Scholar]
  2. De Bruijn, R.F.A.G.; Heeringa, J.; Wolters, F.J.; Franco, O.H.; Stricker, B.H.C.; Hofman, A.; Koudstaal, P.J.; Ikram, M.A. Association Between Atrial Fibrillation and Dementia in the General Population. JAMA Neurol. 2015, 72, 1288–1294. [Google Scholar] [CrossRef] [PubMed]
  3. Gardarsdottir, M.; Sigurdsson, S.; Aspelund, T.; Rokita, H.; Launer, L.J.; Gudnason, V.; Arnar, D.O. Atrial fibrillation is associated with decreased total cerebral blood flow and brain perfusion. EP Eur. 2018, 20, 1252–1258. [Google Scholar] [CrossRef] [PubMed]
  4. Anselmino, M.; Scarsoglio, S.; Saglietto, A.; Gaita, F.; Ridolfi, L. Transient cerebral hypoperfusion and hypertensive events during atrial fibrillation: A plausible mechanism for cognitive impairment. Sci. Rep. 2016, 6, 8635. [Google Scholar] [CrossRef]
  5. Anazodo, U.C.; Shoemaker, J.K.; Suskin, N.; St. Lawrence, K.S. An investigation of changes in regional gray matter volume in cardiovascular disease patients, pre and post cardiovascular rehabilitation. Neuroimage 2013, 3, 388. [Google Scholar] [CrossRef] [Green Version]
  6. Steinman, D.A.; Poepping, T.L.; Tambasco, M.; Rankin, R.N.; Holdsworth, D.W. Flow Patterns at the Stenosed Carotid Bifurcation: Effect of Concentric versus Eccentric Stenosis. Ann. Biomed. Eng. 2000, 28, 415–423. [Google Scholar] [CrossRef] [Green Version]
  7. Alastruey, J.; Parker, K.H.; Peiró, J.; Byrd, S.M.; Sherwin, S.J. Modelling the circle of Willis to assess the effects of anatomical variations and occlusions on cerebral flows. J. Biomech. 2007, 40, 1794–1805. [Google Scholar] [CrossRef] [PubMed]
  8. Antiga, L.; Piccinelli, M.; Botti, L.; Ene-Iordache, B.; Remuzzi, A.; Steinman, D.A. An image-based modeling framework for patient-specific computational hemodynamics. Med. Biol. Eng. Comput. 2008, 46, 1097–1112. [Google Scholar] [CrossRef] [PubMed] [Green Version]
  9. Lan, H.; Updegrove, A.; Wilson, N.M.; Maher, G.D.; Shadden, S.C.; Marsden, A.L. A Re-Engineered Software Interface and Workflow for the Open-Source SimVascular Cardiovascular Modeling Package. J. Biomech. Eng. 2018, 140, 024501. [Google Scholar] [CrossRef] [Green Version]
  10. Altamirano-Diaz, L.; Kassay, A.D.; Serajelahi, B.; McIntyre, C.W.; Filler, G.; Kharche, S.R. Arterial Hypertension and Unusual Ascending Aortic Dilatation in a Neonate with Acute Kidney Injury: Mechanistic Computer Modeling. Front. Physiol. 2019, 10, 1391. [Google Scholar] [CrossRef]
  11. Joseph, J.J.; Hunter, T.J.; Sun, C.; Goldman, D.; Kharche, S.R.; McIntyre, C.W. Using a Human Circulation Mathematical Model to Simulate the Effects of Hemodialysis and Therapeutic Hypothermia. Appl. Sci. 2021, 12, 307. [Google Scholar] [CrossRef]
  12. Saglietto, A.; Scarsoglio, S.; Ridolfi, L.; Gaita, F.; Anselmino, M. Higher ventricular rate during atrial fibrillation relates to increased cerebral hypoperfusions and hypertensive events. Sci. Rep. 2019, 9, 1–9. [Google Scholar] [CrossRef] [Green Version]
  13. Van Gelder, I.C.; Groenveld, H.F.; Crijns, H.J.G.M.; Tuininga, Y.S.; Tijssen, J.G.P.; Alings, A.M.; Hillege, H.L.; Bergsma-Kadijk, J.A.; Cornel, J.H.; Kamp, O.; et al. Lenient versus Strict Rate Control in Patients with Atrial Fibrillation. N. Engl. J. Med. 2010, 362, 1363–1373. [Google Scholar] [CrossRef] [Green Version]
  14. Heldt, T. Computational Models of Cardiovascular Response to Orthostatic Stress. Ph.D. Dissertation, Massacheusetts Institute of Technology, Cambridge, MA, USA, 2004. [Google Scholar]
  15. Lin, J.; Ngwompo, R.F.; Tilley, D.G. Development of a cardiopulmonary mathematical model incorporating a baro-chemoreceptor reflex control system. Proc. Inst. Mech. Eng. Part H J. Eng. Med. 2012, 226, 787–803. [Google Scholar] [CrossRef] [PubMed] [Green Version]
  16. Ursino, M.; Giannessi, M. A model of cerebrovascular reactivity including the circle of Willis and cortical anastomoses. Ann. Biomed. Eng. 2010, 38, 955–974. [Google Scholar] [CrossRef]
  17. Hennig, T.; Maass, P.; Hayano, J.; Heinrichs, S.; Hennig, T.; Maass, P.; Hayano, J.; Heinrichs, S. Exponential Distribution of Long Heart Beat Intervals During Atrial Fibrillation and Their Relevance for White Noise Behaviour in Power Spectrum. J. Biol. Phys. 2006, 32, 383–392. [Google Scholar] [CrossRef] [PubMed] [Green Version]
  18. Scarsoglio, S.; Guala, A.; Camporeale, C.; Ridolfi, L. Impact of atrial fibrillation on the cardiovascular system through a lumped-parameter approach. Med. Biol. Eng. Comput. 2014, 52, 905–920. [Google Scholar] [CrossRef] [PubMed] [Green Version]
  19. Anselmino, M.; Scarsoglio, S.; Saglietto, A.; Gaita, F.; Ridolfi, L. A computational study on the relation between resting heart rate and atrial fibrillation hemodynamics under exercise. PLoS ONE 2017, 12, e0169967. [Google Scholar] [CrossRef] [PubMed]
  20. Hindmarsh, A.C.; Brown, P.N.; Grant, K.E.; Lee, S.L.; Serban, R.; Shumaker, D.E.; Woodward, C.S. SUNDIALS: Suite of nonlinear and differential/algebraic equation solvers. ACM Trans. Math. Softw. 2005, 31, 363–396. [Google Scholar] [CrossRef]
  21. Tange, O. GNU Parallel 2018. Available online: https://zenodo.org/record/1146014#.YgJqUerMKUl (accessed on 31 December 2021). [CrossRef]
  22. Pianelli, M.; Scaglione, M.; Anselmino, M.; Caponi, D.; Garcia, P.; Cesarani, F.; Toso, E.; Raimondo, C.; Halimi, F.; Leclercq, J.F.; et al. Delaying cardioversion following 4-week anticoagulation in case of persistent atrial fibrillation after a transcatheter ablation procedure to reduce silent cerebral thromboembolism: A single-center pilot study. J. Cardiovasc. Med. 2011, 12, 785–789. [Google Scholar] [CrossRef]
  23. Kharche, S.R.; Mironova, G.Y.; Goldman, D.; McIntyre, C.W.; Welsh, D.G. Sensitivity analysis of a smooth muscle cell electrophysiological model. In Functional Imaging and Modeling of the Heart; Ennis, D.B., Perotti, L.E., Wang, V.Y., Eds.; Springer International Publishing: Cham, Switzerland, 2021; Volume 12738 LNCS, pp. 540–550. [Google Scholar]
  24. Matsumoto, M.; Nishimura, T. Mersenne twister. ACM Trans. Model. Comput. Simul. 1998, 8, 3–30. [Google Scholar] [CrossRef] [Green Version]
  25. Malone, B.P.; Minansy, B.; Brungard, C. Some methods to improve the utility of conditioned Latin hypercube sampling. PeerJ 2019, 7, e6451. [Google Scholar] [CrossRef] [PubMed]
  26. Kharche, S.; Lüdtke, N.; Panzeri, S.; Zhang, H. A global sensitivity index for biophysically detailed cardiac cell models: A computational approach. In Functional Imaging and Modeling of the Heart; Ayache, N., Delingette, H., Sermesant, M., Eds.; Springer: Berlin/Heidelberg, Germany, 2009; pp. 366–375. [Google Scholar]
  27. Hamby, D.M. A comparison of sensitivity analysis techniques. Health Phys. 1995, 68, 195–204. [Google Scholar] [CrossRef] [PubMed] [Green Version]
  28. Zarrinkoob, L.; Ambarki, K.; Wåhlin, A.; Birgander, R.; Eklund, A.; Malm, J. Blood flow distribution in cerebral arteries. J. Cereb. Blood Flow Metab. 2015, 35, 648–654. [Google Scholar] [CrossRef] [PubMed] [Green Version]
  29. Joseph, J.J.; Lee, T.-Y.; Goldman, D.; McIntyre, C.W.; Kharche, S.R. The role of extra-coronary vascular conditions that affect coronary fractional flow reserve estimation. In Functional Imaging and Modeling of the Heart; Ennis, D.B., Perotti, L.E., Wang, V.Y., Eds.; Springer International Publishing: Cham, Switzerland, 2021; Volume 12738 LNCS, pp. 595–604. [Google Scholar]
  30. Grande Gutierrez, N. Hemodynamic Based Thrombotic Risk Stratification in Kawasaki Disease Patients with Coronary Artery Aneurysms. Ph.D. Dissertation, Stanford University, Stanford, CA, USA, 2019. [Google Scholar]
Figure 1. Caricature of the whole-body blood flow model. The cerebral model (black box, bold, top) is expanded in Figure 2.
Applsci 12 01750 g001
Figure 2. Cerebral arterial architecture consisting of all Circle of Willis arteries. RA: Right anterior artery; LA: Left anterior artery; RM: Right middle artery; LM: Left middle artery; RP: Right posterior artery; LP: Left posterior artery; ACA1: Pre-communicating anterior cerebral artery; PCoA: Posterior communicating artery; and PCA1: Pre-communicating posterior cerebral artery.
Applsci 12 01750 g002
Figure 3. Caricature representations of all the common CoW variants. Variant 1 has all CoW vessels. Variant 2 has a missing posterior communicating artery (PCoA). Variant 3 has both missing PCoAs. Variant 4 has a missing precommunicating anterior cerebral artery, ACA1, segment. Variant 5 has a missing precommunicating posterior cerebral artery, PCA1, segment. Variant 6 has a missing PCoA and contralateral PCA1 segment.
Applsci 12 01750 g003
Figure 4. Stochastic RR interval assignment. Top row: Probability distribution functions for sampled RR intervals in NSR (A) and AF (B) at shown heart rates. (C) Sampled RR intervals with mean of 70 bpm over the span of 5000 beats under NSR (blue line) and AF (red line) conditions.
Applsci 12 01750 g004
Figure 5. Hemodynamic outputs of a simulation of AF (red) and NSR (blue) at 70 bpm in the normal CoW. (A) Aortic blood pressures. (B) Blood flow through the left middle distal artery with hypoperfusion events shown in black.
Applsci 12 01750 g005
Figure 6. Absolute frequencies of hypoperfusion events in the distal cerebral circulations at varying heart rates under AF conditions. Count is the sum of all hypoperfusion events in each of the six distal circulation regions over a 5000 heart-beat simulation. Each panel shows hypoperfusion counts for heart rates from 50 bpm to 130 bpm for a particular CoW variant. (A) Complete CoW. (B) Missing PCoA. (C) Missing both PCoAs. (D) Missing ACA. (E) Missing PCA. (F) Missing PCoA and PCA.
Applsci 12 01750 g006
Figure 7. Perfusion to distal regions of the brain, represented by outflow at three distinct vessel terminals. Color coding for all panels is provided in (B). In all panels, red line represents flow at the terminal of left middle artery, blue lines represent flow at the terminal of left posterior artery, and black line represents flow at the terminal of left anterior artery. Each panel illustrates blood flow in a particular CoW variant. (A) Complete CoW. (B) Missing PCoA. (C) Missing both PCoAs. (D) Missing ACA. (E) Missing PCA. (F) Missing PCoA and PCA.
Applsci 12 01750 g007
Figure 8. PRCCs for hypoperfusion count for each of the six considered CoW variants. The 10 PRCC values with the greatest magnitude are shown for each case and are ordered from greatest to least magnitude. Symbols are described in Table 1. Each panel illustrates PRCC analysis for a particular CoW variant. (A) Complete CoW. (B) Missing PCoA. (C) Missing both PCoAs. (D) Missing ACA. (E) Missing PCA. (F) Missing PCoA and PCA.
Applsci 12 01750 g008
Table 1. Relevant model parameters.
ParameterDescriptionBaseline Value
Whole-body circulation
HR0Intrinsic heart rate75 bpm
EdiasrvRight ventricular diastolic elastance.0.07 (mmHg ml−1)
EsysrvRight ventricular systolic elastance.1.3 (mmHg ml−1)
EsysraRight atrial systolic elastance.0.74 (mmHg ml−1)
EdiasraRight atrial diastolic elastance.0.3 (mmHg ml−1)
EdiaslvLeft ventricular diastolic elastance.0.13 (mmHg ml−1)
RpvPulmonary venous resistance.0.01 (mmHg s ml−1)
Cerebral circulation
GautAutoregulation function gain.0.9 (unitless)
tauautAutoregulation function time constant.20 (s)
CdDistal cerebral arterial compliance.200 (ml mmHg−1)
kRDistal cerebral resistance scaling term.13,100 (mmHg−3 s ml−1)
Table 2. Model outputs under NSR conditions.
Output NameOutput Values
NSRAF
Pa,sys (mmHg)117.44 ± 21.35119.51 ± 17.45
Pa,dias (mmHg)77.81 ± 15.8578.95 ± 16.64
QACA (ml s−1)0.99 ± 0.370.95 ± 0.45
QMCA (ml s−1)3.68 ± 1.213.64 ± 1.37
QPCA (ml s−1)1.47 ± 0.521.44 ± 0.59
CBF (ml s−1)12.54 ± 4.2412.31 ± 4.78
Model output statistics for a simulation run with CoW variant 1 (complete CoW), at an HR of 80 BPM under AF and NSR conditions. Systemic pressure and cerebral blood flow statistics are shown to be similar in both NSR and AF cases. Values are shown as median ± standard deviation. Pa,sys: Arterial systolic pressure; Pa,dias: Arterial diastolic pressure; QACA: Anterior cerebral artery flow rate; QMCA: Middle cerebral artery flow rate; QPCA: Posterior cerebral artery flow rate; CBF: Cerebral blood flow.
Publisher’s Note: MDPI stays neutral with regard to jurisdictional claims in published maps and institutional affiliations.

