
The Characteristics of Seismic Rotations in VTI Medium


1
“MWMC” Group, School of Geophysics and Information Technology, China University of Geosciences, Beijing 100083, China
2
Fujian Earthquake Agency, China Earthquake Administration, Fuzhou 350003, China
*
Author to whom correspondence should be addressed.
Appl. Sci. 2021, 11(22), 10845; https://0-doi-org.brum.beds.ac.uk/10.3390/app112210845
Submission received: 12 October 2021
/
Revised: 30 October 2021
/
Accepted: 10 November 2021
/
Published: 17 November 2021
(This article belongs to the Special Issue Technological Advances in Seismic Data Processing and Imaging)
Abstract
:Under the assumptions of linear elasticity and small deformation in traditional elastodynamics, the anisotropy of the medium has a significant effect on rotations observed during earthquakes. Based on the basic theory of the first-order velocity-stress elastic wave equation, this paper simulates the seismic wave propagation of the translational and rotational motions in two-dimensional isotropic and VTI (transverse isotropic media with a vertical axis of symmetry) media under different source mechanisms with the staggered-grid finite-difference method with respect to nine different seismological models. Through comparing the similarities and differences between the translational and rotational components of the wave fields, this paper focuses on the influence of anisotropic parameters on the amplitude and phase characteristics of the rotations. We verify that the energy of S waves in the rotational components is significantly stronger than that of P waves, and the response of rotations to the anisotropic parameters is more sensitive. There is more abundant information in the high-frequency band of the rotational components. With the increase of Thomsen anisotropic parameters ε and δ, the energy of the rotations increases gradually, which means that the rotational component observation may be helpful to the study of anisotropic parameters.
1. Introduction
It is well known that the six-component records of ground motion include three-component translations and three-component rotations [1]. In the past two decades, with the development of rotational seismometers, the observation of rotations has gradually increased, and rotations caused by earthquakes have attracted increasing attention in the scientific and seismic engineering fields, and great progress has been made in both theoretical research and practical applications [2,3,4,5,6].
In order to study the mechanism of seismological rotations, many meaningful inquiries have been made by means of indirect calculation, direct observation, and numerical simulation. Aiming at the Newport–Inglewood (NI) fault in America, Wang et al. [7] used a finite-difference method to simulate several earthquakes with magnitude 7 in different hypocenters, and found the influence of source and receiving geological conditions on the rotations. They also found that the variations of the source produce a great effect on the rotations. Therefore, rotational observations may contribute to the exploration of the mechanism of NI earthquakes. Ferreira et al. [8] simulated the rotations recorded at the fundamental mode of surface waves with the full ray theory (FRT) for laterally smooth heterogeneous Earth models, and found that the synthetic seismograms showed good agreement with the real ones. With the joint observations of rotation rates and accelerations, the one-dimensional S-wave velocity at the observing locations can be obtained. Pham et al. [9] calculated the amplitudes of rotational rates based on the Kelvin–Christoffel equations and found that the rotational rates caused by anisotropies were large enough in strong earthquakes to predict the underground structures and constrain anisotropic parameters. Tang et al. [10] developed a new method, the generalized reflection and transmission coefficient method, which could obtain the translational and rotational synthetic seismograms in VTI media.
Barak et al. [11] performed a synthetic seismic experiment on a simple two-layer model of a water-covered seabed, where there were isolated high-velocity spheres different from the background medium. They found that the energy of the Scholte waves on rotational components was stronger than that on translational components, which would be helpful to identify different modes of waves and separate the surface waves from the body waves. More importantly, with seven-component seismic data, including the pressure components recorded by hydrophones, displacements recorded by three-component geophones, and rotations recorded by three-component rotational seismometers, their analyses presented the possibility to recover the vector characteristics of wave fields. Additionally, we previously discuss the differences between body waves and surface waves projected on the rotational components in 2D isotropic media [12], and Zhang et al. [13] found that the responses of the anomalies with a lower velocity were more obvious on the rotational components than on the translational components, and the energy of the shear waves on rotational components was stronger than that of P waves.
Although there is much research about rotations at present, the characteristics of rotations in transverse isotropic media with a vertical axis of symmetry (VTI) have not yet been clarified, and the influence of the anisotropic parameters on rotations is still unclear. In order to study the characteristics of the rotations generated from different sources in VTI media and explore the significance of rotations to the research of anisotropic parameters, we simulate the seismic rotations and translations based on the first-order velocity-stress equations using the staggered-grid finite-difference method in 2D VTI medium, analyze the similarities and differences between translations and rotations, and focus on the influence of the Thomsen parameters [14] on rotations so as to promote the relationship of the rotations and the anisotropies of the media, which can be helpful for the wave–field separation, inversion of the anisotropic parameters and the study of the earthquake source mechanism.
2. Theoretical Foundations
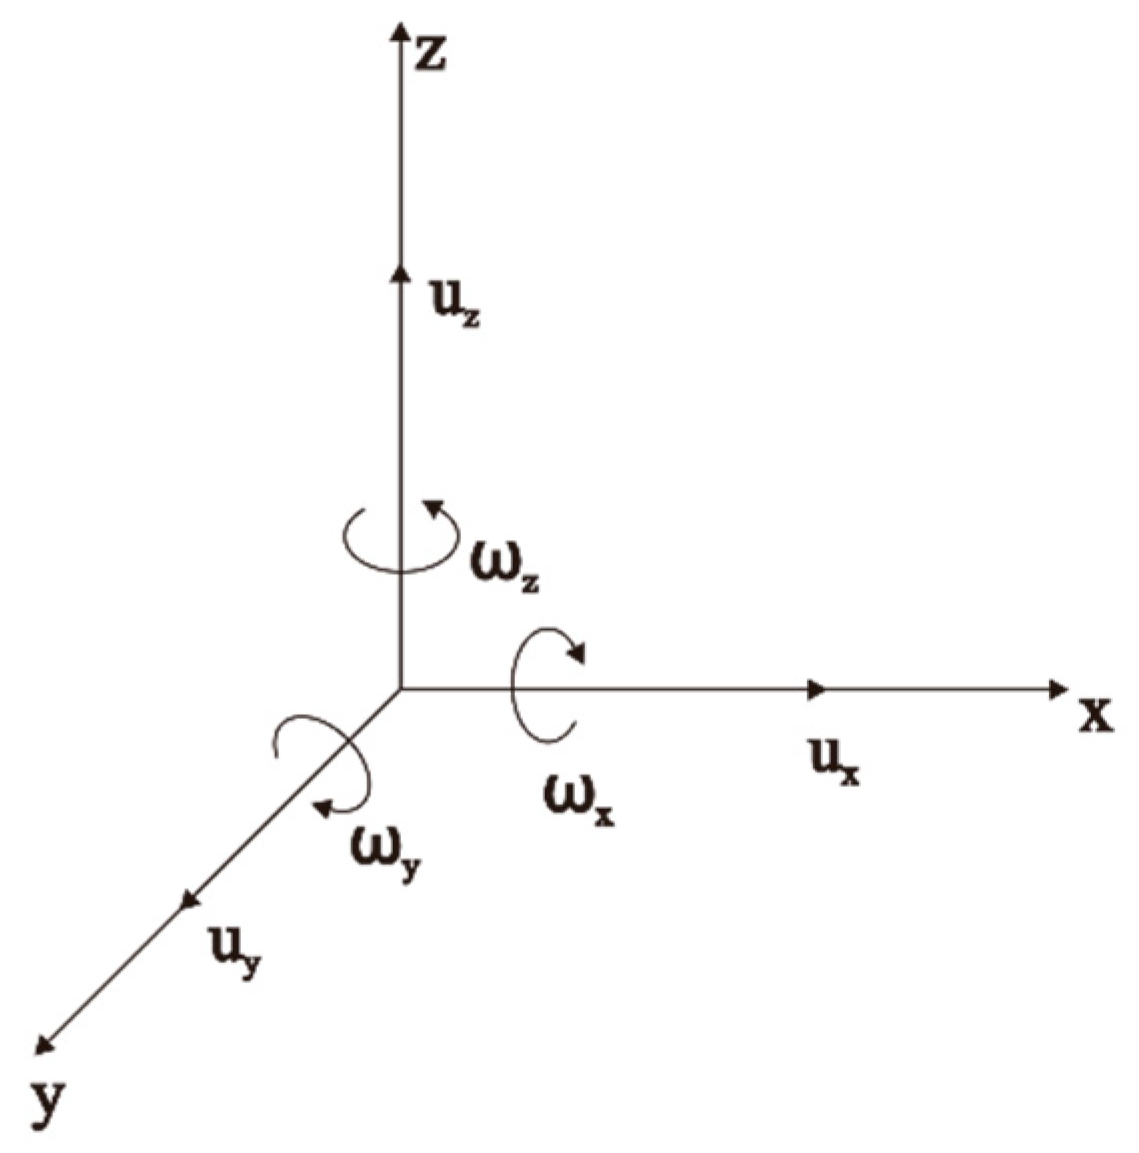
Ground motion includes not only three components of linear displacements but also three components of rotation in three-dimensional Cartesian coordinates (Figure 1). The rotation tensor, the curl of the displacement field, is expressed as:
where is the rotation tensor and is the displacement tensor.
In a two-dimensional plane, the seismic wave fields can be presented as two translational components, X and Z components, and a rotational component, . In order to correlate with the general seismic velocity observation, the rotation rate vector can be expressed as:
where and are the X and Z components of the velocity, respectively; x and z are the coordinates on the Cartesian system.
Using the staggered-grid finite-difference method [15], under the assumptions of linear elasticity and small deformation, the one-order velocity-stress equations of the elastic waves in 2D VTI medium can be expressed as:
where , and are three stress components, t is time, is density; , , and are elastic coefficients, which can be calculated with [14]:
where and are the velocity of the P and S waves, respectively, and and are the anisotropic parameters. We define different VTI models by giving different Thomsen parameters to study the influence of anisotropic parameters on the translational and rotational components. When and , Equation (3) corresponds to an isotropic medium.
Based on Equations (2)–(4), we simulate the seismic waves in discrete models with the grids at second-order time and twelfth-order space differential approximations. In addition, we use the Ricker wavelet with a 60 Hz central frequency to simulate the explosion source, the radial concentrated force source, the vertical concentrated force source, and the shear source, respectively. Furthermore, we utilize the splitting form of perfectly matched absorbing layer boundary condition (SPML) [16] to weaken the boundary reflections.
3. Synthetic Examples
In order to study the influence of the source mechanism on rotations, we defined model 1 as a 2D isotropic full-space homogeneous elastic medium, as illustrated in Table 1. Since P waves theoretically do not generate rotational motion in isotropic media [9], we compared the translational and rotational components generated from the concentrated force and the shear source.
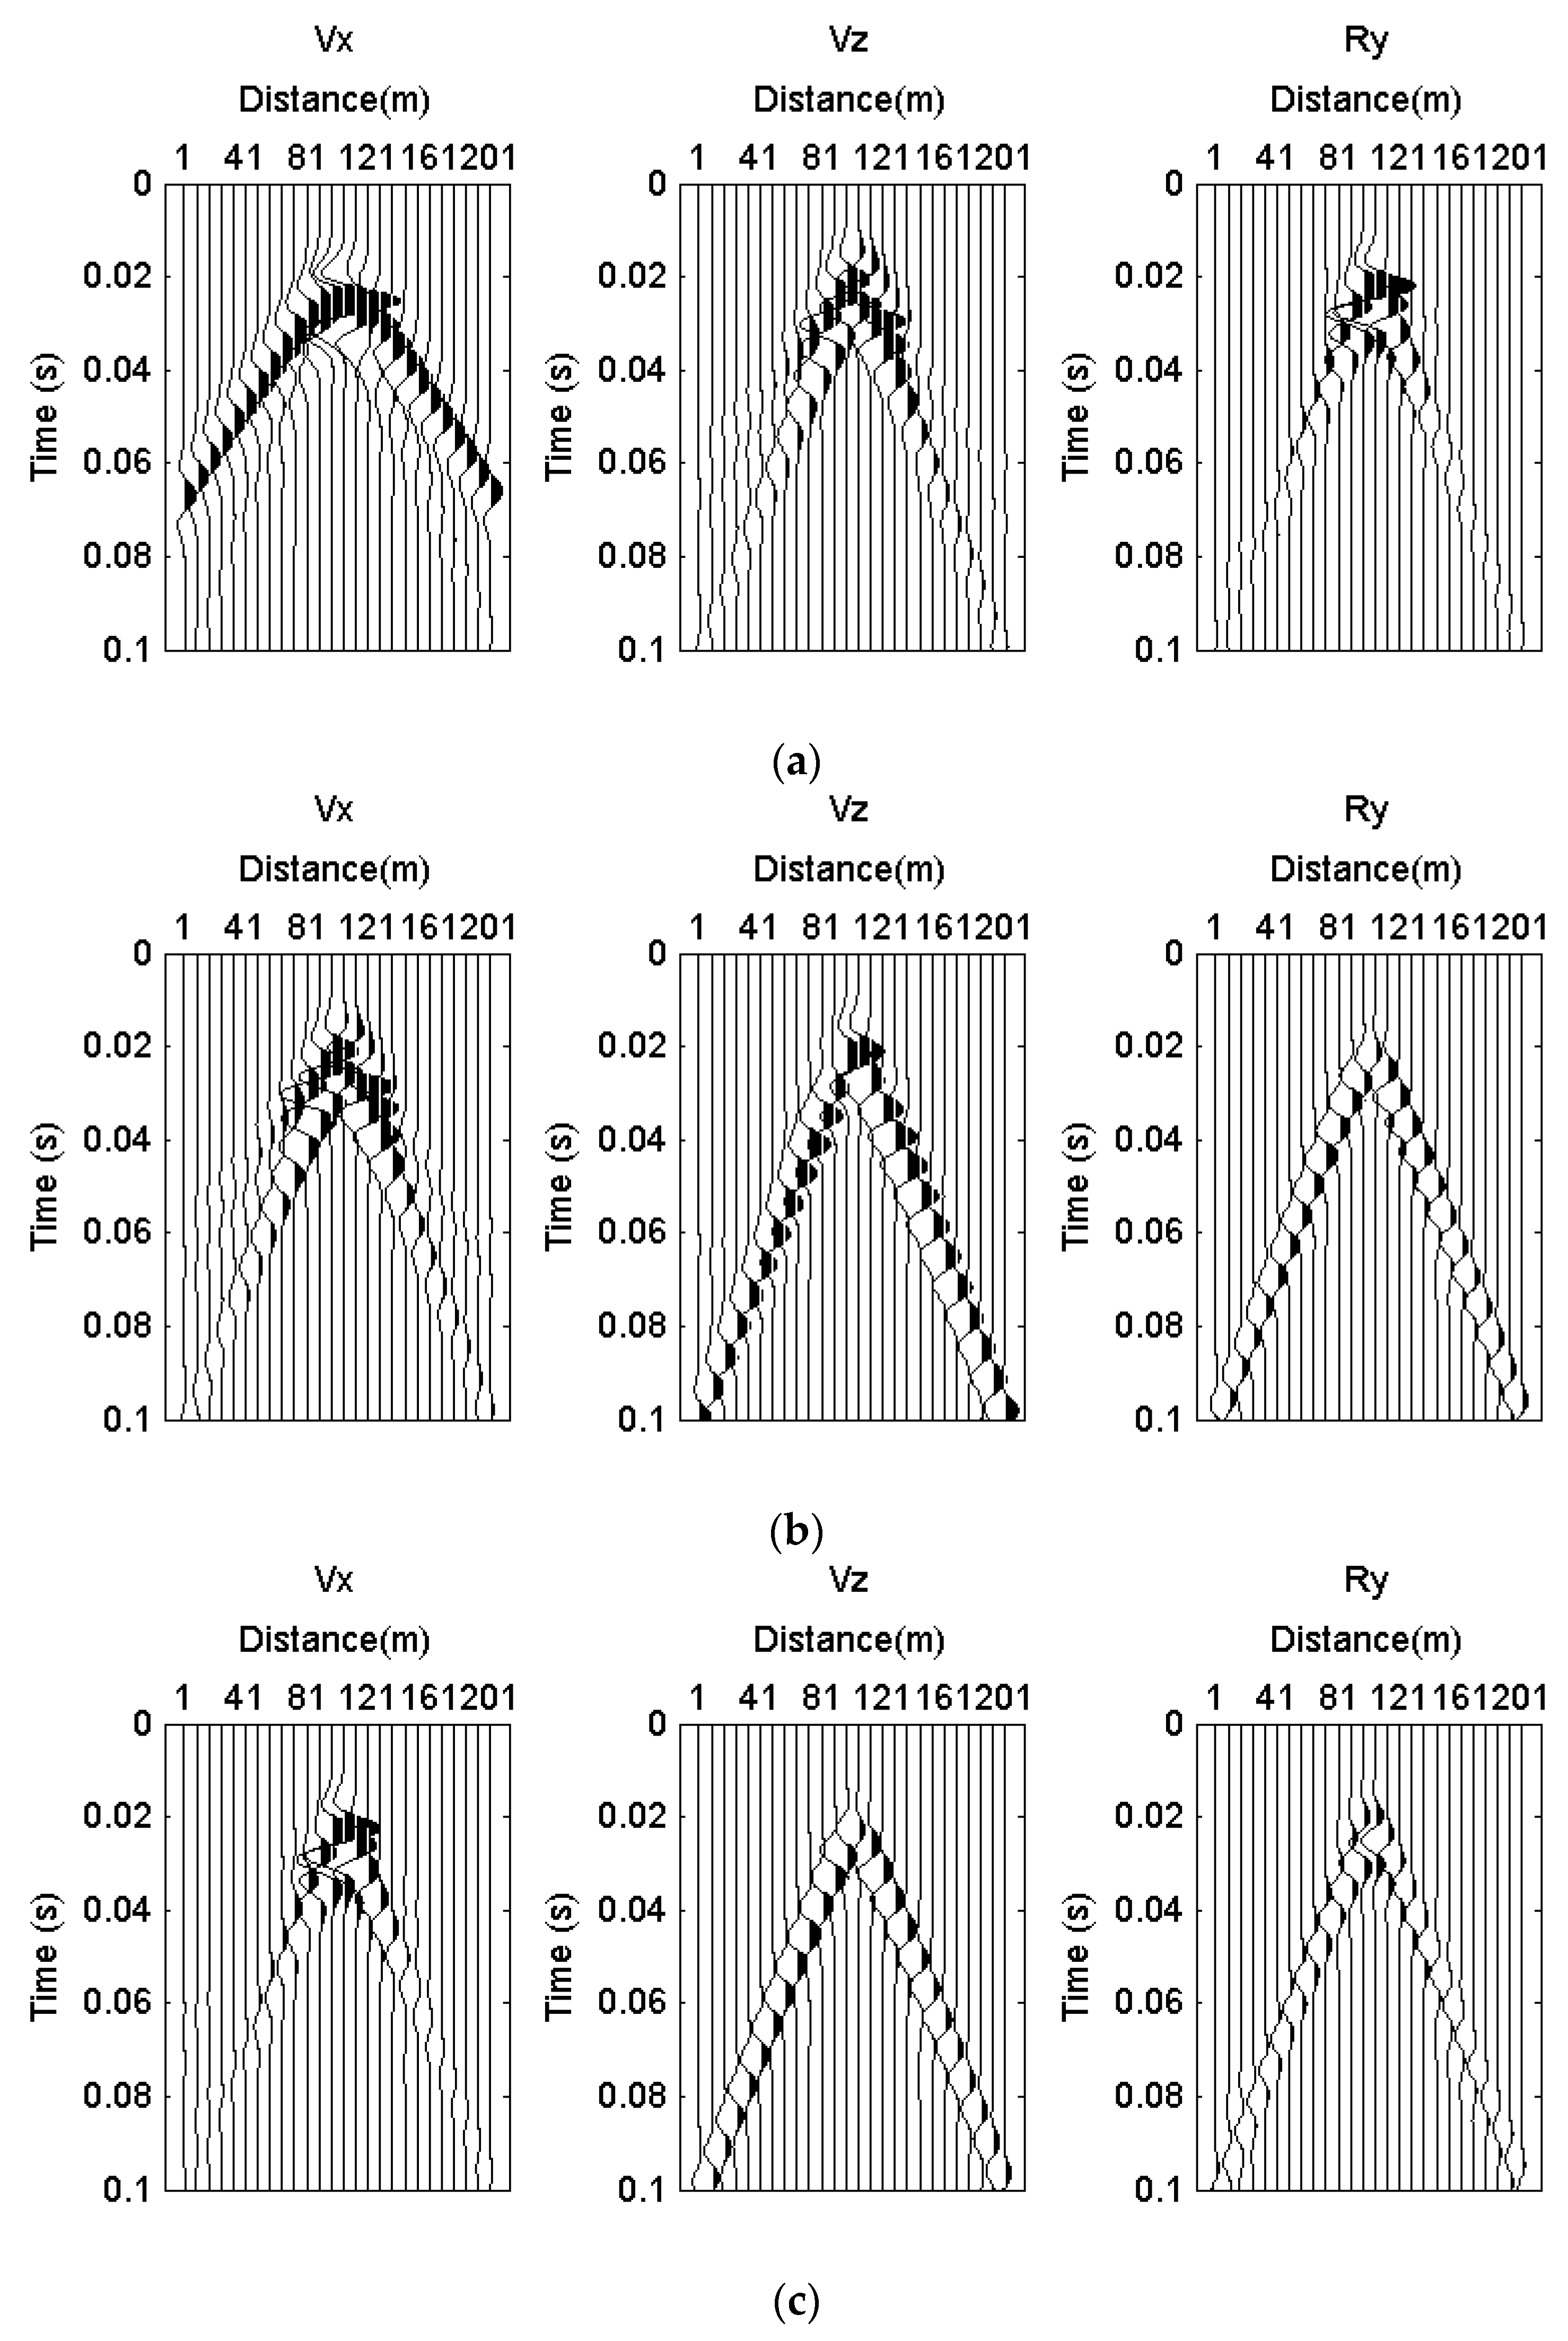
With a size of 200 m × 200 m, the shot in the center of the model, and the receivers arrayed at a depth of 100 m with 1 m intervals, the translational and rotational components generated from different sources are shown in Figure 2, Figure 3 and Figure 4, where the sample interval is 0.1 s and the total recording time is 0.1 s.
In Figure 2, it is obvious that there are only S waves in the three components because the model is isotropic and only S waves are produced by the shear source, while it can be clearly seen that there are the first arrivals of P and S waves generated from the radial and vertical concentrated force sources. The energy of the component generated from the concentrated force source is so weak that it needed to be magnified 10 times to be visible at the same energy level with the other two components on the records. It can be found that P waves are much stronger than S waves in the X component generated from the radial concentrated force source, while S waves cause a stronger rotational motion, and P waves are hardly visible in components.
We extracted the 30th trace of the seismic records to make a further comparison of translations and rotations, as shown in Figure 3. The influence of sources in the X component and component is much stronger than that in the Z component in the far offset. The amplitude of P waves in the X component generated from the radial concentrated force source is much stronger than that from the other two sources. However, the amplitude of the S waves generated from the radial concentrated force source is weak in all three components.
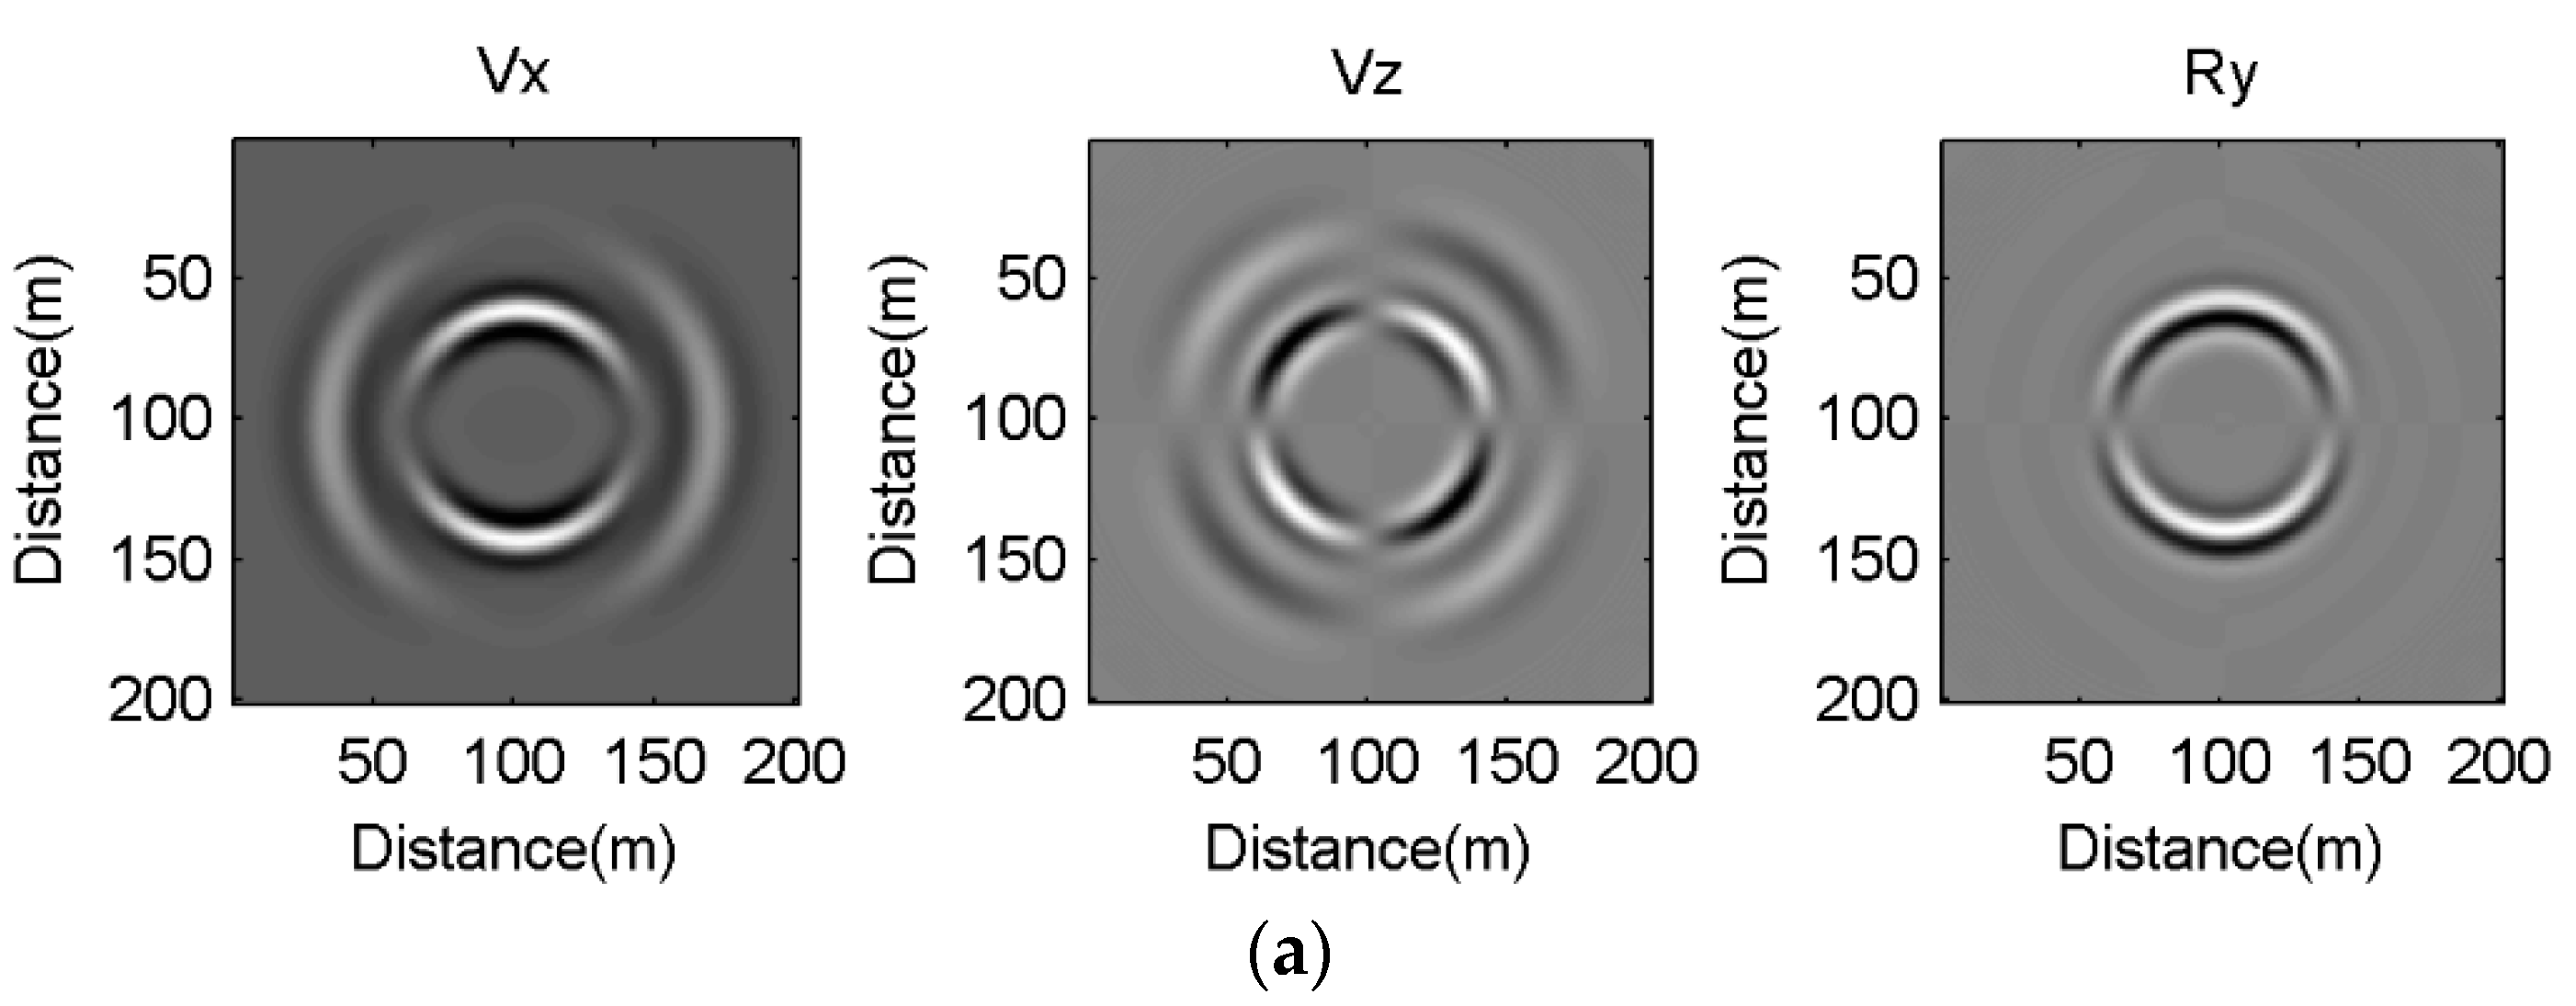
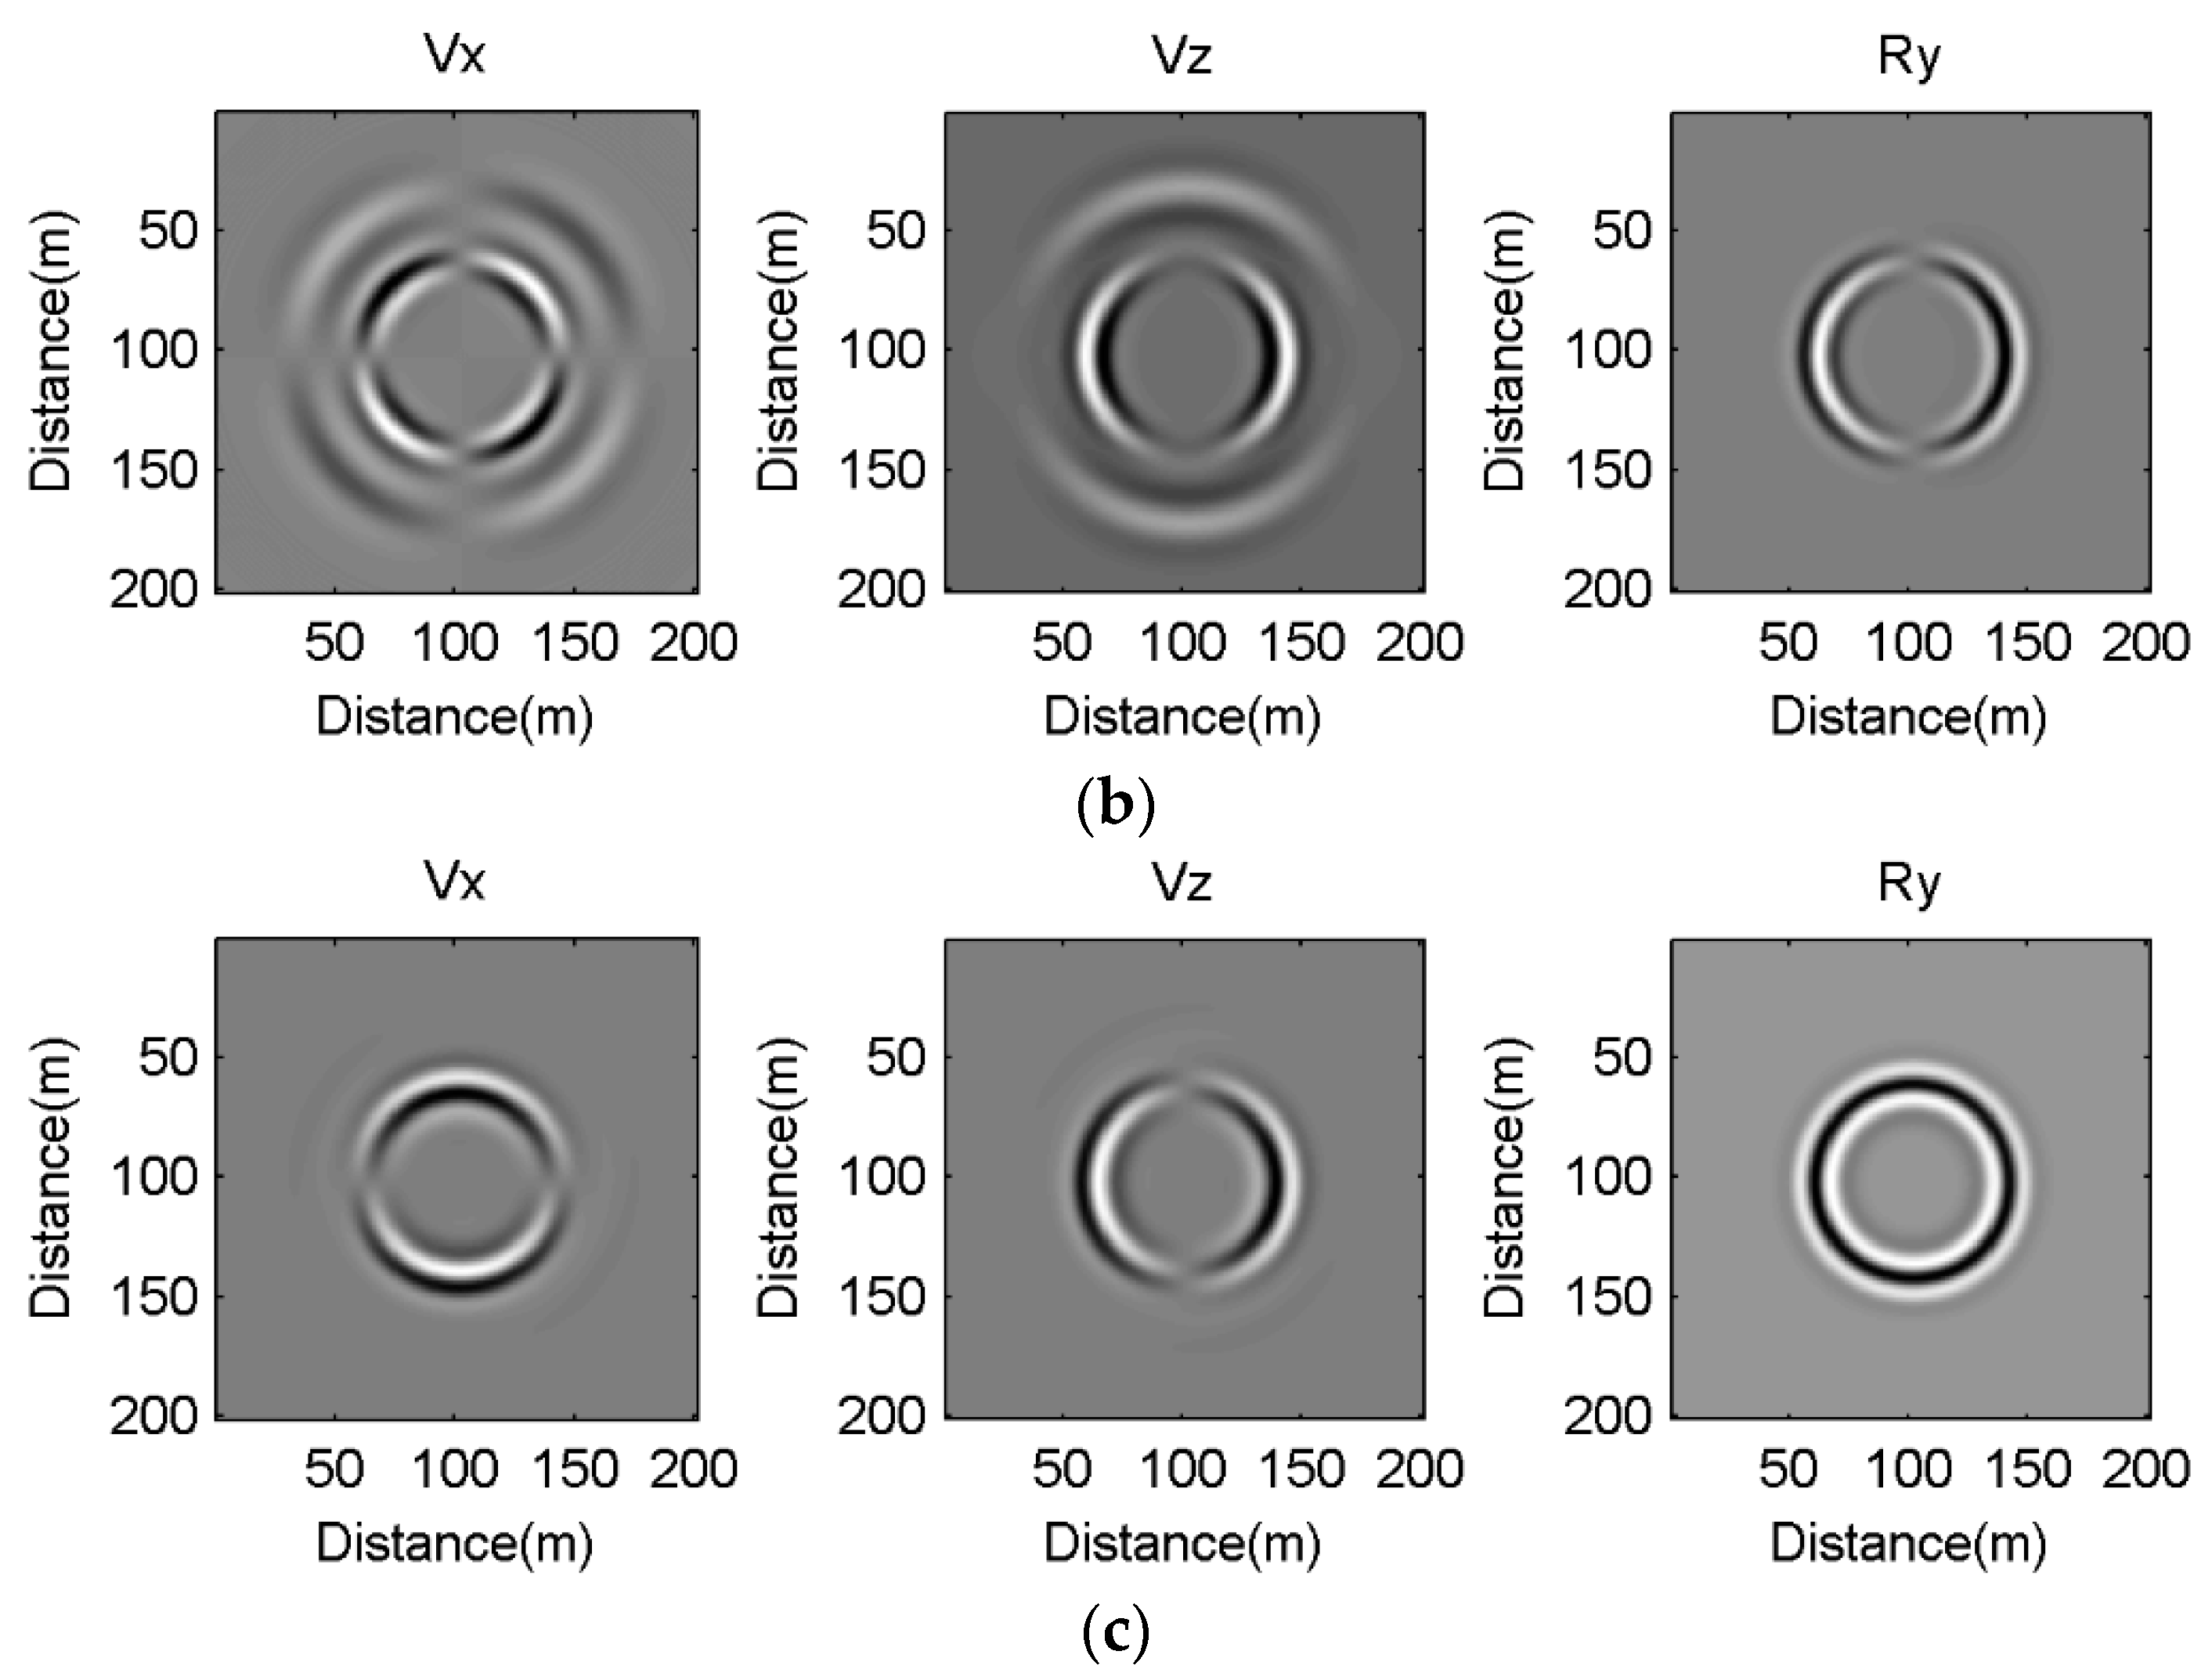
All these anomalies can be enhanced in the snapshots of different components generated from different sources (Figure 4), where there are only S waves in the components. In all snapshots, the shapes of the wavefronts in the X and Z components are round, which is consistent with Zhang’s research [17]. It can be seen that the wavefront propagates with reverse phase along the horizontal axis in the component generated from the radial concentrated force source, while it propagates with reverse phase along the vertical axis in the component generated from the vertical concentrated force source. However, it propagates with the same phase around the circumference in the component generated from the shear force. The wavefronts in the X components and Z components are complex and different from the components.
Obviously, the energy of S waves is significantly stronger than that of P waves on the component, which means the component may be helpful to identify different body waves.
4. Effects of Anisotropic Parameters on Rotations
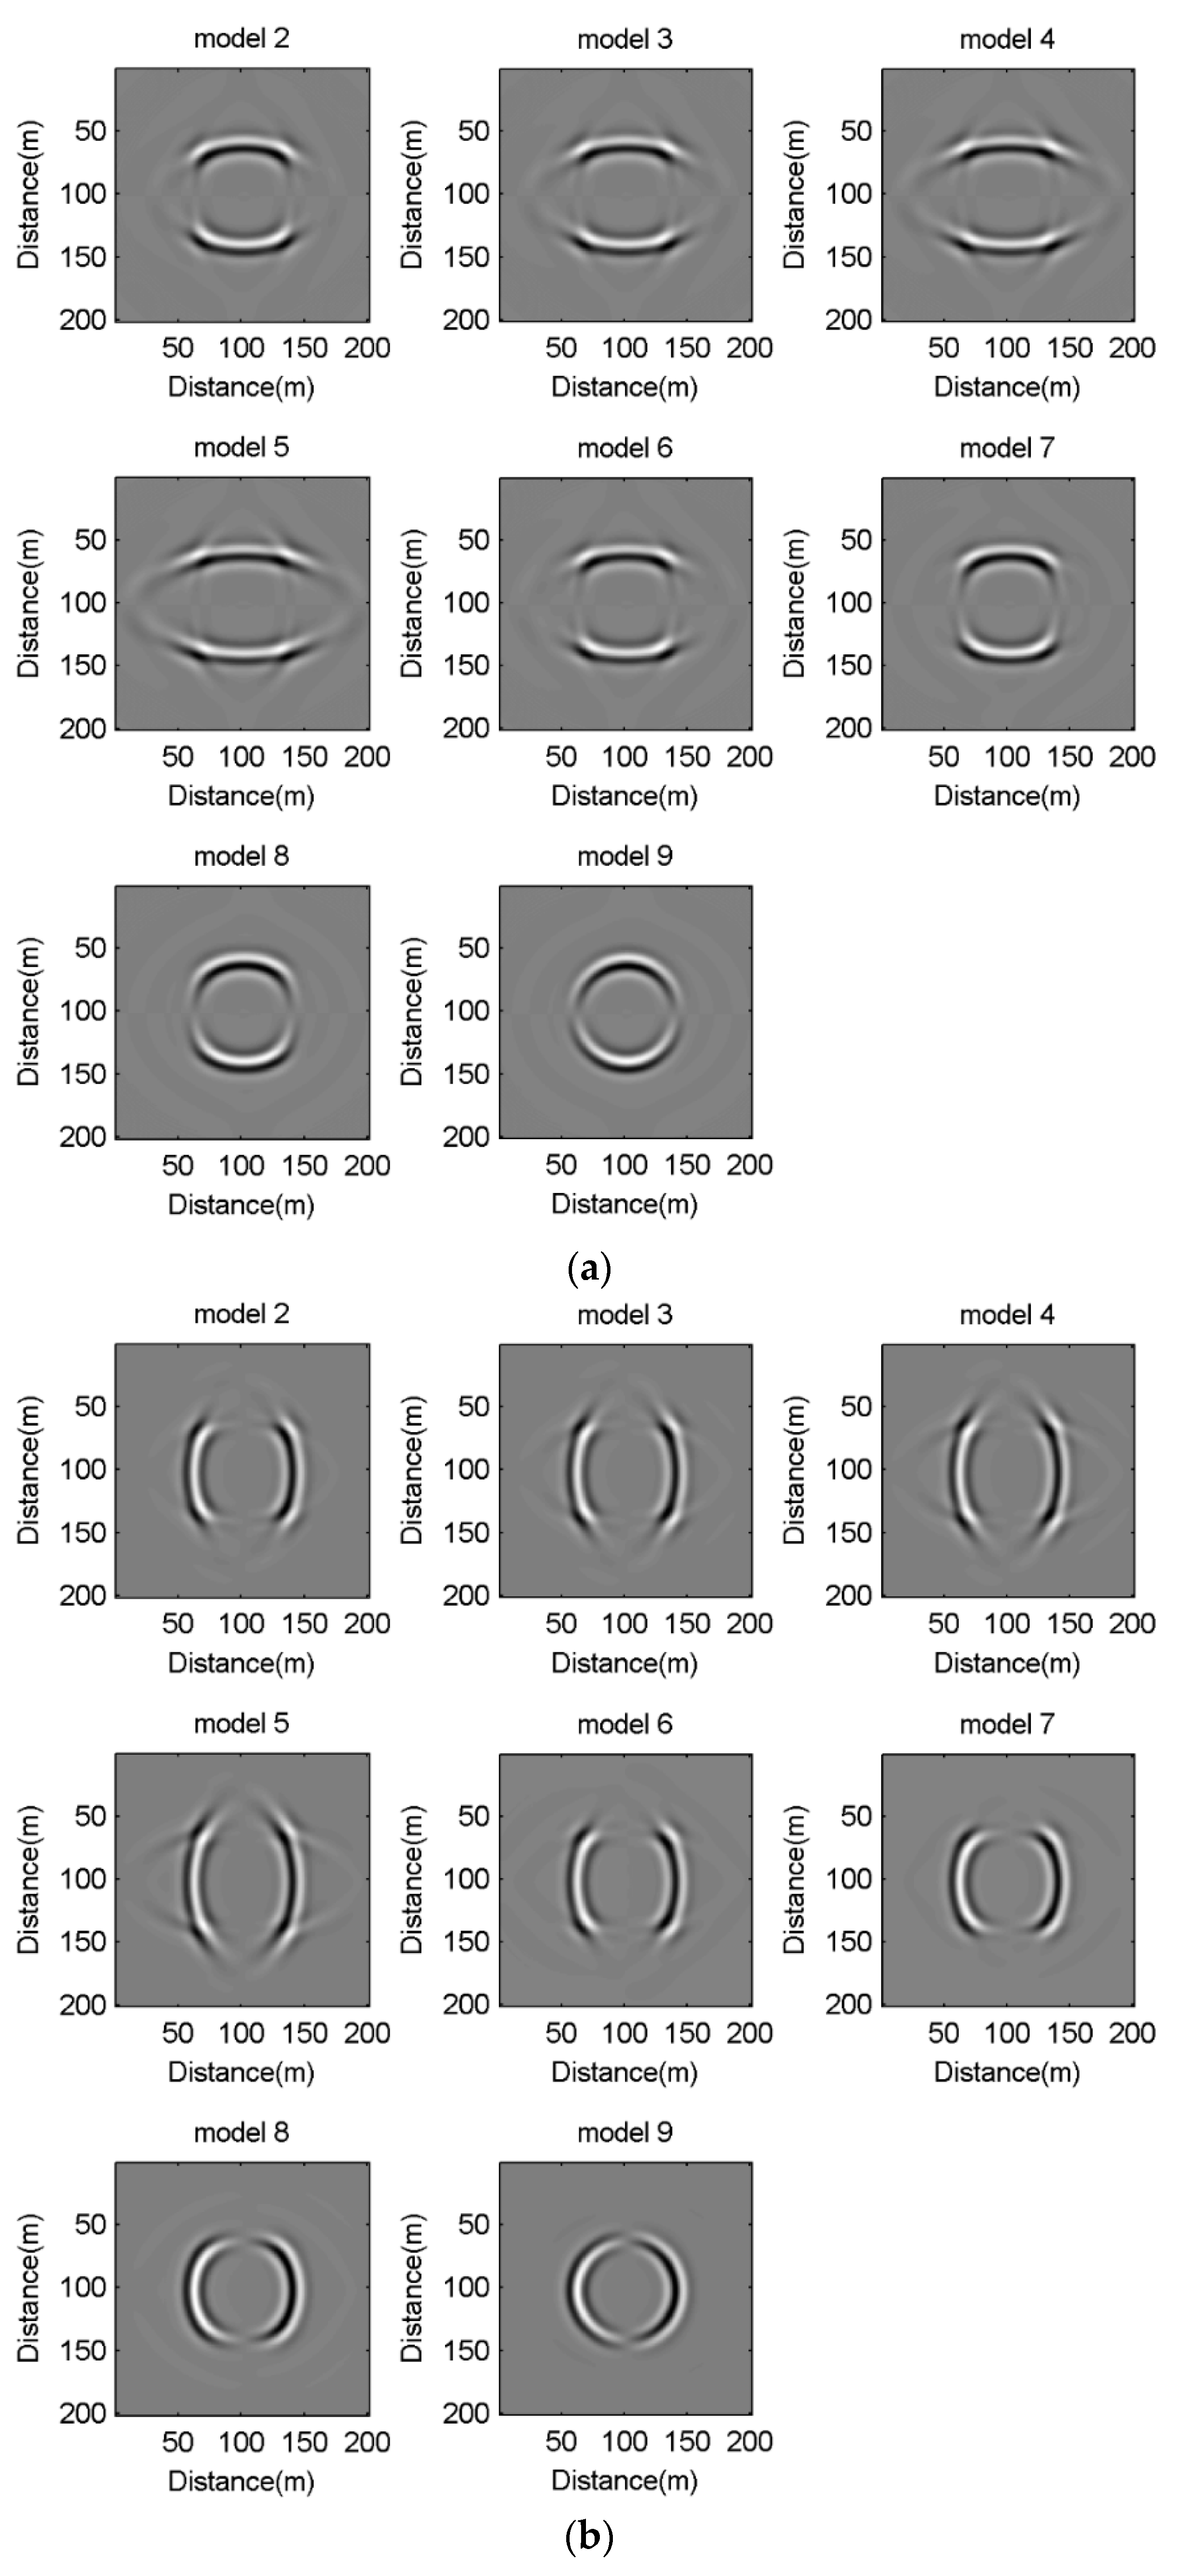
In order to further explore the effects of anisotropic parameters on rotational motion, we changed the Thomsen parameters δ and ε, based on the same seismic observation system to simulate the three-component velocity fields. Eight different models are defined as illustrated in Table 2: models 2–5 were mainly used to study the effects of ε on rotational components by increasing ε from 0 to 0.3 as δ is constant, and model 4 and models 6–9 were employed to explore the influence of δ by gradually increasing δ from −0.2 to 0.2 as ε is constant. We first analyzed the simulation results under the explosion source in detail, shown in Figure 5, Figure 6, Figure 7, Figure 8, Figure 9, Figure 10, Figure 11 and Figure 12.
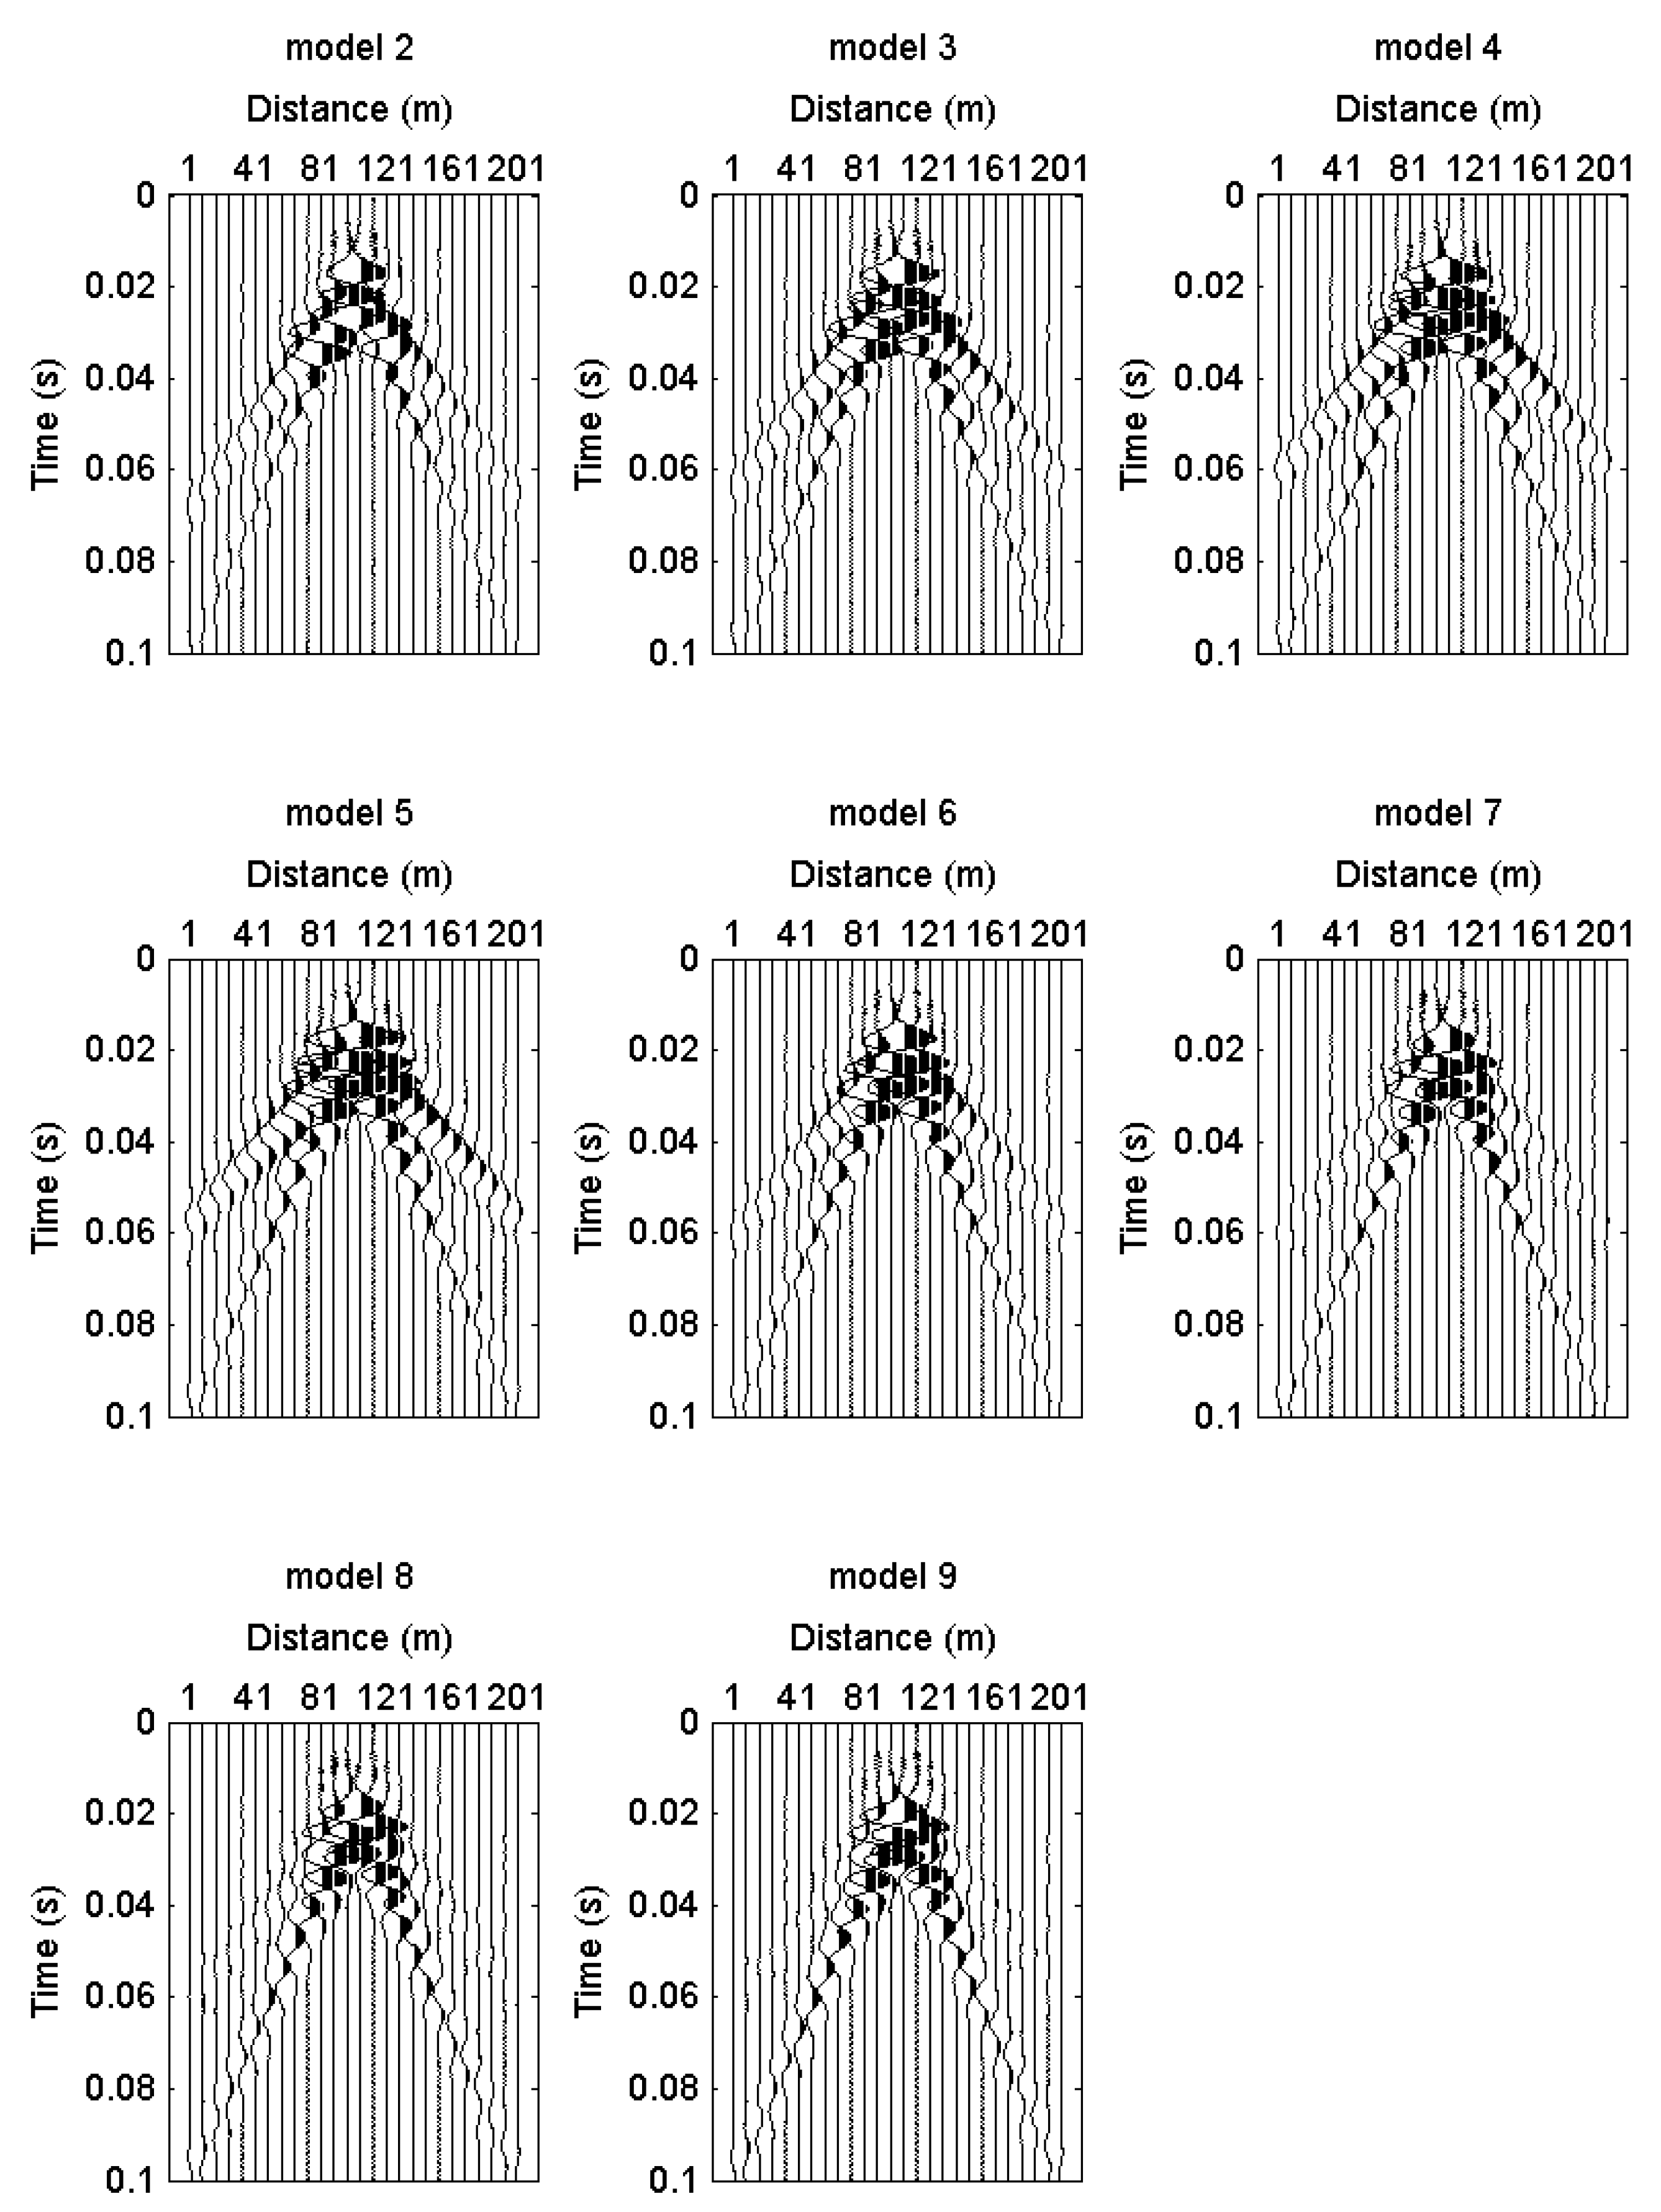
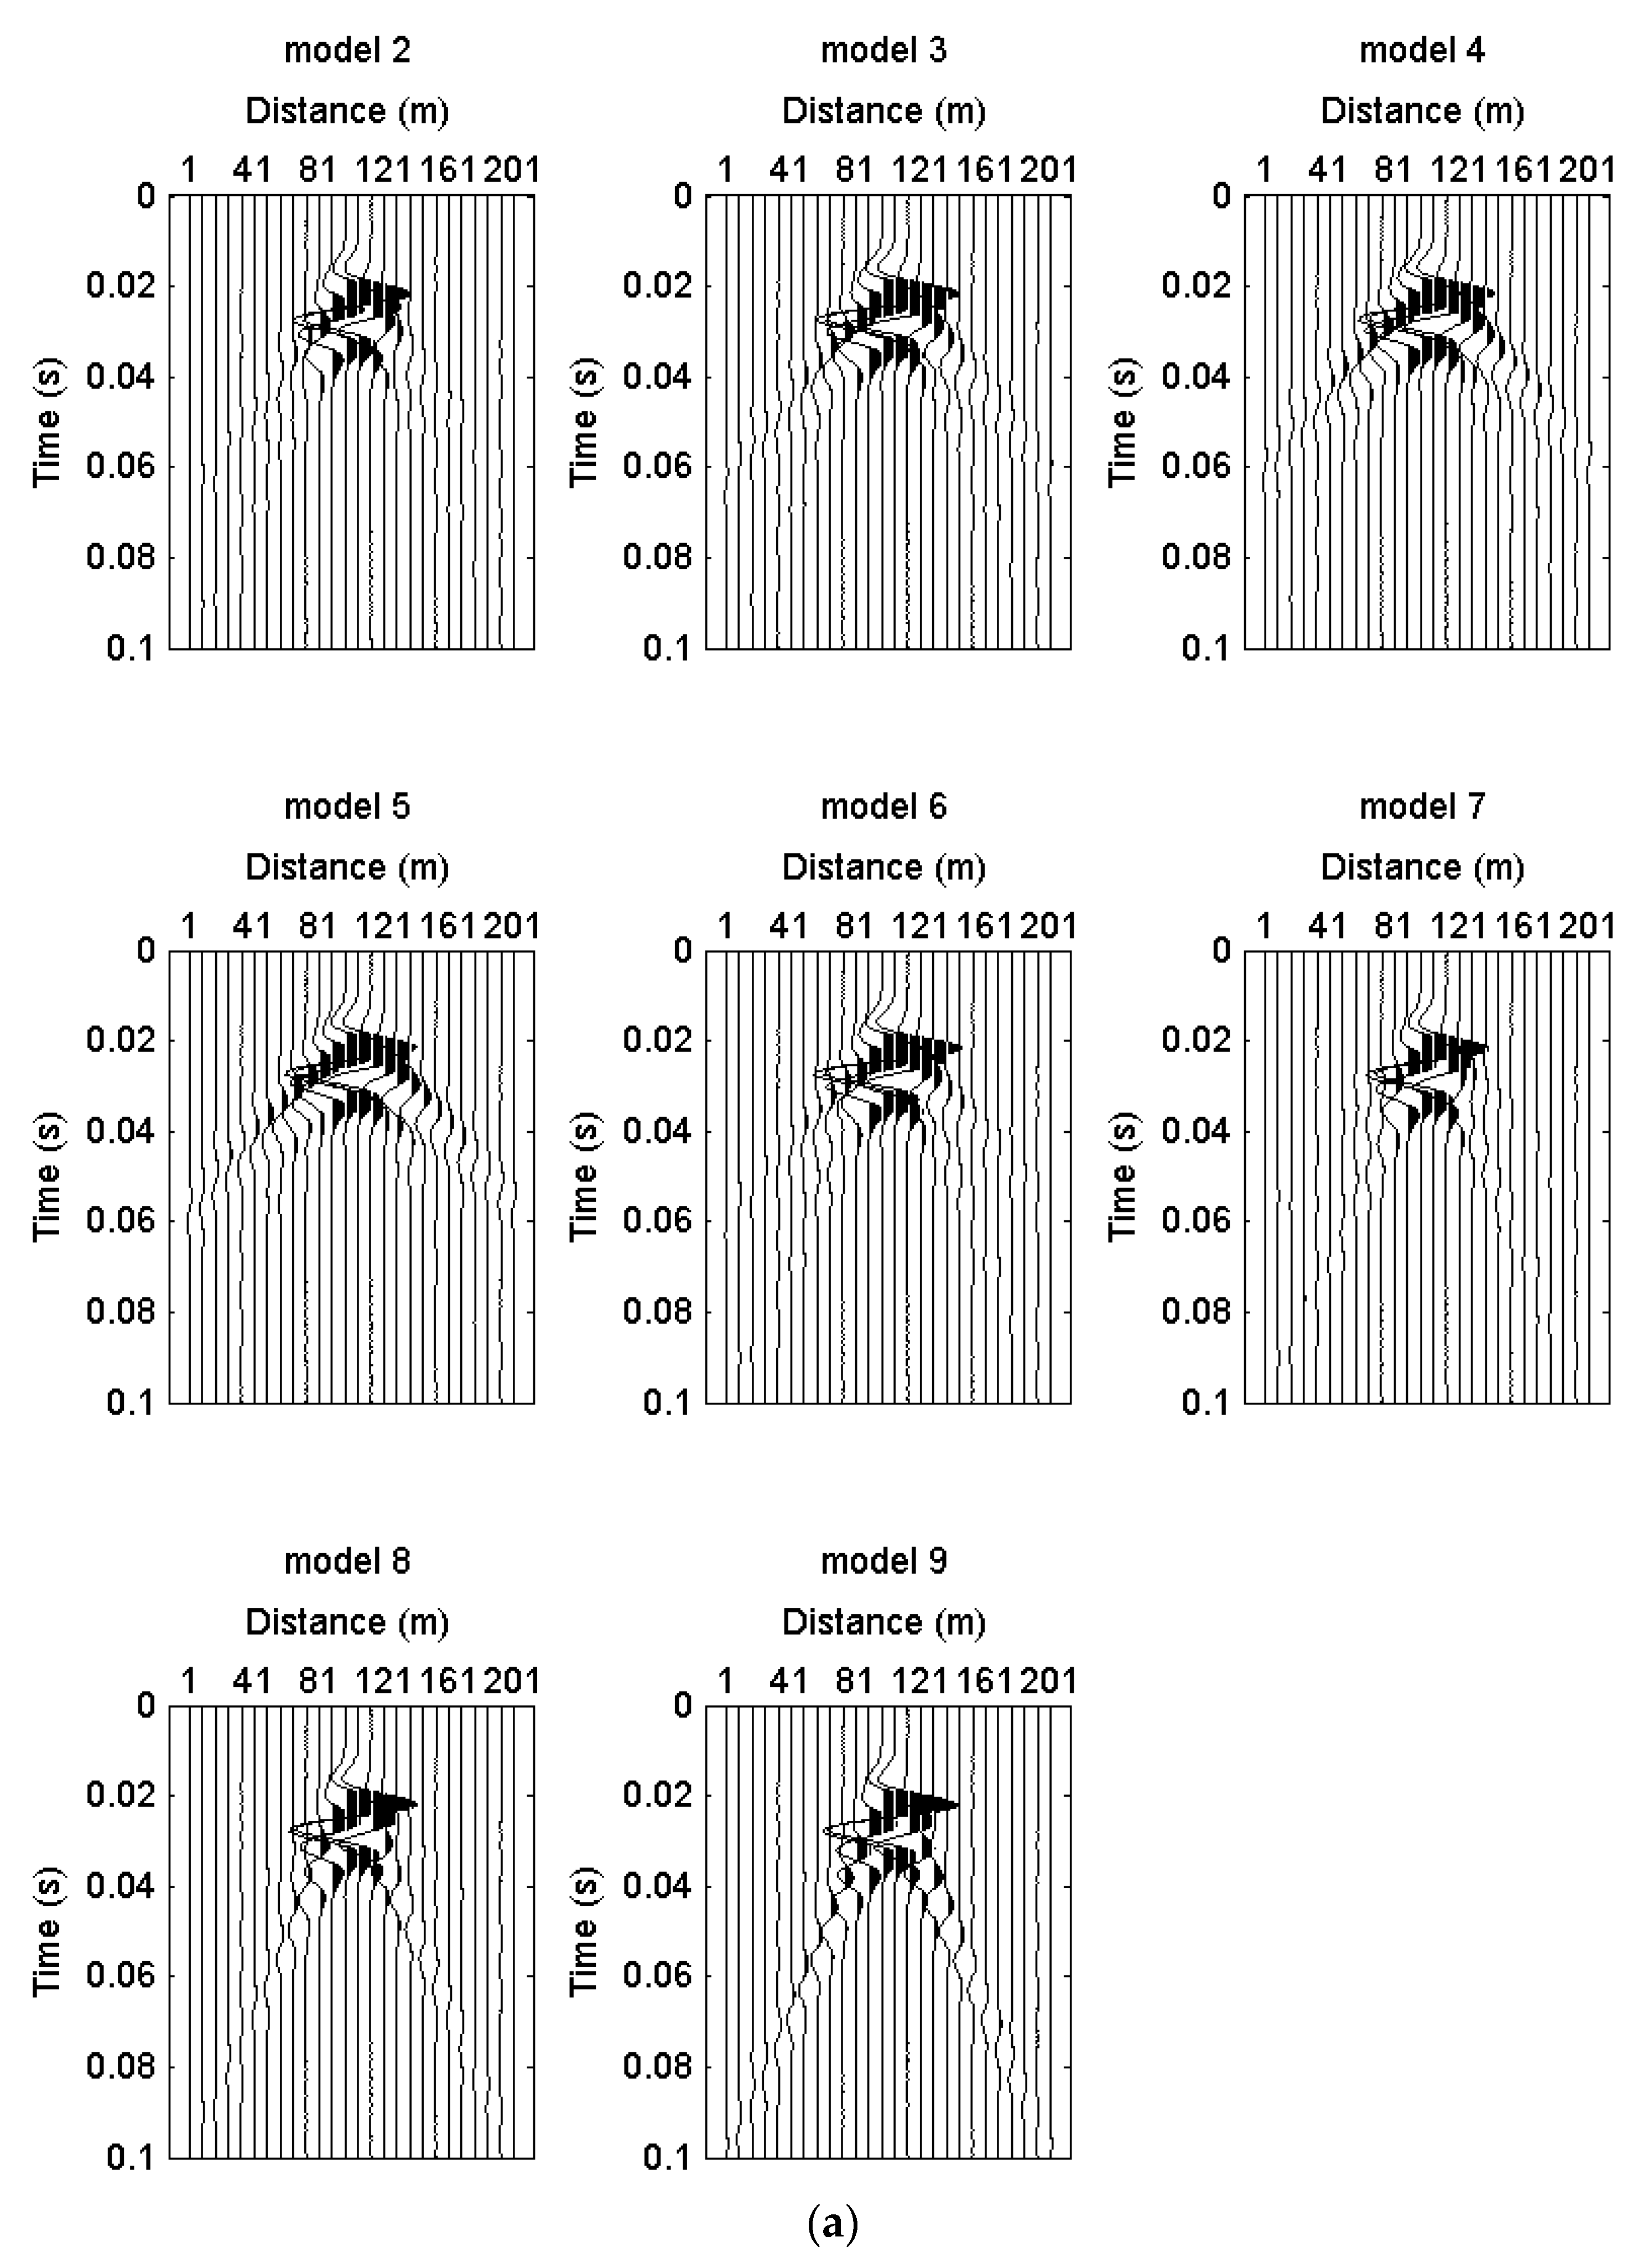
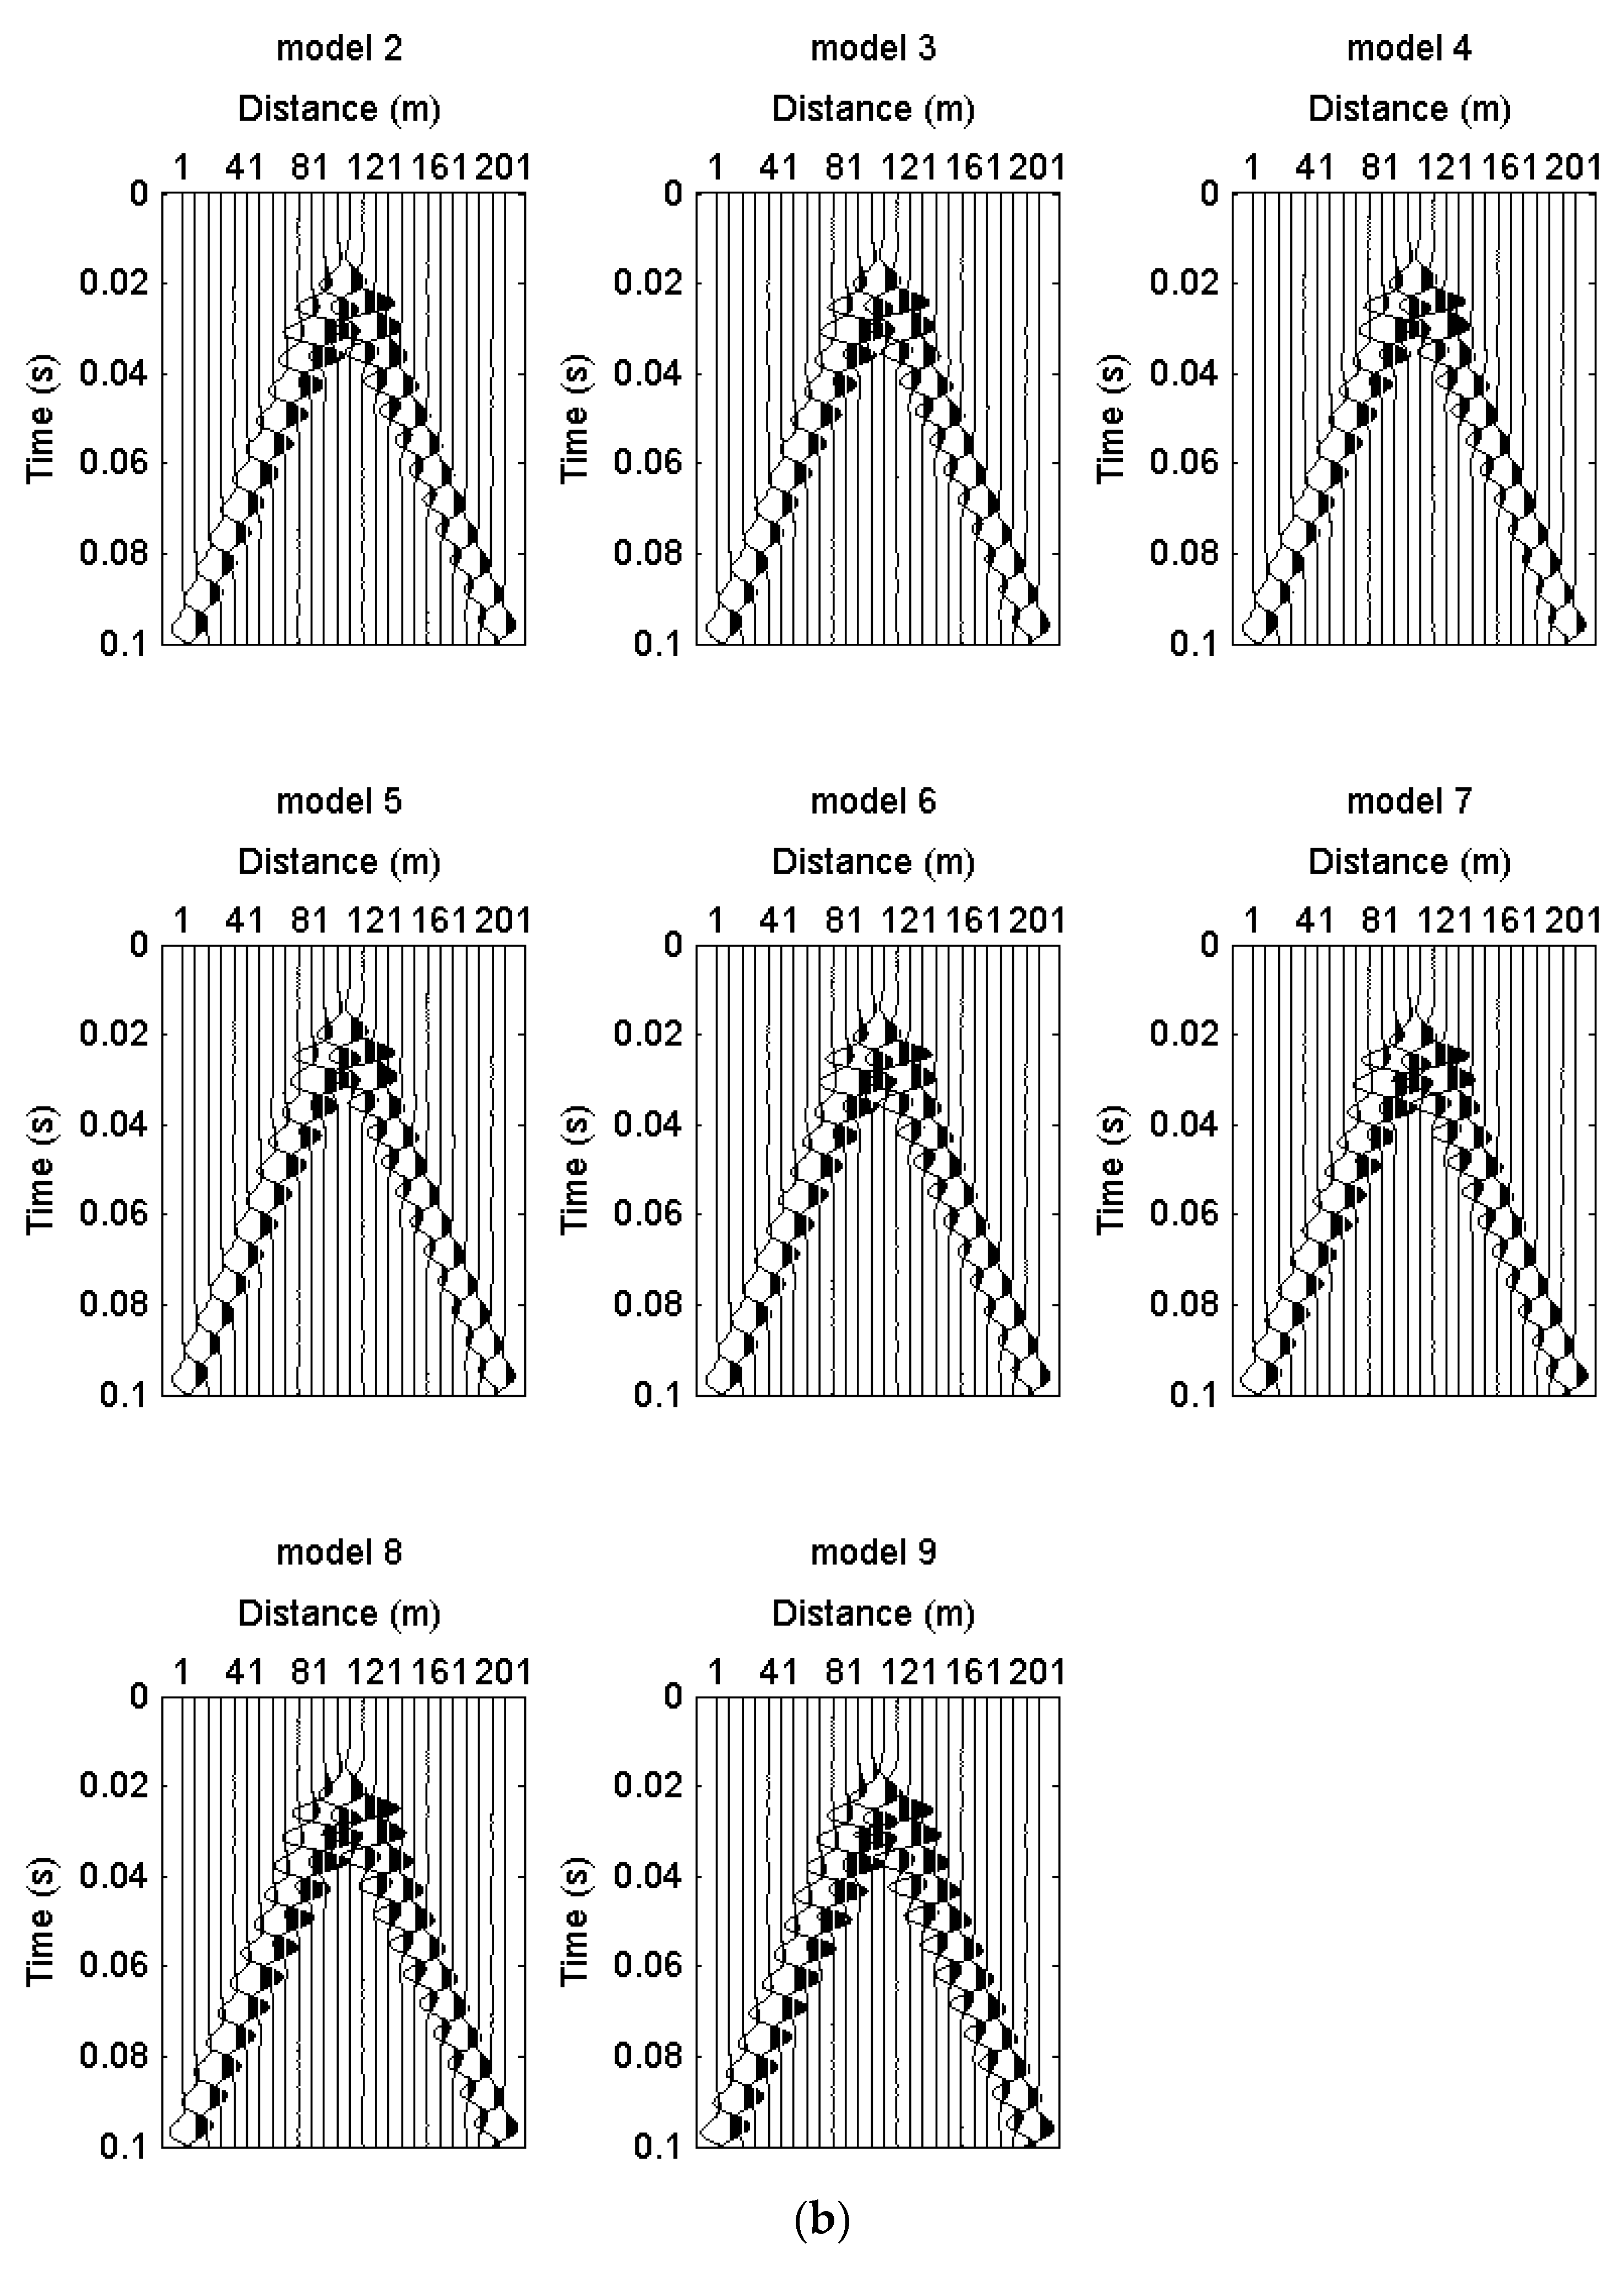
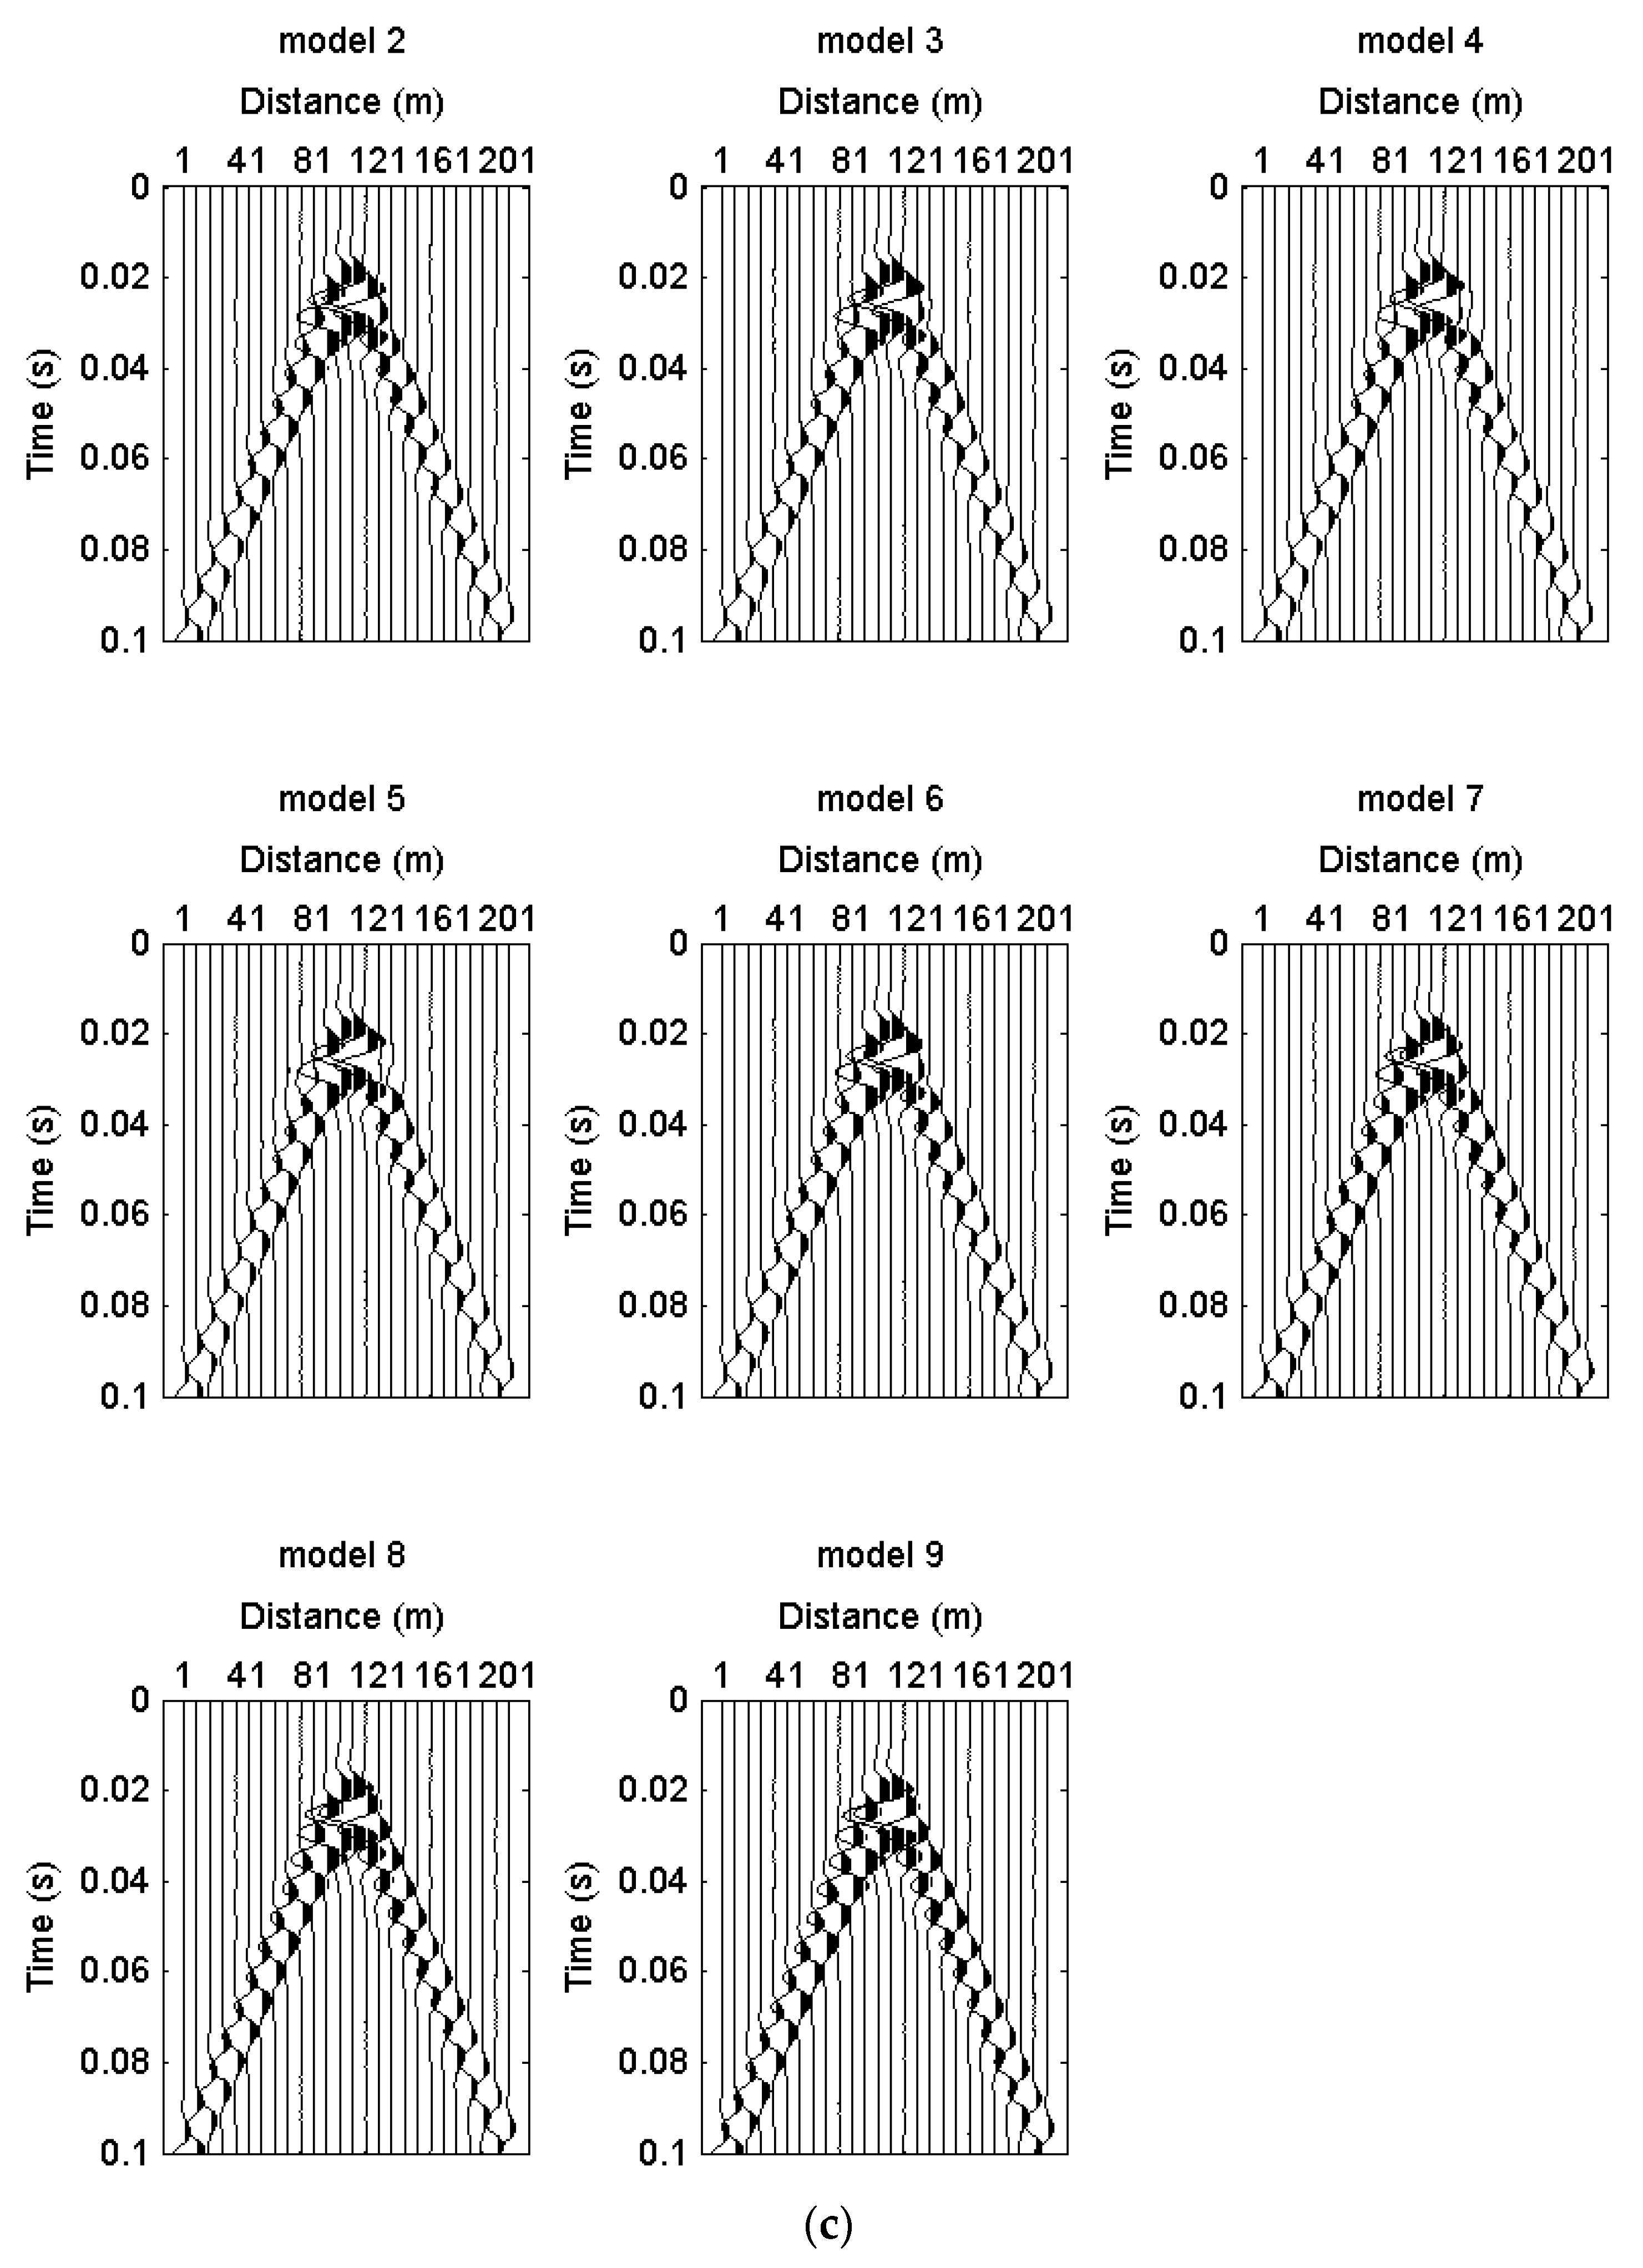
The seismic records, wave field snapshots, and FK spectra of different models are shown in Figure 5, Figure 6 and Figure 7. Figure 5 demonstrates that, contributed by the velocity anisotropy, both P and S waves existed in the components in the VTI media. The energy of S waves became stronger with increasing ε, while the effects of δ were almost invisible.
The shape of wavefronts in components became elliptical in VTI media, as seen in Figure 6. The eccentricities of the ellipse gradually increased with increasing ε, while the eccentricity of the ellipse gradually decreased with increasing δ.
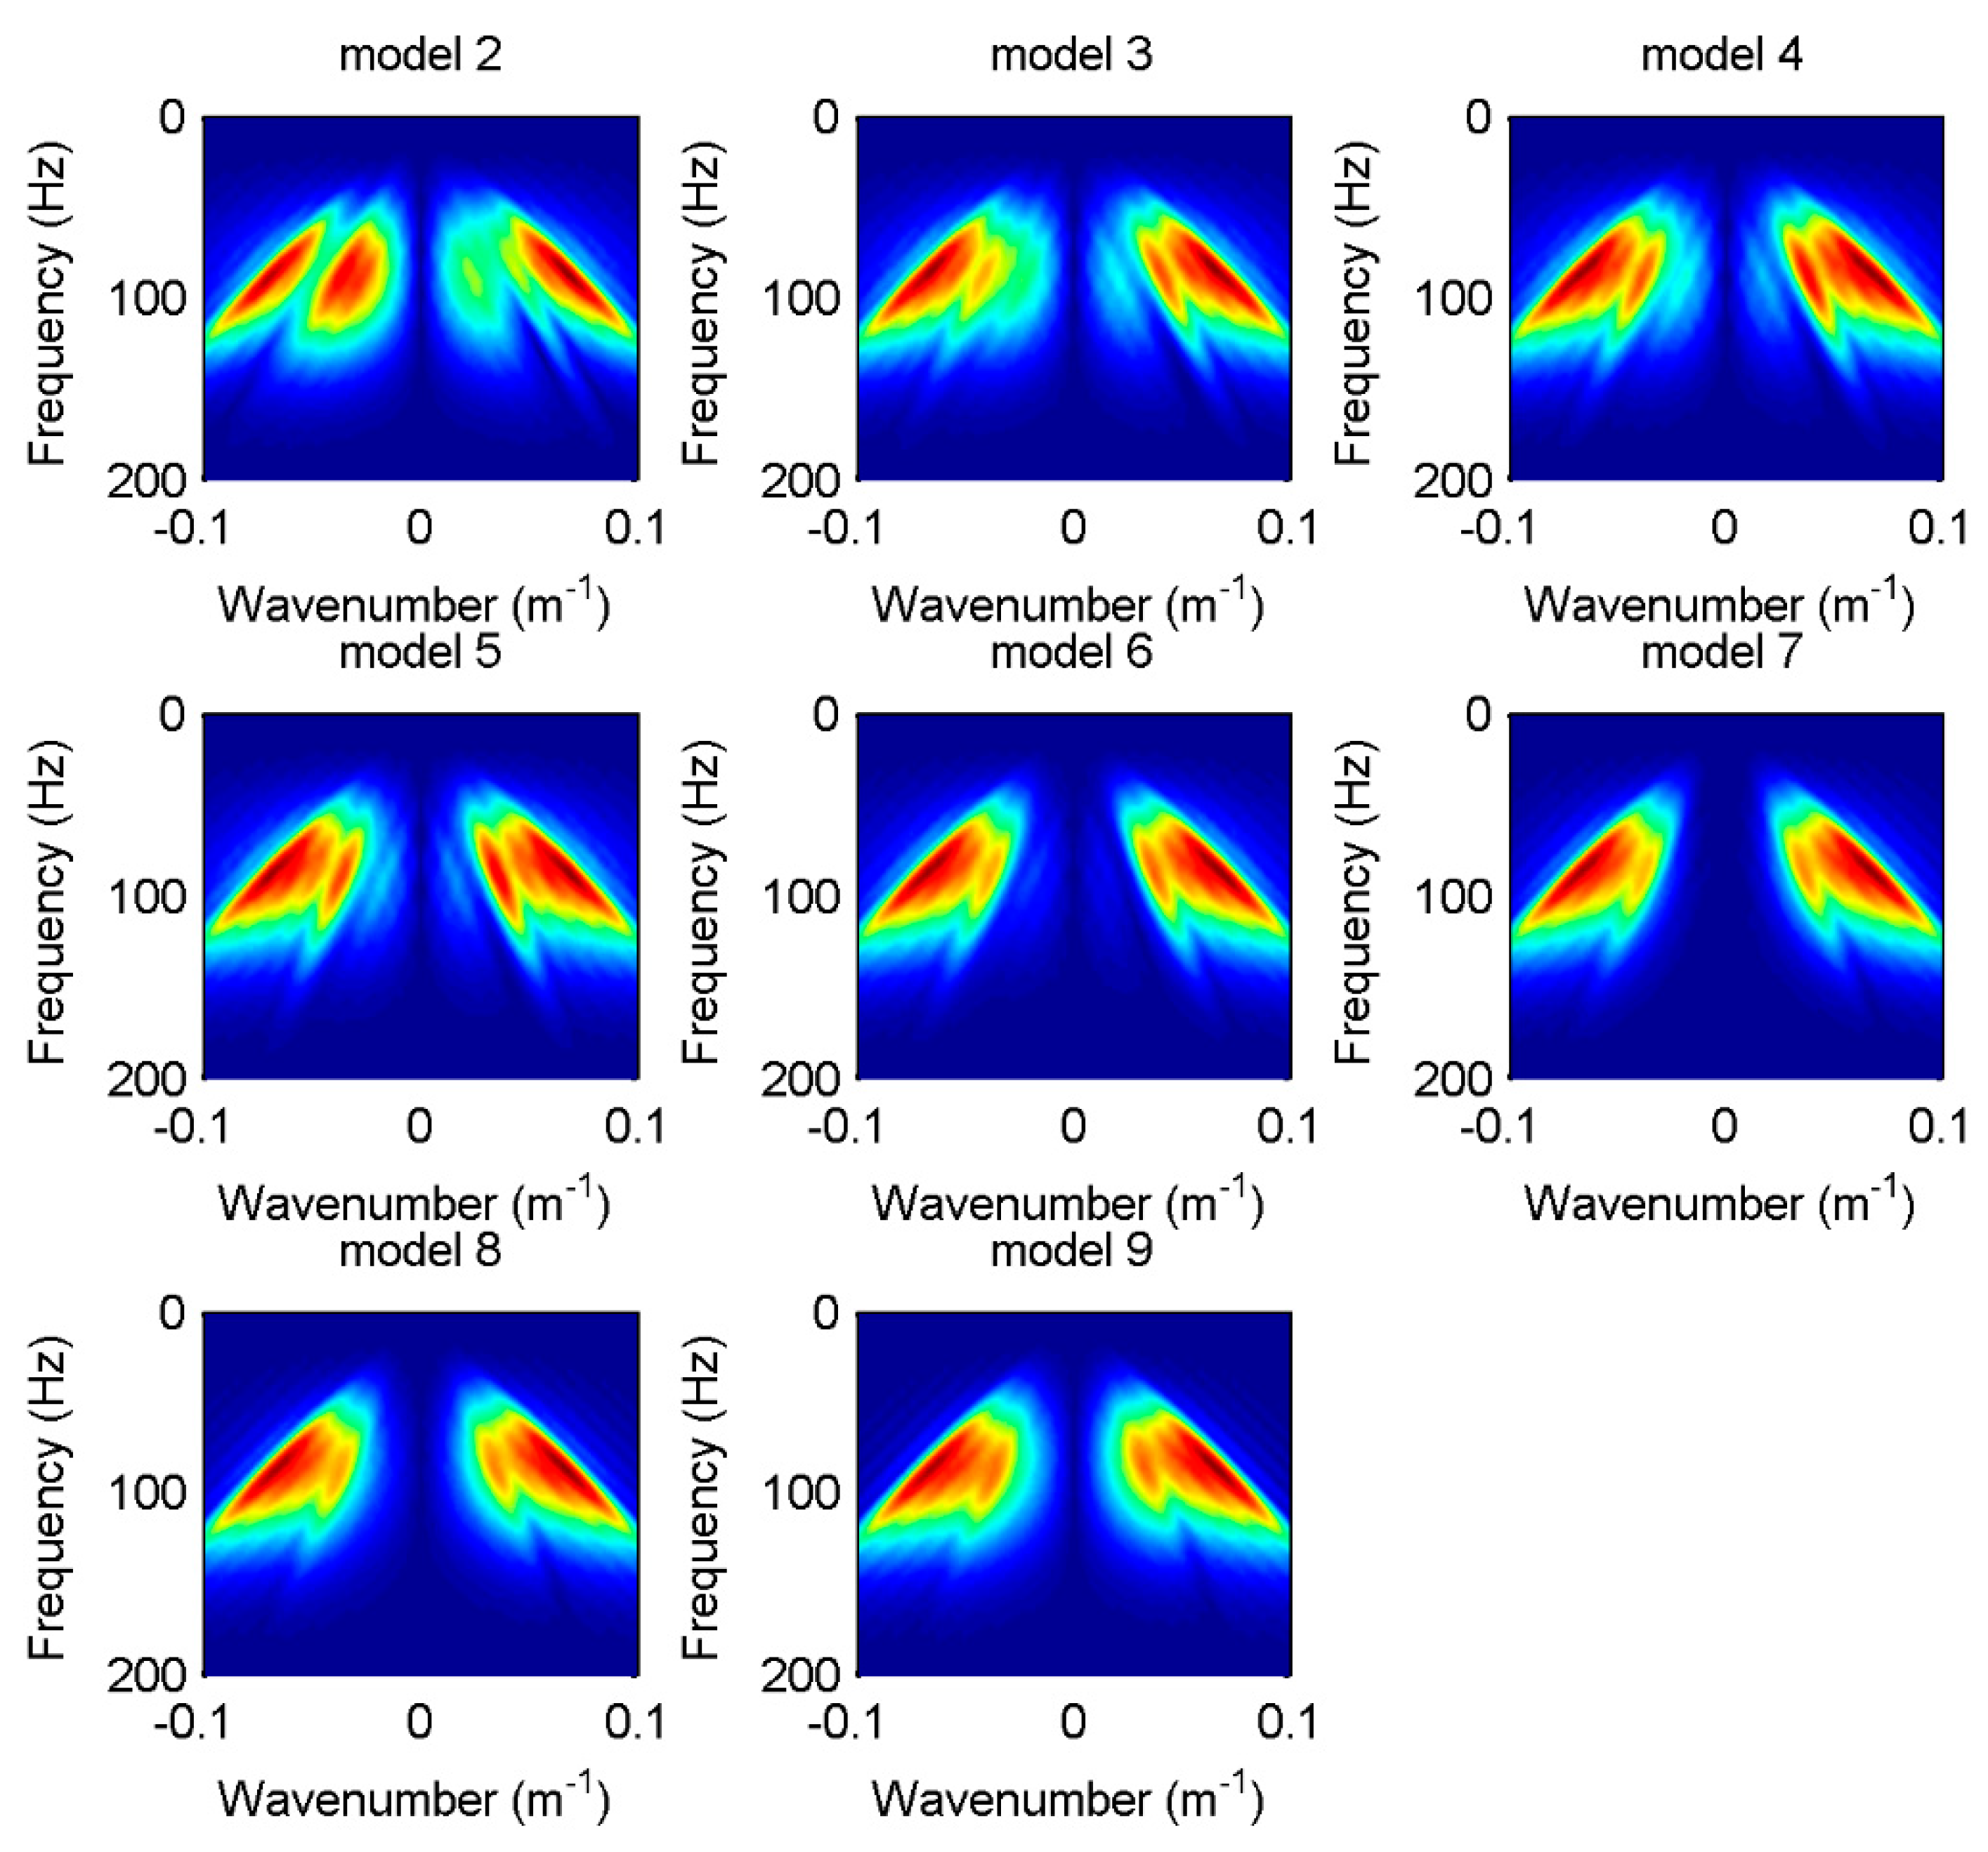
There are obvious P- and S-wave energy groups in the rotational components in the FK spectra (Figure 7). With the increase of ε, the energy of P waves decreased gradually, but became more concentrated at the same time, while the energy of S waves gradually increased. However, the FK spectra of rotational components were almost unchanged with increasing δ.
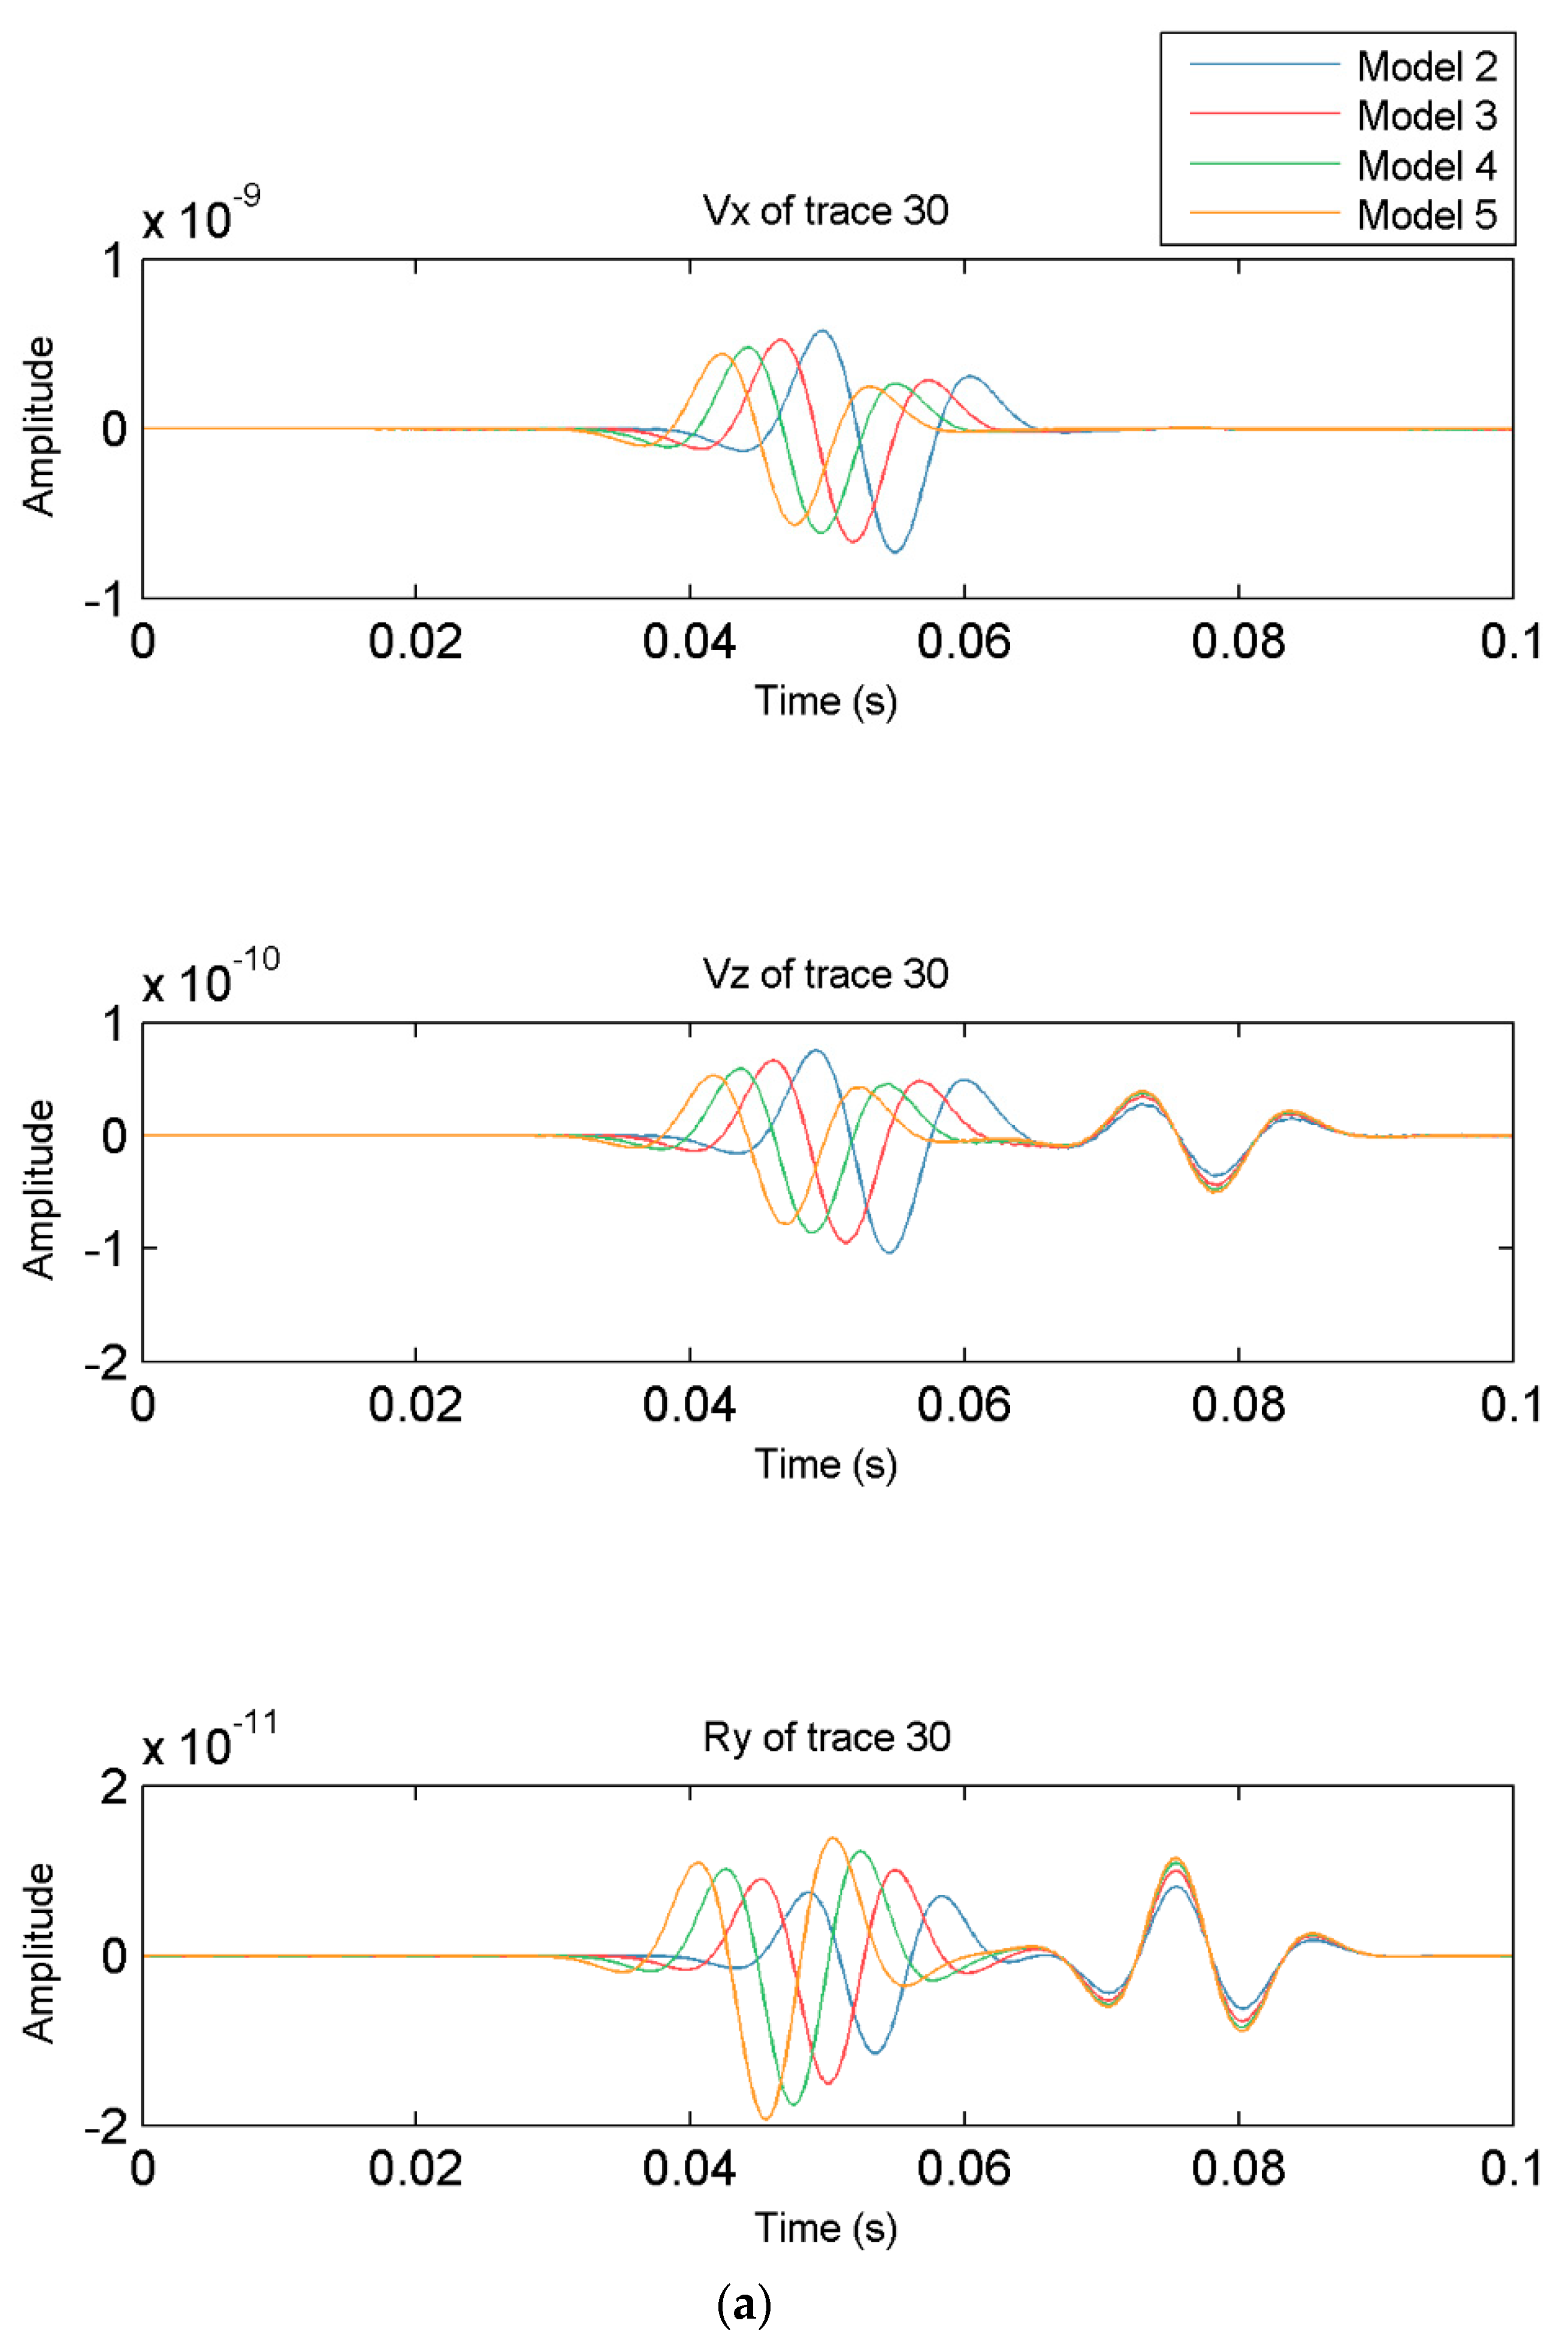
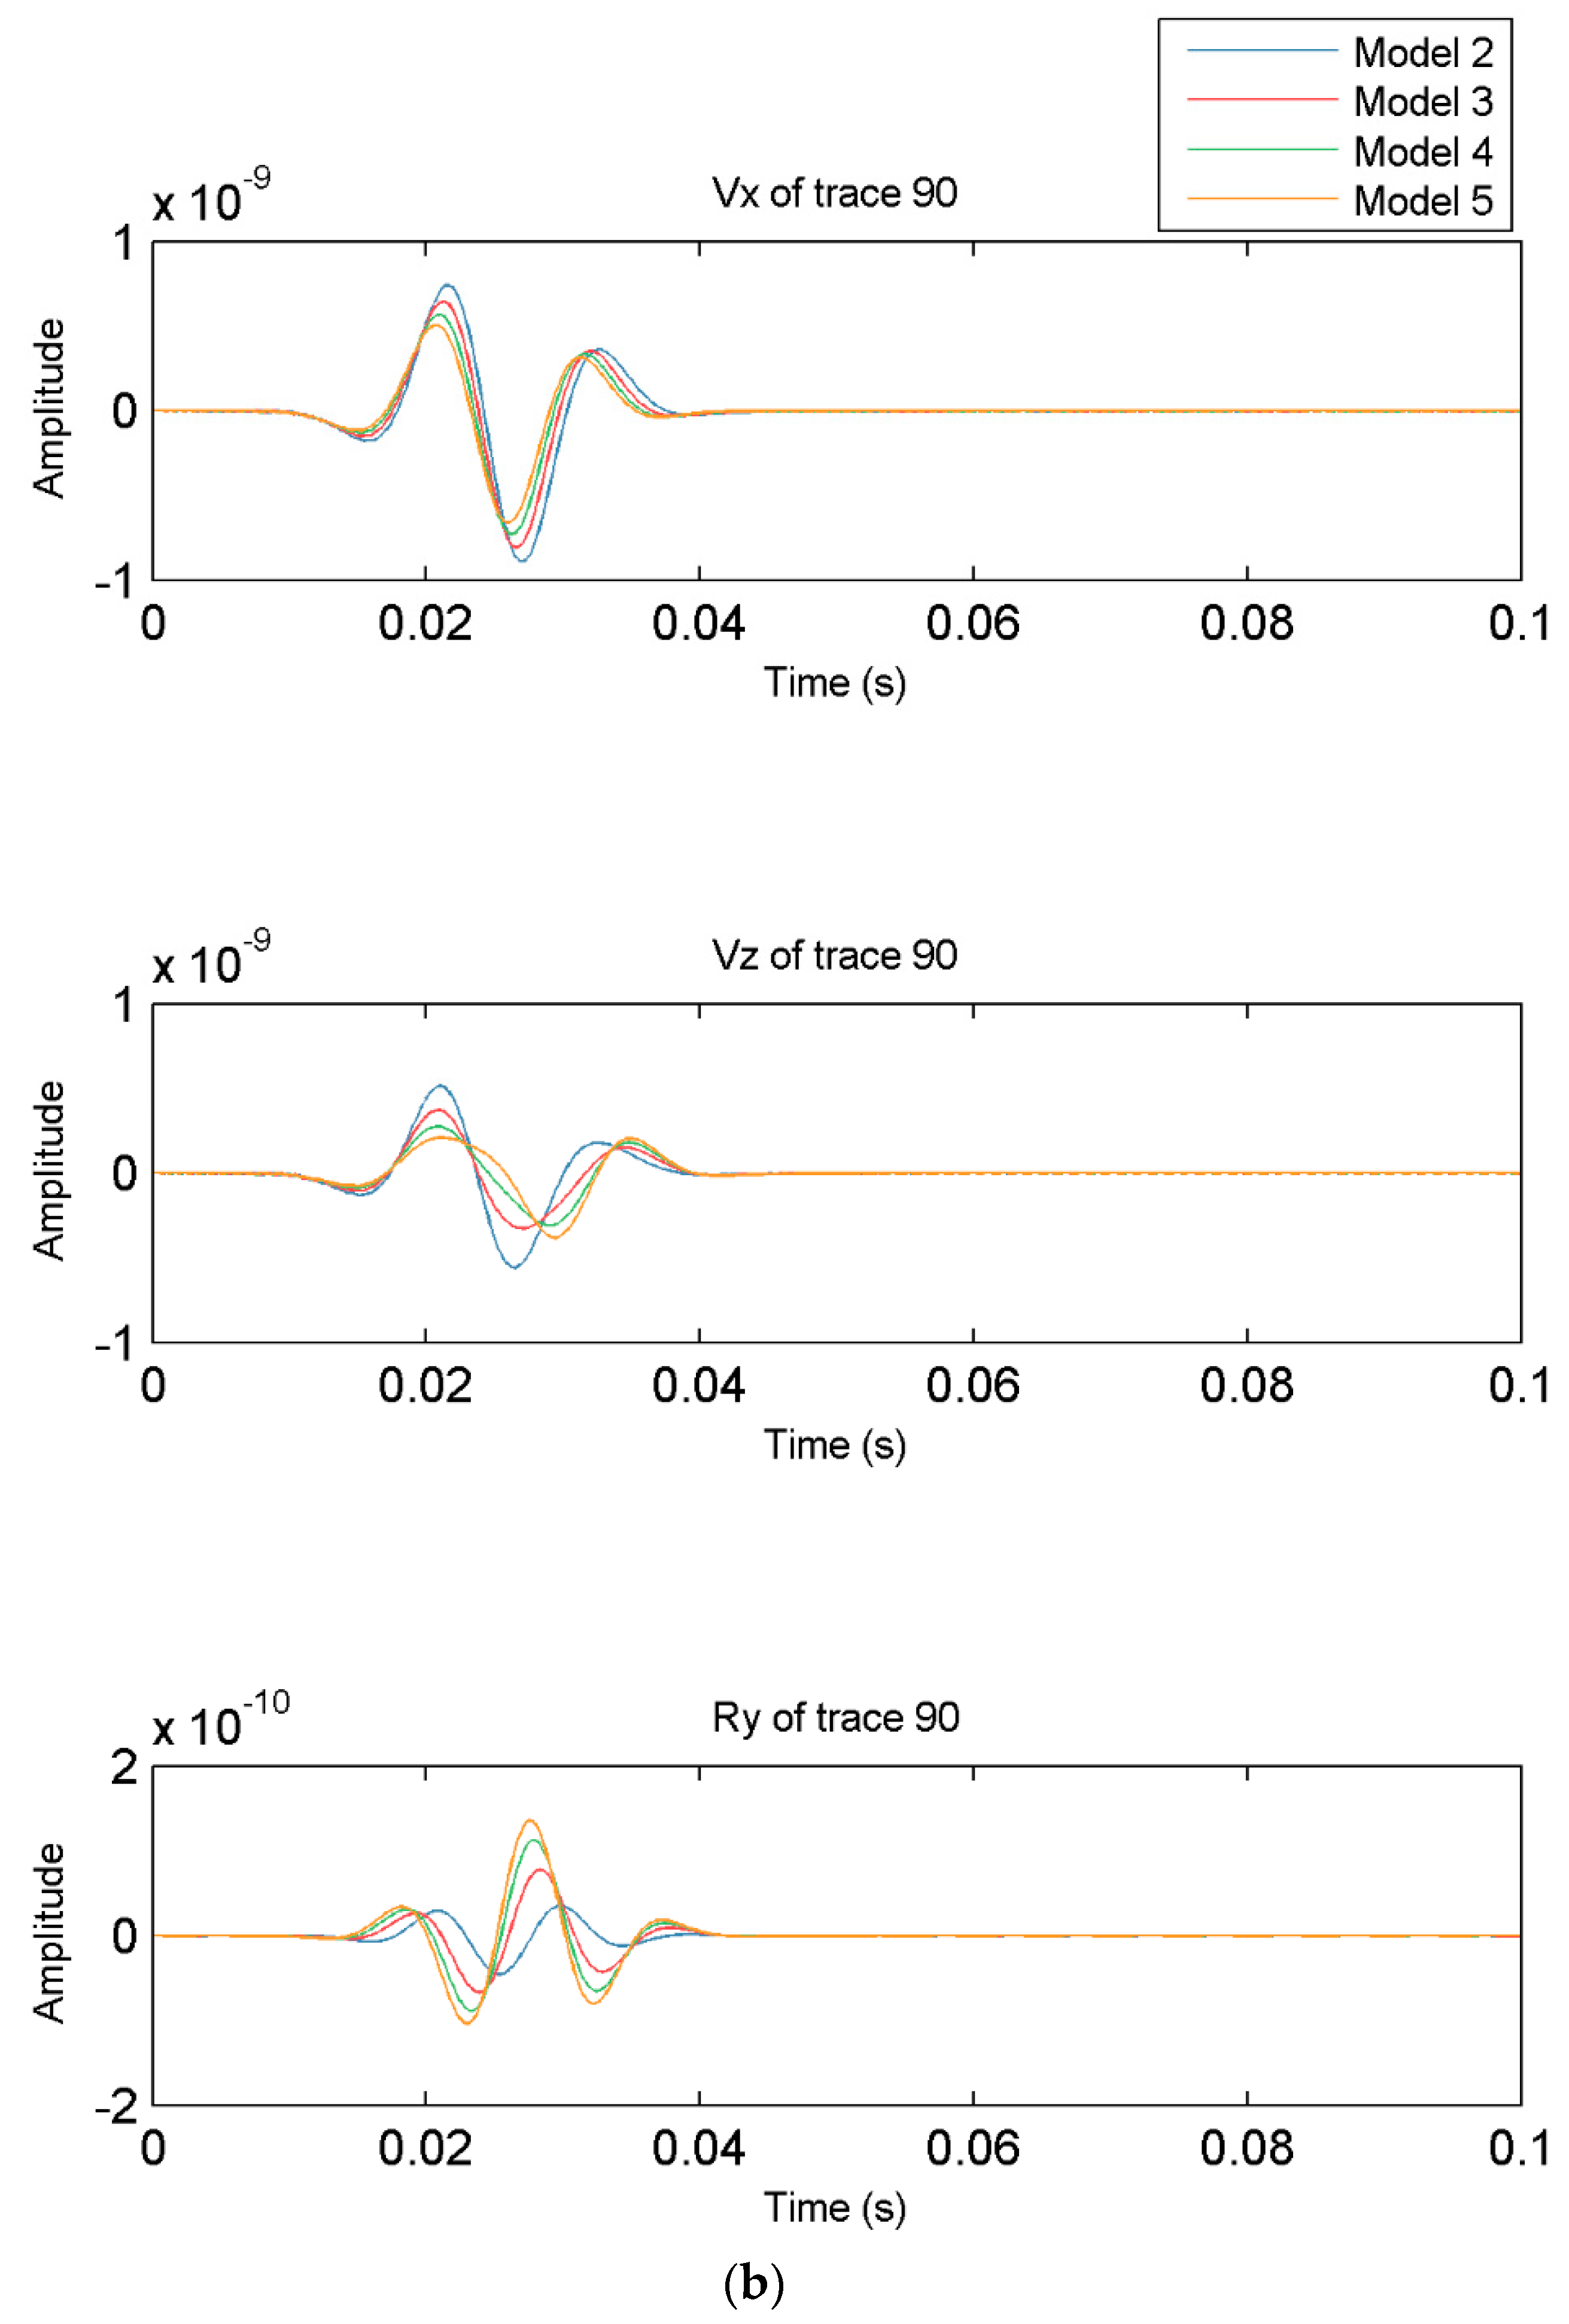
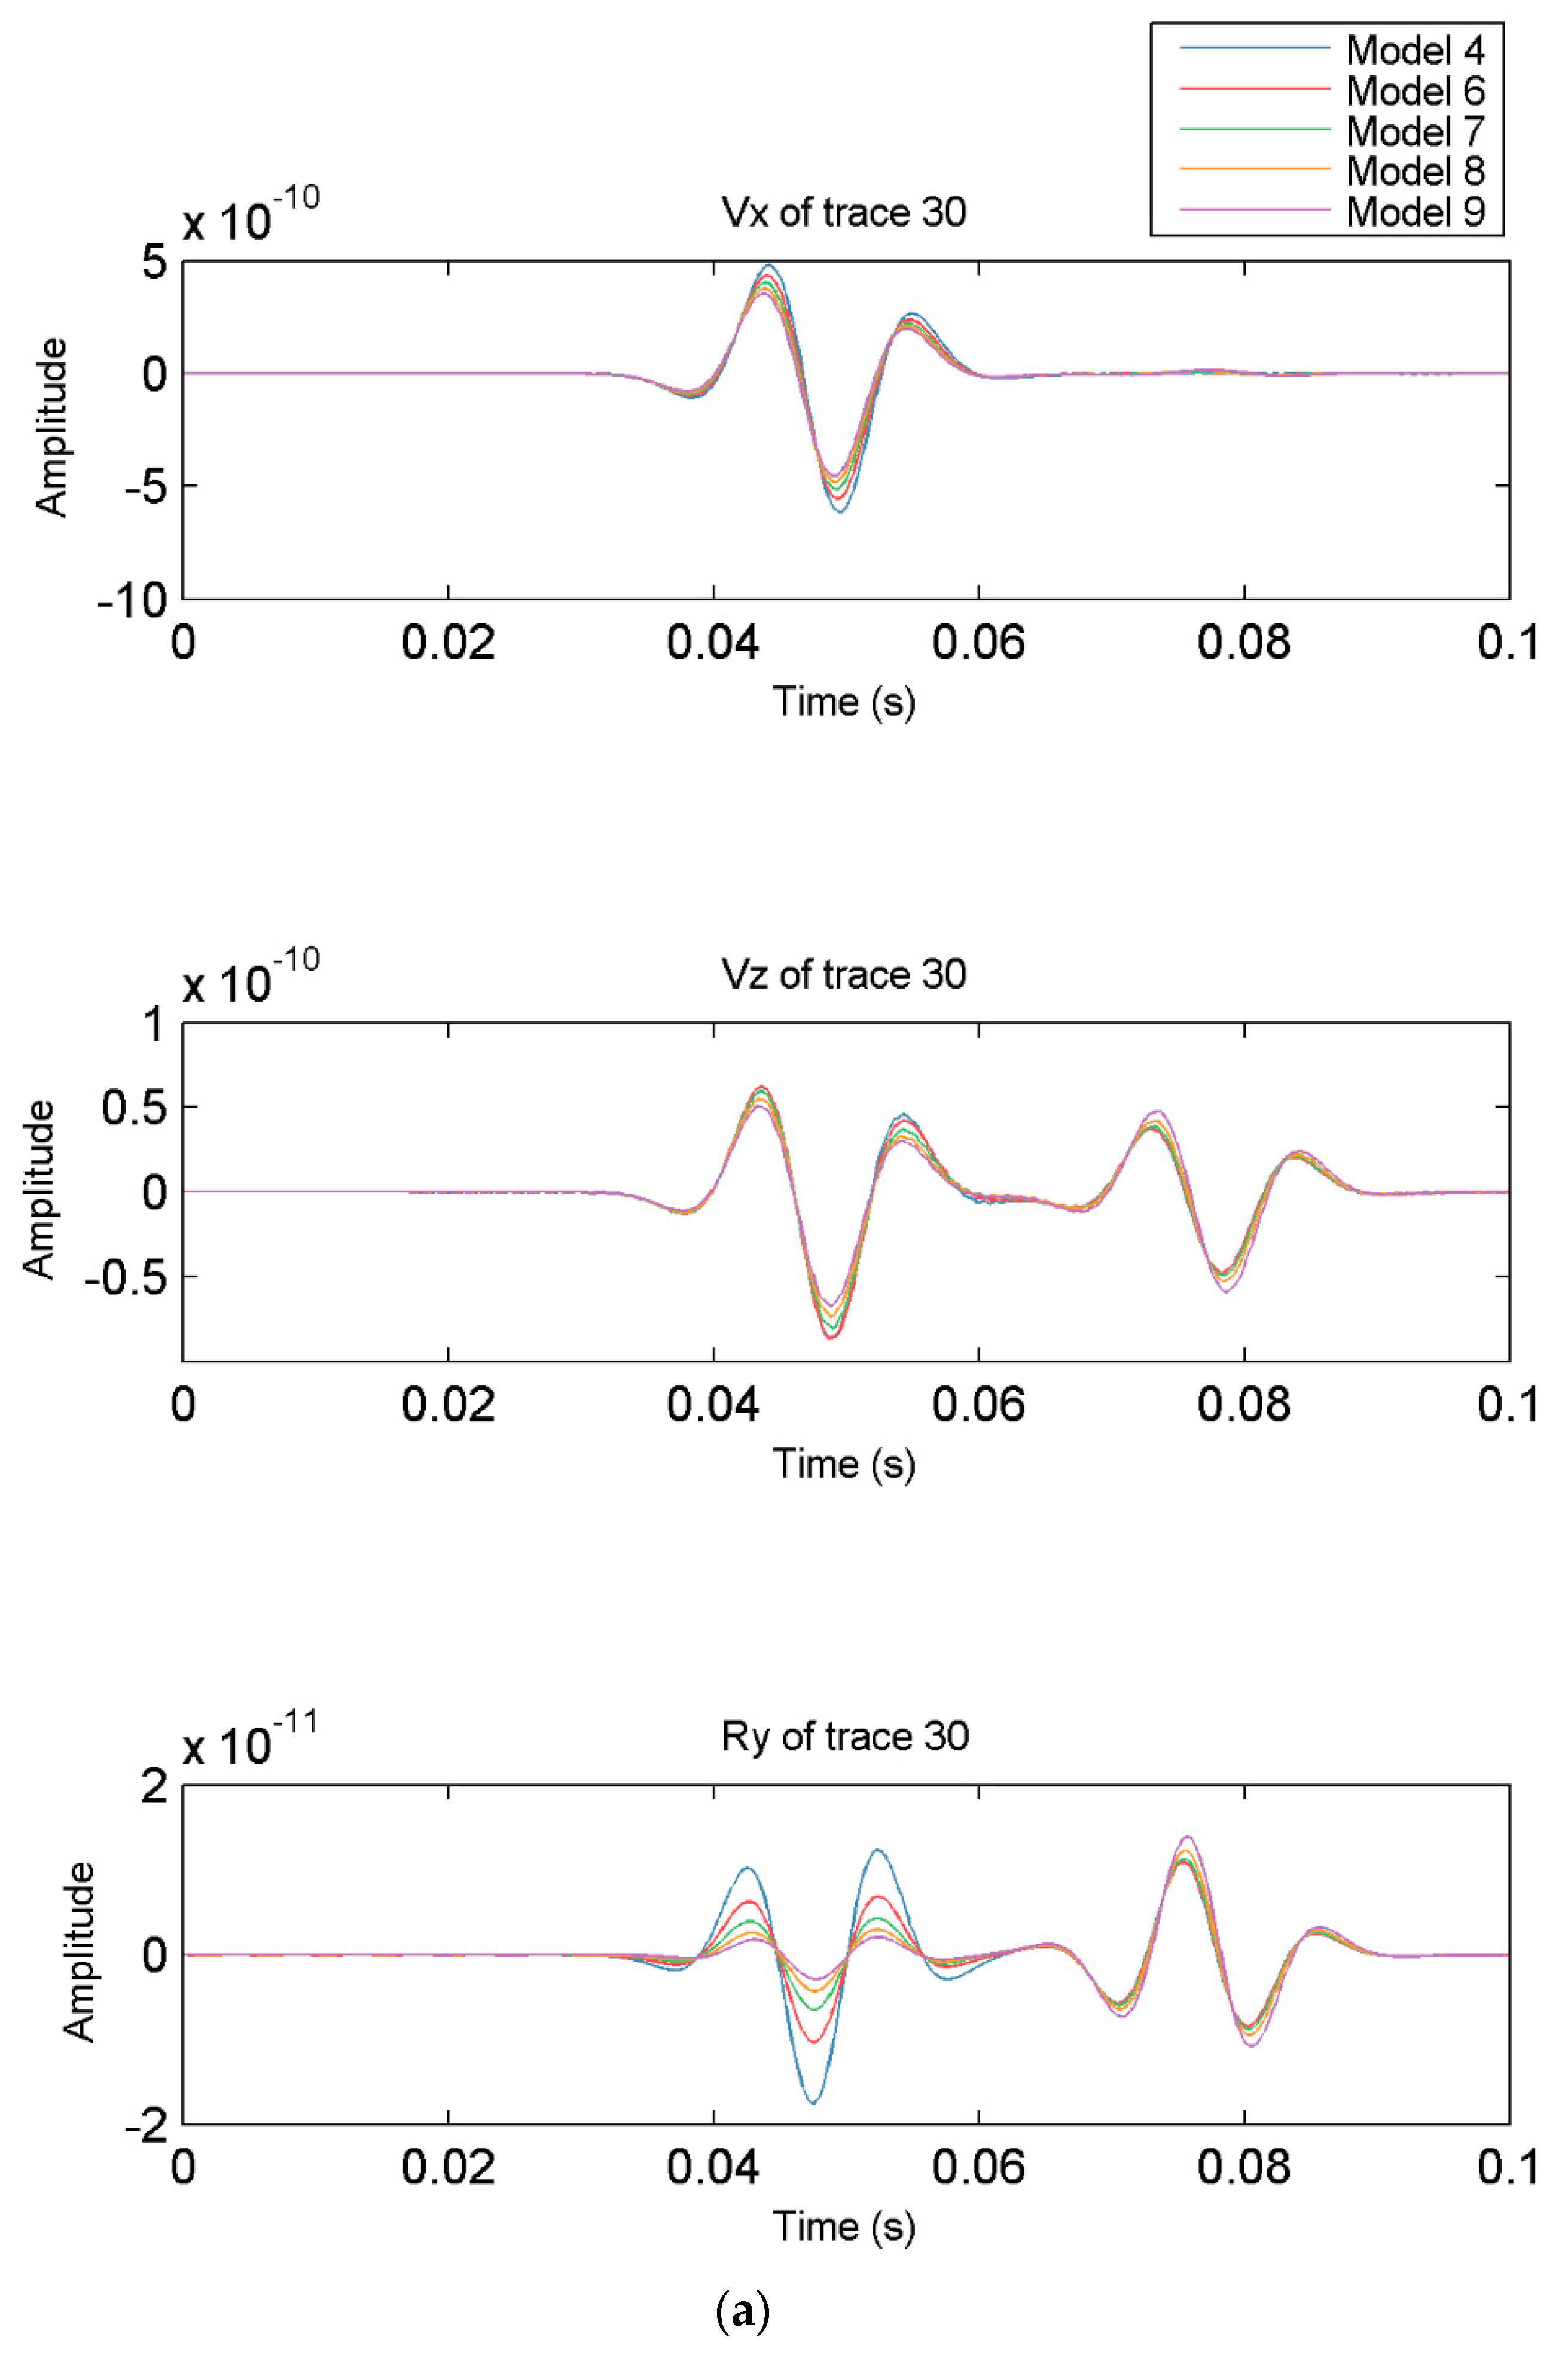
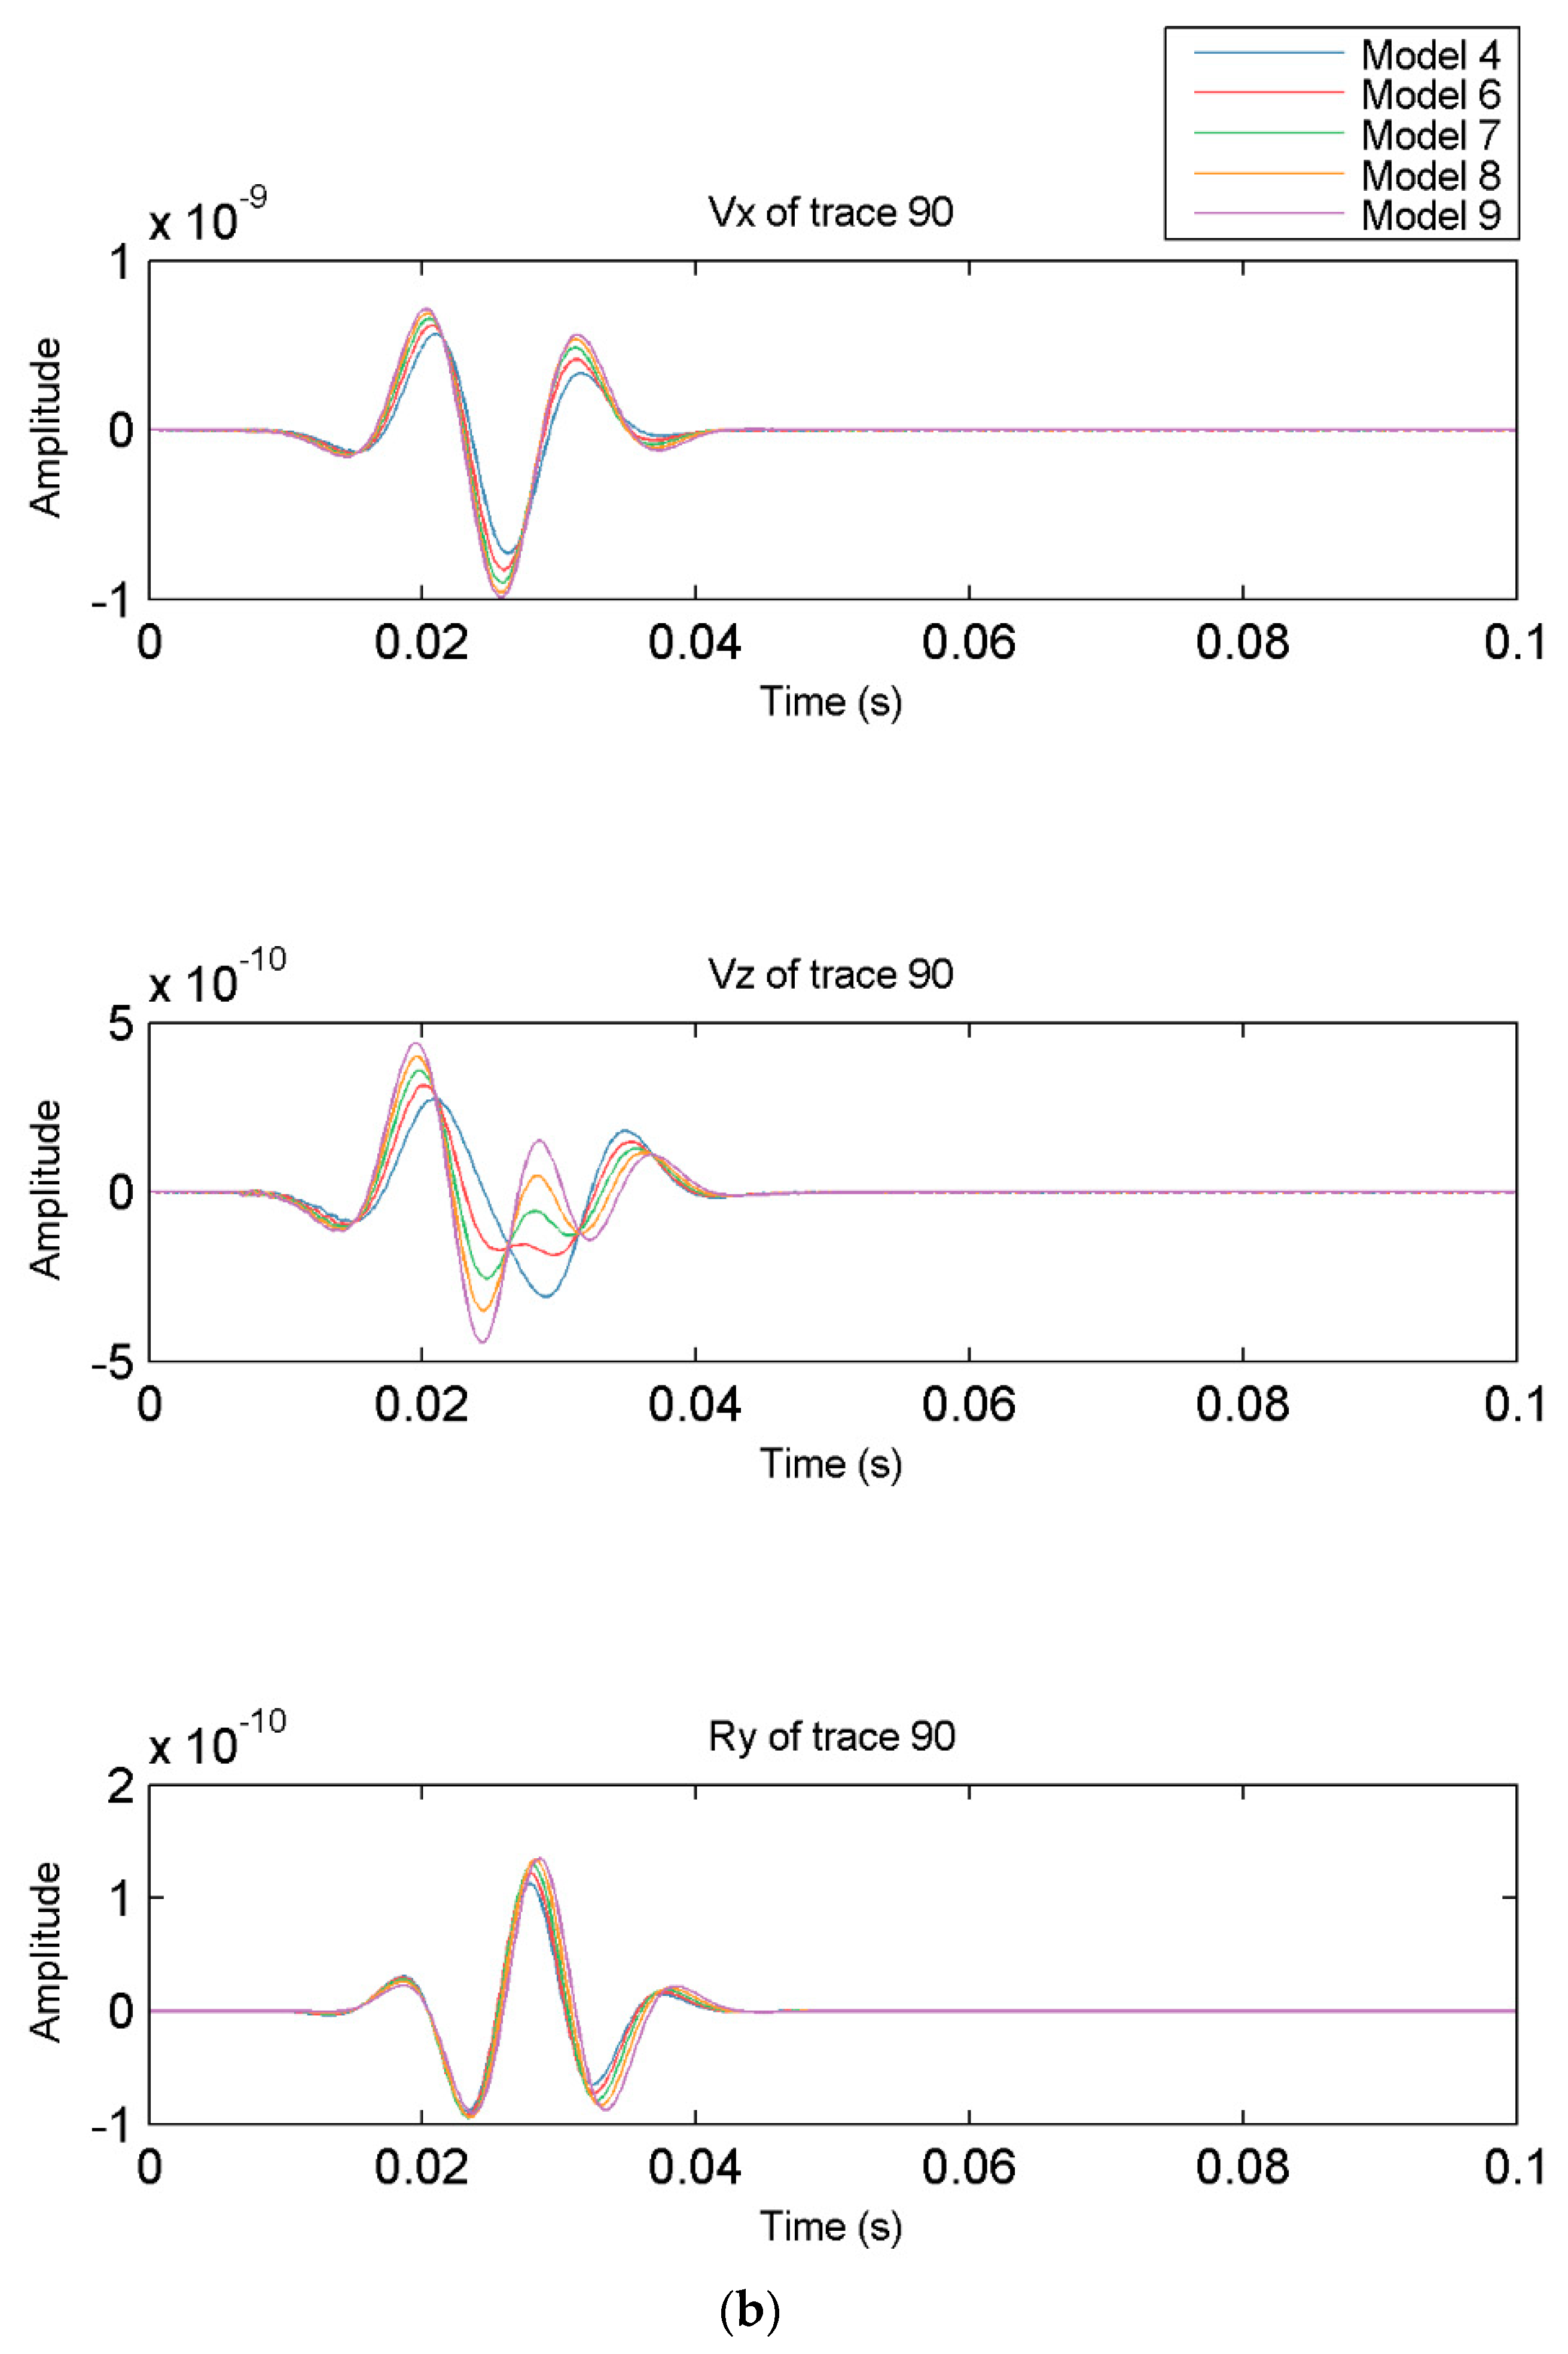
We extracted and boosted the 30th and 90th traces’ waveforms to study the effects of ε and δ on the amplitude and phase of seismic waves, which represented the far and near offset traces, respectively, to analyze the dynamic characteristics in detail. With the increase of ε, the amplitude and phase of the seismic waveforms showed obvious variations, as illustrated in Figure 8. In the near offset, with the increase of ε, the X components changed slightly. The peak values of Z components decreased gradually, while those of components increased gradually. However, in the far offset, the peak values of components increased slightly, while the phase varied widely with the increase of ε.
The effects of δ on waves’ dynamic characteristics are shown in Figure 9. The effects of anisotropy on the X components were nearly negligible in the far offset, while the effects on the components were obvious. The Z components changed substantially with the increase of δ in the near offset. The waves on the rotational components changed more obviously than those on translational components with increasing δ.
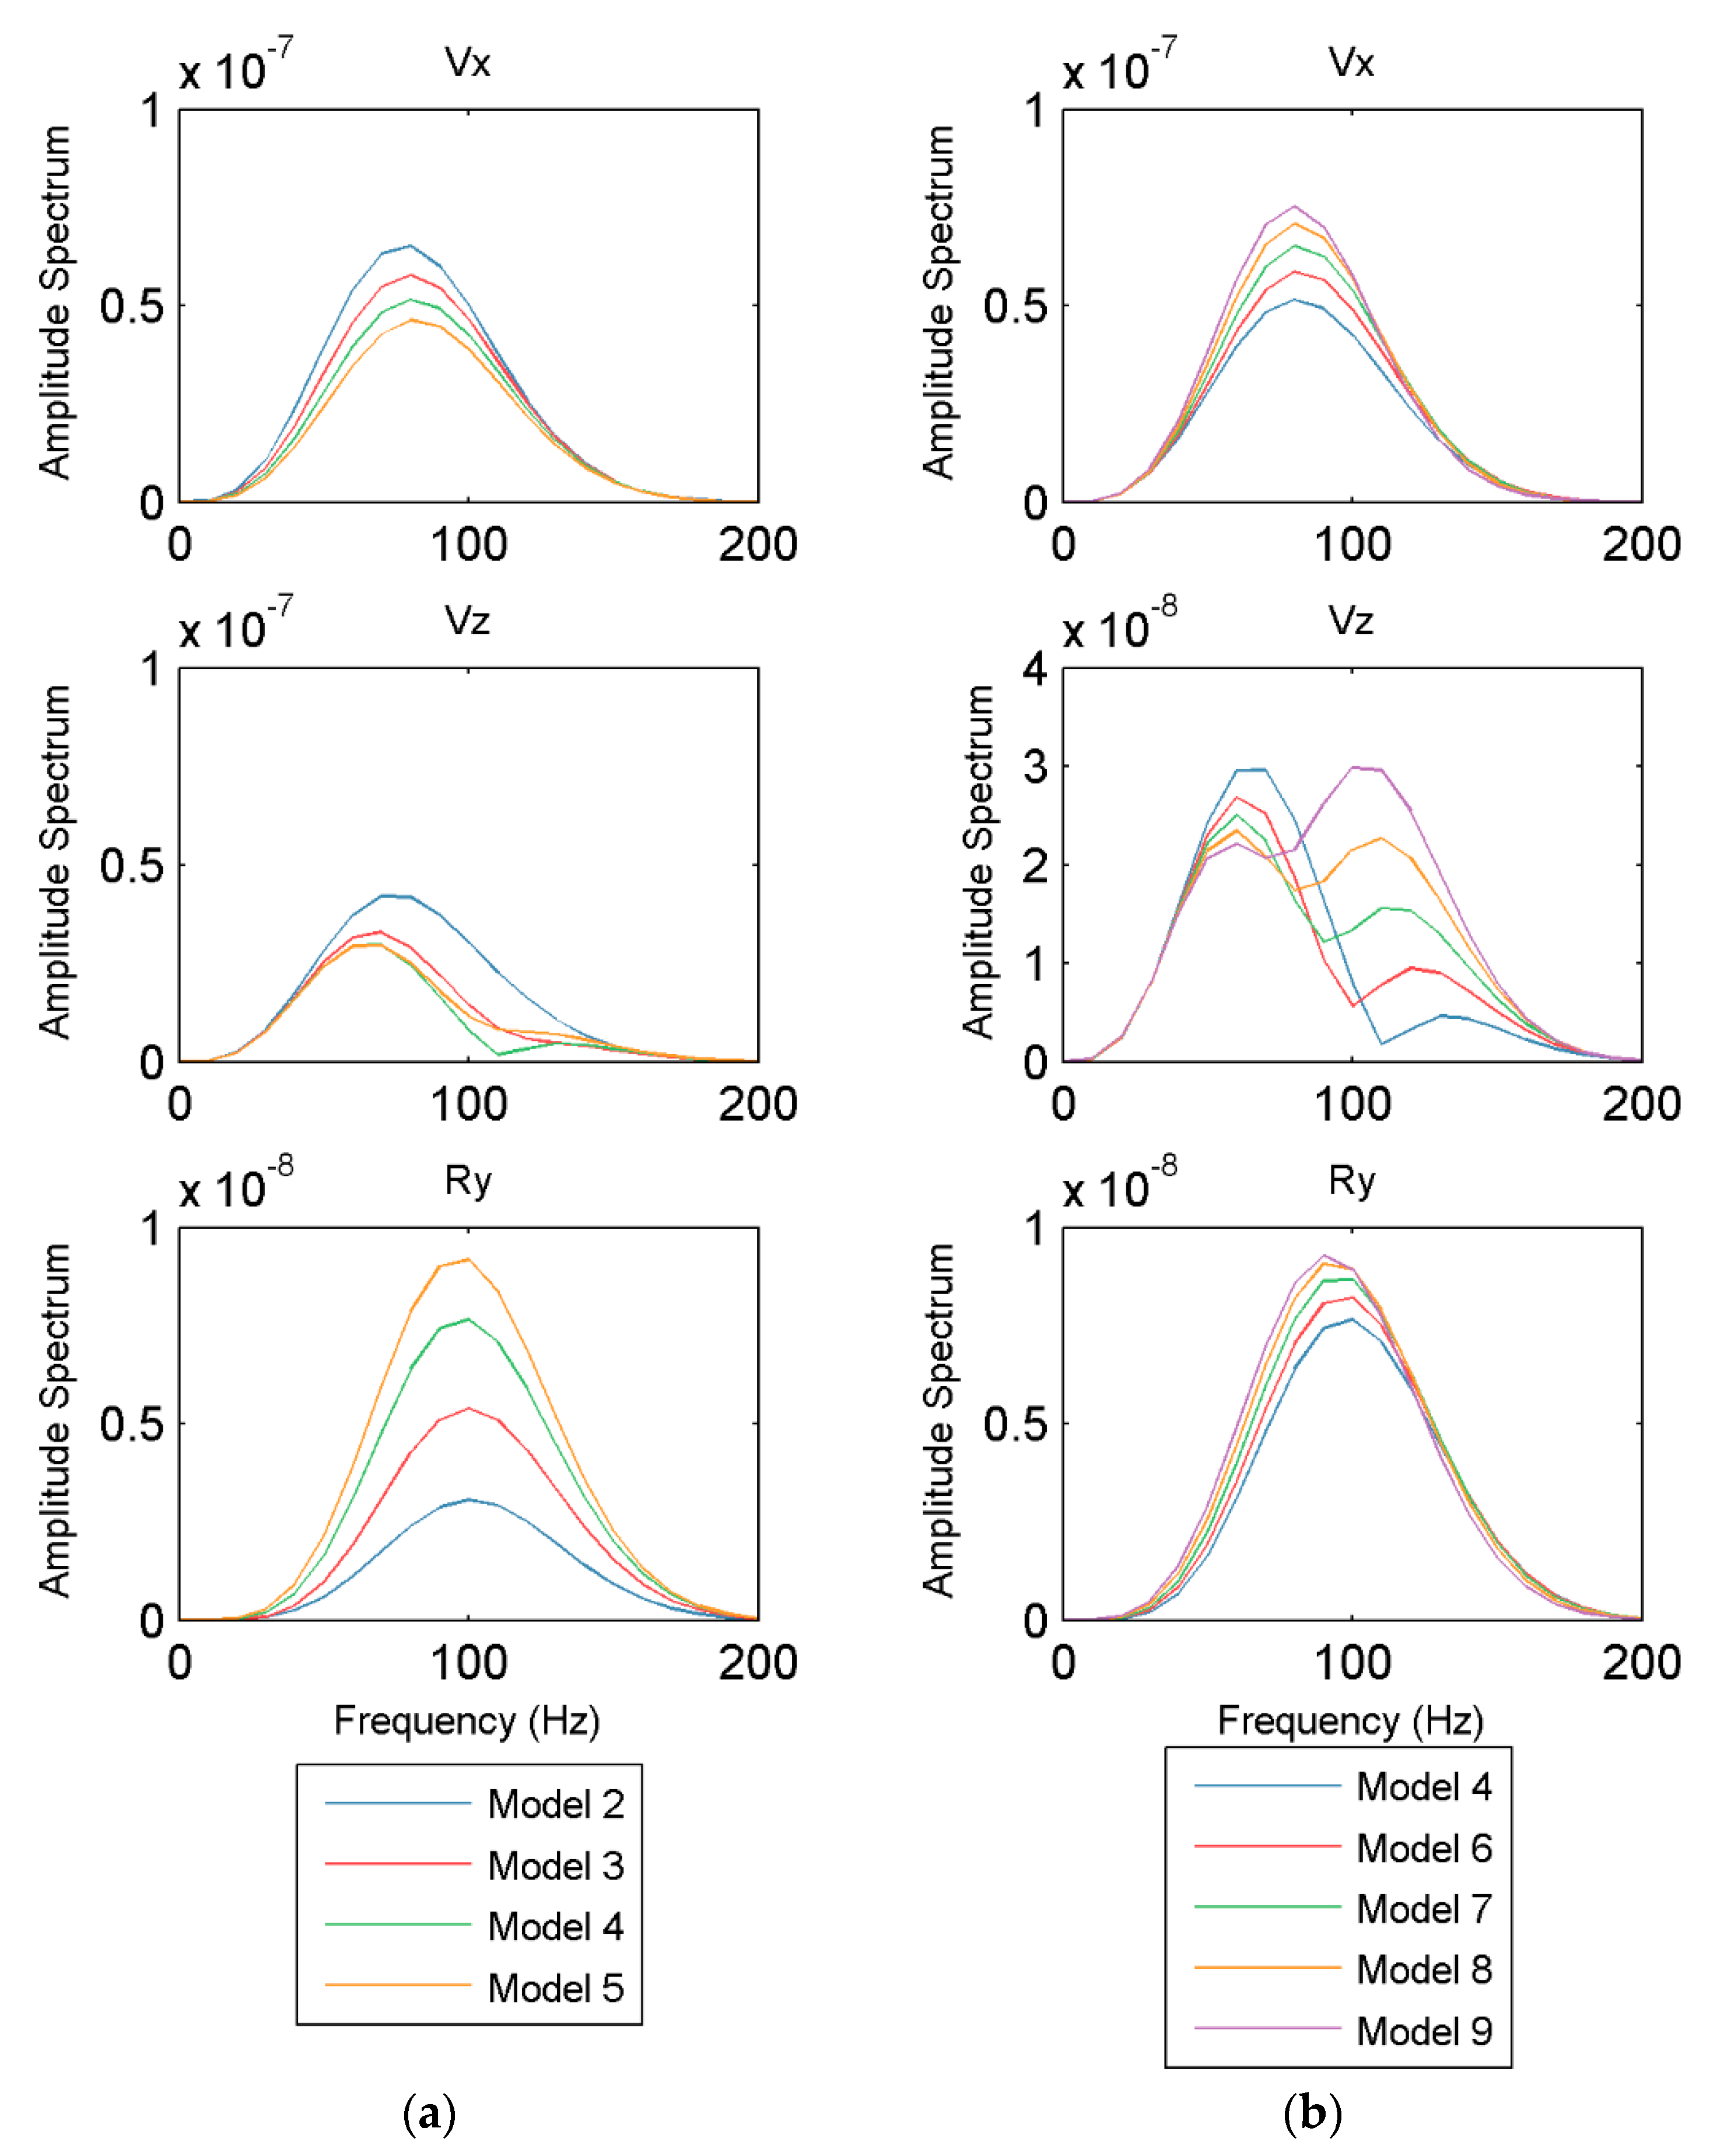
Furthermore, the influence of ε and δ on different components is shown in the amplitude and phase spectra (Figure 10 and Figure 11). We can conclude that the rotational components had more high-frequency information than the translational components, since the spectra of X components were mainly in the frequency range 60–100 Hz, Z components are mainly in the frequency range 70–110 Hz, and components in the frequency range 80–120 Hz. The amplitude variation of the components was much greater than that of the X components with the variation of ε. On the Z components, the bandwidths of the wave fields became smaller, and the central frequencies became lower as ε increased. In addition, δ had less of an influence on the amplitude spectra of the three components than ε. With the increase of δ, the amplitudes of the wave fields on the X components and the components increased slightly, while the amplitudes on the Z components showed a greater increase in the high frequencies.
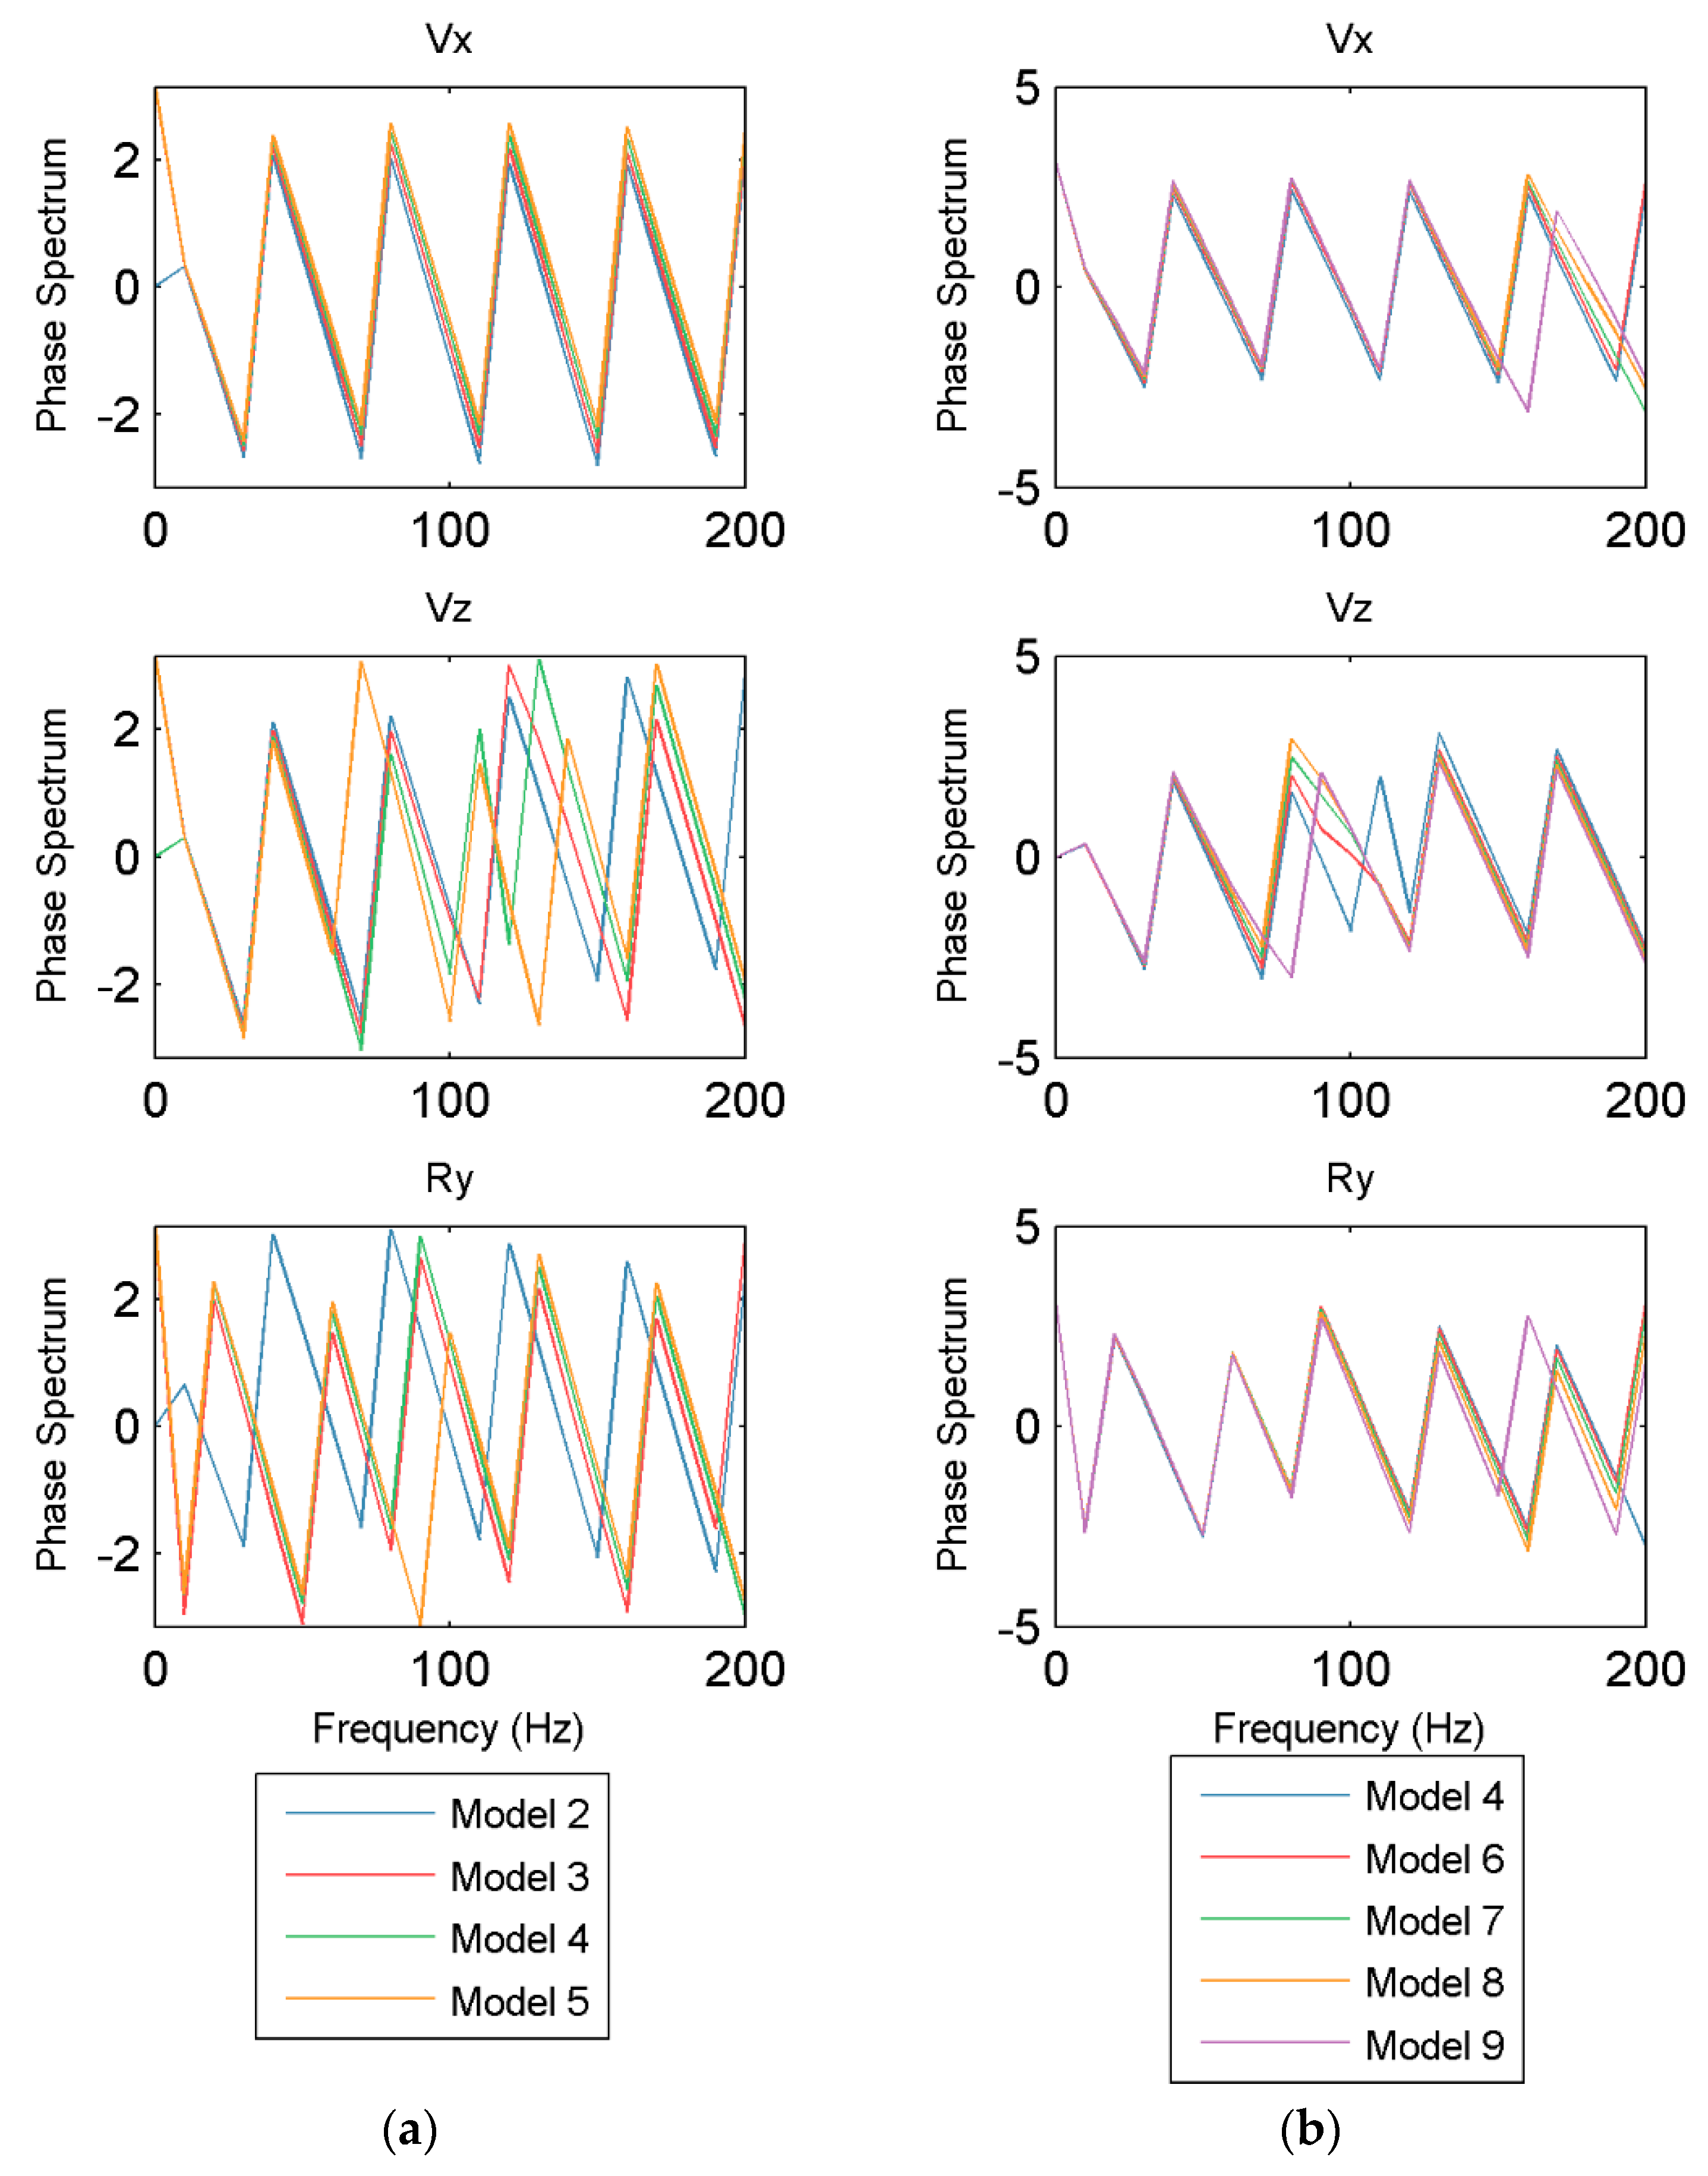
In Figure 11, there are barely visible variations in the phase spectra of the X components with variation of ε, demonstrating that ε had a minor effect on the X components. The Z components of the four models differed mainly in the frequency range 100–200 Hz, while they were almost the same in the low frequencies. With the increase of ε, the phase spectra of components varied more greatly than the translational components. The effects of δ variation on the phase spectra of three components were less pronounced than the effects of ε variation. The phase variation of X components was weak except in the frequency range 180–200 Hz, while it was more substantial in the frequency range 90–130 Hz for the Z components. With the increase of δ, the phase spectra of components differed slightly, but they were significantly different from the isotropic condition. It can be deduced that rotation observations may be preferable to the study of anisotropic parameters.
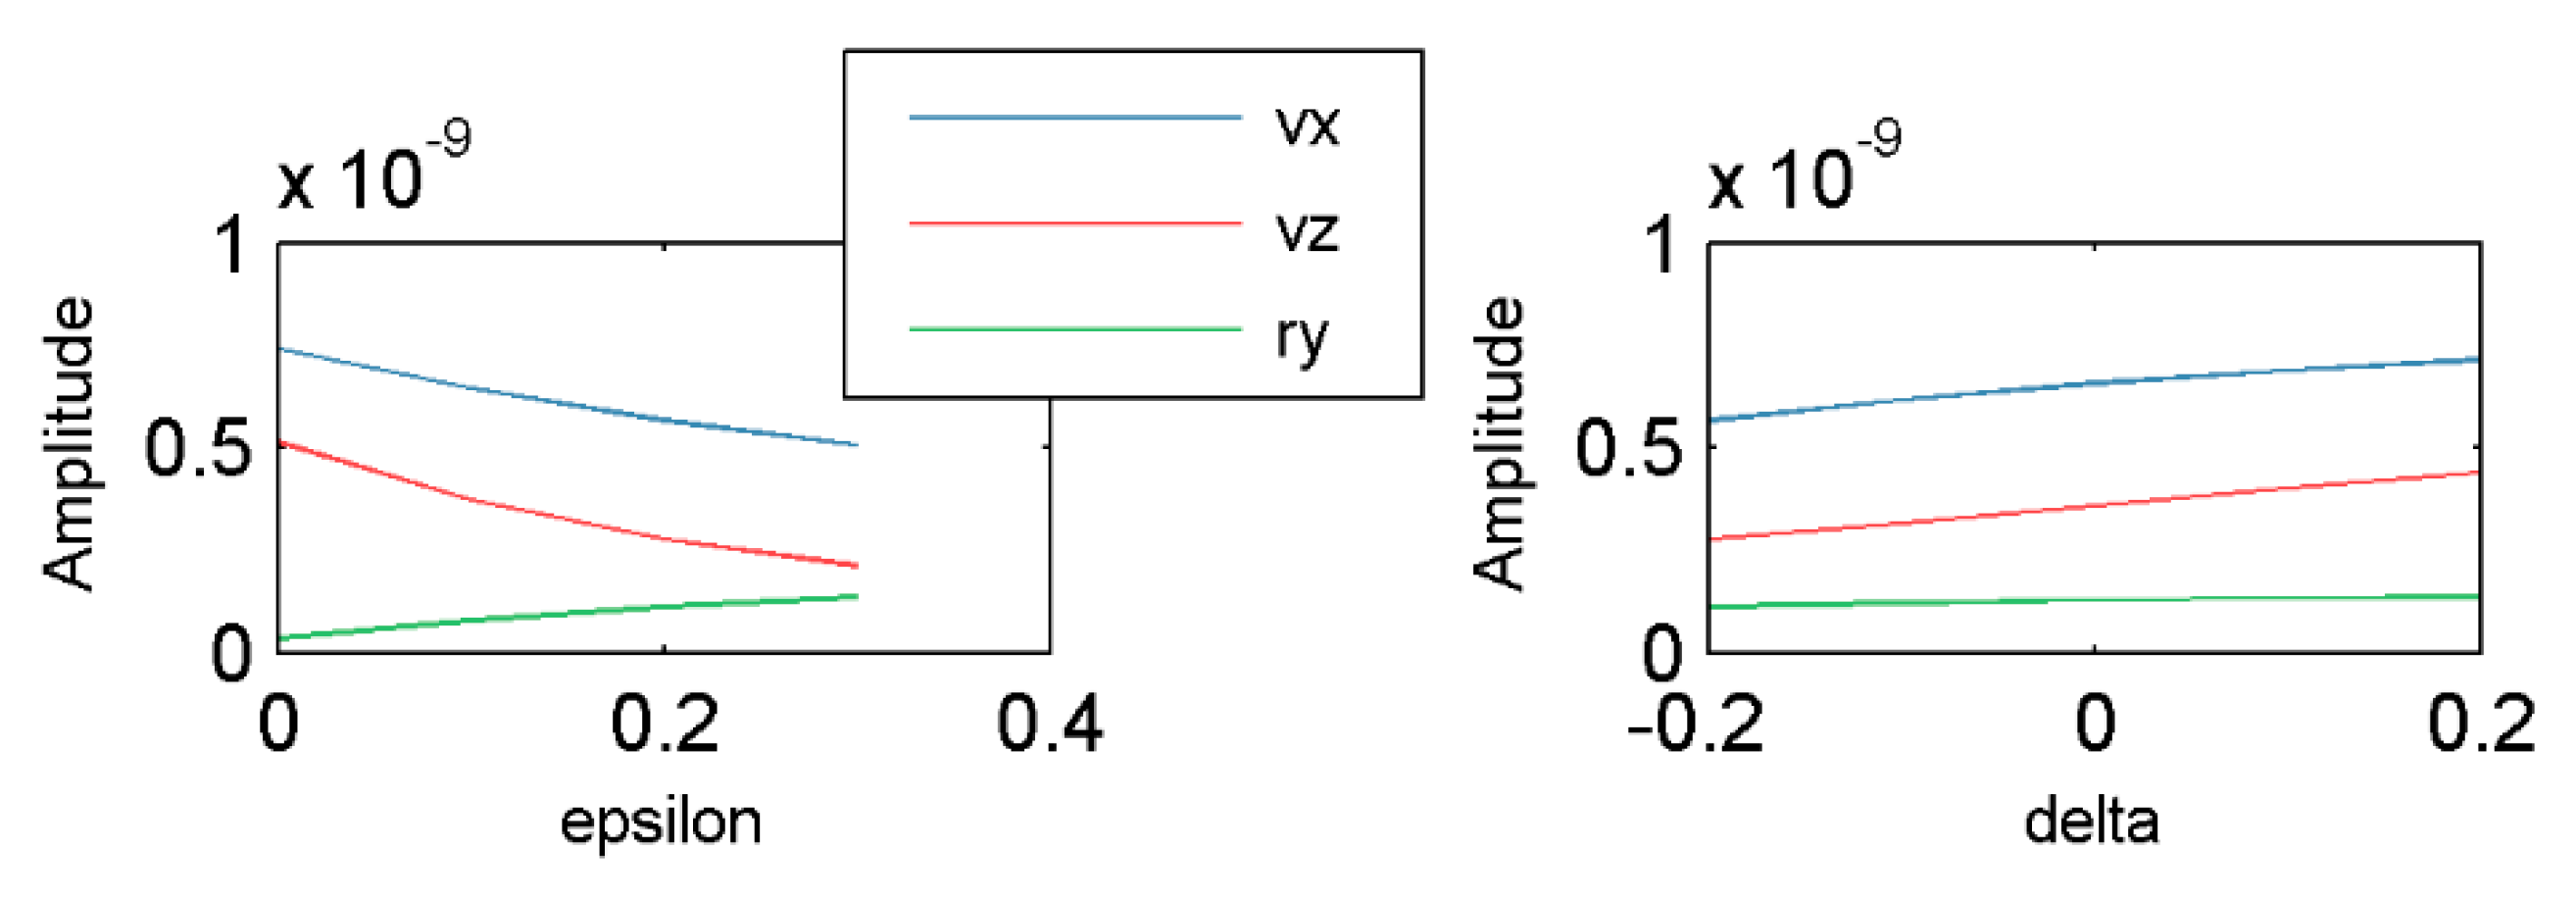
Peak values of the 90th trace in different models can be seen in Figure 12. We found that the peak values of the rotational components increased gradually with the increase of ε, while they were almost the same with increasing δ.
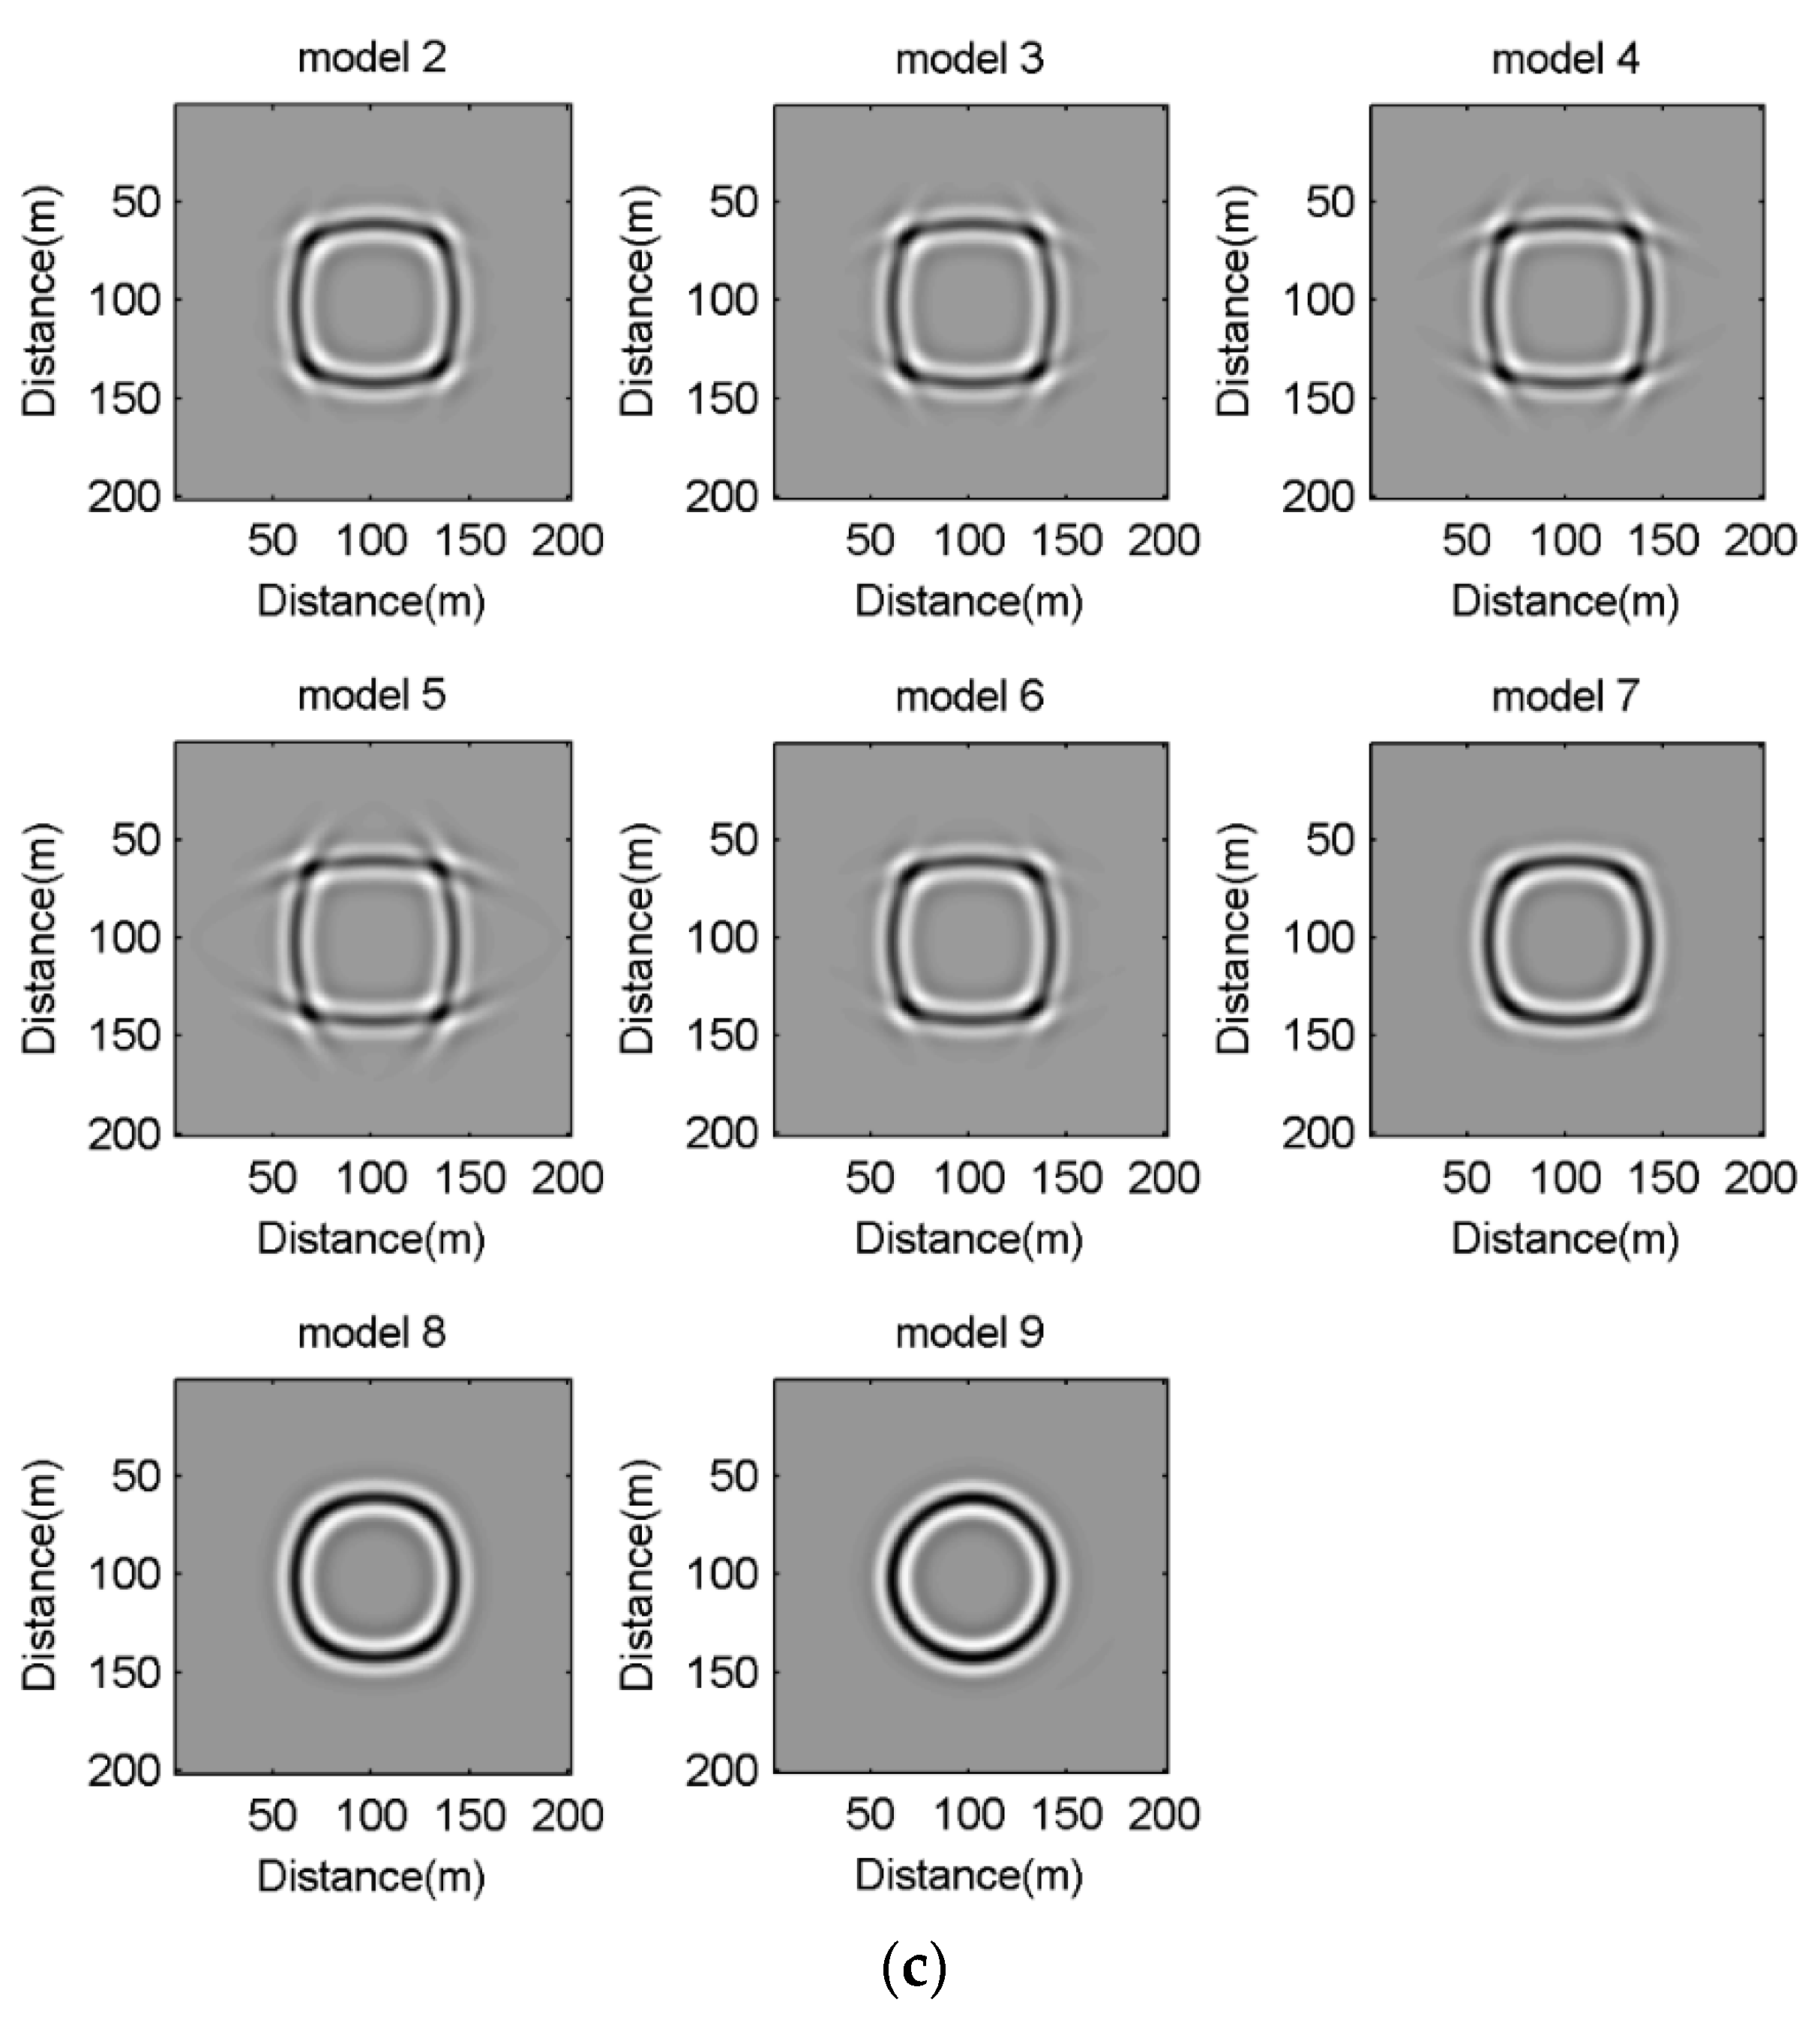
To demonstrate the influence of the source on rotation, the seismic synthetic data and snapshots of wave fields at 0.05 s generated from different sources for different models are shown in Figure 13 and Figure 14. There are obviously P waves and S waves in the seismic synthetic data generated from the radial concentrated force source, while there are few P waves in the seismograms generated from the other sources. The energy of P waves in the components generated from the radial concentrated force source was stronger than that generated from the vertical concentrated force source and shear source. With the increase of ε, the energy of P waves generated from the radial concentrated force source was much more enhanced than that of S waves, which is completely opposite to the outcome observed with increasing δ. Since S waves existed in the components generated from the vertical concentrated force and shear source, it can be seen that the energy of S waves gradually increased with the increase of ε and δ.
The shape of the wavefront was an ellipse in VTI media generated from the shear source and concentrated force source in the components, while the wavefront was round in isotropic medium. The energy of P waves was much weaker than that of S waves, although it could barely be seen in the snapshots of wave fields generated from the shear source and vertical concentrated force source. With the increase of ε, the eccentricity of the wavefronts gradually increased. However, with the increase of δ, the eccentricity of the ellipse gradually decreased to near-circular. We conclude that the sources have a great influence on the wave fields of the component.
5. Conclusions
We simulated seismic waves in VTI media with different anisotropic parameters under different sources and analyzed the similarities and differences between the translational components and the rotational components, especially focusing on the effects of anisotropic parameters on the rotational motions. We drew the following conclusions from these synthetic examples:
- The energy of S waves is significantly stronger than that of P waves in the rotational components, and the rotational components have more high-frequency information.
- The wave fields of rotations propagate with different phase distributions under different source mechanisms in space, and the vertical concentrated force source and shear source cause much stronger rotations than the others.
- The amplitude and phase characteristics of the rotations are more complex in VTI media, which is helpful to distinguish VTI media from isotropic media. With the increase of ε and δ, the energy of the rotational components increases. With the increase of ε, the eccentricity of the wavefronts gradually increases, while with the increase of δ the eccentricity of the ellipse gradually decreases to near-circular.
- Rotations are influenced more significantly by anisotropic parameters than translations, which indicates that the response of the rotations to the anisotropy is more sensitive.
From the simulations and comparisons introduced in this paper, we can deduce that rotation will be beneficial to distinguish VTI media from isotropic media and to predict their anisotropic parameters.
Author Contributions
Conceptualization, L.S. and Y.W. (Yun Wang); investigation, W.L.; writing—original draft preparation, L.S.; writing—review and editing, L.S. and Y.W. (Yun Wang); visualization, Y.W. (Yongxiang Wei). All authors have read and agreed to the published version of the manuscript.
Funding
This research was funded by the National Natural Science Foundation of China, grant number U1839208 and 41425017.
Institutional Review Board Statement
Not applicable.
Informed Consent Statement
Not applicable.
Data Availability Statement
Not applicable.
Acknowledgments
We gratefully acknowledge financial support by the National Natural Science Foundation of China (U1839208, 41425017).
Conflicts of Interest
The authors declare no conflict of interest.
References
- Trifunac, M.D. Review: Rotations in Structural Response. Bull. Seismol. Soc. Am. 2009, 99, 968–979. [Google Scholar] [CrossRef]
- Jaroszewicz, L.R.; Kurzych, A.; Krajewski, Z.; Marć, P.; Kowalski, J.K.; Bobra, P. Review of the Usefulness of Various Rotational Seismometers with Laboratory Results of Fibre-Optic Ones Tested for Engineering Applications. Sensors 2016, 16, 2161. [Google Scholar] [CrossRef] [PubMed] [Green Version]
- Lee, W.H.K.; Igel, H.; Trifunac, M.D. Recent advances in rotational seismology. Seismol. Res. Lett. 2009, 80, 479–490. [Google Scholar] [CrossRef]
- Kozák, J.T. Tutorial on earthquake rotational effects: Historical examples. Bull. Seismol. Soc. Am. 2009, 99, 998–1010. [Google Scholar] [CrossRef]
- Guidotti, R.; Castellani, A.; Stupazzini, M. Near-field earthquake strong ground motion rotations and their relevance on tall buildings. Bull. Seismol. Soc. Am. 2018, 108, 1171–1184. [Google Scholar] [CrossRef]
- Igel, H.; Cochard, A.; Wassermann, J.; Flaws, A.; Schreiber, U.; Velikoseltsev, A.; Pham Dinh, N. Broad-band observations of earthquake-induced rotational ground motions. Geophys. J. Int. 2007, 168, 182–196. [Google Scholar] [CrossRef] [Green Version]
- Wang, H.; Igel, H.; Gallovič, F.; Cochard, A. Source and basin effects on rotational ground motions: Comparison with translations. Bull. Seismol. Soc. Am. 2009, 99, 1162–1173. [Google Scholar] [CrossRef]
- Ferreira, A.M.G.; Igel, H. Rotational Motions of Seismic Surface Waves in a Laterally Heterogeneous Earth. Bull. Seismol. Soc. Am. 2009, 99, 1429–1436. [Google Scholar] [CrossRef]
- Pham, N.D.; Igel, H.; de la Puente, J.; Käser, M.; Schoenberg, M.A. Rotational motions in homogeneous anisotropic elastic media. Geophysics 2010, 75, D47–D56. [Google Scholar] [CrossRef] [Green Version]
- Tang, L.; Fang, X. Generation of 6-C synthetic seismograms in stratified vertically transversely isotropic media using a generalized reflection and transmission coefficient method. Geophys. J. Int. 2021, 255, 1554–1585. [Google Scholar] [CrossRef]
- Barak, O.; Brune, R.; Herkenhoff, F.; Dash, R.; Rector, J.; Ronen, S. Seven-component seismic data. In SEG Technical Program Expanded Abstracts 2013; Society of Exploration Geophysicists: Tulsa, OK, USA, 2013; pp. 5151–5155. [Google Scholar]
- Sun, L.; Zhang, Z.; Wang, Y. Six-component elastic-wave simulation and analysis. EGU General Assembly. In Geophysical Research Abstracts; EGU2018-14930-1; EGU Press: Munich, Germany, 2018; Volume 20. [Google Scholar]
- Zhang, Z.; Sun, L.; Tang, G.; Xu, T.; Wang, Y.; Wang, M.; Guo, X. Numerical simulation of the six-component elastic-wave field. Chin. J. Geophys. 2020, 63, 2375–2385. [Google Scholar]
- Thomsen, L. Weak elastic anisotropy. Geophysics 1986, 51, 1954–1966. [Google Scholar] [CrossRef]
- Madariaga, R. Dynamics of an expanding circular fault. Bull. Seismol. Soc. Am. 1976, 66, 639–666. [Google Scholar] [CrossRef]
- Li, P.; Lin, W.; Zhang, X. Comparisons for regular splitting and non-splitting perfectly matched layer absorbing boundary conditions. Acta Acust. 2015, 40, 44–53. [Google Scholar]
- Zhang, Z. Geological Seismic Waves in Three-Dimensional Anisotropic Media; Changchun Institute of Geology Press: Changchun, China, 1989. [Google Scholar]
Figure 1.
The translations and rotations.

Figure 2.
The seismograms. (a) The radial concentrated force source. (b) The vertical concentrated force source. (c) The shear source.
Figure 2.
The seismograms. (a) The radial concentrated force source. (b) The vertical concentrated force source. (c) The shear source.

Figure 3.
Seismograms of the 30th trace.

Figure 4.
Snapshots of wave fields at 0.05 s. (a) Radial concentrated force source. (b) Vertical concentrated force source. (c) Shear source.
Figure 4.
Snapshots of wave fields at 0.05 s. (a) Radial concentrated force source. (b) Vertical concentrated force source. (c) Shear source.


Figure 5.
Components generated from the expansion source in different models.

Figure 6.
Wave field snapshots of generated from the expansion source at 0.05 s.

Figure 7.
FK spectra of generated from the expansion source in different models.

Figure 8.
Influence of ε on seismic records generated from the expansion source: (a) the seismic records of the 30th trace; (b) the seismic records of the 90th trace.
Figure 8.
Influence of ε on seismic records generated from the expansion source: (a) the seismic records of the 30th trace; (b) the seismic records of the 90th trace.


Figure 9.
Influence of δ on seismic records generated from the expansion source: (a) the seismic records of the 30th trace; (b) the seismic records of the 90th trace.
Figure 9.
Influence of δ on seismic records generated from the expansion source: (a) the seismic records of the 30th trace; (b) the seismic records of the 90th trace.


Figure 10.
Influence of anisotropy parameters on amplitude spectra of the 90th trace generated from the expansion source: (a) when ε varies; (b) when δ varies.
Figure 10.
Influence of anisotropy parameters on amplitude spectra of the 90th trace generated from the expansion source: (a) when ε varies; (b) when δ varies.

Figure 11.
Influence of anisotropy parameters on phase spectra of the 90th trace generated from the expansion source: (a) when ε varies; (b) when δ varies.
Figure 11.
Influence of anisotropy parameters on phase spectra of the 90th trace generated from the expansion source: (a) when ε varies; (b) when δ varies.

Figure 12.
Influence of ε and δ on peak values of the 90th trace generated from the expansion source.
Figure 12.
Influence of ε and δ on peak values of the 90th trace generated from the expansion source.

Figure 13.
Seismograms. (a) Radial concentrated force source. (b) Vertical concentrated force source. (c) Shear source.
Figure 13.
Seismograms. (a) Radial concentrated force source. (b) Vertical concentrated force source. (c) Shear source.


Figure 14.
Snapshots of wave fields at 0.05 s. (a) Radial concentrated force source. (b) Vertical concentrated force source. (c) Shear source.
Figure 14.
Snapshots of wave fields at 0.05 s. (a) Radial concentrated force source. (b) Vertical concentrated force source. (c) Shear source.


Table 1.
Parameters of model 1.
| Model | (m/s) | (m/s) | (kg/m3) | ε | δ |
|---|---|---|---|---|---|
| Model 1 | 2000 | 1200 | 2000 | 0 | 0 |
Table 2.
Anisotropic parameters of different models.
| Parameter | Model 2 | Model 3 | Model 4 | Model 5 | Model 6 | Model 7 | Model 8 | Model 9 |
|---|---|---|---|---|---|---|---|---|
| Ε | 0 | 0.1 | 0.2 | 0.3 | 0.2 | 0.2 | 0.2 | 0.2 |
| Δ | −0.2 | −0.2 | −0.2 | −0.2 | −0.1 | 0 | 0.1 | 0.2 |
Publisher’s Note: MDPI stays neutral with regard to jurisdictional claims in published maps and institutional affiliations. |
© 2021 by the authors. Licensee MDPI, Basel, Switzerland. This article is an open access article distributed under the terms and conditions of the Creative Commons Attribution (CC BY) license (https://creativecommons.org/licenses/by/4.0/).
Share and Cite
MDPI and ACS Style
Sun, L.; Wang, Y.; Li, W.; Wei, Y. The Characteristics of Seismic Rotations in VTI Medium. Appl. Sci. 2021, 11, 10845. https://0-doi-org.brum.beds.ac.uk/10.3390/app112210845
AMA Style
Sun L, Wang Y, Li W, Wei Y. The Characteristics of Seismic Rotations in VTI Medium. Applied Sciences. 2021; 11(22):10845. https://0-doi-org.brum.beds.ac.uk/10.3390/app112210845
Chicago/Turabian StyleSun, Lixia, Yun Wang, Wei Li, and Yongxiang Wei. 2021. "The Characteristics of Seismic Rotations in VTI Medium" Applied Sciences 11, no. 22: 10845. https://0-doi-org.brum.beds.ac.uk/10.3390/app112210845
Note that from the first issue of 2016, this journal uses article numbers instead of page numbers. See further details here.