Article

Properties and Colorimetric Performance of Screen-Printed Thermochromic/UV-Visible Fluorescent Hybrid Ink Systems

by
Tamara Tomašegović
*,
Sanja Mahović Poljaček
*,
Maja Strižić Jakovljević
* and
Ana Marošević Dolovski
Faculty of Graphic Arts, University of Zagreb, 10 000 Zagreb, Croatia
*
Authors to whom correspondence should be addressed.
Submission received: 25 October 2021 / Revised: 25 November 2021 / Accepted: 30 November 2021 / Published: 2 December 2021
(This article belongs to the Special Issue Recent Advances in Application of Coatings and Films)

Abstract

:

Featured Application

Functional packaging, temperature monitoring, hidden information, security of printed products, brand protection.

Abstract

In the present research, properties and performance of special effect printing inks were observed with the aim of obtaining a printed product with dual functional properties. Thermochromic liquid crystal-based printing ink (TLC) and UV-visible (daylight invisible) fluorescent inks (UVF), pure and as hybrid ink systems, were printed using a screen-printing technique on two types of uncoated paper substrates. Characterization of the paper substrates was performed, as well as detailed analysis of printed layers. Thickness, surface roughness, surface free energy, and adhesion parameters of printed layers were analysed. Spectral reflectance of pure UVF and TLC printing inks, as well as the spectral reflectance of the proposed hybrid ink systems were measured. The thermochromic effect of the TLC ink and hybrid systems was analysed. Microscopy was used to display the visual colour play effect and the effect of the fluorescence. Results of the measurements showed high compatibility of used materials in the proposed hybrid ink systems. Since the effect of luminescence and the colour play effect in the hybrid systems were preserved, it can be concluded that TLC/UVF hybrid ink systems can find their application in the development of functional packaging and in all other applications with special requirements for temperature monitoring and hidden information for different products.

1. Introduction

Special effect printing inks are nowadays widely used for different applications and in different industries. The effect achieved by applying a special ink on the substrate, usually in combination with other inks, gives the product a certain added value. In this research two types of special inks were used, thermochromic printing ink and UV-visible (daylight invisible) fluorescent ink as a hybrid printing ink systems with dual functional properties.
Thermochromic (TC) printing inks change their colour as a response to temperature change [1]. Two major types of TC ink apply either leuco dye-based TC composites or thermochromic liquid crystals (TLCs). These inks contain microencapsulated active material, the thermochromic “pigments”, dispersed in a suitable binder. The colouration properties are determined by the active material, whereas the binder defines the printing and drying technology [2,3]. Thermochromic printing inks can be used in several different applications such as temperature indicators, intelligent packaging, security printing, textile, brand protection, and marketing [2,4,5,6].
TLC inks have special effect inside their temperature activation range, also referred to as the “bandwidth” or “colour play interval” [7,8]. The temperature activation region of the TLC ink has several degrees and is defined by the producer. The ink is active, i.e., changes colour inside this region, but is colourless outside of it. Every TLC ink has its activation temperature TA, the point at which, during heating, the colour starts to change. This type of printing ink is the only one so far known for this colour play effect. After reaching the TA and with further heating, the effect starts with the appearance of red colour, followed by orange, yellow, green, blue, and violet [7,9]. Each of these colours is limited to a narrow temperature interval (White MA, Leblanc, 1999). Above the upper threshold of the activation range, the violet colour disappears, and the TLC ink becomes colourless again. The temperature required to reach the colourless stage is called the “clearing point” [7,10]. Our previous experiments have shown the colour cycles of TLC inks to be reversible [11].
The microencapsulated cholesteric or chiral nematic liquid crystals reflect the light on the helical structure formed inside the activation region (i.e., chiral nematic mesophase). This occurs at wavelengths equal to the optical value of the pitch length of the helix. In TLCs, the length of the helix depends on the temperature, which shifts the reflection peak across the spectrum-producing structural colour [5,7].
Microencapsulation prevents the adjacent of TLC drops from fusion or splitting and protects the active material from degradation by chemicals such as fats, greases, and solvents [5]. The protection from harmful effects of UV radiation is very poor and previous research has shown that TLC ink deteriorates in a short time if the prints are unprotected. Therefore, applications with unprotected TLC inks are suitable only for indoor purposes and for lighting conditions where no prolonged exposure to UV light is present [12].
The colour play effect of TLC inks is only clearly visible when the ink is printed on a black substrate, which can absorb the greatest part of the light transmitted through the ink layer [10,13]. In such conditions, the spectral reflection obtains clearly visible iridescent colours [14,15]. On a white substrate, most of this light is backscattered, virtually obscuring the low light intensity reflected from the molecular pitch [10].
Distinctive limitations of TLC ink in printing, handling, and combining with other printing materials puts a great challenge in development of temperature—sensitive applications and other hybrid systems.
For the purpose of this research, a hybrid printing ink systems with dual functional properties obtained in combination of two special effect printing inks, i.e., TLC printing ink and UV-visible fluorescent printing inks, are proposed.
UV-visible fluorescent pigments/inks used in this research are invisible in the daylight, only being visible when exposed to UV radiation. Because of their original properties, they belong to a group of luminescent materials; i.e., they have the possibility of absorbing the UV radiation, and re-emitting photons of a different radiation. The effect of fluorescence lasts only as long as the primary radiation acts, after which it stops almost immediately [16,17,18]. This characteristic gives them an original application and in the last decades, they have been used in the decorative and packaging industry for highlighting markers, in document security applications, and the tagging of postage stamps, etc. [19,20,21,22].
UV-visible (daylight invisible) fluorescent inks (UVF) can be used in different printing processes. Most commonly, they are used in a screen-printing technique by mixing the UV fluorescent pigment with the transparent base. Furthermore, UV fluorescent inks can be used in the form of a varnish in flexography, offset printing techniques, and in relief printing [23,24,25]. Research published before showed the possibilities of printing with UVF inks on paper substrates using the screen-printing technique by addition of silicon dioxide (SiO2) and titanium dioxide (TiO2) nanoparticles into the UVF inks. Inks were prepared by the addition of fluorescent pigment into a transparent base. Results of that research showed that the addition of nanoparticles does not cause any significant change in the visibility of the fluorescence effect. The research also addressed the influence of the aging process on the stability of fluorescent prints and concluded that the addition of nanoparticles could have a positive impact on the fading of the UVF prints and on the observed chemical and mechanical characteristics of printed coatings [26]. To observe the influence of the addition of SiO2 and TiO2 nanoparticles in the varnish used in flexography, the fluorescent varnish was printed on polyester substrate, woodfree uncoated paper, and 100% recycled packaging paper [27,28]. Results demonstrated the possibilities of achieving fluorescent phenomena by application of fluorescent inks on different printing substrates with different surface properties. The authors in [25] investigated the effects of ink media on the fluorescence properties of fluorescent dyes used in the offset-printing technique. The effect of fluorescence was observed in digital electrophotographic printing processes as well [29].
Having in mind that the fluorescence effect can be used in different applications; research on this phenomenon is interesting from different aspects. It demands a complex approach in studying the interactions of fluorescent material with other materials in contact to meet the specific printing requirements and ensure their optimal functional application.
This research proposes a new functional printing ink with dual functional properties that could be used as a common hybrid system in the proposed combination. It includes pure TLC printing ink, as well as two hybrid ink systems based on the combination of TLC and UV-visible fluorescent pigments/printing inks, printed on two types of black uncoated paper substrates. The combination of these materials could be used in the development of functional packaging, security applications, and brand protection, as well as all other applications with special requests for temperature monitoring (TLC) and possible hidden information (UVF). It is important to emphasize that both TLC and UVF inks are prone to degradation during prolonged exposure to UV radiation. Therefore, the application of the hybrid ink systems presented in this research is limited to an environment without constant exposure to UV wavelengths. The presented hybrid ink systems are intended to be exposed to UV radiation only for a moment, when checking the authenticity of the print or looking for a specific marking, since this is the primary purpose of the UVF component.

2. Materials and Methods

The aim of this research was to obtain a functional printed product in a hybrid TLC–UVF ink system. Measurement and analysis methods performed in this research were aimed at characterizing all components of the produced printed product, i.e., printing substrates and prepared inks, and an analysis of the surface interaction of the printed layers and substrates. This approach is important for determining the functionality and applicability of the printed product.

2.1. Materials

In this research, two types of printing inks were used: TLC ink, and UVF printing ink/pigment.
TLC ink used in this research had water-based formulation (Printcolor, Berikon, Aargau, Switzerland). According to the specification of the TLC ink given by the producer, TA is at 25 °C and has a 5 °C activation region. TLC ink becomes red at 25 °C, turns to green at 26 °C, and to blue at 30 °C; above 44 °C and below 25 °C it is expected to be colourless.
UVF red ink consisted of UV-visible (daylight invisible) fluorescent red pigment (UVFp) by Cestisa mixed in a water-based transparent base PLASTOLAK K73990K1 by Epta Inks (Eptanova S.R.L., Albiate, Italy). Fluorescent red pigment was added into the transparent base in the mass concentration of 3%.
Prepared inks were applied on the two types of recycled black uncoated papers: UT Tray Black (UT) (Mayr-Melnhof Karton Hirschwang Gesellschaft m.b.H., Vienna, Austria), grammage 425 gm−2, a high quality recycled cardboard with requirements suitable for fruit and vegetable trays and a Cotton Black (CB) (Avery Dennison Materials Group Europe, The Netherlands), 120 gm−2, uncoated matt 100% cotton paper suitable for labelling of high and premium goods (spirits, specialist foods, etc.). UT Tray Black (UT) has black top side and brown reverse side, including environmentally friendly moisture barrier, as stated in technical sheet. UT’s black top side is pre-printed, while CB paper substrate is coloured in mass. These substrates were selected for this research based on the previously published results, which showed a strong colour play effect on both paper substrates [30].

2.2. Methods

2.2.1. Hybrid Ink Systems

In order to obtain a functional printed product using hybrid ink systems, TLC and UVF printing inks were prepared and applied on the printed substrates by using the screen-printing technique. In the first phase, a pure TLC and UVF printing inks were printed on the UT and CB substrates. Pure printing inks were applied and characterized in order to compare the obtained results with the results of measurements of printed hybrid ink systems. In the next phase, hybrid systems were prepared and printed. First hybrid system consisted of two printed layers. TLC ink was printed on substrate and after the drying, the TLC printed layer was covered with a layer of UVF ink. UVF ink was prepared before the printing process, by mixing the UVF pigment in the transparent base in 3% mass concentration [26]. The designation of this system is UVF on TLC. Second hybrid system consisted of one printed layer. For this system, UVF pigment was directly mixed into the TLC ink (no transparent base was used). The mass concentration of UVF red pigment was 3% according to the previously published research [26]. The designation of this system is UVFp in TLC.

2.2.2. Printing Process

Printing inks were screen printed on two types of black papers (UT and CB) and the papers were conditioned prior to the printing at a temperature of 24 ± 1 °C and 50–55% relative humidity. For the purpose of printing process, a printing plate with a mesh density of 43 lines cm−1 was prepared (SEFAR® PET 1500 43/110-80 polyester mesh with 149 μm openings). Printing process was performed using a screen-printing machine by Bochonow (Drucktisch 2000 50/70) and the printed samples were air-dried for 48 h at a temperature of 25 ± 2 °C after the printing process.

2.2.3. Characterization Methods

Smoothness of both paper substrates was measured using PTI line Bekk tester (PTI Austria GmbH, Laakirchen, Austria) on 10 samples for each paper substrate (5 on felt and 5 on wire side of the paper), following ISO 5627 standard. Caliper was determined with a micrometre DGTB001 Thickness Gauge (Enrico Toniolo S.r.l., Milano, Italy) and was measured on 20 samples for each paper substrate according to ISO 534:2011.
Surface roughness of substrates and applied printing inks were measured in order to define the influence of roughness on the characteristics of observed ink systems. According to [31], substrates with different surface roughness play a crucial role in determining the optical properties of deposited materials, especially in the area of functional coatings. Considering the fact that two types of substrates were used in this work, the assumption was that their surface structures might affect the physical–chemical interactions between the materials and the visual response of the observed hybrid systems. Research published previously [32,33] report on the influence of rough surface on surface free energy (SFE) and the interactions between the substances in contact.
The profiling methods and roughness parameters were defined by international standards (ISO 11562, DIN 4777, DIN 4762). Three basic roughness parameters were measured: Ra-the arithmetic mean deviation of the profile (ISO 4287); Rz (ISO)-mean height of unevenness in ten points, numerically the difference in mean height between the five highest peaks and the five lowest peaks within the reference length (ISO 4287); Rmax-maximum roughness depth is the largest single roughness depth within the evaluation length (ISO 4287).
The roughness instrument MarSurf PS 10 (Mahr GmbH, Gottingen, Germany) with the stylus method was used. The diameter of a stylus was 2 µm and measuring force was 0.00075 N. Measurement was performed ten times in two directions (in the fibre direction and in the opposite direction), on each sample and the results of a mean value were presented.
Printed ink thickness was measured by means of a SaluTron D4-Fe device (Frechen, Germany). The SaluTron D4-Fe works on the magnetic induction principle and measures all nonmagnetic surfaces. The results of the ink thickness were used to identify the possible influence of the thickness on the visual response of printed inks.
Surface free energy (SFE) and contact angles on samples were analysed using the Data Physics OCA 30 goniometer (DataPhysics Instruments GmbH, Filderstadt, Germany). Three referent liquids of known surface tension (demineralized water, diiodomethane, and glycerol) were applied on the substrates without prints and on the printed ink layers. Contact angles were measured by Sessile drop method, the shape of the drop was a spherical cap, and the volume of the drop was 1 µL. Ten drops of each liquid were applied on each sample and the mean value was calculated. All measurements of the contact angles were performed at 0.4 s after the drop had touched the measured substrate. Surface tension of the referent liquids and their contact angles were used to calculate SFE (γ) and its dispersive (γd) and polar (γp) components on all samples by using the Owens, Wendt, Rabel, and Kaelble (OWRK) method [34,35,36,37,38]. Total, dispersive, and polar surface tension components of probe liquids expressed in mJ/m2 were respectively: diiodomethane—50.8, 50.8, and 0; glycerol—64.0, 34.0, and 30.0; and water—72.8, 21.8, and 51.0. Calculation of SFE provides the insight into the important surface properties of the printed layers and substrate, and enable the characterization of the material interactions [39].
From the obtained SFE adhesion, the parameters (surface free energy of the interphase (γ12), work of adhesion (W12), and wetting coefficient (S12)) were calculated. The work of adhesion (W12) Equation (1) between the substrates, TLC ink, UVF ink, and hybrid ink system was defined in order to predict the strength of interactions [35,40,41]:
W 12 = γ 1 + γ 2 γ 12 ,
where the subscript refers to SFE of the solids in contact and the γ12 denotes the surface free energy of the interphase. Surface free energy of the interphase was calculated according to Equation (2):
γ 12 = γ 1 + γ 2   2   γ 1 d   γ 2 d 2   γ 1 p   γ 2 p
The wetting coefficient (S12) indicates that an ink will spontaneously spread on the solid surface if the value is positive or equal to zero, while the negative value implies that the wetting is not complete, Equation (3):
S 12 = γ 1 γ 2   γ 12 ,  
where γ1 and γ2 denote SFE of the solid layers in contact (ink layer and substrate layer); and γ12 denotes SFE of their interface. Temperature-dependent optical properties of the prints containing TLC ink were measured in a temperature range from 20 to 47 °C. Spectral reflectance of the samples was measured in spectral region between 400 and 700 nm, in 1 nm steps, using fibre-based USB 2000+ portable spectrometer (Ocean Optics, Orlando, FL, USA) with 30 mm wide integrating sphere (ISP-30-8-RGT) with (8°:di) measuring geometry and 6 mm sampling port diameter. SpectraSuite software by Ocean Optics was used to calculate the CIELAB L*, a*, and b* values taking into account the D50 illuminant and 2° standard observer. The printed samples were temperature controlled using the surface of a water block (EK Water Blocks; EKWB d.o.o., Komenda, Slovenia) [10,42]. Spectral reflectance of the printed layer containing UVF pigment was measured using the Ocean Optics USB 2000+ spectrometer (Ocean Optics, Orlando, FL, USA) and Deuterium-Tungsten Halogen UV light source DH-2000.
Microscopy of samples was performed by means of an Olympus BX51 microscope (Tokyo, Japan) at different magnifications in order to evaluate the surface structures of the substrates and the arrangement of TCL crystals and UVF pigments in the observed systems.

3. Results and Discussion

3.1. Characterisation of the Paper Substrates

Table 1 presents the results of smoothness and calliper measured on both paper substrates. One can see that UT paper has higher smoothness in comparison to CB paper. It amounts 11.94 s, and for CB paper it amounts 0.68 s. According to these results, one can see that CB paper has significantly more expressed surface irregularities. Calliper values show that UT paper has higher thickness (0.617 mm) than CB paper (0.293 mm).
Figure 1 presents microscopic images of used substrates UT (a) and CB (b) papers, under magnification of 200×. One can see that papers have similar surface structure with intertwined fibres arranged in different directions forming a complex structure of the surface.
Table 2 presents the results of measured roughness parameters Ra, Rz, and Rmax. It can be observed that CB paper has rougher surface in comparison to UT paper. All the measured parameters have more expressed surface deviations on CB paper.
The Ra parameter, which describes arithmetic mean deviation of the profile, has three times the value (6.940 µm) of the UT sample (2.392 µm). Rz and Rmax parameters have significantly higher values as well, indicating the more uneven and irregular structure of CB paper. Rz parameter, which defines the mean height of unevenness in ten points, equals 12.425 µm on UT paper and 36.642 µm on CB. Rmax parameter, indicating the largest single roughness depth of the surface, amounts to 16.539 µm on UT paper and 45.022 µm on CB. Surface profiles, presented in Figure 2, indicate the difference in surface structures of the observed papers. The deviation of the surface structure from the baseline profile level is expressed more on the CB paper, it amounts to between −20 μm and 20 μm. The UT paper has a relative deviation from the baseline profile level between −10 μm and 10 μm. The results of measurements of the surface roughness parameters correspond to the smoothness results, presented in Table 1.

3.2. Thickness of the Printed Layers

The results of the ink thickness were used to observe the uniformity of the printed layers and to identify the possible relation of the thickness on the visual response (thermochromic and fluorescence effect) of printed inks. Table 3 presents the thickness of the TLC and UVF printing inks and the thickness of the hybrid ink systems printed on both substrates.
From the results presented in Table 3, one can see that the thickness of the printed pure inks is relatively uniform on both paper substrates. It varies between 19.286 µm and 20.833 µm. CB paper gives slightly higher values of thickness, due to possible better transfer of the ink during the printing process and better adhesion of the inks on the substrate. A significantly higher thickness of the layers was measured on the double-layered hybrid systems, where one layer was printed over the other (UVF on TLC). It amounted to 30.714 µm on UT paper and 32.333 µm on CB paper. Despite the application of mono-layers of about 20 µm, the double-layered ink system obviously does not give a double value of thickness. Most likely, during the printing and drying process of the inks, in addition to the penetration of the ink into the structure of the paper, there is an interaction and additional bonding of the layers of the printed UVF and TLC inks. In Table 3, one can see that a hybrid UVFp in the TLC system gives slightly higher values of thickness on both substrates. These results were expected due to the addition of UVFp into the TLC ink and the forming of a hybrid printing ink containing thermo-responsive microcapsules and particles of fluorescent pigments.

3.3. Roughness Parameters of the Prints

Roughness of the prints made by pure TLC ink, pure UVF ink, and of the printed hybrid ink systems were observed in order to define the influence of surface roughness of the substrates on the optical properties and adhesion of the materials in contact. Table 4 presents results of the measured roughness parameters. Based on those results and the results presented in Table 2, one can see that the roughness parameters decreased after the printing for almost all samples. Ra parameter measured on UT paper has the lowest values on the prints made by UVF ink (UVF/UT) and equals 1.890 µm. Probably, the fluorescent pigment mixed in a transparent base, better fills and overlays the surface irregularities, resulting in the lowest values of roughness parameters. The highest value of roughness is measured on a layer printed in a hybrid ink system UVF on TLC/UT (Ra is 2.241 µm). When observing the roughness of the CB paper substrate, one can see that the printed layers cause a significant decrease in surface irregularities. The lowest values of all parameters are measured on layers printed with UVF ink (UVF/CB), the same as it is detected on UT paper (Ra is 3.943 µm, for 3 µm smaller than that measured on the CB surface). Bearing in mind that all roughness parameters decreased after the printing, it can obviously be said that the UVF ink layer evenly overlays all irregularities in the surface structure, i.e., the depressions between the fibres and the raised structures in the surface (depths and peaks). When observing hybrid ink systems printed on CB, one can see that printed layers cause a decrease in roughness parameters, especially Rmax parameter. It is decreased by ca. 50%, in relation to the CB paper structure. Obviously, during the printing process and drying of the prints, microcapsules in TLC ink and particles of fluorescent pigments uniformly fill the depressions between the fibres in the paper.

3.4. Surface Free Energy and Adhesion Parameters

Results of the surface free energy (SFE) calculations obtained from contact angle measurements (Table S1) are presented in Figure 3a,b. It is visible that both paper substrates have a dominant dispersive component of SFE, with CB paper having a more expressed polar component of SFE than UT paper. When TLC printing ink was printed on the substrates, the polarity of the new surface (and total SFE) increased.
Compared to the TLC printing ink, the printed layer of UVF ink on both papers displayed the dominance of the dispersive component of SFE, with the polar component being negligible. Therefore, it can be concluded that the uniform layer of UVF ink with complete coverage was printed on the CB and UT substrates. Interesting results of SFE calculations can be observed when hybrid ink systems are printed on two different papers. UVFp in TLC printed on CB paper displays the highest SFE values among the hybrid ink surfaces (48.65 mJ/m2). This can be attributed to the highest measured roughness parameters (Table 4). The results of SFE calculations are in the accordance with SFE values of TLC ink printed on papers, as well as with the hydrophobicity of the UVF ink [26,30]. In general, surfaces of hybrid ink systems printed on CB paper presented higher SFE than prints on UT paper. Therefore, adhesion parameters are of importance for the assessment of the interactions between different papers and between the printed ink layers used in this research.
Results of the calculated adhesion parameters are presented in Table 5. When assessing the strength of the interaction, all three parameters should be considered—work of adhesion (W12) should be as high as possible, interfacial tension ( γ 12 ) should be close to zero, and wetting coefficient (S12) should be positive or equal to zero.
Observing Table 5, it can be concluded that the adhesion between the papers and the layer of TLC ink is not optimal because of the high interfacial tension and negative values of wetting coefficients. Higher work of adhesion—work that is necessary to separate two layers—was achieved between CB and TLC than between UT and TLC (93.96 vs. 77.72 mJ/m2). Furthermore, when observing all three adhesion parameters for the samples with printed UVF ink layer, it can be concluded that the adhesion of UVF ink on CB paper was better than on UT paper in terms of the higher W12 (74.23 vs. 62.72 mJ/m2), and the wetting coefficient was lower than for UVF ink on UT (7.37 vs. 18.23 mJ/m2), pointing to the better wetting of UVF ink on CB substrate. Interfacial tension is lower between UT paper and UVF ink, than between CB paper and UVF ink.
In hybrid ink systems (UVFp in TLC, and UVF on TLC), the highest work of adhesion was present between CB paper and UVFp in TLC (92.4 mJ/m2), while the lowest work of adhesion was displayed between UT paper and UVFp in TLC (55.87 mJ/m2). Interfacial tension was positive for all samples, but the values were not close to zero. This points to the conclusion that the surfaces in contact have a tendency to separate. Highest interfacial tension was measured between TLC and UVF on CB substrate (14.38 mJ/cm2), and lowest between UVF ink and UT substrate (4.52 mJ/cm2). Apart from the hybrid ink systems, high values of interfacial tension were also measured between the substrates and TLC ink. Generally, TLC inks have a tendency to be poorly resistant to abrasion and are therefore demanding to work with. For this reason, TLC inks and hybrid ink systems presented in this research could benefit from a protective coating or other form of mechanical protection or adhesion improvement. Furthermore, the wetting coefficient was not optimal between the papers and in-between the hybrid ink layers. Since all wetting coefficients in the TLC/UVF systems (except TLC–UVF on CB substrate with high wetting coefficient of 12.73 mJ/m2) presented negative values, it can be concluded that the wetting between the layers was generally not complete. This occurrence is generally not favourable, but a negative wetting coefficient in the printing process can decrease the unevenness of the print called mottling, resulting with the improved print quality [43].
It can be concluded that the best adhesion in hybrid ink systems was achieved between the CB paper and UVFp in the TLC hybrid ink. Compared to UVFp in the TLC hybrid, higher interfacial tension and values of the wetting coefficient further from zero between TLC and UVF layers pointed to weaker adhesion in the hybrid systems with UVF ink overlayed on TLC ink.

3.5. Spectral Reflectance of Prints

The results of spectral reflectance measurements of the printed UVF ink and hybrid ink systems are presented in Figure 4a,b. Peaks detected in the range of 580–660 nm correspond to the spectral reflectance of the used UVF red, Eu3+ -based pigment [26].
In Figure 4a, spectral reflectance of the UVF ink systems on UT paper can be seen. It can be seen that that the UVFp in TLC displays the highest spectral reflectance in the wavelength area of interest compared to the other ink systems. This occurrence can be attributed to the influence of the transparent base on the decrease in reflectance in UVF and UVF on TLC ink systems. Furthermore, it can be concluded that TLC ink does not cause any changes in the reflectance spectra of the UVF pigment.
A similar situation is observable for the reflectance spectra of UVF and hybrid ink systems on CB paper, presented in Figure 4b. Previous research [30] has shown that CB paper is a highly suitable printing substrate for TLC ink, and the same can be concluded for UVF ink/pigment printed on CB paper. Reflectance of the UVFp in TLC is higher compared to the same hybrid ink on UT paper (31.5% vs. 29% of maximal reflectance). The purpose of the spectral reflectance measurements of UVF ink in hybrid systems was to evaluate the performance of the UV fluorescent pigment when combined with TLC ink. Since the reflectance spectra showed no significant decrease in intensity or changes in UVF pigment peaks, it can be concluded that used TLC ink is suitable for the combination with used UVF pigment and applied on the appropriate substrates.
The reflectance spectra of the TLC ink printed on UT and CB paper substates are shown in Figure 5 and Figure 6. When the functional material inside the “pigments”, i.e., microcapsules, is in the chiral nematic/cholesteric phase, a single reflection peak occurs, representing the spectral characteristic of the colour play effect. This peak moves across the visible range as a function of the temperature. Inside temperature activation range of TLC printing ink, temperature-dependent colours are clearly observable. As the samples of TLC ink printed on UT and CB paper substates show, the effect starts at 26 °C, which peaks at 626 nm for CB, showing red colour. At the same temperature, the TLC sample with UT substrate peaks at 595 nm, where the colour becomes orange. With further increase in temperature, the peak of reflectance spectra shifts towards shorter wavelengths and narrows. As the temperature rises over 32 °C, the peak shifts outside of the visible region (below 400 nm) and disappears completely above 44 °C, when TLC turns into isotropic liquid. This temperature is commonly referred to as the clearing point (Jakovljević et al., 2017). Although reflectance spectra of TLC ink are very similar on both paper substates, UT shows more statics, especially at higher temperatures.
Reflectance spectra of all temperature-dependant printed samples at 27 °C for UT and CB paper substrates are shown in Figure 7a,b. Spectral reflectance of TLC on UT substrate peaks at about 550 nm, resulting in green colour of the sample, UVFp in TLC peaks at 572 nm (yellow), and UVF on TLC at 615 nm (orange). UVF pigment in TLC ink changes the effect of pure TLC ink, shifting the reflectance peaks towards higher wavelengths, which are more pronounced for UVF on the TLC sample. For CB substrate, UVF on TLC and UVFp in TLC have peaks at approximately the same wavelengths as for UT, but TLC peaks at 580 nm, differ from UT substrate by 30 nm and show another colour (yellow). The reason for this effect could be thickness of the UT paper substrate, which affects temperature-dependant measurements. Both hybrid ink systems, UVF on TLC and UVFp in TLC, show peaks at 620 nm because of fluorescent pigment that is detected during measurements, even without UV light.
Results are similar for TLC and hybrid ink systems printed on UT and CB substrates at 29 °C (Figure 8a,b). Reflectance spectra of pure TLC ink peaks at 494 nm for UT, and for CB at 500 nm, which occurs as a green colour of the printed sample; here the difference between the UT and CB samples is only 6 nm, which is almost imperceptible compared to the difference between UT and CB at 27 °C (Figure 7a,b). UVFp in TLC peaks at about 503 nm for both UT and CB but has a higher peak for CB substrate, which also applies to the samples measured at 27 °C. UVF on TLC peaks at about 530 nm for both UT and CB substrates.
Further increase in temperature resulted in fewer differences between spectral reflectance peaks for TLC and hybrid ink systems. The samples printed on UT and CB paper substrates were measured at 31 °C and the results are shown in Figure 9a,b. TLC and UVFp in TLC peak are about 460 nm for both UT and CB paper substrate. UVF on TLC peaks at 480 nm for UT, while the peak for CB cannot be determined exactly because of high device statics.
Colorimetric analysis (Tables S2 and S3) was used to describe thermochromic colour play effect of liquid crystals in pure TLC printing ink, as well as hybrid ink systems with TLCs and UVF pigment. The CIELAB colour values of all samples printed on UT substrate were calculated from the corresponding reflectance spectra shown in Figure 10.
Both pure TLC and hybrid ink systems show full colour play effect caused by the chiral nematic/cholesteric phase of TLCs (Figure 10a). This effect implies the red-green (a*) and yellow-blue (b*) values start and end at almost the same points of the (a*,b*) graph, showing the colour of the sample in an isotropic phase of the TLC, where no colour has developed. At intermediate temperatures, where the chiral nematic/cholesteric phase produces the single reflection peak, the entire loop is formed, exhibiting a thermochromic effect [11]. All three measurements form a similar loop, but some differences do occur. Pure TLC results in the most intense colour play effect, forming the widest loop in (a*,b*) graph. The loops of UVF on TLC and UVFp in TLC (Figure 10a) cover a smaller area in comparison with pure TLC, showing less intense thermochromic effect, especially in some parts of the spectrum, for example, UVF on TLC—in the blue part. The temperature-dependent diagram shows these differences in more detail, including lightness L* measured at each individual temperature of the printed sample (Figure 10b). Each curve extends from 20 to 47 °C, where the reflection peak appears invisible. A single maximum occurs in each L* (T) curve in the yellow-green region, where the colour has the highest lightness L*. Inside the temperature activation region, L*max occurs at almost the same temperature for all samples (Table 6). The intensity of lightness ΔL*max is the highest for TLC, then follows UVF on TLC and UVFp in TLC (Table 6; Figure 10).
Pure TLC on CB shows similar results to that of the UT paper substrate, experiencing the most intense colour play effect. UVFp in TLC shows a slightly less diminished effect within the same curve limits of pure TLC, while UVF on TLC has the weakest thermochromic colour play effect. The reason for this less intense thermochromic effect of hybrid ink systems printed on both substrates could be the composition of the UVF printing ink, i.e., UVF layer printed over TLCs, which most probably decreases selective reflection of liquid crystals by partially absorbing light through the UVF layer. This effect occurs to a lesser extent and the results in the L* (T) graph confirms that claim (Figure 11); L*max has almost the same values for all samples, with a maximal difference of 1.19 (L* is 37.5 for TLC and 36.31 for UVFp in TLC). L*max for TLC and UVF in TLC occurs at 27.5 °C, and for UVFp in TLC at 27 °C. The intensity of lightness ΔL*max is the highest for TLC, then follows UVFp in TLC and UVF on TLC (Table 7; Figure 11).

3.6. Microscopy of Printed Inks

Microscopic images of the printed samples are presented in Figure 12 and Figure 13. The images were taken under same conditions at a room temperature of 25 ± 1 °C and 50–55% relative humidity. Images present the surfaces of prints produced in hybrid printing ink systems, printed on UT and CB paper substrates, captured without UV and exposed to UV radiation to ensure the visibility of the fluorescence effect.
Figure 12a–d presents images of hybrid ink systems printed on UT paper substrate. Observing Figure 12a,c, captured without exposure to UV radiation, one can conclude that visual observation of images corresponds to the results of spectral reflectance and the CIELAB colour values presented in Figure 5, Figure 7 and Figure 10.
It is obvious that in a UVFp in TLC hybrid system the mixing of the UVF pigment in the TLC printing ink causes the forming of a complex structure with properly distributed thermochromic and fluorescent pigments particles in the layer. By overlaying the TLC ink with UVF printing ink the distribution of particles is less visible due to the layer of UVF pigment mixed in the transparent base that diminishes the thermochromic effect to a certain extent. By exposing the printed hybrid systems to UV radiation (Figure 12b,d), one can see that the fluorescence effect is more expressed in UVF on the TLC printed layer. The reason for this is that overlaying the TLC ink with UVF printing ink enables a stronger visual response of fluorescent printing ink.
In Figure 13a–d one can see the microscopic images of hybrid ink systems printed on CB paper substrate. Since CB paper substrate has an extremely complex surface structure, with a more pronounced roughness than UT paper (Figure 1 and Figure 2; Table 2), the microscopic images show a different visual response of the observed samples in comparison to UT paper.
On the sample which is not exposed to UV radiation (Figure 13a), almost no response of either thermochromic or UVF effect is visible. Relatively uniform distribution of the ink layer on the surface can be seen. The sample exposed to UV radiation clearly shows the effect of fluorescence; although, the fibres and the structure of the substrate are notably expressed despite the double-layer application of inks (Figure 13b). In the hybrid system of UVFp in TLC (Figure 13c), the microcapsules in TLC ink are correctly distributed and the structure of the substrate is visible. On the sample exposed to UV radiation, the ink particles are very nicely expressed, and the fluorescent effect is visible with properly distributed thermochromic ink microcapsules.
Comparing visual effects visible on microscopic images of UT and CB paper substrates, one can say that CB substrate gives a higher visual effect of fluorescence and a more pronounced thermochromic effect in the observed hybrid ink systems. Probably, due to its surface characteristics, it expressed more roughness and higher values of printing ink thickness in comparison to UT paper, and better interaction in the printing process was achieved causing the positive dual-functional effect, as was confirmed by the presented measurement results. Nevertheless, both effects are visible in their respective ranges (temperature or wavelength) on both substrates.
Possible applications of presented hybrid ink systems can be used for a wide range of products that could benefit from dual added value: temperature sensing, and security applications/UV marking.
Specifically, the temperature activation region of the TLC ink used in this research was between 25 and 30 °C. This is the temperature region inside which colour play effect occurs, i.e., TLC ink shows its functional properties. TLC printing inks with an activation region between 25 and 30 °C could be used for temperature monitoring of certain products that have strict storage or serving instructions. For example, some cosmetic products are not recommended to be exposed to the temperatures above 25 °C, as well as some sorts of food products. The UVF component of the hybrid system can then enable the detection of authenticity of the product, which can help combat the rising rate of product counterfeiting. An example of a functional application of the proposed hybrid ink systems is a combination of the temperature indicator (TLC component of the hybrid ink system) and the brand protection control with the UVF component on the packaging made for chocolate or similar products that should not be stored at temperatures higher than 25–27 °C (some medications, certain wood varnishes, some chewing gums, etc.).

4. Conclusions

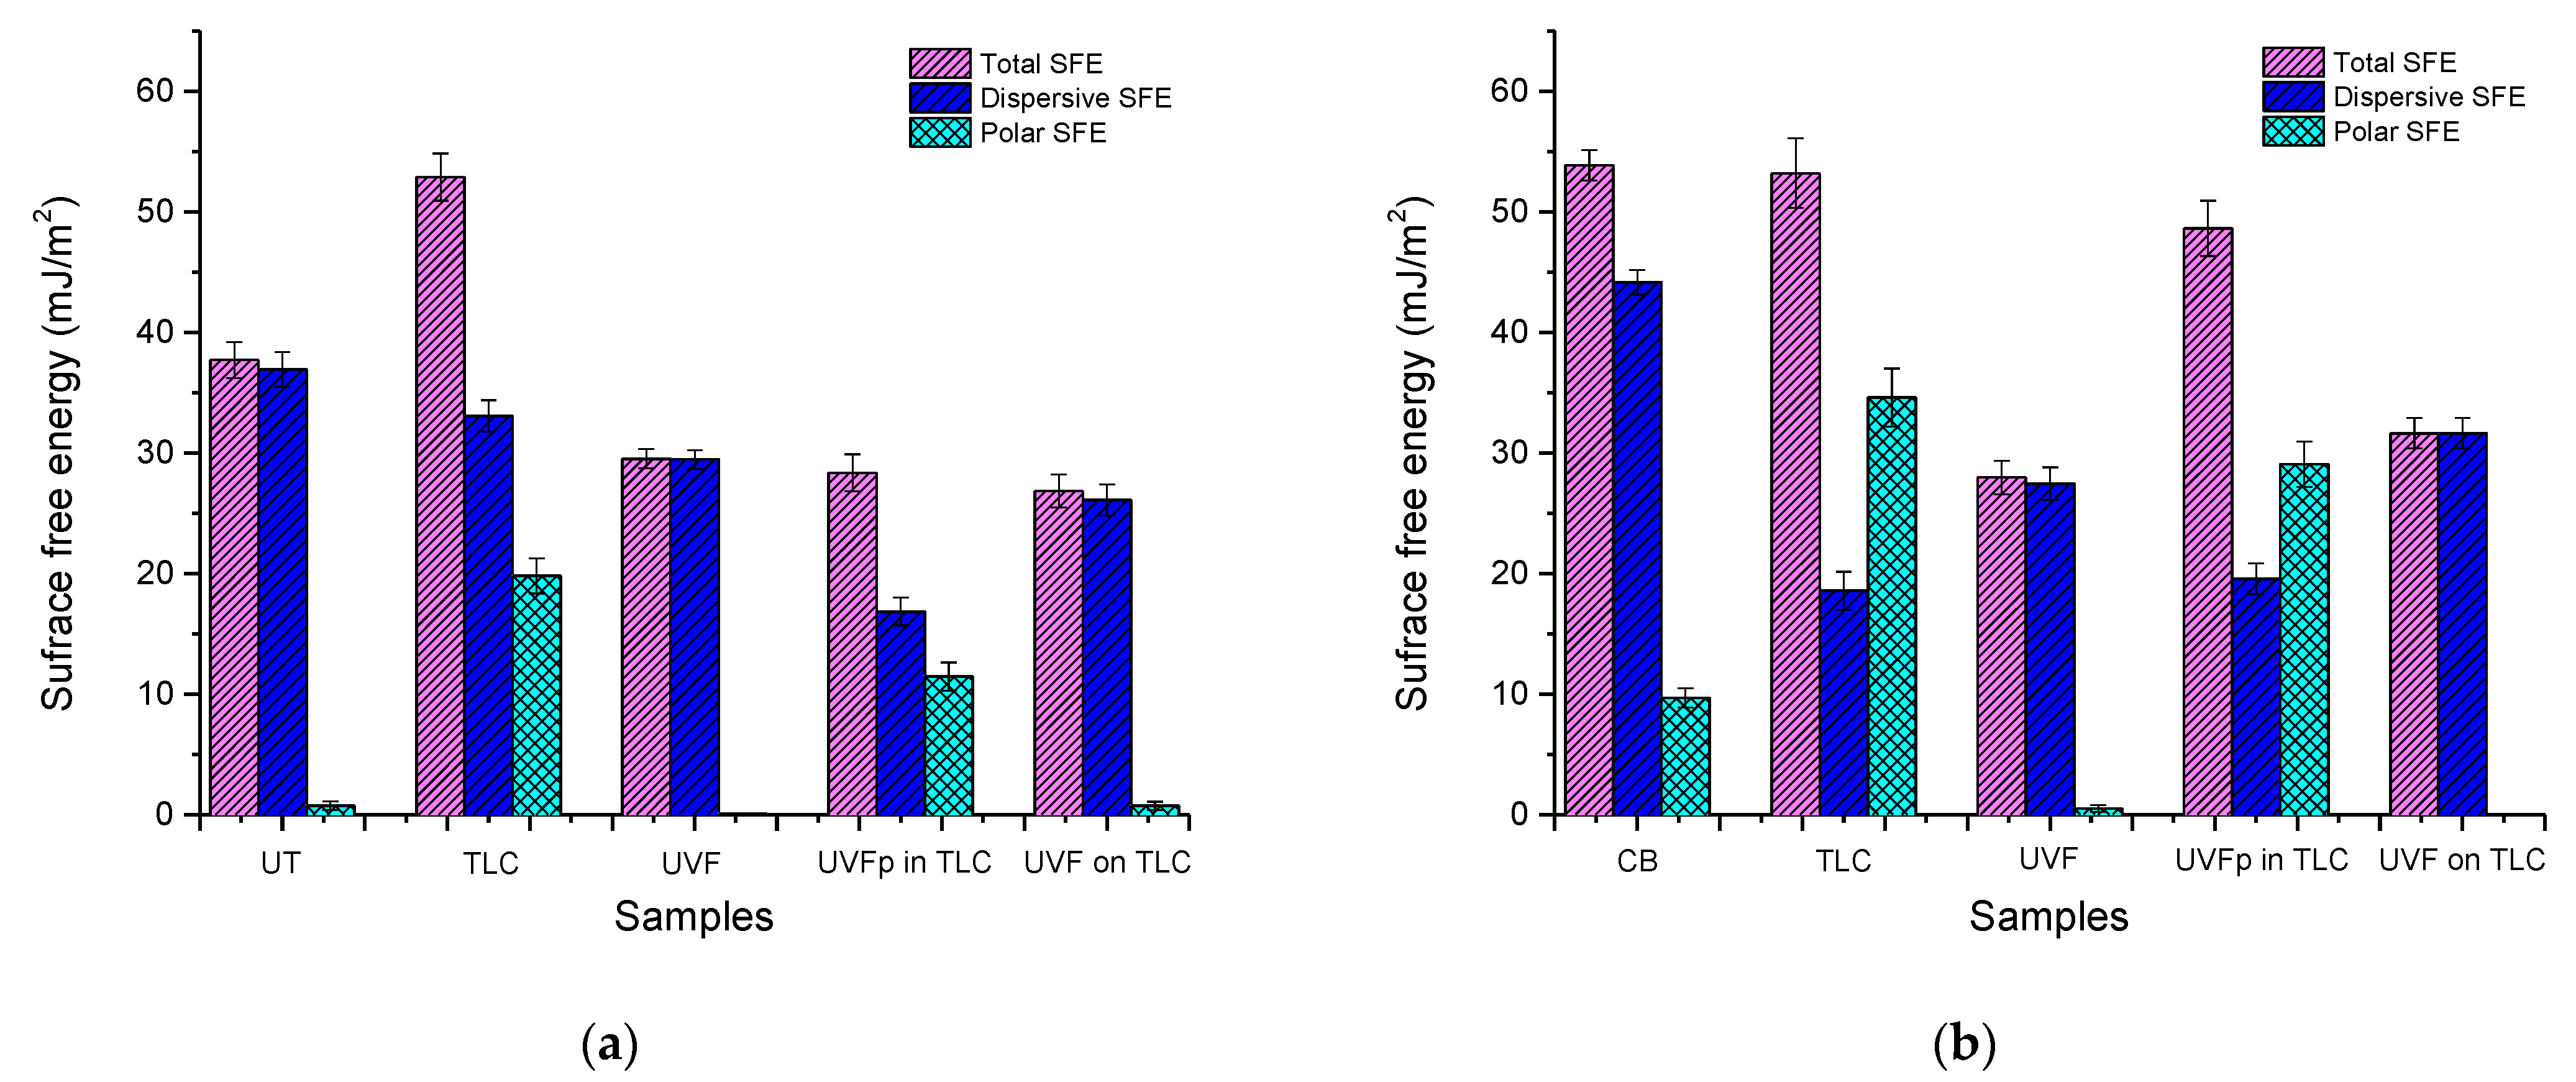
The aim of this research was to obtain a functional printed product in hybrid printing ink systems, by using two special effect printing inks, i.e., TLC ink and UV-visible fluorescent pigment/ink, on two types of black uncoated paper substrates (UT and CB).
Results of adhesion performance showed that higher work of adhesion was achieved between CB paper and TLC ink than between UT paper and TLC ink. The adhesion of UVF ink was better on CB paper as well. In hybrid ink systems, the highest work of adhesion was achieved between CB paper and UVFp in TLC ink, pointing to the highest level of interactions at the interface among hybrid samples. Interfacial tension and wetting coefficient were not optimal for most interfaces, pointing to the possibility of the separation of the layers in contact. In future research, this problem, generally present for TLC inks, should be addressed by additives and/or protective coatings.
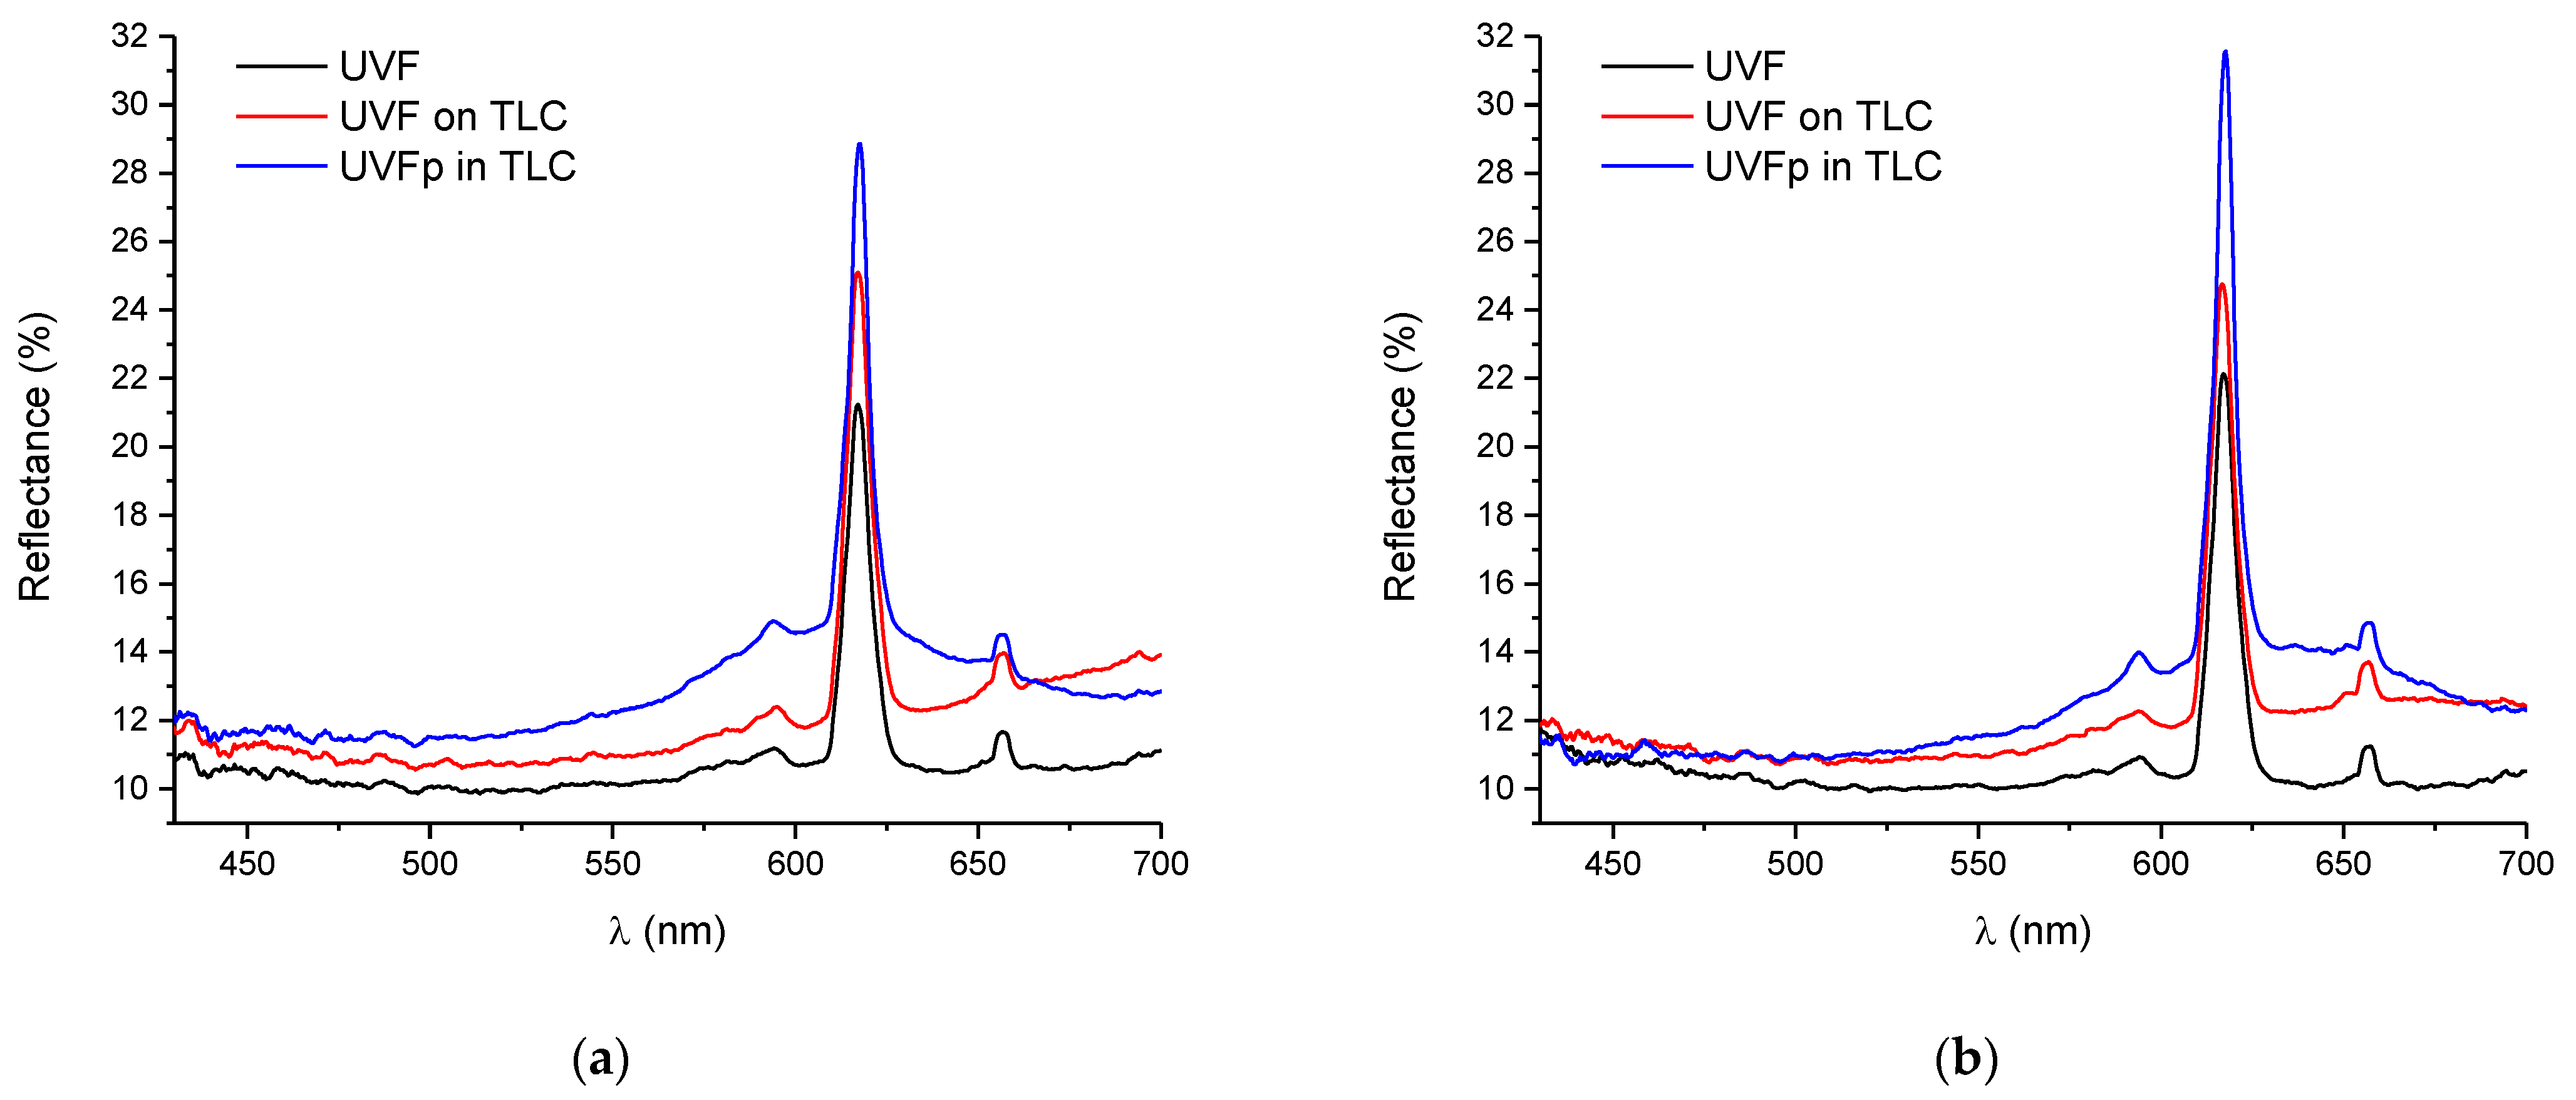
Spectral reflectance of UVF ink and hybrid ink systems showed that TLC ink does not cause any changes in the reflectance spectra of the UVF printing ink. The highest spectral reflectance was measured on the UVFp in TLC prints compared to the other ink systems. It is concluded that used TLC ink is suitable for the combination with used UVF pigment in the proposed hybrid ink system.
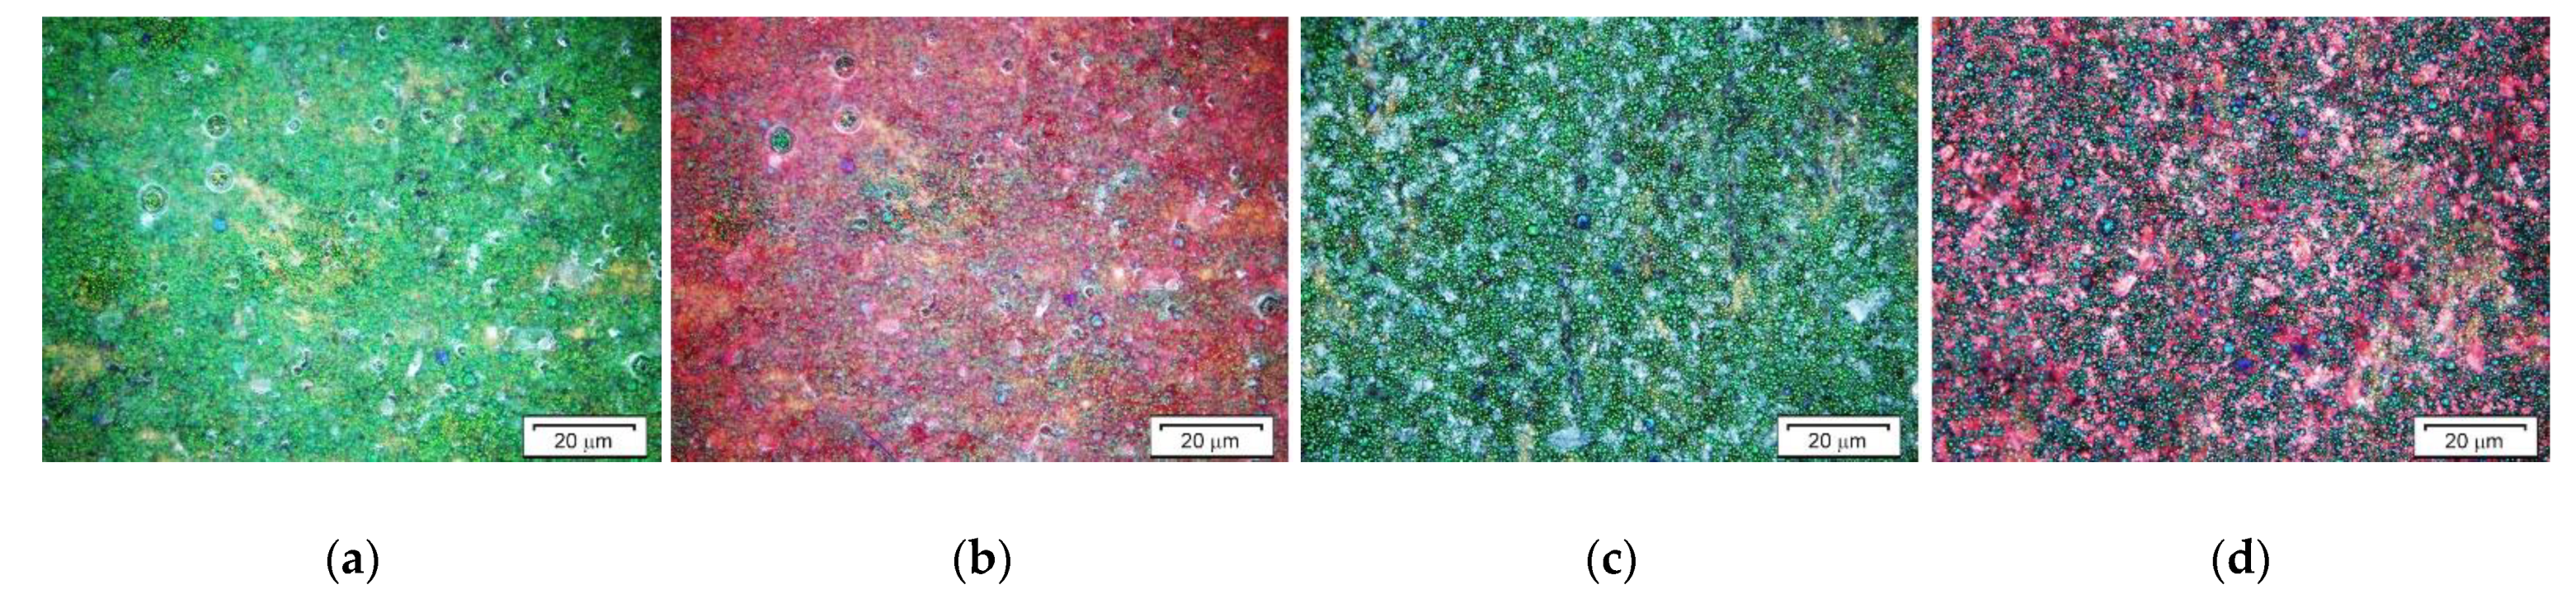
Results of this research show that both pure TLC and hybrid ink systems based on combination of TLC and UVF inks/pigments have full colour play effect on both UT and CB paper substrates. This is important knowledge because it shows compatibility of highly sensitive TLC microcapsules and UVF ink/pigment, as well as their combination with chosen uncoated black paper substrates. Since UVF ink/pigment does not diminish the colour play effect of the TLCs in hybrid ink systems, it can be concluded that these systems have a special effect with several distinctive features in visible and UV parts of the spectrum.
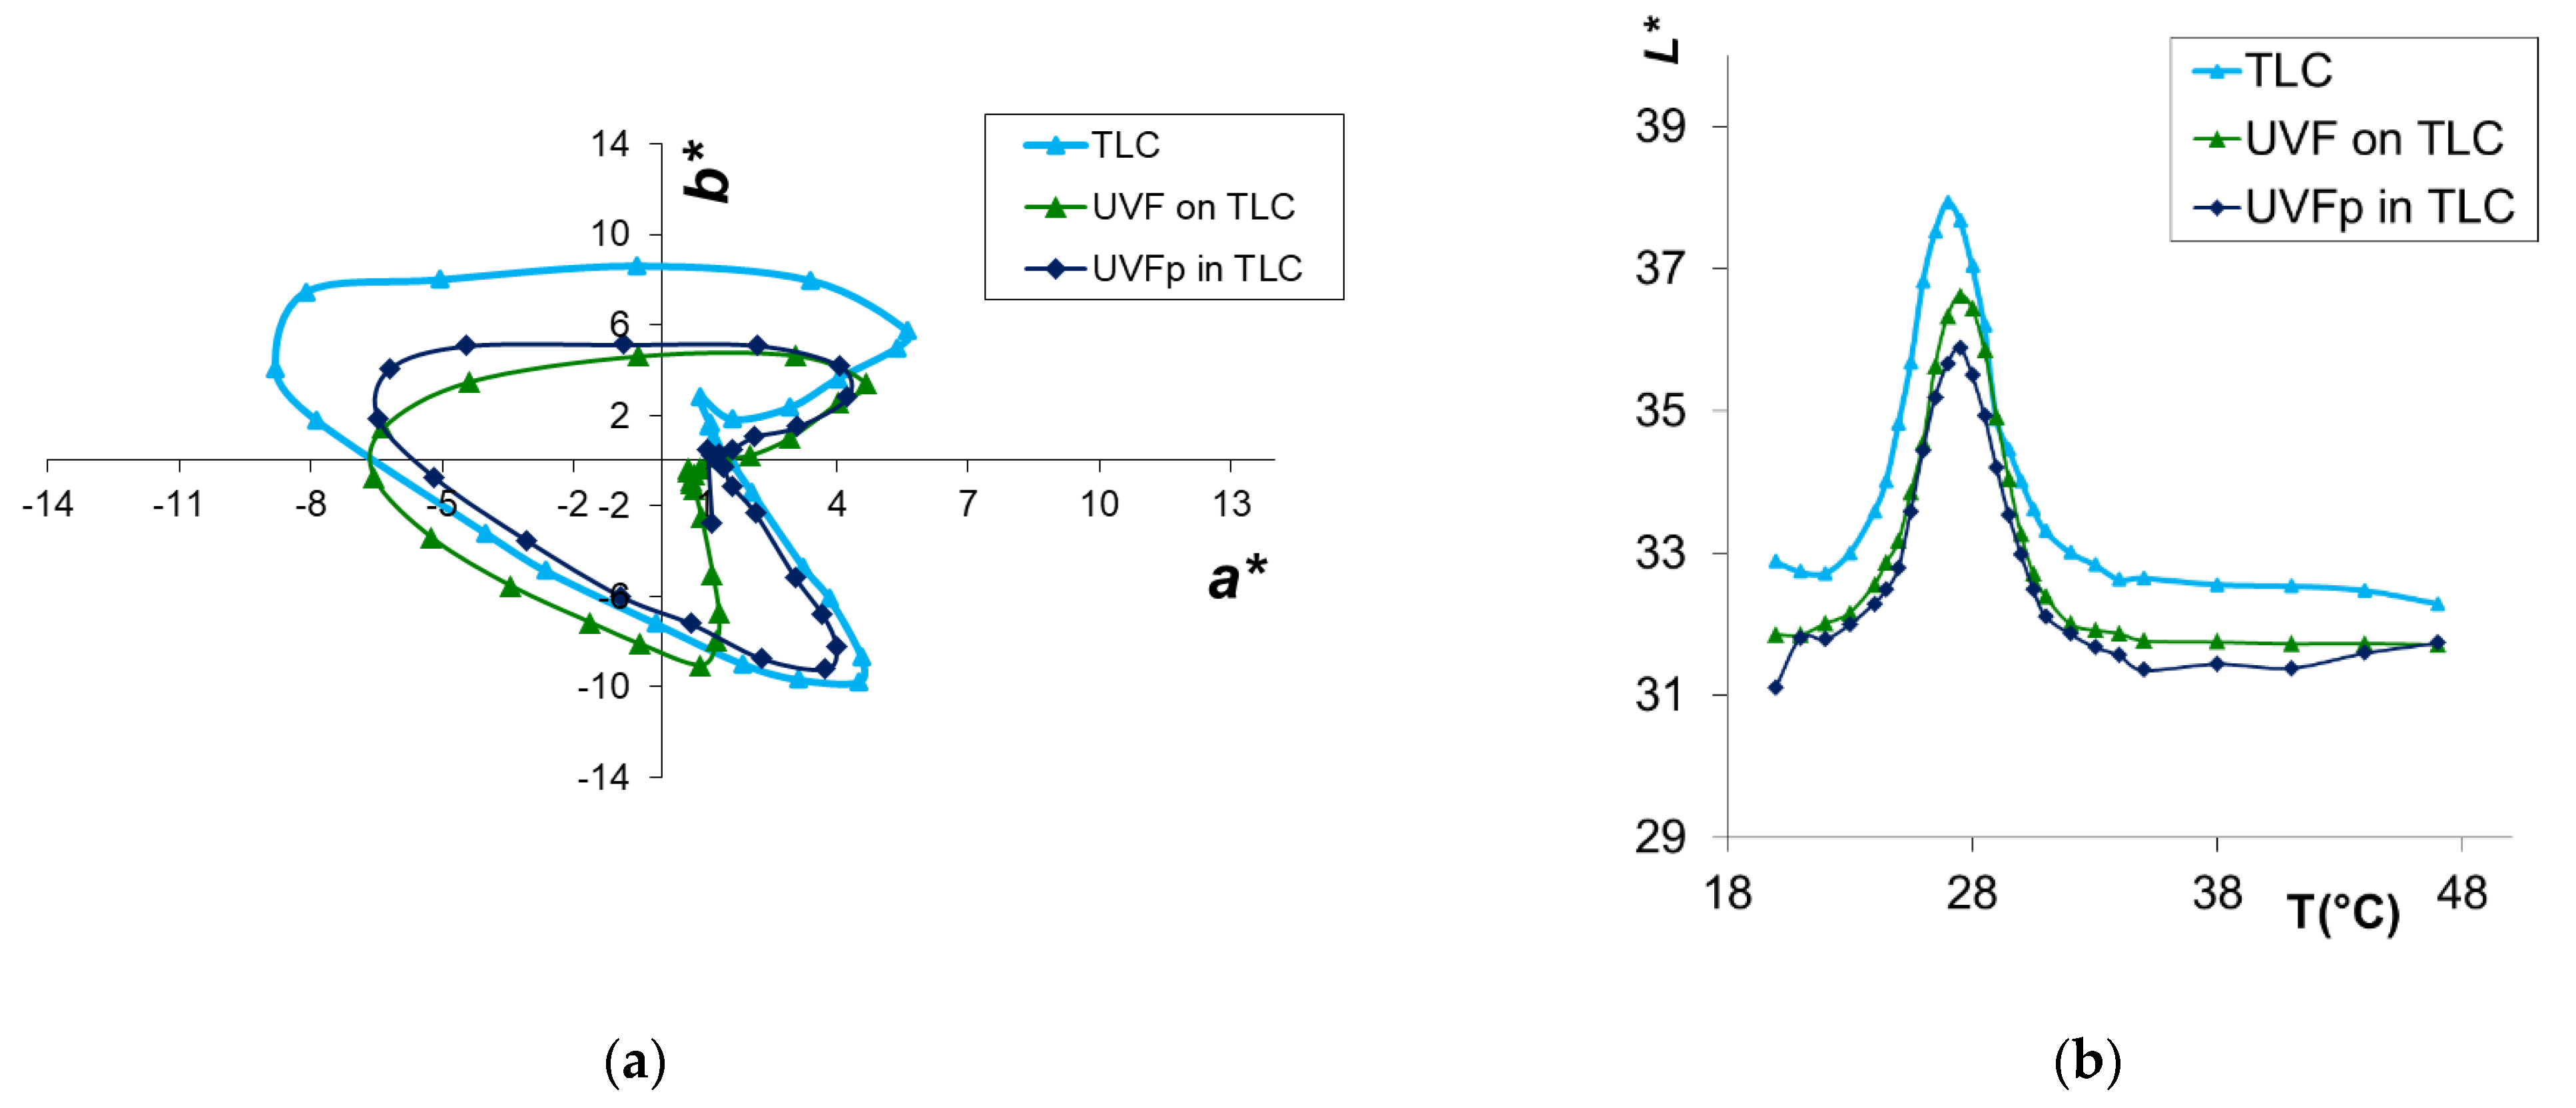
Spectral reflectance measurements of printed samples showed that UT paper substrate is less stable than CB. These results are confirmed with colorimetric results of CIELAB and L*/T values. These results are related to the characteristics of paper substrate, regarding processing of black papers during production.
The samples of pure TLC and hybrid ink systems at defined temperatures (27, 29, and 31 °C) showed higher stability, i.e., mutual uniformity for CB paper substrate than for UT, for which this effect occurs only at higher temperature (31 °C).
The value of the offered printing ink systems is the dual functional–thermochromic effect used in smart packaging that is visible in daylight in a specific temperature range; and the second added value of the thermochromic print (or brand) protection is in terms of the authenticity given by UVF component of the hybrid system. Both added value features were applied on the same print (and in the same prepared ink in one of hybrid ink systems) for the first time. In this way, a new thermochromic ink with hidden security feature has been produced. Presented hybrid ink systems could find their application in development of functional packaging and all other applications with special requests for temperature monitoring (TLC) and possible hidden information (UVF); such applications could imply security and/or brand protection. Future research will go in direction of investigating and improving the light fastness of hybrid prints and their adhesion properties, as well as measuring the influence of UV radiation, temperature, and humidity on hybrid ink systems, as functional packaging in today’ s supply chains is exposed to different conditions, and needs to fulfil many strict demands.

Supplementary Materials

The following are available online at https://0-www-mdpi-com.brum.beds.ac.uk/article/10.3390/app112311414/s1, Table S1: Contact angles of probe liquids, Table S2: Colorimetric measurements on UT substrate, Table S3: Colorimetric measurements on CB substrate.

Author Contributions

Conceptualization, S.M.P., M.S.J., T.T. and A.M.D.; methodology, S.M.P., M.S.J., T.T. and A.M.D.; formal analysis, S.M.P., M.S.J. and T.T.; investigation, S.M.P., M.S.J., T.T. and A.M.D.; resources, S.M.P., M.S.J. and T.T.; writing—original draft preparation, S.M.P., M.S.J. and T.T.; writing—review and editing, S.M.P., M.S.J., T.T. and A.M.D.; visualization, S.M.P., M.S.J. and T.T.; funding acquisition, S.M.P. All authors have read and agreed to the published version of the manuscript.

Funding

This research was funded by short-term scientific support provided by University of Zagreb.

Institutional Review Board Statement

Not applicable.

Informed Consent Statement

Not applicable.

Data Availability Statement

Data is contained within the article or supplementary material. The data presented in this study are available in Table S1–S3.

Conflicts of Interest

The authors declare no conflict of interest.

References

  1. Seeboth, A.; Lötzsch, D. Thermochromic and Thermotropic Materials; Jenny Stanford Publishing: Singapore, 2013. [Google Scholar]
  2. Seeboth, A.; Lötzsch, D. Thermochromic Phenomena in Polymers; Smithers Rapra: Shrewsbury, UK, 2008. [Google Scholar]
  3. White, M.A.; LeBlanc, M. Thermochromism in commercial products. J. Chem. Educ. 1999, 76, 1201–1205. [Google Scholar] [CrossRef]
  4. Aitken, D.; Burkinshaw, S.M.; Griffiths, J.; Towns, A.D. Textile applications of thennochromic systems. Rev. Prog. Color. Relat. Top. 1996, 26, 1–8. [Google Scholar] [CrossRef]
  5. Sage, I. Thermochromic Liquid Crystals; Taylor & Francis: Abingdon, UK, 2021. [Google Scholar] [CrossRef]
  6. Kerry, J.; Butler, P. Smart Packaging Technologies for Fast Moving Consumer Goods. Smart Packag. Technol. Fast Mov. Consum. Goods 2008, 1–340. [Google Scholar] [CrossRef]
  7. Liquid Crystal Formulations (LCs). Available online: https://www.hallcrest.com/technology/liquid-crystal (accessed on 22 October 2021).
  8. Christie, R.M.; Bryant, I.D. An evaluation of thermochromic prints based on microencapsulated liquid crystals using variable temperature colour measurement. Color. Technol. 2005, 121, 187–192. [Google Scholar] [CrossRef]
  9. Microencapsulation SpotSee. Available online: https://spotsee.io/technologies/microencapsulation?redirect=hallcrest (accessed on 22 October 2021).
  10. Jakovljević, M.; Lozo, B.; Klanjšek Gunde, M. Spectroscopic evaluation of the colour play effect of thermochromic liquid crystal printing inks. Color. Technol. 2017, 133, 81–87. [Google Scholar] [CrossRef]
  11. Jakovljević, M.S.; Lozo, B.; Gunde, M.K. Identifying a unique communication mechanism of thermochromic liquid crystal printing ink. Crystals 2021, 11, 876. [Google Scholar] [CrossRef]
  12. Strižić Jakovljević, M.; Kulčar, R.; Friškovec, M.; Lozo, B.; Klanjšek Gunde, M. Light fastness of liquid crystal-based thermochromic printing inks. Dye. Pigment. 2020, 180, 108482. [Google Scholar] [CrossRef]
  13. Jakovljević, M.; Kulčar, R.; Tomašegović, D.; Friškovec, M. Colorimetric description of thermochromic printing inks. Acta Graph. Znan. Časopis Tisk. Graf. Komun. 2017, 28, 7–14. [Google Scholar] [CrossRef]
  14. Jakovljević, M.; Friškovec, M.; Gunde, M.K.; Lozo, B. Optical properties of thermochromic liquid crystal printing inks. In Proceedings of the 5th International Scientific Conference “Printing Future Days 2013”, Chemnitz, Germany, 10–12 September 2013; pp. 169–173. [Google Scholar]
  15. Strižić Jakovljević, M.; Lozo, B.; Klanjšek Gunde, M. The properties of printing substrates required for thermochromic liquidcrystal printing inks. J. Print Media Technol. Res. 2018, 4, 165–170. [Google Scholar]
  16. Diamond, A.S. Optical Science and Engineering. In Handbook of Imaging Materials; CRC Press: Boca Raton, FL, USA, 2019. [Google Scholar]
  17. Jameson, D.M. Introduction to Fluorescence, 1st ed.; CRC Press: Boca Raton, FL, USA, 2014. [Google Scholar]
  18. Becidyan, A.N. Luminescent pigments in security applications. Color Res. Appl. 1995, 20, 124–130. [Google Scholar] [CrossRef]
  19. Becidyan, A.N. The chemistry and physics of special-effect pigments and colorants for inks and coatings. Paint Coat. Ind. 2003, 19, 65–76. [Google Scholar]
  20. Bodenstein, C.; Sauer, H.M.; Hirmer, K.; Dörsam, E. Printing process and characterization of fully pad printed electroluminescent panels on curved surfaces. J. Coat. Technol. Res. 2019, 16, 1673–1681. [Google Scholar] [CrossRef]
  21. Elenbaas, W. Fluorescent Lamps; Philips Technical Library; Macmillan Education: Stuttgart, Germany, 1971; ISBN 9781349003617. [Google Scholar]
  22. Yook, K.S.; Lee, J.Y. Fabrication and luminance switching of flexible organic bistable light-emitting diodes on flexible substrate. J. Lumin. 2013, 137, 105–108. [Google Scholar] [CrossRef]
  23. Bozhkova, T.; Spiridonov, I.; Shterev, K. Overview of security printing types and trends in its future development. Bulg. Chem. Commun. 2017, 49, 195–201. [Google Scholar]
  24. Koutsioukis, A.; Belessi, V.; Georgakilas, V. Fluorescent Carbon Dots Ink for Gravure Printing. C 2019, 5, 12. [Google Scholar] [CrossRef] [Green Version]
  25. Talebnia, F.; Nourmohammadian, F.; Bastani, S. Development of novel fluorescent offset ink based on coumarin dyes: Synthesis and properties. Prog. Org. Coat. 2014, 77, 1351–1359. [Google Scholar] [CrossRef]
  26. Poljaček, S.M.; Tomašegović, T.; Leskovšek, M.; Elesini, U.S. Effect of SiO2 and TiO2 Nanoparticles on the Performance of UV Visible Fluorescent Coatings. Coatings 2021, 11, 928. [Google Scholar] [CrossRef]
  27. Mahović Poljček, S.; Tomašegović, T.; Slišković, A. Characterization of UV fluorescent coating modified with TiO2 nanoparticles printed on polymer substrate in flexography. In Proceedings of the MATRIB 2021, Vela Luka, Croatia, 30 June–2 July 2021; pp. 406–416. [Google Scholar]
  28. Tomašegović, T.; Poljaček, S.M.; Jurišić, I.; Galaš, M. Flexographic reproduction of UV luminescent coating modified with SiO2 nanoparticles. In Proceedings of the MATRIB 2021, Vela Luka, Croatia, 30 June–2 July 2021; pp. 467–476. [Google Scholar]
  29. Ataeefard, M.; Nourmohammadian, F. Producing fluorescent digital printing ink: Investigating the effect of type and amount of coumarin derivative dyes on the quality of ink. J. Lumin. 2015, 167, 254–260. [Google Scholar] [CrossRef]
  30. Marošević Dolovski, A.; Strižić Jakovljević, M.; Mahović Poljaček, S.; Tomašegović, T. Thermochromic effect and adhesion parameters of liquid crystal-based printing ink on recycled printing substrates. In Proceedings of the 2nd International Conference on Circular Packaging, Slovenj Gradec, Slovenia, 9–10 September 2021; pp. 305–310. [Google Scholar]
  31. Zheng, B.; Wong, L.P.; Wu, L.Y.L.; Chen, Z. Identifying Key Factors towards Highly Reflective Silver Coatings. Adv. Mater. Sci. Eng. 2017, 2017, 7686983. [Google Scholar] [CrossRef] [Green Version]
  32. Shaker, M.; Salahinejad, E. A combined criterion of surface free energy and roughness to predict the wettability of non-ideal low-energy surfaces. Prog. Org. Coat. 2018, 119, 123–126. [Google Scholar] [CrossRef]
  33. Hsieh, C.T.; Chen, J.M.; Kuo, R.R.; Lin, T.S.; Wu, C.F. Influence of surface roughness on water- And oil-repellent surfaces coated with nanoparticles. Appl. Surf. Sci. 2005, 240, 318–326. [Google Scholar] [CrossRef]
  34. Owens, D.K.; Wendt, R.C. Estimation of the surface free energy of polymers. J. Appl. Polym. Sci. 1969, 13, 1741–1747. [Google Scholar] [CrossRef]
  35. Żenkiewicz, M. Methods for the calculation of surface free energy of solids. J. Achiev. Mater. Manuf. Eng. 2007, 24, 137–145. [Google Scholar]
  36. Rožić, M.; Šegota, N.; Vukoje, M.; Kulčar, R.; Šegota, S. Description of Thermochromic Offset Prints Morphologies Depending on Printing Substrate. Appl. Sci. 2020, 10, 8095. [Google Scholar] [CrossRef]
  37. Vukoje, M. The Influence of Adhesion Parameters on Material and Organic Recycling of Thermochromic Prints. Ph.D. Thesis, University of Zagreb Faculty of Graphic Arts, Agram, Croatia, 2018. [Google Scholar]
  38. Gindl, M.; Sinn, G.; Gindl, W.; Reiterer, A.; Tschegg, S. A comparison of different methods to calculate the surface free energy of wood using contact angle measurements. Colloids Surf. A Physicochem. Eng. Asp. 2001, 181, 279–287. [Google Scholar] [CrossRef]
  39. Aydemir, C.; Yenidoğan, S.; Karademir, A.; Arman Kandirmaz, E. The examination of vegetable- and mineral oil-based inks’ effects on print quality: Green printing effects with different oils. J. Appl. Biomater. Funct. Mater. 2018, 16, 137–143. [Google Scholar] [CrossRef] [PubMed] [Green Version]
  40. Israelachvili, J. Intermolecular and Surface Forces; Elsevier: Amsterdam, The Netherlands, 2011. [Google Scholar] [CrossRef]
  41. Ebnesajjad, S. Handbook of Adhesives and Surface Preparation: Technology, Applications and Manufacturing; William Andrew: New York, NY, USA, 2011. [Google Scholar] [CrossRef]
  42. Kulčar, R.; Friškovec, M.; Hauptman, N.; Vesel, A.; Gunde, M.K. Colorimetric properties of reversible thermochromic printing inks. Dye. Pigment. 2010, 86, 271–277. [Google Scholar] [CrossRef]
  43. Joshi, A.V.; Bandyopadhyay, S. Effect of ink transfer on print mottle in shrink films. J. Coat. Technol. Res. 2015, 12, 205–213. [Google Scholar] [CrossRef]
Figure 1. Microscopic images of the substrates: (a) UT; (b) CB (mag. 200×).
Applsci 11 11414 g001
Figure 2. Surface profiles of the substrates: (top) UT; (bottom) CB.
Applsci 11 11414 g002
Figure 3. Surface free energy components of papers and printed ink layers on: (a) UT paper; (b) CB paper.
Applsci 11 11414 g003
Figure 4. Spectral reflectance of UVF pigment/ink printed on: (a) UT paper; (b) CB paper.
Applsci 11 11414 g004
Figure 5. Reflectance spectra of TLC ink printed on UT paper substrate.
Applsci 11 11414 g005
Figure 6. Reflectance spectra of TLC ink printed on CB paper substrate.
Applsci 11 11414 g006
Figure 7. Reflectance spectra of TLC, UVF on TLC, and UVFp in TLC, at 27 °C: (a) on UT paper substrate; (b) on CB paper substrate.
Applsci 11 11414 g007
Figure 8. Reflectance spectra of TLC, UVF on TLC, and UVFp in TLC, at 29 °C: (a) on UT paper substrate; (b) on CB paper substrate.
Applsci 11 11414 g008
Figure 9. Reflectance spectra of TLC, UVF on TLC, and UVFp in TLC, at 31 °C: (a) on UT paper substrate; (b) on CB paper substrate.
Applsci 11 11414 g009
Figure 10. CIELAB colour values of TLC, UVF on TLC, and UVFp in TLC inks printed on UT paper substrate, presented as (a) (a*, b*); (b) L* (T) graphs.
Applsci 11 11414 g010
Figure 11. CIELAB colour values of TLC, UVF on TLC, and UVFp in TLC inks printed on CB paper substrate, presented as (a) (a*,b*); (b) L* (T) graphs.
Applsci 11 11414 g011
Figure 12. Microscopic images of: (a) UVF on TLC without UV; (b) UVF on TLC exposed to UV radiation; (c) UVFp in TLC without UV; (d) UVFp in TLC exposed to UV radiation; printed on UT paper substrate (mag 200×).
Applsci 11 11414 g012
Figure 13. Microscopic images of: (a) UVF on TLC without UV; (b) UVF on TLC exposed to UV radiation; (c) UVFp in TLC without UV; (d) UVFp in TLC exposed to UV radiation; printed on CB paper substrate (mag 200×).
Applsci 11 11414 g013
Table 1. Smoothness and calliper of paper substrates.
Paper PropertyStandardMeasuring UnitUTCB
Smoothness (Bekk method)ISO 5627s11.940.68
CalliperISO 534:2011mm0.6170.293
Table 2. Roughness parameters measured on paper substrates.
SubstratesRa (µm)SDRz (µm)SDRmax (µm)SD
UT2.390.1712.430.8216.542.28
CB6.940.6936.642.0945.025.76
Table 3. Thickness of the printed layers.
Printed Ink Layers Thickness (µm)
UTSDCBSD
TLC 19.291.3720.431.50
UVF 19.521.1820.831.41
UVF on TLC30.712.0532.332.18
UVFp in TLC23.861.5224.461.41
Table 4. Roughness parameters measured on prints.
SamplesRa (μm)SDRz (μm)SDRmax (μm)SD
TLC/UT2.190.1212.311.1215.542.12
UVF/UT1.890.2310.711.0815.232.51
UVF on TLC/UT2.240.1912.901.5619.215.03
UVFp in TLC/UT1.980.1611.371.0715.055.79
TLC/CB5.450.4031.033.4939.135.53
UVF/CB3.940.6421.644.0528.034.48
UVF on TLC/CB3.980.3522.132.4530.094.62
UVFp in TLC/CB4.880.7025.983.3032.874.91
Table 5. Adhesion parameters between the papers and printed ink layers.
Adhesion Parameters (mJ/m2)
Surfaces of Interaction γ 12 W 12 S 12
UT–TLC12.8877.72−12.44
UT–UVF4.5262.7218.23
UT–UVFp in TLC10.1955.87−4.89
TLC–UVF (on UT)13.3066.45−14.79
CB–TLC13.1093.96−28.06
CB–UVF7.6374.237.37
CB–UVFp in TLC10.1192.40−0.83
TLC–UVF (on CB)14.3866.8212.73
Table 6. Properties of pure TLC ink and hybrid ink systems printed on UT paper substrate: temperature at which the L* (T) curve has its maximum is denoted by T(L*max), and its intensity by ΔL*max. See also Figure 10.
SampleT(L*max) (°C)ΔL*max
TLC275.21
UVF on TLC27.54.82
UVFp in TLC27.54.09
Table 7. Properties of pure TLC ink and hybrid ink systems printed on CB paper substrate: temperature at which the L*(T) curve has its maximum is denoted by T (L*max), and its intensity by ΔL*max. See also Figure 11.
SampleT(L*max) (°C)ΔL*max
TLC27.56.38
UVF on TLC27.54.42
UVFp in TLC275.49
Publisher’s Note: MDPI stays neutral with regard to jurisdictional claims in published maps and institutional affiliations.

