Article

Prediction of the Long-Term Performance Based on the Seepage-Stress-Damage Coupling Theory: A Case in South-to-North Water Diversion Project in China

1
School of Water Conservancy, North China University of Water Resources and Electric Power, Zhengzhou 450045, China
2
Collaborative Innovation Center of Water Resources Efficient Utilization and Protection Engineering, Zhengzhou 450045, China
3
Shanghai Investigation, Design and Research Institute Co., Ltd., Shanghai 200335, China
4
Department of Hydrogeology, Faculty of Earth Sciences, King Abdulaziz University, Jeddah 21589, Saudi Arabia
*
Author to whom correspondence should be addressed.
Submission received: 9 October 2021 / Revised: 26 November 2021 / Accepted: 29 November 2021 / Published: 2 December 2021
(This article belongs to the Special Issue Water Quality Modelling, Monitoring and Mitigation)

Abstract

:
The South-to-North Water Diversion Project has been in operation since 2014, directly benefiting more than 79 million people in China. Thus, its service life and long-term performance have gained much attention from scholars. To predict its life and performance, this study used the seepage/stress-damage coupling method. In addition, a seepage/stress-damage coupling theory was proposed and a finite element model of a deep excavated canal in the Xichuan Section of the South-to-North Water Diversion Project was established. The results showed that this canal subsided greatly in the first two years of operation, which can be confirmed by the monitoring data. It is predicted that, after 50 years of normal operation, the canal damage may start and spread from the water level, and reach 37.6%, but such damage will not affect its normal water delivery function. The purpose of this study is to provide guidance for the safe operation of the project.

1. Introduction

The South-to-North Water Diversion Project (SNWDP) aims to optimize the temporal and spatial allocation of water resources in China. As a national strategic project, it safeguards China’s land management and sustainable development. Canal engineering is an integral part of SNWDP, and its seepage failure involves complicated hydraulic problems, particularly in some deep excavated sections, due to the high groundwater level, complex geological conditions, soil consolidation and deformation, and rainfall or channel infiltration [1]. The seepage–stress coupling may occur between the concrete lining and the foundation, damaging the lining plate. If the damage persists, the water from the canal will seep into the soil of the canal more quickly, altering the seepage field and causing structural damage between the soil of the canal, the concrete lining, and the seepage field [2]. Therefore, scholars at home and abroad are all concerned about the SNWDP’s service life and performance evolution in long-term operation, for it matters to water delivery safety and further affects the people’s living conditions, social and economic development, and environmental protection [3]. The Xichuan Section is the first section of the main channel of the SNWDP Middle Route, classified into Class I project according to the engineering grade, so its safe running is of great significance.
A seepage/stress-damage (SSD) coupling theory was proposed, and a finite element model of a deep excavated canal in the SNWDP Xichuan Section was established in the same scale as its actual design drawings. Even the materials used and the surrounding environment were the same as the actual situation. First, the SSD coupling theory proposed in this paper needs a stable seepage field, on which a lot of research has been performed. For example, Cai et al. [4] used the strength reduction method to establish a seepage–stress coupled numerical model. They discussed the impact of various factors on the slope stability under different working conditions and concluded that the groundwater and rainfall infiltration have the most considerable effect on slope stability. In southern Jiangxi province, Pan et al. [5] investigated the failure modes of granite residual soil slopes and employed normal soil material parameters to analyze precipitation infiltration under three operating situations. They discovered that the wet front’s depth and slope coefficient have varied over time. Zhou et al. [6] studied the spatial–temporal characteristics of water movement on fractured soil slopes under rainfall conditions. They investigated the mechanism of fractured slope instability as a function of soil saturation variations and discovered that matrix suction is the primary driver of overall instability. Huang et al. [7] analyzed the stability of hydraulic landslides with different permeability coefficients under fluctuating reservoir water levels and rainstorm conditions. They found that due to heavy rains, the stability of the landslide was considerably reduced, and the coefficient of stability increased with increased permeability. Kim et al. [8] analyzed and compared water pressure and pore pressure data from hydraulic wells to observe the influence of seepage changes. Luo et al. [9]. analyze the sudden pipeline crash of a specific project and derive its evolution process. Zhao et al. [10] proposed an innovative permeability evolution equation. They found that the seepage pressure will continuously intensify fracture propagation and penetration in the rock mass due to the time effect of permeability and failure. Nian et al. [11] used pore pressure as a controlled condition to analyze the rainfall infiltration and seepage on slopes under different rainfall intensities. They obtained the relationship between the rainfall intensity and the actual infiltration rate. The above research results showed that the permeability coefficient will change with time, rainfall intensity and other external factors, which can be verified by the SSD theory (taking the permeability coefficient as a variable) in this study.
Second, the SSD coupling method used in this paper needs the coupling of the seepage field and the stress field, which is mainly achieved by solving the seepage field and converting it into an equivalent load acting on the model nodes. Many research on the seepage–stress coupling has been conducted at national and global scales. For example, Wang et al. [12] established a theoretical model of micro-fracture grouting seepage based on the fluid–solid coupling between grout seepage and micro-fractures. They studied the fracturing conditions, fractures’ spatial distribution, and the variation law of mud seepage distance. Through analysis and comparison, Ma et al. [13] obtained the failure mode and seepage characteristics of unloaded rock with and without water pressure. Ma et al. [14] used finite-difference to analyze the influence of saturated or unsaturated seepage on the slope stability. They obtained the influence of the flow rate on the stability of the slope. Liu et al. [15] analyzed that the external water pressure of the tunnel is related to the basement and seepage of the basement and is the main influencing factor related to safety. Xiao [16] used the neural network method to develop the program to combine the seismic load effect and the fluid–solid coupling effect. He analyzed the seepage stability of the earth dam and determined the dangerous sliding surface of the dam slope. Chen [17] gave a method of calculating the safety factor of slope stability considering seepage conditions based on the law of seepage–stress coupling evolution. He estimated that the effect of seepage has a significant impact on slope stability. Cai et al. [18] evaluated the slope stability under rainfall infiltration conditions based on the shear strength reduction technology. They considered the non-coupled conditions of seepage and deformation, combined with statistics and observation methods. Rahardjo et al. [19] studied the factors influencing slope stability under rainfall infiltration conditions. They found that slope instability mainly depends on the rainfall intensity and the nature of the soil, as well as slope type and groundwater level. Baum et al. [20] established saturated and unsaturated transient rainfall infiltration models. Based on correlated groundwater transients, unsaturated infiltration analysis, and groundwater pressure diffusion, the models predicted the time and main source areas of landslides caused by rainfall. Rahardjo et al. [21] considered different groundwater levels, rainfall intensity, and soil properties to analyze the stability of the residual soil slope under rainfall infiltration conditions. The results are in good agreement with the research trend in the parameter study. Muntohar et al. [22] analyzed the failure laws of shallow slopes under rainfall infiltration conditions based on the Green–Ampt infiltration model and the infinite slope stability model. The proposed model can be used to estimate the first-order approximation of the time when a rainfall-induced shallow landslide occurs and its sliding depth. Tsai et al. [23] compared the design plan with actual case data. They investigated the influence of unit weight and the function of unsaturated shear strength and saturation on shallow landslides triggered by rainfall infiltration. Borja et al. [24] established a finite element model that couples solid deformation with fluid pressure in unsaturated soil to evaluate slope stability. However, most of the above research was conducted by using the seepage method or the seepage–stress coupling method. Based on these results, the SSD coupling method was adopted in this paper.
Third, the SSD coupling method used in this paper correlates seepage–stress with damage to reflect the impact of damage on the seepage of concrete linings. The relationship between the seepage coefficient and damage was used as a bridge connecting the seepage field, stress field and damage field. Some scholars have also explored such methods. For example, Zhou [25] derived the permeability coefficient conversion equation taking into account the damage to the tunnel rock and depicted the SSD multi-field coupling model of the surrounding rock. He analyzed the stability of the surrounding rock excavated in the tunnel construction based on the fluid–solid coupling theory. Zhou et al. [26] established an SSD coupling algorithm based on the permeable lining theory and applied it to high-pressure hydraulic tunnels. Their results are consistent with the general engineering laws and provide a reference for solving practical engineering problems. Sheng et al. [27] believe that the influence of groundwater on slope stability cannot be replaced by pore water, and the synergy of the seepage field and the stress field must be considered in foundation pit slope engineering. Xu et al. [28] established the equation of relation between rock failure and coefficient of permeability based on damage variables and seepage–stress coupling. They described the evolutions of the rock-failure-based permeability and groundwater seepage field. They studied the evolutionary relationship between rock mass stress and strain, permeability and strain, strain and failure, as well as permeability and failure. Zhu et al. [29] coupled failure and fluid flow to the Mohr–Coulomb failure criterion, based on the dynamic evolution of damage, porosity and permeability, and proposed SSD models under the effect of hydraulic fracturing and natural fracturing based on the dynamic evolution of damage, porosity, and permeability. The results are very close to the engineering practices. The above research findings and the SSD coupling method used in this paper make the predictions more realistic.
Aiming at the above problems, this study used the SSD coupling method to predict the SNWDP’s service life and performance evolution after long-term operation. Taking into account the change in the permeability coefficient induced by soil consolidation over time and the evolution of the infiltration field and its performance after long-term operation, it is necessary to discover the internal mechanism of the seepage failure and further explore the long-term changes in the performance of typical deep excavated sections of the SNWDP. The ultimate goal of this study is to predict the performance evolution of the deep excavated canal in the SNWDP Xichuan Section after long-term operation, providing a theoretical basis for the actual operation of the project.

2. Basic Theory and Realization Method of SSD Coupling

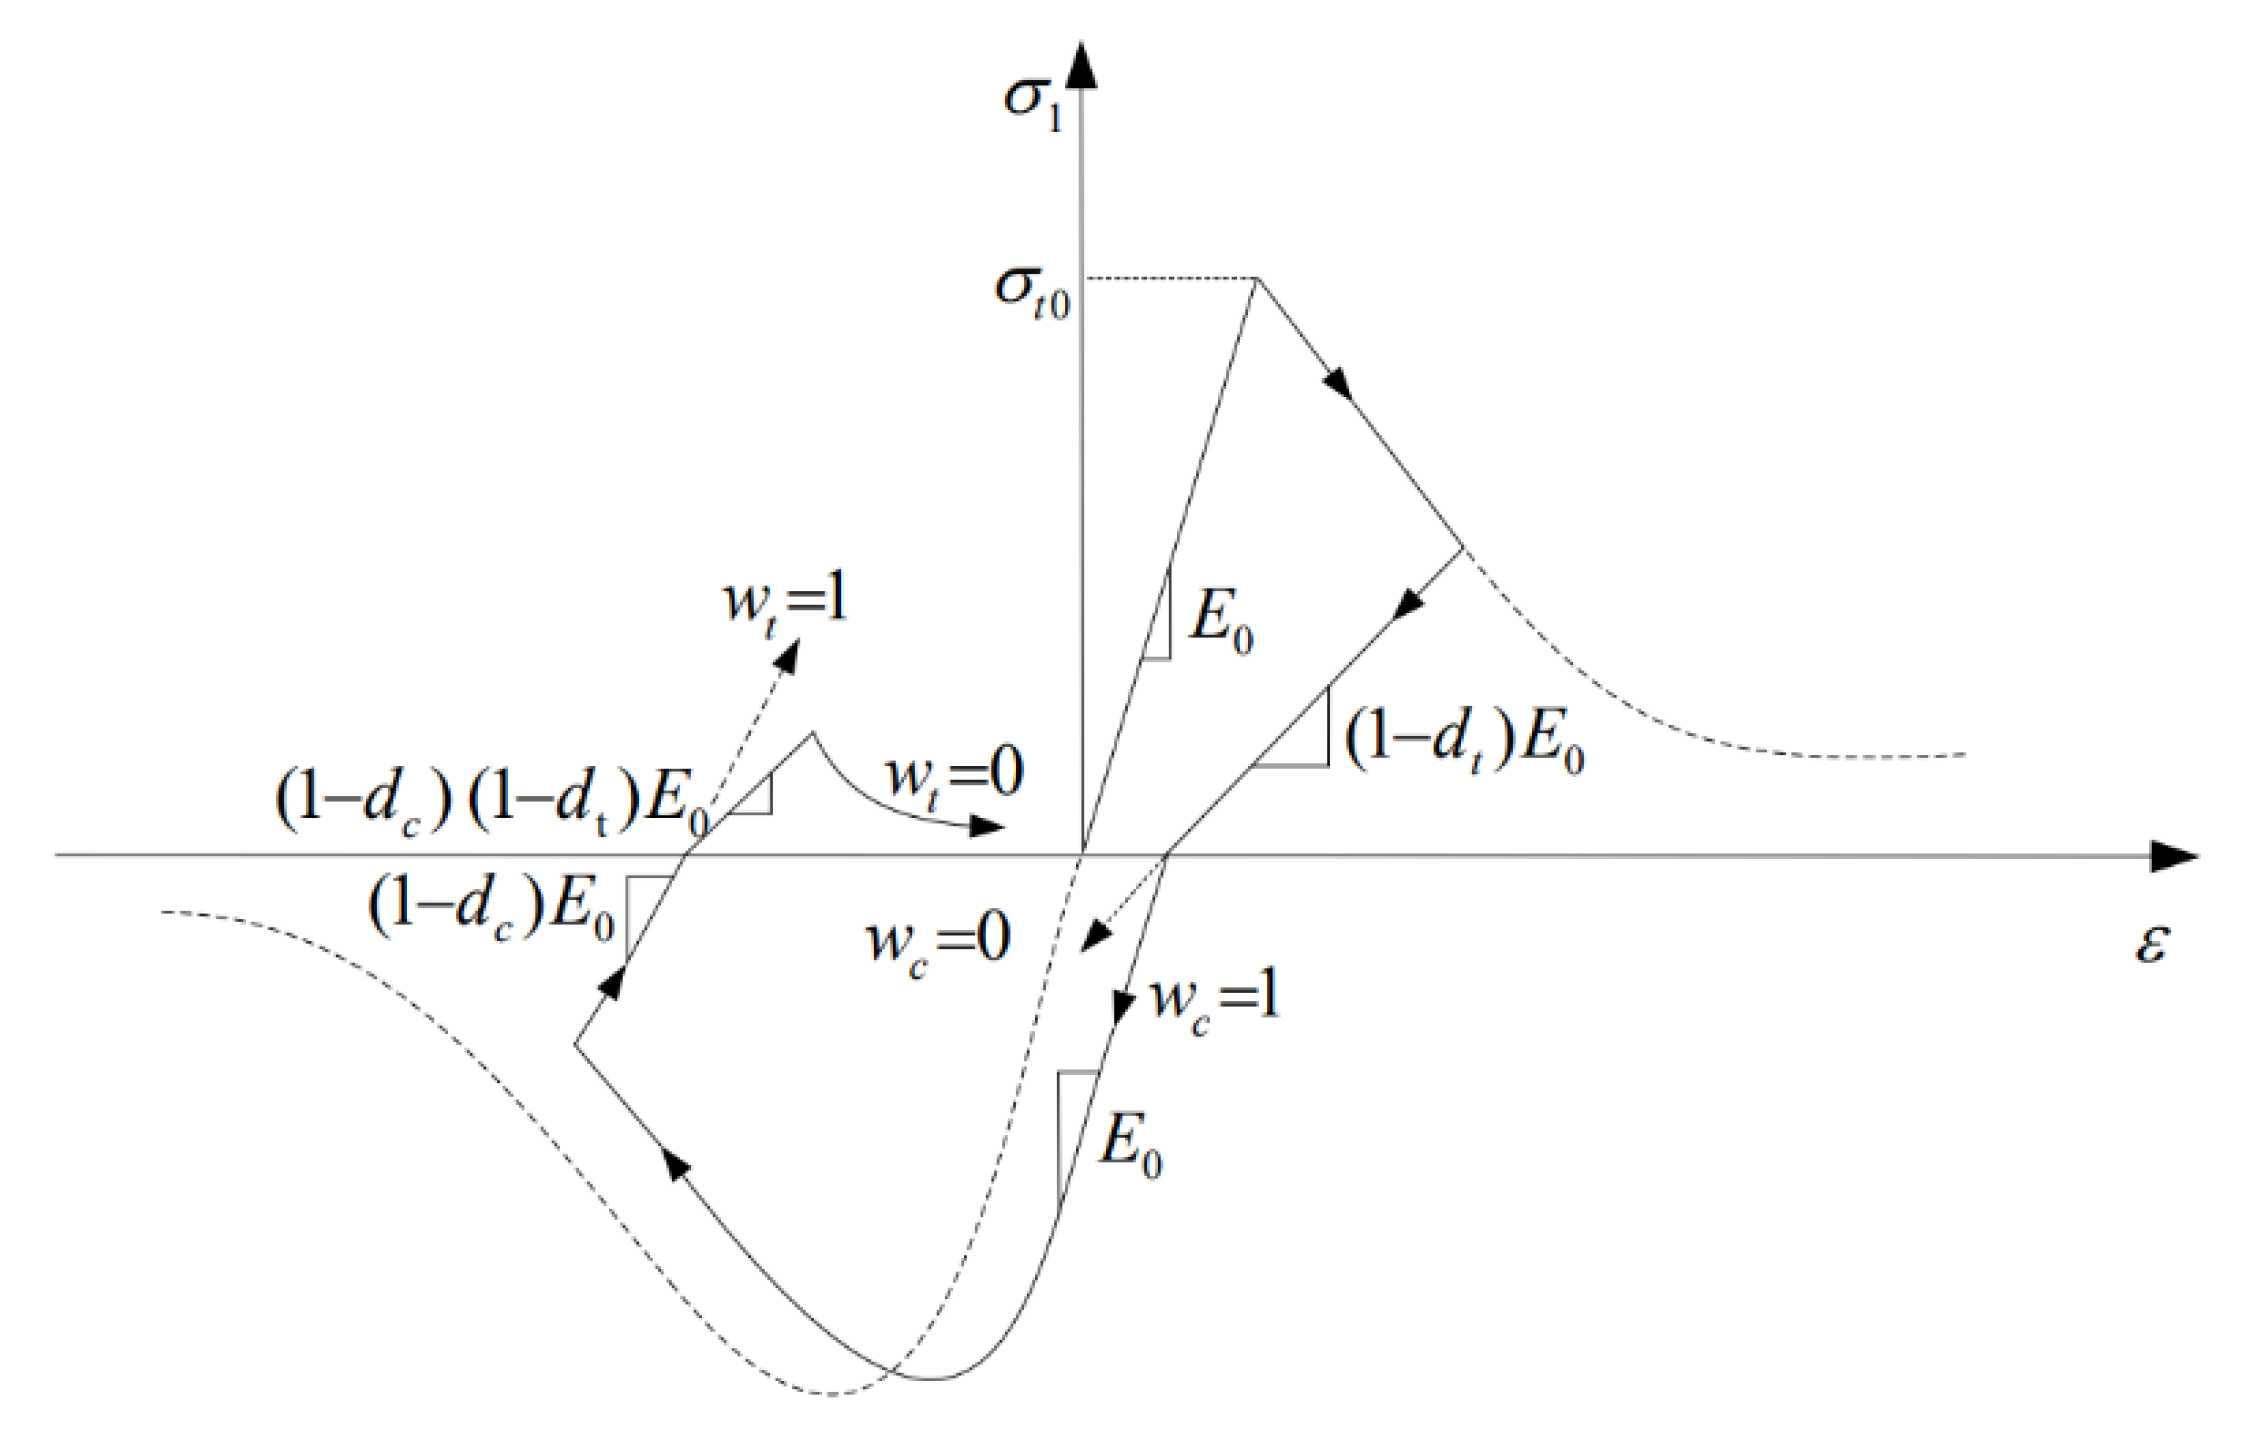
2.1. Basic Theory of SSD Coupling

Changes in the seepage–stress coupling environment can cause changes in the internal microstructure (i.e., meso-damage) [30], macro-mechanical properties, and permeability of concrete. Changes in permeability and mechanical properties can affect the concrete’s stress state, the distribution of soil pore pressure and worsen the meso-damage of concrete. This phenomenon is called SSD coupling.
Conventional seepage–stress coupled governing equations include solid-based geometric equations and equilibrium equations, fluid-based mass conservation equations and flow equations, and seepage–stress coupled constitutive equations [31]. The SSD coupled governing equations can be obtained by introducing concrete damage variables into the conventional seepage–stress coupled equations. The following derivation techniques are explained by using direct tensor notation to simplify the theoretical formulations mathematically [32].
Assuming that the seepage process follows the nonlinear Darcy’s law in the entire section, water and materials are incompressible, and the volumetric deformation of the saturated porous solid framework is equal to the deformation of the pores, then, the seepage field conforms to the continuity equation of three-dimensional single-phase porous fluid [33,34].
x [ k x H x ] + y [ k y H y ] + z [ k z H z ] + Q = 0
where kx, ky and kz are the permeability coefficients in the x, y, and z directions, respectively; hydraulic potential H = p γ , in which p is the pore water pressure and γ is the water unit weight; z is the elevation head; and Q is the source sink term.
Assuming that concrete and rock masses are equivalent continuum models, then, after finite element discretization, interpolation, and integration, the matrix equation for solving the seepage field can be obtained as follows [35]:
[ A ] { H } = { F }
where [ A ] is the total permeability matrix, { H } is the column vector of the node head, and { F } is the nodal load obtained by integrating the seepage boundary. After the seepage field is calculated, the water load generated by the hydraulic gradient acts on the inside of the structure in the form of seepage force. In the equivalent continuum model, the seepage gradient acts on the node in the form of seepage force. After the node head is obtained through the seepage field calculation, the seepage load acting on the element node is calculated as follows:
{ F p } = Ω γ [ N ] T { H x , H y , H z 1 } T d Ω
where [ N ] is the interpolation function, Ω is the integral domain of the seepage force node and T is the transposition of a matrix.
The computational space domain is discretized to obtain the seepage–stress coupling equation:
[ K ] [ U ] = { F V } + { F s } + { F p } + { F σ 0 }
where [ K ] is the structural stiffness matrix; [ U ] is the nodal displacement matrix; F V and F s are the body and surface loads, respectively; F p is the equivalent load formed by pore pressure; and F σ 0 is the initial stress load.
According to the incremental theory of plasticity in the plastic damage model, the total strain tensor, ε , is composed of the elastic strain rate, ε e l , and the equivalent plastic strain rate, ε p l :
ε = ε e l + ε p l
When there is no damage to the concrete, the stress–strain relationship of the concrete is as follows:
σ = D e l ( ε ε p l )
where σ is the total stress, and D e l is the elastic stiffness matrix.
When the concrete material is damaged, according to the theory of continuum damage mechanics, the internal micro-cracks, micro-pores, and other micro-defects under the action of external loads can be described by the damage factor, d . The damage factor is mainly used to reflect the concrete stiffness degradation under uniaxial or multiaxial loads. Assuming that the damage is isotropic, then, the relationship between the damage and stress of the concrete under the three-dimensional multiaxial state can be expressed by the damage elasticity equation, and the concrete stress, σ , is calculated as follows [36]:
σ = ( 1 d ) σ ¯ = ( 1 d ) D e l ( ε ε p l )
where σ ¯ is the effective stress, which represents the stress on the net section of the concrete material.
The element damage, d , is expressed by the equivalent plastic strain ε ˜ p l :
{ d t = d t ( ε ˜ t p l ) , 0 d t 1 d c = d c ( ε ˜ c p l ) , 0 d c 1
where d t is the tensile damage factor, d c is the compressive damage factor, t is the tensile state, and c is the compressive state.
The equivalent plastic strain ε ˜ p l is calculated as follows:
{ ε ˜ t p l = 0 t ε ˜ ˙ t p l d t ε ˜ c p l = 0 t ε ˜ ˙ c p l d t
{ ε ˜ ˙ t p l = r ( σ ¯ ^ ) ε ˙ ^ m a x p l ε ˜ ˙ c p l = ( 1 r ( σ ¯ ^ ) ) ε ˙ ^ m i n p l
where ε ˙ ^ m a x p l is the maximum value the plastic strain rate tensor, ε ˙ ^ m i n p l is the minimum value of the plastic strain rate tensor, ε ˜ ˙ t p l is the equivalent plastic strain rate in tension, and ε ˜ ˙ c p l is the equivalent plastic strain rate in compression. The multiaxial stress weighting factor r ( σ ¯ ^ ) can be defined as follows:
r ( σ ¯ ^ ) = i = 1 3 σ ¯ ^ i i = 1 3 | σ ¯ ^ i | , 0 r ( σ ¯ ^ ) 1
where σ ¯ ^ i (i = 1, 2, 3) are the principal stress components, respectively, · is defined as x = ( | x | + x ) / 2 , and | x | is the absolute value of x .
Under periodic alternating loads, the complex concrete damage mechanism is related to the cracking and merging of the initial cracks and their interrelation during changes. When the concrete is subject to compression after tension, its stiffness will be partially restored, that is, the unilateral effect is more significant. To reflect this effect, the relationship between tensile and compressive damage variables, d t and d c , is:
( 1 d ) = ( 1 s t d c ) ( 1 s c d t )
where 0 s t ,     s c 1 , s t , and s c are the relational expressions after stiffness recovery.
{ s t = 1 ω t r ( σ ¯ ^ ) , 0 ω t 1 s c = 1 ω c [ 1 r ( σ ¯ ^ ) ] , 0 ω c 1
where ω t and ω c are the weighting factors of stiffness recovery related to the material properties. Figure 1 shows the stiffness recovery curve of the concrete damage model when the weighting factors are ω t = 0 (compression → tension) and ω c = 1 (tension → compression) under uniaxial alternating loads.
When the plastic damage model is used, the damage may cause the degradation of the concrete structure’s stiffness. Based on it, the influence of concrete damage and cracking on the stress state of the structure can be simulated. At the same time, the concrete damage and cracking have a significant impact on the permeability characteristics of the structure. The material element is composed of a damaged phase and an undamaged phase. The element permeability coefficient is calculated as follows [37]:
k = ( 1 d ) k m + d k d ( 1 + ε v p f ) 3
where k m is the permeability coefficient of the undamaged phase, and k d is the permeability coefficient of the damaged phase. Assuming that no damage occurs in the case of elastic deformation, while plastic deformation and damage occur simultaneously, then, the plastic volumetric strain of the damaged phase is ε v p f = d ε v p , in which ε v p is the plastic volumetric strain of the element.
Once macroscopic cracks appear, brittle material’s permeability will suddenly increase; thus, the sudden jump factor, ξ, is introduced to calculate the permeability coefficient of the damage phase [25]:
k d = ξ k m
where, for compression–shear damage, ξ = 100 , and for tensile damage,
ξ = { 10 , 0 < d 0.1 1000 10 0.9 0.1 d + 10 , 0.1 < d < 0.9 1000 , 0.9 d 1
Compared with conventional seepage–stress coupling models, the model in this paper couples the effect of damage and extends the study of the seepage–stress coupling problem from the simple stress state analysis to the damage process analysis, which lays a theoretical basis for further studying the concrete failure process and seepage evolution under seepage–stress coupling conditions.

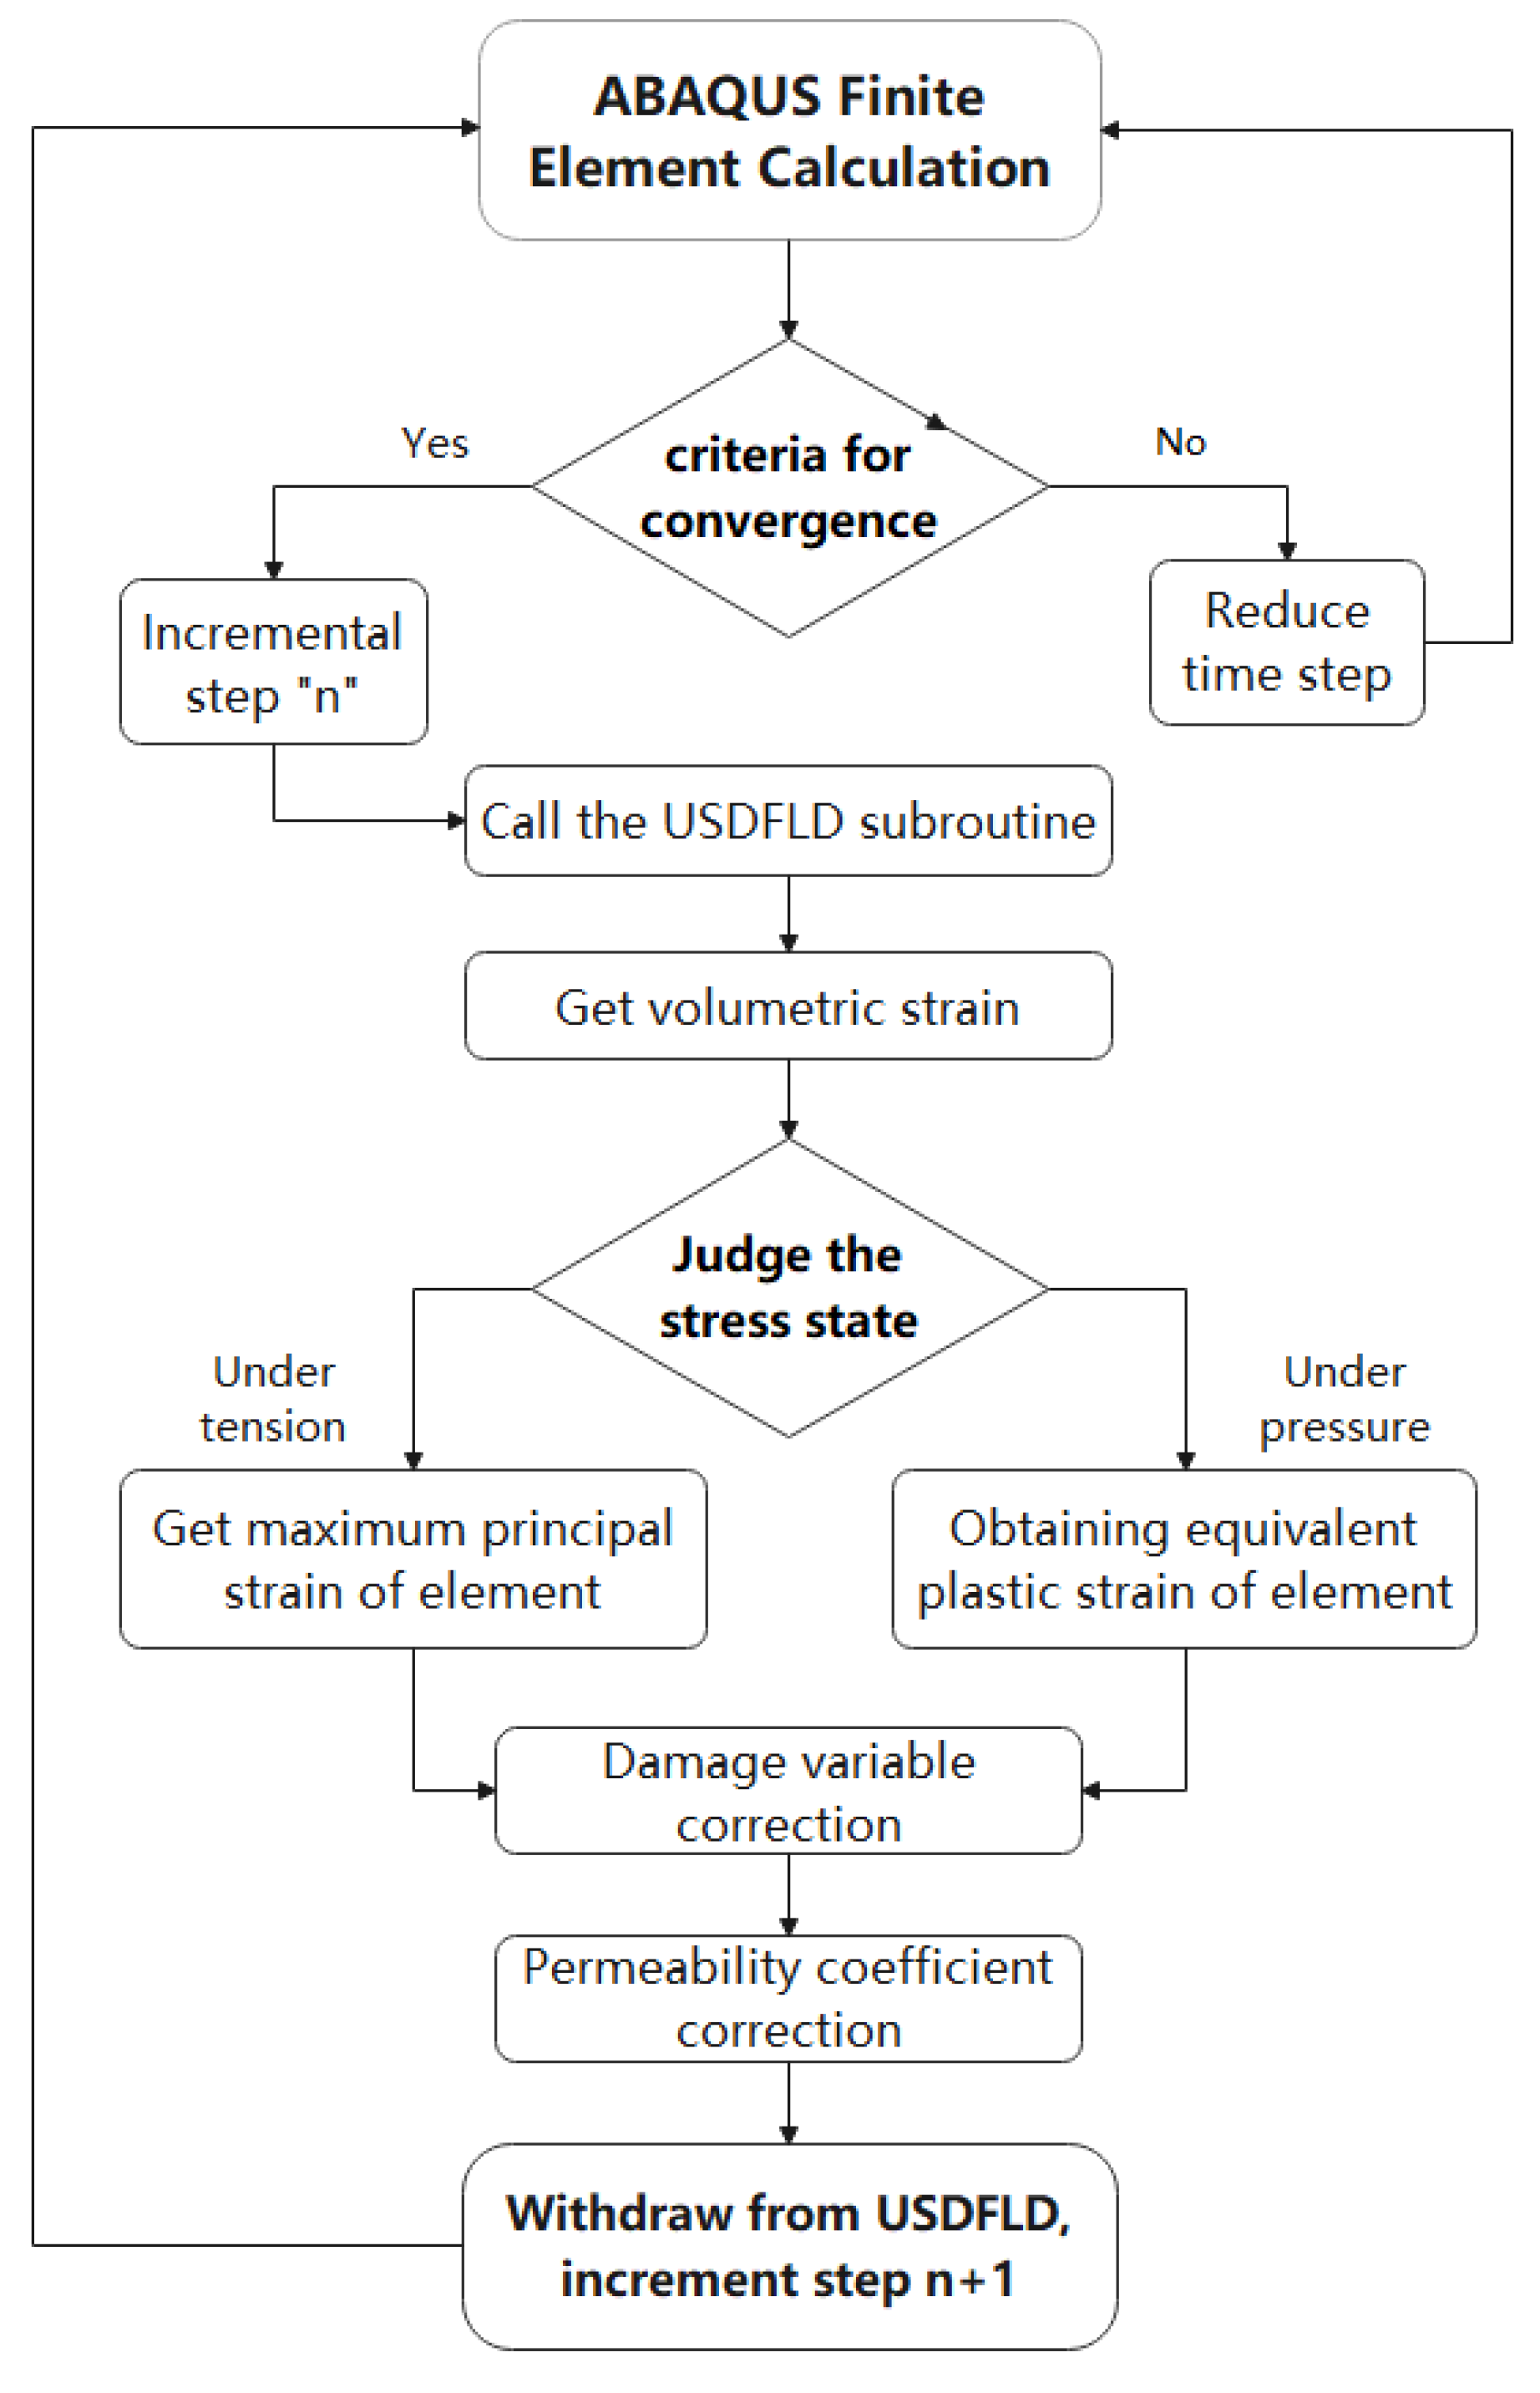
2.2. SSD Coupling Method

The lining supports most of the water pressure from the deep excavated canal of the SNWDP [38]. In this paper, the constitutive elastoplastic relationship is used to simulate the canal lining, and it is based on the Mohr–Coulomb criterion; and the SSD coupling method is used to analyze and predict the long-term functioning of the lining of the canal.
The SSD coupling method used in this paper is based on the ABAQUS finite element software for secondary development [39]. The SSD coupling method used in this paper is based on the ABAQUS finite element software for secondary development. The damage was obtained via the FORTRAN language program, namely GETBRM. According to the damage curve and the permeability coefficient, the subprogram USDFLD (ABAQUS subprogram, which can define the constant variable on the material point as a time function) is used to update the canal permeability coefficient with damage changes. The element’s permeability coefficient is defined as a field variable, and the subprogram was utilized in each incremental calculation to obtain the maximum principal strain and the equivalent plastic strain of the material integration point, thereby determining the element’s stress state. The element’s damage variable was solved. The lining’s permeability coefficient was revised based on relevant information of the element and node to predict the long-term operation of the SNWDP more accurately. The established SSD coupling analysis process is shown in Figure 2.

3. Model Parameters and Boundary Conditions

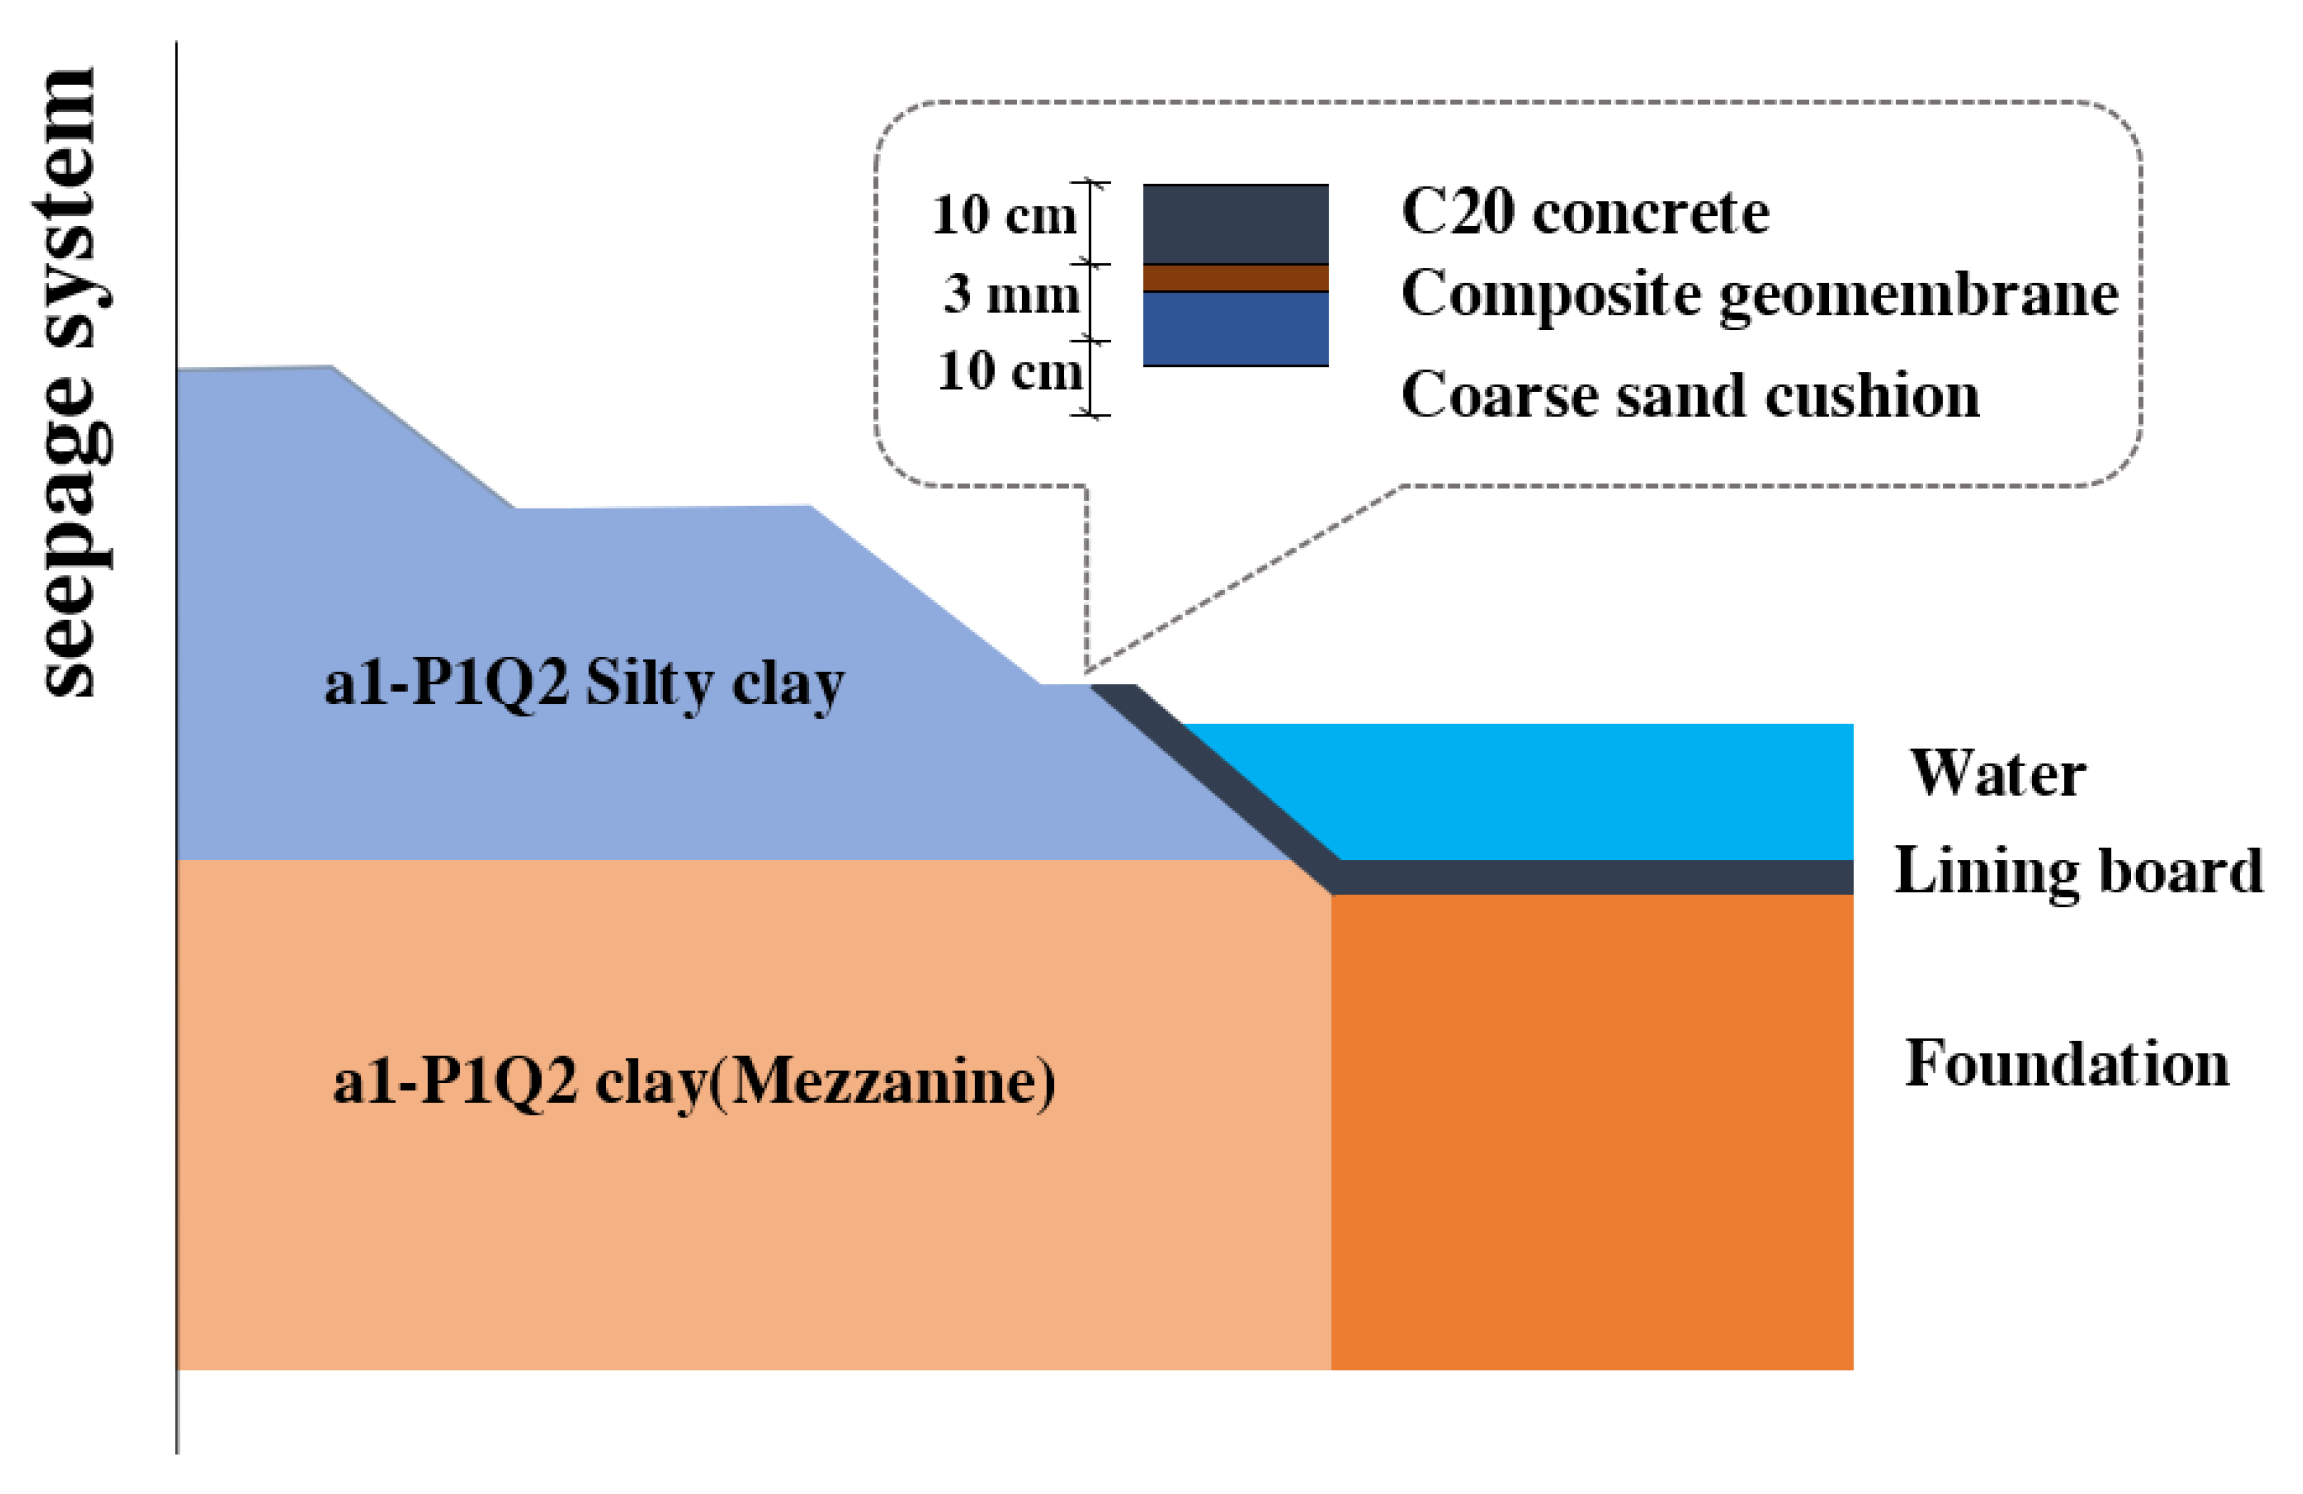
3.1. Project Overview

There is a canal excavated with a depth of 36–47 m in the SNWDP Xichuan Section. The canal is located on the edge of the northern subtropical zone and also in the humid area. Affected by the monsoon climate all year round, it has four distinct seasons and abundant rainfall, with an average annual rainfall of more than 730 mm. In addition, this canal has a high groundwater level. Given that canals with high fills are more likely to undergo slope instability, this paper selects a typical section of the said deep canal in Xichuan Section for research. Its slope is reinforced by the combination of large-section excavation and water collection well. The canal consists of concrete lining plates, a geomembrane, sand–gravel cushions, and foundations. There are three-level bridleways on both banks, which can withstand vehicle loads, canal water pressure, groundwater pressure, and gravity.
As illustrated in Figure 3, a three-dimensional finite element numerical simulation model of a representative portion of a deep dug channel was created. It was accomplished by considering the central point of the canal bottom as the origin, the X-axis as the horizontal direction of the vertical water flow, the Y-axis as the direction parallel to the flow direction, and the Z-axis as the vertical direction the vertical water flow. The canal structure in the numerical model was discrete based on the C3D8RP (hexahedral reduced-integration) element. It had 185,000 elements and 208,098 nodes in total. The bottom of the finite element model was constrained fully, and the surrounding was constrained normally. The boundary conditions of the total head and the free seepage section were set. The monitored seepage flow of the canal was converted into the seepage velocity and set as the seepage velocity boundary condition.

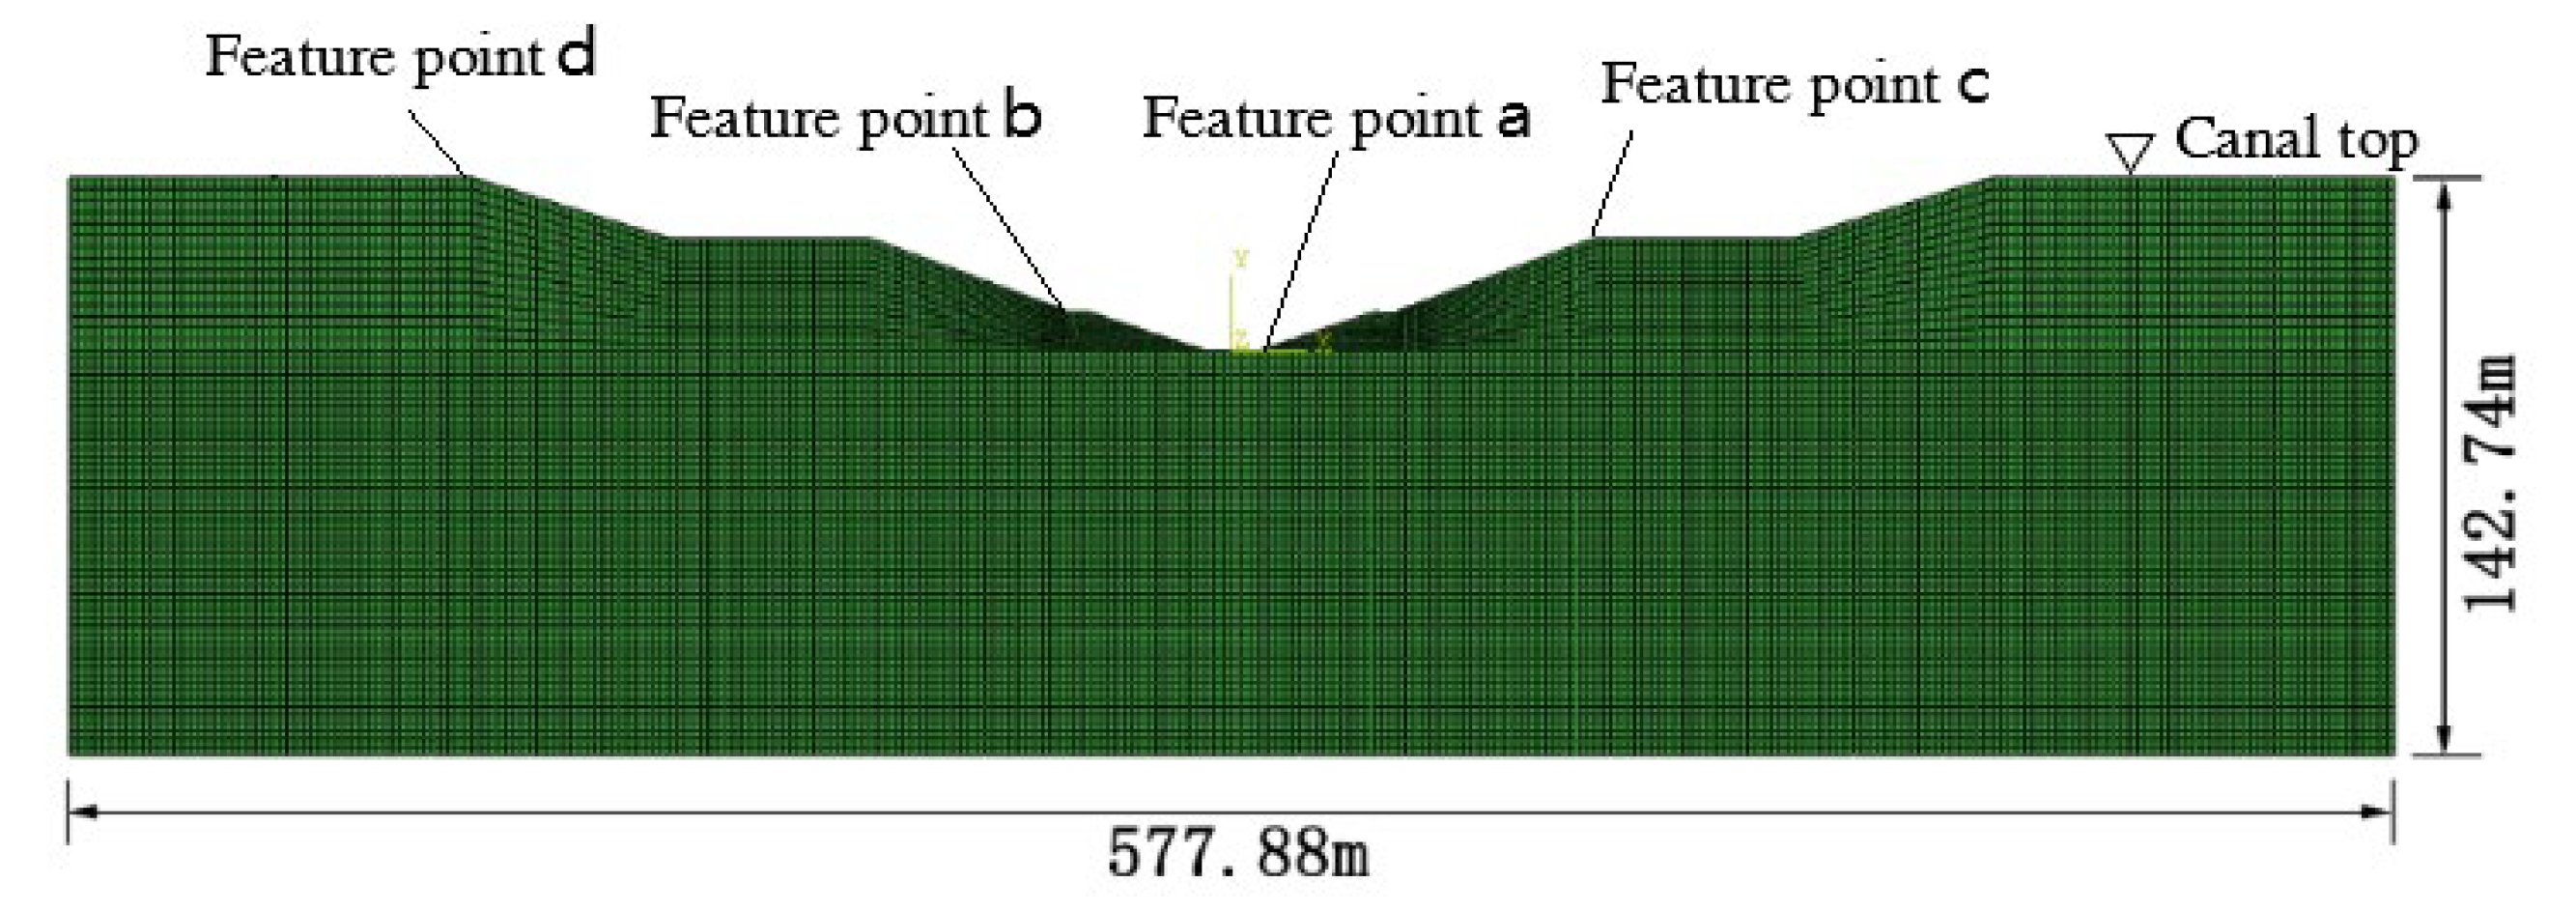
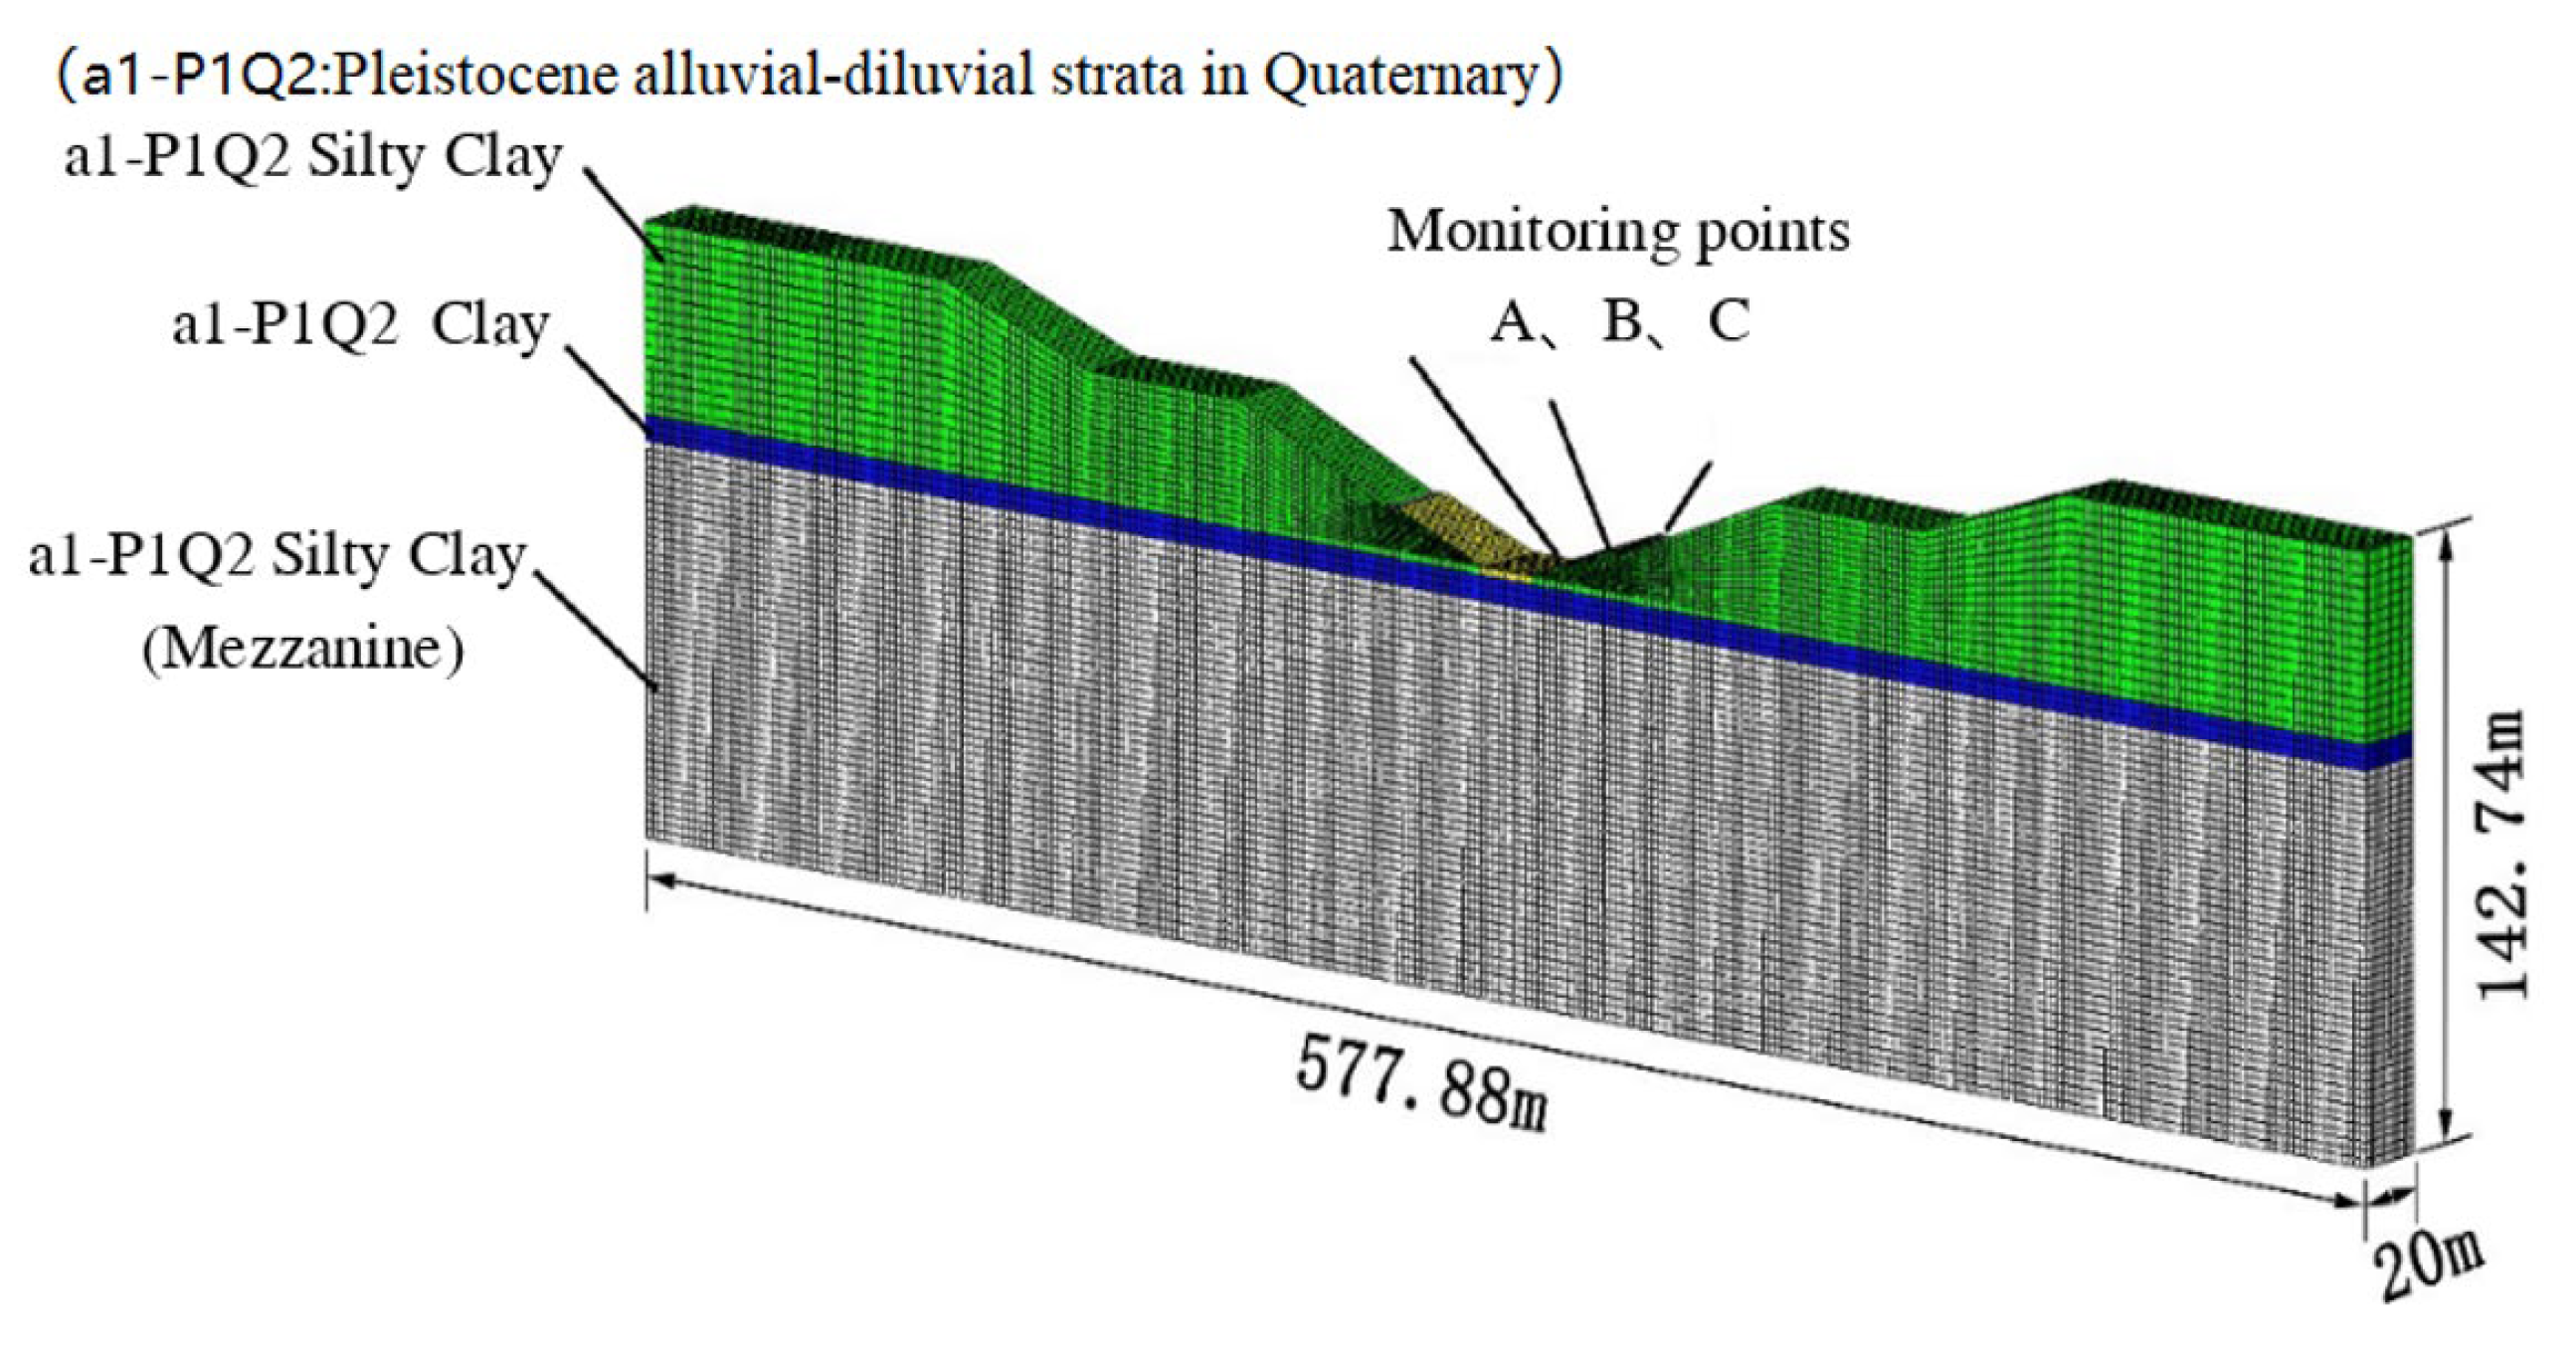
3.2. Finite Element Model and Material Properties

This study chose a specific section of a high groundwater level for the numerical simulation analysis of the infiltration–stress coupling. A three-dimensional finite element numerical simulation model based on the drawings of the typical section design was established. Figure 4 depicts the canal’s general details and the distribution of structural materials in each portion. Part of the model parameters are as follows: the canal bottom width is 13.5 m; the digging depth is 46 m; an 8 cm–thick C25 concrete slab is used as the lining plate, under which there is a composite geomembrane and then a 25 cm–thick coarse sand cushion, with the foundation at the bottommost; the designed water level is 8 m; the increased water level is 8.77 m; and the underground water level is 41.28 m.
Three monitoring points, A, B, and C, were selected in the deep excavated canal to monitor the canal’s displacement and settlement. The clay materials are mainly used for the foundation and slope of the deep excavated canal section of the SNWDP. The anti-seepage system is mainly achieved by a concrete lining board, geomembrane, coarse sand cushion, and polysulfide sealant, as shown in Figure 5. During the actual operation of the SNWDP, the canal’s infiltrated surface is subject to the continuous change of the permeability coefficient. Therefore, in this study, the characteristics of the water section were constantly assumed to ensure the continuity and accuracy of the results.

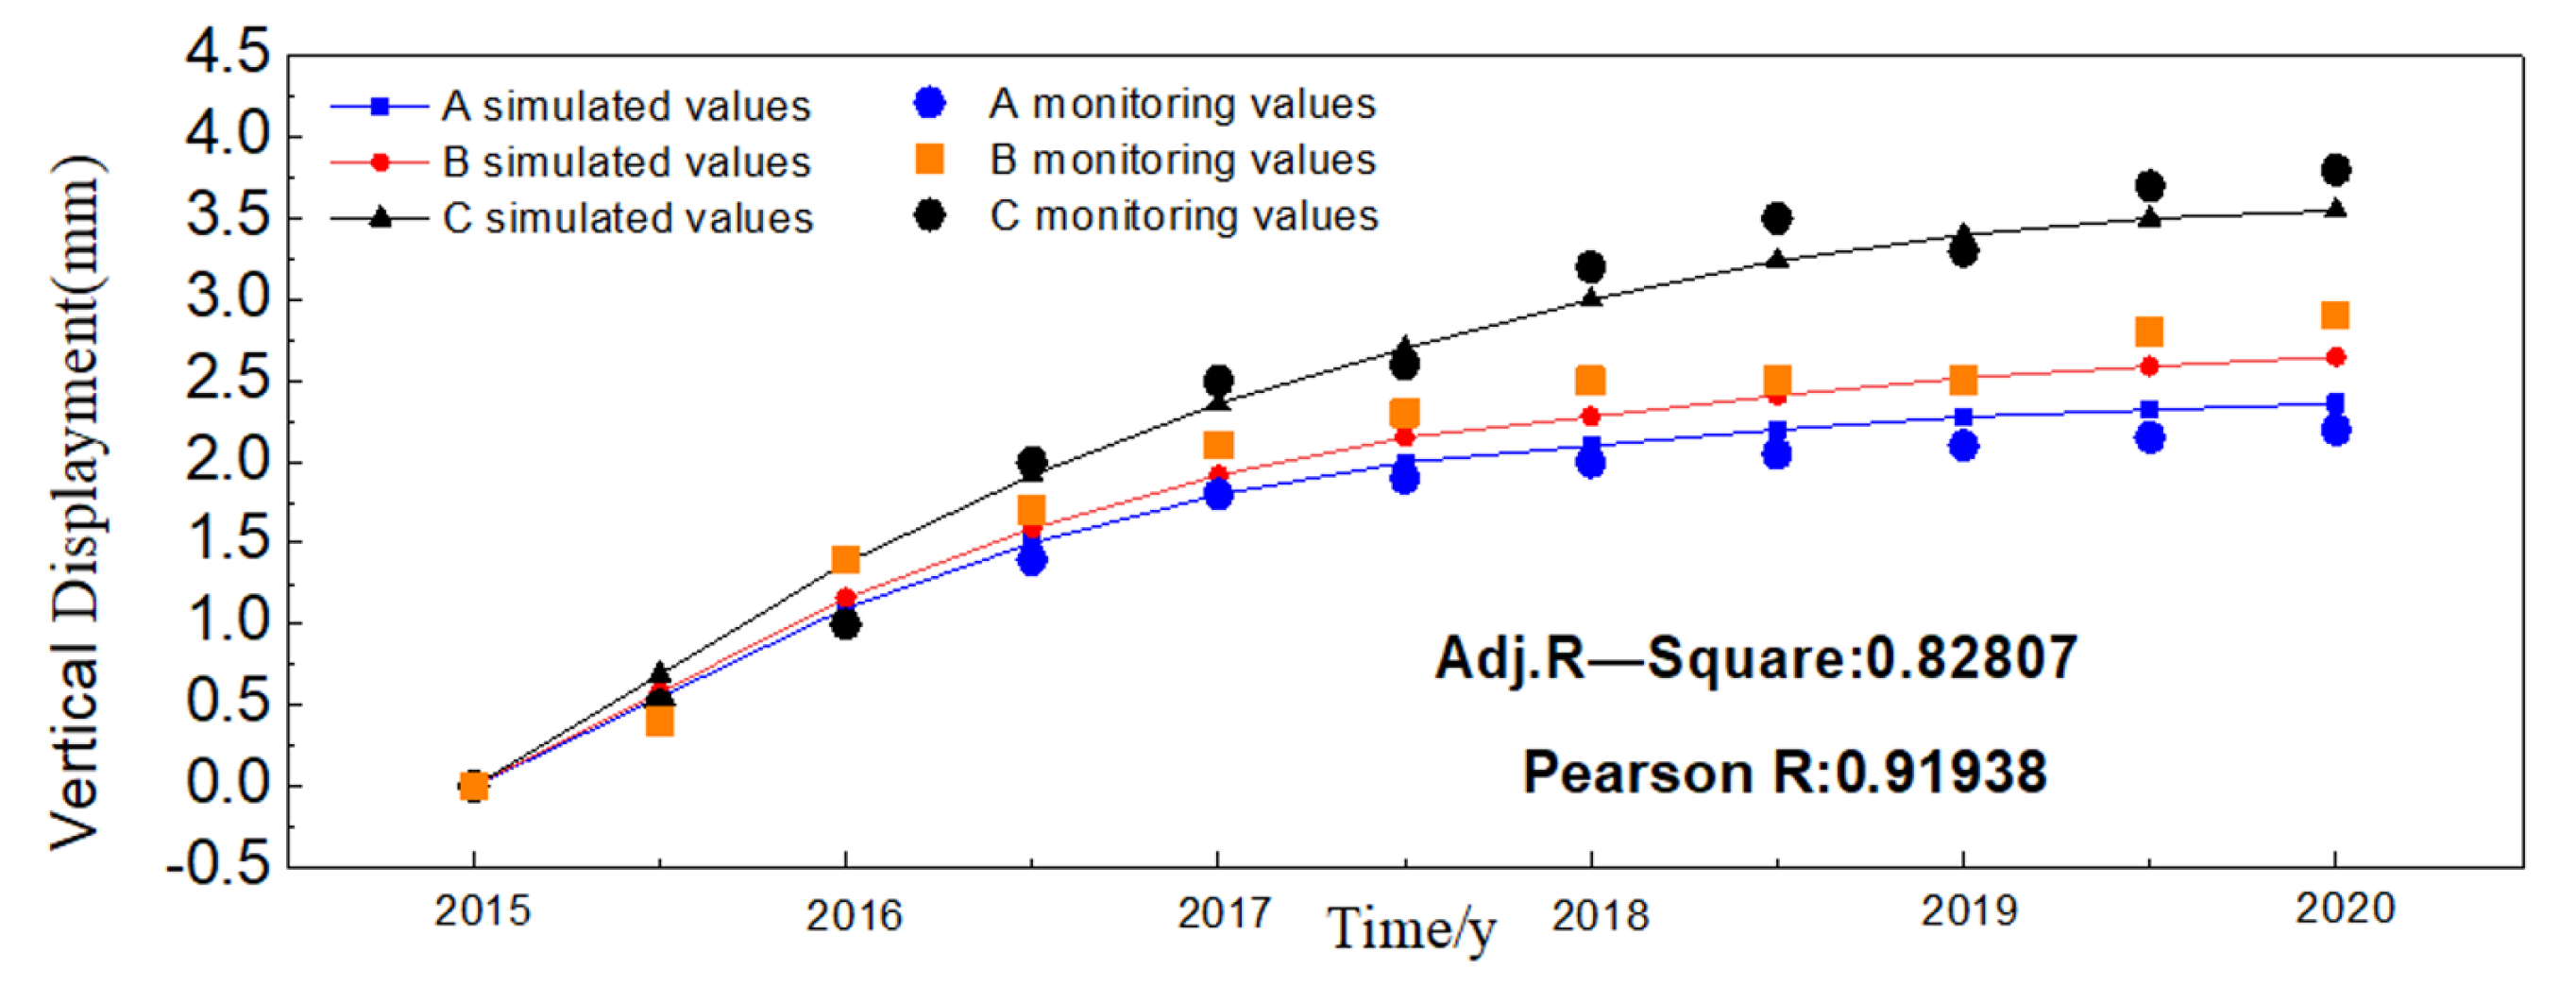
4. Comparison between Monitored Data and Numerical Simulation

This section provides a concise and precise description of the experimental results, their interpretation, and the experimental conclusions that can be drawn.
Three monitoring points, A, B, and C, were selected on the canal, bottom, and slope, respectively (as shown in Figure 6a). Their safety-monitoring data from January 2014 to January 2018 were calculated and analyzed. Settlement monitoring points were used to conduct on-site surveys of the settlement displacement of the deep excavated section of the SNWDP (Figure 6b,c). The calculation results were compared and analyzed. Figure 7 shows the correlation curve between the simulated settlement and the monitored settlement of the monitoring points.
It can be seen from Figure 7 that, (1) during the 5-year operation of the deep excavated canal, the displacement gradually increased from the bottom to the top of the canal, reaching the highest at the top. The maximum difference between the monitored displacement and settlement value and the calculated value is 0.559 mm, and the minimum is 0.02 mm; (2) the canal subsided rapidly during the first two years, and then the settlement slowed down and got close to final settlement; and (3) compared to the displacement curve of the monitored section, the settlement trend is similar. According to the Adj.R-square coefficient and Pearson’s correlation coefficient, the calculated data curve is highly fitted to the actually monitored data curve. After five years of operation, the settlements are the same, suggesting that the numerical simulation of the canal’s long-term settlements is consistent with the actual project operation.

5. Evolution of the Canal’s Long-Term Behavior Based on SSD

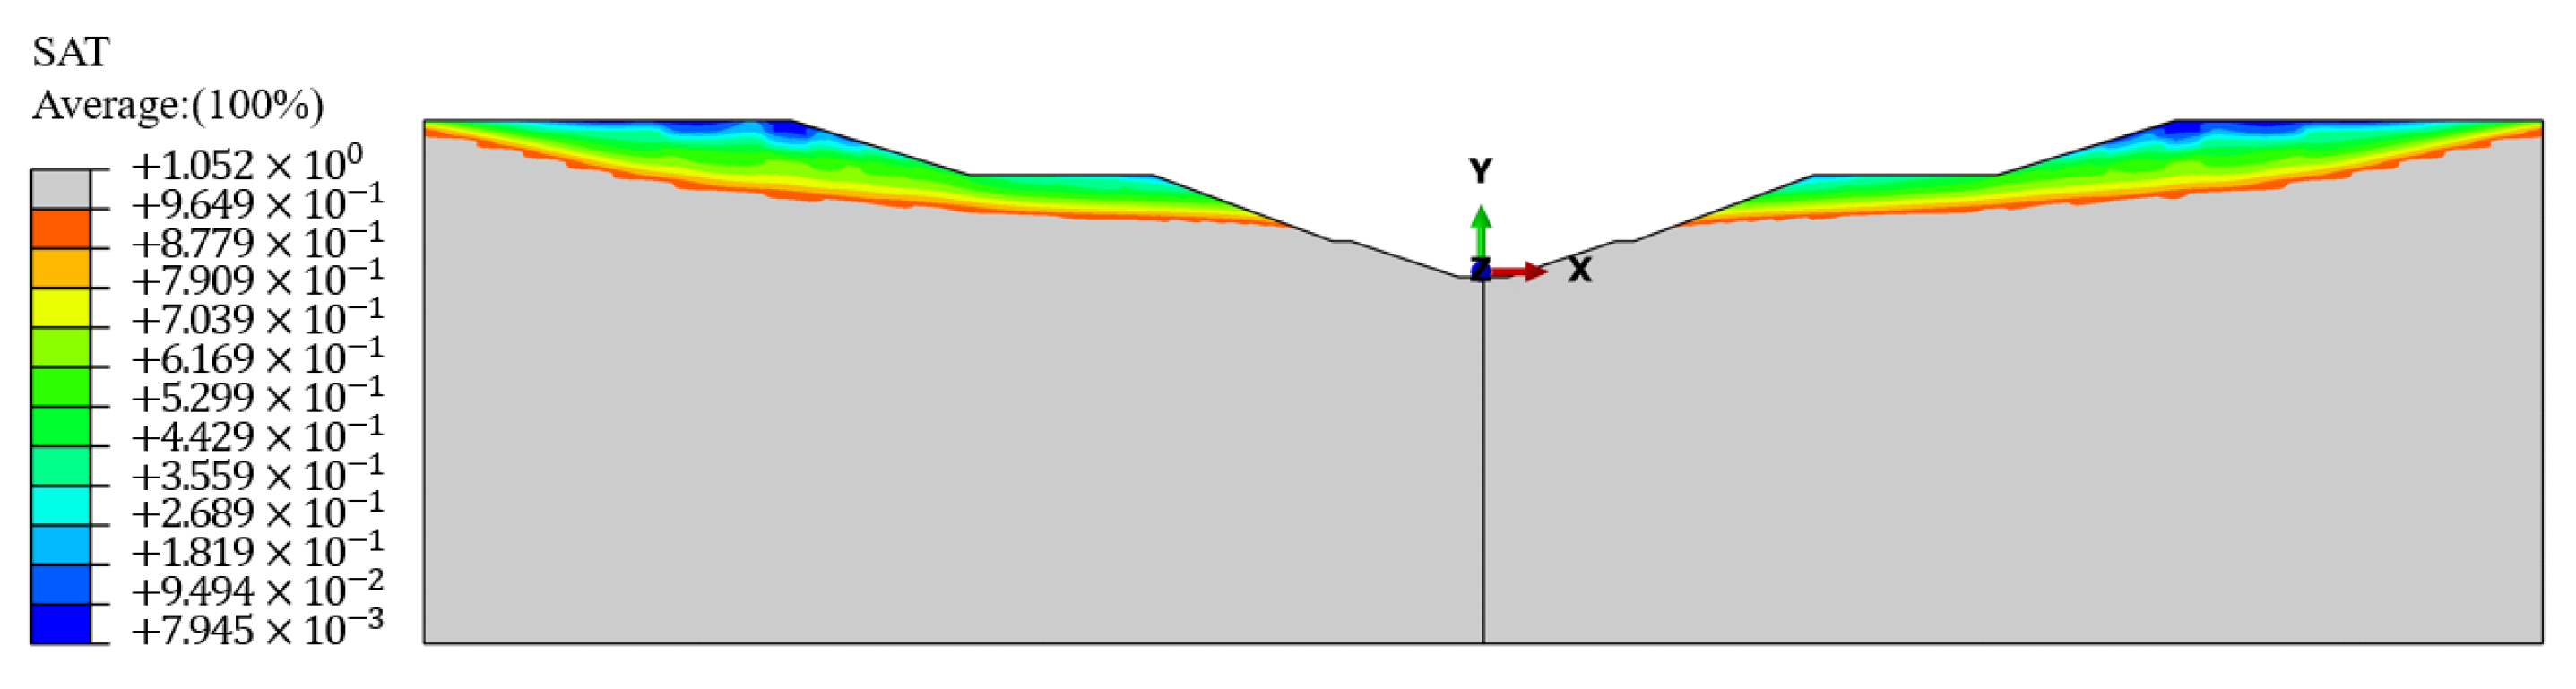
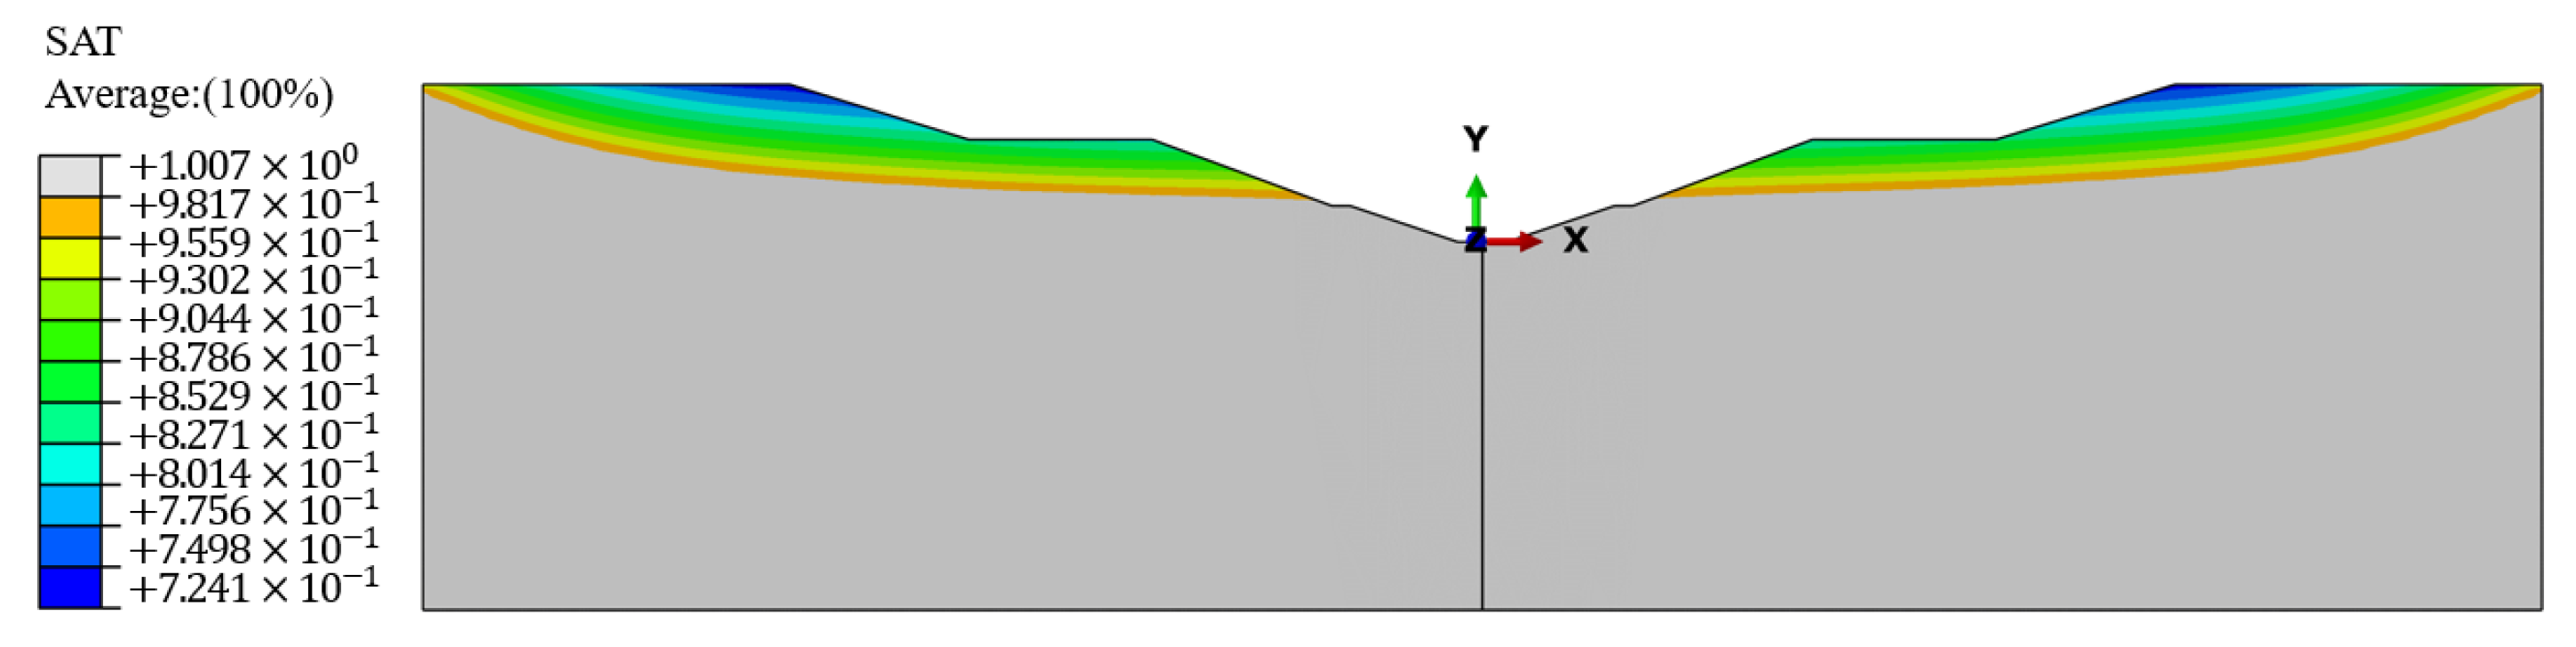
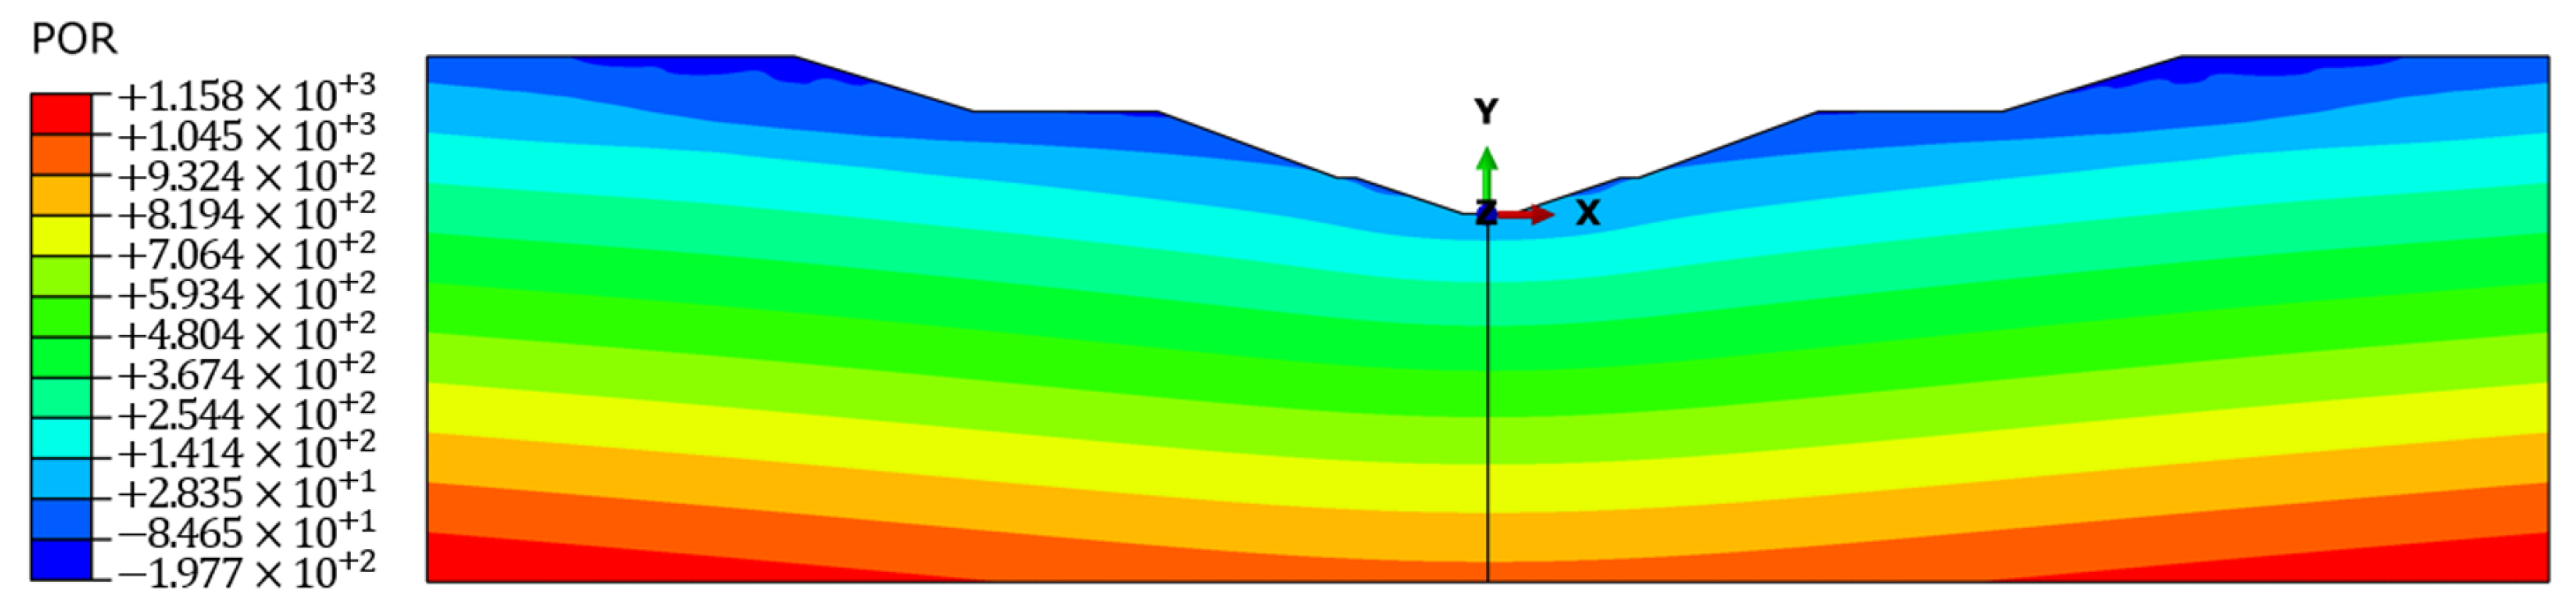
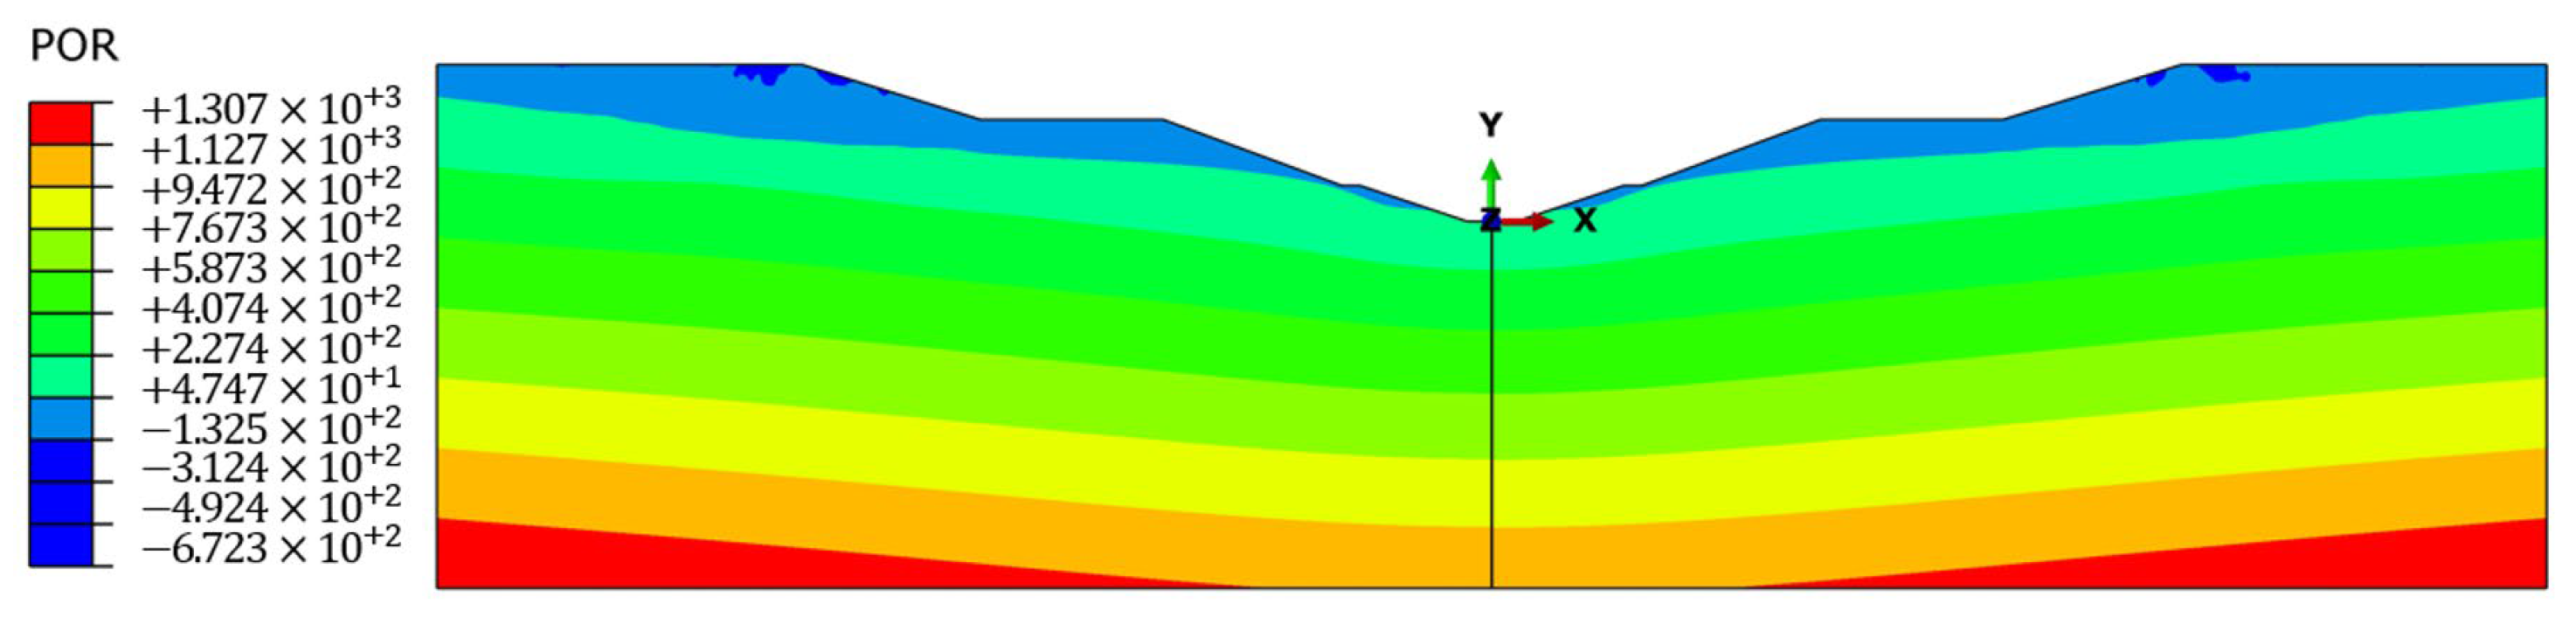
5.1. Evolution of Canal Pore Pressure

Long-term seepage failure has a significant impact on the safe operation of the canal. Taking as an example the deep excavated canal in the section of the SNWDP, the long-term settlement of the canal and seepage field changes under the effect of coupling of seepage and stresses are calculated. Based on the above parameters and conditions, the ABAQUS software is used to estimate the deep excavated canal’s long-term settlements and seepage field changes.
Figure 8 and Figure 9 respectively show the saturation contours of the deep excavated canal after 10 and 20 years of operation. Here, the saturation is used to describe the moisture content of the foundation soil under the concrete lining plate. It can be seen from the figures that in the deep excavated canal, most of the soil is in a saturated state, and some are unsaturated, and the seepage effect is relatively large. By comparing the two contours, it can be seen that under given conditions, as the operating time of the canal increases, the saturated zone decreases and the unsaturated zone increases. It may be due to the fluctuation in the void ratio and the permeability coefficient produced by canal settlement. With the continuous settlement of the canal, the void ratio decreases, and the coefficient of permeability also decreases. In the macroscopic view, a change in the seepage field generates a change in the stress field, which shows a change in the settlement.
Figure 10 and Figure 11 respectively show the pore pressure contours of the deep excavated canal after ten years and 20 years of operation. It can be seen from the figures that there is negative pore pressure at the top of the canal, indicating the existence of unsaturated zones. The foundation exhibits both saturated seepage and unsaturated seepage, which is consistent with the numerical results of saturation. Pore pressure decreases on both sides towards the middle. Due to the high groundwater level on both sides of the deep excavated canal, the groundwater flows into the canal center under the action of gravity. Therefore, drainage measures should be taken on the slope of the canal to reduce the groundwater seepage and improve the security of the canal water supply.

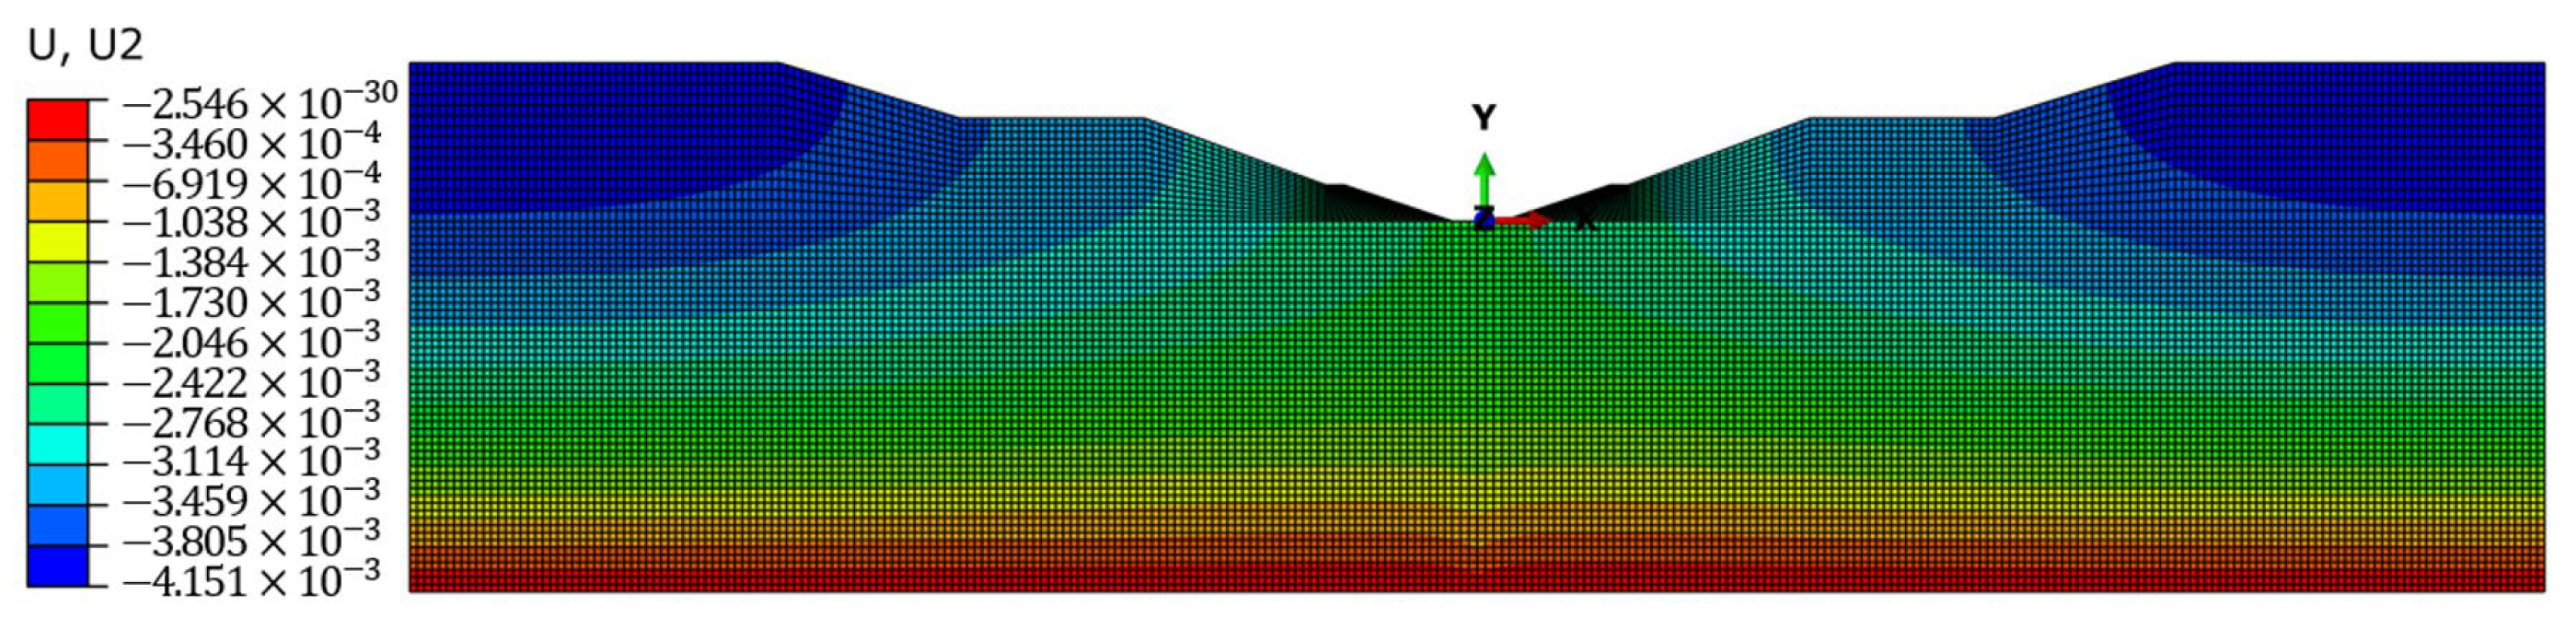
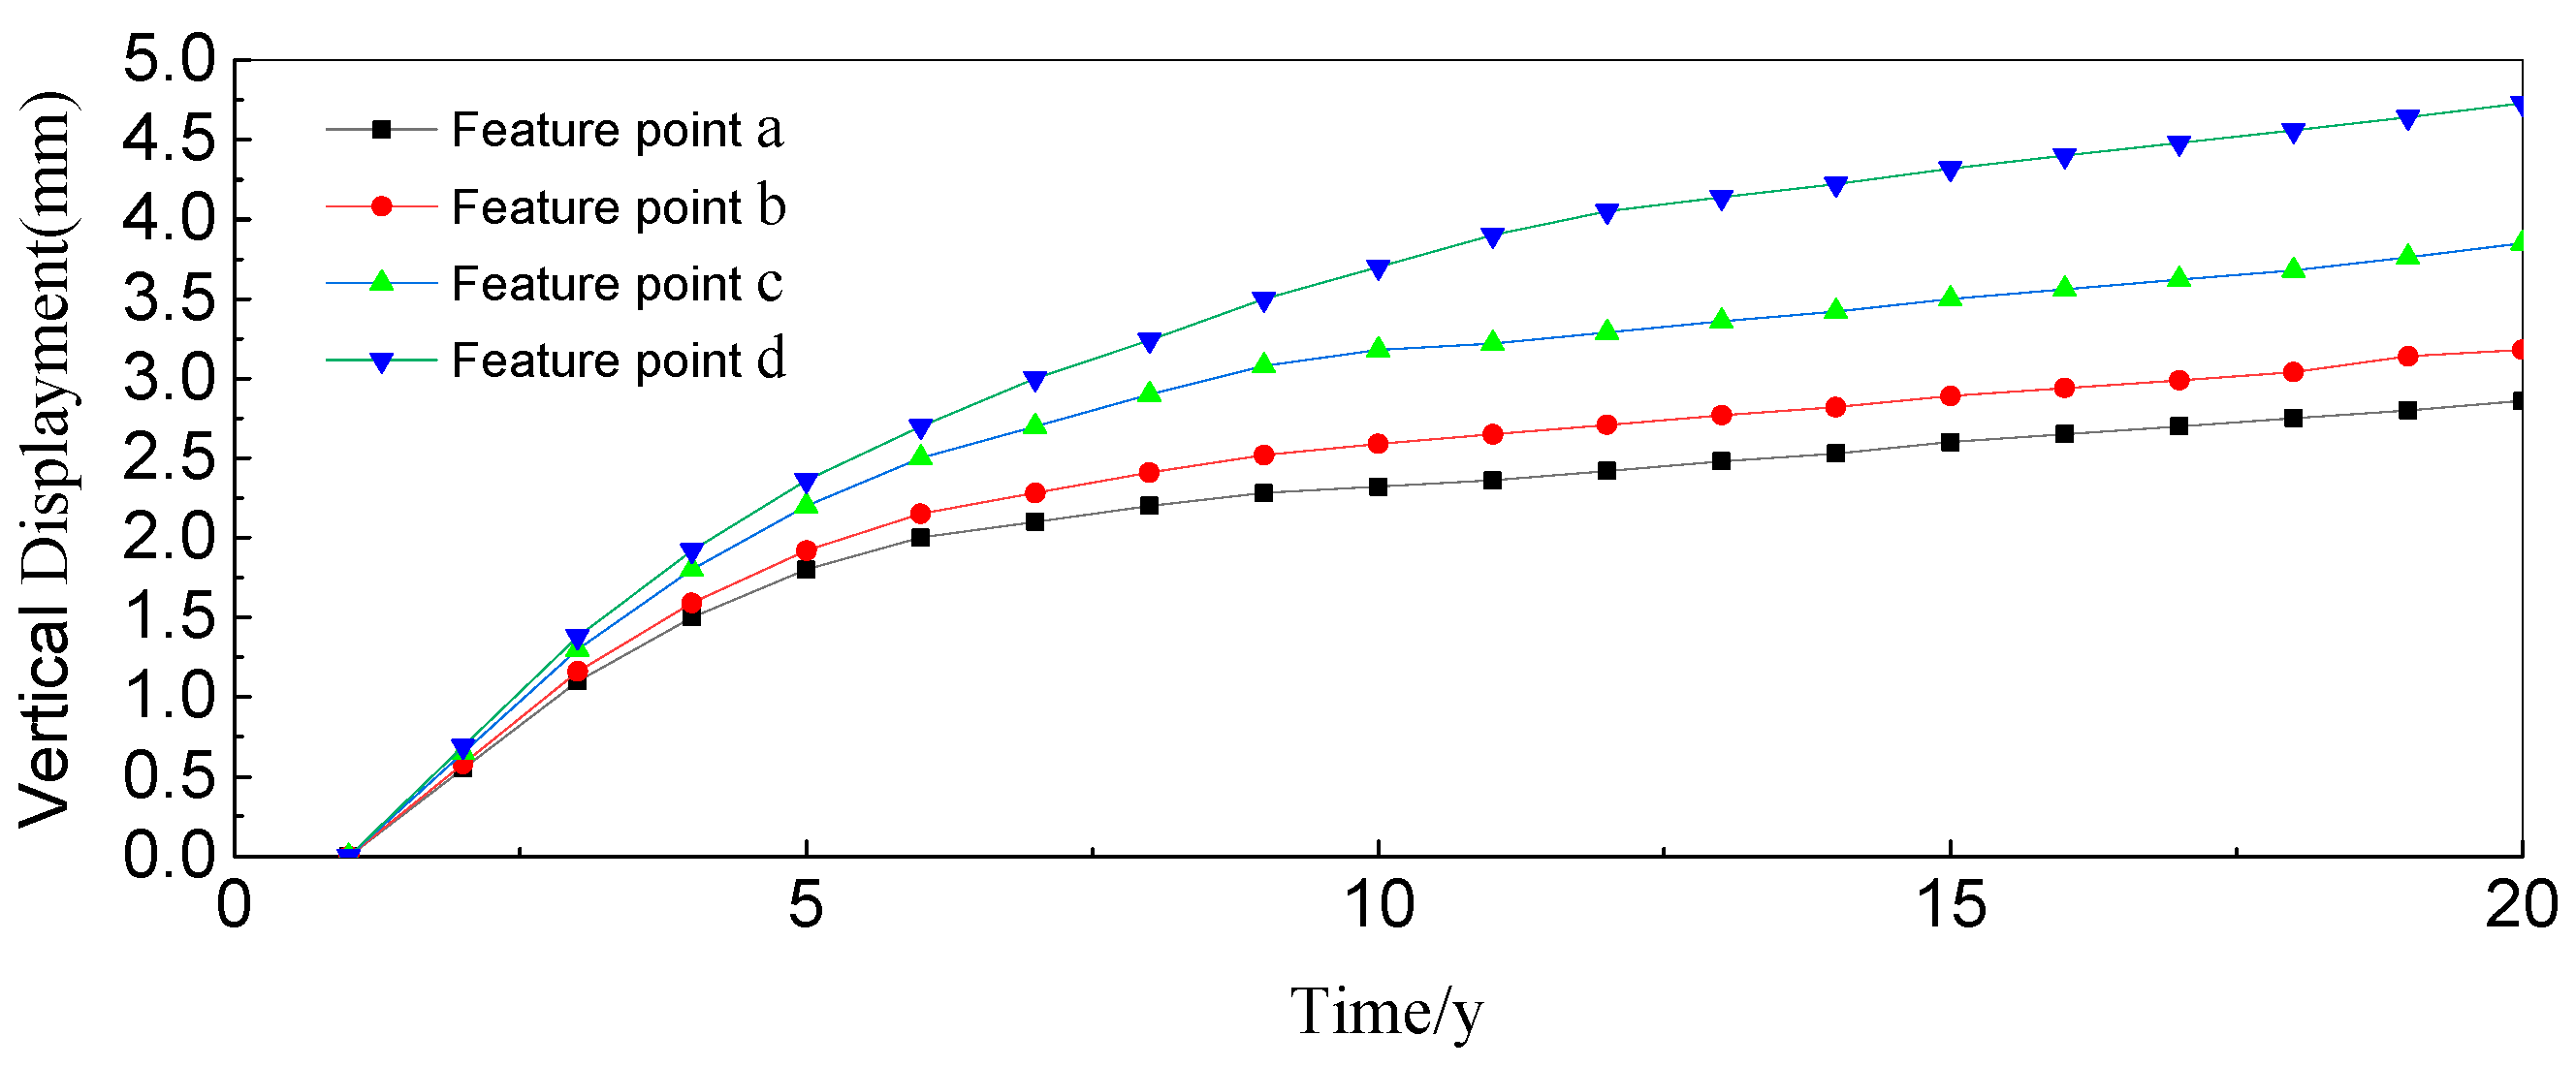
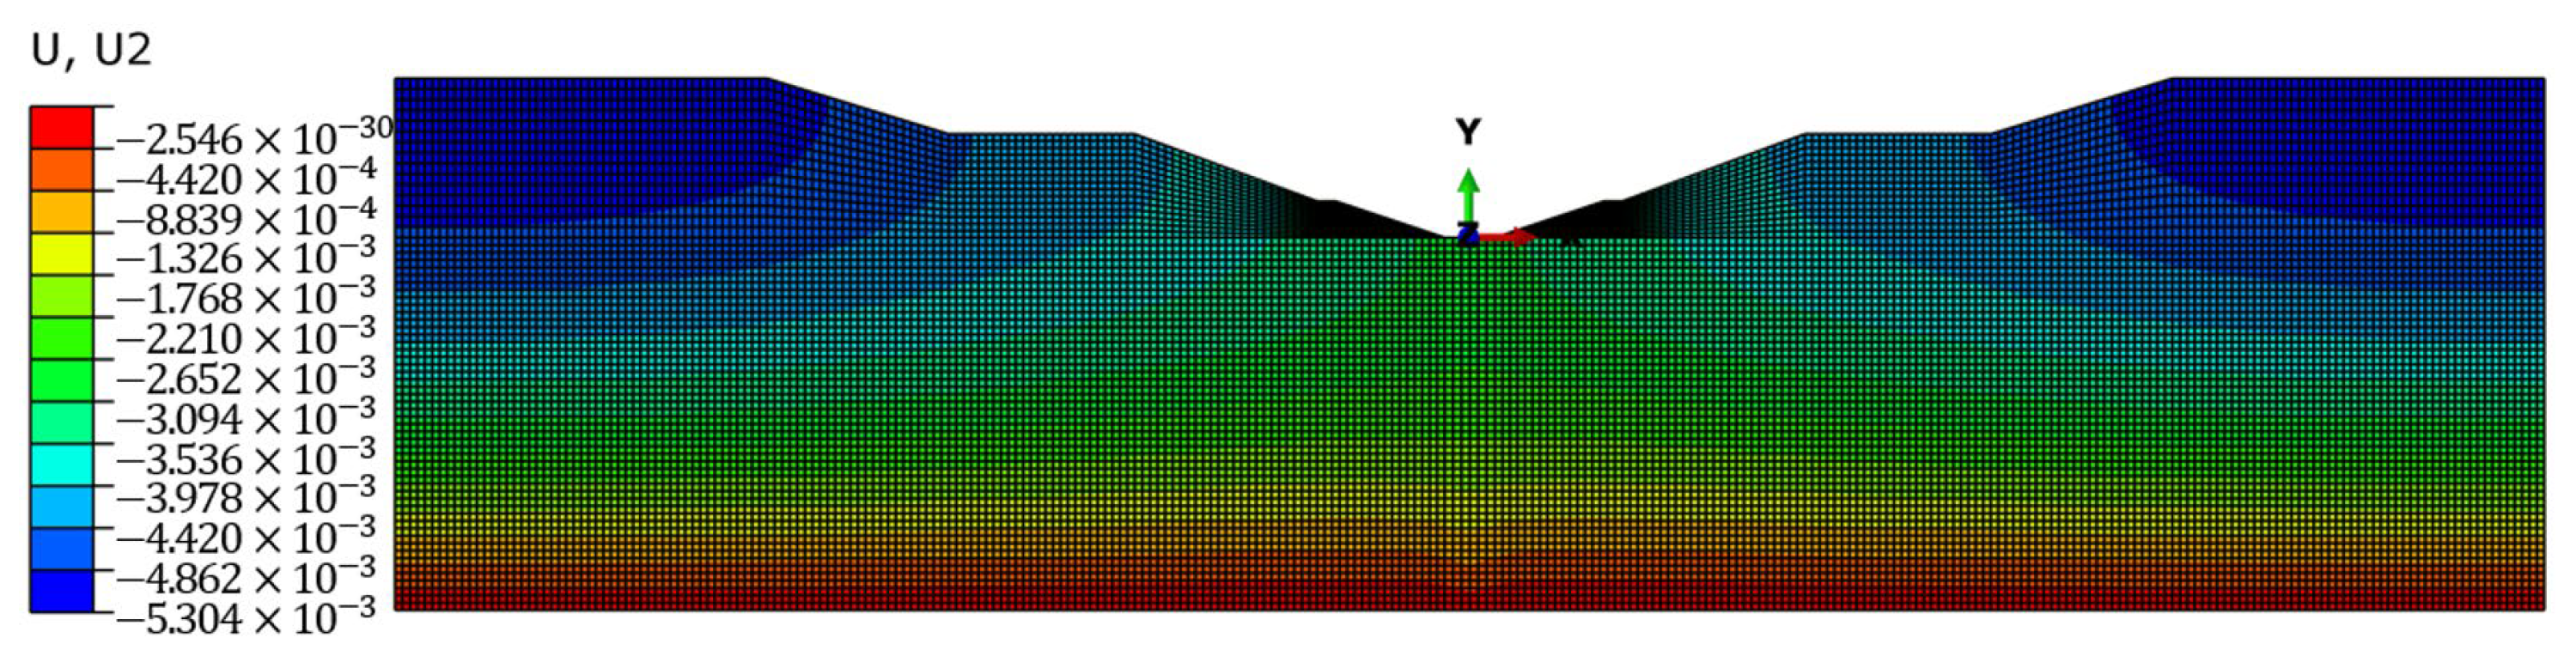
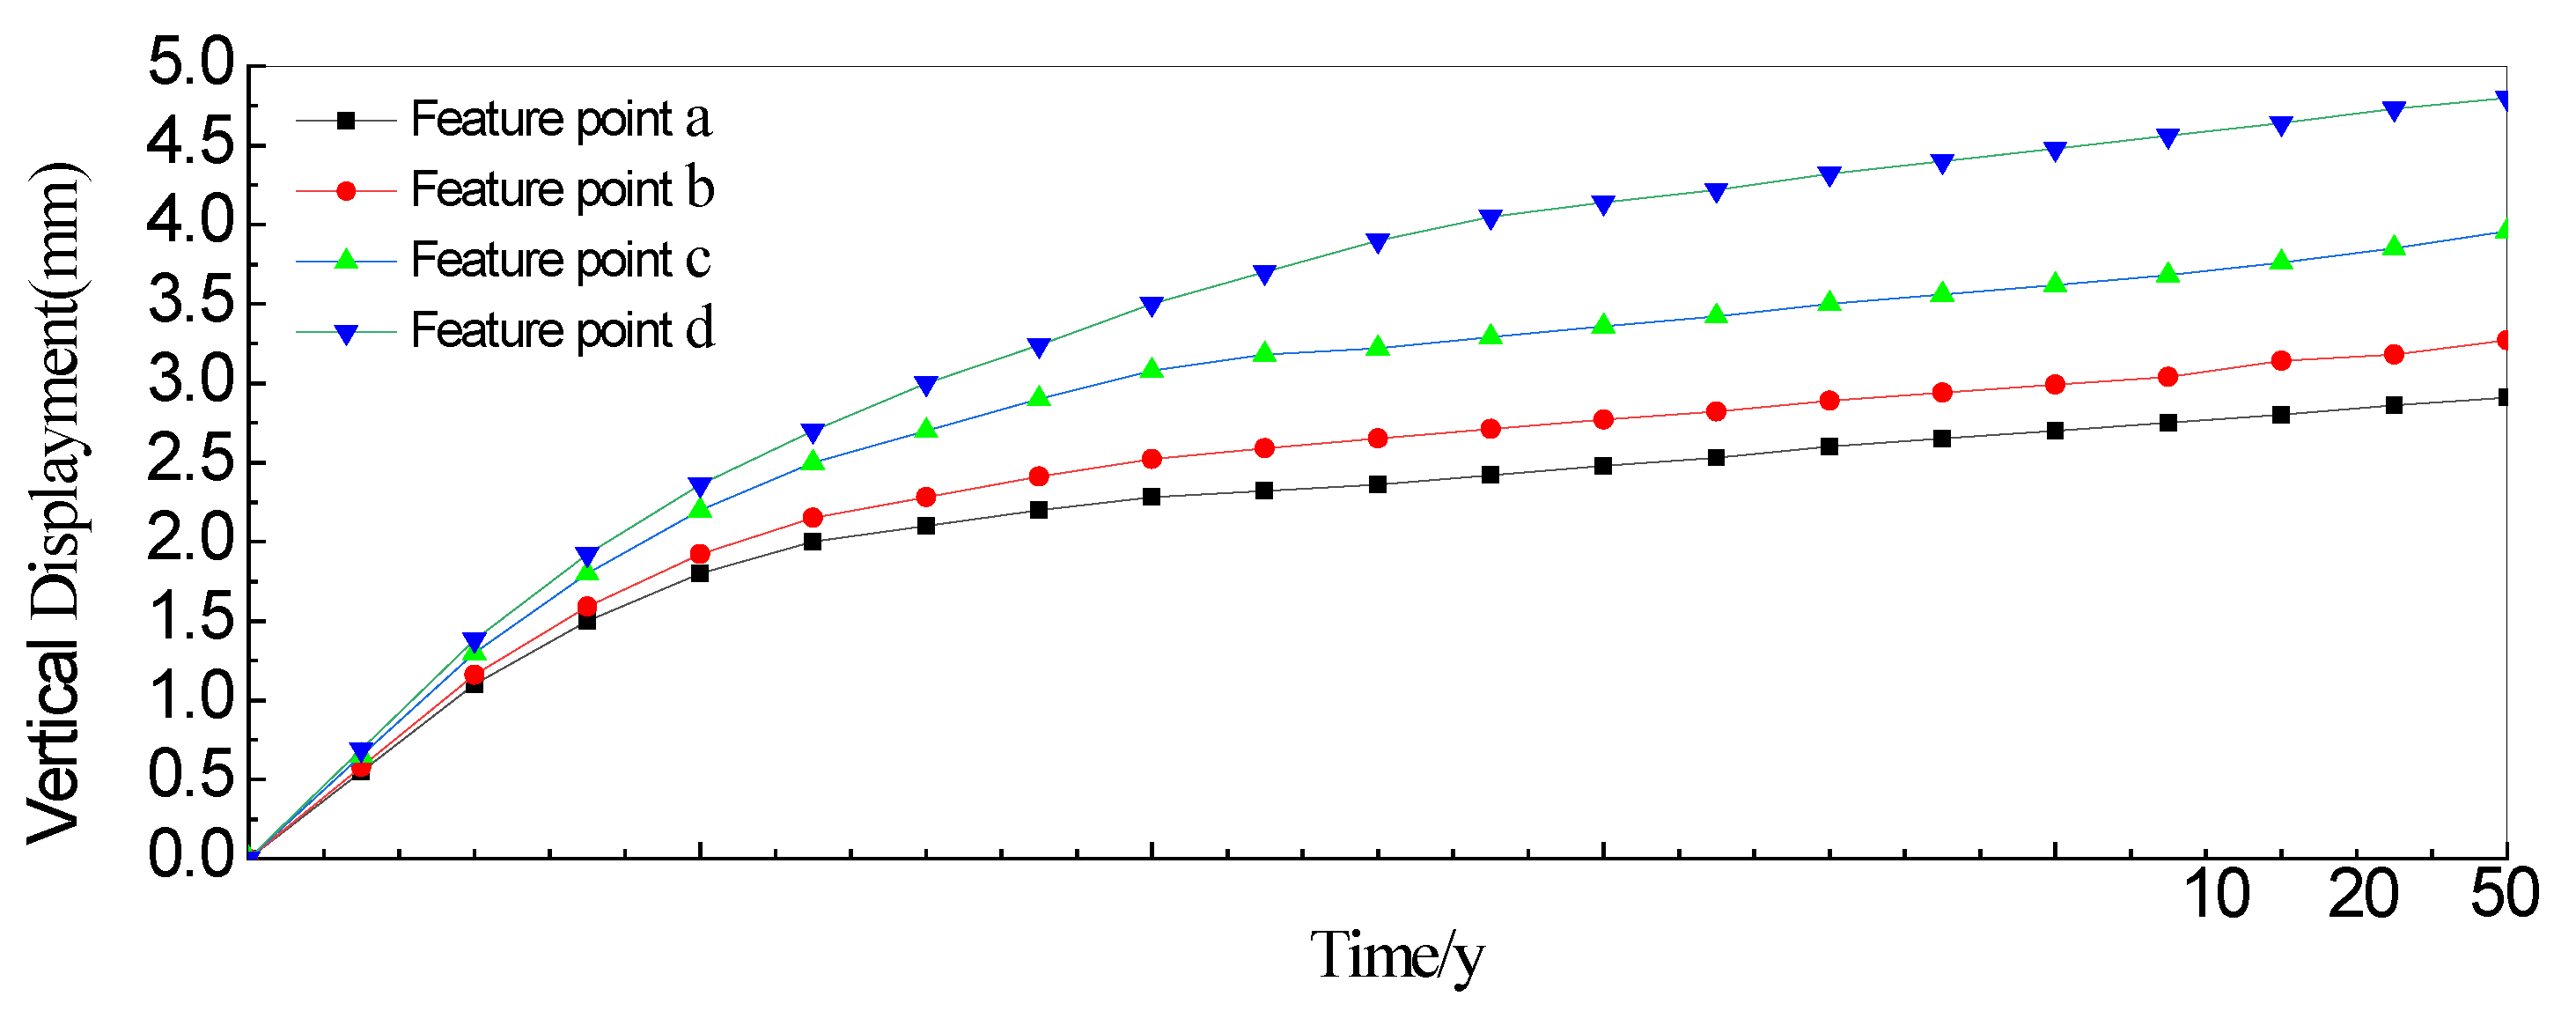
5.2. Evolution of the Canal’s Long-Term Settlements

In the calculation process, the design water level of the canal, the highest groundwater level of the slope and underground drainage measures are not applicable. The anti-seepage system is damaged, the seepage of the slope is stable, and the interior slope has no boundary flow. Based on the finite element model of the specific cross-section of the deep excavated canal, the characteristic points a, b, c, and d respectively were selected for settlement analysis at the canal bottom, embankment, slope, and top. The water level adopted the canal’s design water level, the vehicle load on the first-level bridleway adopted the car-10 level load, the crowd load was 0.3 t/m2, and the highest groundwater level was 180.218 m.
The SSD coupling method was used to compute the canal settlements after five years of operation based on the above working conditions. The nephogram of the canal’s vertical displacements after a 5-year operation is shown in Figure 12, and the settlement of each distinctive point is shown in Figure 13. The highest vertical displacement of the canal was 4.151 mm, which was within the authorized settlement range, as shown in the figures. The U2 is the vertical component of the total settlement U.
Based on the foregoing conclusions, a numerical simulation of the deep excavated canal is carried out, and a nephogram of the canal’s settling clouds after ten years of operation is obtained (see Figure 14). According to the nephogram of canal settlements, the settlement curve of each characteristic point was obtained (as shown in Figure 15). It can be seen from the figures that the maximum settlement is 5.128 mm, which represents an increase of 0.977 mm compared to the five years of operation. This change is not significant, so it is believed that the settlement has reached the final settlement. Table 1 shows the settlement rate of the canal top’s characteristic point at different times after the 10-year operation. The canal subsides at a decreasing rate after its operation. After 10 years of operation, the canal settlement rate is 0.16 mm/year. Although its absolute number is minimal and may not have much impact, the settlement continues.
The numerical simulation is repeated to investigate the deep excavated canal’s long-term settlement and deformation to get the nephogram of canal settlements after 20 years of operation, as shown in Figure 16. It is evident from the figure that the maximum settlement is very close to that calculated after 10 years of operation, indicating the deep excavated canal has reached a stable state, as shown in Figure 17. However, in actual operation, the stability of the deep excavated canal is affected by many factors such as complex water distribution conditions and varying environments, and significant settlements can occur locally. As the operating time increases, the canal’s settlement becomes smaller, not affecting its operating safety.
In this paper, the hypothetical SSD coupling method was used to predict the life and performance of the deep excavated canal in the SNWDP Xichuan Section. The numerical results showed that under normal operating conditions, the canal may only subside a little after 20 years of operation. The numerical simulation in this paper is based on the coupling of the seepage field and the stress field. It is expected that the canal operates will work stably for some time in the future.

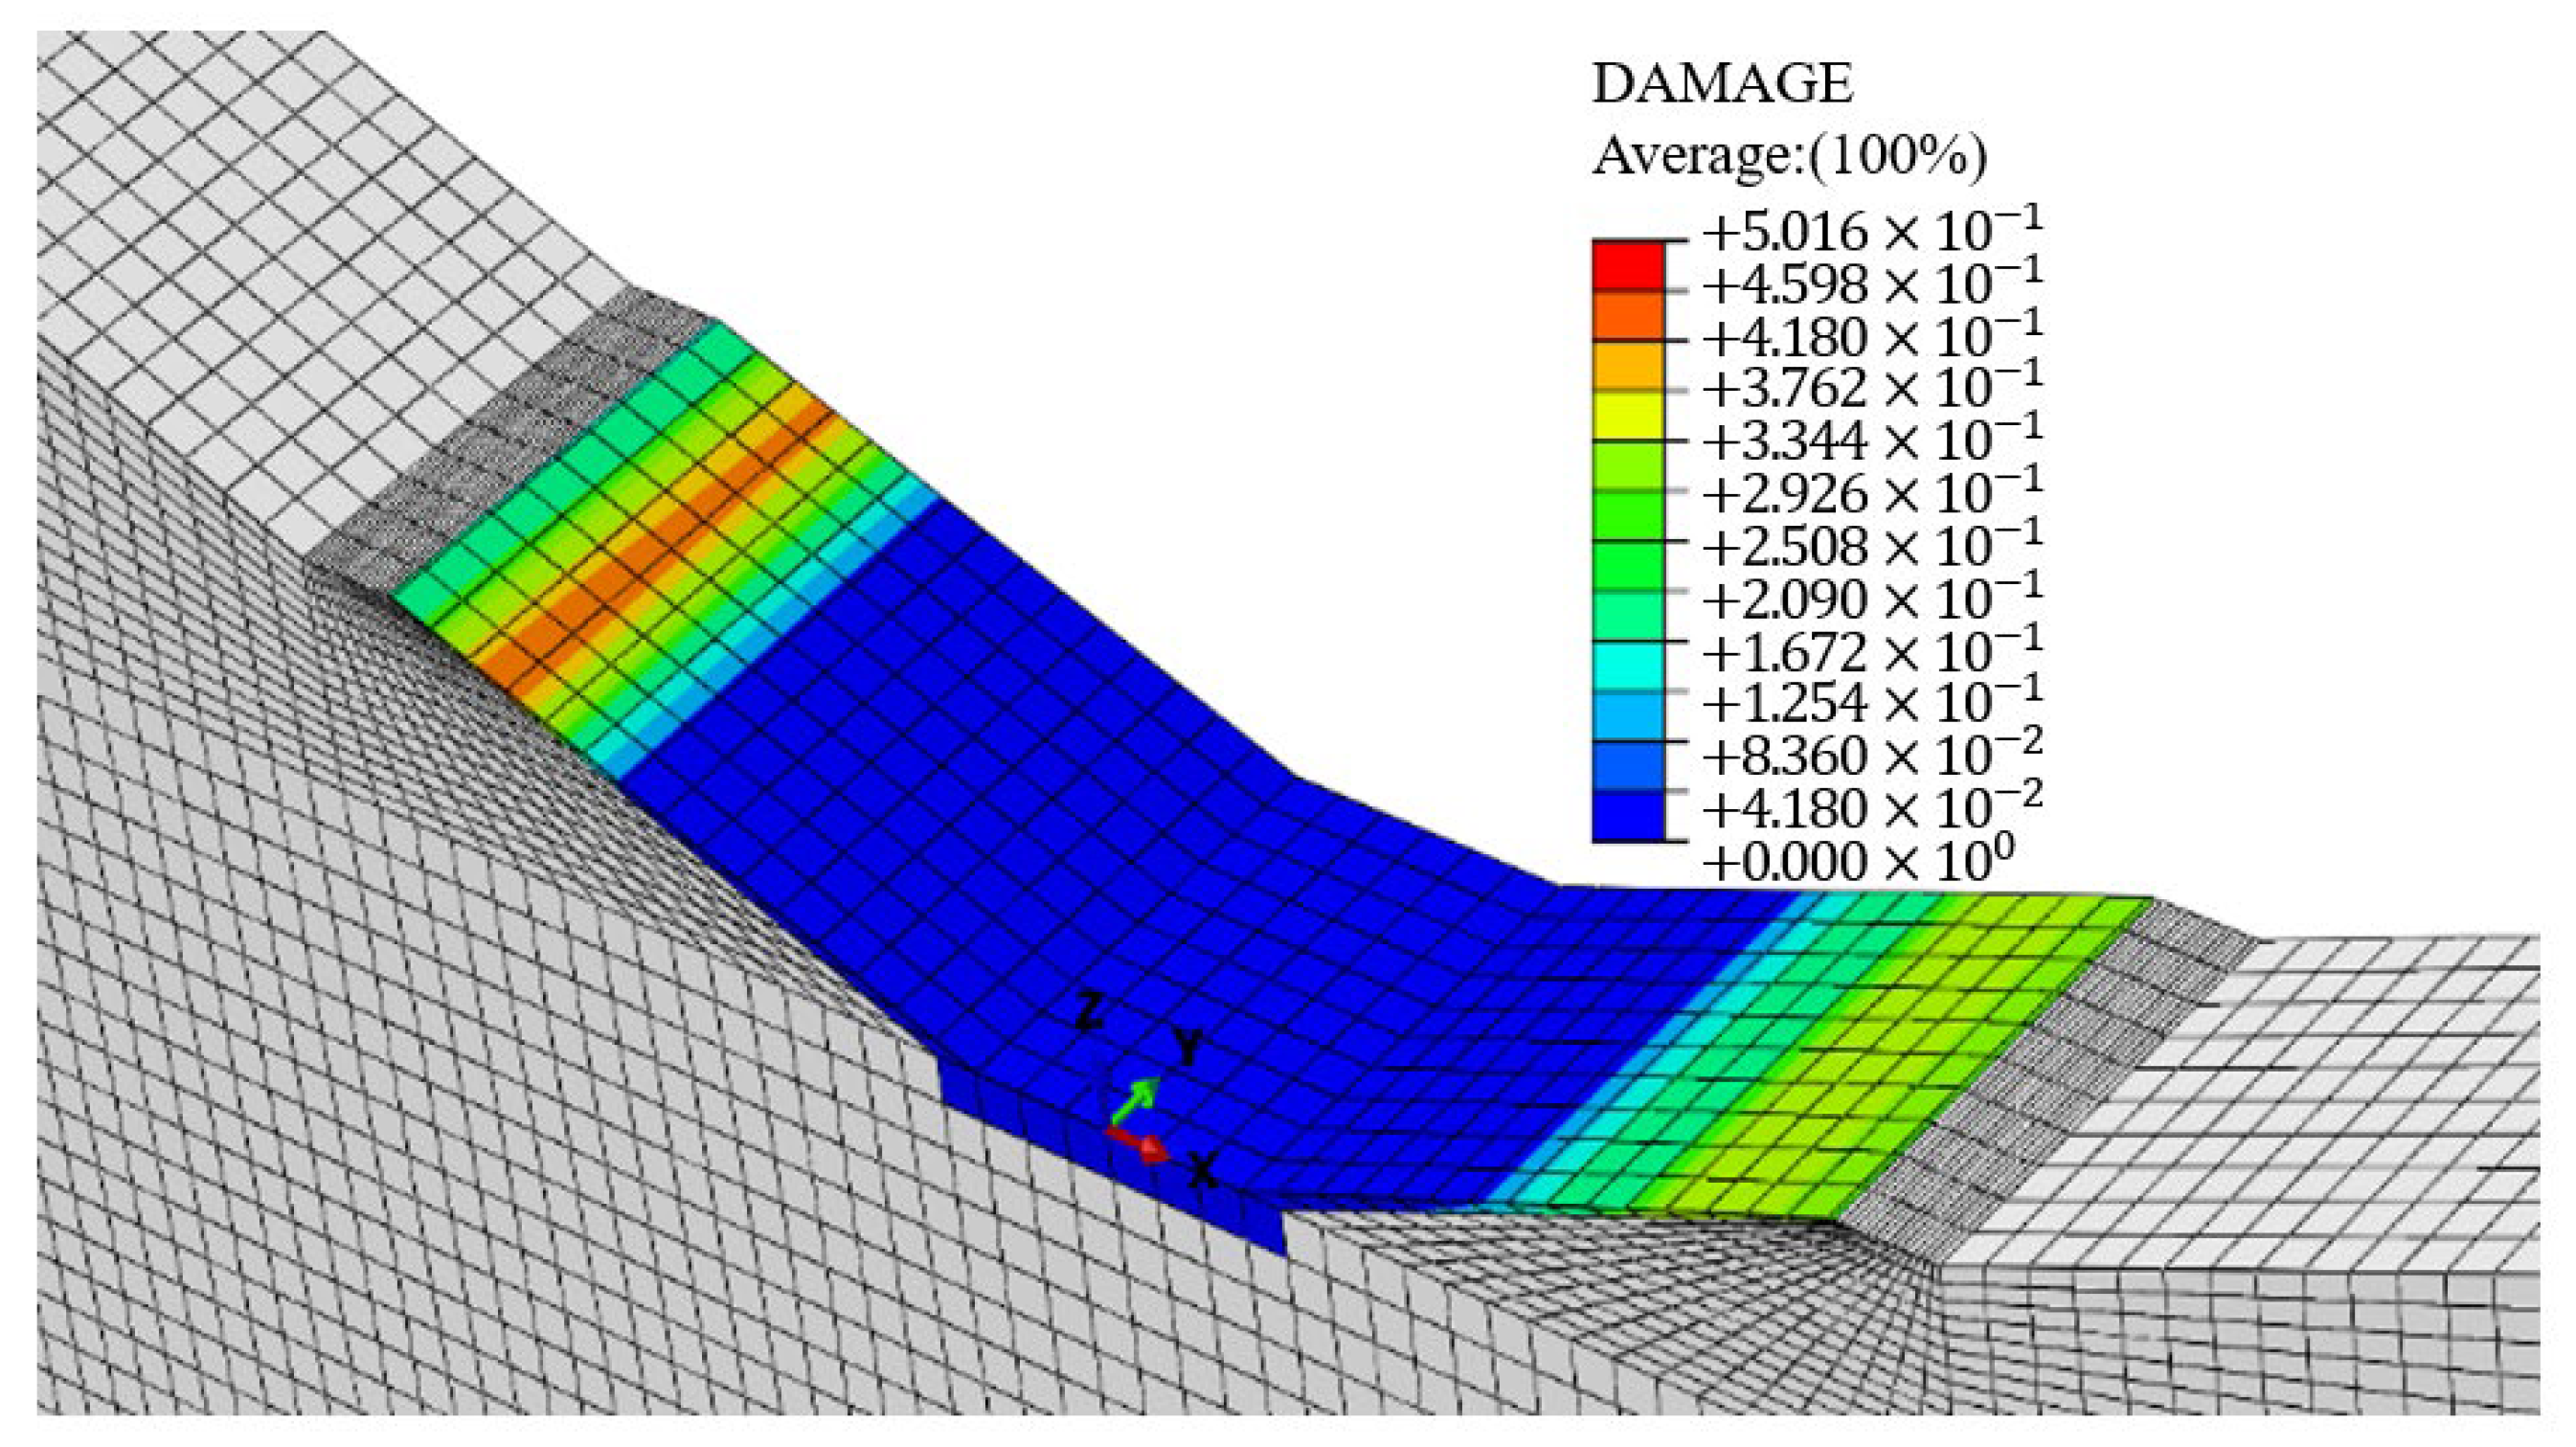
5.3. Canal Lining Damage and Crack after Long-Term Operation

A numerical simulation of the evolution of the SNWDP’s deep excavated canal after 50 years of regular operation was conducted by using the SSD coupling. The canal settlement nephogram was obtained (Figure 18). The displacement of each characteristic point is shown in Figure 19. Compared with the settlement nephogram after 20 years of operation, the settlement is insignificant and remains stable.
The seepage effect is larger in the deep excavated canal because much of the soil is saturated. As the settlement increases, both the void ratio and permeability coefficient decrease. The change in the seepage field affects the stress field and settlement at the macro level.
After 50 years of operation, the canal was discovered to be slightly damaged when investigating the evolution of its long-term behavior (Figure 20). In terms of overall damage, the maximum damage to the canal lining after the long-term operation is 37.6%. It is predicted that the deep excavated canal in the SNWDP Xichuan Section can still be used under normal operating conditions, for there is no large-area damage, except the concrete damage near the water surface. The damage first appeared near the water level of the left lining plate because the elevation of the top of the canal on the left bank was higher than that on the right bank, and the seepage–stress coupling effect was greater. The damage then occurred on the right lining plate, particularly at the point of the overflow of the water table in the canal, which was symmetrical to the point of damage on the left bank. The high level of the water table and its increasing water pressure with depth are the main causes of damage to the canal lining board. The water pressure differential between the inside and outside of the canal lining board is significant. The water pressure difference between the top and lower positions of the water surface inside the canal is minor, resulting in damage. The canal lining board is generally in a relatively safe condition, and there is no large-scale damage. Over time, the lining board may eventually be damaged in the form of uplifting after 50 years of operation, which may provide theoretical indications for the actual operation of the project. This study used the SSD coupling method to predict the service life and running status of the deep excavated canal in the SNWDP Xichuan Section under normal conditions, but it was limited to such external factors as environment, climate, and rainfall intensity [40]. More other influencing factors need to be studied further.

6. Conclusions

In this study, the SSD coupling method was adopted. The canal “lining-foundation” is considered a whole coupled system. The concrete lining’s damage and the foundation’s seepage damage were linked together, and long-term effects were introduced for numerical simulation and analysis of the canal lining structure. The conclusion is summarized as follows:
(1)
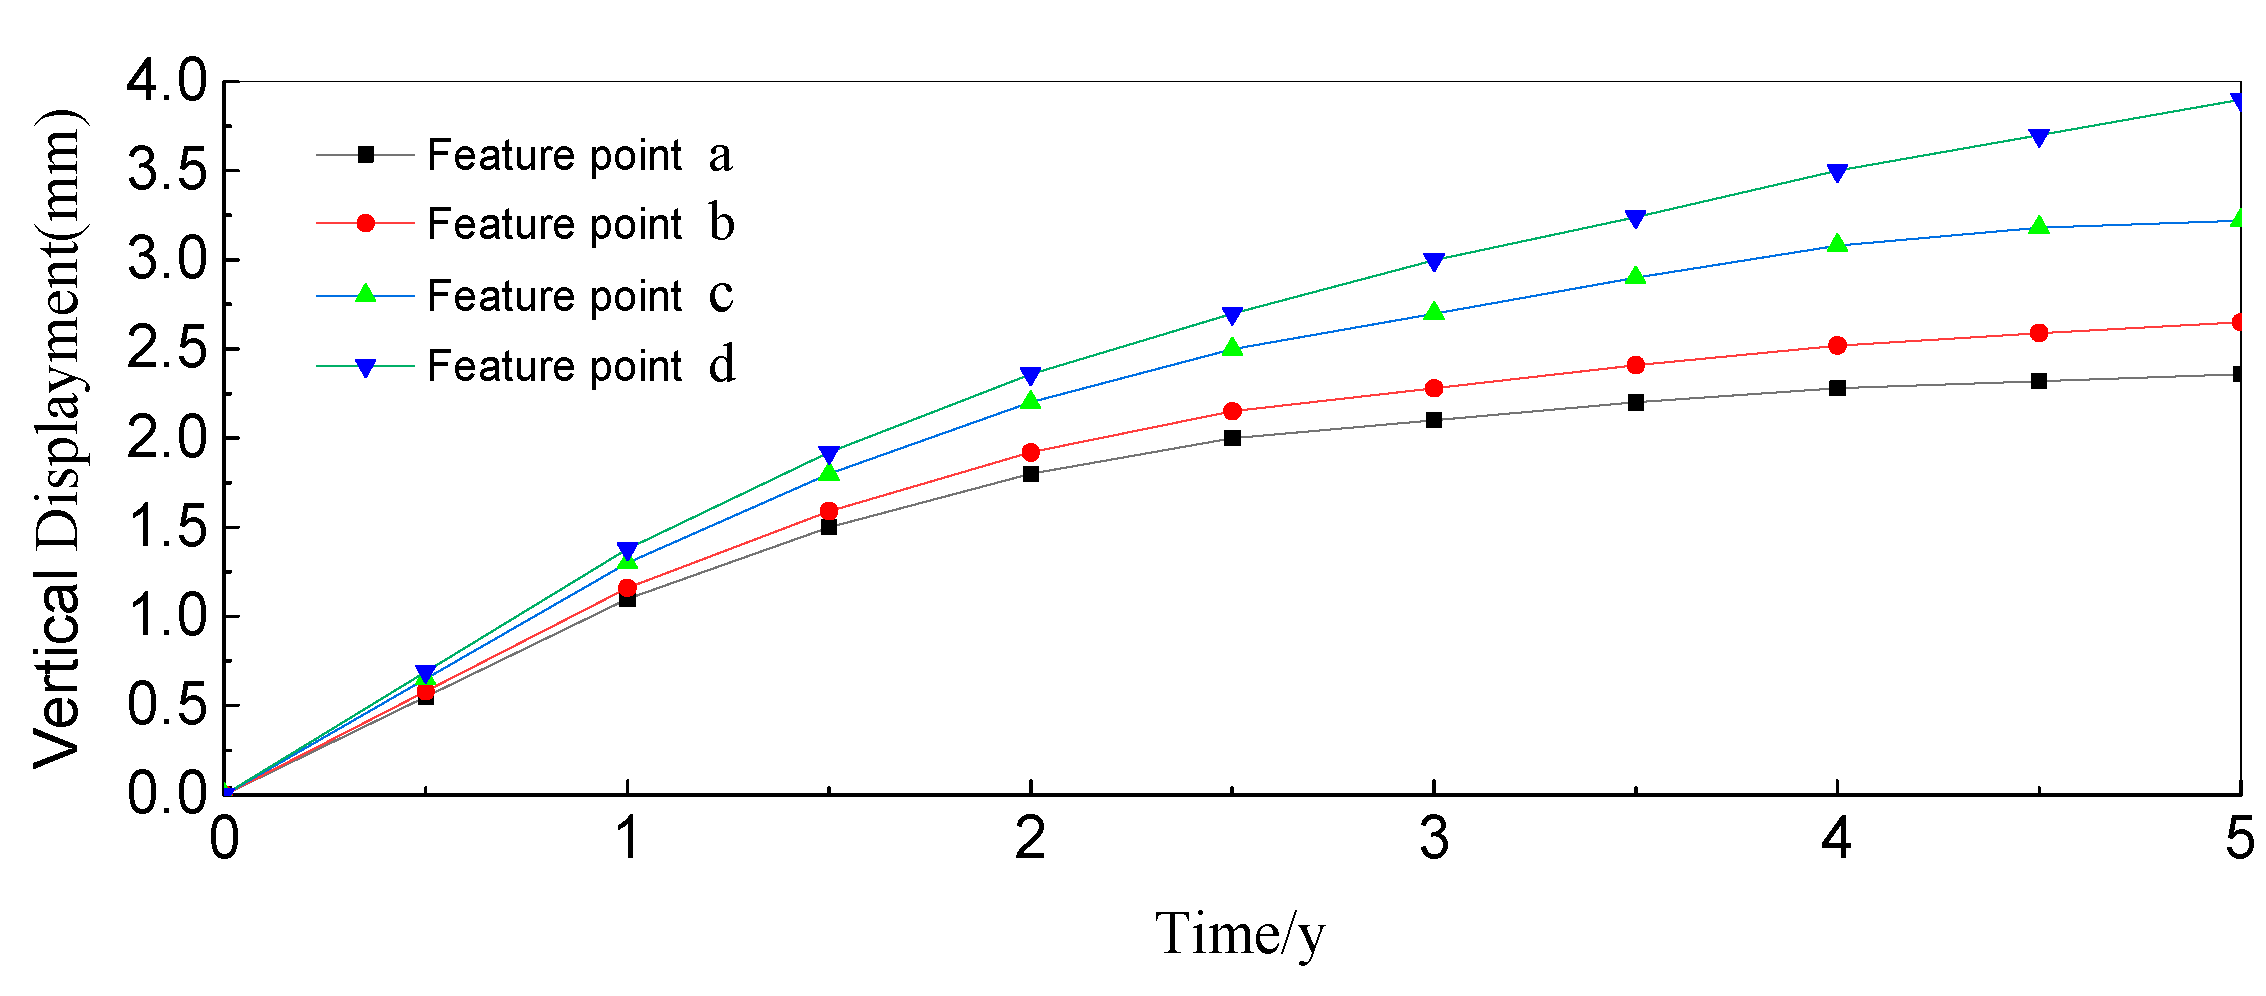
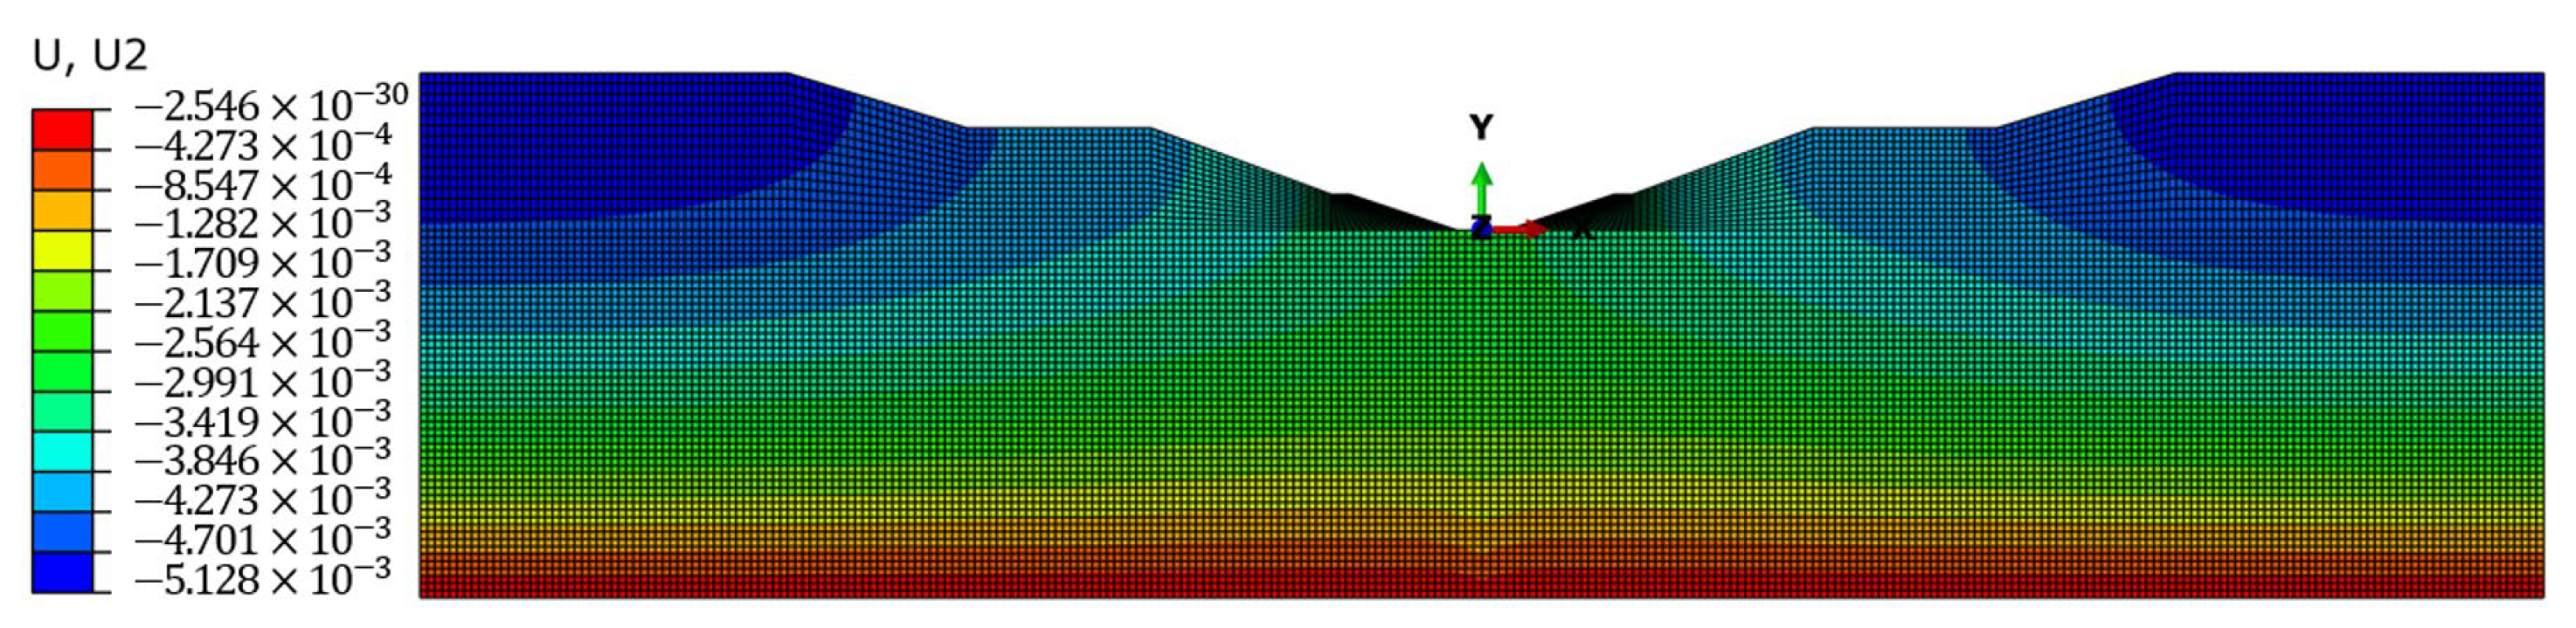
The applicability of the SSD coupling method to the SNWDP in China: The long-term settlement of the canal and the modification of the seepage field were investigated by using a constitutive coupled plastic damage model of nonlinear dynamic damage of concrete, which is used in the numerical simulation of the coupled seepage–stress model. After five years of operation through modeling, the maximum settlement of the deep excavated canal in the SNWDP Xichuan Section is 4151 mm, which is consistent with the monitoring data, thus verifying the rationality of the numerical simulation method.
(2)
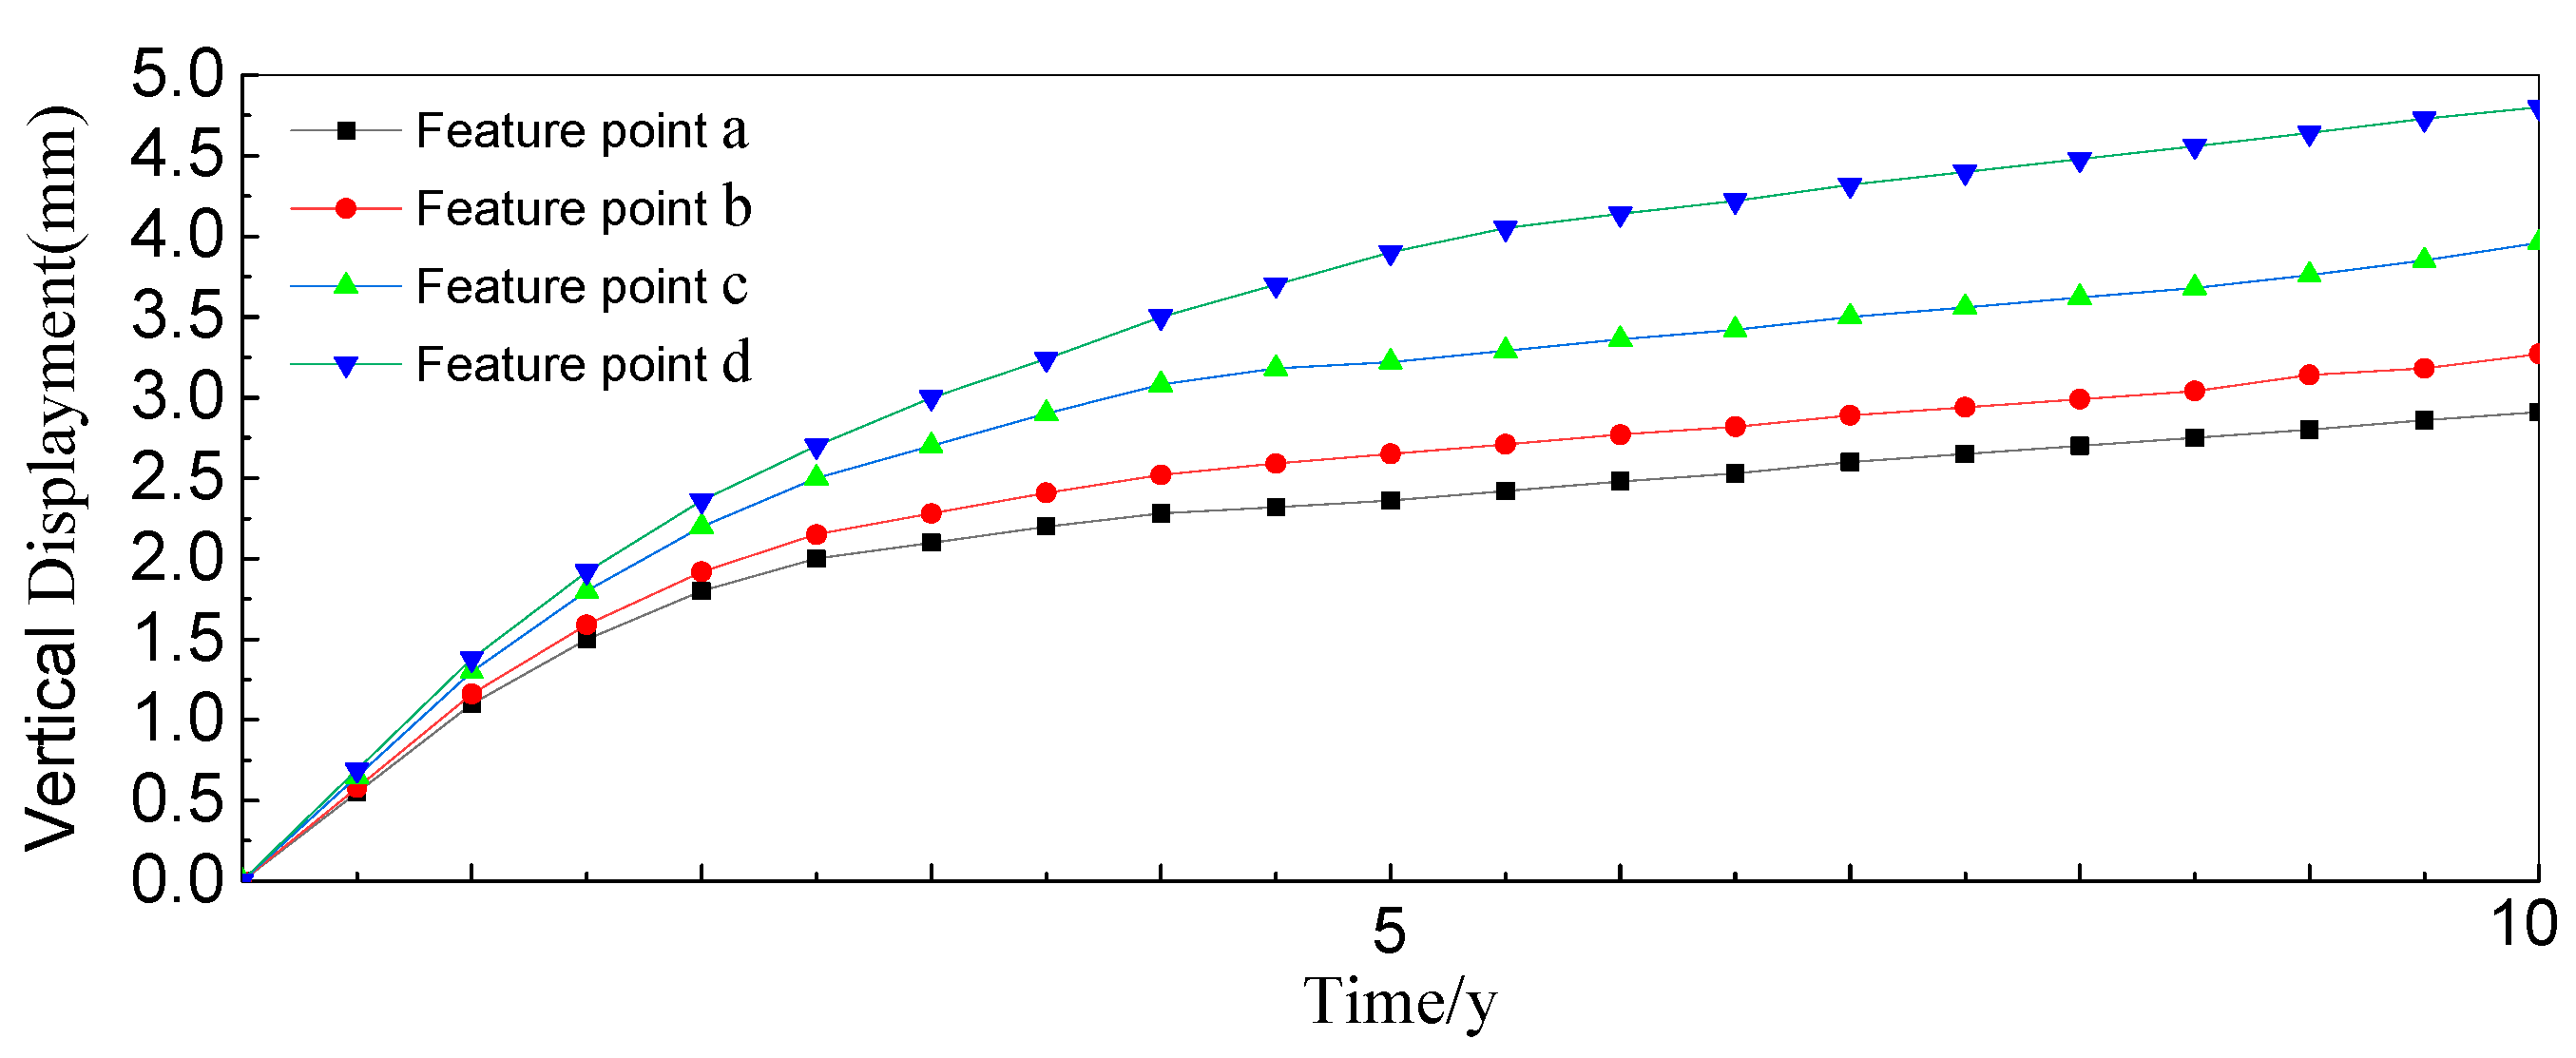
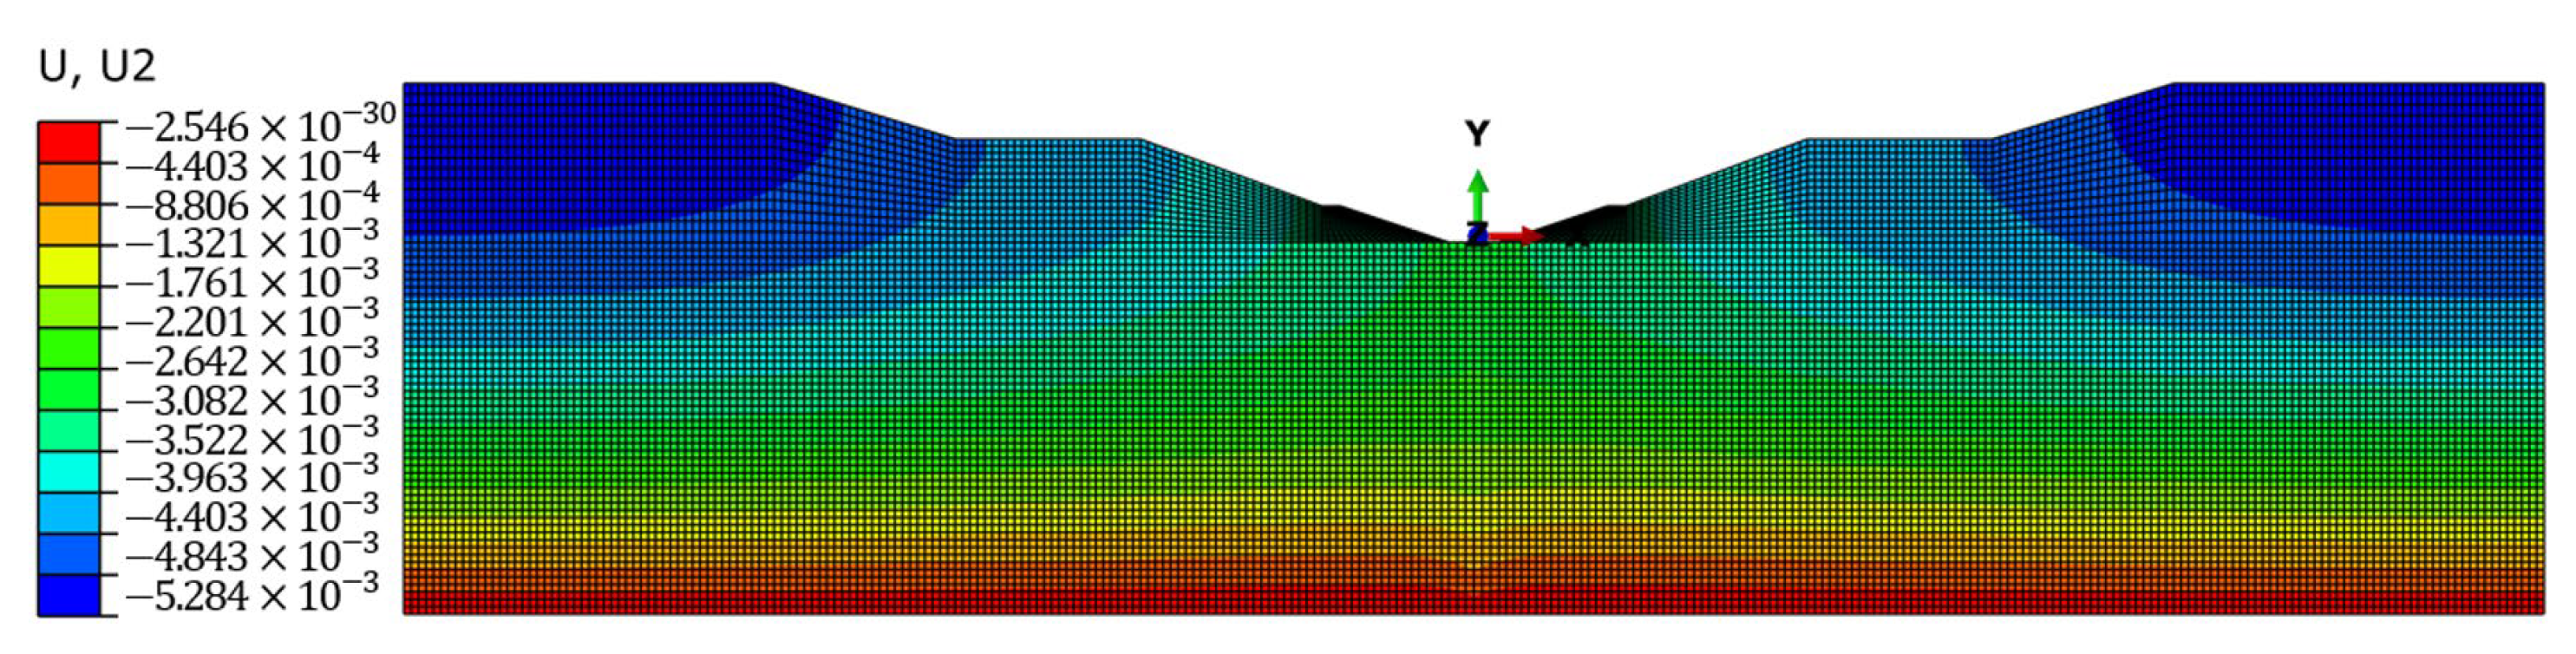
Prediction on the settlement of the canal after long-term operation: Through the numerical simulation of the settlement after 10 years of operation, it is found that the maximum settlement is 5.128 mm, and the canal settlement mainly occurred in the first two years. Numerical simulations were used to obtain the settlement nephograms after 20 and 50 years of operation. It is evident from the nephograms that the settlement finally remains the same.
(3)
The damage evolution process of the canal after long-term operation: Judging by the overall damage of the lining plates on the canal of the SNWDP, the lining plate on the left bank was damaged first, and the damage was concentrated near the water level. After a long-term operation, the lining structure of the deep excavated canal in the SNWDP Xichuan Section is still safe, and there is no apparent damage.
(4)
Causes of the damage and limitations of this study: The deep excavated canal in the SNWDP Xichuan Section is destroyed from the water surface, mainly due to the seepage of the high underground water. The damage spreads gradually from the local area, eventually leading to failure of the concrete lining plate. However, this study was limited by the environment, climate, and rainfall intensity. Therefore, more other influencing factors need to be studied further.

Author Contributions

Conceptualization, X.X. and W.X.; methodology, C.X.; software, C.X.; validation, W.X. and C.X.; formal analysis, W.X.; investigation, W.X.; resources, X.X.; data curation, X.X.; writing—original draft preparation, W.X.; writing—review and editing, W.X. and M.Y.A.K.; visualization, W.X.; supervision, X.X.; project administration, X.X.; funding acquisition, X.X. All authors have read and agreed to the published version of the manuscript.

Funding

This study was supported by the National Key Research and Development Program of China (Grant No. 2018YFC0406901), the National Natural Science Foundation of China (Grant No. 51979109), Henan Science and Technology Innovation Talent Program (Grant No. 174200510020), and Henan Province University Science and Technology Innovation Team Support Plan (Grant No. 19IRTSTHN030). These supports are gratefully acknowledged and greatly appreciated.

Institutional Review Board Statement

Not applicable.

Informed Consent Statement

Not applicable.

Data Availability Statement

Not applicable.

Conflicts of Interest

The authors declare no conflict of interest.

References

  1. Kumar, A.; Taxak, A.K.; Mishra, S.; Pandey, R. Long term trend analysis and suitability of water quality of River Ganga at Himalayan hills of Uttarakhand, India. Environ. Technol. Innov. 2021, 22, 101405. [Google Scholar] [CrossRef]
  2. Cui, H.D.; Zhang, J.F.; Zhang, W.; Wang, J.L. Numerical analysis of seepage field in typical confined water strata in the middle route of the South-to-North Water Diversion Project. Rock Soil Mech. 2010, 31, 447–451. [Google Scholar]
  3. Kumar, A.; Cabral-Pinto, M.; Kumar, A.; Kumar, M.; Dinis, P.A. Estimation of Risk to the Eco-Environment and Human Health of Using Heavy Metals in the Uttarakhand Himalaya, India. Appl. Sci. 2020, 10, 7078. [Google Scholar] [CrossRef]
  4. Cai, Y.F.; Qi, C.M. Slope Stability under Seepage-stress Coupling and Rainfall Infiltration. J. Univ. South China (Sci. Technol.) 2019, 33, 33–39. [Google Scholar]
  5. Pan, Y.L.; Jian, W.X.; Li, L.J.; Lin, Y.Q.; Tian, P.F. A study on the Rainfall Infiltration of Granite Residual Soil Slope with An Improved Green-Ampt model. Rock Soil Mech. 2020, 41, 1–8. [Google Scholar]
  6. Zhou, Z.; Zhang, J.M.; Ning, F.L.; Luo, Y.; Wang, J.L. Temporal and Spatial Characteristics of Moisture Migration and Instability Mechanism of Cracked Soil Slope under Rainfall Infiltration. J. Traffic Transp. Eng. 2020, 8, 1–8. [Google Scholar]
  7. Huang, F.; Luo, X.; Liu, W. Stability Analysis of Hydrodynamic Pressure Landslides with Different Permeability Coefficients Affected by Reservoir Water Level Fluctuations and Rainstorms. Water 2017, 9, 450. [Google Scholar] [CrossRef] [Green Version]
  8. Kim, J.; Han, H.; Jin, Y. Analysis of Pore Water Pressure and Piping of Hydraulic Well. Water 2021, 13, 502. [Google Scholar] [CrossRef]
  9. Luo, B.; Sun, Y.; Xu, Z.; Chen, G.; Zhang, L.; Lu, W.; Zhao, X.; Yuan, K. Damage Characteristics and Mechanism of the 2017 Groundwater Inrush Accident That Occurred at Dongyu Coalmine in Taiyuan, Shanxi, China. Water 2021, 13, 368. [Google Scholar] [CrossRef]
  10. Zhao, E.; Jiang, Y. Seepage Evolution Model of the Fractured Rock Mass under High Seepage Pressure in Dam Foundation. Adv. Civ. Eng. 2021, 2021, 8832774. [Google Scholar] [CrossRef]
  11. Nian, G.Q.; Chen, Z.H.; Zhang, L.F.; Bao, M. Treatment of Two Boundary Conditions for Rainfall Infiltration in Slope and Its Application. Rock Soil Mech. 2020, 12, 1–11. [Google Scholar]
  12. Wang, K.; Wang, L.; Ren, B.; Fan, H. Study on Seepage Simulation of High Pressure Grouting in Microfractured Rock Mass. Geofluids 2021, 2021, 6696882. [Google Scholar] [CrossRef]
  13. Ma, Z.T.; Cui, Y.Q.; Lu, K.Y.; Song, D.F.; Yang, Y.C. Study on Fracture and Permeability Characteristics of Unloading Rock with High Water Pressure. Math. Probl. Eng. 2021, 2021, 6685405. [Google Scholar] [CrossRef]
  14. Ma, Z.; Zhu, C.; Yao, X.; Dang, F. Slope Stability Analysis under Complex Stress State with Saturated and Unsaturated Seepage Flow. Geofluids 2021, 2021, 6637098. [Google Scholar] [CrossRef]
  15. Liu, Z.J.; Huang, Y.; Zhou, D.; Ge, H. Analysis of External Water Pressure for a Tunnel in Fractured Rocks. Geofluids 2017, 2017, 8618613. [Google Scholar] [CrossRef]
  16. Xiao, X.L. Analysis of Slope Stability on Account of Fluid-Structure Coupling Seepage Effect. Ph.D. Thesis, Huazhong University of Science and Technology, Wuhan, China, 2011. [Google Scholar]
  17. Chen, L.G. The Slope Stability Analysis of Taking into Account the Seepage and Stress Coupling Effect Based on ABAQUS. Ph.D. Thesis, Zhengzhou University, Zhengzhou, China, 1 May 2010. [Google Scholar]
  18. Cai, F.; Ugai, K. Numerical Analysis of Rainfall Effects on Slope Stability. Int. J. Geomech. 2004, 4, 69–78. [Google Scholar] [CrossRef]
  19. Rahardjo, H.; Ong, T.H.; Rezaur, R.B.; Leong, E.C. Factors Controlling Instability of Homogeneous Soil Slopes under Rainfall. J. Geotech. Geoenviron. Eng. 2007, 133, 1532–1543. [Google Scholar] [CrossRef]
  20. Baum, R.L.; Godt, J.W.; Savage, W.Z. Estimating the timing and location of shallow rainfall-induced landslides using a model for transient, unsaturated infiltration. J. Geophys. Res. Earth Surf. 2010, 115, 26. [Google Scholar] [CrossRef]
  21. Rahardjo, H.; Nio, A.S.; Leong, E.C.; Song, N.Y. Effects of Groundwater Table Position and Soil Properties on Stability of Slope during Rainfall. J. Geotech. Geoenviron. Eng. 2010, 136, 1555–1564. [Google Scholar] [CrossRef]
  22. Muntohar, A.S.; Liao, H.J. Rainfall infiltration: Infinite slope model for landslides triggering by rainstorm. Nat. Hazards 2010, 54, 967–984. [Google Scholar] [CrossRef]
  23. Tsai, T.L.; Chen, H.F. Effects of degree of saturation on shallow landslides triggered by rainfall. Environ. Earth Sci. 2010, 59, 1285–1295. [Google Scholar] [CrossRef]
  24. Borja, R.I.; White, J.A. Continuum deformation and stability analyses of a steep hillside slope under rainfall infiltration. Acta Geotech. 2010, 5, 1–14. [Google Scholar] [CrossRef]
  25. Zhou, Y.F. Study on Seepage-stress-damage/crack Coupling Theory and Method for Hydraulic Tunnel. Ph.D. Thesis, Wuhan University, Wuhan, China, 1 May 2015. [Google Scholar]
  26. Li, Z.; Kai, S.; Yafen, Z. Hydro-mechanical Coupling Analysis of Pervious Lining in High Pressure Hydraulic Tunnel. J. Hydraul. Eng. 2018, 49, 313–322. [Google Scholar]
  27. Sheng, J.L.; Ye, J. Slope Stability of Foundation Pit Considering the Seepage-stress Coupling Action. J. Wuhan Univ. Sci. Technol. 2015, 38, 391–395. [Google Scholar]
  28. Xu, B.; Chen, B.; Huang, H.; Qi, Y.; Xinhua, X.; Xu, H. Underground water migration studies based on the damage variable coupling with seepage and rock stress. J. Food Agri. Environ. 2013, 11, 786–790. [Google Scholar]
  29. Zhu, H.Y.; Jin, X.C.; Guo, J.C.; An, F.C.; Wang, Y.H.; Lai, X.D. Coupled flow, stress and damage modelling of interactions between hydraulic fractures and natural fractures in shale gas reservoirs. Int. J. Oil Gas Coal Technol. 2016, 13, 359–390. [Google Scholar] [CrossRef]
  30. Kumar, A.; Sharma, M.P.; Taxak, A.K. Analysis of water environment changing trend in Bhagirathi tributary of Ganges in India. Desalin Water Treat 2017, 63, 55–62. [Google Scholar] [CrossRef]
  31. Chen, H.F. Constitutive Equation of Concrete and Soil [M]; China Construction Industry Press: Beijing, China, 2004; p. 258. [Google Scholar]
  32. Kumar, A.; Mishra, S.; Taxak, A.; Pandey, R.; Yu, Z.-G. Nature rejuvenation: Long-term (1989–2016) vs. short-term memory approach based appraisal of water quality of the upper part of Ganga River, India. Environ. Technol. Innov. 2020, 20, 101164. [Google Scholar] [CrossRef]
  33. Wu, M.X. Finite-element algorithm for Richards’ equation for saturated-unsaturated seepage flow. J. Hydraul. Eng. 2009, 40, 1274–1279. [Google Scholar]
  34. Ji, Y.J.; Liu, J.J.; Cheng, L.S. Numerical simulation of tunnel excavation considering fluid-solid coupling. Rock Soil Mech. 2011, 32, 1229–1233. [Google Scholar]
  35. Kang, B.; Ming, X. Seepage-damage-stress coupling analysis of hydraulic tunnel lining during hydraulic fracturing. Chin. J. Rock Mech. Eng. 2010, 29, 3769–3776. [Google Scholar]
  36. Lubliner, J.; Oliver, J.; Oller, S.; Onate, E. A plastic-damage model for concrete. Int. J. Solids Struct. 1989, 25, 299–326. [Google Scholar] [CrossRef]
  37. Jia, S.P.; Chen, W.Z.; Yu, H.D. Study on the fully coupled damage model of seepage field and stress field during mudstone tunnel construction. Rock Soil Mech. 2009, 30, 19–26. [Google Scholar]
  38. Lee, J.; Fenves, G.L. Plastic damage model for cyclic loading of concrete structure. J. Eng. Mech. 1998, 124, 892–900. [Google Scholar] [CrossRef]
  39. Fei, K.; Zhang, J.W. Application of ABAQUS in Geotechnical Engineering [M]; China Water Conservancy and Hydropower Press: Beijing, China, 2010; p. 222. [Google Scholar]
  40. Hu, J.; Zhang, J.K.; Yu, M.X.; Ma, F.H.; Xiao, W.S. Analysis and prediction of slope deformation characteristics of deep-excavated expansive soil channel. Hydro-Sci. Eng. 2021, 4, 1–9. [Google Scholar]
Figure 1. Stress–strain relation under the uniaxial alternating load.
Applsci 11 11413 g001
Figure 2. Flowchart of seepage/stress-damage coupling analysis.
Applsci 11 11413 g002
Figure 3. Three-dimensional finite element model of a typical section of the deep excavated canal.
Applsci 11 11413 g003
Figure 4. Finite element model of a typical section of the deep excavated canal.
Applsci 11 11413 g004
Figure 5. Canal seepage system.
Applsci 11 11413 g005
Figure 6. Canal of the South-to-North Water Diversion Project and settlement monitoring points. (a) A section of the South-to-North Water Diversion Project, (b) Settlement monitoring points protection box, (c) Settlement monitoring points.
Applsci 11 11413 g006
Figure 7. Correlation curve between the estimated settlement and the monitored settlement of the monitoring points.
Applsci 11 11413 g007
Figure 8. Canal saturation contour when t = 10 years.
Applsci 11 11413 g008
Figure 9. Canal saturation contour when t = 20 years.
Applsci 11 11413 g009
Figure 10. Canal pore pressure contour when t = 10 years.
Applsci 11 11413 g010
Figure 11. Canal pore pressure contour when t = 20 years.
Applsci 11 11413 g011
Figure 12. Canal settlement nephogram when t = 5 years.
Applsci 11 11413 g012
Figure 13. Settlements of each characteristic point when t = 5 years.
Applsci 11 11413 g013
Figure 14. Canal settlement nephogram when t = 10 years.
Applsci 11 11413 g014
Figure 15. Settlement of each characteristic point when t = 10 years.
Applsci 11 11413 g015
Figure 16. Canal settlement nephogram when t = 20 years.
Applsci 11 11413 g016
Figure 17. Settlement of each characteristic point when t = 20 years.
Applsci 11 11413 g017
Figure 18. Canal settlement nephogram when t = 50 years.
Applsci 11 11413 g018
Figure 19. Settlement of each characteristic point when t = 50 years.
Applsci 11 11413 g019
Figure 20. Damage-distribution cloud diagram after 50 years.
Applsci 11 11413 g020
Table 1. Canal top’s settlement rate.
Time/Year12345
Rate (mm/year)1.380.980.640.50.4
Time/year678910
Rate (mm/year)0.240.180.170.1650.16
Publisher’s Note: MDPI stays neutral with regard to jurisdictional claims in published maps and institutional affiliations.

