Article

Organic Matter and Pigments in the Wall Paintings of Me-Taw-Ya Temple in Bagan Valley, Myanmar

1
Department of Pure and Applied Sciences, University of Urbino, 61029 Urbino, Italy
2
Diagnostic Laboratory for Cultural Heritage, 06049 Spoleto, Italy
3
Department of Chemistry, Life Sciences and Environmental Sustainability, University of Parma, 43121 Parma, Italy
4
Department of Objects Conservation and Archaeometry, Art University of Isfahan, Isfahan 81758-94418, Iran
5
Department of Physics and Earth Sciences, University of Ferrara, 44122 Ferrara, Italy
6
Myanmar Department of Archaeology (DoA), Bagan, Nyaung Oo 05232, Myanmar
7
Tokyo National Research Institute for Cultural Properties, Tokyo 110-8713, Japan
*
Author to whom correspondence should be addressed.
Submission received: 25 October 2021 / Revised: 16 November 2021 / Accepted: 21 November 2021 / Published: 2 December 2021
(This article belongs to the Special Issue Organic Materials in the Wall Paintings)

Abstract

:

Featured Application

The results derived from this research paper contributes to the body of knowledge available from Bagan painting materials and techniques and also to a treatment proposal for the conservation and restoration of Bagan’s temples.

Abstract

Pagán is an ancient city located in Myanmar that is renowned for the remains of about 4000 pagodas, stupas, temples and monasteries dating from the 11th to 13th centuries. Due to a magnitude 6.8 earthquake in 2016, more than 300 ancient buildings were seriously damaged. As a part of the post-earthquake emergency program, a diagnostic pilot project was carried out on Me-taw-ya temple wall paintings to acquire further information on the materials and on their state of conservation. This article presents our attempts at characterising the painting materials at Me-taw-ya temple using non-invasive portable energy dispersive X-ray fluorescence (ED-XRF), portable Raman spectroscopy and micro-invasive attenuated total reflectance—Fourier transform infrared spectroscopy (ATR-FTIR), micro-Raman spectroscopy (µ-Raman), gas chromatography-mass spectrometry (GC-MS), polarized light microscopy (PLM) and environmental scanning electron microscope—X-ray energy dispersive system (ESEM-EDS) investigations with the aim of identifying the composition of organic binders and pigments. The presence of a proteinaceous glue mixed with the lime-based plaster was ascertained and identified by GC-MS. In addition, this technique confirmed the occurrence of plant-derived gums as binders pointing to the a secco technique. Fe-based compounds, vermillion, carbon black and As-compounds were identified to have been incorporated in the palette of the murals.

1. Historical and Technical Background

The ancient city of Bagan (formerly called Pagán) is located in the Myanmar Mandalay Region of Burma. Between 1044 and 1287 AD, Pagán became the capital of the Pagán empire and grew into the political, economic and cultural nerve centre of the region. During the kingdom, along with the diffusion of Buddhism, a large number of religious buildings were built under the patronage of kings, nobles, and dignitaries and of large sections of civil society, as attested by commemorative inscriptions [1].
The remains of about 10,000 pagodas, stupas, temples and monasteries still stand today on the Bagan plains (Figure 1a), which cover an area of 104 square kilometres, outlining the landscape of this unique site [2].
The temple is the most common architectural type in Pagán that become an autonomous structure with respect to the monastery since the 11th century. Characterised by a central plan, and longitudinal or cruciform in design [1], most temples are built with fired bricks joined with mortar, while whitish stuccoes partially covered their facades [3]. Interior walls and vaults are decorated with wall paintings, many of which dated from the 11th to the 13th century. These wall paintings are characterised by vivid colours and black, brown or red outline drawings. A figurative repertoire is generally taken from the former lives of the Buddha; decorative friezes with plant motifs and geometric patterns were also largely used.
Plaster’s constitutive materials range depending on the chronology: mud, lime, sand with glue and jaggery (plant-derived sugar) were used in an earlier period (11th–12th century) while sand and lime were more commonly utilised in the later periods (from the 13th to 16th century) [4,5]. The plasters were composed of one or more layers and usually, a thin primer of slaked lime was applied [6,7]. Carbon black or red ochre was sometimes used for the preparatory drawings [8,9].
Pagán wall paintings were generally executed with a secco technique and coated with a protective varnish made out of gums or resins. Natural gums including acacia [7] or Neem tree gums [6,10] were usually used as binders. Materials and executive techniques employed over the centuries in Pagán has been introduced to Burma from India, evolving in a different expression and style [10]. Indeed, the knowledge of the Indian technique of wall painting is useful to understand the painting technique in Central Asia. As a binding medium, beeswax and glue were used in the Buddhist wall paintings dating from the 2nd to the 7th century. Glues are produced by vegetable materials (gums, pulps and saps of different plants and trees) or using animal derivatives (gelatine produced by boiling buffalo skins) [4].
The earliest reference to the use of colours and pigments, such as vermilion, red lakes, and natural ochre can be traced to the Sawhlawun inscription datable to Sakaraj-598 (1236 AD) [6]. Orpiment, carbon and bone black have been detected thanks to previous investigations [8,11]. Blue and green pigments are rare in wall paintings from the first period; greenish tones are usually obtained by mixing orpiment and bone black as in the Pahtothamya temple [6]. Conversely, in the later period, copper-based greens were in use [8].

2. Conservation Issue

The Pagán area has been subjected to frequent earthquakes over time, being in the so-called ‘trans-Asiatic’ seismic zone [12]. Therefore, through centuries, heritage buildings underwent several restorations and reconstruction interventions, as testified from ancient inscriptions and more recent plaques placed in numerous structures.
One of the most devastating earthquakes occurred in July 1975, destroying, among others, numerous monuments and causing extensive damage, especially to the upper part of buildings, the vaults, the external carved stuccoes and the internal wall paintings [13]. An international United Nations Educational, Scientific and Cultural Organization (UNESCO) project was started in the 1980s and managed by Pichard to undertake both a damage assessment survey and a conservation project [13,14,15,16,17].
Since 2013, a project for the protection of Myanmar’s Cultural Heritage, as a part of an international collaboration between the Tokyo National Research Institute for Cultural Properties (TNRICPT) and the Nara National Research Institute for Cultural Properties (NNRICP) was undertaken. The project involved training and an exchange program with technicians from the Department of Archaeology of Bagan (DoA).
On 24 August 2016, a magnitude 6.8 earthquake struck again central Burma and more than 300 monuments of the Pagán Archaeological Zone were seriously damaged. The DoA, Japan International Cooperation Agency and the UNESCO Bangkok Office collaborated on a post-earthquake emergency program and extensive data concerning structural damages and behaviour of the heritage buildings during the earthquake were collected [18]. Besides, a pilot conservation project was carried out on Me-taw-ya temple with the aim of developing an emergency training program.
The temple, also known as temple 1205 (Figure 1a,b) according to Pichard’s inventory [19,20], dates back to the 13th century and is of the Bagan Dynasty. The building has a central plan, is cruciform in design, and is located in the middle of the Bagan Chauk Road that connects Old Bagan to New Bagan in the south of Myinkaba village. The principal constituting materials of the structure are fired bricks and mud-based mortars, covered with white stucco reliefs and patterns, of which only a few traces remain visible [19,20].
The temple houses a statue of the seated Buddha and a statue of the standing Buddha (both are reconstructions undertaken during the 1990s). A large central dome, measuring approximately 3.5 m × 3.5 m, decorates the central atrium. The dome is painted with geometric designs contemporary with the construction of the temple. Friezes with floral, circular and diamond-shaped patterns decorate the walls and the small vaults of the eastern and western vestibules. The palette of the wall paintings is largely made out of white, yellow, black, grey and red-purple colours. The current hues of the painting are probably changed with respect to the original one due to the deterioration and fading phenomena (Figure 1c,d).
The main causes of active deterioration are rainwater infiltrations, pests, insect nesting, animal excrement, graffiti and surface alterations due to previous interventions. Documentation regarding the restoration interventions carried out on the wall paintings does not exist, nevertheless on the left-hand side entrance of the eastern façade are two cement plaques: the first indicates a former (pre-Pichard) survey number and a date: N°543—27 April 1964 [10]; the second plaque shows the date (1976) and probably commemorates post-1975 earthquake repairs. A second small cement-based ground standing plaque indicates the date 18 August 1997, relative to works undertaken on the Buddha statues inside the temple and probably to further building repairs.
A restoration campaign dating post-1985 was carried out and is briefly described in the Safeguarding of Cultural Heritage in Myanmar report (published in March 2017 by the Independent Administrative Institution National Institutes for Cultural Heritage, TNRICPT) [21].
In 2016, the TNRICPT and DoA technicians carried out a mapping survey on wall painting damages, as well as emergency treatments to stabilise the painted plaster. Mortars were stabilised by edging procedures using lime and sand mixtures. In 2017, a non-invasive campaign was carried out using in situ portable micro-Raman spectroscopy (µ-Raman) and energy dispersive X-ray fluorescence (ED-XRF) in order to both investigate the wall paintings and to identify representative areas of micro-samples with the aim of revealing the composition of the binder and pigments. The micro-samples were analysed using attenuated total reflectance-Fourier transform infrared spectroscopy (ATR-FTIR), gas chromatography-mass spectrometry (GC-MS) and µ-Raman spectroscopy. In addition, the paint stratigraphy was investigated with polarized light microscopy and an environmental scanning electron microscope coupled with an X-ray energy dispersive system (ESEM-EDS).
The major goal of this paper is to acquire accurate information on the Me-taw-ya wall painting materials. The scientific results regarding the complex stratigraphy, the pigments and binders, as well as the state of conservation could help the restorers to plan a practical code to be adopted to preserve and restore the wall paintings. The same strategy could be applied for the recognition of the wall paintings belonging to other temples which require similar intervention.

3. Materials and Methods

3.1. Non-Invasive Methods

During the last mapping survey carried out by TNRICPT and DoA technicians, Me-Taw-Ya temple wall paintings were submitted to non-invasive in situ analyses.
Energy Dispersive X-ray Fluorescence analysis was carried out using an Oxford Instruments X-Met 8000 energy dispersive portable spectrometer with a silicon drift detector SDD detector, X-Flash, and 6 mm diameter spot, with a rhodium (Rh) target X-ray tube operating both at 8 kV, 50 µA and 40 kV, 8 µA. The first operating condition is particularly sensitive to light elements (from about Al) and was used for detecting Ca, S, Si, K, Cl, Ti, Ni, and Fe elements. The second operating condition related to heavier ones was useful for the As, Hg, Mg, Zr, and Sr elements including Sn, Sb and Ba K-lines. The net areas under the x-ray characteristic K energy lines of Al, Si, S, Cl and Ca, which were collected at 8 kV, and the net areas under the X-ray K energy lines of Fe, Ni and As and L energy lines of Hg, which were collected at 40 kV, were measured by Python multichannel analyser (PyMCA) and the data were handled by principal component analysis (PCA). This approach helped us to collect sufficient intensity of different important elements which showed higher variance in the entire dataset.
The BRAVO spectrometer uses a new patented technology called SSE™ (Sequentially Shifted Excitation, patent number US8570507B1) in order to mitigate fluorescence [22,23]. During the acquisition, the laser was slightly wavelength shifted three times and three raw Raman spectra are recorded. A proper algorithm recognizes all the peaks that shift at different laser wavelengths as good Raman peaks, and other peaks, non-shifting, as fluorescence (or absorbance) peaks, removing them. Moreover, the BRAVO uses two different lasers (DuoLaser™), ranging from 700 to 1100 nm, during the acquisition. The spectra are collected from 300 to 3.200 cm−1. The applied laser power is always less than 100 mW for both lasers. The spectra were acquired with acquisition time ranging from 500 ms to 2 s and accumulation ranging from 5 to 30. For all the measurements OPUS™ software (Version 7.7) has been used in order to select the appropriate acquisition parameters.

3.2. Micro Destructive Analyses

3.2.1. Materials

XRF investigations carried out on 33 hues were useful for choosing seven more representative areas in which the Raman analysis showed the presence of oxalates, suggesting an alteration of organic substances. In these areas, 7 samples were collected from the plasters and the paint layers both in the north lateral niche and the eastern vestibule wall using a scalpel. The number and the size (no more than 1 square centimetre in size) of the samples were limited in accordance with the principle of micro-invasiveness.
Three gum reference materials extracted from two different trees growing in Bagan Area and used by Burmese artisans were analyzed. Two of them are Acacia gum such as Acacia leucophloea (sample G1) and Acacia catechu (sample G2), respectively Tanaung and Mung-ting in the Burmese language. The reference material G3 is Neem gum extracted from Azadirachta indica, Tama in Burmese [24].

3.2.2. Methods

As infrared spectrophotometer, an ALPHA (Bruker Optik GmbH) FTIR spectrometer equipped with a Globar IR source, an interferometer (Rock-Solid)™, insensitive to external vibrations and able to work in any spatial orientation), a DLaTGS room temperature detector and an ATR accessory with a diamond crystal were used. The IR spectra were acquired in the painting surface and in the lacunas in the spectral range 4000–375 cm−1 with a spectral resolution of 4 cm−1 and 128 interferograms.
GC−MS analysis was carried out on a Hewlett Packard HP 6890 gas chromatograph coupled to MSD—HP 5973 MSD mass selective detector (Hewlett-Packard) and a split-splitless injector were used. The mass spectrometer was operated in the EI positive mode (70 eV). The carrier gas was helium. The injector was kept at 280 °C. MS conditions were as follows: interface temperature, 280 °C; ion source temperature, ca. 230 °C; scan mode in the range of m/z 40–400. A low-polarity capillary column SLB-5 ms by Sigma-Aldrich Supelco (5% phenyl groups, I.D. 30 m × 0.25 mm, film thickness of 0.25 µm) was used. An analytical procedure for the characterization of polysaccharides and the identification of plant gums in reference materials and paint samples is defined. The procedure is based on hydrolysis with 2 N trifluoroacetic acid (120 min, 121 °C), keeping in shaking. After letting it cool, take 150 μL and put it in a flask together with 80 μL phenyl-β-glucoside 1000 ppm (internal standard), and dry to rotary evaporator. Next, the residual acid is removed by adding 1 mL of methanol to the flask, which is then evaporated again with the rotary evaporator. Since uronic acids (such as glucuronic and galacturonic acid) that may be present in the sample are degraded by the trifluoroacetic acid which transforms them into lactones, 1 mL of 0.5 M ammonia dissolved in water is added. In this way, by bringing the pH to alkaline values, the reopening of the lactone ring and the return to the initial structure of the uronic acids are allowed, which are thus detectable by subsequent instrumental analysis. Ammonia is allowed to react for about 10 min, then evaporates again to the rotary evaporator. Finally, 800 μL of Dimethylformamide and 200 μL of N, O-Bis(trimethylsilyl) trifluoroacetamide (BSTFA) are added. It is allowed to react for 1 h at 60 °C under stirring and injected into GC-MS. The samples MY32 and MY46 were also treated with the basic methodology for the identification of fatty acids and amino acids already carried out in Casoli et al, 2012 [25].
Raman spectra were collected on cross-section samples using an Olympus BXFM Microscope coupled with a LabRam HR800 spectrometer (Horiba Jobin Yvon, France) fitted with an air-cooled CCD detector (1024–256 pixels), set at −70 °C. The spectrometer had a focal length of 80 mm and the spectra were by a 600 grooves/mm grating, a 100 × objective and a He-Ne laser (632.8 nm) as excitation source with the resolution of 4 cm−1. The acquisitions were achieved with the laser powers between 0.2 and 4 mW and the exposure time varied between 5 and 10 s with 10 accumulations. The spectrometer was calibrated and checked with silicon at 520 cm−1.
Microscope observations were performed on micro-samples using an OLYMPUS BX51 polarized light microscope in reflected and transmitted light mode using reflected polarized and UV light. The microscope was directly connected to an Olympus SC50 camera equipped with Stream Basic software for images acquisition. All the wall paintings’ samples (Table 1) were embedded in an epoxy resin and carefully polished after curing of the resin with progressively finer paper to be made into cross-sections. Some samples were carefully ground to final thickness (usually 30 μm) to be made into thin sections too. Cross and thin sections were observed with fixed oculars of 10× and objectives at different magnifications (5, 10, 20, 50×).
Morphological observations and chemical microanalyses on thin and cross-sections were carried out using an environmental scanning electron microscope (Philips Quanta FEI 200) equipped with energy dispersive X-ray spectrometer (EDX), model 6103 by Link Analytical Oxford (Link, UK). The analyses were carried out at an acceleration voltage of 20 kV with a variable working distance (from 7.3 to 11.4 mm), 40 μA filament current, 100 s lifetime.

4. Results

4.1. Non-Invasive Investigations

4.1.1. ED-XRF Analysis

ED-XRF analysis was carried out on 33 hues of the wall paintings (measurement points from M18 to M45) involving interior walls, eastern vestibule and north lateral niche vaults (Figure 2 and Figure S1). Generally, ED-XRF analysis determines chemical components of investigated area based on X-ray spectra (qualitative analysis). However, we have to consider that in the case of wall paintings with multiple layers, or when a surviving area of pigments is smaller than the irradiated area, the X-ray analyses provide not only the compositional information of the targeted pigments but also those of the lower layer or the surrounding and underlying area.
ED-XRF investigations confirmed the ubiquitous presence of Ca, As, Hg, S, Mg, Sr, Si, K, Cl and Fe. All areas revealed high amounts of Ca, As and S referable to lime/gypsum plaster and arsenic-based compounds. The content of Si, K, Fe, Ti and Mn can be related to red and brown earth pigments [26]. Low levels of Ni and Zr were also revealed, which can be linked to residual minerals developed by metamorphic rocks [27]. In the black and reddish tones, vermilion could be ascertained for the presence of Hg.
Due to a large number of ED-XRF spectra that were collected from different paint layers, a simple observation at the spectra and interpretation of the particular association of elements in the entire dataset was difficult if not impossible. Thus, a dimension reduction approach in observing the dataset was adopted to look at the spectra data. As a multivariate statistical approach, PCA was chosen for this purpose. PCA has already been proven to be a powerful tool for elaborating compositional data of a large number of XRF spectra collected from painted materials [28,29], and could have been used similarly in order to have a useful look at the dataset obtained by ED-XRF measurements from the pigments at Me-taw-ya.
PCA on the log-transformed data from the net area under the peaks of the X-ray characteristic of the elements showing more than 60% of total variance accounted for the first two principal components (PCs), demonstrating a relatively good estimate of data observation with PCA. As Figure 2 shows, the high correlation between Fe, Al and Si, is related to the earth pigments (such as ochres) while the high association of Ca and S suggested the occurrence of calcium sulphate, probably in gypsum form related to restoration interventions.
The presence of Hg suggested the occurrence of vermillion and the moderate association of Hg and Cl (the correlation coefficient between Hg and Cl is about +0.50) may be linked to the darkened vermilion due to the well-known vermilion alteration in presence of halides [30]. It is interesting to highlight the relatively high association of As and Hg, which might point to a certain source of vermillion or its adulteration with an As-bearing pigment (e.g., realgar). The negative association of As and Fe rules out the retention of As in Fe-bearing minerals.

4.1.2. Portable Raman Analysis

Based on the ED-XRF results, Raman analyses were carried out by portable instruments on representative areas of the painting surface in order to identify the presence of inorganic compounds.
Raman spectroscopy allowed us to recognise two forms of oxalates: weddellite and whewellite, identified by the presence of characteristic signals at 1467 and 1490 cm−1 due to the ν(C-O) stretching vibration, respectively, and the ν(C-C) stretching mode [31] in black (points M19 and M23) (Figure 3a) and whitish areas (M20). In all samples, calcium carbonate was revealed by the bands at 1085 and 713 cm−1 [32]. Occasional traces of sulphates (points M23 and M19) revealed gypsum presence, thanks to the ν1 (SO4) Raman vibration mode at 1005 cm−1 [33] (Figure 3a). Sulphates are probably related to restoration interventions.
The Raman spectrum of a brownish area (point M24.1) shows the band at 350 cm−1 (Figure 3b) ascribable to As-S stretching vibrational mode [34] of the orpiment pigment together with quartz signal at 466 cm−1 [32], which one evidenced also in M19 and M20. The signals at 510 and 370 cm−1 (Figure 3c) identified in a reddish area (point M43) has ascribed to feldspar minerals [35].

4.2. Micro Destructive Investigations

According to non-invasive results, the following micro-invasive investigations were performed on paint samples (Table 1), thin and cross-sections in order to identify the pictorial technique and painting materials.

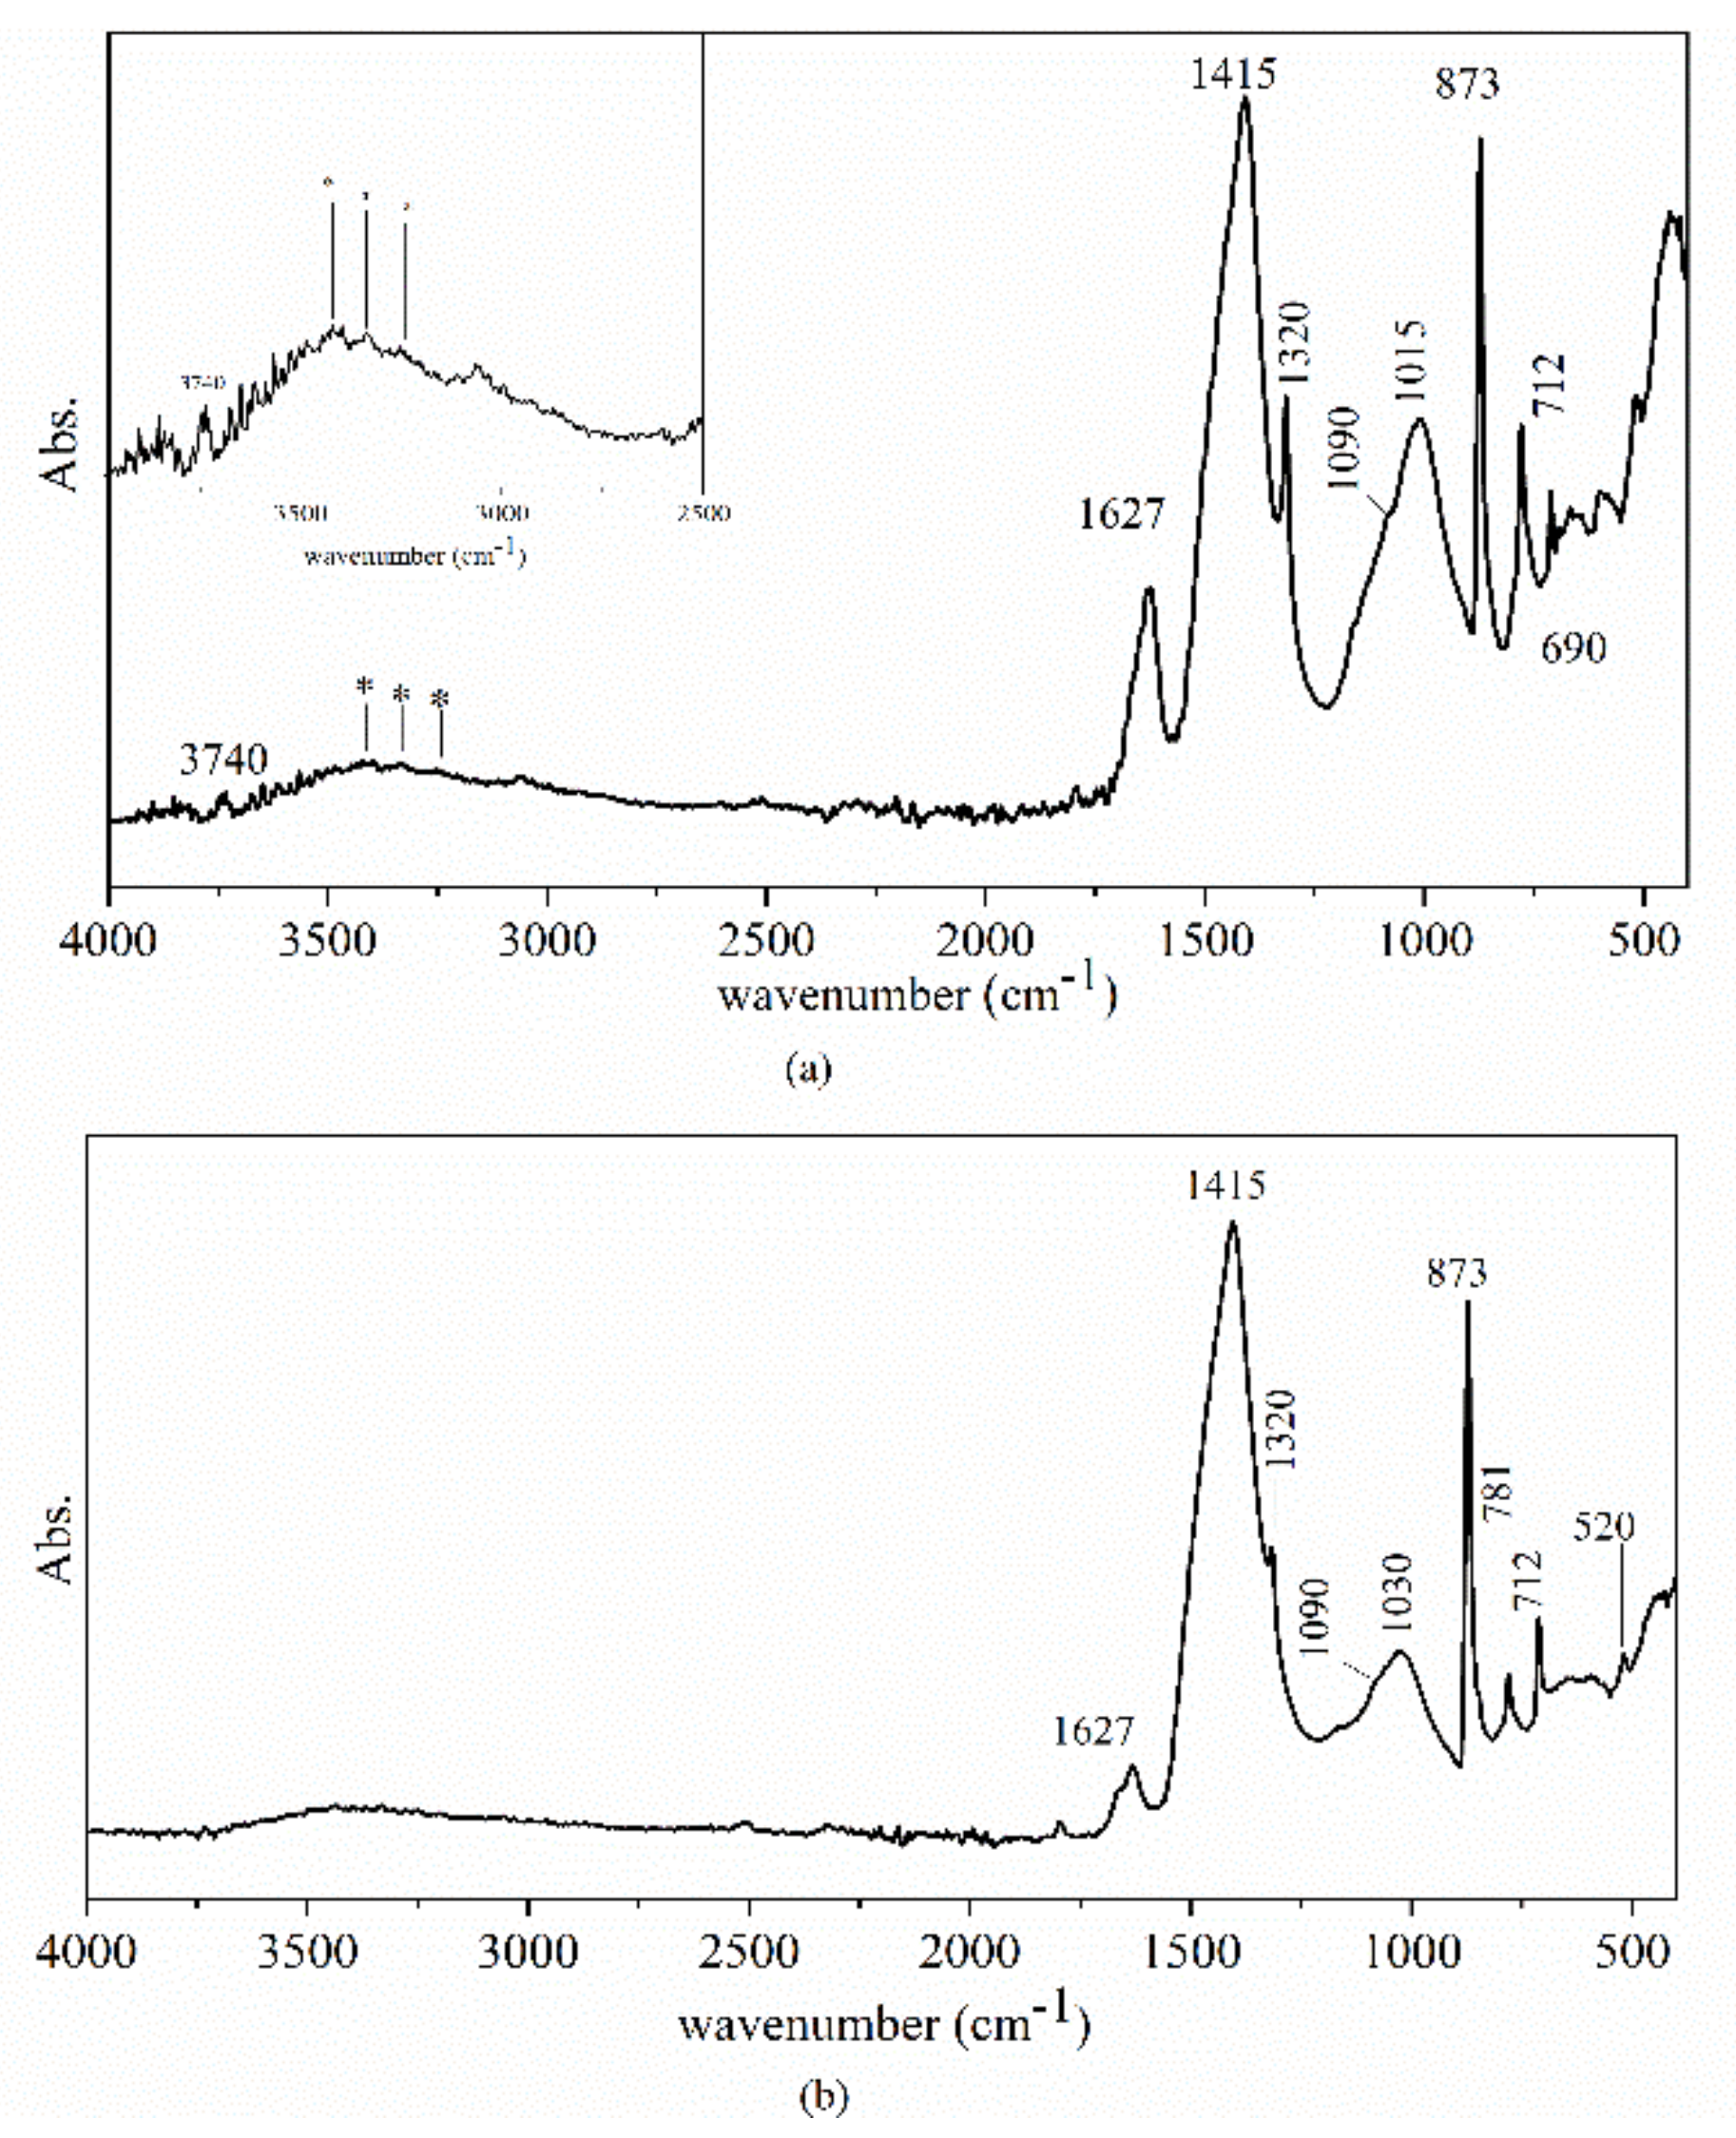
4.2.1. ATR-FTIR Analysis

ATR-FTIR analysis indicated the presence of calcium carbonate, silicates and quartz. In all samples, the presence of weddellite and sometimes whewellite were found. In sample MY49 only quartz and kaolin, with typical Si-O and O-H stretching modes at 1033 cm−1 and between 3700–3500 cm−1, respectively [36], were detected. Whewellite (Figure 4a), identified by its characteristic bands at 1320, 1627 cm−1 ascribable to the νs (C-O) + δ(O-C=O) and νa (C=O) vibrational modes, respectively, and the pattern in the OH stretching vibrations (3600–3000 cm−1) [37,38], suggested the use of an organic binder mixed with the lime. A work by Cariati et al. [39] has considered the possibility that calcium oxalate found on the stone artefacts had been formed after the oxidation of organic substances applied on the stone’s surfaces. In MY33 and MY44a, the presence of illite was revealed by the Si-O stretching modes at 1015 cm−1 and 1090 cm−1, this one as shoulder and the Si-O bending out of the plane at 690 cm−1 [40] (Figure 4a). Smectite was found in samples MY45 and MY45e thanks to the intense Si-O stretching modes at 1030 cm−1 with a shoulder at 1090 cm−1 and the Si-O-Al bending mode at 520 cm−1 [36] (Figure 4b).

4.2.2. GC-MS Analysis

Some selected samples (MY32, MY33, MY45e and MY46) were investigated by GC-MS. The samples MY32 and MY46 are composed both of plaster and a paint layer, while MY33 and MY45e consisted only of paint layers. The first survey was conducted with the aim of identifying polysaccharides. For this purpose, three vegetable gums (Table 1) as reference materials, such as two acacia gums (G1 and G2) and Neem gum (G3) were submitted to polysaccharide procedure for GC-MS analysis.
The percentages of monosaccharides determined in the reference gums are shown in Table 2: in the acacia gums (G1 and G2) arabinose, galactose, mannose, fucose, xylose and glucuronic acid were detected. Conversely, in the chromatogram of Neem gum (Figure 5a) arabinose, galactose, mannose and glucuronic acid were revealed, whereas peaks related to fucose and xylose are missing.
Weak chromatographic profiles of monosaccharides of all four samples were obtained. In fact, for all the samples examined, it was observed that the content of polysaccharide material is very diluted: the average of the polysaccharide content in the four samples is 0.08 mg/100 mg for each. The chromatograms of all paint samples show the only presence of monosaccharides such as arabinose, galactose and glucose, given the low content of polysaccharide material found, which would presumably be more abundant (Table 2). Figure 5b shows the chromatogram for monosaccharide analysis of the MY33 sample.
Only two common analytes, arabinose and galactose, were considered to identify the organic material. As Figure 6a shows, the four samples of paint material are close to the G3 reference, i.e., the Neem gum, which could be used as a binder to apply the colour in all four painting samples, as also reported by Nayak et al. and reported in U Tin Lwin [41,42]. The absence of glucuronic acid and mannose could be due to the dilution of the sample or to the degradation of the rubber. A certain amount of glucose, found in all samples, could be due to the addition of honey [43].
Azadirachta indica, commonly known as Neem tree (Tama in Burmese), is a tropical evergreen tree of the Meliaceae Family native to India, and it also grows in Asia, Africa and in central and South America. The Neem oil is isolated from its fruits and seeds; the juice from the sap and finally from the bark gum is obtained as the result of a certain metabolic mechanism of plants and trees [4]. All products derived from the tree contain pesticide components, whereas azadirachtin is best known for its antifungal properties. Most likely, this gum is used as a paint binder, as well as for its pesticide properties, determined by different compounds content in all parts of the tree including the most important azadirachtin [4]. A more recent study reports a high content of arsenic found in three different kinds of Azadirachta indica, whether from Sudan [44]. The walls of the Me-taw-ya temple, made with lime and mud plaster, were attacked by termites and ants [4,6,45] which may have been turned away by neem pesticide components, whereas honey was probably added as a humectant and plasticiser.
After the polysaccharides analysis by GC-MS, due to the smallness of the samples, only the samples MY32 and MY46 were also subjected to the procedures for revealing both amino acid and lipidic fraction.
The presence of fatty acids, such as myristic acid, palmitic acid, linoleic acid, stearic acid, arachidic acid, and behenic acid could be due to neem seed oil, as already found in Omowanle et al. [46].
In the chromatograms relative to the amino acids fractions, the detection of alanine, glycine, leucine, proline, hydroxyproline, aspartic acid, glutamic acid and phenylalanine suggest the presence of proteinaceous material.
For the proteinaceous media, the percentage content of amino acids in each sample was compared to those from a dataset of 43 reference samples of egg (whole, egg yolk, egg white), casein and animal glue, belonging to the reference collection of the Opificio delle Pietre Dure of Florence [47]. PCA was performed on the correlation matrix of the relative percentage contents of eight amino acids (Figure 6b) (alanine, glycine, leucine, proline, hydroxyproline, aspartic acid, glutamic acid, phenylalanine) [48]. The evaluation by means of PCA locates all the samples in a cluster suggesting the presence of animal glue, from collagen-rich animal tissues, such as skin and bones.
For two samples (MY32 and MY46), composed of both plaster and paint layers, the GC-MS data revealed the presence of animal glue which could belong to the plaster layer, as already found in similar temples, in which the clay has been used mixed with animal glue [6]. It is probable that Neem oil was added in the plaster for its antiseptic characteristic, although there is no information in the literature, as far as we know.

4.2.3. µ-Raman Analysis

In sample MY33, the occurrence of hematite, Fe2O3, with the Raman bands at 227, 294, 411, 612 and 681 cm−1 [49] (Figure 7a), vermillion with the Raman signals at 253, 285 and 341 cm−1 [50] (Figure 7b), quartz (SiO2) with the bands at 130, 206, 266, 356, 405 and 466 cm−1 [51] (Figure 7c) and anatase (TiO2) with the Raman bands at 145, 397 and 641 cm−1 [52](Figure 7d) was attested by µ-Raman. With regards to the occurrence of vermillion, since the most intense Raman bands of this pigment have not been blue-shifted about 5–7 cm−1, one may suggest that cinnabar (α-HgS) occurs in the paint layer instead of metacinnabar (β-HgS) [53].
The presence of anatase should not be considered as a modern intervention in the paint layer [54]. As Clark et al. [55] have shown, anatase is a good Raman scatterer and occurs as a minor impurity in clays and silicates, e.g., quartz.
µ-Raman also showed the carbon black was present in the MY44 sample with the two broad and strong bands at about 1360 and 1580 cm−1 (Figure 8). While the band at 1360 cm−1 is attributed to stretching vibrations in the planar graphite structure (G band), the band at 1580 cm−1 appears as a result of defects of graphite structure or disorder band (D band) [56]. The full width at half maximum (FWHM) for the D and G bands (ωD and ωG, respectively) was about 230 and 115, respectively, and the intensity ratio of D and G bands (ID/IG) was about 0.9. These values show that the carbon black that occurred in the paint layer is reasonably similar to lampblac, whose Raman spectrum has been studied by Tomasini et al. [57]. The absence of additional Raman bands due to the compound associated with carbon black as impurities [58] may support this idea. One should, however, note that the excitation source used by Tomasini et al. and Coccato et al. (i.e., laser line 514 nm) is different from the one used in this study (i.e., laser line 632.8 nm). Thus, slight to moderate Raman shifts might have occurred in the Raman spectrum of the pigment under study with respect to the standard carbon blacks reported by Tomasini et al. and Coccato et al. [57,58].

4.2.4. PLM and ESEM-EDS Investigations

The main stratigraphic features related to plaster, primer and paint layer (organised by hue) were investigated by PLM and ESEM-EDS. A detailed synthesis of data obtained by integrated analyses is discussed below and illustrated in Table 3. PLM observations showed that the supports of the paintings are composed of two layers of plaster with an irregular thickness. The plasters are composed of a lime-based binder with silicate and carbonate aggregates (Figure 9a). The aggregate consists of quartz, feldspars, plagioclase (albite), muscovite, hornblende, ilmenite and opaque minerals.
As EDXRF analysis has provided the elemental composition of the bulk; the SEM-EDS allowed us to understand the elements’ stratigraphic location and the reciprocal relationship between them, such as, for example, that arsenic is rarely associated with sulphur. An ESEM-EDS analysis of plasters (Table 3) detected a high content of Ca and a low amount of Si, Fe, Ti, Al, K, Mg, Na, and traces of Cl, P, S. The presence of calcite, quartz, aluminosilicates, Fe-oxides and Mn-oxides constituting the aggregate was confirmed by EDS analysis.
In most of the samples, a whitish discontinuous primer layer was observed. UV light highlighted a yellowish fluorescence, probably related to organic compounds (Figure 9b). The primer is composed of As-containing compounds and silica/magnesium-based clays (sample MY44; Table 3) to indicate the possibility that As can be contained in magnesian clay [59]. According to the influence of ancient Indian painting tradition [42,60], the Burmese technique uses clayey plaster [42,61].
Arsenic is mainly present as oxide (e.g., arsenolite) as suggested by the EDS analysis of the primer, (e.g., sample MY31 and MY33bis; Figure 9a,b), and the absence of S allowed to refuse the occurrence of orpiment/realgar. The function of such primer could be related to its light-reflecting properties.
PLM observations revealed very thin paint layers (Table 3) with an irregular and discontinuous surface. Sometimes the paint layers are detached from the plaster, probably because of the deterioration processes. ESEM-EDS carried out on the samples surface detected in some cases Ca and S related to calcium sulphate that could be related to a modern restoration intervention.
In the reddish paint sample (MY33; Table 3), a thin and discontinuous layer with a maximum thickness of 48 µm contains red coarse-grained and black particles (Figure 9c). ESEM-EDS microanalysis detected Hg, S and As, related to cinnabar/vermillion and As-based compounds. The presence of Si, Mg, Al, K, Fe and Ti may be due both to Fe-based pigments (red ochre) and clayey matrix [50,51]. Traces of P and Cl may be ascribed respectively to animal glue and chloride compounds. The latter is probably due to past restoration interventions.
Optical and ESEM microscope with EDS analyses of the brownish layers (samples MY32 and MY45e; Table 3) showed an irregular dark brown layer containing brownish particles in which Ca, Si, Al, Fe, K, Hg, S, Mg are the main elements detected. Earth pigments and a few cinnabar particles are the main ones responsible for the colour (Figure 9d). In addition, a few As-based particles and Cr-Fe based particles were also found.
The blackish samples (MY31 and MY44; Table 3) are characterised by a thin (30 µm) and uniform black layer with angular carbon black particles and opaque minerals. The EDS analysis detected C and S, confirming a charcoal black origin [62], while Ca, Si, Fe, Mg, Na, K, and Ti are related both to calcite and natural earth pigments [63].
Arsenic was detected in all the different painting hues, seldom linked with sulphur, and related to orpiment or realgar. In several areas it is linked to oxygen, suggesting the use of As-based oxides or possible photodegradation phenomena of the original red/yellow As-based pigments. According to the possibility that arsenic could be naturally present in the ochres [64,65] or in the clay [61], a possible association of As with Fe and Si was considered. However, as PCA elaboration of ED-XRF data (Figure 2) and SEM/EDS analysis (Figure 10a,b) show, no obvious correlation between Fe, Si and As was observed. Arsenic variability doesn’t follow the one of Fe; this fact was also demonstrated both by ED-XRF data (Figure 2) and EDS analysis (Figure 10b).
Since the use of orpiment is attested in the Burmese painting [65,66], therefore a possible alteration of As/S based pigments [67] should be considered as a further subject of research.

5. Conclusions

Several non-invasive and micro-invasive analytical approaches were used to identify pigments and binding mediums used in the Burmese wall paintings at Me-taw-ya in Myanmar.
The use of EDXRF data for the pigment identification may be more complicated when dealing with the altered ones, due to the advanced state of decay of the wall painting in an archaeological context, as in the case of the Me-taw-ya temple. Using PCA, the association of mercury with chlorine or arsenic suggests two degradation mechanisms of mercury related respectively to the darkening of vermilion, or its adulteration with an As-bearing pigment.
The Raman spectroscopy performed in situ revealed two forms of oxalates, weddellite and whewellite, suggesting traces of organic compounds. In addition, only at one point was the orpiment pigment ascertained, even if the widespread detection of arsenic in the paintings remained unexplained. Conversely, Raman spectra acquired on paint samples were useful to identify hematite and vermilion for the red paints, with carbon black probably in lampblack form for the blackish areas.
An FTIR-ATR analysis performed directly on the painted surface of the micro-samples showed calcite and quartz and a primer layer composed of clay minerals, together with oxalates detected both on the plaster and on the paint layer.
The possible use of Neem gum and honey was demonstrated as the binding medium in the paintings by GC-MS analysis, confirming ‘a secco’ technique. It is interesting to highlight that the Neem gum is extracted from the bark of this endemic tree, characterised by antiseptic properties probably against the attack of termites and ants to which the paintings are often subjected. For the same purpose, we argue that Neem oil together with animal glue were added to the plaster used in the temple.
PLM and SEM-EDS analyses allow us to corroborate the previous findings of the technique of Burmese painting: a lime-based plaster mixed with an organic binder together with quartz, feldspars, Fe-based compounds, Ti-oxide, and silicates (i.e., hornblende, albite and muscovite) was used in support of the murals at Me-taw-ya. Moreover, a primer layer composed of clay minerals together with As-based compounds was applied. These latter compounds were found with different arrangements mainly in the primer layer, in which it seems to be its major component and it could justify the high As-levels revealed also by EDXRF and its uniform appearance. Therefore, its presence cannot be uniquely ascribed to the alteration of As-based pigments. Further analyses will be carried out in order to ascertain the nature of the As-based compounds.

Supplementary Materials

The following is available online at https://0-www-mdpi-com.brum.beds.ac.uk/article/10.3390/app112311441/s1, Figure S1: X-ray characteristic peaks of the main elements in the MY samples.

Author Contributions

Conceptualization, M.L.A.; Data curation, M.L.A., M.V., P.H. and G.G.; Formal analysis, M.L.A., V.M., M.V., A.C., P.H., N.E. and G.G.; Funding acquisition, M.L.A.; Investigation, M.L.A., V.M., M.V. and G.G.; Methodology, M.L.A. and P.H.; Project administration, Y.M.; Resources, K.L. and Y.M.; Supervision, M.L.A.; Validation, M.L.A.; Visualization, M.L.A. and K.L.; Writing—original draft, M.L.A.; Writing—review & editing, M.L.A., V.M., M.V., P.H. and G.G. All authors have read and agreed to the published version of the manuscript.

Funding

This research was funded by BEN 123456I, Benelli Arte, Urbino and DISPEA Project, University of Urbino, CUP H31I18000020005.

Acknowledgments

The authors would like to thank Daniela Murphy Corella and Daniele Angellotto (National Heritage Conservation, Florence, Italy), the restorers that were working on the Me-taw-ya temple, for their support. We thank Pietro Bartaldi in supporting Raman analysis. We thank Sergio De Iasio (Department of Chemistry, Life Sciences and Environmental Sustainability of the University of Parma).

Conflicts of Interest

The authors declare no conflict of interest. The funders had no role in the design of the study; in the collection, analyses, or interpretation of data; in the writing of the manuscript, or in the decision to publish the results.

References

  1. Pichard, P. La composition architecturale des temples de Pagan. Comptes Rendus Séances Acad. Inscr. Belles Lett. 1992, 136, 357–374. [Google Scholar] [CrossRef]
  2. Statdner, M. Sacred Sites of Burma; River Books: Bangkok, Thailand, 2011. [Google Scholar]
  3. Yarmola, J.C. Conservation of Historic Brick Masonry in Pagan (Report No. 3); Technical Report UNDP/BUR/78/023, FMR/CC/CH/88/237 (UNDP); UNESCO: Paris, France, 1988. [Google Scholar]
  4. Hlaing, C.S.S. Scientific analysis and utilization of plant and fruit samples for conservation of Ancient Decorative Arts. In Proceedings of the Asia Cooperation Program for Conservation Science ACPCS, Daejeon, Korea, 1 April–31 August 2018. [Google Scholar]
  5. Lee, N.R.; Lee, H.S.; Han, K.S. Experimental Reinforcement Agent for Damaged Walls of Payathonzu Temple Murals in Bagan, Myanmar. J. Conserv. Sci. 2020, 36, 284–295. [Google Scholar] [CrossRef]
  6. Luján-Lunsford, R. Guidance Note in Approaches for Conservation of Mural Paintings and Architectural Decorative Works at Pagán; Internal UNESCO Report; UNESCO: Rome, Italy, 2017. [Google Scholar]
  7. Luján-Lunsford, R.; Zari, D. Conservation of Mural Paintings and External Stuccoes, Pagan, Union of Myanmar; UNESCO Contract BOC Ref. No. 392.736.2 and 392.738.3, UNDP Project, MYA/86/019; UNESCO: Rome, Italy, 1993. [Google Scholar]
  8. Schwartzbaum, P.M.; Zari, D.; Tint, U.B.; Lazzarini, L. The conservation of the mural paintings and external stuccoes of the temples of Pagan. Stud. Conserv. 1988, 33, 103–107. [Google Scholar] [CrossRef]
  9. Hays, J. Burmese Painting and Modern Art. Facts and Detail Website. Available online: https://factsanddetails.com/southeast-asia/Myanmar/sub5_5e/entry-3085.html (accessed on 20 July 2021).
  10. Me-taw-ya Temple Project—Capacity Building: A Conservation Project for the Repair, Strengthening and Recovery of Temple 1205a, Archaeological Area and Monuments of Pagán, Myanmar 2016–2020; Tokyo National Research Institute for Cultural Properties: Tokyo, Japan, 2021.
  11. Henau, P.; Tint, B. Contribution a l’étude des peintures murales de Pagan en Birmanie. Bull. Inst. R. Patrim. Artist. 1969, 11, 82–92. [Google Scholar]
  12. Pichard, P. Pagan, Burma’s ancient city of 2000 pagodas damaged by a violent earthquake. UNESCO Cour. 1976, 29, 24–29. [Google Scholar]
  13. Pichard, P. The Conservation of Monuments in Pagan, Myanmar; Assignment Report, UNDP/MYA/86/019, RACAP/PROAP/92/2; UNESCO-UNDP: Bangkok, Thailand, 1992. [Google Scholar]
  14. Pichard, P. The Restoration of Pagan; Technical Report RP/1975-76/3.411.6; FMR/CC/CH/76/116; UNESCO: Paris, France, 1976. [Google Scholar]
  15. Pichard, P. Progress of Work for the Preservation of Monuments and Artifacts at Selected Sites in Burma; Assignment Report, UNDP/BUR/78/023, FMR/CLT/CH/83/226 (UNDP); UNESCO: Paris, France, 1983. [Google Scholar]
  16. Pichard, P. Conservation of Monuments in Pagan, Burma; Assignment Report, UNDP/BUR/81/032, FMR/CLT/CH/83/236 (UNDP); UNESCO: Paris, France, 1988. [Google Scholar]
  17. Pichard, P. Conservation of Monuments in Pagan (December 1993–January 1994); Assignment Report, UNDP/MYA/86/019, FMR/CLT/CH/94/215 (UNDP); UNESCO: Paris, France, 1994. [Google Scholar]
  18. Post-Earthquake Damage Assessment Survey of Cultural Heritage Buildings at Pagán Archaeological Zone—Quick Report; Tokyo National Research Institute for Cultural Properties: Tokyo, Japan, 2016.
  19. Pichard, P. Inventory of Monuments at Pagan: Monuments 1137–1439; Kiscadale: Gartmore, Scotland, 1995; Volume 5, pp. 94–95. [Google Scholar]
  20. Amadori, M.L.; Fermo, P.; Raspugli, V.; Comite, V.; Mini, F.M.; Maekawa, Y.; Russa, M. La Integrated scientific investigations on the constitutive materials from Me-taw-ya Temple, Pagán Valley, Burma (Myanmar). Meas. J. Int. Meas. Confed. 2019, 131, 737–750. [Google Scholar] [CrossRef]
  21. Me-taw-ya Pagoda Project—Capacity Building: A Conservation Project for the Repair, Strengthening and Recovery of Temple 1205, Archaeological Area and Monuments of Pagán, Burma 2016–2020 Draft Report 2018; Tokyo National Research Institute for Cultural Properties: Tokyo, Japan, 2017.
  22. Cooper, J.B.; Marshall, S.; Jones, R.; Abdelkader, M.; Wise, K.L. Spatially compressed dual-wavelength excitation Raman spectrometer. Appl. Opt. 2014, 53, 3333. [Google Scholar] [CrossRef]
  23. Cooper, J.B.; Abdelkader, M.; Wise, K.L. Sequentially Shifted Excitation Raman Spectroscopy: Novel Algorithm and Instrumentation for Fluorescence-Free Raman Spectroscopy in Spectral Space. Appl. Spectrosc. 2013, 67, 973–984. [Google Scholar] [CrossRef] [PubMed]
  24. De Filipps, R.A.; Krupnick, G.A. The medicinal plants of Myanmar. PhytoKeys 2018, 102, 1–341. [Google Scholar] [CrossRef]
  25. Casoli, A.; Santoro, S. Organic materials in the wall paintings in Pompei: A case study of Insuladel Centenario. Chem. Cent. J. 2012, 6, 107. [Google Scholar] [CrossRef] [PubMed] [Green Version]
  26. Popelka-Filcoff, R.S.; Robertson, J.D.; Glascock, M.D.; Descantes, C. Trace element characterization of ochre from geological sources. J. Radioanal. Nucl. Chem. 2007, 272, 17–27. [Google Scholar] [CrossRef]
  27. Gardiner, N.J.; Robb, L.J.; Morley, C.K.; Searle, M.P.; Cawood, P.A.; Whitehouse, M.J.; Kirkland, C.L.; Roberts, N.M.W.; Myint, T.A. The tectonic and metallogenic framework of Myanmar: A Tethyan mineral system. Ore Geol. Rev. 2016, 79, 26–45. [Google Scholar] [CrossRef] [Green Version]
  28. Rosi, F.; Burnstock, A.; Van den Berg, K.J.; Miliani, C.; Brunetti, B.G.; Sgamellotti, A. A non-invasive XRF study supported by multivariate statistical analysis and reflectance FTIR to assess the composition of modern painting materials. Spectrochim. Acta Part A Mol. Biomol. Spectrosc. 2009, 71, 1655–1662. [Google Scholar] [CrossRef] [PubMed]
  29. Renda, V.; Mollica Nardo, V.; Anastasio, G.; Caponetti, E.; Vasi, C.S.; Saladino, M.L.; Armetta, F.; Trusso, S.; Ponterio, R.C. A multivariate statistical approach of X-ray fluorescence characterization of a large collection of reverse glass paintings. Spectrochim. Acta Part B At. Spectrosc. 2019, 159, 105655. [Google Scholar] [CrossRef]
  30. McCormack, J.K. The darkening of cinnabar in sunlight. Miner. Depos. 2000, 35, 796–798. [Google Scholar] [CrossRef]
  31. Frost, R. Raman spectroscopy of natural oxalates. Anal. Chim. Acta 2004, 517, 207–214. [Google Scholar] [CrossRef] [Green Version]
  32. Whittaker, E.J. (V. C.) Farmer, editor. The Infrared Spectra of Minerals. London (Mineralogical Society), 1974. x + 539 pp., 219 figs. Price £16. Mineral. Mag. 2018, 40, 104. [Google Scholar] [CrossRef]
  33. Prieto-Taboada, N.; Gómez-Laserna, O.; Martínez-Arkarazo, I.; Olazabal, M.Á.; Madariaga, J.M. Raman Spectra of the Different Phases in the CaSO4–H2O System. Anal. Chem. 2014, 86, 10131–10137. [Google Scholar] [CrossRef] [PubMed]
  34. Cheng, H.; Zhou, Y.; Frost, R.L. Structure comparison of Orpiment and Realgar by Raman spectroscopy. Spectrosc. Lett. 2017, 50, 23–29. [Google Scholar] [CrossRef]
  35. Mernagh, T.P. Use of the laser Raman microprobe for discrimination amongst feldspar minerals. J. Raman Spectrosc. 1991, 22, 453–457. [Google Scholar] [CrossRef]
  36. Madejova, J. FTIR Techniques in Clay Mineral Studies. Vib. Spectrosc. 2003, 31, 1–10. [Google Scholar] [CrossRef]
  37. Conti, C.; Casati, M.; Colombo, C.; Realini, M.; Brambilla, L.; Zerbi, G. Phase transformation of calcium oxalate dihydrate–monohydrate: Effects of relative humidity and new spectroscopic data. Spectrochim. Acta Part A Mol. Biomol. Spectrosc. 2014, 128, 413–419. [Google Scholar] [CrossRef] [PubMed]
  38. Frost, R.L.; Yang, J.; Ding, Z. Raman and FTIR spectroscopy of natural oxalates: Implications for the evidence of life on Mars. Chin. Sci. Bull. 2003, 48, 1844–1852. [Google Scholar] [CrossRef]
  39. Cariati, F.; Rampazzi, L.; Toniolo, L.; Pozzi, A. Calcium oxalate films on stone surfaces: Experimental assessment of the chemical formation. Stud. Conserv. 2000, 45, 180–188. [Google Scholar] [CrossRef]
  40. Zviagina, B.B.; Drits, V.A.; Dorzhieva, O.V. Distinguishing Features and Identification Criteria for K-Dioctahedral 1M Micas (Illite-Aluminoceladonite and Illite-Glauconite-Celadonite Series) from Middle-Infrared Spectroscopy Data. Minerals 2020, 10, 153. [Google Scholar] [CrossRef] [Green Version]
  41. Nayak, B.R.; Rao, R.; Pattabiraman, T.N. Studies on plant gums. Isolation and characterisation of the major polysaccharide from Neem (Azadirachta indica) gum. Proc. Indian Acad. Sci. 1978, 87, 261–269. [Google Scholar] [CrossRef]
  42. Lwin, U.T. Old Burmese Painting. Oriens Extrem. 1974, 21, 237–259. [Google Scholar]
  43. Lluveras-Tenorio, A.; Mazurek, J.; Restivo, A.; Colombini, M.P.; Bonaduce, I. Analysis of plant gums and saccharide materials in paint samples: Comparison of GC-MS analytical procedures and databases. Chem. Cent. J. 2012, 6, 1. [Google Scholar] [CrossRef] [Green Version]
  44. Mawahib, E.M.; Elfatih, A.; Hassan Mohammed, E.O. Characterization and rheological behaviour of neem gum (Azadirachta indica). Int. J. Chem. Stud. 2018, 6, 1977–1981. [Google Scholar]
  45. Zari, D.; Giantomassi, C.; Schwartzbaum, P.M. Conservation of Mural Paintings. Pagan, Burma (25 December 1984–25 January 1985); Mission Report: Contract BOC ref. 712.091.4 BUR/78/023; ICCROM: Rome, Italy, 1985. [Google Scholar]
  46. Omowanle, J.; Ayo, R.J.; Habila, J.I.; Lekhaize, J.; Adegbe, E.A. Physico-chemical and GC-MS analysis of some selected plant seed oil: Castor, neem and rubber seed oils. FUW Trends Sci. Technol. J. 2018, 3, 644–651. [Google Scholar]
  47. Lanterna, G.; Mairani, A.; Matteini, M.; Rizzi, M.; Vigato, A. Characterisation of decay markers on pictorial models simulating ancient polychromies. In Proceedings of the 2nd International Congress on Science and Technology for the Safeguard of Cultural Heritage in the Mediterranean Basin, Paris, France, 5–9 July 1999; Elsevier: Paris, France, 2000; pp. 5–9. [Google Scholar]
  48. Casoli, A.; Montanari, A.; Palla, L. Painted models simulating ancient polychromies: A statistical analysis of chemical results. In Proceedings of the 3rd International Congress on Science and Technology for the Safeguard of Cultural Heritage in the Mediterranean Basin, Alcalá De Henares, Spain, 9–14 July 2001; Elsevier: Paris, France, 2001; pp. 839–845. [Google Scholar]
  49. De Faria, D.L.A.; Venâncio Silva, S.; de Oliveira, M.T. Raman microspectroscopy of some iron oxides and oxyhydroxides. J. Raman Spectrosc. 1997, 28, 873–878. [Google Scholar] [CrossRef]
  50. Scheuermann, W.; Ritter, G.J. Raman Spectra of Cinnabar (HgS), Realgar (As4S4) and Orpiment (As2S3). Z. Nat. A 1969, 24, 408–411. [Google Scholar] [CrossRef]
  51. Krishnan, R.S. Raman spectrum of quartz. Nature 1945, 155, 452. [Google Scholar] [CrossRef]
  52. Ohsaka, T.; Izumi, F.; Fujiki, Y. Raman spectrum of anatase, TiO2. J. Raman Spectrosc. 1978, 7, 321–324. [Google Scholar] [CrossRef]
  53. Chiriu, D.; Pala, M.; Pisu, F.A.; Cappellini, G.; Ricci, P.C.; Carbonaro, C.M. Time through colors: A kinetic model of red vermilion darkening from Raman spectra. Dye. Pigment. 2021, 184, 108866. [Google Scholar] [CrossRef]
  54. Amadori, M.L.; Costantini, I.; Madariaga Mota, J.M.; Valentini, L.; Ferrucci, F.; Mengacci, V.; Camaiti, M. Calcium antimonate: A new discovery in colour palette of Paestum wall paintings. Microchem. J. 2021, 168, 106401. [Google Scholar] [CrossRef]
  55. Clark, R.J.H.; Wang, Q.; Correia, A. Can the Raman spectrum of anatase in artwork and archaeology be used for dating purposes? Identification by Raman microscopy of anatase in decorative coatings on Neolithic (Yangshao) pottery from Henan, China. J. Archaeol. Sci. 2007, 34, 1787–1793. [Google Scholar] [CrossRef]
  56. Jawhari, T.; Roid, A.; Casado, J. Raman spectroscopic characterization of some commercially available carbon black materials. Carbon 1995, 33, 1561–1565. [Google Scholar] [CrossRef]
  57. Tomasini, E.P.; Halac, E.B.; Reinoso, M.; Di Liscia, E.J.; Maier, M.S. Micro-Raman spectroscopy of carbon-based black pigments. J. Raman Spectrosc. 2012, 43, 1671–1675. [Google Scholar] [CrossRef]
  58. Coccato, A.; Jehlicka, J.; Moens, L.; Vandenabeele, P. Raman spectroscopy for the investigation of carbon-based black pigments. J. Raman Spectrosc. 2015, 46, 1003–1015. [Google Scholar] [CrossRef] [Green Version]
  59. Ryan, P.C.; Huertas, F.; Pincus, L.N. Arsenic-bearing serpentine-group minerals: Mineral synthesis with insights for the arsenic cycle. Clays Clay Miner. 2019, 67, 488–506. [Google Scholar] [CrossRef]
  60. Singh, M.; Arbad, B. Chemistry of preservation of the Ajanta murals. Int. J. Conserv. Sci. 2013, 4, 161–176. [Google Scholar]
  61. Whitbread, A.K.J. Mediaeval Burmese wall-paintings from a temple at Pagan now in the Hamburgisdies Museum für Völkerkunde, Hamburg. Oriens Extrem. 1971, 18, 85–122. [Google Scholar]
  62. Winter, J.; West Fitzhugh, E. Pigments based on carbon. In Artist’s Pigments, a Handbook of Their History and Characteristics; Berrie, B.H., Ed.; National Gallery of Art: Washington, DC, USA, 2007; pp. 24–26. [Google Scholar]
  63. Helwig, K. Iron oxide pigments, natural and synthetic. In Artist’s Pigments, a Handbook of Their History and Characteristics; Berrie, B.H., Ed.; National Gallery of Art: Washington, DC, USA, 2007; Volume 4. [Google Scholar]
  64. Hattori, K.; Takahashi, Y.; Guillot, S.; Johanson, B. Occurrence of arsenic (V) in forearc mantle serpentinites based on X-ray absorption spectroscopy study. Geochim. Cosmochim. Acta 2005, 69, 5585–5596. [Google Scholar] [CrossRef]
  65. Smedley, P.L.; Kinniburgh, D.G. A review of the source, behaviour and distribution of arsenic in natural waters. Appl. Geochem. 2002, 17, 517–568. [Google Scholar] [CrossRef] [Green Version]
  66. Zari, D.; Schwartzbaum, P.M. Conservation of Mural Paintings. Pagan, Burma—BUR/78/023; UNESCO Contract 651.278.3; UNESCO: Rome, Italy, 1983. [Google Scholar]
  67. Green, L. Colour transformations of ancient Egyptian pigments. In Colour and Painting in Ancient Egypt; British Museum Press: London, UK, 2001; pp. 43–48. [Google Scholar]
Figure 1. (a) Me-taw-ya temple (1205); (b) Me-taw-ya map by Pichard inventory with XRF investigated areas; (c) interior, detail of the circle pattern with lotus rosacea motif; (d) Eastern vestibule, north-east wall, detail of XRF investigated areas.
Applsci 11 11441 g001
Figure 2. PCA biplot on the net area under the X-ray characteristic peaks of the main elements composing the paint layers.
Applsci 11 11441 g002
Figure 3. Portable Raman spectra of points: (a) M23; (b) MY24.1; (c) M43.
Applsci 11 11441 g003
Figure 4. ATR-FTIR-spectra of samples MY33 (a) and MY45 (b). The infrared bands are reported and the pattern of the OH stretching vibrations highlighted with an asterisk (*) is better illustrated in the detail of figure (a).
Applsci 11 11441 g004
Figure 5. (a) Chromatogram of polysaccharide content of Neem gum; (b) Chromatogram for monosaccharide analysis of the MY33 sample.
Applsci 11 11441 g005
Figure 6. (a) Arabinose vs galactose bivariate plot; (b) PCA biplot on the various possible proteinaceous binding mediums references and the samples MY46 and MY32. G1: C; G2: CYO; G3: CRO; G4: CVB; G5: CSJW; G6: CGE; G7: CSM; G8: AzCpi; G9: AzCpv; G10: Cpv10; G11: GI; M1: L; M2: LYO; M3: LRO; M4: LVB; M5: LSJW; M6: LGE; M7: LSM; M8: AzLtv; M9: Ltv (uv); M10: BpLti10P; M11: TvLtv; M12: TvLtv©; M13: BpLtv(uv); M14: AzLti; M15: AzLtv; M16: BpLti10P; M17: TvLtv; M18: Ltvi23; M19: BpLti©; M20: BpLtv(uv); M21: BpLtv©; M22: TvLtv©; M23: Ltv(uv); E1: U; E2: UYO; E3: URO; E4: UVB; E5USJW; E6: UGE; E7: USM; E8: SmUivi; E9: TvUivg; E10: AzUig; E11: AzUivi; E12: MnTgi; E13: MnTgv; E14: BpUig; E15: BpUivi; E16: Uivg.
Applsci 11 11441 g006
Figure 7. Sample My33: Raman spectra of (a) hematite; (b) vermilion; (c) quartz (the italic bands are from anatase); (d) anatase.
Applsci 11 11441 g007
Figure 8. Sample My44: Raman spectra of carbon black.
Applsci 11 11441 g008
Figure 9. Micrograph of the painting layer: (a) sample MY44 and (b) sample MY33 in UV light; (c) sample MY33; (d) sample MY45e in visible light.
Applsci 11 11441 g009
Figure 10. Sample MY31: (a) BSE-SEM micrographs; (b) EDS spectrum of the primer layer.
Applsci 11 11441 g010
Table 1. Samples list.
CodeSampling AreaDescriptionAnalytical Techniques
MY31Vault, lateral niche northBlackish paint layers and plasterPLM, ESEM-EDS
MY32Vault, lateral niche northBrownish paint layers and plasterGC-MS, PLM, ESEM-EDS
MY33Vestibule, north-east wallReddish paint layer and plasterµ-Raman, GC-MS, PLM, ESEM-EDS, ATR-FTIR
MY44Entrance, north-west wallBlackish paint layer and plasterµ-Raman, PLM, ESEM-EDS
MY45Entrance, north-west wallPlasterµ-Raman, PLM, ESEM-EDS, ATR-FTIR
MY45eVestibule, north-east wallBrownish/yellowish paint layer and plasterGC-MS, PLM, ESEM-EDS, ATR-FTIR
MY46Vestibule, north-east wallBlackish paint layerGC-MS
G1Acacia leucophloeaAcacia gumGC-MS
G2Acacia catechuAcacia gumGC-MS
G3Azadirachta indicaNeem gumGC-MS
Table 2. Polysaccharide percentage content of reference gums and paint samples.
GumArabinoseFucoseXyloseMannoseGalactoseGlucuronic AcidGlucose
G176.221.910.342.6116.532.39
G276.451.060.281.7219.810.55
G343.16 4.5638.8113.47
MY3248.00 35.80 16.20
MY3348.08 36.20 15.72
MY45e47.90 35.32 16.78
MY4643.80 38.33 17.87
Table 3. Stratigraphic composition of paint samples.
SampleMaximum Thickness (µm)TypologyDetected Elements (ESEM/EDX)Stratigraphic Identification (PLM + ESEM-EDX)
MY3315painting layerCa, Hg, Si, Al, As, S, Fe, K, Cl, (Mg, P)Calcite, cinnabar/vermilion, As-based particles
20primerCa, As, Si, Ti, Cl, Fe, Na, (S, P)Calcium carbonate, As-compounds, silicates
1880plasterCa, Si, Fe, Ti, Al, K, Mg, Cl, S, P, NaCalcium carbonate, aluminosilicates, ilmenite
MY3240painting layerCa, Fe, Si, As, Mg (Al, K, S)Fe-based pigments (earths), As-based particles
45primerAs, Ca, Mg, Si, Cr, Fe, Ti (Al, P)Calcium carbonate, As-based particles
1800plasterCa, Si, (Ti, Mg, Al, Fe, K)Calcium carbonate, aluminosilicates, Mg-based particles
MY45e30painting layersCa, Al, Si, Fe, Ti, K, Mg, As, (P, S)Calcium carbonate, Fe-based oxides, As-based particles
10primerCa, Si, As, Hg, Mg (Al, Cl, K)Calcium carbonate, silicates, As-based particles, vermillion
1600plasterCa, Si, Al, Mg, Fe, K, Ti, Na, Cr, Cl, S, PCalcium carbonate, silicates, quartz, Ti-Fe oxides, Fe-oxides
160 Si, Al, Fe, Mg, Na, Ca, S, KSilicates, plagioclase, Fe-based oxides, calcium carbonate, pyrite particles
MY3130painting layerCa, Si, Fe, As, C, Mg, Al, (K, Cl, P)Carbon black, As-based particles, Fe-based oxides, silicates
35primerCa, As, Mg, Si, (Al, Na, K, Fe, Cl)As-based particles, calcium carbonate, aluminosilicates
400plasterCa, Si, Mg, K, (Al, Na, Cl, P, S, Ti)Calcium carbonate, quartz, aluminosilicates
MY4420painting layersC, Ca, Fe, Mg, Si, As (Na, K, S, Cl)Carbon black, calcite, Fe-based oxides, silicates, As-based particles
20primerCa, Mg, Si, As, (Al, Fe, K, Na, Cl, Cu, Zn)Calcium carbonate, silicates, As-based particles
340plasterCa, Si, K, Fe, Al, Mg, Ti, S, Cl (Na, P)Calcium carbonate, silicates, quartz, aluminosilicates, Fe-based oxides, Ti-based particles
Publisher’s Note: MDPI stays neutral with regard to jurisdictional claims in published maps and institutional affiliations.

