
A Durability Prediction Method for Historical Square Rebar Reinforced Concrete Buildings


School of Architecture, Southeast University, 2 Sipailou Road, Nanjing 210096, China
*
Author to whom correspondence should be addressed.
Appl. Sci. 2021, 11(24), 11737; https://0-doi-org.brum.beds.ac.uk/10.3390/app112411737
Submission received: 12 November 2021
/
Revised: 3 December 2021
/
Accepted: 7 December 2021
/
Published: 10 December 2021
(This article belongs to the Special Issue Diagnostics and Monitoring of Steel and Concrete Structures)
Abstract
:Featured Application
The proposed durability prediction method can directly guide the evaluation and conservation of the historical square rebar reinforced concrete buildings.
Abstract
Square rebars were developed and used for decades in the early development of reinforced concrete (RC) structures; however, the objectives of modern concrete structure durability analyses and standards are centered on round rebars in past decades, which are not suited for RC buildings utilizing square rebars. Considering the absence of proper evaluation techniques to evaluate the square rebar RC structures’ durability accurately, a novel durability prediction method has been proposed for this type of historical building. The method is based on major parts as in-situ investigation, finite element model simulation, component importance analysis, and structural durability prediction. The durability prediction calculation method was established on the experimental results of the realistic historical concrete tests and corrosion-induced cover cracking experiments for square rebar components. It was found that the carbonization-resistant ability of historical concretes was relatively weaker than that of current concretes and the calculation method for critical corrosion depth of square rebar was different from that of round rebar. Furthermore, two typical application cases are presented to introduce the procedure of the method in detail. Consequently, the research outcomes can be directly used on the durability prediction and protection works for historical RC buildings.
1. Introduction
In the current state, almost all studies related to durability prediction and corrosion induced cracking for reinforced concrete (RC) components and structures focus on the round rebar cases [1,2,3,4,5,6,7,8,9,10]. The concrete structure design standards and codes in many countries and states also default that the type of reinforcement is round steel rebar [11,12,13], without any application description for square steel rebar. Although round rebars are presently the most often utilized steel material in RC constructions, square rebars were commonly used throughout history (approximately between 1900s and 1940s), particularly in Europe [14,15], America [16,17] and China [14]. The China standard [18] and report from ACI Committee 365 [19] for RC structure durability evaluation are both based on round rebar components. Therefore, the current research and standards related to round rebar usage do not provide conformance for the square rebar reinforced concrete structures. To exemplify more tangibly, in China, the latest standard for durability assessment of existing concrete structures, GB/T 51355, does not mention any situation about square rebar [18], which is based on the current design codes for concrete structures; and the current design system has been developed since the 1980s [20,21]. As a direct consequence, the majority of historical RC structures do not match the demands of the current design system; therefore, durability evaluation cannot be completed accurately by the current China standard. The main reasons behind this situation are as follows:
- The durability prediction method of the current China standard is structured on “target service life” which is dependent on the current durability design codes and current construction technology [18,21]. However, a precise definition of “target service life” for historical RC structures has not been established in history; hence, the durability prediction relied on the current China standard cannot be employed directly.
- Compared with the current level of the construction industry, the materials properties and construction techniques in history were backward [22]; thus, historical RC buildings cannot satisfy all of the current standards’ durability design criteria. Accordingly, numerous elements and indexes from the current standards are inaccurate and unreliable for assessing the historical RC buildings.
- The theoretical models and experiments in the standard [18] are all designed for round rebar components; however, according to the existing studies, the structural configuration design [23], the bond-slip behavior between rebar and concrete [24] and the rebar corrosion induced cracking model [25] for square rebar cases are very different from the round rebar cases.
Due to the domination of round rebar for the current industry, the research on the historical RC buildings with square rebars is limited in number. Meinheit and Felder [17] studied the history of invention and development of steel rebar, contributing some unique pieces of information about vintage steel rebar. The book stated that the various section types of steel rebars in the early reinforcement industry were searching for the higher bond-slip strength between concrete and rebars, but it does not provide bond-slip strength between concretes and different types of rebars. Chun, Van Balen and Pan [26] tested material properties of square rebars on the abandoned members from the historical RC buildings (built between 1912 and 1949) in China. They reported that the square rebars were low-carbon and hot-rolled steel rebars, similar to the current round steel rebars, with an average yield strength of 278.60 MPa, and average tensile stress of 375.86 MPa. In another study, Chun and Pan [22] investigated the structural characteristics by testing the compressive strength of the old concretes from twelve historical RC buildings (built between 1912 and 1949) in China. The average compressive strength of the old concretes was 12~22 MPa. The sole factor evaluated in the study relevant to the considerations given above was the influence of the old concrete on the durability of historical RC structures. Chun, Van Balen and Han [23,27] performed a comparison study on the historical design theory in China with the current design standards for beam bending and shear behaviors. The historical design theory adopted an allowable stress calculation method, and the design safety factors were 3.55~4.00. The historical design method was more conservative than the current design method, however, it did not consider the earthquake action, and some structural configurations were primary. In another study was performed by Dong et al. [25], a corrosion-induced concrete cracking experiment was conducted for square rebar concrete specimens and corrode products of the historical square rebars were analyzed. Moreover, the ratio of the critical depth and the section length of the rebars were investigated; however, they did not establish an applicable calculation method. Zhang et al. [24] performed experimental and numerical investigation on the bond-slip behavior of square rebar and concrete, and the experimental results revealed that the performance was substantially weaker than that of the current deformed round rebar. Subsequently, Zhang et al. [28] performed a study for experimental and theoretical analysis for the shear capacity of the square rebar reinforced concrete beam. The experimental results illustrated that this type of beam had a critical crack that propagated to the upper surface of the beam which caused the beam failure under shear load. They proposed a modified arch-truss model to quantitatively evaluate the relationship between the crack development and the shear capacity of the square rebar reinforced concrete beam. According to the comprehensive literature review, an adaptive durability assessment method for square rebar RC historical buildings was not found. Only approaches for round rebar reinforced concrete structures may currently be used to anticipate and analyze the durability of historical RC buildings; nevertheless, the accuracy and reliability have not been proven. Consequently, in the current paper, a durability prediction system for square rebar reinforced concrete buildings is proposed, which can be used for the durability prediction for the relevant type of historical buildings.
2. The Durability Prediction Method and Research Method
2.1. The Durability Prediction Method
Succinctly, the principle of the method is using the durability life of critical components to represent the durability life for the entire historical square rebar RC buildings. The durability prediction method is structured based on four main phases: the in-situ investigation, the finite element model simulation, the component importance analysis, and the structural durability prediction (Figure 1). The former step is necessary for the subsequent step. In-situ investigations primarily consist of structural surveying (mainly including load condition, structural arrangement, component geometry, concrete cover depth, reinforcement arrangement, reinforcement geometry, etc.) and material properties testing (mainly including concrete compressive strength, etc.), which can provide the essential data for the subsequent step of constructing the finite element model and computations. The finite element method is used to accomplish the component importance analysis, which can provide the order of all structural components according to importance. The vertical loads for the daily condition are loaded in the finite element model. Then, according to the importance order, all the structural components can be divided into four levels, and the first level components are critical components for the entire structure. Ultimately, the averaged durability life of critical components is calculated to represent the durability life for the entire structure, enabling the durability life evaluation to progress from the component level to the structure level. The durability life in this paper is represented by the corrosion-induced cracking life of the component, including the time before rebar corrosion and the time from corrosion initiation to corrosion-induced concrete cover cracking.
2.2. Research Method
The research method mainly consists of two parts. The first part is the component importance analysis method to determine the critical components with the calculations based on the finite element model. The second part is to provide an adaptive calculation method for the durability life of the square rebar RC component. However, it should be noted that the durability of an RC component or building scale encompasses so many factors that extensive investigation is unattainable. As mentioned above, there is a China standard for the durability assessment for the concrete structure, which is based on many long-term studies and a massive amount of data. Therefore, considering the contained long-term studies and the massive data, the China standard GB/T 51,355 for the durability assessment for the concrete structure can be taken as a basis for predicting the square rebar RC component durability especially for those equations which are not related to the rebar type. Regarding durability analysis, the key differences between current and historical RC components are concrete carbonization resistant ability and steel rebar type [22,26]. The ability of carbonization resistance of concrete is related to the overall quality of the concrete and the working condition, which can determine the time before rebar corrosion. Different shapes of rebar sections can present different mechanical models for the rebar corrosion-induced cover cracking, which can determine the time of corrosion-inducing concrete cracking. In general, the qualities and properties of historical concrete were relatively weak, due to the low quality of cement, mix proportion, construction technology, and curing conditions [22]. The square rebars were widely used in early history for decades, while the round rebars are used for every RC building around the world at present. Thus, these two different aspects are the main research objects in this study. The current limitations of the study should also be stated. The main limitation is the amount of the experimental square rebars. The majority of the historical RC buildings with square rebars are protected buildings in China, and they are forbidden to be demolished and replaced by the current round rebars in principle. Thus, it is very difficult to collect the experimental square rebars. Our team group have taken ten years to collect dozens of historical square rebars from the abandoned historical concrete components.
To introduce the detailed application of the proposed method, two typical historical RC buildings in China were analyzed, and the two application cases can also help to evaluate the reliability and the applicability of the proposed durability prediction method.
2.3. Research Significance and Novelties
The invention of the durability prediction method can directly guide the evaluation and conservation of the historical square rebar RC buildings. The main novelties are as follows:
- Fundamentally, the proposed durability prediction method accomplishes the issue that there has been no applicable and reliable method of durability evaluation for historical square rebar RC buildings.
- The durability prediction calculation methods for a single concrete component focus on the historical concrete and square rebar components. It considers the poor properties of the historical concrete and the different models of corrosion-induced cover cracking between square rebar and round rebar.
- The proposed important analysis method is improved from the existing theory on the realistic application, which is more accurate and efficient. The inclusion of the finite element model also enhances the efficiency of the evaluation works of the building.
- GB/T 51,355 standard fosters the engineers or workers to choose a limited number of structural members to represent the status of the entire structure; however, the selection is performed randomly or inaccurately only depending on the experience. The proposed method ranks the structural members according to importance, which can reduce the potential human error and improve the reliability of the durability evaluation. Additionally, the component importance ranking is highly valuable and practical for the renovations and conservations of historic buildings that have aesthetic parts as colorful drawings and patterns. When feasible, the ranks can guide engineers to reinforce only the essential components rather than all components; hence, allowing the original paintings and patterns on the components to be preserved.
3. The Method for Determination of Critical Components
3.1. The Components Importance Analysis
The structural components importance analysis is based on the energy theory and finite element calculation. The component importance index is defined as the change in structural strain energy ratio caused by removing component [29], and the simplified expression is as follows:
where the and are the generalized stiffness of the original structure and the changed structure, respectively; and are the total strain energy of the original structure and the changed structure, respectively.
3.2. The Finite Element Method for Components Importance Analysis
According to the theory given above, Ye et al. [29] adopted the removing component method to analyze some examples. The method proposed by them requires manual calculation or code calculation for each different case; thus, it is highly inefficient. Besides, the requirement for redistribution of the load in each calculation process for the demolition of a single component can pose negative importance values for some beam components, which causes uncertainty in identifying the engineering significance of components. In this study, the finite element method is adopted to develop the abovementioned method based on the conversion of the single complete component demolition to an element demolition, via the commercial finite element software, ANSYS. The method of reducing elastic modulus was adopted, which depends on the reduction of the concretes’ elastic modulus with a considerably small coefficient. The calculation is achieved by reducing the elastic modulus of every element of the finite element, rather than a whole structural component. Many durability problems (such as local spalling of concrete, local cracking of concrete components, etc.) are local damages of structural components, rather than the total destruction of the structural component. The proposed reducing elastic modulus method based on the finite element model can much better simulate the local damage. For the removing component method, it has to handle the load redistribution as if the disappearance of a component changes the load condition of the structure locally. For the proposed reducing elastic modulus based on finite element model, it only changes the elastic modulus of a part of a structural component, which does not change the load condition of the structure locally, thus, the load redistribution can be ignored in the calculation process. The advantages of this methodology are as follows: (1) the calculation efficiency can be significantly improved by finite element software; (2) the same finite element model can be utilized for structural analyzes and component importance analysis, besides the use of finite element model can also improve the efficiency of the overall evaluation works of the building; (3) the finite element method can eliminate the negative values of some beam components, and clarify each component’s importance, which is analyzed in detail in previous texts. In this paper, the calculation is achieved by the finite element model; hence, the expression should be as follows:
where, is the unit volume change rate of the total strain energy of the structure, and is the element volume.
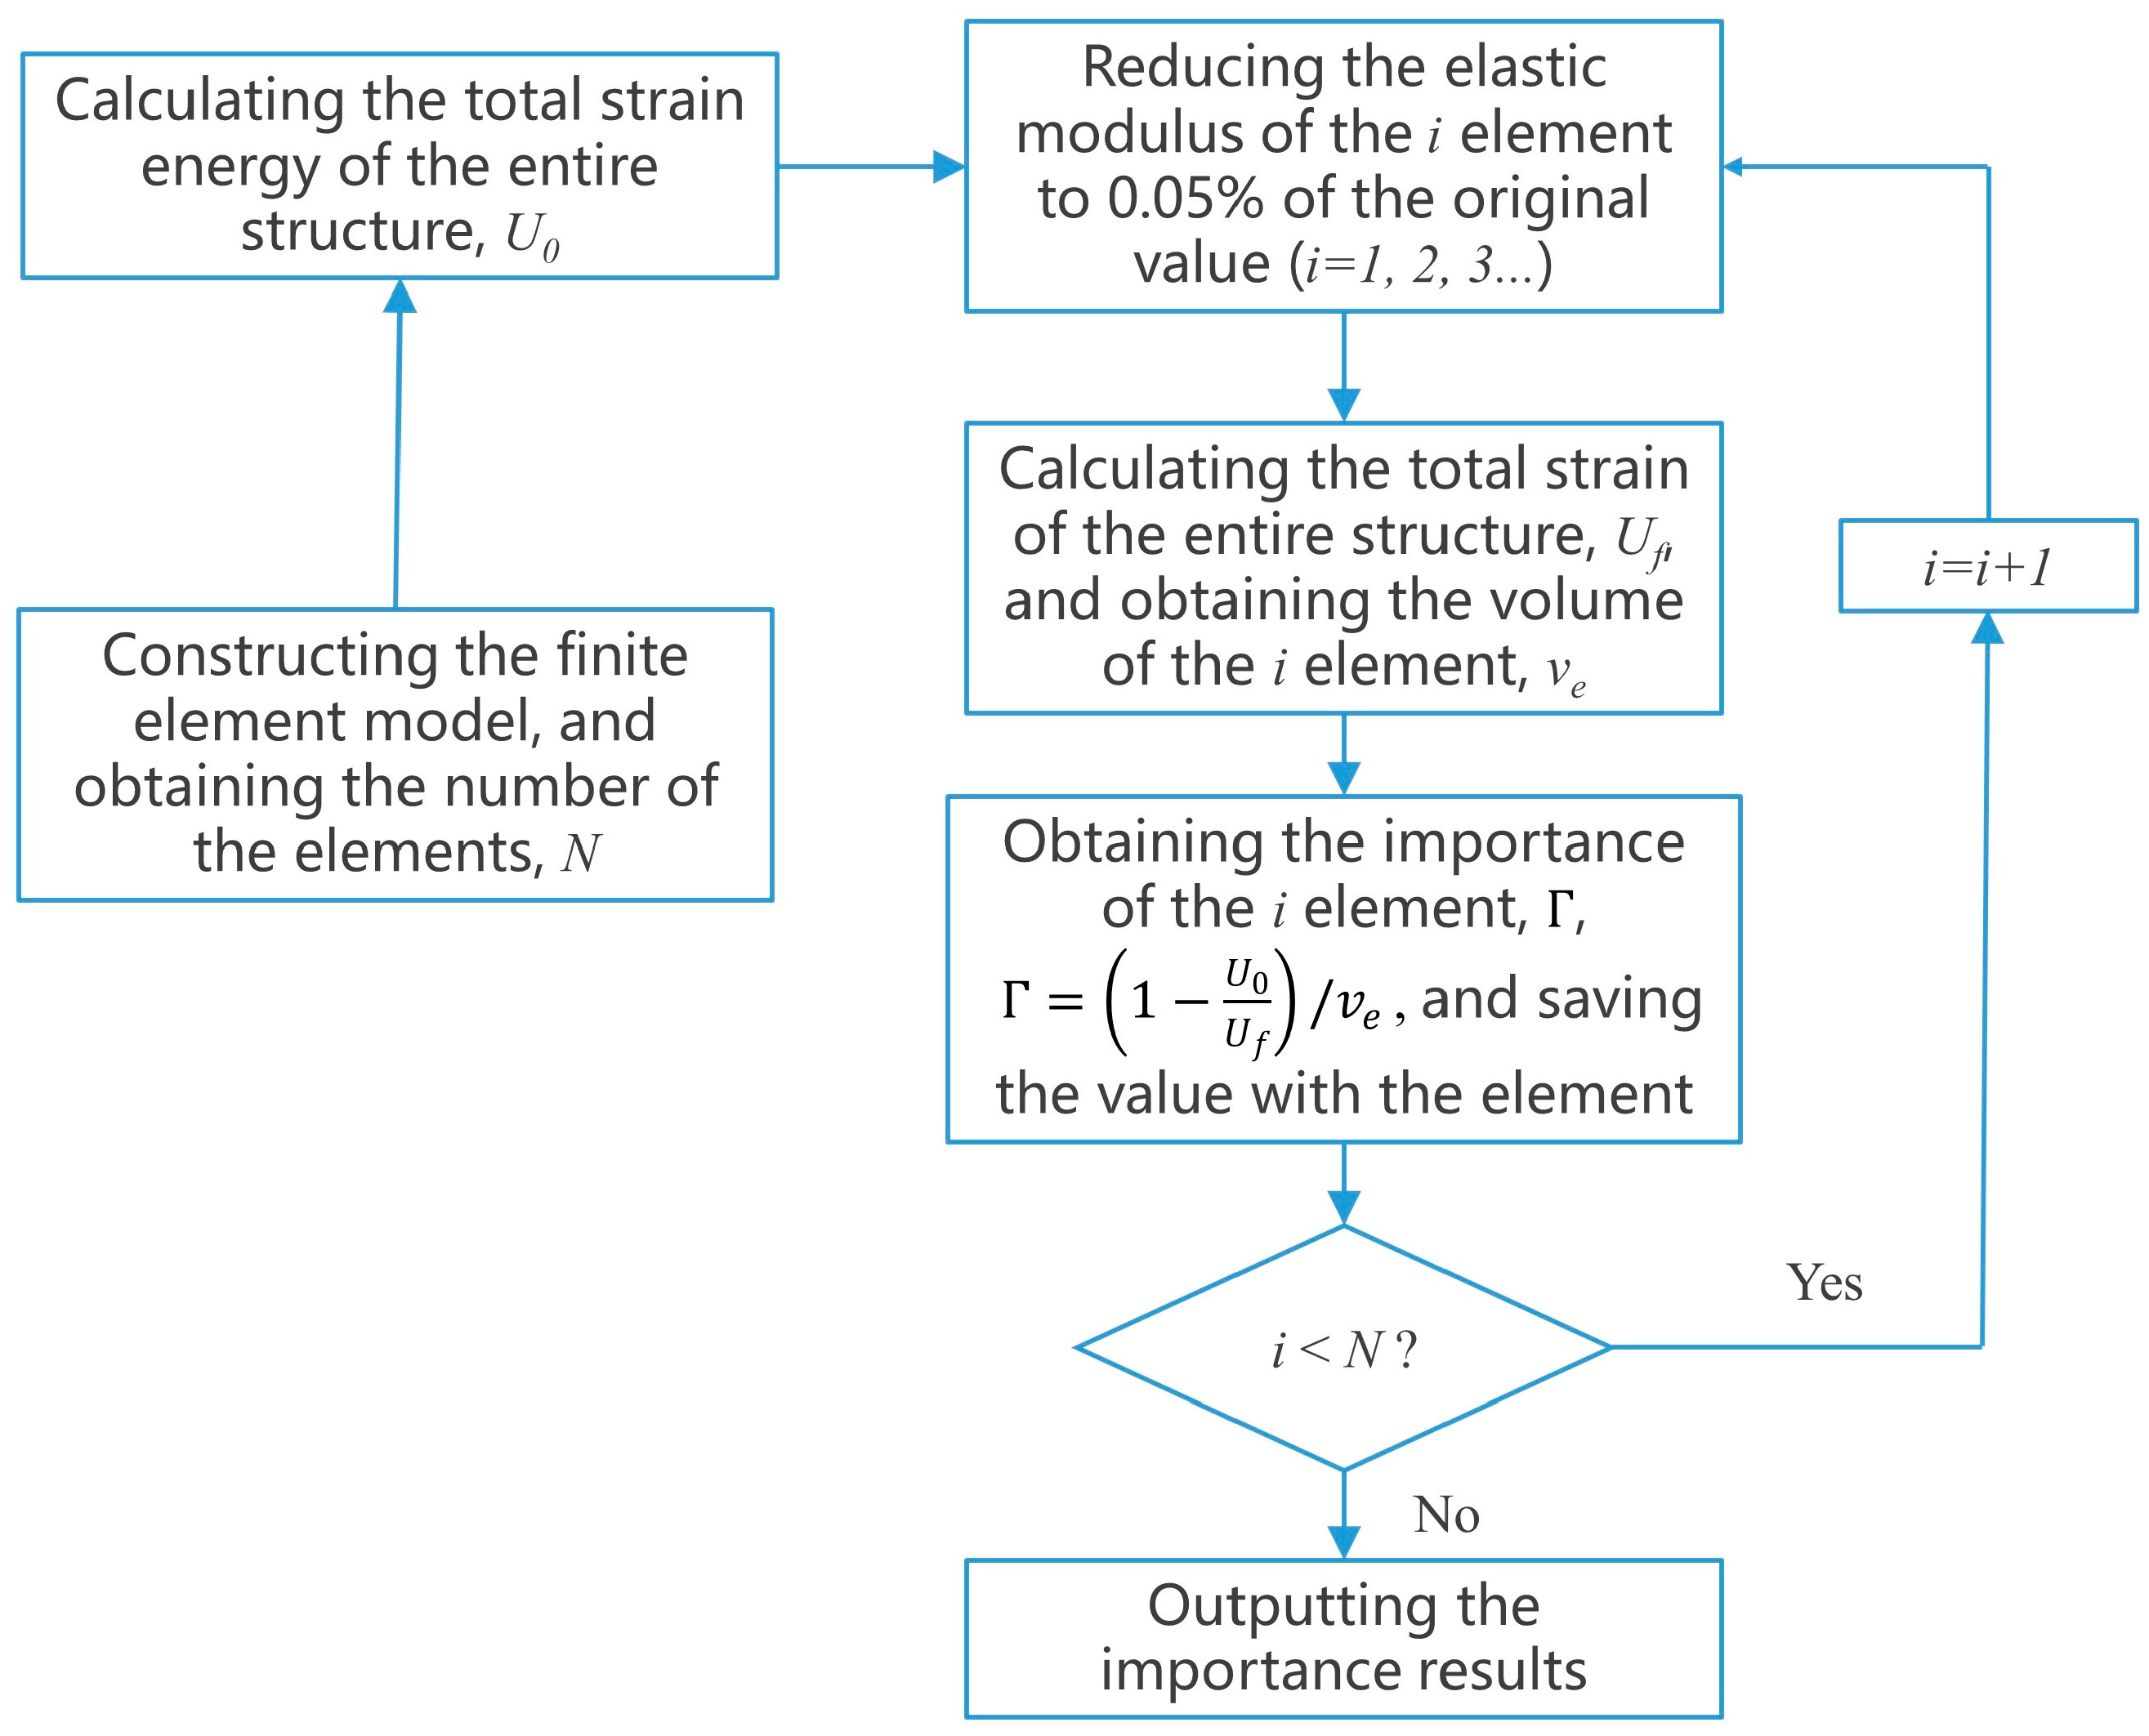
The calculation procedure is as follows: (i) constructing a finite element model of the structure according to the in-site investigation results, with the realistic cross-sectional dimensions of members and the tested material strength; (ii) calculating the total strain energy of the entire structure in the normal condition; (iii) reducing the elastic modulus of one element, and calculating the new value of total strain energy of the entire structure, obtaining the importance value of the element according to Equation (2); (iv) traveling the step (iii) to obtain the importance value for each element of the model. Figure 2 illustrates the computation procedure in detail.
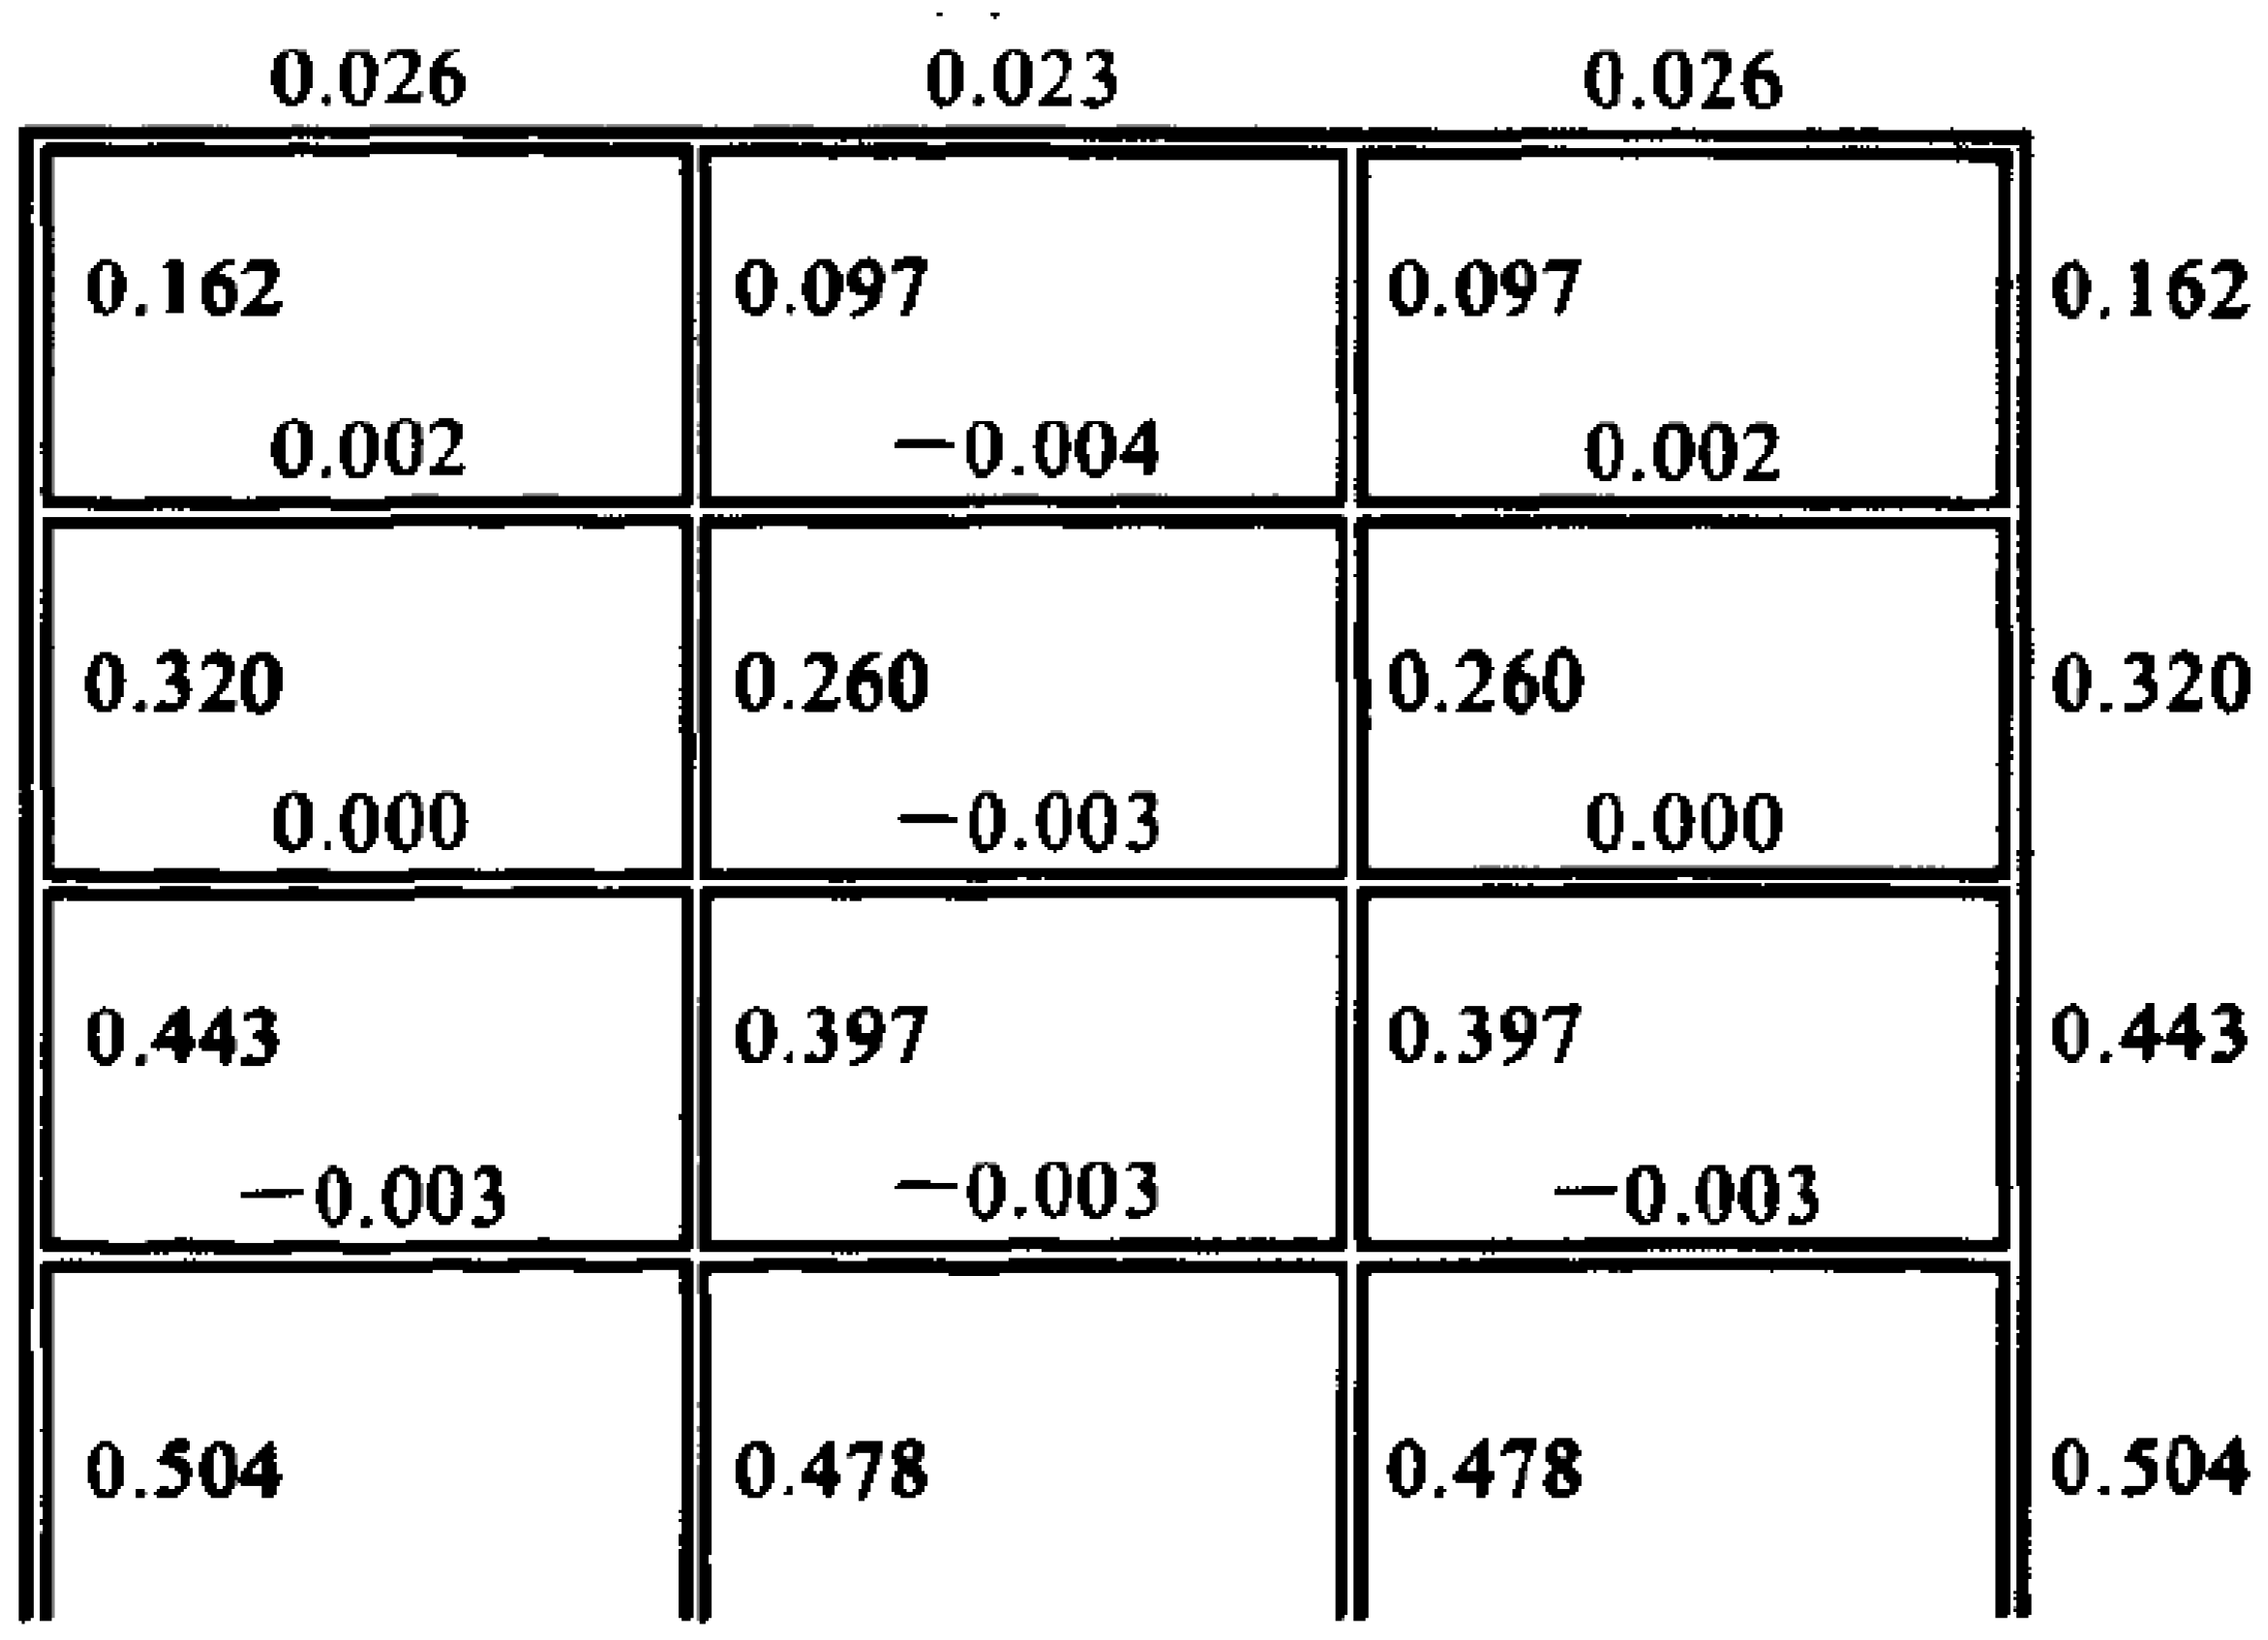
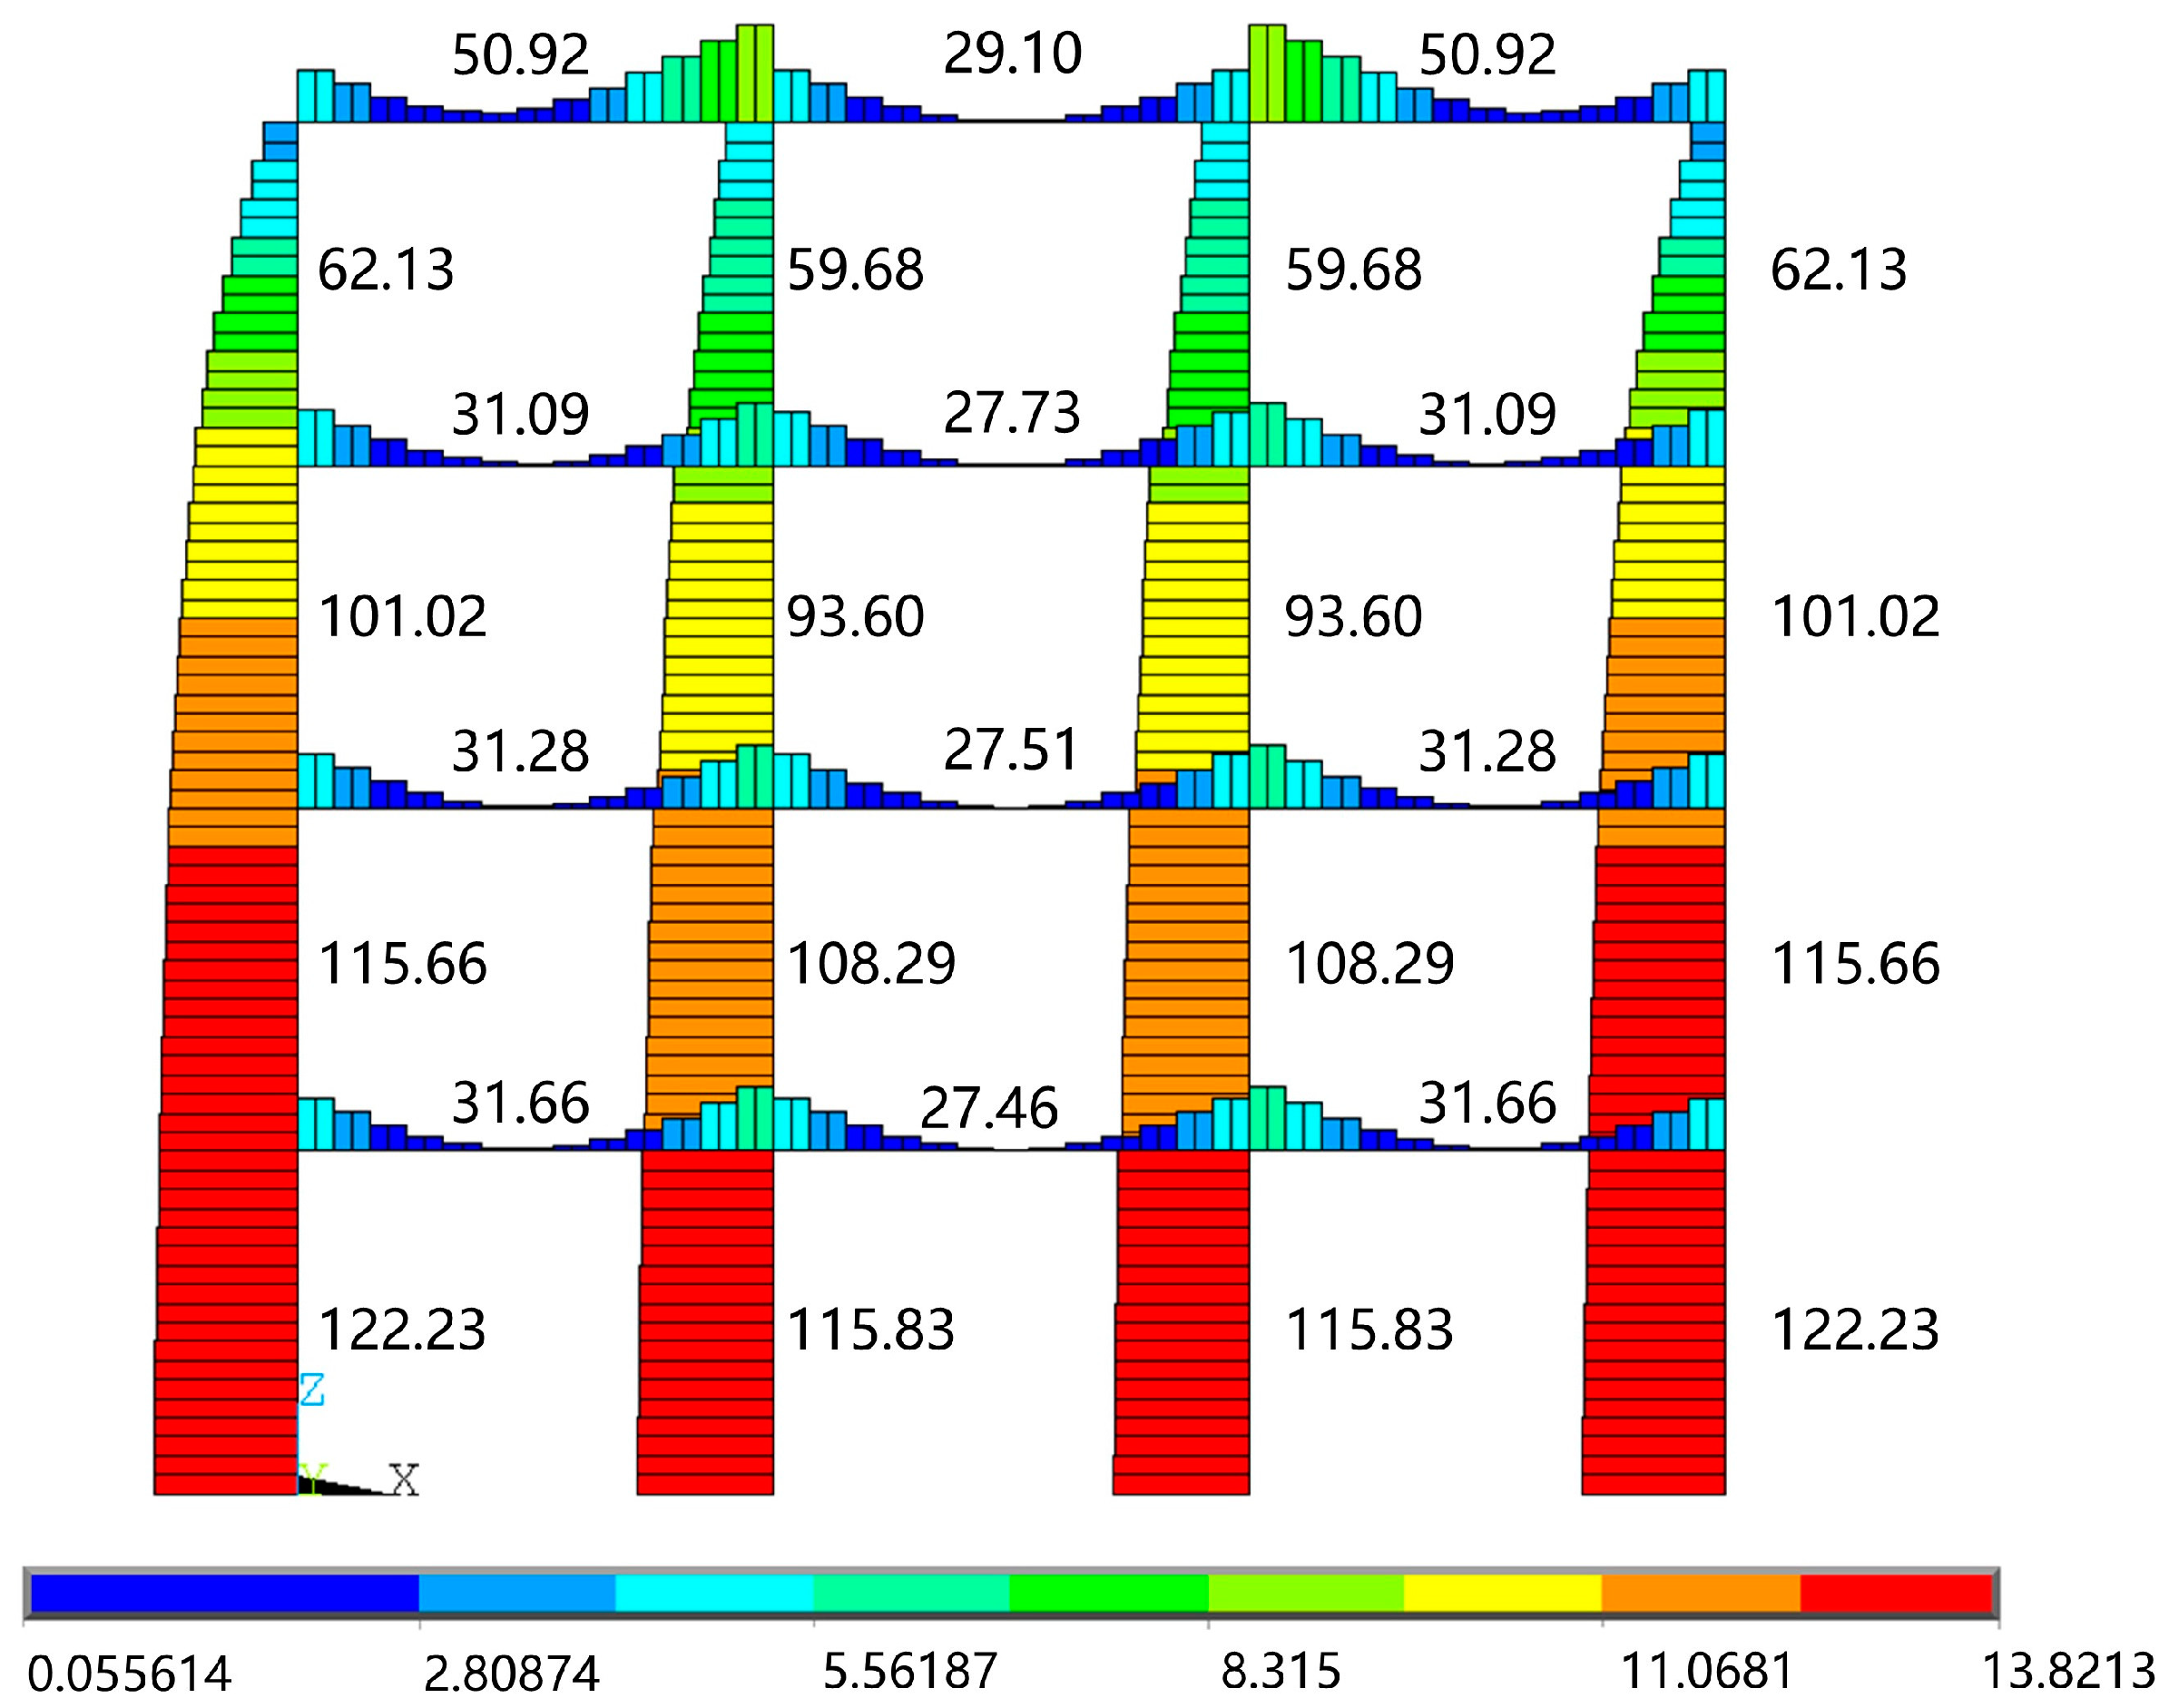
Figure 3 presents a calculation example from the study performed by Ye et al. [29], while Figure 4 illustrates the results from the finite element method used in the current study. It is obviously shown in Figure 4 that negative importance values (in Figure 3) can be eliminated through the method of reducing elastic modulus based on the finite element model. With the exception of the corresponding components in Figure 3 with negative importance values, all of the components in Figure 4 coincide with the computation results in Figure 3. The order of importance of the elements in such a row of frame structures is as follows: the column members are more important than the beam members, while the bottom column members are more important than the upper column members. Besides, within the same structural layer, the importance of the outer column member is slightly larger than the inner column member. The obtained results also coincide with the conclusions of the relevant published studies [29,30]. The columns are commonly more important than the beams because the columns are vertical members which bear the loads from beams and pass loads down to the foundations. The bottom columns are more important than the upper columns, because that the loads borne by the bottom columns are from more members than those for the upper columns. For the importance of the side columns and the central columns, it is common that the central columns are more important, while for a row or two rows of the frame, the side columns could be more important because they can affect more members of the structure if they were removed. Thus, each building should be analyzed and calculated individually to avoid possible errors and inaccuracies from the experience. Overall, the analysis and comparison results can validate the accuracy and applicability of the elastic modulus reduction technique based on the finite element method.
In addition, the importance values in Figure 3 and Figure 4 should also be clarified. For the method from Ye et al. [29], they limited the importance value between [0, 1], that the effect of the structural component removed on the entire structure can be judged by the value directly. The importance value can indicate the importance of the component to the entire structure. Their study stated that the negative values can be considered as 0 to solve the confusion problem of negative values. However, the implication of the 0 value of a structural component is also a little bit confused. In that theory, 0 means that the structural component is no contribution to the entire structure, but each structural component is significant or even essential for a row of the frame structure; at least, it has significance as the bearing of loads on it. Besides, the importance value equal to 1 only existed theoretically. If the importance values of a structural component were 1, it means that the component possesses the whole strain energy or generalized stiffness of a structure, which is impossible. The proposed reducing elastic modulus method is based on the finite element model, and that volume of the element needs to be introduced into the equation, thus, the importance value cannot be controlled between [0, 1]. This causes the important values to only have comparative significance, rather than intrinsic significance. However, the proposed prediction method in this study only needs an importance order of the structural components to determine the critical components by comparison, which is introduced in the latter subsection. The use of a finite element model to calculate the component importance is more practical for the proposed durability method, meanwhile, it can also avoid the confusion of negative values caused by the removing component method.
3.3. The Ranks of the Components
The critical components are determined based on the results of the importance analysis results. Following the importance analysis, each element of the finite element model receives an importance value, and all elements can be ranked. An elevation index, , was introduced to describe the contribution of the element to the entire structure, which was defined as the element importance order percentage. For example, the elements that meet are Critical Element, which means that these elements are the top 5% among all elements according to the importance values ranking. The structural component consists of the Critical Elements is defined as Critical Component. The order that the structural components take according to the element order percentage consists of four basic levels: Critical Components, Important Components, Ordinary Components, and Secondary Components. The detailed ranking for the components is listed in Table 1.
The ranks of the components provide serious information about the elements of the structure in terms of engineering importance and have significant importance. To be more specific, the destruction of the Critical Components poses a great risk that can result in the collapse of the majority of the structure. Similarly, the destruction of the Important Components may cause the collapse of a large area for the entire structure with a relatively lower risk, while the destructions of the Ordinary Components cause the local collapse of the entire structure. With relatively lower impact than the other levels of the component ranks, the destruction of the Secondary Components may only affect themselves rather than the other linked structural components.
4. The Durability Prediction Calculation Methods for Square Rebar Components
GB/T 51,355 standard is widely used for durability assessment for both industrial buildings and civil buildings in China. As mentioned above, the durability prediction calculation methods for a single component from the civil building part of GB/T 51,355 were taken as a research base for the square rebar case. In the following subsections, the methods of GB/T 51,355 would be basically introduced, and then the dedicated calculation methods for the historical square rebar component would be presented.
4.1. The Time before Rebar Corrosion
The time elapsed before corrosion for rebar depends on the carbonization life of the concrete. The calculation method for the time before rebar corrosion provided by GB/T 51,355 standard is positively related to the cover depth, which can also be considered as the carbonization depth before rebar corrosion, and negatively to the carbonization-resistant ability of the concrete, and is called as carbonization coefficient, k. Since, in many cases, the rebar begins to corrode before or after the total carbonization of cover concrete, a carbonation residue parameter, x0, is induced to improve accuracy [18]. The calculation methods of GB/T 51,355 for the time before rebar corrosion are as follows:
where is the time before steel rebar corrosion (years); is the cover depth (mm); is the carbonation coefficient; is an influencing factor due to cover depth and carbonization; m is a local environmental factor;, , and , are respectively the location factor, the CO2 density factor, the construction factor and the working factor; RH is the environment humidity (%); is the averaged environment temperature (°C); is the estimated value of concrete compressive strength (MPa); is the measured carbonation depth (mm); is the time from the completion of the structure to the assessment.
Equation (3) defines the time before rebar corrosion, relating to the cover depth, carbonation residue parameter and carbonization coefficient. Equation (4) states the carbonation residue parameter is dependent on empirical factors and the carbonization coefficient. The GB/T 51,355 standard provides two calculation procedures for carbonation coefficient: Equation (5a) is an empirical equation from extensive experiments and tests, while Equation (5b) is the definition of the carbonation coefficient, which is more accurate than the empirical equation. However, Equation (5b) requires small-invasive tests on structures. Many historical buildings are forbidden to use any invasive test method. In addition, the small-invasive test method is sometimes inappropriate for some critical structural components; thus, Equation (5a) is necessary for some projects. Although the factors contributing to concrete carbonization are the same for the historical concrete and the current concrete, the carbonization-resistant ability due to quality of the cement, the mix proportion for the concrete, the curing condition for the concrete and some more are different. Therefore, the factors and form of the empirical equations should be the same, but the constant factor should not be the same so that the variable situations can be reflected. Thus, Equations (3) and (4) can be kept for the historical concrete component cases, while Equation (5a) can be corrected through an introduction of a correction constant factor. In this study, the carbonation coefficient calculated by the Equation (5b) is taken as the target value, and a correction constant factor is introduced into the Equation (5a) for the corrected equation of carbonization coefficient for the historical concrete structure. The corrected equation is shown in Equation (6a).
The data for correction constant factor is based on 12 historical concrete structures, including completion time of the structure, compressive strength of the concrete, thickness of concrete cover and measured carbonation depth. The details are listed in Table 2.
Considering the test data in Table 2, the correction constant can be obtained. Thus, the proposed calculation equation of carbonization coefficient for the historical concrete structure is as follows:
4.2. The Time from Corrosion Initiation to Concrete Cover Cracking
The time from corrosion initiation to concrete cover cracking depends on the critical corrosion depth of the reinforcement and the corrosion rate. The calculation equations of GB/T 51,355 are as follows:
where is the durability prediction life (years); is the time from corrosion initiation to concrete cover cracking (year); is the critical corrosion depth of rebar (mm); is the corrosion rate of rebar (mm/year); is the rebar location coefficient, and is the diameter of the round rebar section.
Equation (7) defines the durability prediction life of one component, while Equation (8) defines the time from corrosion initiation to concrete cover cracking as the critical corrosion depth of rebar divided by the corrosion rate of rebar. Equation (9) expresses that the corrosion rate of rebar is related to the environmental factors and concrete compressive strength, rather than the rebar itself. Only Equation (10) is directly affected by the rebar type in the calculation process. This is because the corrosion-induced cracking models are different for round rebar and square rebar [25]. Thus, Equations (7)~(9) can be kept for square rebar case, while only Equation (10) should be replaced by a dedicated study.
4.3. Corrosion-Induced Cover Cracking Experiments for Square Rebar Component
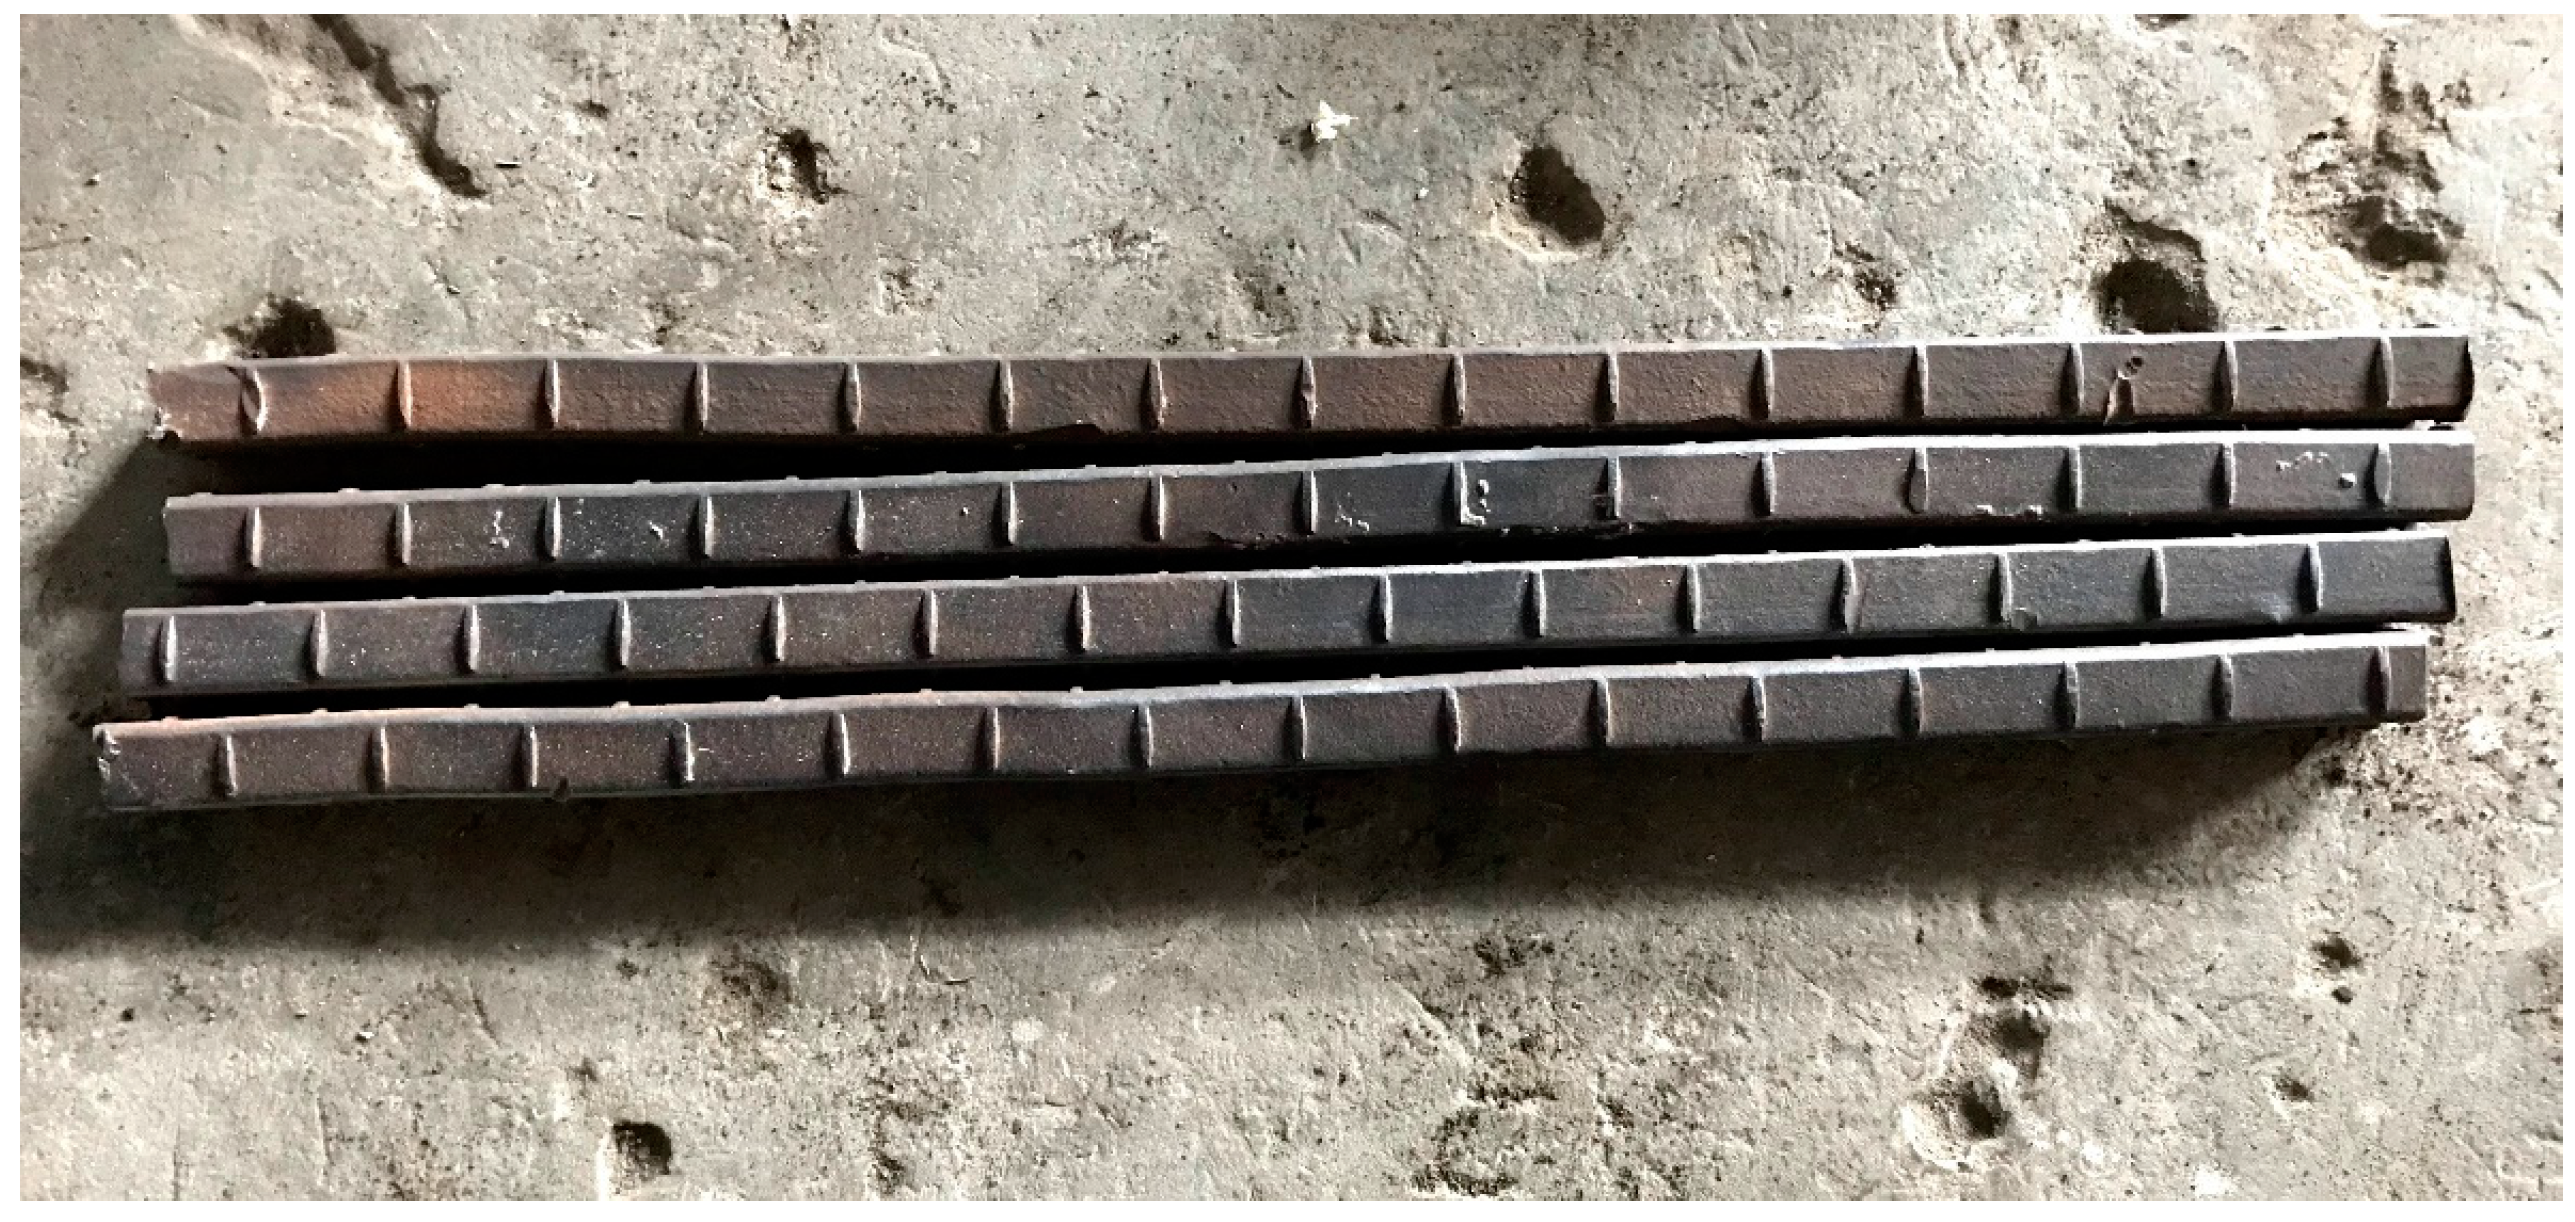
The corrosion induced cover cracking experiment was performed using accelerated square rebar corrosion, and the experiment included ten specimens. The experimental square rebars were collected from abandoned components of historical RC buildings in China, and the age of the experimental square rebars are comparable to the age of the analyzed structures. The rust of the square rebars was removed before the experiment. Figure 5 shows the vintage square rebars. Specimens with dimensions of 150 mm × 200 mm × 150 mm and their schematic drawings are shown in Figure 6. According to the historical literature [31,32,33], the ratios of content and volume were Cement:Sand:Stone (Coarse aggregate) = 1:2:4, and water accounted for 10~13% weight of all dry contents. The average compressive strength (three specimens) of the standard 150 mm cube was 15.6 MPa after 28 days of curing in the standard condition. The results obtained were qualified as the compressive strength of concrete in history [31,32,33]. The detailed information used in the experiment is listed in Table 2.
Many studies have adopted the electrochemical acceleration of rebar corrosion to obtain the critical corrosion depth of the rebar simultaneously when cover cracking occurs. The direct current was used to accelerate the corrosion of the square rebars, and the current value was 100 μA/cm2 [3,5,7]. The electrolyte solution consisted of a 5% NaCl solution [5,7], and half the height of the specimens was immersed in the solution upon the wooden heel blocks. After the electrical wires were welded on the reinforcement, the side surfaces and the external rebars were coated with approximately 2 mm epoxy resin. After the solidification of the epoxy resin and before the impression of the direct current, the test specimens were immersed in the solution for 72 h, to ensure that the specimens were in the wet state before electrification. Finally, testing was terminated when the width of the cover crack reached 0.1 mm [18]. The schematic diagram of accelerated electrochemical corrosion for steel rebars obtained from the experiment is shown in Figure 7.
4.4. Experimental Results
To verify that the GB/T 51,355 standard calculation equation is not suitable and accurate for the square rebar component, the test values and calculated values by the standard are shown in Table 3, and the table also provides three more calculated results from other equations based on experiments for round rebar components. Three other methods calculated in addition to Equation (10) are as follows.
Rodriguez et al. [2]:
Alonso et al. [3]:
Zhang [4]:
where is the characteristic value of concrete tensile strength, and is the characteristic value of concrete compressive strength.
It can be calculated from Table 3, that the average errors between test values and calculated values from Equations (10)~(13) are 29.3%, 69.9%, 65.7%, and 81.2%, separately. Based on the results, it is obvious that the calculation methods for the critical rust depth of round rebars are not accurate and applicable for the square rebars.
4.5. The Calculation Method of the Critical Corrosion Depth of Square Rebar
Concrete strength, the ratio of cover depth, and rebar diameter are seen as factors affecting the critical corrosion depth at the cover cracking time [2,3,4,18]. Therefore, these factors and the form of empirical equations were also used in this study. Based on the experimental data in Table 2, an empirical equation was obtained to calculate the critical corrosion depth of the square rebar by multiple linear regression. The calculation method is shown in Equation (14).
where is the width of the square rebar section (mm).
The decisive coefficient in the least square method is a statistical index reflecting the reliability of the change of dependent variables for the multiple linear regression results. Yu et al. [34] presented the decisive coefficients for the Equations (11) and (13), and both values were 0.645. However, the value of the decisive coefficient in the proposed equation was 0.738, which indicated that the collected two factors were highly related to the critical corrosion depth of the square rebar. Thereby, it can be concluded that the empirical equation is reliable and can meet the accuracy requirements of engineering applications. From Table 3, the average error between test values and calculated values from Equation (14) can be calculated, and the value is 8.42% (calculated by the absolute values of the error data), which is more accurate than the results from equations for round rebars, and the calculation accuracy of Equation (14) is acceptable for engineering application.
4.6. The Durability Prediction Calculation Methods for the Square Rebar Component
Considering the data from the above studies, the durability calculation method for the single square rebar reinforced concrete component consists of two parts: the time before rebar corrosion and the time from corrosion initiation to concrete cover cracking. The calculation method for the first part consists of Equations (3), (4) and (6b), while the calculation method for the second part consists of Equations (7)~(9) and (14). The durability prediction for a single component is the sum of the first part time and the second part time.
5. Applications of the Proposed Method
5.1. Two Typical Historical Square Rebar Reinforced Concrete Buildings
Two typical historical buildings were presented as the application cases in this section. Both of them were constructed between 1930 and 1940 and used square rebars. They are the target objects of this method. Besides, they both are of typical pseudo-classic style. The form of the Songfengge Building is a double-eave hip roof, and the form of the Main Hall of the Tomb of Yu is a double-eave saddle roof. Hip roof and saddle roof were two typical roof types for traditional Chinese timber buildings, and these two styles were very popular to be used on RC buildings for decades in China history. The structure arrangements of these types of RC buildings were not similar to the current common frame structure, especially for the roofs. Both of the structural designs and concrete techniques of these two buildings were representative of that historical period. Besides, many similar types of RC buildings also existed in other Asian countries. Component importance analysis for these two buildings can also serve as a reference for buildings of comparable characteristics found in Japan, Korea, and some Southeast Asian countries. The dimensions of the ground plan of the Songfengge Building are 38.5 m × 16.6 m, while the height of the building is 13.35 m. The data of the Main Hall of the Tomb of Yu are 24.0 m × 21.5 m and 17.67 m. The buildings are shown in Figure 8 and Figure 9.
5.2. Results of Component Importance Analysis of the Two Buildings
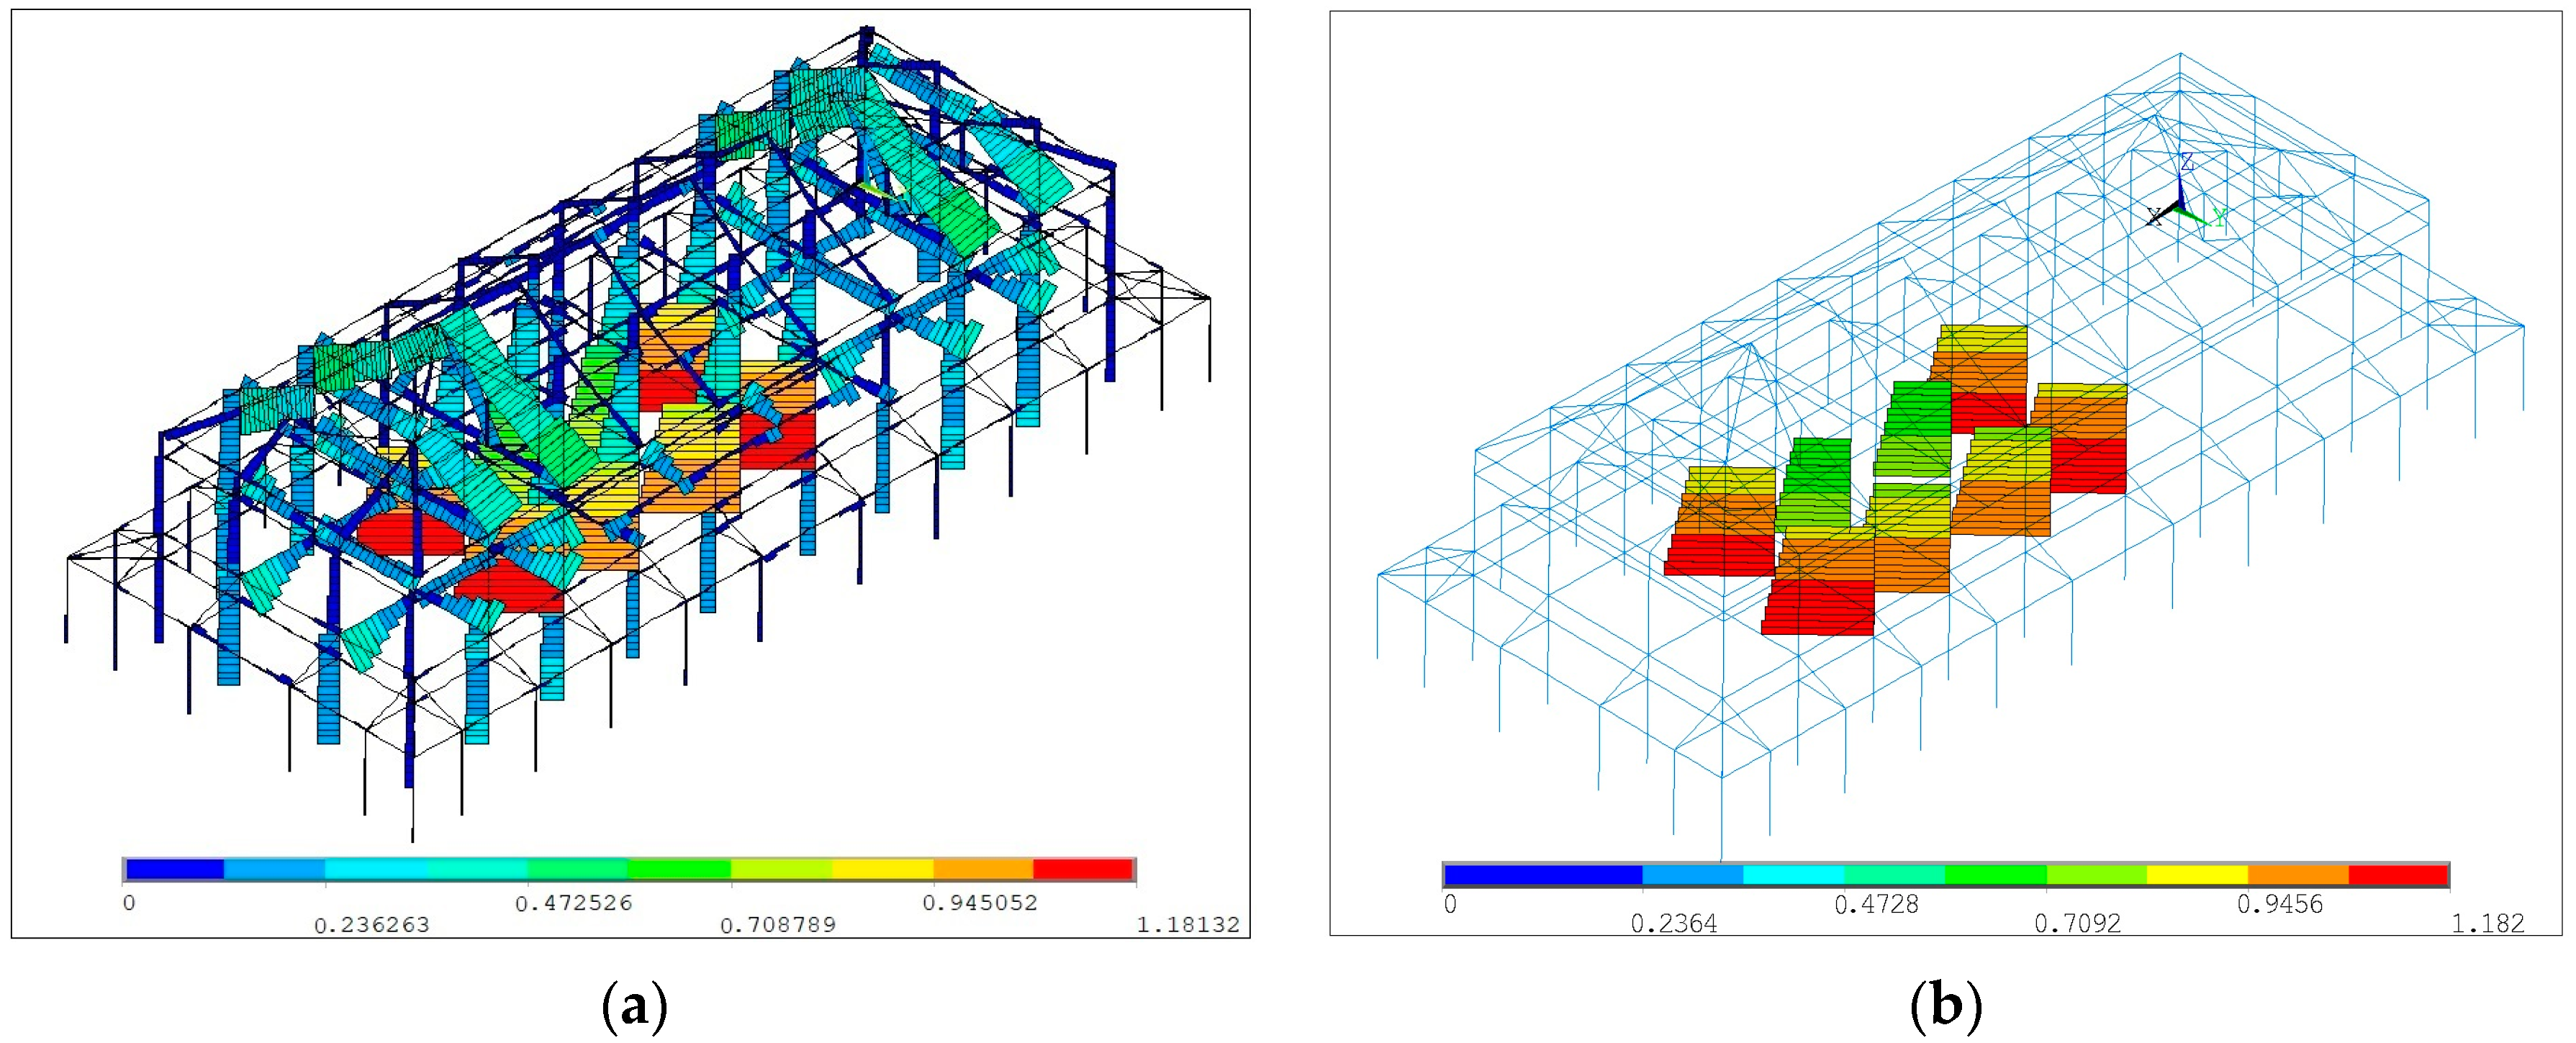
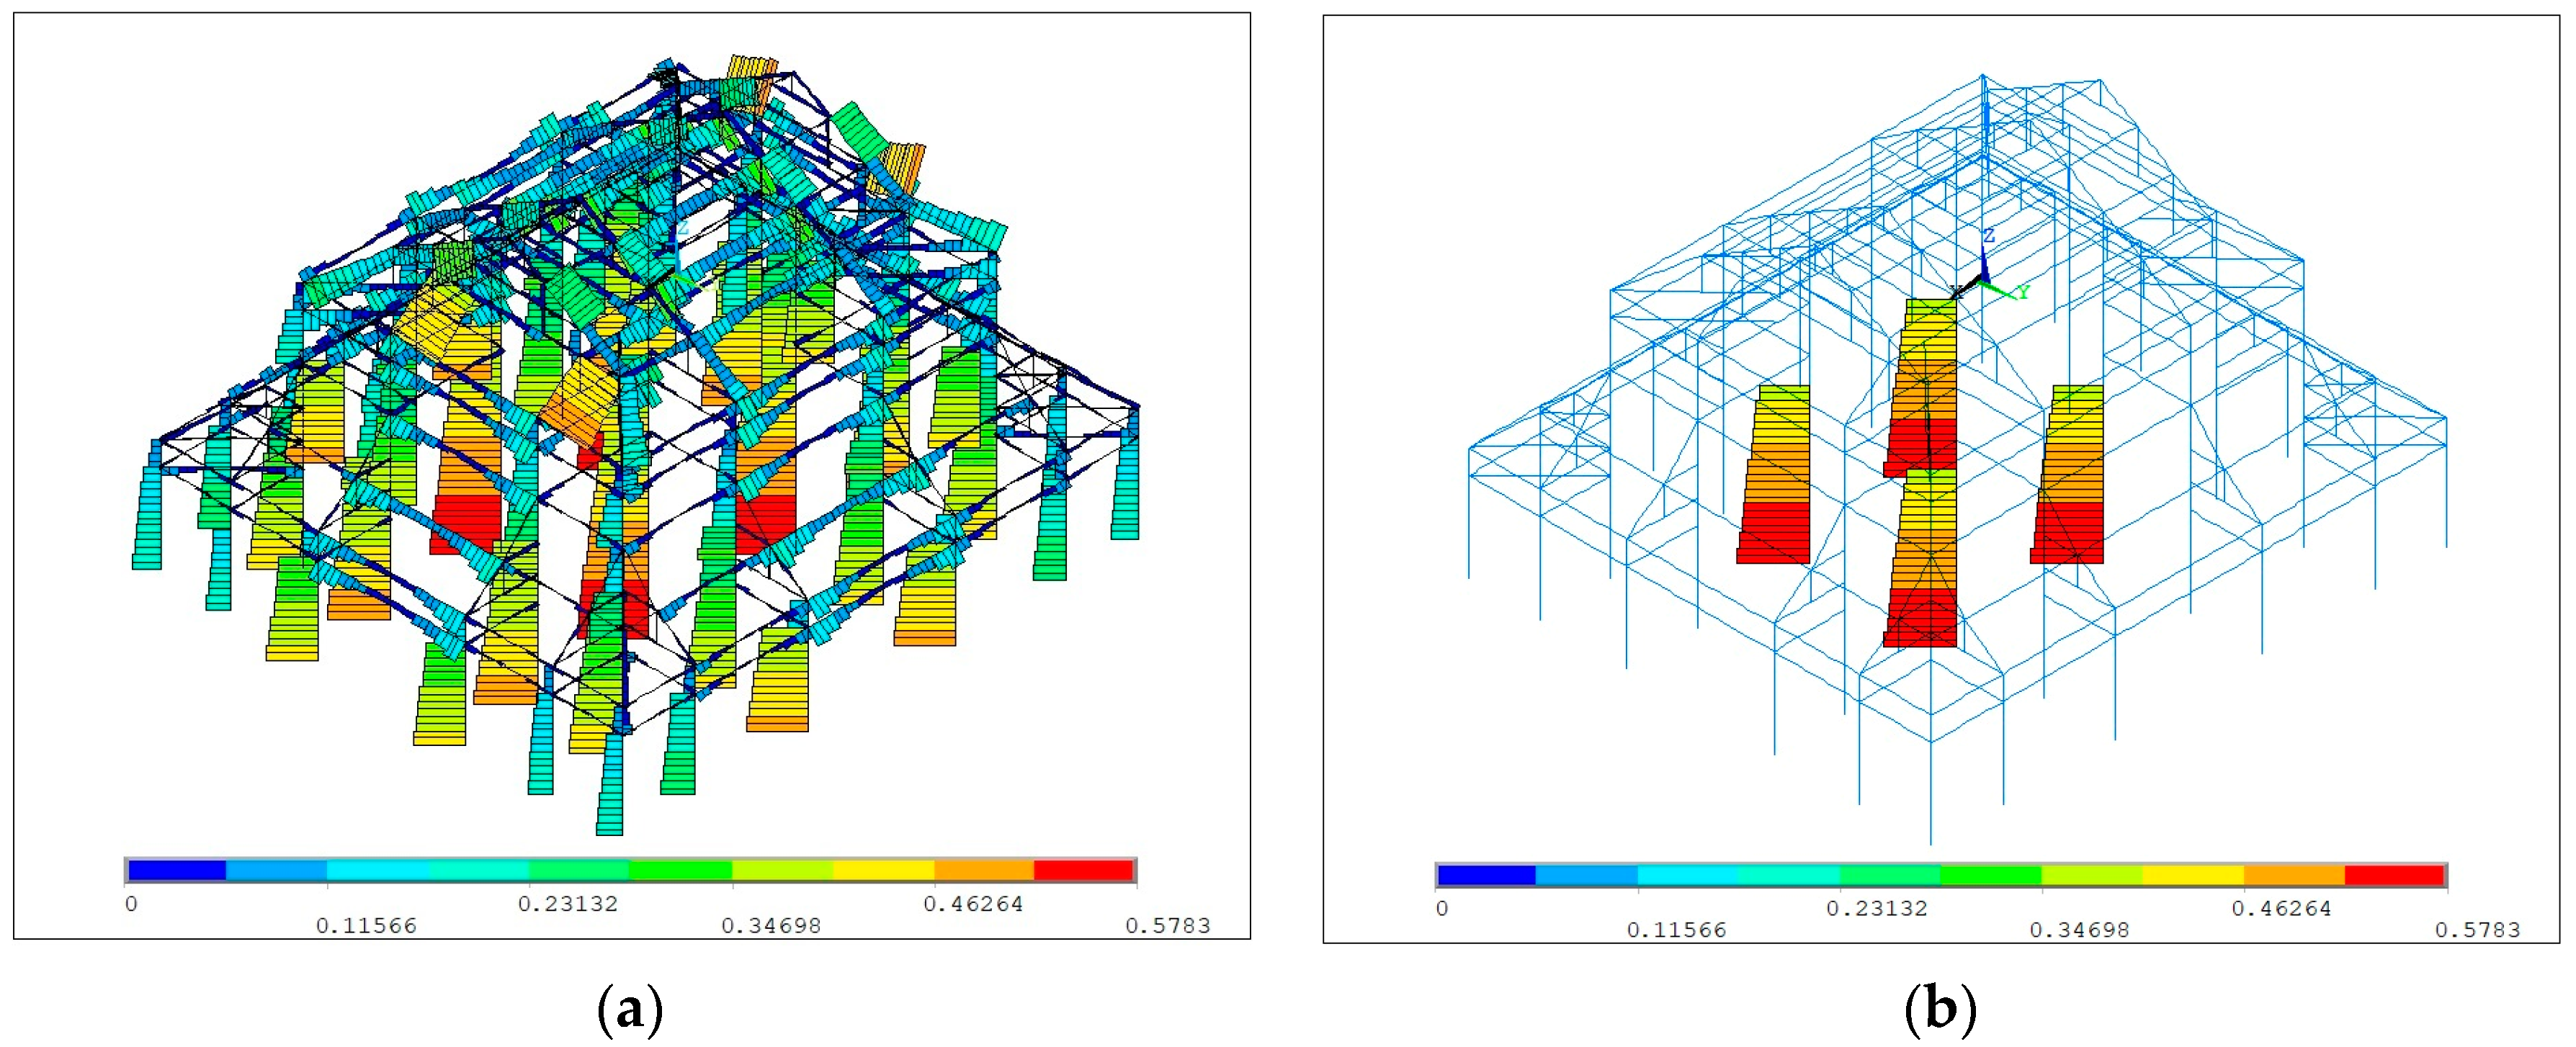
The calculations of the component importance analysis of the buildings were achieved by a commercial finite element software ANSYS (17.0). The information of models was from the in-situ investigation works, including the structural arrangements, sectional dimensions of the components, and strengths of the materials, etc. The results of component importance analysis for the buildings are illustrated in Figure 10 and Figure 11.
It is clear that for the two typical historical RC buildings, the Critical Components are the columns on the ground floors around the central area on the plan view. The results were obtained in line with the engineering experience. Accordingly for a building structure, often the columns on the ground are more important than beams and columns on higher stories, and the inner columns or middle columns as more distributed loads and interconnected components are more important than side columns [30]. Nevertheless, the structures of pseudo-traditional style roofs contribute differences on the structure from the common reinforced concrete frame structure. It can be noticed that the importance of some structural components of the roof structures ranks next to the critical columns for the Songfengge Building and the Main Hall of the Tomb of Yu, which are in the Important Component rank. Although they are not Critical Components, they should also be investigated carefully on-site, and in the subsequent works for loading capacity analysis and conservation design, they should all be given priority.
5.3. The Durability Prediction Results of the Two Buildings
According to the surrounding environments of the buildings and the working conditions of the critical components, the values of Kco2, Kkl, Kkt, Kks, RH, T, and Kcl can be determined [18], and correspondingly critical components’ concrete strength and the cover depth were measured especially. Subsequently, the durability prediction times of the two buildings were calculated respectively. The calculation methods of corrosion-induced cracking life for the single concrete component were compared with the calculation methods from GB/T 51,355 standard. The results from the different methods are listed in Table 4.
In terms of the total durability prediction for the single component, the results obtained using the proposed method were relatively close to the results from the China standard; yet, the Part 1 time and the Part 2 time were correspondingly different between these two calculation methods, respectively. As considering the compared results, the carbonization-resist ability of the historical concrete is weaker than the modern concrete. In contrast, for the time from corrosion initiation to concrete cracking, the square rebar components were longer than the round rebar components. The combinations of these two parts resulted in comparable outcomes from the two different calculation methods, which were coincidences. It should be noted that GB/T 51,355 is an inapplicable standard for square rebar components since it is based on experiments for round rebar components due to the calculation equation for the critical depth of corrosion of rebar and the material properties tests for modern concrete. The improvement of the proposed calculation method is not related only relatively more accuracy ensured than GB/T 51,355 for durability prediction, but also it depends on realistic tests for the historical concretes and the experiments for square rebar components. The following subsection will analyze the reliability and applicability of the proposed method.
5.4. The Reliability and Applicability of the Proposed Method
5.4.1. The Conservativeness of the Proposed Method
Overall, the proposed method is reasonable and conservative, as it considers the durability life of critical components to represent the durability life of the whole structure. The structural design theory, construction technology, materials properties, and some other engineering characters in history are not as mature as the current industry level, so this conservatism is realistic for engineering applications. A reasonably conservative durability prediction method is good for the conservation of historic buildings.
5.4.2. The Origin of the Proposed Calculation Methods for Single Component
The proposed calculation methods rely on the calculation methods of the China standard, with modifications and alterations. The predicted calculation theory and its influencing factors were confirmed by the works for the publication of the standard. The reliability of the standard has ensured the reliability of the proposed calculation methods. Moreover, the applicability has guaranteed by considering the corrected factor obtained from the historical concretes and a dedicated equation derived from square rebar experiments.
5.4.3. The Realistic Evaluations of the Two Cases
The authors conducted durability studies and structural analyses of these two buildings. In the light of the data obtained from the studies, the special conservation designs were presented. The main research results and engineering measures are as follows.
The Songfengge Building
The rest durability prediction of the Songfengge Building was more than 10 years. All of the concrete beam and column components of the structure were in a good condition, without an obvious durability problem. Except for some paint falling and local tile damage, there was no visible cracking on RC members to the building. Therefore, the authors presented a daily maintenance design for this building.
The Main Hall of the Tomb of Yu
The service time of the Main Hall of the Tomb of Yu had exceeded the durability prediction life of 2 years. Some concrete slabs showed signs of water seepage and rebar exposure. Long corrosion induced cracks and some concrete beam rebar were exposed in some beams and columns, including major important components and a critical component. The durability status of the building was in a poor condition. The authors presented the urgent conservation design for this building, and the slabs, beams, and columns were repaired or strengthened according to their different necessities.
According to the realistic engineering experience, it is thought that the durability prediction method proposed in this study can meet the accuracy and safety requirements of durability evaluation for engineering practice and application.
6. Conclusions
Square rebars were widely utilized for the RC buildings for decades in a period of history, and the majority of the buildings have been and will be still used due to their historical and cultural value; however, there has been no proper durability evaluation method for these historical square rebar RC buildings. In this study, a reliable and applicable durability prediction method for historical square rebar RC structures is proposed, which can solve the problem where the current standard cannot be used for the durability assessment work for historical square rebar reinforced concrete structures. Based on the comparison between the detailed durability assessment and prediction results of the real cases, it can be considered that the durability prediction result from the proposed method is close to the realistic status and can meet the requirements of engineering applications. The durability prediction method mainly consists of four steps: (i) in-situ investigation, (ii) finite element model simulation, (iii) component importance analysis, and (iv) structural durability prediction. It can be succinctly described as adopting the durability life of the critical components to stand for the durability of the entire historical building, and the critical components are obtained by importance ranking. The novelties and applicability of the proposed method are based on the utilization of structural component importance analysis and the dedicated tests and experiments for historical concretes and square rebar. It should be also noted that being an adaptable model for different needs is of great importance in terms of the prevalence of use, especially for the historical buildings.
Author Contributions
Conceptualization and methodology, Q.C. and H.J.; Software, formal analysis, H.J., C.Z. and Y.H. Investigation, writing—original draft preparation, and visualization, H.J.; Resources, validation, data curation, writing—review and editing, supervision, project administration, and funding acquisition, Q.C. All authors have read and agreed to the published version of the manuscript.
Funding
This research was funded by Jiangsu Provincial Key Research and Development Program, BE2017717, and Jiangsu Province Cultural Relics Research Program, 2017SK02.
Data Availability Statement
The data, models, and code generated contributing to the conclusions in this study appear in the submitted article; and some or all data, models, or code generated or used during the study are available from the corresponding author by request.
Acknowledgments
Thanks Yang Hongbo and Zhang Shiqi for taking part in the in-situ investigation works of the Songfengge Building. Thanks Cai Chenning for providing advices for the experiments.
Conflicts of Interest
The authors declare no conflict of interest.
References
- Bazant, Z.P. Physical model for steel corrosion in concrete sea structures—Theory. J. Struct. Div. ASCE 1979, 105, 1137–1153. [Google Scholar] [CrossRef]
- Rodriguez, J.; Ortega, L.M.; Casal, J.; Diez, J.M. Corrosion of reinforcement and service life of concrete structures. In Proceedings of the 7th International Conference on Durability of Building Materials and Components, London, UK, 30 May–3 June 1996; pp. 117–126. [Google Scholar]
- Alonso, C.; Andrade, C.; Rodriguez, J.; Diez, J.M. Factors controlling cracking of concrete affected by reinforcement corrosion. Mater. Struct. 1998, 31, 435–441. [Google Scholar] [CrossRef]
- Zhang, W. Corrosion Damage Prediction and Durability Evaluation of Reinforced Concrete Structures. Ph.D. Thesis, Tongji University, Shanghai, China, 1999. [Google Scholar]
- Vu, K.; Stewart, M.G.; Mullard, J. Corrosion-induced cracking: Experimental data and predictive models. ACI Struct. J. 2005, 102, 719–726. [Google Scholar]
- El Maaddawy, T.; Soudki, K. A model for prediction of time from corrosion initiation to corrosion cracking. Cem. Concr. Compos. 2007, 29, 168–175. [Google Scholar] [CrossRef]
- Lu, C.; Jin, W.; Liu, R. Reinforcement corrosion-induced cover cracking and its time prediction for reinforced concrete structures. Corros. Sci. 2011, 53, 1337–1347. [Google Scholar] [CrossRef]
- Stambaugh, N.D.; Bergman, T.L.; Srubar, W.V. Numerical service-life modeling of chloride-induced corrosion in recycled-aggregate concrete. Constr. Build. Mater. 2018, 161, 236–245. [Google Scholar] [CrossRef]
- Wang, P.; Qiao, H.; Chen, K.; Li, Y.; Feng, Q. Life prediction and long-term durability of coated steel bars in magnesium oxychloride concrete. KSCE J. Civ. Eng. 2020, 24, 2120–2131. [Google Scholar] [CrossRef]
- Liang, Y.; Wang, L. Prediction of corrosion-induced cracking of concrete cover: A critical review for thick-walled cylinder models. Ocean Eng. 2020, 213, 107688. [Google Scholar] [CrossRef]
- European Committee for Standardization. EN 1992-1-1: 2004 Eurocode 2: Design of Concrete Structures—Part 1-1: General Rules and Rules for Buildings; European Committee for Standardization: Brussels, Belgium, 2004. [Google Scholar]
- American Concrete Institute. ACI 318-08: Building Code Requirements for Structural Concrete; American Concrete Institute: Farmington Hills, MI, USA, 2008. [Google Scholar]
- Ministry of Housing and Urban-Rural Development of the People’s Republic of China. Code for Design of Concrete Structures GB 50010-2010; Ministry of Housing and Urban-Rural Development of the People’s Republic of China: Beijing, China, 2015.
- Du, Y. Engineering budget (17). Buil. Mon. Mag. 1934, 2, 48–51. [Google Scholar]
- Lee, H.E. Engineers’ Pocketbook of Reinforced Concrete; Myron, C., Ed.; Clark Publishing: London, UK, 1915. [Google Scholar]
- Alexander, N. Structural Renovation of Buildings: Methods, Details, & Design Examples; McGraw-Hill Professional: New York, NY, USA, 2000. [Google Scholar]
- Meinheit, D.F.; Felder, A.L. Vintage Steel Reinforcement in Concrete Structures; Concrete Reinforcing Steel Institute: Schaumburg, IL, USA, 2014. [Google Scholar]
- Ministry of Housing and Urban-Rural Development of the People’s Republic of China. Standard for Durability Assessment of Existing Concrete Structures; Ministry of Housing and Urban-Rural Development of the People’s Republic of China: Beijing, China, 2019.
- ACI Committee 408. ACI 408R-03: Bond and Development of Straight Reinforcing Bars in Tension; American Concrete Institute: Farmington Hills, MI, USA, 2003. [Google Scholar]
- Ministry of Housing and Urban-Rural Development of the People’s Republic of China. Concrete Structure Design Standard GB/J 10-89; China Architecture Publishing & Media Co., Ltd.: Beijing, China, 1989. [Google Scholar]
- Ministry of Housing and Urban-Rural Development of the People’s Republic of China. Standard for Design of Concrete Structures Durability GB/T 50476; China Architecture Publishing & Media Co., Ltd.: Beijing, China, 2019. [Google Scholar]
- Chun, Q.; Pan, J. Research on structural configuration design of chinese modern reinforced concrete buildings. China Cul. Herit. Sci. Res. 2015, 2, 85–90. [Google Scholar] [CrossRef]
- Chun, Q.; Van Balen, K.; Han, Y. Comparison study on calculation methods of bending behavior of Chinese reinforced concrete beams from 1912 to 1949. J. Southeast Univ. 2015, 31, 529–534. [Google Scholar] [CrossRef]
- Zhang, C.; Chun, Q.; Jin, H.; Zhang, S.; Lin, Y. Experimental and numerical research on the bond-slip behavior of square-rebar reinforced concrete during the republic of China (1912–1949). Struct. Concr. 2020, 23, 871–893. [Google Scholar] [CrossRef]
- Dong, Y.; Chun, Q.; Xu, X.; Wang, J.; Huang, S. Critical corrosion depth of rebar of Republican Period reinforced concrete structures. J. Zhejiang Univ. 2017, 51, 27–37. [Google Scholar] [CrossRef]
- Chun, Q.; Van Balen, K.; Pan, J. Experimental research on physical and mechanical performance of steel rebars in Chinese modern reinforced concrete buildings built during the Republic of China era from 1912 to 1949. Mater. Struct. 2015, 49, 3679–3692. [Google Scholar] [CrossRef]
- Chun, Q.; Balen, K.V.; Han, Y. Comparative studies on calculation methods of shear behavior of reinforced concrete beams of Chinese modern reinforced concrete buildings. J. Harbin Inst. Technol. 2016, 23, 1–8. [Google Scholar] [CrossRef]
- Zhang, C.; Chun, Q.; Lin, Y.; Jin, H.; Wang, Y. Experimental and theoretical analysis for the shear capacity of the square rebar reinforced concrete beams during the period of the Republic of China (1912–1949). Eur. J. Environ. Civ. Eng. 2021, 1–40. [Google Scholar] [CrossRef]
- Ye, L.; Lin, X.; Qu, Z.; Lu, X.; Peng, P. Evaluating method of element importance of structural system based on general ized structural stiffness. J. Archit. Civ. Eng. 2010, 27, 1–6. [Google Scholar] [CrossRef]
- Zhu, L.; Wang, N.; Jun, D. Evaluation on element importance based on objective weighting method. J. Archit. Civ. Eng. 2015, 32, 46–52. [Google Scholar] [CrossRef]
- Zhao, F. Reinforced Concrete Structure; China Engineers Association: Shanghai, China, 1935. [Google Scholar]
- Chen, Z. Simplified Reinforced Concrete Structure; World Bookstore: Shanghai, China, 1936. [Google Scholar]
- Zhang, J. Simplified Reinforced Concrete Design Method; World Bookstore: Shanghai, China, 1944. [Google Scholar]
- Yu, M.; Li, S.; Zhang, S.; Qiang, N. Model for calcualting the steel corrosion depth based on crack width. Concrete 2014, 301, 13. [Google Scholar] [CrossRef]
Figure 1.
The procedures of the durability prediction method for historical RC buildings.

Figure 2.
The procedure of the structural component importance analysis.

Figure 3.
The results of the importance analysis of a row of the frame structure, which was calculated by the removing component method according to Equation (1) as mentioned above.
Figure 3.
The results of the importance analysis of a row of the frame structure, which was calculated by the removing component method according to Equation (1) as mentioned above.

Figure 4.
The results of the importance analysis of the frame by finite element method, which were calculated according to the procedure illustrated in Figure 2 above.
Figure 4.
The results of the importance analysis of the frame by finite element method, which were calculated according to the procedure illustrated in Figure 2 above.

Figure 5.
The vintage square rebars.

Figure 6.
Dimension of the specimen.

Figure 7.
Schematic diagram of electrochemical accelerated corrosion test using the method of the parallel circuit.
Figure 7.
Schematic diagram of electrochemical accelerated corrosion test using the method of the parallel circuit.

Figure 8.
The picture of the Songfengge Building.

Figure 9.
The picture of the Main Hall of the Tomb of Yu.

Figure 10.
(a) The results of component importance analysis for the Songfengge Building; (b) the critical components of the Songfengge Building.
Figure 10.
(a) The results of component importance analysis for the Songfengge Building; (b) the critical components of the Songfengge Building.

Figure 11.
(a) The results of component importance analysis for the Main Hall of the Tomb of Yu; (b) the critical components of the Main Hall of the Tomb of Yu.
Figure 11.
(a) The results of component importance analysis for the Main Hall of the Tomb of Yu; (b) the critical components of the Main Hall of the Tomb of Yu.


Table 1.
The importance ranking of the structural components.
| Element Ranking Percentage | ||||
|---|---|---|---|---|
| Component ranks | Critical Components | Important Components | Ordinary Components | Secondary Components |
Table 2.
The measured concrete material properties of some typical historical square rebar reinforced concrete buildings.
Table 2.
The measured concrete material properties of some typical historical square rebar reinforced concrete buildings.
| 1 Cases | Items | |||||
|---|---|---|---|---|---|---|
| 2 Concrete Average Compressive Strength/MPa | 2 Average Thickness of Concrete Cover/mm | 2 Concrete Average Measured Carbonation Depth/mm | ||||
| Column | Beam | Column | Beam | Column | Beam | |
| Main Hall of the Tomb of Yu (1933) | 15.7 | 15.4 | 40 | 41 | 33 | 40 |
| No.1 Building of Zhongshan East Road (1935) | 12.4 | 11.7 | 34 | 27 | 62 | 65 |
| Dahua Cinema (1931) | 15.6 | 17.8 | 33 | 34 | 63 | 40 |
| Dacheng Factory (1935) | 17.0 | 22.9 | 35 | 34 | 45 | 40 |
| Main Hall of Nanjing Museum (1937) | 18.0 | 23.2 | 34 | 35 | 43 | 49 |
| Huangpu Hall of Jiangsu Conference Center (1931) | 14.7 | 17.6 | 35 | 33 | 45 | 54 |
| Former site of overseas Chinese Hostel (1933) | 16.5 | 14.8 | 30 | 28 | 58 | 62 |
| Lingyuan Post Office (1947) | 14.0 | 17.4 | 40 | 38 | 55 | 45 |
| Former site of National Art Museum (1925) | 14.4 | 17.1 | 35 | 33 | 60 | 71 |
| Former site of the Ordnance Special School of the National Revolutionary Army (1932) | - | 17.2 | - | 25 | - | 55 |
| Former site of Young Men’s Christian Association (1946) | 10.4 | - | 38 | - | 47 | - |
| Former site of Central Radio Equipment Co., Ltd. (1946) | - | 12.2 | - | 32 | - | 40 |
1 The figure in bracket is the time of the completion of the building. 2 Each of the average data was obtained by testing 6~10 structural components, for both beam and column cases respectively.
Table 3.
Parameters of the specimens and test results.
| Specimen | 1 /mm | c /mm | Crack Width /mm | Critical Corrosion Depth/mm | |||||||||||
|---|---|---|---|---|---|---|---|---|---|---|---|---|---|---|---|
| Test Value | 2 Equation (10) | 2 Equation (11) | 2 Equation (12) | 2 Equation (13) | Equation (14) | ||||||||||
| Value | 3 Error/% | Value | 3 Error/% | Value | 3 Error/% | Value | 3 Error/% | Value | 3 Error/% | ||||||
| A1 | 16 | 36 | 14.7 | 0.1 | 0.0642 | 0.0573 | −10.6 | 0.0260 | −59.5 | 0.0285 | −55.6 | 0.0159 | −75.2 | 0.08552 | 33.26 |
| A2 | 16 | 38 | 14.9 | 0.1 | 0.0900 | 0.0590 | −34.4 | 0.0264 | −70.6 | 0.0297 | −67.0 | 0.0170 | −81.1 | 0.09084 | 0.98 |
| A3 | 16 | 40 | 15.6 | 0.1 | 0.1093 | 0.0611 | −44.1 | 0.0256 | −76.6 | 0.0308 | −71.8 | 0.0182 | −83.3 | 0.09677 | −11.47 |
| A4 | 16 | 42 | 15.8 | 0.1 | 0.0951 | 0.0628 | −34.0 | 0.0261 | −72.6 | 0.0320 | −66.3 | 0.0193 | −79.7 | 0.10210 | 7.42 |
| A5 | 16 | 44 | 15.2 | 0.1 | 0.1134 | 0.0638 | −43.8 | 0.0285 | −74.9 | 0.0332 | −70.8 | 0.0201 | −82.3 | 0.10647 | −6.12 |
| B1 | 22 | 36 | 14.3 | 0.1 | 0.0639 | 0.0496 | −22.3 | 0.0225 | −64.8 | 0.0228 | −64.3 | 0.0109 | −83.0 | 0.06006 | −5.96 |
| B2 | 22 | 38 | 14.8 | 0.1 | 0.0652 | 0.0512 | −21.6 | 0.0219 | −66.5 | 0.0236 | −63.8 | 0.0118 | −82.0 | 0.06436 | −1.33 |
| B3 | 22 | 40 | 15.6 | 0.1 | 0.0673 | 0.0529 | −21.4 | 0.0206 | −69.4 | 0.0245 | −63.6 | 0.0128 | −81.0 | 0.06902 | 2.56 |
| B4 | 22 | 42 | 16.2 | 0.1 | 0.0715 | 0.0545 | −23.8 | 0.0198 | −72.3 | 0.0253 | −64.6 | 0.0137 | −80.8 | 0.07344 | 2.70 |
| B5 | 22 | 44 | 14.7 | 0.1 | 0.0860 | 0.0543 | −36.8 | 0.0241 | −71.9 | 0.0262 | −69.6 | 0.0139 | −83.8 | 0.07534 | −12.41 |
1 is the width of the square rebar section. 2 For the comparisons, the section width of the square rebar, , is taken as d to substitute into Equations (10)–(13). 3 Error = (calculated value − test value)/test value × 100%.
Table 4.
The predicted durability lives from different calculation methods for the two buildings.
| Names | Durability Assessment Time/Years | c /mm | fcu,e /MPa | /mm | Durability Prediction by GB/T 51,355/Years | Durability Prediction by the Proposed Method/Years | ||||
|---|---|---|---|---|---|---|---|---|---|---|
| * Part 1 | * Part 2 | Total | * Part 1 | * Part 2 | Total | |||||
| Songfengge Building | 86 | 34 | 22.5 | 24 | 47 | 53 | 100 | 43 | 60 | 103 |
| Main Hall of the Tomb of Yu | 78 | 40 | 15.7 | 25 | 49 | 25 | 74 | 46 | 30 | 76 |
* Part 1 and Part 2 corresponded to the time before rebar corrosion and the time from corrosion initiation to concrete cover cracking in Section 4.1 and Section 4.2, respectively.
Publisher’s Note: MDPI stays neutral with regard to jurisdictional claims in published maps and institutional affiliations. |
© 2021 by the authors. Licensee MDPI, Basel, Switzerland. This article is an open access article distributed under the terms and conditions of the Creative Commons Attribution (CC BY) license (https://creativecommons.org/licenses/by/4.0/).
Share and Cite
MDPI and ACS Style
Jin, H.; Chun, Q.; Zhang, C.; Han, Y. A Durability Prediction Method for Historical Square Rebar Reinforced Concrete Buildings. Appl. Sci. 2021, 11, 11737. https://0-doi-org.brum.beds.ac.uk/10.3390/app112411737
AMA Style
Jin H, Chun Q, Zhang C, Han Y. A Durability Prediction Method for Historical Square Rebar Reinforced Concrete Buildings. Applied Sciences. 2021; 11(24):11737. https://0-doi-org.brum.beds.ac.uk/10.3390/app112411737
Chicago/Turabian StyleJin, Hui, Qing Chun, Chengwen Zhang, and Yidan Han. 2021. "A Durability Prediction Method for Historical Square Rebar Reinforced Concrete Buildings" Applied Sciences 11, no. 24: 11737. https://0-doi-org.brum.beds.ac.uk/10.3390/app112411737
Note that from the first issue of 2016, this journal uses article numbers instead of page numbers. See further details here.