
Simultaneous Determination of Four Marker Compounds in Lobelia chinensis Lour. Extract by HPLC-PDA


Abstract
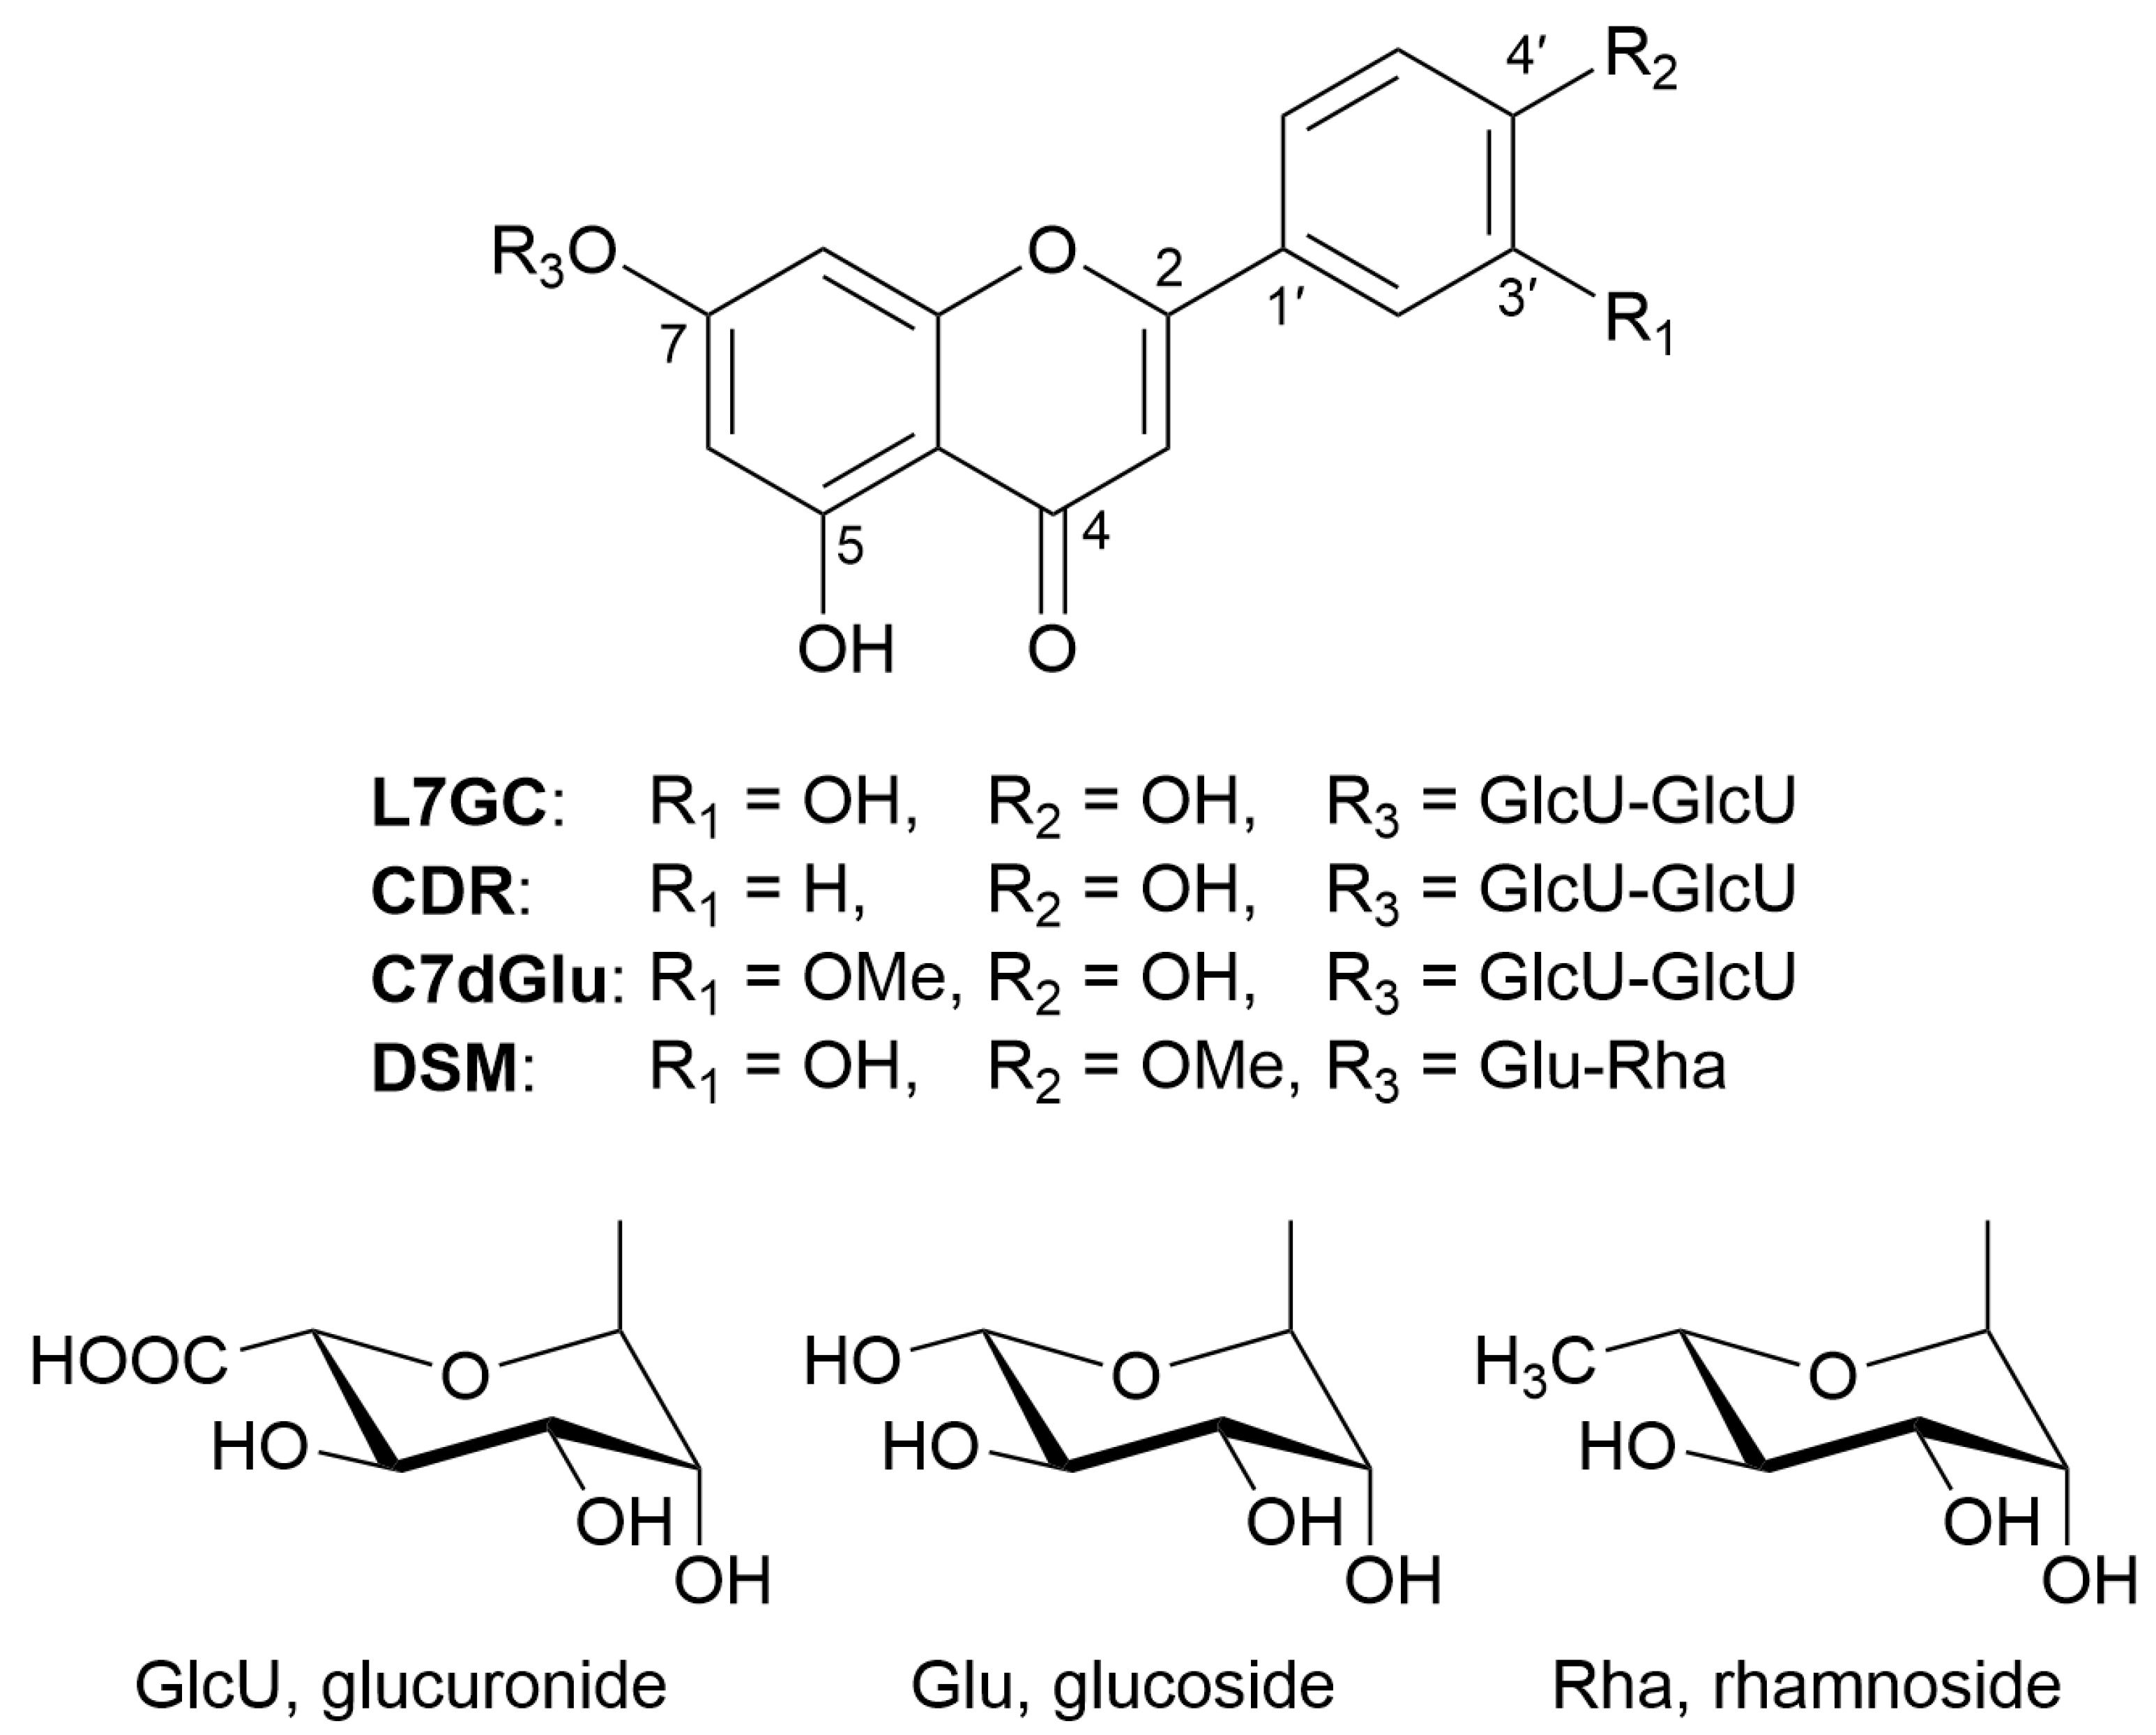
:1. Introduction
2. Experimental
2.1. Plant Material
2.2. Chemicals and Reagents
2.3. Equipment
2.4. Chromatographic Conditions
2.5. Preparation of Crude Extracts and Sample Solutions
2.6. Preparation of Standard Solutions
2.7. Validation of the HPLC-PDA Method
3. Results and Discussion
3.1. Development of HPLC-PDA analysis conditions
3.2. HPLC-PDA Method Validation
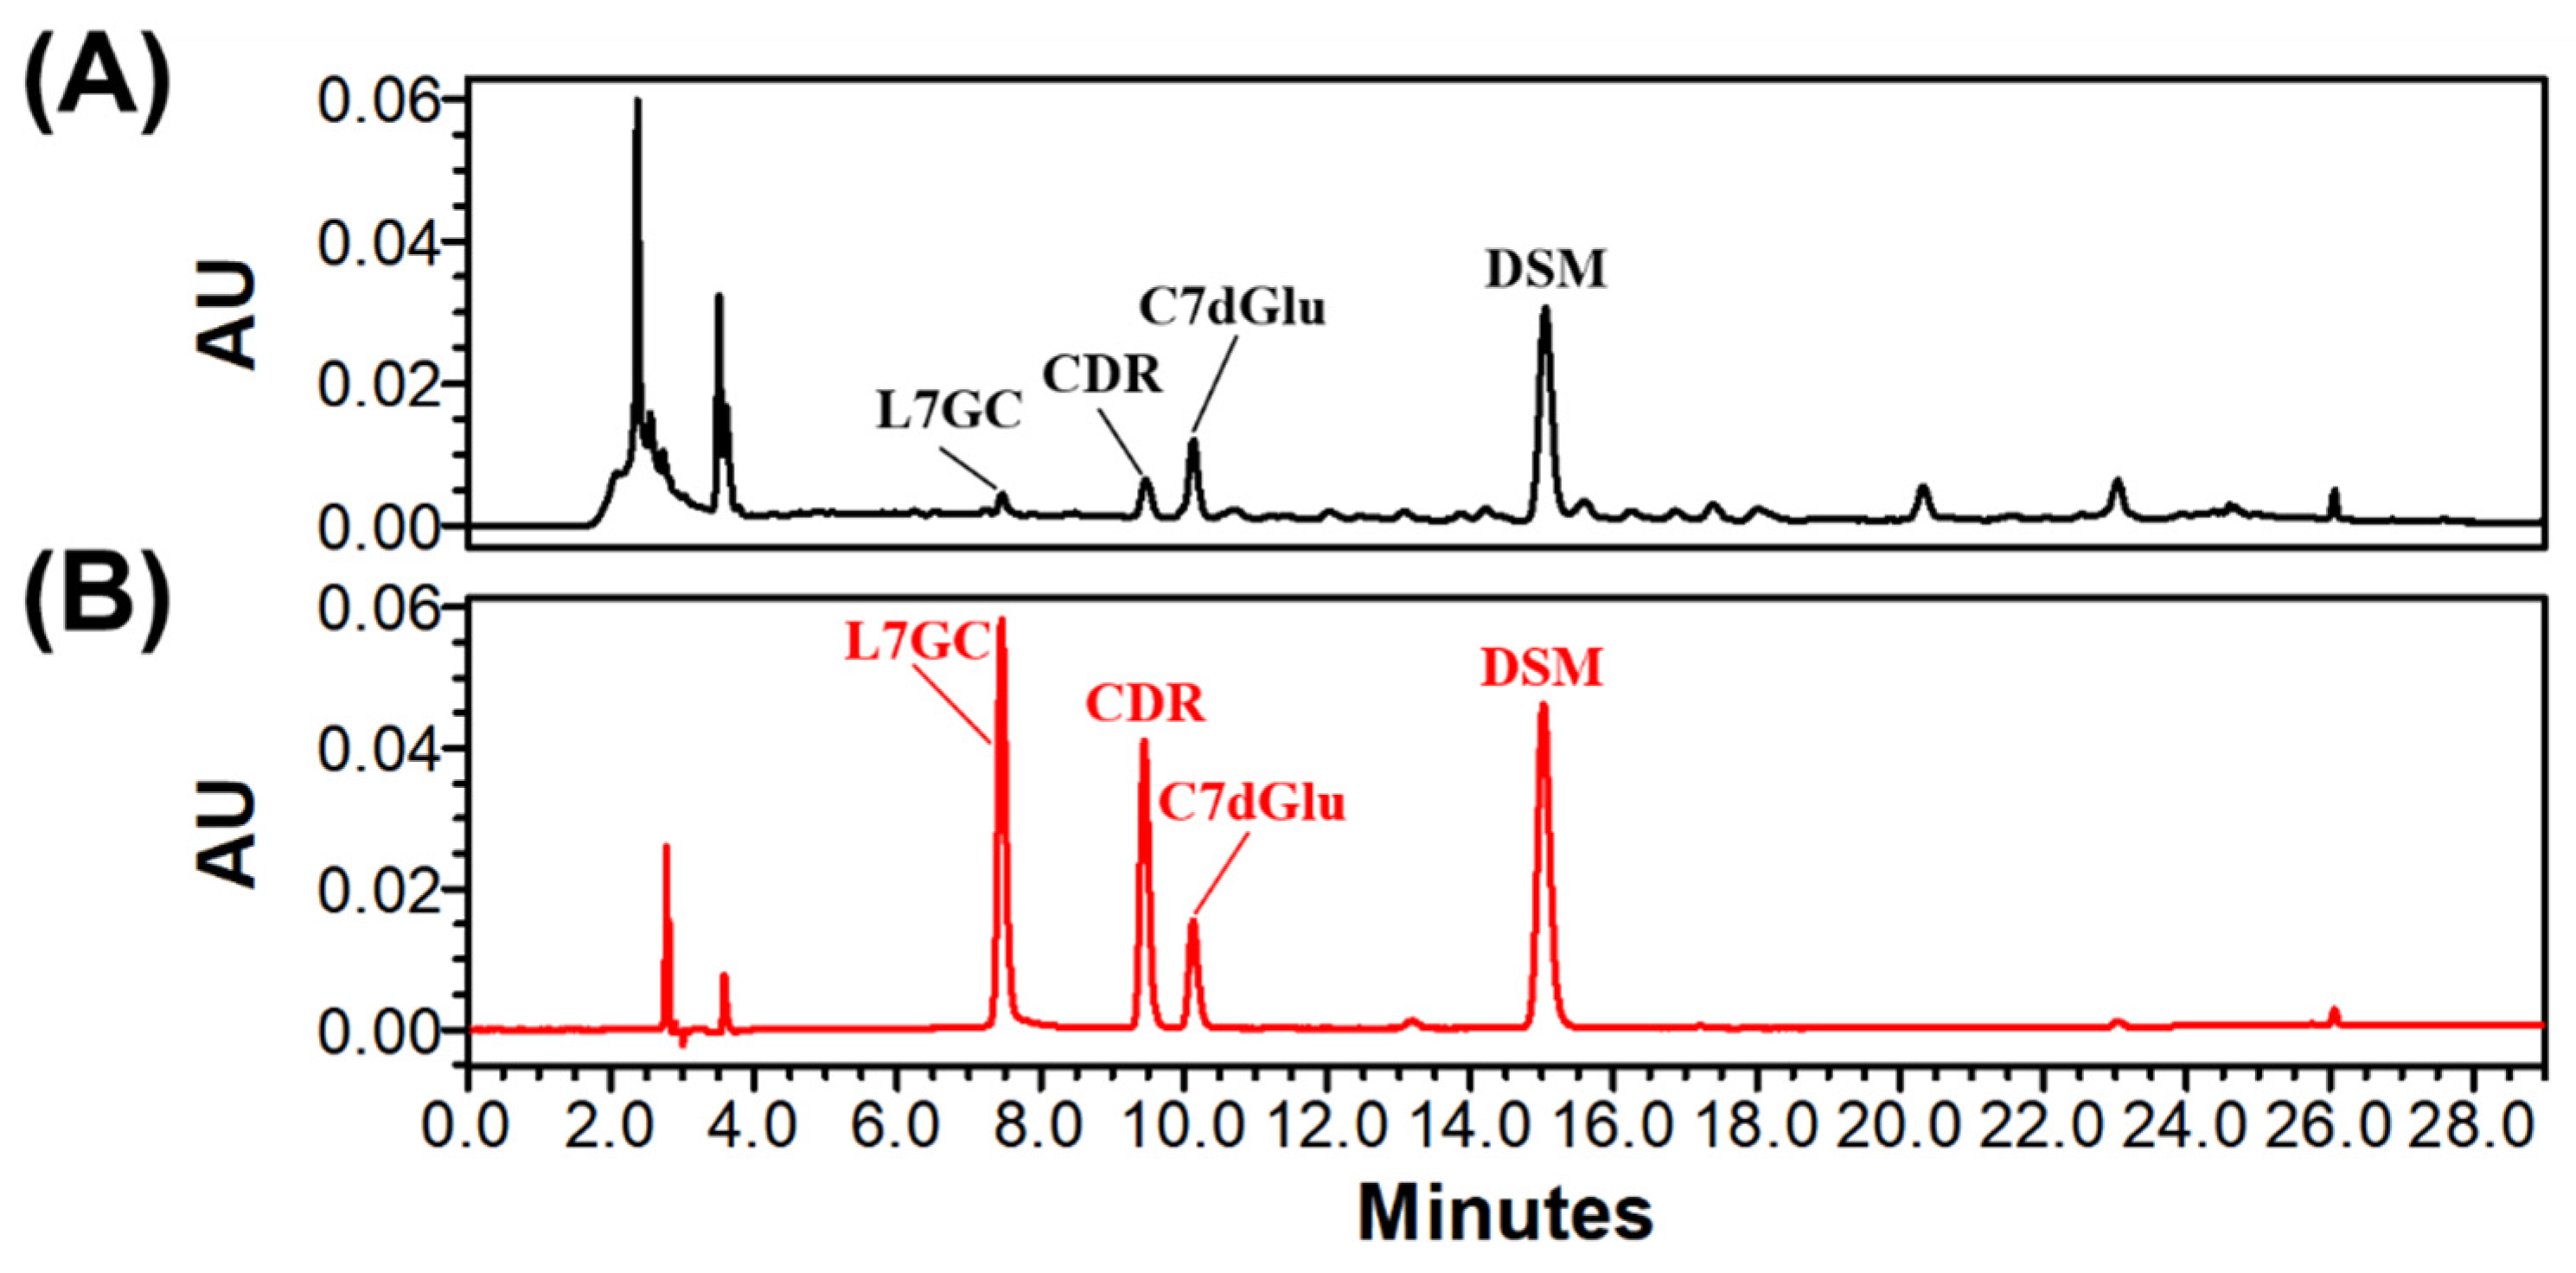
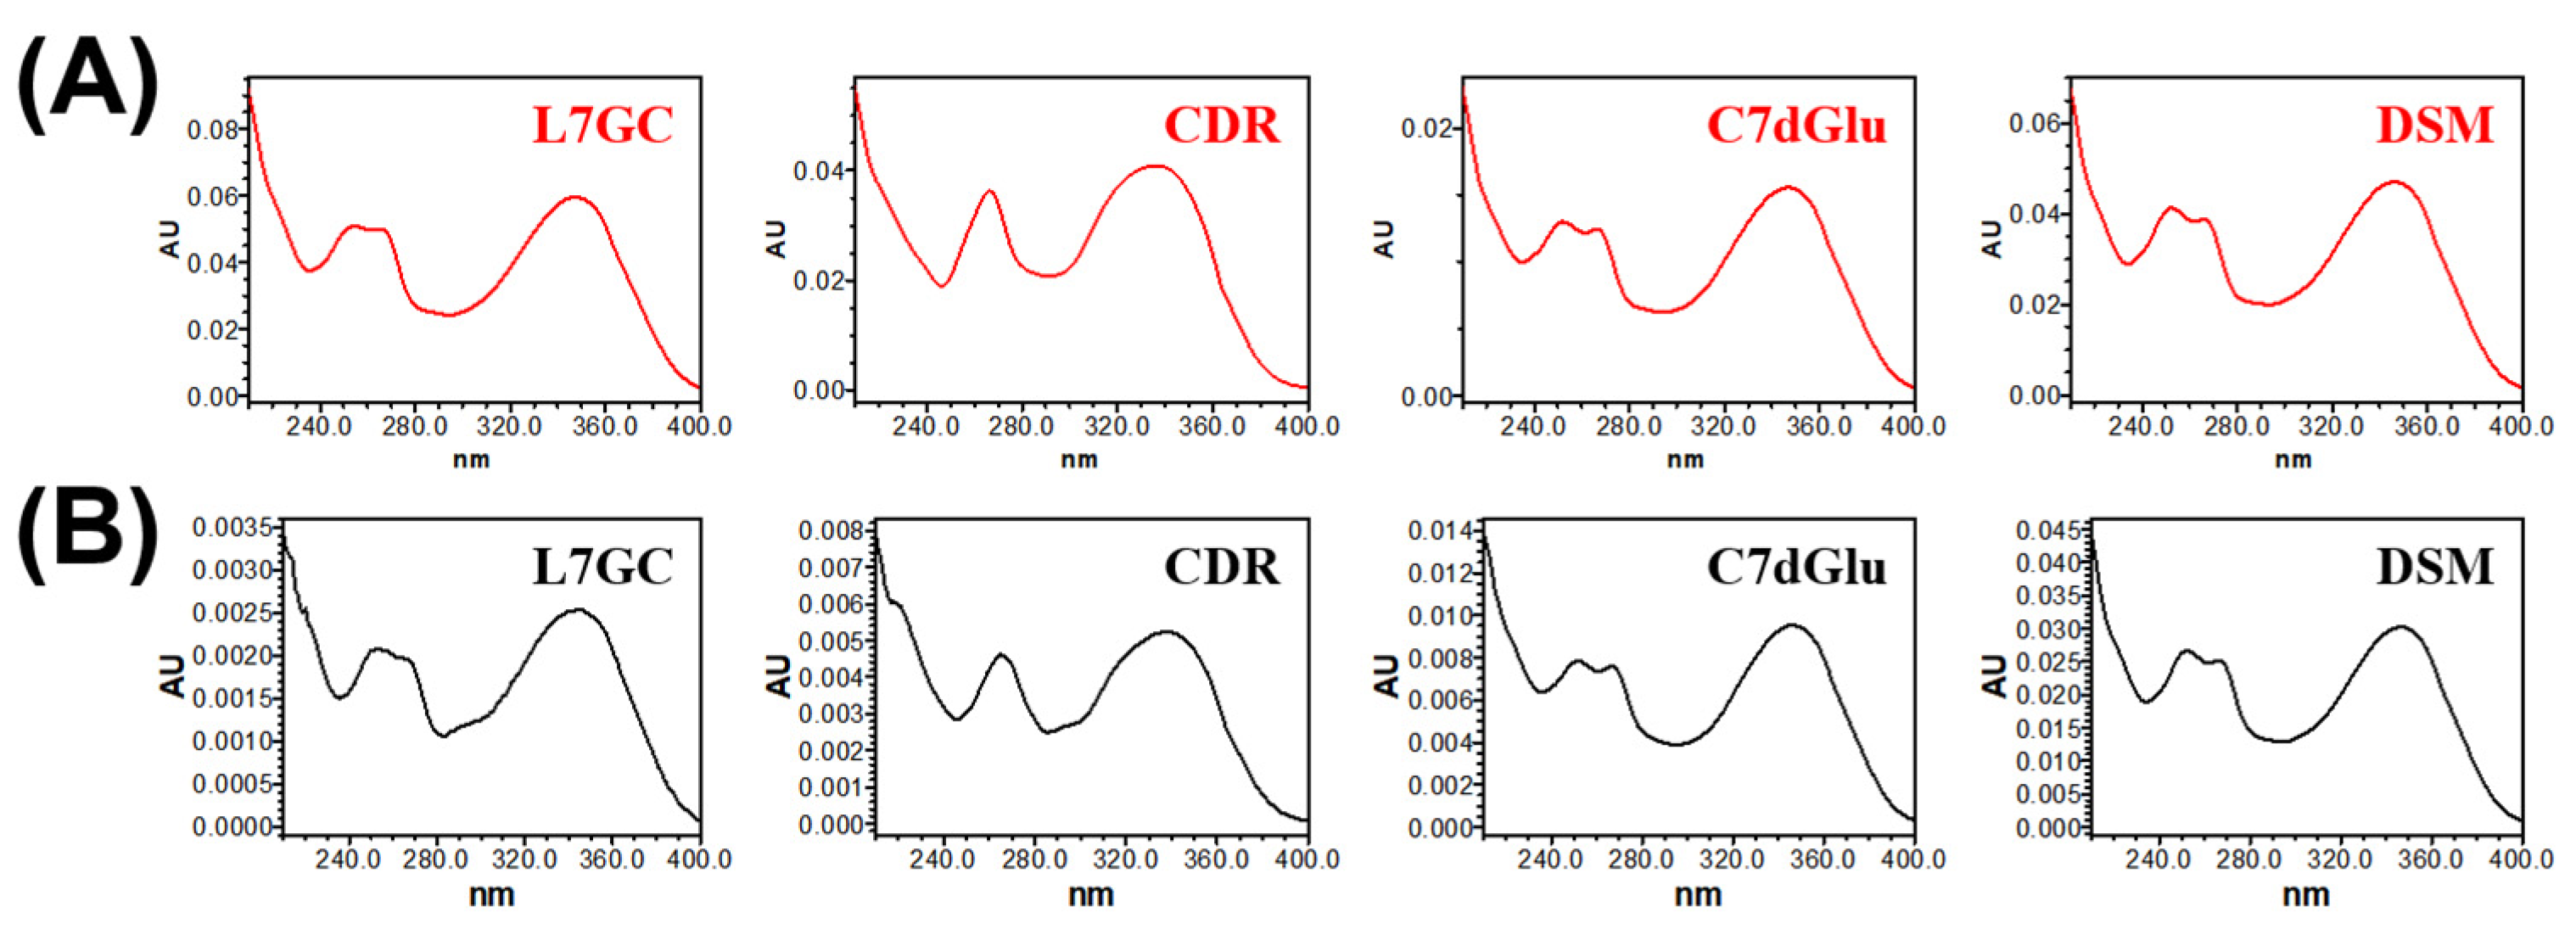
3.2.1. Specificity
3.2.2. Linear Range, Linearity, Limits of Detection (LODs), and Limits of Quantification (LOQs)
3.2.3. Intra-and Inter-Day Precisions
3.2.4. Analyte Recoveries
3.2.5. Stabilities of Analyte Solutions
3.3. Quantification of Four Marker Compounds in L. chinensis Extract
4. Conclusions
Author Contributions
Funding
Institutional Review Board Statement
Informed Consent Statement
Data Availability Statement
Conflicts of Interest
References
- Li, S. The Ben Cao Gang Mu: Chinese Edition, 1st ed.; University of California Press: Oakland, CA, USA, 2016; p. 625. [Google Scholar]
- Li, K.-C.; Ho, Y.-L.; Huang, G.-J.; Chang, Y.-S. Anti-oxidative and anti-inflammatory effects of Lobelia chinensis in vitro and in vivo. Am. J. Chin. Med. 2015, 43, 269–287. [Google Scholar] [CrossRef]
- Zhang, L.; Reddy, N.; Khoo, C.; Koyyalamudi, S.R.; Jones, C.E. Antioxidant and immunomodulatory activities and structural characterization of polysaccharides isolated from Lobelia chinensis Lour. Pharmacologia 2018, 157–168. [Google Scholar] [CrossRef]
- Kuo, P.-C.; Hwang, T.-L.; Lin, Y.-T.; Kuo, Y.-C.; Leu, Y.-L. Chemical constituents from Lobelia chinensis and their anti-virus and anti-inflammatory bioactivities. Arch. Pharm. Res. 2011, 34, 715–722. [Google Scholar] [CrossRef]
- Kuo, Y.-C.; Lee, Y.-C.; Leu, Y.-L.; Tsai, W.-J.; Chang, S.-C. Efficacy of orally administered Lobelia chinensis extracts on herpes simplex virus type 1 infection in BALB/c mice. Antivir. Res. 2008, 80, 206–212. [Google Scholar] [CrossRef] [PubMed]
- Zhang, X.; Hu, P.; Zhang, X.; Li, X. Chemical structure elucidation of an inulin-type fructan isolated from Lobelia chinensis Lour. with anti-obesity activity on diet-induced mice. Carbohydr. Polym. 2020, 240, 116357. [Google Scholar] [CrossRef] [PubMed]
- Choi, W.H.; Lee, I.A. The anti-tubercular activity of Melia azedarach L. and Lobelia chinensis Lour. and their potential as effective anti-Mycobacterium tuberculosis candidate agents. Asian Pac. J. Trop. Biomed. 2016, 6, 830–835. [Google Scholar] [CrossRef] [Green Version]
- Chen, M.-W.; Chen, W.-R.; Zhang, J.-M.; Long, X.-Y.; Wang, Y.-T. Lobelia chinensis: Chemical constituents and anticancer activity perspective. Chin. J. Nat. Med. 2014, 12, 103–107. [Google Scholar] [CrossRef]
- Shao, J.H.; Zhang, H. Influence of Lobelia chinensis Lour. Decoction on expression of C-erbB-2 and P53 on H22 tumor-bearing mice. Chin. J. Clin. Pharm. 2010, 19, 372–375. [Google Scholar]
- Santosa, M.H.; Herzog, R.; Voelter, W. Antitumor Activity of the Hot Water Extract of Lobelia chinensis. Planta Med. 1986, 6, 555. [Google Scholar] [CrossRef]
- Wang, H.; Li, Y.; Huang, Y.; Zhao, C.; Cheung, H.-Y. Chemical Profiling of Lobelia chinensis with High-Performance Liquid Chromatography/Quadrupole Time-of-Flight Mass Spectrometry (HPLC/Q-TOF MS) Reveals Absence of Lobeline in the Herb. Molecules 2018, 23, 3258. [Google Scholar] [CrossRef] [PubMed] [Green Version]
- Wang, J.; Chen, L.; Qu, L.; Li, K.; Zhao, Y.; Wang, Z.; Li, Y.; Zhang, X.; Jin, Y.; Liang, X. Isolation and bioactive evaluation of fla-vonoid glycosides from Lobelia chinensis Lour. using two-dimensional liquid chromatography combined with label-free cell phenotypic assays. J. Chromatogr. A 2019, 1601, 224–231. [Google Scholar] [CrossRef] [PubMed]
- Zhou, Y.; Wang, Y.; Wang, R.; Guo, F.; Yan, C. Two-dimensional liquid chromatography coupled with mass spectrometry for the analysis of Lobelia chinensis Lour. using an ESI/APCI multimode ion source. J. Sep. Sci. 2008, 31, 2388–2394. [Google Scholar] [CrossRef] [PubMed]
- Yang, S.; Shen, T.; Zhao, L.; Li, C.; Zhang, Y.; Lou, H.; Ren, D. Chemical constituents of Lobelia chinensis. Fitoterapia 2014, 93, 168–174. [Google Scholar] [CrossRef] [PubMed]
- Yang, S.; Li, C.; Wang, S.; Zhao, L.; Hou, Z.; Lou, H.; Ren, D. Chiral separation of two diastereomeric pairs of enantiomers of novel alkaloid-lignan hybrids from Lobelia chinensis and determination of the tentative absolute con-figuration. J. Chromatogr. A 2013, 1311, 134–139. [Google Scholar] [CrossRef] [PubMed]
- Elhelaly, A.E.; Al Basher, G.; Alfarraj, S.; Almeer, R.; Bahbah, E.I.; Fouda, M.M.; Bungău, S.G.; Aleya, L.; Abdel-Daim, M.M. Protective effects of hesperidin and diosmin against acrylamide-induced liver, kidney, and brain oxidative damage in rats. Environ. Sci. Pollut. Res. 2019, 26, 35151–35162. [Google Scholar] [CrossRef]
- Ali, F.E.; Azouz, A.A.; Bakr, A.G.; Abo-Youssef, A.M.; Hemeida, R.A. Hepatoprotective effects of diosmin and/or sildenafil against cholestatic liver cirrhosis: The role of Keap-1/Nrf-2 and P38-MAPK/NF-κB/iNOS signaling pathway. Food Chem. Toxicol. 2018, 120, 294–304. [Google Scholar] [CrossRef]
- Crespo, M.E.; Galvez, J.; Cruz, T.; Ocete, M.A.; Zarzuelo, A. Anti-inflammatory activity of diosmin and hesperidin in rat colitis induced by TNBS. Planta Med. 1999, 65, 651–653. [Google Scholar] [CrossRef]
- Shalkami, A.S.; Hassan, M.I.A.; Bakr, A.G. Anti-inflammatory, antioxidant and anti-apoptotic activity of diosmin in acetic acid-induced ulcerative colitis. Hum. Exp. Toxicol. 2018, 37, 78–86. [Google Scholar] [CrossRef]
- Berkoz, M. Diosmin suppresses the proinflammatory mediators in lipopolysaccharide-induced RAW264. 7 macrophages via NF-κB and MAPKs signal pathways. Gen. Physiol. Biophys. 2019, 38, 315–324. [Google Scholar] [CrossRef]
- Chen, Y.; Wang, Y.; Liu, M.; Zhou, B.; Yang, G. Diosmetin exhibits anti-proliferative and anti-inflammatory effects on TNF-α-stimulated human rheumatoid arthritis fibroblast-like synoviocytes through regulating the Akt and NF-κB signaling pathways. Phytother. Res. 2020, 34, 1310–1319. [Google Scholar] [CrossRef]
- Han, X.; Wu, Y.C.; Meng, M.; Sun, Q.-S.; Gao, S.-M.; Sun, H. Linarin prevents LPS induced acute lung injury by suppressing oxidative stress and inflammation via inhibition of TXNIP/NLRP3 and NF-κB pathways. Int. J. Mol. Med. 2018, 42, 1460–1472. [Google Scholar] [CrossRef] [Green Version]
- Chen, X.; Zhang, S.; Xuan, Z.; Ge, D.; Chen, X.; Zhang, J.; Wang, Q.; Wu, Y.; Liu, B. The phenolic fraction of Mentha haplocalyx and its constituent linarin ameliorate inflammatory response through inactivation of NF-κB and MAPKs in lipopolysaccharide-induced RAW264. 7 cells. Molecules 2017, 22, 811. [Google Scholar] [CrossRef] [Green Version]
- Vafa, A.; Afzal, S.M.; Barnwal, P.; Rashid, S.; Shahid, A.; Alpashree; Islam, J.; Sultana, S. Protective role of diosmin against testosterone propionate-induced prostatic hyperplasia in Wistar rats: Plausible role of oxidative stress and inflammation. Hum. Exp. Toxicol. 2020, 39, 1133–1146. [Google Scholar] [CrossRef]
- Yang, Y.; Gong, X.-B.; Huang, L.-G.; Wang, Z.-X.; Wan, R.-Z.; Zhang, P.; Zhang, Q.-Y.; Chen, Z.; Zhang, B.-S. Diosmetin exerts anti-oxidative, anti-inflammatory and anti-apoptotic effects to protect against endotoxin-induced acute hepatic failure in mice. Oncotarget 2017, 8, 30723. [Google Scholar] [CrossRef] [PubMed] [Green Version]
- Qiaoshan, Y.; Suhong, C.; Minxia, S.; Wenjia, M.; Bo, L.; Guiyuan, L. Preparative purification of linarin extracts from Dendranthema indicum flowers and evaluation of its antihypertensive effect. Evid.-Based Complement. Altern. Med. 2014, 2014, 394276. [Google Scholar] [CrossRef] [Green Version]
- Lee, J.; Song, K.-M.; Jung, C.H. Diosmin restores the skin barrier by targeting the aryl hydrocarbon receptor in atopic dermatitis. Phytomedicine 2021, 81, 153418. [Google Scholar] [CrossRef] [PubMed]
- Lee, D.-H.; Park, J.-K.; Choi, J.; Jang, H.; Seol, J.-W. Anti-inflammatory effects of natural flavonoid diosmetin in IL-4 and LPS-induced macrophage activation and atopic dermatitis model. Int. Immunopharmacol. 2020, 89, 107046. [Google Scholar] [CrossRef] [PubMed]
- Chen, G.; Yang, Y.; Liu, M.; Teng, Z.; Ye, J.; Xu, Y.; Cai, X.; Cheng, X.; Yang, J.; Hu, C.; et al. Banxia xiexin decoction protects against dextran sulfate sodium-induced chronic ulcerative colitis in mice. J. Ethnopharmacol. 2015, 166, 149–156. [Google Scholar] [CrossRef]
- Lu, Y.; Xu, J.-Y.; Zhang, X.-H.; Zhao, X. Gu-Ben-Fang-Xiao decoction attenuates sustained airway inflammation by suppressing ER stress response in a murine asthma remission model of respiratory syncytial virus infection. J. Ethnopharmacol. 2016, 192, 496–509. [Google Scholar] [CrossRef] [PubMed]
- Yang, D.; Chen, Y.; Guo, F.; Huang, B.; Okyere, S.A.; Wang, H. Comparative analysis of chemical composition, antioxidant and antimicrobial activities of leaves, leaf tea and root from Codonopsis pilosula. Ind. Crops Prod. 2019, 142, 111844. [Google Scholar] [CrossRef]
- Li, S.; Jiang, H.; Lin, Z.; Deng, S.; Guan, Y.; Wang, H.; Chen, S. An on-line high-performance liquid chromatography−diode-array detector−multi-stage mass spectrometry−deoxyribonucleic acid−4′,6-diamidino-2-phenylindole−fluorescence detector system for screening the DNA-binding active compounds in Fufang Banbianlian Injection. J. Chromatogr. A 2015, 1424, 37–50. [Google Scholar] [CrossRef] [PubMed]
- Li, S.; Lin, Z.; Jiang, H.; Tong, L.; Wang, H.; Chen, S. Rapid identification and assignation of the active ingredients in fufang banbianlian injection using HPLC-DAD-ESI-IT-TOF-MS. J. Chromatogr. Sci. 2016, 54, 1225–1237. [Google Scholar] [CrossRef] [Green Version]
- Wang, Y.; Xue, X.; Xiao, Y.; Zhang, F.; Xu, Q.; Liang, X. Purification and preparation of compounds from an extract of Scutellaria barbata D. Don using preparative parallel high performance liquid chromatography. J. Sep. Sci. 2008, 31, 1669–1676. [Google Scholar] [CrossRef] [PubMed]
- Xu, L.; Ma, T.; Wang, X.; Liu, W.; Li, J.; Wang, X. Preparative separation of seven polyphenols from Perillae Folium via pH-zone-refining counter-current chromatography combined with high-speed counter-current chromatography. Anal. Methods 2021, 13, 1232–1237. [Google Scholar] [CrossRef] [PubMed]
- Kowalska, I.; Stochmal, A.; Kapusta, I.; Janda, B.; Pizza, C.; Piacente, S.; Oleszek, W. Flavonoids from barrel medic (Medicago truncatula) aerial parts. J. Agric. Food Chem. 2007, 55, 2645–2652. [Google Scholar] [CrossRef]
- International Conference on Harmonisation of Technical Requirements for Registration of Pharmaceuticals for Human Use, Validation of Analytical Procedures: Text and Methodology Q2(R1); International Council for Harmonisation (ICH): November 2005. Available online: https://www.ich.org/page/quality-guidelines (accessed on 10 November 2021).


| Compound a | Retention Time (min) | Linear Range (μg/mL) | Regression Equation b | r2 | LOD (μg/mL) | LOQ (μg/mL) |
|---|---|---|---|---|---|---|
| L7GC | 7.445 ± 0.02 | 3.00–360.00 | y = 11,715.29x − 5916.88 | 1.0000 | 2.152 | 6.521 |
| CDR | 9.445 ± 0.01 | 5.00–600.00 | y = 5316.01x − 10,240.04 | 0.9999 | 1.927 | 5.840 |
| C7dGlu | 10.121 ± 0.02 | 3.00–360.00 | y = 5487.39x − 15,317.53 | 0.9996 | 0.379 | 1.147 |
| DSM | 15.034 ± 0.03 | 5.00–600.00 | y = 1783.97x − 12,666.06 | 0.9991 | 0.901 | 2.732 |
| Compound a | Conc. (μg/mL) | Precision | |||
|---|---|---|---|---|---|
| Intra-Day (n = 5) | Inter-Day (n = 5) | ||||
| Measured Conc. (μg/mL) | RSD (%) | Measured Conc. (μg/mL) | RSD (%) | ||
| L7GC | 10.00 | 8.26 | 0.42 | 8.19 | 1.31 |
| 100.00 | 100.46 | 0.20 | 97.95 | 1.96 | |
| 250.00 | 244.08 | 0.18 | 245.49 | 0.87 | |
| CDR | 12.50 | 12.28 | 0.56 | 12.32 | 1.69 |
| 125.00 | 119.56 | 0.54 | 118.95 | 0.77 | |
| 312.50 | 300.17 | 0.11 | 297.71 | 0.63 | |
| C7dGlu | 5.00 | 5.06 | 0.92 | 5.08 | 1.29 |
| 50.00 | 48.74 | 0.13 | 49.27 | 1.41 | |
| 125.00 | 122.60 | 0.32 | 123.86 | 1.65 | |
| DSM | 12.50 | 11.33 | 1.93 | 11.35 | 1.41 |
| 125.00 | 123.97 | 0.24 | 125.73 | 1.17 | |
| 312.50 | 305.70 | 1.02 | 301.60 | 1.95 | |
| Compound a | Original Conc. (μg/mL) | Spike Conc. (μg/mL) | Found Conc. (μg/mL) | Recovery b ± SD (%) | RSD (%) |
|---|---|---|---|---|---|
| L7GC | 0.81 | 5.00 | 5.70 | 106.04 ± 1.29 | 1.22 |
| 50.00 | 49.89 | 99.24 ± 0.35 | 0.35 | ||
| 125.00 | 130.02 | 105.62 ± 0.18 | 0.17 | ||
| CDR | 4.16 | 6.25 | 10.42 | 113.18 ± 0.87 | 0.77 |
| 62.5 | 64.63 | 99.55 ± 0.54 | 0.54 | ||
| 156.25 | 161.07 | 104.80 ± 0.23 | 0.22 | ||
| C7dGlu | 18.81 | 5.00 | 23.75 | 119.35 ± 1.84 | 1.54 |
| 50.00 | 67.44 | 96.83 ± 0.84 | 0.86 | ||
| 125.00 | 145.75 | 104.01 ± 0.21 | 0.20 | ||
| DSM | 22.78 | 6.25 | 29.06 | 127.07 ± 2.20 | 1.73 |
| 62.50 | 87.85 | 103.07 ± 0.86 | 0.83 | ||
| 156.25 | 189.95 | 109.68 ± 0.15 | 0.14 |
| Compound a | Temp | Peak Area (Mean AU ± SD) | RSD (%) | ||||
|---|---|---|---|---|---|---|---|
| 0 h | 6 h | 24 h | 48 h | 72 h | |||
| L7GC | R.T. | 19,437 ± 193 | 18,357 ± 155 | 18,510 ± 127 | 17,857 ± 92 | 17,321 ± 238 | 4.03 |
| 4 °C | 19,437 ± 193 | 18,314 ± 136 | 18,051 ± 109 | 17,542 ± 183 | 17,951 ± 138 | 3.66 | |
| CDR | R.T. | 51,346 ± 340 | 49,122 ± 424 | 48,587 ± 181 | 48,438 ± 195 | 48,443 ± 615 | 2.42 |
| 4 °C | 51,346 ± 340 | 48,789 ± 483 | 49,070 ± 334 | 48,710 ± 335 | 48,188 ± 270 | 2.38 | |
| C7dGlu | R.T. | 95,923 ± 1816 | 90,583 ± 881 | 89,581 ± 441 | 88,643 ± 1548 | 90,358 ± 1121 | 3.12 |
| 4 °C | 95,923 ± 1816 | 91,128 ± 650 | 89,458 ± 1438 | 88,591 ± 663 | 88,384 ± 830 | 3.35 | |
| DSM | R.T. | 357,036 ± 1145 | 340,928 ± 1062 | 324,260 ± 5259 | 250,171 ± 4572 | 214,936 ± 637 | 18.95 |
| 4 °C | 357,036 ± 1145 | 339,828 ± 1173 | 341,246 ± 1379 | 341,845 ± 1559 | 336,843 ± 1513 | 2.13 | |
| Compound a | Contents (mg/g) | |
|---|---|---|
| Mean ± SD | RSD (%) | |
| L7GC | 0.108 ± 0.001 | 0.76 |
| CDR | 0.579 ± 0.003 | 0.55 |
| C7dGlu | 1.014 ± 0.017 | 1.63 |
| DSM | 10.362 ± 0.032 | 0.31 |
Publisher’s Note: MDPI stays neutral with regard to jurisdictional claims in published maps and institutional affiliations. |
© 2021 by the authors. Licensee MDPI, Basel, Switzerland. This article is an open access article distributed under the terms and conditions of the Creative Commons Attribution (CC BY) license (https://creativecommons.org/licenses/by/4.0/).
Share and Cite
Jo, B.-G.; Park, Y.-H.; Kim, K.H.; Kim, S.-N.; Yang, M.H. Simultaneous Determination of Four Marker Compounds in Lobelia chinensis Lour. Extract by HPLC-PDA. Appl. Sci. 2021, 11, 12080. https://0-doi-org.brum.beds.ac.uk/10.3390/app112412080
Jo B-G, Park Y-H, Kim KH, Kim S-N, Yang MH. Simultaneous Determination of Four Marker Compounds in Lobelia chinensis Lour. Extract by HPLC-PDA. Applied Sciences. 2021; 11(24):12080. https://0-doi-org.brum.beds.ac.uk/10.3390/app112412080
Chicago/Turabian StyleJo, Beom-Geun, Young-Hun Park, Ki Hyun Kim, Su-Nam Kim, and Min Hye Yang. 2021. "Simultaneous Determination of Four Marker Compounds in Lobelia chinensis Lour. Extract by HPLC-PDA" Applied Sciences 11, no. 24: 12080. https://0-doi-org.brum.beds.ac.uk/10.3390/app112412080